Embed Size (px)
Citation preview

©2017 Society of Economic Geologists, Inc.Economic Geology, v. 112, pp. 1419–1440
Cyclic Magmatic-Hydrothermal Evolution in Porphyry Systems: High-Precision U-Pb and Re-Os Geochronology Constraints on the
Tibetan Qulong Porphyry Cu-Mo Deposit*
Yang Li,1,†,** David Selby,1 Daniel Condon,2 and Simon Tapster 21Department of Earth Sciences, Durham University, Durham, United Kingdom DH1 3LE
2NERC Isotope Geosciences Laboratory, British Geological Survey, Nottingham, United Kingdom NG12 5GG
AbstractWe present high-precision chemical abrasion-isotope dilution-thermal ionization mass spectrometry (CA-ID-TIMS) U-Pb zircon and isotope dilution-negative-thermal ionization mass spectrometry (ID-N-TIMS) Re-Os molybdenite geochronology of the world-class Tibetan Qulong porphyry Cu-Mo deposit. The data is used to constrain the timing, duration, and to yield implications for the ore-forming processes. The U-Pb data suggest that the preore Rongmucuola pluton crystallized at 17.142 ± 0.014/0.014/0.023 Ma (uncertainties presented as analytical /+ tracer /+ decay constant uncertainties), with emplacements of the synore P porphyry and postore quartz diorite occurring at 16.009 ± 0.016/0.017/0.024 and 15.166 ± 0.010/0.011/0.020 Ma, respectively. The Re-Os analysis of multiple independent molybdenite separations from single molybdenite-bearing quartz veins yields sub-‰ level analytical precision (<1‰), which is comparable with that of modern CA-ID-TIMS U-Pb zircon geochronology. The new Re-Os data indicate that the majority of the metals at Qulong were deposited over a minimum duration of 266 ± 13 k.y., between 16.126 ± 0.008/0.060/0.077 and 15.860 ± 0.010/0.058/0.075 Ma, with the main phase of mineralization being broadly synchronous with the emplacement of the P porphyry. However, our Re-Os data of molybdenite hosted within the Rongmucuola pluton imply that a portion of min-eralization also predated the P porphyry and suggest that the P porphyry is an intermineral porphyry stock, although mineralization cut by P porphyry has not been previously documented or observed in this study. Cor-relating the Re-Os ages with vein types (A-B-D veins) demonstrates that the mineralization process was cyclical, with the presence of at least three short-lived (38 ± 11 to 59 ± 10 k.y.) mineralization pulses between 16.126 ± 0.008 and 16.050 ± 0.005, 16.040 ± 0.007 and 15.981 ± 0.007, and ~15.981 ± 0.007 and 15.860 ± 0.010 Ma. Coupling the Re-Os molybdenite ages and quartz (coprecipitated with the dated molybdenite) fluid inclusion data suggests that the cooling history was also cyclic, and implies a rapid cooling rate during the entire mineral-ization process (0.55° ± 0.11°C/k.y.), with much faster cooling rates (1.19° ± 0.82° to 1.27° ± 0.53°C/k.y.) for the individual mineralization pulses. The cyclic and rapid cooling process requires an additional cooling mechanism rather than the inefficient conduction, which we attribute to meteoric water circulation.
The presence of mineralization predating the intermineral P porphyry stock and the absence of evidence of an early porphyry stock at Qulong suggest that mineralization potentially can take place without contemporane-ous magmatism at mineralization levels. As a result, dating magmatic events may not necessarily bracket the entire mineralization duration of a porphyry system. This highlights the importance of dating ore minerals to reveal a comprehensive picture of the magma-hydrothermal process. In addition, the absence of contempora-neous magmatism during mineralization has broad implications for the classification of porphyry copper depos-its and mineral exploration. The timescales of mineralization cycles constrained here via direct dating of ore minerals (tens of k.y.) are comparable with those recently proposed through high-precision U-Pb zircon dating, diffusion modeling, and numerical simulation. We propose that the cyclic mineralization pulses are linked with the periodic release of volatiles from the lower crustal magma chamber, which are common for porphyry copper systems worldwide. The episodic/cyclic metal enrichment process potentially is one of the controlling factors of porphyry copper ore formation and is the key to differentiate the formation of economic and subeconomic porphyry deposits.
Finally, direct comparison of molybdenite Re-Os dates from different laboratories and with the zircon U-Pb system needs to account for the much larger uncertainties from tracer calibration and decay constants, respec-tively. As a result, we lose the necessary resolution to investigate the ore-forming process at the k.y. level. There-fore, to reduce these uncertainties, calibration between the two chronometers, using shared tracer solutions and a transparent data reduction platform within the community is required.
IntroductionMetals forming porphyry copper deposits are derived from the lower crust and are transported to shallow mineraliza-tion levels by magmatic fluids via porphyry stocks that act as
conduits (Sillitoe, 2010; Richards, 2011; Cooke et al., 2014). Although this model is widely accepted, there is a paucity of detailed, precise, and robust time frames of igneous and hydrothermal systems to test this hypothesis. For example, at what level are mineralization and magmatism contemporane-ous? Moreover, the duration of the porphyry mineralization process is poorly constrained, with studies suggesting orders of magnitude variation, from tens of thousands to several mil-lions of years (m.y.; Chiaradia et al., 2014).
doi: 10.5382/econgeo.2017.45150361-0128/17/1419-22 1419
Submitted: February 13, 2017Accepted: May 14, 2017
† Corresponding author: e-mail, [email protected]*A digital supplement containing electronic appendices for this paper is avail-
able at http://economicgeology.org.**Present address: Department of Geology and Geophysics, Yale University,
New Haven, Connecticut 06511, USA.

1420 LI ET AL.
The time scales of ore formation in porphyry copper depos-its can be constrained through the dating of pre- and postore intrusions. Traditionally, in situ zircon U-Pb dates are used to establish the time frame of porphyry stocks and constrain the duration of ore formation (Sillitoe and Mortensen, 2010; Deckart et al., 2012). However, limited by the precision (~2%) of in situ U-Pb zircon analysis (Klötzli et al., 2009; Li et al., 2015; Schaltegger et al., 2015; Schoene, 2014), the con-clusions of these studies are controversial (von Quadt et al., 2011). A high-precision (‰ level) dating technique, e.g., chemical abrasion-isotope dilution-thermal ionization mass spectrometry (CA-ID-TIMS) zircon U-Pb geochronology, makes it possible to refine the time frame and timescales of porphyry copper systems (von Quadt et al., 2011). Recent high-precision zircon U-Pb geochronology case studies indi-cate that the lifetime of porphyry Cu deposits varies from tens to hundreds of k.y., and by inference these results suggest the presence of multiple magmatic-hydrothermal episodes (von Quadt et al., 2011; Chelle-Michou et al., 2015; Buret et al., 2016; Tapster et al., 2016). The latter suggestion is further supported by numerical simulation and diffusion modeling, which suggest that the ore-forming event involves multiple short-lived (several tens of k.y.) mineralization pulses (Cath-les, 1977; Weis et al., 2012; Mercer et al., 2015; Weis, 2015; Chelle-Michou et al., 2017). However, these approaches (U-Pb dating, numerical simulation, and diffusion model-ing) are either based on dating porphyry stocks, which do not necessarily bracket the entire mineralization duration, and/or age constraints of silicate minerals, which may not coprecipi-tate with ore minerals, or numerical models that do not fully reflect the complexity of a specific porphyry system.
The most straightforward approach to constrain the timing and duration of ore-forming events is by dating ore minerals directly. The ubiquitous distribution of molybdenite in por-phyry Cu-Mo deposits and advances in molybdenite Re-Os geochronology permit precise dating of the ore-forming event(s) directly (Stein, 2014; Spencer et al., 2015). High-precision molybdenite Re-Os dating of the El Salvador and El Teniente porphyry Cu-Mo deposits yielded a mineralization duration of 0.6 m.y. (Zimmerman et al., 2014) and the pres-ence of multiple short-lived (<100 k.y.) mineralization pulses over 1.7 m.y. (Spencer et al., 2015), respectively. As each com-plete mineralization pulse comprises petrographically defined veinlets, which are termed as A (earliest), B, D (latest) veins (Gustafson and Hunt, 1975; Sillitoe, 2010), multipulsed min-eralization event(s) will result in a complex evolution history (i.e., A/B veins that are younger than D veins). This has been supported by high-precision Re-Os dating of the Los Pelam-bres Cu-(Mo) deposit, which shows that D veins are ~1 m.y. older than B veins (Stein, 2014).
As discussed above, multiple magmatic-hydrothermal/mineralization pulses are evident for deposits with prolonged formation intervals (e.g., several m.y.). However, for deposits with shorter formation intervals (e.g., several to tens to hun-dreds of k.y.), which, in some cases, are at the same magnitude as the precision of the dating method, there is an increasing need to apply high-precision dating to understand the chro-nology and duration of the ore-forming process. Moreover, due to a lack of deposit-wide crosscutting relationships, it is not clear yet whether these short-lived systems are formed
via a single protracted pulse or through multiple short-lived intermittent pulses. In addition, for deposits incrementally formed by several successive mineralization pulses, the tim-escale of individual pulses remains unknown. The answers for these questions will aid our understanding of metal deposition processes in porphyry copper deposits and shape exploration strategy, e.g., are multiple mineralization pulses necessary to form giant deposits, or is a prolonged mineralization duration essential for economic deposits? Moreover, if multiple mag-matic-mineralization events are common in porphyry copper deposits, what is the cooling history of the system? Further, multiple magmatic-hydrothermal/mineralization events pre-dict thermal resetting for chronometers with low closure tem-peratures, which need to be considered when interpreting thermochronology dates (e.g., zircon U-Th-He, apatite fission track [AFT], and mica 40Ar-40Ar).
In this paper, we examine the temporal models (e.g., the temporal relationship between magmatism and mineral-ization and the ore-forming processes) of porphyry copper deposits via constraining the ore-forming process of the well-studied Qulong porphyry Cu-Mo deposit by employing CA-ID-TIMS U-Pb zircon and isotope dilution-negative-thermal ionization mass spectrometry (ID-N-TIMS) Re-Os molybde-nite geochronology with analytical precisions of ~1‰. Qulong has only one mineralization center with one main porphyry stock, which makes the deposit a relatively simple and ideal candidate for the research proposed here. The data is used to examine the temporal relationship between magmatism and mineralization, and to propose that one of the main controls of economic porphyry copper systems is an episodic/cyclic magmatic-hydrothermal/mineralization process.
Geologic BackgroundThe Qulong porphyry Cu-Mo deposit is located in the east-ern region of the Gangdese magmatic arc (Fig. 1A), which extends along the southern margin of the Lhasa terrane. The Lhasa terrane records the subduction of the Neotethyan oce-anic lithosphere and subsequent India-Asia collision (Zhang et al., 2014; Zhu et al., 2015). The eastern part of the Gangdese magmatic arc is termed the Gangdese porphyry copper belt, which contains >20 porphyry copper systems that formed in a collisional or postcollisional (India-Asian) tectonic setting dur-ing the Cenozoic (Hou et al., 2009; Wang et al., 2015; Zheng et al., 2015), with the magmas generated by partial melting of a thickened basaltic lower crust (Hou et al., 2009; Wang et al., 2014; Richards, 2015). Of these porphyry copper systems, eight of them have Cu reserves in excess of 0.5 million tonnes (Mt), with Qulong being the largest both in this belt and in China, hosting ~11 Mt Cu and >0.5 Mt Mo (Yang et al., 2009; Hu et al., 2015; Zhao et al., 2016; Li et al., 2017a).
Miocene intrusive units at QulongThe mid-Miocene Qulong deposit is spatially associated with the Rongmucuola pluton, aplite, P porphyry, X porphyry, two stages of breccia, and quartz diorite units (Fig. 1). The P por-phyry and orebody show a spatial association with a N-S–strik-ing normal fault system (Fig. 1). The geology of the Qulong system has been described in detail by many previous stud-ies (Zheng et al., 2004; Yang et al., 2009; Xiao et al., 2012; Hu et al., 2015; Zhao et al., 2016; Li et al., 2017a), which we

GEOCHRONOLOGY CONSTRAINTS ON THE TIBETAN QULONG PORPHYRY Cu-Mo DEPOSIT 1421
summarize and discuss below. The relative chronology of these units defined by crosscutting relationships is presented in Figure 2A (Yang et al., 2009; Hu et al., 2015; Zhao et al., 2016; Li et al., 2017a).
The mid-Miocene Rongmucuola pluton is the predominant host lithology to the mineralization of Qulong, which intruded into the Jurassic volcanic (Yeba Formation) and intrusive rocks (dacite-rhyolite porphyry). The pluton has a surface exposure of ~8 km2 and a depth of >2 km, as constrained by drilling (Fig. 1B, C). The composition of the Rongmucuola pluton var-ies gradually from granodiorite to biotite monzogranite (Fig.
1B), from east to west (Yang et al., 2009; Zhao et al., 2016). Despite this compositional variation, the entire pluton pos-sesses a similar mineralogy (plagioclase, K-feldspar, quartz, amphibole, and biotite; Fig. 3A); however, mineralization is only present in the western Rongmucuola pluton (Fig. 1B). The western Rongmucuola pluton is cut by small aplite dikes, the P porphyry, the X porphyry, and a breccia pipe. The aplite hosted by this pluton has limited distribution in drill core and occurs as several to tens of centimeters-wide discontinuous fracture-controlled dikes (Yang et al., 2009; Zhao et al., 2016; Li et al., 2017a). The aplite is characterized by intergrowths
Cu-Mo orebody
Dacite-rhyolite porphyry Rongmucuola pluton (east)
P porphyry X porphyry Quartz diorite Breccias Cross sectionQuaternary
Yeba Formation
5300
5100
4900
4700
4500
4300o
2938
' No
2937
' N
o91 35' E o91 36' E o91 37' E A A'
A A'
Elev
atio
n (m
)
Drillhole
200 m
B) C)
500 m
N
Rongmucuola pluton (west)
A A’
40 kmN
o88 E o89 E o90 E o92 E
o30
N
Porphyry Cu depositsMiocene porphyry intrusion
QulongLhasaASIA
INDIA
o80 E o90 E
30N
200 km
Lhasa
o91 E
Lhasa terrane
Gangdese magmatic arc
N
Ngranitoids
N-Sfault
A)
B B'
BB'B'
BD) E)
5200
5000
4800
4600
Elev
atio
n (m
)
Cu grade Mo grade
>0.6 >0.3 <0.1Cu grade, wt % >0.06 >0.03 >0.01 <0.01 Mo grade, wt %
P porphyry
X porphyry
>0.1
ZK313
ZK001
ZK1405
ZK1605
JiamaLhasa
200 m 200 m
Fig. 1. Geologic setting of the Lhasa terrane and deposit geology map of Qulong porphyry Cu-Mo deposit. A) Simplified geologic setting of the Lhasa terrane, Gangdese magmatic belt and Gangdese porphyry copper deposit belt. B) Geologic map of the Qulong porphyry Cu-Mo deposit. C) Cross section showing the crosscutting relationship of the Miocene units at the Qulong porphyry Cu-Mo deposit. D-E) Cross sections showing the Cu and Mo grades at the Qulong porphyry Cu-Mo deposit. Revised after Yang et al. (2009) and Zhao et al. (2016).

1422 LI ET AL.
of fine-grained (~1 mm) anhedral alkali feldspar and quartz with disseminated magnetite and pyrite (Yang et al., 2009; Li et al., 2017a).
The P porphyry, which has an exposure diameter of ~200 m and a depth of >1.8 km, as indicated by drilling, was emplaced into the center of the western Rongmucuola pluton (Fig. 1B, C). No observed (this study) or documented crosscutting rela-tionships between the aplite and the P porphyry are known
(Yang et al., 2009; Zhao et al., 2016; Li et al., 2017a). The P porphyry is monzogranitic in composition (plagioclase, quartz, K-feldspar, and amphibole and biotite; Fig. 3B) and occurs in the centre (Fig. 1B, C) of the deposit (Yang et al., 2009; Hu et al., 2015; Zhao et al., 2016; Li et al., 2017a). The X por-phyry crosscuts both the western Rongmucuola pluton (Fig. 1C) and the P porphyry (Zhao et al., 2016), and has a limited distribution, as it is only present at shallow levels (<200 m) as
11
13
15
17
19
21
Dat
e (M
a)
16.10 ± 0.70 Ma6
LA LALA SHRIMP LA SHRIMP ID-ICPMS Re-Os
Rongmucuola pluton P porphyry X porphyry Post-ore Q-diorite Mineralization
SIMS
zircon U-Pb ( )2σ zircon U-Th-He ( )2σ 2 SD uncertaintiesmolybdenite Re-Os ( )2σ
9
17.2 ± 1.8 Ma, n = 24316.5 ± 2.2 Ma, n = 3815.8 ± 2.0 Ma, n = 3
16.3 ± 1.0 Ma, n = 1517.1 ± 2.0 Ma, n = 1314.7 ± 3.6 Ma, n = 3
15.9 ± 1.0 Ma, n = 18
15.1 ± 0.9 Ma, n = 3
15.7 ± 0.8 Ma, n = 2115.3 ± 0.6 Ma, n = 17
LA-ICP-MSSIMS/SHRIMPZircon U-Th-He
Rongmucuola pluton P porphyry
X porphyry
Post-ore dioriteMineralization
Aplite
brecciabreccia
A)
B)
decreasing relative age?
116.2 ± 0.3 Ma116.9 ± 0.4 Ma117.0 ± 0.6 Ma116.6 ± 0.5 Ma117.3 ± 0.3 Ma117.4 ± 0.4 Ma116.9 ± 0.3 Ma116.7 ± 0.3 Ma417.6 ± 0.4 Ma417.4 ± 0.6 Ma417.4 ± 0.5 Ma417.2 ± 0.4 Ma
216.35 ± 0.40 Ma216.38 ± 0.46 Ma317.58 ± 0.74 Ma
416.2 ± 0.4 Ma
517.58 ± 0.74 Ma 415.9 ± 0.4 Ma
415.7 ± 0.2 Ma
415.3 ± 0.3 Ma
data in and are reported LA and SHRIMP/SIMS datesblue purplefrom different studies, which are considered as emplacement ages
Mean and 2 standard deviation of all data from the same intrusion dated by same method
n = 16
Rongmucuola pluton P porphyry X porphyry Quartz diorite
Ar-Ar15.7 ± 0.2 Ma4
Fig. 2. Geologic time frame of the intrusion and mineralization at Qulong constrained by crosscutting relationships and geo-chronology. A) Relative chronology of the Miocene magmatism and mineralization at Qulong porphyry Cu-Mo deposit. B) Published geochronology data of the Miocene magmatism and mineralization at Qulong porphyry Cu-Mo deposit. See text for discussion. Detailed dates are provided in Appendix Tables A1 and A2. Source of dates: 1 = Hu et al. (2015), 2 = Wang et al. (2006), 3 = Li et al. (2004), 4 = Zhao et al. (2016), 5 = Hou et al. (2004), 6 = Li et al. (2017a); Revised after Li et al. (2017a).

GEOCHRONOLOGY CONSTRAINTS ON THE TIBETAN QULONG PORPHYRY Cu-Mo DEPOSIT 1423
discontinuous irregular dikes with variable thickness, from a few centimeters to 0.5 m (Yang et al., 2009; Li et al., 2017a). The X porphyry has a composition and texture similar to that of the P porphyry, with the exception to its biotite content (3–5% in the X porphyry vs. <3% in the P porphyry;(Yang et al., 2009). A magmatic-hydrothermal breccia pipe with a diameter of ~100 m (Fig. 1C) and unknown depth (>500 m) is observed to only crosscut the western Rongmucuola plu-ton (Yang et al., 2009; Zhao et al., 2016; Li et al., 2017a). The breccia pipe contains two stages of breccia formation, with the first-stage breccia comprising clasts (<2 cm) of the mineralized and hydrothermally altered Rongmucuola pluton and the X porphyry, which is crosscut by the second-stage breccia that is characterized by fragments (1–10 cm) of mineralized and hydrothermally altered Rongmucuola pluton (Yang et al., 2009; Zhao et al., 2016; Li et al., 2017a). A cement of a monzogranitic composition, plus mineralized alteration assemblages (e.g., anhydrite, quartz, feldspar, biotite, pyrite, and chalcopyrite) is characteristic of both stages of breccia (Yang et al., 2009).
The cessation of magmatism at Qulong is marked by a quartz diorite (plagioclase, quartz, and hornblende; Fig. 3C), which intrudes the Rongmucuola pluton (Fig. 1C) as discon-tinuous dikes with a thickness of 2 to 6 m (Yang et al., 2009; Hu et al., 2015; Zhao et al., 2016; Li et al., 2017a). The quartz diorite exhibits a low degree of alteration, as evidenced by the plagioclase phenocrysts. The alteration assemblage consists of calcite-chlorite-sericite and clay minerals (Yang et al., 2015; Li et al., 2017a).
Alteration and mineralization at QulongMineralization at Qulong is predominately (>80%) hosted by the western Rongmucuola pluton. Drill core logging
indicates that the Cu-Mo metals are directly associated with potassic stage alteration assemblages (80%), although propy-litic and phyllic alteration assemblages also contain Cu-Mo mineralization (Yang et al., 2009; Hu et al., 2015; Zhao et al., 2016; Li et al., 2017a). The potassic stage alteration is ubiqui-tous in the western Rongmucuola pluton with the most inten-sive alteration assemblages being spatially associated with the P porphyry and the N-S–trending fault system (Yang et al., 2009; Li et al., 2017a). Propylitic alteration assemblages pre-dominately occur in the western Rongmucuola pluton and overprint potassic alteration assemblages (Yang et al., 2009). Both potassic and propylitic stage alterations are overprinted by pervasive phyllic stage alteration assemblages in the west-ern Rongmucuola pluton (Yang et al., 2009; Zhao et al., 2016; Li et al., 2017a). In the first order, the grades of Cu-Mo met-als exhibit concentrically zoned patterns (Fig. 1D, E) around the P porphyry and the N-S–trending fault (Yang et al., 2009), although the ore with the highest grade does decouple from the P porphyry. The decoupling is most evident for the grade of Mo in the orebody, with the highest grade of ore only occuring on the eastern side of the P porphyry (Fig. 1E). Considering the small size, limited and discontinuous distribution of the aplite, and the X porphyry, it is currently accepted that the P porphyry is the main fluid conduit at Qulong (Yang et al., 2009; Hu et al., 2015; Zhao et al., 2016; Li et al., 2017a). The ore minerals at Qulong are chalcopyrite and molybdenite with trace amounts of bornite. They are pre-dominantly hosted by quartz vein assemblages in the western Rongmucuola pluton (Yang et al., 2009; Li et al., 2017a) and, to a lesser extent, by the Jurassic Yeba Formation. Except for very minor disseminated molybdenite clusters (<1 mm) or quartz veins with very minor molybdenite (equivalent to <0.5
100 μm
Rongmucuola pluton
P porphyry
Quartz diorite
z4 z7 z1 z5
z6z8z9z3
z2 z1 z3
z4Az5z6
z1 z9 z10 z6
z3z4z2
z4B
1 mm
1 mm
1 mm
A)
B)
C)
biotite quartz
altered plagioclase
quartz
fine grained quartz
altered feldspar
altered plagioclase
hornblende
D)
Fig. 3. Petrography of the Miocene units at Qulong and their zircon CL images. A) Rongmucuola pluton, B) P porphyry, C) postore quartz diorite, D) CL images of the analyzed zircon grains of the Rongmucuola pluton, the P porphyry and the quartz diorite.

1424 LI ET AL.
mg), which also exhibit intensive hydrothermal overprint by late-stage propylitic and phyllic alteration, no veins with lim-ited overprint and appreciable molybdenite (≥10 mg) have been observed in the P porphyry during the course of study. Further, according to previous drill core logging (Yang et al., 2009; Hu et al., 2015; Zhao et al., 2016; Li et al., 2017a) and observations from this study, the P porphyry has not been observed to crosscut any mineralization. The quartz veins are classified as A, B, and D veins (Fig. 4), based on previous studies (Yang et al., 2009; Li et al., 2017a) and by following the vein terminology/classification of Gustafson and Hunt (1975) and Sillitoe (2010).
Representative A, B, and D veins observed at Qulong are presented in Figure 4. The A veins are characterized by 0.3- to 0.8-cm-wide discontinuous granular quartz veinlets with dis-continuous narrow (<3 mm) K-feldspar selvages, which host disseminated chalcopyrite and molybdenite (Fig. 4A). The B veins are represented by veinlets (0.4–2 cm wide) compris-ing crystalline quartz with a crack-seal texture, and they have irregularly distributed K-feldspar selvages and predominantly host molybdenite and chalcopyrite along the vein margin (Fig. 4B). The D quartz veins (0.5–6 cm) host euhedral pyrite, with sericite and anhydrite (0.1 and 1.5 cm) selvages (Fig. 4D), and minor disseminated chalcopyrite and molybdenite.
B
B
D
quartz-sericite halo
K-feldspar halo
D
A
granular quartz -moly ± chalcopyrite
quartz - molybdenite ±chalcopyrite (± suture)
quartz-pyrite ± chalcopyrite
B
D
A
A)
B)
D)
C)
scale bar is 1 cm
molybdenite
discontinued granular quartz vein
molybdenitepyrite
anhydrite
quartz
crystalline quartz vein
molybdenite
discontinued K-feldspar halo
chalcopyrite
A quartz vein with tracemolybdenite and chalcopyrite
Later barre
n A quartz ve
in
B veinwith Cu-Mo
veins w/o identified types
barren A veincut by later A vein
note the disseminatedCu-Mo mineralization
E) F)
Note the ubiquitouschlorite alteration
chlorite
1 cm
1 cm
1 cm
1 cm 1 cm
Fig. 4. Representative A, B, and D veins from the Qulong porphyry Cu-Mo deposit and sketch shows the definition of these veins. A) The A veins are characterized by 0.3- to 0.8-cm-wide, discontinuous granular quartz veinlets with narrow (<3 mm) K-feldspar selvages, which host disseminated chalcopyrite and molybdenite; B) The B veins are represented by veinlets (0.4–2 cm wide) comprising crystalline quartz with suture in the center, and possess irregularly distributed K-feldspar sel-vage, and predominantly host molybdenite and chalcopyrite along the margin of the vein; C) The definitions of vein types are illustrated following those of Gustafson and Hunt (1975) and Sillitoe (2010). D) The D quartz veins (0.5–6 cm) host euhedral pyrite, with sericite and anhydrite (0.1 and 1.5 cm) selvages, and minor disseminated chalcopyrite and molybdenite. E-F) Representative sections showing the crosscutting relationships between different stages of veins, e.g., A type quartz vein cut by later A and B type veins. See text for details.

GEOCHRONOLOGY CONSTRAINTS ON THE TIBETAN QULONG PORPHYRY Cu-Mo DEPOSIT 1425
The relative timing relationships between different vein types, e.g., barren A vein cut by later mineralized A vein and/or B vein, have been previously documented (Yang et al., 2009; Li et al., 2017a) and also are observed in this study (Fig. 4E, F). However, importantly, to avoid any potential mixing of dif-ferent generations of mineralization and to yield robust molyb-denite Re-Os geochronology, this study focused on veins that have not been crosscut by later veins and on those that show the least evidence of overprinting (e.g., Fig. 4A, B, D).
Previous geochronologyThe Qulong deposit has been studied extensively with the principal goal of establishing the timing of magmatism, min-eralization, and the cooling history (Hou et al., 2004; Zheng et al., 2004; Wang et al., 2006; Yang et al., 2009, 2015; Hu et al., 2015; Zhao et al., 2016; Li et al., 2017a, and references therein). These studies established the time frame of the Qulong porphyry system (Fig. 2A) via laser ablation-induc-tively coupled plasma-mass spectrometer (LA-ICP-MS) and sensitive high resolution ion microprobe/secondary ion mass spectrometer (SHRIMP/SIMS) (U-Pb zircon; App. Table A1) and ID-ICP-MS (Re-Os molybdenite; App. Table A2). Samples from the western Rongmucuola pluton dated by in situ zircon U-Pb yield variable weighted mean 206Pb/238U dates between 17.6 ± 0.4 and 16.2 ± 0.3 Ma, with dates from the P porphyry varying from 17.58 ± 0.74 to 16.2 ± 0.4 Ma. The X porphyry has a mean 206Pb/238U date of 15.9 ± 0.4 Ma and postore quartz diorite yield mean 206Pb/238U dates of 15.7 ± 0.2 and 15.3 ± 0.3 Ma. Molybdenite hosted by the Rong-mucuola pluton yield variable dates ranging from 16.85 ± 0.19 to 15.36 ± 0.21 Ma. These prior studies provide a basic framework for the formation time of Qulong. However, the emplacement ages of the intrusions constrained by in situ U-Pb zircon techniques and the mineralization ages deter-mined by ID-ICP-MS molybdenite Re-Os methodology have significant uncertainties (1.3–4.2% and 1.1–12.2%, respec-tively), which equate to absolute uncertainties of 0.2 to 0.7 and 0.2 to 1.9 m.y., respectively, for the U-Pb and Re-Os dates of the ~16 Ma porphyry system. In order to evaluate the dates of the same intrusion from different studies, the mean and 2-standard deviation of zircon U-Pb 206Pb/238U data from dif-ferent studies with different dating techniques are presented in Figure 2B. The reason for using the mean and 2-standard deviation, rather than weighted mean, is that dates from dif-ferent studies are not equivalent and cannot be regarded as one population. The significant variations demonstrated in Figure 2B either reflect the complexity of ages (e.g., complex magmatic evolution history) the zircon grains record (Chelle-Michou et al., 2014), and/or unaccounted analytical bias inher-ent in microbeam analysis (Li et al., 2015). As demonstrated previously (von Quadt et al., 2011), the uncertainties of these data are mostly greater than the timescales proposed for the ore formation processes (Chiaradia et al., 2014). Therefore, these dates cannot be used to precisely define the durations of the magmatic and mineralization event(s) and further develop models for ore formation (Schaltegger et al., 2015).
Samples and Analytical MethodsTo provide robust and precise time constraints for the Qulong porphyry Cu-Mo system, high-precision CA-ID-TIMS zircon
U-Pb geochronology and ID-N-TIMS molybdenite Re-Os dating are employed. Representative samples of the western Rongmucuola pluton, P porphyry, and the quartz diorite (Fig. 3) were collected from drill core to conduct U-Pb zircon dat-ing. The X porphyry has been exhausted by previous studies in the available drill core we studied, and as such, the X por-phyry was not available for CA-ID-TIMS zircon U-Pb analysis for this study. A previous attempt to date the aplite by SIMS zircon U-Pb analysis demonstrated that the aplite only con-tains inherited grains (Li et al., 2017a), and in this case the aplite is not further investigated by CA-ID-TIMS.
The sample from the Rongmucuola pluton (1605-296, Fig. 3A) used for U-Pb dating exhibits a low degree of hydrother-mal alteration and mineralization, as evidenced by the rims of the biotite and plagioclase, which are altered to chlorite and sericite, with the groundmass possessing minor dissemi-nated pyrite. The P porphyry sample (001-550, Fig. 3B) used for U-Pb dating is extensively hydrothermally altered and overprinted by multiple stages of alteration assemblages. The quartz phenocrysts exhibit an embayed morphology and K-feldspar shows partial replacement by sericite. In addition, the groundmass displays different degrees of hypogene altera-tion. For example, plagioclase and biotite either exhibit com-plete or partial destruction with alteration to sericite/clay and chlorite, respectively. The quartz diorite sample (1605-81, Fig. 3C) used for U-Pb dating only exhibits minor alteration, as represented by the rims of the plagioclase phenocrysts that are altered to calcite-chlorite-sericite and clay minerals.
To yield robust molybdenite Re-Os geochronology, e.g., avoid any potential disturbance of Re-Os by overprinting and mixing different stages of mineralization, veins without intersections and exhibiting the least evidence of overprint (e.g., Fig. 4A, B, D) were selected for molybdenite Re-Os geochronology. Three A veins, 7 B veins, and 3 D veins were selected to conduct high-precision ID-N-TIMS Re-Os molybdenite geochronology analyses. All of the veins used for Re-Os molybdenite geochronology are hosted by the western Rongmucuola pluton, with the exception of one vein (sample 313-145), which is hosted by an aplite dike. The dated molyb-denite-bearing veins are identical to those used previously for a fluid inclusion study (Li et al., 2017a), and therefore per-mit coupling vein formation ages and temperatures (see Dis-cussion). The sample number of studied igneous rocks and molybdenite-bearing veins is made by combining the drill core number and sample depth in meters. Locations for drill-ing are marked in Figure 1B.
CA-ID-TIMS zircon U-PbThe methods used for U-Pb geochronology analyses are the same as previously documented by Tapster et al. (2016). Min-eral separation was carried out at the National Environment Research Council (NERC) Isotope Geosciences Laboratory (NIGL), British Geological Survey (BGS), Nottingham, UK. Zircons were isolated from ~1.5-kg drill core samples. After washing, samples were jaw-crushed, disc milled, and sieved (<400 µm). Heavy minerals were concentrated using a Rogers table, then a Frantz electromagnetic separator, and finally by standard heavy liquid (diiodomethane) concentration. Zircon grains from the concentrated materials were then handpicked under a binocular microscope and were mounted in epoxy,

1426 LI ET AL.
and then were polished with a 0.25-µm diamond paste and finished at near-equatorial sections to yield the best internal exposure of the zircon grains.
The mounts were coated with carbon for cathodolumines-cence (CL) imaging (Li et al., 2017b), and zircon grains with the least inclusions and no indication of inheritance cores (Fig. 3) were removed from the mounts and then individually ther-mally annealed in quartz crucibles at 900°C for ~60 hours as part of the chemical abrasion process (Mattinson, 2005). The zircons were then individually ultrasonically cleaned in warm 4N HNO3, and further rinsed with 4N HNO3 and ultrapure acetone. The chemical abrasion was continued by loading the zircons individually into 300-µl FEP Teflon microcapsules with 200-µl 29N HF with trace 4N HNO3. The microcapsules were placed in a self-sealing Parr™ vessel at ~180°C for 12 hours (Mattinson, 2005). The leachate was removed, with the zircon fractions being rinsed in 4N HNO3, fluxed in 6N HCl at ~80°C for several hours, and further rinsed in 4N HNO3 and ultrapure water. The leached zircons were spiked with the mixed 202Pb-205Pb–233U-235U EARTHTIME tracer solutions (ET2535: Condon et al., 2015; McLean et al., 2015) before dissolution with ~120 µl of 29N HF and trace HNO3 in Parr™ vessels at ~220°C for 60 hours. Solutions of the equilibrated tracer and dissolved zircon were evaporated and redissolved in ParrTM vessels overnight in 200 µl 3N HCl at 180°C. Ura-nium and Pb were separated by standard HCl-based anion-exchange chemistry (Krogh, 1973) and evaporated to dryness with 2 µl of 0.05N H3PO4.
Uranium and Pb were loaded together on a single zone-refined Re filament in a silica gel-phosphoric acid matrix (Gerstenberger and Haase, 1997). Isotope ratios were mea-sured using a Thermo-Electron Triton Thermal Ionization-Mass Spectrometer. Uranium was measured as an oxide (UO2) in static Faraday mode on Faraday detectors equipped with 1012 Ω resistors for intensities greater than 4 mV or peak-hopping mode on a secondary electron multiplier detector (SEMD) for low-U samples. The isobaric interferences are corrected using an 18O/16O value of 0.00205 (Condon et al., 2015). Lead isotope compositions were measured by peak-hopping mode on an SEMD. Linearity characterization and dead time corrections (Pb = 24.5 ns; U = 22 ns) for SEMD measurements were made from long-term monitoring of the NBS 982, NBS 981, and U 500 standards.
Measured U and Pb isotope data were processed using the TRIPOLI software package (Bowring et al., 2011). Data reduction, error propagation, data calculation, and presenta-tion were conducted using ET_Redux and related algorithms (McLean et al., 2011). Mass bias for Pb isotope measurement was corrected with real-time 202Pb/205Pb ratios (Condon et al., 2015; McLean et al., 2015). The U mass fractionation was cal-culated in real-time based on the isotopic composition of the EARTHTIME tracer solutions. Decay constants used here are from Cheng et al. (2000) for 230Th, Jaffey et al. (1971) for 238U and 235U, with the value of 238U/235U from Hiess et al. (2012).
All common Pb (Pbc) was attributed to an isotopic compo-sition of the NIGL laboratory blank of 206Pb/204Pb = 18.099 ± 3.02%, 207Pb/204Pb = 15.545 ± 1.758%, and 208Pb/204Pb = 37.824 ± 2.814% (2σ uncertainties) for the analytical period. For most zircon grains, the radiogenic Pb is high compared
with common Pb (with a ratio >5 in most cases), showing that the results are insensitive to the common Pb correc-tions (Table 1). The U blanks were assigned a value of 0.10 ± 0.02 pg (2σ) based upon total procedural blanks.
The preferential inclusion of 238U and exclusion of 230Th during zircon crystallization (Schärer, 1984), and thus even-tual deficit in 206Pb (younger apparent dates), was accounted for via Th disequilibrium correction. For corrections, the Th/U values of the bulk samples were used to represent the Th/U value of the melt at the time of zircon crystallization (Schärer, 1984).
The Th/U values of the Rongmucuola pluton, the P por-phyry, and the quartz diorite are 4.0, 3.6, and 5.0, respectively (Yang et al., 2009). These values were used with an uncer-tainty of ± 2 (2σ) to correct the initial 230Th disequilibrium. However, the Th/U values of individual zircons may vary due to fractional crystallization, partition coefficients, tempera-ture, and oxidation state (Rubatto and Hermann, 2007; Luo and Ayers, 2009; Burnham and Berry, 2012). To account for all these complexities, we further investigated the sensitivity of the initial 230Th disequilibrium correction by varying the Th/U values within geologically feasible values between 1 and 7 (Fig. 5). As demonstrated by using the youngest group comprising three zircon dates from the P porphyry (see below
15.90
15.95
16.00
16.05
16.10
Wei
ghte
d m
ean
date
(Ma)
Th/U
0.0
0.5
1.0
1.5
2.0
MSW
D o
f mea
n
0 2 4 6 8
Th/U0 2 4 6 8
A)
B)
applied value for P porphyryTh/U = 3.6 ± 2
applied value for P porphyryTh/U = 3.6 ± 2
Fig. 5. The impact of initial 230Th disequilibrium correction on age dates as illustrated by the youngest group of zircon dates of the P porphyry. A) the weighted mean of the youngest three dates as a function of variable Th/U values used for initial 230Th disequilibrium correction. B) The MSWD of the weighted mean of the youngest three dates as a function of the variable Th/U values used for initial 230Th disequilibrium correction. Also showing in the fig-ure is the applied Th/U value with uncertainty for initial 230Th disequilibrium correction for P porphyry (see text for detailed discussion).

G
EO
CH
RO
NO
LO
GY C
ON
STRA
INTS O
N TH
E TIB
ETA
N Q
UL
ON
G PO
RPH
YRY C
u-Mo D
EPO
SIT 1427
Table 1. CA-ID-TIMS U-Pb Data of Miocene Intrusive Rocks at Qulong
Composition Isotopic ratios Dates (Ma)
Fraction Th/ Pb* Pbc Pb*/ Th/U ±2σ 206Pb/ 207Pb/ ±2σ 206Pb/ ±2σ 207Pb/ ±2σ 206Pb/ ±2σ 206Pb/ ±2σ 207Pb/ ±2σ 207Pb/ ±2σ Discor- Corr. U 1 (pg) 2 (pg) 3 Pbc 4 [magma] (abs) 204Pb 5 235U 6 (%) 238U 6 (%) 206Pb 6 (%) 238U 7 (abs) 238U 8 (abs) 235U 8 (abs) 206Pb 8 (abs) dance 9% coef.
Sample 1605-296z4 0.59 1.95 0.56 3.47 4.00 2.00 222 0.01866 3.0 0.00278 0.28 0.04873 2.9 17.975 0.050 17.882 0.049 18.768 0.552 134 69 4.2 0.122z7 0.55 3.38 0.27 12.63 4.00 2.00 769 0.01724 1.7 0.00274 0.17 0.04573 1.7 17.708 0.031 17.614 0.030 17.359 0.292 –18 41 –2.0 0.065z1 0.57 4.82 0.50 9.66 4.00 2.00 590 0.01727 1.1 0.00267 0.11 0.04687 1.1 17.302 0.020 17.208 0.019 17.382 0.187 41 26 0.5 0.195z5 0.52 2.71 0.31 8.88 4.00 2.00 552 0.01693 1.5 0.00266 0.15 0.04626 1.5 17.193 0.027 17.098 0.026 17.050 0.261 10 36 –0.8 0.391z3 0.47 0.59 0.26 2.26 4.00 2.00 156 0.01715 4.8 0.00265 0.43 0.04688 4.7 17.180 0.074 17.084 0.074 17.262 0.815 42 111 0.5 0.284z9 0.52 9.02 0.35 25.94 4.00 2.00 1573 0.01726 0.5 0.00265 0.09 0.04728 0.4 17.145 0.016 17.051 0.015 17.372 0.078 62 11 1.3 0.168z8 0.51 9.31 0.62 15.02 4.00 2.00 921 0.01706 0.8 0.00265 0.15 0.04679 0.8 17.129 0.026 17.034 0.025 17.177 0.140 37 19 0.3 0.245z6 0.59 1.59 0.36 4.40 4.00 2.00 277 0.01688 3.6 0.00264 0.31 0.04649 3.4 17.057 0.053 16.964 0.052 17.001 0.600 22 82 –0.3 0.458
Sample 001-550z2 1.11 4.58 1.42 3.22 3.60 2.00 185 0.01613 4.0 0.00249 0.39 0.04697 3.9 16.115 0.065 16.040 0.062 16.245 0.640 47 92 0.8 0.335z1 1.05 2.41 0.81 2.99 3.60 2.00 175 0.01627 4.9 0.00249 0.40 0.04742 4.8 16.107 0.067 16.030 0.064 16.389 0.795 69 113 1.7 0.342z3 0.84 5.10 0.72 7.12 3.60 2.00 411 0.01618 2.2 0.00248 0.21 0.04730 2.1 16.063 0.036 15.979 0.033 16.297 0.356 63 51 1.4 0.306z6 0.55 25.24 1.48 17.10 3.60 2.00 1036 0.01587 0.6 0.00248 0.11 0.04643 0.6 16.057 0.019 15.965 0.017 15.983 0.102 19 15 –0.5 0.204z5 1.11 4.78 0.92 5.19 3.60 2.00 287 0.01605 2.3 0.00248 0.22 0.04698 2.3 16.031 0.039 15.956 0.035 16.163 0.368 47 54 0.8 0.208z4B 0.94 6.07 0.30 20.33 3.60 2.00 1113 0.01603 0.8 0.00247 0.09 0.04703 0.8 16.008 0.021 15.928 0.014 16.152 0.126 50 18 0.9 0.294z4A 0.92 3.40 0.33 10.20 3.60 2.00 571 0.01589 1.5 0.00247 0.17 0.04664 1.4 15.998 0.031 15.917 0.027 16.008 0.233 30 33 0.1 0.494
Sample 1605-81z8 1.13 1.25 1.03 1.21 4.97 2.00 80 0.03674 18.0 0.00563 1.46 0.04737 17.0 36.267 0.528 36.183 0.528 36.641 6.475 67 406 1.0 0.668z1 0.50 7.23 0.30 23.78 4.97 2.00 1452 0.01513 0.4 0.00234 0.06 0.04683 0.4 15.189 0.009 15.091 0.009 15.243 0.067 39 10 0.4 0.222z9 1.14 2.97 0.26 11.38 4.97 2.00 604 0.01494 1.2 0.00234 0.13 0.04625 1.2 15.179 0.019 15.095 0.019 15.061 0.179 10 28 –0.8 0.226z10 0.60 3.35 0.28 11.82 4.97 2.00 713 0.01503 1.1 0.00234 0.16 0.04657 1.0 15.173 0.025 15.077 0.025 15.147 0.171 26 25 –0.2 0.717z6 0.48 3.95 0.73 5.42 4.97 2.00 347 0.01520 1.8 0.00234 0.17 0.04712 1.8 15.171 0.026 15.073 0.026 15.321 0.278 54 43 1.0 0.138z2 0.72 8.33 0.83 9.99 4.97 2.00 587 0.01510 1.1 0.00234 0.11 0.04682 1.1 15.158 0.016 15.065 0.016 15.215 0.165 39 26 0.4 0.166z4 0.57 2.39 1.03 2.33 4.97 2.00 156 0.01542 4.8 0.00234 0.44 0.04789 4.8 15.143 0.067 15.047 0.067 15.541 0.747 93 113 2.6 0.253z3 0.81 4.47 1.27 3.52 4.97 2.00 214 0.01498 3.1 0.00233 0.29 0.04660 3.0 15.116 0.044 15.025 0.044 15.102 0.462 27 73 –0.1 0.185
1 Th contents calculated from radiogenic 208Pb and the 230Th-corrected 206Pb/238U date of the sample, assuming concordance between the U-Pb and Th-Pb systems2 Total mass of radiogenic Pb3 Total mass of common Pb4 Ratio of radiogenic Pb (including 208Pb) to common Pb5 Measured ratio corrected for fractionation and spike contribution only6 Measured ratios corrected for fractionation, tracer and blank7 Corrected for initial Th/U disequilibrium using radiogenic 208Pb and Th/U[magma]8 Isotopic dates calculated using the decay constants λ238 = 1.55125E-10 and λ235 = 9.8485E-10 (Jaffey et al. 1971)9 % discordance = 100 – (100 * (206Pb/238U date) / (207Pb/235Pb date))

1428 LI ET AL.
for detailed discussion), the weighted average of the young-est group varied by less than 40 k.y. over the range of Th/U values between 2 and 7 (Fig. 5A), and the statistically accept-able MSWD values (e.g., <1.5, Fig. 5B) were maintained throughout. In addition, within uncertainties, the weighted average from our preferred solution (using the bulk sample Th/U value for correction) overlapped with those corrected from Th/U values of 2 to 7 (Fig. 5A). However, when mag-matic Th/U value approached unity (Th/U = 1), a significantly younger date was determined. Given that the Th/U values of the Rongmucuola pluton, the P porphyry, and the quartz diorite are 4.0, 3.6, and 5.0, respectively (Yang et al., 2009), we consider that correcting for initial 230Th disequilibrium using a Th/U ≤1 is a geologically unreasonable assumption.
Therefore, using Th/U values (± 2, 2σ) of the bulk samples is a reasonable and valid approach.
ID-N-TIMS molybdenite Re-OsThe molybdenite separation and Re-Os dating methods are adopted from previous studies (Selby and Creaser, 2001; Lawley and Selby, 2012). Molybdenite-bearing (0.3- to 3-mm grain size) quartz veins were selected based on previous petrography and fluid inclusion study (Li et al., 2017a), and then cut into several parts depending on molybdenite abun-dance (Fig. 6). The fractions were then individually crushed, using an agate pestle, to 10 mesh (~2 mm) and then hand-picked under a binocular microscope to remove nonmolyb-denite-bearing phases and to examine the genetic association
molybdenite bearing quartz vein
separation 1 separation 2 separation 3 separation 4
A)
separation 1 separation 2 separation 3 separation 4
B)
multiple independent molybdenite separations from a single vein
C)
27.40
27.50
27.60
27.70
27.80
27.90
Dat
e (M
a)
Mean = 27.695 ± 0.038 Ma, n = 9, MSWD = 0.53
box heights are 2σ
Recommended value = 27.66 ± 0.10
1 cm
Fig. 6. A) Cartoon illustrates the approach of obtaining several independent molybdenite separates from a single vein, which permits testing the consistency of Re-Os systematics along the vein, verifying the accuracy of the Re-Os ages, and reducing analytical uncertainties. B) The multiple independent molybdenite separates approach illustrated by a B vein analyzed in this study. C) The model ages of the Henderson molybdenite reference materials (RM8599) analyzed during the course of study, which yields a weighted mean of 27.695 ± 0.038 (n = 9, MSWD = 0.53) and overlaps with the recommended value of 27.66 ± 0.10 (Markey et al., 2007; Zimmerman et al., 2014).

GEOCHRONOLOGY CONSTRAINTS ON THE TIBETAN QULONG PORPHYRY Cu-Mo DEPOSIT 1429
between quartz and molybdenite. The prepurified materials (quartz-bearing molybdenite) of individual separations were loaded into Teflon beakers with 10 ml 32N HF to dissolve quartz at room temperature overnight (Lawley and Selby, 2012). The HF purification step was repeated until most of the quartz fractions were dissolved, e.g., most of the molybde-nites were liberated. The molybdenites were then rinsed with Milli-Q water (MQ) three times and further rinsed with etha-nol, and then dried at ~35°C. The concentrated molybdenite aliquots were further purified (removal of any pyrite and/or chalcopyrite and undissolved silicate phases) by hand under a binocular microscope. The purity of the mineral separate was estimated to be better than 95%.
This approach, dating multiple independent molybdenite separations from a single vein (Fig. 6A, B), offers the oppor-tunity to check the consistency and closed system behavior of the Re-Os system within the vein and ultimately to verify the accuracy of the dates, as further discussed below. In addition, as with zircon U-Pb geochronology, this approach permits cal-culating a weighted average of dates from the same vein and statistically reduces the effect of the analytical uncertainties.
For molybdenite digestion, a known amount of molybde-nite (typically >20 mg) and tracer solution (185Re plus isotopi-cally normal Os; Selby and Creaser, 2001) was loaded into a Carius tube (Shirey and Walker, 1995) with 3 ml 15.5N HCl and 6 ml 16N HNO3, sealed and placed in steel jackets. The Carius tube-bearing jackets were placed in an oven to digest at 220°C for ~24 hours, which permitted the achievement of both rhenium and osmium isotope equilibrium between the tracer and sample (Selby and Creaser, 2001). Once cooled to room temperature, the outsides of the tubes were carefully rinsed with MQ to remove any particles and then dried. The bottom parts of the Carius tubes were frozen in a mixture of dry ice and ethanol and then opened from the top with an H2-O2 flame in a fume hood. Osmium was isolated from the acid medium using a solvent extraction method (CHCl3; 3 × 3 mL) at room temperature (Shen et al., 1996), and then back extracted into HBr (Cohen and Waters, 1996) on a rocker overnight. The Os-bearing HBr solution was dried with the Os further purified by microdistillation (Roy-Barman, 1993; Birck et al., 1997). After Os extraction, the Re-bearing acid medium was dried and then separated by NaOH-acetone solvent extraction (Matthews and Riley, 1970). The Re was further purified via modified standard anion column chroma-tography (Morgan et al., 1991).
Rhenium and Os were loaded onto outgassed Ni and Pt fila-ments, respectively. The isotopic compositions of Re and Os were measured with negative thermal ionization mass spec-trometry (N-TIMS) as ReO4
– and OsO3–, respectively (Creaser
et al., 1991; Völkening et al., 1991). The mass spectrometer analysis was conducted on a Thermo Scientific Triton mass spectrometer at Durham University, with Re and Os isotope compositions measured using static Faraday cups collection mode. The measured Re and Os isotope compositions were corrected using a 18O/16O and 17O/16O value of 0.002045 and 0.001113 (Nier, 1950). The isotopic composition of Re was corrected for instrumental fractionation by fractionation fac-tors defined by the differences between standard Re analyses and the value of Gramlich et al. (1973; 185Re/187Re = 0.59738) before and after the sample Re measurements. The Os mass
fractionation was monitored in real time by monitoring the Os isotope composition of the tracer and corrected using a 192Os/188Os of 3.08761. The uncertainties of sample Re and Os isotope composition measurements, tracer calibration, sam-ple and tracer weighting, reproducibility of Re and Os isotope standards, as well as blank abundances and isotopic composi-tions during the course of study were all propagated. During this study, the Re and Os blanks were 2 and 0.5 pg, respec-tively, with an 187Os/188Os value of 0.24 ± 0.01 (n = 6, 2σ). The high Re and Os abundances (Table 2) in these samples in comparison to the blanks result in a negligible blank correc-tion to the final date (<0.035%).
The molybdenite Re-Os model age was calculated using the equation t = ln (187Os/187Re + 1)/λ, in which λ is the decay constant (Smoliar et al., 1996). Using the 187Re decay constant of Selby et al. (2007) yielded model ages that are ~0.008 m.y. younger than those calculated with 187Re decay constant of (Smoliar et al., 1996). This small systematic discrepancy is at the same level as the analytical uncertainty and the model ages calculated with two 187Re decay constants that overlap within uncertainties. Therefore, we consider that using either one of the 187Re decay constants does not impact the interpre-tation of the final date.
To evaluate the accuracy and reproducibility of the molyb-denite Re-Os analytical approach, the Henderson molybde-nite reference material (RM8599) was run during the course of this study. Nine analyses of RM8599 yielded a weighted mean of 27.695 ± 0.038 (2σ, MSWD = 0.53, Fig. 6C), which is in good agreement with the recommended value 27.66 ± 0.10 Ma (Markey et al., 2007; Zimmerman et al., 2014), and previous analysis at Durham (Lawley and Selby, 2012).
A further consideration, although negligible, is the presence of trace amounts of common 187Os in the molybdenite (Stein et al., 2001; Selby and Creaser, 2001; Stein, 2014), which is not accounted for by the analytical method using a tracer solu-tion with a normal Os isotope composition (Selby and Creaser, 2001; Markey et al., 2007). However, the level of common 187Os in most published molybdenite is <~23 ppt, and typi-cally <6 ppt ( Stein et al., 2001; Stein, 2014; Zimmerman et al., 2014; Spencer et al., 2015). Therefore, this level of common 187Os will only alter the model ages of the studied samples by 1 to 10 k.y. (33 of the 42 dates <3 k.y.). Further, our approach of obtaining multiple independent dates from a single vein (Fig. 6A, B) is an independent test for the consistency of the Re-Os systematics along the vein. The reproducible dates (Table 2) from the same vein verify the accuracy of the model ages, and support the negligible presence of common 187Os in molybde-nite since a single vein can be regarded as a specific geologic event (Stein, 2006). Finally, as other tracers (e.g., 190Os-188Os tracer) are calibrated against the common Os solution/tracer (Markey et al., 2007), their precision and accuracy will never be better than that of the common Os tracer, and as a result dates obtained using a common Os tracer, will, in principle, have smaller uncertainties inherited from tracer calibration.
Uncertainties of duration and cooling ratesAs this study is utilizing high-precision dates to constrain the ore-forming process, e.g., the duration and cooling rates, it is particularly important to evaluate the uncertainties associ-ated with the dates. For durations calculated from the same
1430 L
I ET A
L.
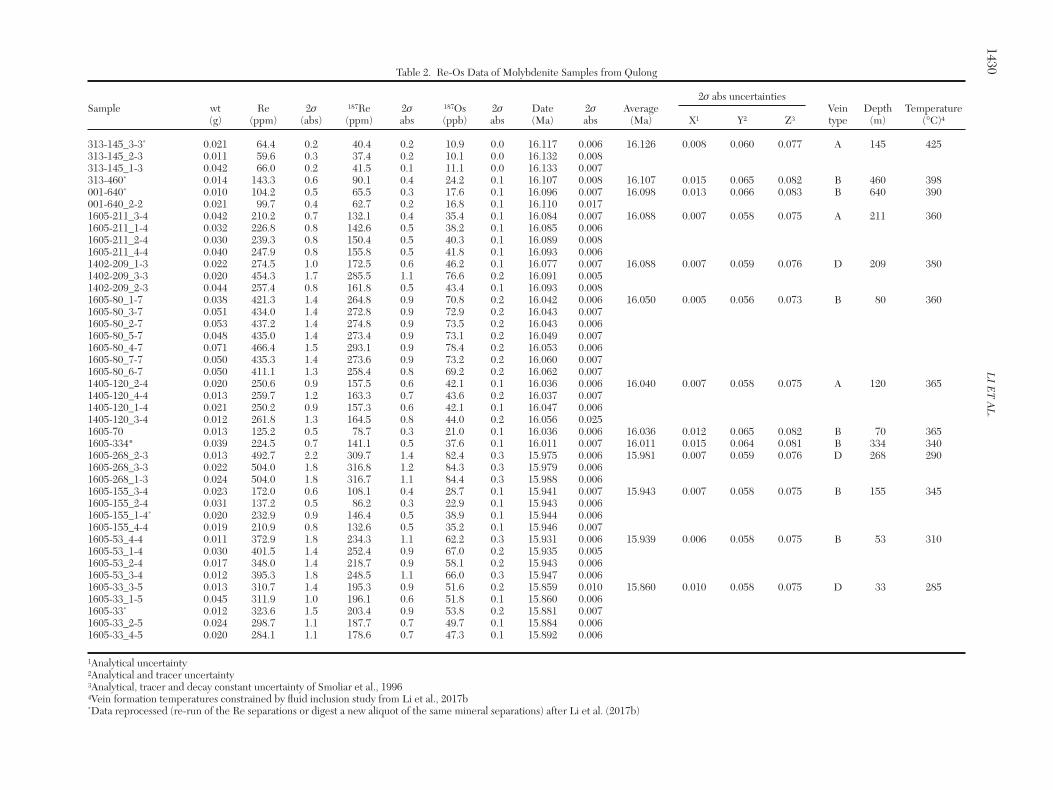
Table 2. Re-Os Data of Molybdenite Samples from Qulong
2σ abs uncertaintiesSample wt Re 2σ 187Re 2σ 187Os 2σ Date 2σ Average Vein Depth Temperature (g) (ppm) (abs) (ppm) abs (ppb) abs (Ma) abs (Ma) X1 Y2 Z3 type (m) (°C)4
313-145_3-3* 0.021 64.4 0.2 40.4 0.2 10.9 0.0 16.117 0.006 16.126 0.008 0.060 0.077 A 145 425313-145_2-3 0.011 59.6 0.3 37.4 0.2 10.1 0.0 16.132 0.008313-145_1-3 0.042 66.0 0.2 41.5 0.1 11.1 0.0 16.133 0.007313-460* 0.014 143.3 0.6 90.1 0.4 24.2 0.1 16.107 0.008 16.107 0.015 0.065 0.082 B 460 398001-640* 0.010 104.2 0.5 65.5 0.3 17.6 0.1 16.096 0.007 16.098 0.013 0.066 0.083 B 640 390001-640_2-2 0.021 99.7 0.4 62.7 0.2 16.8 0.1 16.110 0.0171605-211_3-4 0.042 210.2 0.7 132.1 0.4 35.4 0.1 16.084 0.007 16.088 0.007 0.058 0.075 A 211 3601605-211_1-4 0.032 226.8 0.8 142.6 0.5 38.2 0.1 16.085 0.0061605-211_2-4 0.030 239.3 0.8 150.4 0.5 40.3 0.1 16.089 0.0081605-211_4-4 0.040 247.9 0.8 155.8 0.5 41.8 0.1 16.093 0.0061402-209_1-3 0.022 274.5 1.0 172.5 0.6 46.2 0.1 16.077 0.007 16.088 0.007 0.059 0.076 D 209 3801402-209_3-3 0.020 454.3 1.7 285.5 1.1 76.6 0.2 16.091 0.0051402-209_2-3 0.044 257.4 0.8 161.8 0.5 43.4 0.1 16.093 0.0081605-80_1-7 0.038 421.3 1.4 264.8 0.9 70.8 0.2 16.042 0.006 16.050 0.005 0.056 0.073 B 80 3601605-80_3-7 0.051 434.0 1.4 272.8 0.9 72.9 0.2 16.043 0.0071605-80_2-7 0.053 437.2 1.4 274.8 0.9 73.5 0.2 16.043 0.0061605-80_5-7 0.048 435.0 1.4 273.4 0.9 73.1 0.2 16.049 0.0071605-80_4-7 0.071 466.4 1.5 293.1 0.9 78.4 0.2 16.053 0.0061605-80_7-7 0.050 435.3 1.4 273.6 0.9 73.2 0.2 16.060 0.0071605-80_6-7 0.050 411.1 1.3 258.4 0.8 69.2 0.2 16.062 0.0071405-120_2-4 0.020 250.6 0.9 157.5 0.6 42.1 0.1 16.036 0.006 16.040 0.007 0.058 0.075 A 120 3651405-120_4-4 0.013 259.7 1.2 163.3 0.7 43.6 0.2 16.037 0.0071405-120_1-4 0.021 250.2 0.9 157.3 0.6 42.1 0.1 16.047 0.0061405-120_3-4 0.012 261.8 1.3 164.5 0.8 44.0 0.2 16.056 0.0251605-70 0.013 125.2 0.5 78.7 0.3 21.0 0.1 16.036 0.006 16.036 0.012 0.065 0.082 B 70 3651605-334* 0.039 224.5 0.7 141.1 0.5 37.6 0.1 16.011 0.007 16.011 0.015 0.064 0.081 B 334 3401605-268_2-3 0.013 492.7 2.2 309.7 1.4 82.4 0.3 15.975 0.006 15.981 0.007 0.059 0.076 D 268 2901605-268_3-3 0.022 504.0 1.8 316.8 1.2 84.3 0.3 15.979 0.0061605-268_1-3 0.024 504.0 1.8 316.7 1.1 84.4 0.3 15.988 0.0061605-155_3-4 0.023 172.0 0.6 108.1 0.4 28.7 0.1 15.941 0.007 15.943 0.007 0.058 0.075 B 155 3451605-155_2-4 0.031 137.2 0.5 86.2 0.3 22.9 0.1 15.943 0.0061605-155_1-4* 0.020 232.9 0.9 146.4 0.5 38.9 0.1 15.944 0.0061605-155_4-4 0.019 210.9 0.8 132.6 0.5 35.2 0.1 15.946 0.0071605-53_4-4 0.011 372.9 1.8 234.3 1.1 62.2 0.3 15.931 0.006 15.939 0.006 0.058 0.075 B 53 3101605-53_1-4 0.030 401.5 1.4 252.4 0.9 67.0 0.2 15.935 0.0051605-53_2-4 0.017 348.0 1.4 218.7 0.9 58.1 0.2 15.943 0.0061605-53_3-4 0.012 395.3 1.8 248.5 1.1 66.0 0.3 15.947 0.0061605-33_3-5 0.013 310.7 1.4 195.3 0.9 51.6 0.2 15.859 0.010 15.860 0.010 0.058 0.075 D 33 2851605-33_1-5 0.045 311.9 1.0 196.1 0.6 51.8 0.1 15.860 0.0061605-33* 0.012 323.6 1.5 203.4 0.9 53.8 0.2 15.881 0.0071605-33_2-5 0.024 298.7 1.1 187.7 0.7 49.7 0.1 15.884 0.0061605-33_4-5 0.020 284.1 1.1 178.6 0.7 47.3 0.1 15.892 0.006
1Analytical uncertainty2Analytical and tracer uncertainty3Analytical, tracer and decay constant uncertainty of Smoliar et al., 19964Vein formation temperatures constrained by fluid inclusion study from Li et al., 2017b*Data reprocessed (re-run of the Re separations or digest a new aliquot of the same mineral separations) after Li et al. (2017b)

GEOCHRONOLOGY CONSTRAINTS ON THE TIBETAN QULONG PORPHYRY Cu-Mo DEPOSIT 1431
radioisotopic system, e.g., Re-Os or U-Pb, either analytical uncertainty or analytical + tracer calibration uncertainties are considered for dates using the same tracer or different tracer, respectively. For example, when calculating the duration of mineralization (Re-Os system), or the temporal gap between the emplacement of the Rongmucuola pluton and the P por-phyry (U-Pb system), only analytical uncertainties need to be accounted for. Considering that molybdenite Re-Os and zircon U-Pb dates are “independent” chronometers, the uncertainty related to calibration of both systems must be considered (i.e., tracer calibration and decay constants) when comparing the two chronometers to derive a geologic inference.
The uncertainties of the duration or rates are propagated using a Monte Carlo simulation. When calculating the uncer-tainties of the cooling rates, in addition to considering the analytical uncertainties of the Re-Os dates, the uncertainty in the trapping temperatures of quartz-hosted fluid inclusions is used (± 20°C; Li et al., 2017a).
ResultsThe uncertainties of the U-Pb and Re-Os dates are pre-sented as ± x/y/z (analytical uncertainty /+tracer calibration /+decay constant uncertainties) in Figures 7 and 8 (Tables 1, 2), respectively.
Zircon U-Pb geochronologyAll the analyzed zircon grains from the Rongmucuola pluton, with the exception of two, yielded concordant 206Pb/238U and 207Pb/235U dates (Fig. 7A).
The eight zircons from the western Rongmucuola pluton yielded 206Pb/238U dates of 17.975 to 17.057 Ma (Fig. 7B) with Th/Uzircon values of 0.47 to 0.59 (Table 1). The youngest date obtained from a single analysis was 17.057 Ma, but this date could not be reproduced by other zircon grains. A weighted mean, 17.142 ± 0.014/0.014/0.023 Ma, was calculated from the youngest cluster of dates that yielded a statistically accept-able population (MSWD = 1.12; n = 3).
Seven analyses from the P porphyry yielded 206Pb/238U dates between 16.115 and 15.998 Ma (Fig. 7B), and the youngest cluster of dates gave a weighted mean of 16.009 ± 0.016/0.017/0.024 (MSWD = 0.90; n = 3) with Th/Uzircon val-ues of 0.92 to 1.11 (Table 1). This group included two frag-ments of a single elongate prismatic zircon grain (z4A and z4B; Fig. 3D) which yielded indistinguishable dates.
Seven zircons from the quartz diorite yielded 206Pb/238U dates of 15.189 to 15.116 Ma (Fig. 7B) with six yielding a weighted mean of 15.166 ± 0.010/0.011/0.020 (MSWD = 1.67).
Molybdenite Re-Os geochronologyFor the 13 molybdenite-bearing veins, multiple (2–7) indi-vidual molybdenite separates (e.g., Fig. 6) were obtained for each vein, except for three veins that only yielded one sepa-rate each as a result of a low concentration of molybdenite. In total, 42 analyses were conducted, of which six were repro-cessed after Li et al. (2017a), either through re-analysis of the purified Re fraction or analysis a new aliquot of the identi-cal mineral separate. Overall, the Re and 187Os abundances
z4
z7
z1
z5z3 z9 z8
z6
z2 z1 z3 z6 z5 z4B z4A
z1 z9 z10 z6 z2 z4 z3 15
16
17
18
Rongmucuola pluton17.142 ± 0.014 /0.014 /0.023 Man = 3, MSWD = 1.12
P porphyry16.009 ± 0.016 /0.017 /0.024 Man = 3, MSWD = 0.90
Quartz diorite15.166 ± 0.010 /0.011 /0.020 Man = 6, MSWD = 1.67
206
238
Pb/
U d
ate
(Ma)
z1
data excluded
data included
analytical+ tracer+ decay constantuncertainties at 2σ zircon number
17.142 ± 0.014 /0.014 /0.023 Ma
Rongmucuola pluton
P porphyry
Quartz diorite
0.0026
0.0024
0.0028
207 235Pb/ U
206
238
Pb/
U
B)A)
0.0023
0.0025
0.0027
0.014 0.016 0.018 0.020
error ellipses are 2σ15
16
17
18
Fig. 7. The CA-ID-TIMS U-Pb zircon dates of the Rongmucuola pluton, the P porphyry and the quartz diorite at Qulong porphyry Cu-Mo deposit. A) The Wetherill Concordia diagram of the analyzed zircon grains. B) 206Pb/238U ages of the ana-lyzed zircon grains and the weighted mean ages of the Rongmucuola pluton, the P porphyry and postore quartz diorite.

1432 L
I ET A
L.
15.6
15.7
15.8
15.9
16.0
16.1
16.2
16.3
16.4
16.126±0.008/0.060/0.077MSWD=1.9
vein type box heights are 2σ
analytical+tracer+decay constant uncertaintyanalytical uncertaintyanalytical+tracer uncertainty
weighted mean±x/y/z
x=analytical uncertaintyy=x+tracer uncertaintyz=y+decay constant uncertainty
1605-211 sample number (drill core no.-depth)
16.088±0.007/0.058/0.075MSWD=0.43
16.098±0.013/0.066/0.083MSWD=0.6
16.088±0.007/0.058/0.075MSWD=0.43
16.088±0.007/0.059/0.076MSWD=1.6
16.050±0.005/0.056/0.073MSWD=1.5
16.040±0.007/0.058/0.075MSWD=0.69
15.981±0.007/0.059/0.076MSWD=1.3
15.943±0.007/0.058/0.075MSWD=0.09
15.939±0.006/0.058/0.075MSWD=1.6
15.877±0.006/0.056/0.073MSWD=5.0
16.107±0.015/0.065/0.082
16.036±0.012/0.065/0.082
16.011±0.015/0.064/0.081
313-145313-460 001-640
1402-2091605-211
1605-80 1605-701405-120 1605-334
1605-268
1605-1551605-53
1605-33
AB B
A D
BA
BB
D
BB
D
A
15.860±0.010/0.058/0.075
MSWD=0.021
15.886±0.007/0.058/0.075MSWD=0.87
for single analyse
for multiple analysis
densityplot
Dat
e (M
a)
A veinB veinD vein
emplacement ageof P porphyry 16.009±0.024
Fig. 8. The ID-N-TIMS molybdenite Re-Os geochronology data of molybdenite veins at Qulong, with probability density plot of different type of veins shown as insert.

GEOCHRONOLOGY CONSTRAINTS ON THE TIBETAN QULONG PORPHYRY Cu-Mo DEPOSIT 1433
of these samples range from 60 to 504 ppm, and from 10 to 85 ppb, respectively (Table 2).
The weighted mean dates were calculated for each vein, with the exception of the three veins with only one analy-sis. The weighted mean dates or model age dates (three samples with one analysis) for these veins span from 16.126 ± 0.008/0.060/0.077 (n = 3, MSWD = 1.9) to 15.860 ± 0.010/0.058/0.075 Ma (n = 2, MSWD = 0.021) and do not form a single statistic population (Fig. 8). Dates of A, B, and D veins vary from 16.126 ± 0.008/0.060/0.077 (n = 3, MSWD = 1.9) to 16.040 ± 0.007/0.058/0.075 Ma (n = 4, MSWD = 0.69), from 16.107 ± 0.015/0.065/0.082 (n = 1) to 15.939 ± 0.006/0.058/0.075 Ma (n = 4, MSWD = 1.6), and from 16.088 ± 0.007/0.059/0.076 (n = 3, MSWD = 1.6) to 15.860 ± 0.010/0.058/0.075 Ma (n = 2, MSWD = 0.021), respectively. No relationship is observed between dates and vein types, although all A veins are older than 16.040 ± 0.007/0.058/0.075 Ma (Fig. 8).
Discussion
A refined chronology of the Qulong porphyry systemRegarding the emplacement ages of the dated igneous units, our preferred interpretation is the weighted averages calcu-lated from the youngest groups of 206Pb/238U dates. For the Rongmucuola pluton, the youngest date cannot be repro-duced by other grains. To avoid biasing the emplacement age to a younger date, which could potentially be related to lead loss, we consider the weighted average of the youngest clus-ter, 17.142 ± 0.014/0.014/0.023 Ma (MSWD = 1.12; n = 3), as our preferred estimate of the emplacement age of the western Rongmucuola pluton (Fig. 7).
The youngest cluster of zircon grains from the P porphyry comprises two fragments of a single elongate prismatic zircon grain (z4A and z4B; Fig. 3D), therefore supporting the hypoth-esis that the lead loss domains, if they occurred, were effi-ciently removed by the chemical abrasion process. As such, we consider the weighted mean, 16.009 ± 0.016/0.017/0.024 Ma (MSWD = 0.90; n = 3), as the best estimate of the emplace-ment age of the P porphyry.
The best estimated emplacement age of the quartz diorite is 15.166 ± 0.010/0.011/0.020 Ma (MSWD = 1.67, n = 6), rep-resented by the weighted average calculated from six of the seven zircon Miocene dates (Fig. 7B).
The oldest discordant zircon from the Rongmucuola pluton is interpreted as a result of the incorporation of xenocrystic cores from an older magmatic source. A similar scenario is preferred to explain the ~36.267 Ma grain from the quartz diorite (Table 1). The older dates from each pluton are inter-preted as a mixture of two age domains (Chelle-Michou et al., 2014), e.g., in addition to the zircon rims formed during the emplacement of the intrusions, the zircons also contain xeno-crystic cores, or represent a protracted zircon crystallization history in an upper crustal magma chamber, and are not dis-cussed further.
As discussed above, our new CA-ID-TIMS U-Pb zircon ages provided here agree with the relative chronology based on field observations (Fig. 2A) and the time frame determined via in situ U-Pb zircon techniques (Fig. 2B), but at a much higher temporal resolution (~0.1%).
Field relationships show that the Rongmucuola pluton and the quartz diorite are pre- and postore without further evidence of Miocene magmatism outside this interval (Yang et al., 2009, 2015; Hu et al., 2015; Zhao et al., 2016; Li et al., 2017a). In this regard, the U-Pb ages of the Rongmucuola pluton and the quartz diorite constrain the duration of miner-alization-related magmatism at Qulong to 1.976 ± 0.017 m.y. The aplite is observed only in the Rongmucuola pluton, with-out direct crosscutting relationship with both the P and X por-phyries (Yang et al., 2009; Hu et al., 2015; Zhao et al., 2016; Li et al., 2017a), and previous SIMS U-Pb zircon geochronol-ogy showed the only evidence of inheritance (Li et al., 2017a). The minimum emplacement age of the aplite is estimated as 16.126 ± 0.077 Ma (including all sources of uncertainty, e.g., analytical uncertainty /+tracer calibration /+decay constant uncertainties) based on a Re-Os molybdenite date from an A-type quartz vein-hosted by the aplite (sample 313-145, dis-cussed below). Given the emplacement age of the P porphyry is 16.009 ± 0.024 Ma (with all uncertainties), the aplite pre-dates the P porphyry and is at least 0.117 ± 0.081 m.y. older.
For molybdenite Re-Os dates, given the similar morphol-ogy of molybdenite grains and alteration assemblages within a vein (e.g., Fig. 4), we assume that molybdenite grains in each vein formed at the same time. This assumption, in part, has been supported by the fact that model ages of multiple analy-ses of each vein (except 1605-33) overlap within uncertainty. For veins with multiple analyses, when the MSWD is accept-able for the number of analyses (Wendt and Carl, 1991), the weighted means are interpreted as molybdenite crystalliza-tion ages. By inference, e.g., close spatial association between molybdenite and the gangue minerals, quartz-bearing fluid inclusions with opaque minerals (Li et al., 2017a), we suggest that molybdenite crystallized at the same time as the gangue minerals, and therefore can be used to represent the vein-for-mation ages. For three veins with one analysis, given the con-fidence of data reproducibility from multiple analyses of the single vein, the model ages were interpreted as vein formation ages. However, an exception is sample 1605-33, which gives a MSWD of 5 (Fig. 8) and is interpreted to reflect the presence of multiple generations of molybdenite, which nonetheless are not recognized petrographically. As such, the mean calcu-lated from the youngest two analyses is interpreted as the best estimated formation age of that vein.
The Re-Os ages of this study overlap with the majority of the dates from previous studies within uncertainties (Fig. 2B). However, the Re-Os dates of this study are considerably more precise (~0.1%; Fig. 7B) and suggest that the majority of the mineralization occurred between 16.126 ± 0.008/0.060/0.077 and 15.860 ± 0.010/0.058/0.075 Ma with a duration of ~ 266 ± 13 k.y. This duration is a minimum estimate as there is no geologic evidence to exclude the presence of mineralization beyond this interval, and observations at Qulong suggest that Cu mineralization as a whole is earlier than the Mo ore. How-ever, we consider that this duration is reasonable as it has been independently shown that, with an average magma flux (pluton filling rate) of 0.01 km3/yr, a few tens of million tons of Cu, comparable to the amount of Cu at Qulong, can be accu-mulated within 200 to 300 k.y. (Chelle-Michou et al., 2017).
The Re-Os dates from previous studies (Fig. 2B; App. Table A2) have appreciable uncertainties of 1.3 to 12.1%,

1434 LI ET AL.
which we attribute to analytical challenges associated with initial Re-Os studies, e.g., imprecise determinations of the stoichiometry of Os salts used for tracer calibration (Yin et al., 2001), poor external reproducibility of ICP-MS anal-ysis (Stein, 2014) potentially caused by memory effects of Os and unstabilized ion signal in the long term, and poten-tial bias between laboratories (e.g., tracer calibration, data reduction). Given dates of the RM8599 reference materi-als measured during the course of study agree with the rec-ommended value (Fig. 6C), and the agreement between molybdenite Re-Os and zircon U-Pb chronometers from a preliminary cross-calibration (Selby et al., 2007) with the same Re-Os tracer used in this study, we suggest that, to the best of our knowledge and analytical effort, the molybdenite Re-Os ages from this study are the best estimates of molyb-denite crystallization ages at Qulong. For future molybde-nite Re-Os geochronology study, we reiterate that measuring and reporting the age values of RM8599 reference materi-als is essential, coupled with the analysis of a suitable-sized aliquant of a mineral separate (e.g., Stein et al., 2003; Selby and Creaser, 2004), and employing the multiple-analysis from a single vein approach proposed here.
Integrating magmatic and hydrothermal timescalesAt Qulong, field observations demonstrate a relatively close spatial association (Fig. 1D, E) between the P porphyry and high-grade Cu ore (Zheng et al., 2004; Yang et al., 2009). In addition, the aplite and X porphyry are very small in size and are only distributed discontinuously. Further, there is no other porphyry stock within 2 km, as demonstrated by exten-sive drilling. Therefore, the P porphyry is regarded as the only observed porphyry stock that can act as a conduit (Yang et al., 2009; Hu et al., 2015; Zhao et al., 2016; Li et al., 2017a). However, this scenario has not been tested due to a lack of crosscutting relationships at the deposit level. Testing of this scenario could be done by dating the P porphyry and miner-alization at Qulong with high accuracy and precision, and the null hypothesis is that the porphyry stock is expected to be older than the mineralization.
With respect to the emplacement age of the P porphyry as 16.009 ± 0.024 Ma (with all uncertainties at the 2σ level; Fig. 7), 13 of the 16 published molybdenite Re-Os ages overlap with this emplacement age, while the remaining three are older (including all sources of uncertainty, e.g., analytical uncertainty /+tracer calibration /+decay constant uncertain-ties). The three Re-Os dates that are older than the P por-phyry agree with the field observations that all mineralization at Qulong postdates the Rongmucuola pluton and predates the quartz diorite (Fig. 2A). For our molybdenite Re-Os dates, only sample 313-145, which is hosted by the aplite, is 0.117 ± 0.081 m.y. older than the P porphyry, with another 11 samples that overlap within uncertainties, and the remaining sample that is nominally younger (Fig. 8).
Excluding analytical issues, the presence of Re-Os dates from this study that predate the P porphyry implies that mineralization did occur before the emplacement of the P porphyry. As mentioned above, the aplite is unlikely to be a conduit given its exceptionally small volume (with a width of 0.05–2 m) and discontinuous distribution. Together with the absence of other documented/observed porphyry stocks that
predate the P porphyry, the most likely scenario is that the P porphyry is an intermineral porphyry stock and potentially a part of the mineralization (e.g., the one yielding ages that pre-date the P porphyry) was deposited before the emplacement of the P porphyry. This scenario is arguably supported by the observation that the highest grade of Mo ore does not occur within the P porphyry (Fig. 1E; Yang et al., 2009), as inter-mineral porphyry stocks commonly result in low-grade cores in porphyry deposits (Sillitoe, 2000). The decoupling between shallow magmatism and volatile transportation thus makes it unlikely that all metals were transported by the P porphyry stock at Qulong. However, we reiterate that such a scenario is the most plausible one, based on the available data. Fur-ther detailed mapping (crosscutting relationships, alteration) could confirm this hypothesis.
Cyclical mineralization pulses and their timescalesThe veins in each mineralization pulse of porphyry copper deposits are classified as A, B, and D veins (Fig. 3). The tem-poral succession of these veins records a progressive change in the fluid nature, e.g., temperature, pH, and/or oxygen fugacity, and is widely used to trace fluid evolution processes (Gustafson and Hunt, 1975; Sillitoe, 2010; Cooke et al., 2014). Given that the timescale of hydrothermal activity that can be sustained by a single magmatic episode is limited to several tens of k.y. (Cathles et al., 1997; Weis et al., 2012; Chelle-Michou et al., 2015; Mercer et al., 2015; Buret et al., 2016; Tapster et al., 2016), porphyry deposits that show prolonged duration (e.g., several m.y.; Chiaradia et al., 2014) clearly imply multiple mineralization pulses, as supported by the presence of repetitive A-B-D veins from field observations and high-precision dating (Sillitoe, 2010; Stein, 2014; Spencer et al., 2015). However, it is still not clear whether multiple mineralization pulses are only present in some deposits with prolonged duration, or if they are common in porphyry cop-per deposits in general. Also questionable is the role of mul-tiple pulses for the formation of economic deposits.
Our geochronological data suggest that the mineralization process at Qulong was likely discontinuous during the 266 ± 13 k.y. interval (Fig. 8), and characterized by the presence of at least two A-B-D cycles and one incomplete (B-D) cycle. Our Re-Os data constrain the lifetime of the two short-lived A-B-D cycles to 38 ± 11 and 59 ± 10 k.y. with a gap of 48 ± 10 k.y. between them. The timescales of mineralization cycles constrained here (tens of k.y.) by direct dating of ore minerals are comparable with those recently proposed through high-precision dating (Chelle-Michou et al., 2015; Buret et al., 2016; Tapster et al., 2016), titanium diffusion in quartz (Mer-cer et al., 2015) and numerical modeling (Weis et al., 2012; Chelle-Michou et al., 2017). However, we are aware that although the sample set used here covers the entire hydro-thermal fluid evolution path at Qulong (Li et al., 2017a), it is impossible to argue that all stages of mineralization phases have been sampled. In addition, even though this study argu-ably presents the most detailed Re-Os geochronology study for a single porphyry Cu-Mo deposit so far, it is very likely that it is still undersampled. To summarize, we propose that according to the current study it is likely that the metals at Qulong system were deposited via a cyclic process, but uncer-tainties remain.

GEOCHRONOLOGY CONSTRAINTS ON THE TIBETAN QULONG PORPHYRY Cu-Mo DEPOSIT 1435
Rapid cooling during mineralizationAlthough the A, B, and D veins in porphyry copper depos-its record the evolution paths of ore-forming fluids (Sillitoe, 2010; Cooke et al., 2014), in most cases the relative chronology of vein types cannot be confidently correlated at the deposit scale due to a lack of deposit-wide crosscutting relationships. Here, we explore the possibility of coupling high-precision molybdenite Re-Os and quartz fluid inclusion data to recon-struct the cooling paths of the Qulong porphyry system.
Correlating the Re-Os dates in this study and fluid inclu-sion data (Li et al., 2017a) suggests that the entire hydrother-mal system cooled from 425° to 280°C within 266 ± 13 k.y. (r2 = 0.797; Fig. 9). This suggests that the Qulong porphyry system as a whole cooled over the period of ore formation with a cooling rate of 0.55° ± 0.11°C/k.y. In addition to the long-term cooling trend, the cooling rates of the two com-plete A-B-D cycles are 1.19 ± 0.82 and 1.27 ± 0.53°C/k.y., respectively (Fig. 9). A potential concern is an underestima-tion of the duration caused by the undersampling of Re-Os dates, as discussed above, by which the cooling rates could be overestimated. However, we argue that if undersampling is indeed an issue, it is unlikely that the duration will sig-nificantly increase given the number and nature (vein type, characteristics of ore related fluid inclusions) of sample set we studied, and the agreement of durations constrained in this study and other independent estimates (see above for detailed discussion). As such, we suggest that the estimated cooling rates here, within uncertainties, are reasonable for Qulong. The cooling speed estimated here suggests a much faster rate than that (0.2°C/kyr) established from thermo-chronology (Zhao et al., 2016). Although the cooling trend of the first mineralization cycle overlaps with that of the long-term cooling rate within uncertainties, the cooling rates of both cycles are much faster than the long-term cooling rate of the Qulong porphyry system. To the best of our knowl-edge, the cooling rates presented in this study (between 0.55 and 1.27°C/k.y.) are faster than the majority (with the excep-tion of Grasberg) of the reported cooling rates (McInnes and
Evans, 2005; McInnes et al., 2005) with the highest tempo-ral resolution (<1‰ level).
The cooling process of a hydrothermal system is balanced between heat gain (e.g., magmatism injection and volatile fluxing associated with heat from depth) and heat loss (e.g., conduction to wall rocks, cooling by the circulation of mete-oric water; Cathles et al., 1997; Weis et al., 2012). At Qulong, the known thermal contributors are the Rongmucuola pluton, aplite, P porphyry, X porphyry, quartz diorite, and exsolved volatile, with heat loss controlled by cooling via conduction. The Rongmucuola pluton, which hosts the majority of the ore at Qulong, is ~1 m.y. older than the P porphyry (Fig. 5). Heat loss modeling predicts that a 40-km-wide, 2-km-thick sill intruded between 16 to 18 km depth can only sustain a maxi-mum hydrothermal discharge >200°C for 0.8 m.y., and this duration decreases to 1 k.y. for systems at shallower depths (<3–5 km; Cathles et al., 1997). Given the much smaller size (<200 m in diam vs 40 km wide and 2 km thick) and much shallower (potentially ~3 km, as inferred from a fluid inclu-sion study by Li et al. [2017a] vs. 16 to 18 km) emplace-ment depth of the Rongmucuola pluton, we conclude that the Rongmucuola pluton was cooled to <200°C before the emplacement of the P porphyry. As the volumes of the aplite and X porphyry are small, they would have had limited ther-mal contribution during ore formation as an intrusion with similar size can only sustain a thermal anomaly for less than a few k.y., as indicated by quartz titanium diffusion and heat loss models (Cathles et al., 1997; Mercer et al., 2015). As a result, the only possible main thermal contributors are the P porphyry and exsolved volatile, although we cannot con-fidently exclude possible contributions from unexposed and unidentified intrusions. With the assumption that the crystal-lization/cooling process of the P porphyry lasted for less than tens of k.y., according to thermal simulation and diffusion modeling (Cathles et al., 1997; Mercer et al., 2015), the ~266 ± 13 k.y. thermal anomaly accompanying the mineralization process needed heat sources external to the contribution from the P porphyry itself. Therefore, we suggest that a periodic magmatic-hydrothermal fertilization process, e.g., an episodic hydrothermal fluid release during the incremental building of the source pluton where the metals and magmatic fluids were derived, provided the additional thermal contribution that maintained the mineralization process.
The thermal anomalies and faster cooling process discussed above require a mechanism to explain the rapid heat removal. However, an increase of heat loss through conduction is unlikely, and we suggest that the most reasonable scenario is rapid thermal removal via the meteoric water circulation model (Weis et al., 2012; Fekete et al., 2016). A simple calcula-tion suggests that 10 to 25 vol % meteoric water (~100°C after heating) mixing with 90 to 75 vol % magmatic water is enough to cool the hot (>500°C) magmatic fluid to the temperatures recorded by ore-related fluid inclusions (425°–280°C). If this is the case, depleted oxygen isotope composition is expected for the ore-forming fluid at Qulong, which has been demon-strated by our unpublished data and is the object for future study.
Given each mineralization cycle will bring additional heat to the cooling porphyry system, the rapid and periodic cool-ing process discussed above predicts resetting of thermal
o 20.55 ± 0.11 C/kyr (r = 0.797)
o1.27 ± 0.53 C/kyr
o1.19 ± 0.82 C/kyr
A veinB veinD vein
250
300
350
400
450
15.8515.9516.0516.15Age (Ma)
oTe
mpe
ratu
re (
C) + +
+
+
+samples with depths >211 m
Fig. 9. Cooling history of Qulong porphyry Cu-Mo system during ore forma-tion, with vein-formation ages and temperatures constrained by molybdenite Re-Os dating in this study and fluid inclusion data of Li et al. (2017b). The uncertainties of formation temperatures are shown as ± 10 oC (1σ), while the uncertainties of Re-Os dates are smaller than the width of the symbol.

1436 LI ET AL.
chronometers of earlier mineralization cycles by later miner-alization cycles. This prediction is supported by the identical Ar-Ar ages of the earlier potassic stage biotite and later phyllic stage sericite and the significant scatter of zircon U-Th-He systematics (Zhao et al., 2016), although the uncertainties of these dates do not permit a robust evaluation for the time-frame of these events (e.g., timeframe of formation and cool-ing history).
Formation of the world-class Qulong Cu-Mo depositThe detailed high-precision zircon U-Pb and molybdenite Re-Os geochronology presented here allows us to propose a model for the formation of the world-class Qulong porphyry Cu-Mo deposit (Fig. 10).
At ~17 Ma, magma generated in the lower crust was emplaced into the upper crust (the emplacement of the Rong-mucuola pluton and the aplite), and was potentially associ-ated with minor mineralization (Fig. 10A). Due to a lack of porphyry stock at this time, the potential conduit transporting magma and volatile to shallow mineralization level is the N-S–trending fault. The meteoric water could circulate downward into the system through the fault system.
After the emplacement of the Rongmucuola pluton and aplite, a temporary cessation of magmatism is observed at shallow levels. At ~16 Ma, potentially triggered by a magma injection event, the magma and metal-bearing fluid rose to the shallow crustal levels periodically, as indicated by the forma-tion of mineralization, and the P and X porphyries (Fig. 10B). The formation of these intermineral porphyry stocks may have remobilized and/or destroyed the earlier mineralization,
and resulted in a relatively low Mo grade core within the P porphyry. Episodic volatile releasing events are potentially the trigger of the mechanical failure of the cupola and the upper crust, as evidenced by the formation of two stages of breccia (Fig. 10C). Hydrothermal fluids associated with the breccia pipe caused further alteration and mineralization assemblages, and may have also remobilized and/or destroyed a portion of earlier stage mineralization. The system is ther-mally balanced by heat input from the magmatism and vola-tiles release events, and heat removal by conduction to wall rock and meteoric water circulation and mixing.
After ~15.860 Ma, the system underwent a further quiet period until ~15.2 Ma. Most likely initiated by injection of new magma that caused thermal rejuvenation, the quartz dio-rite was formed, which marks the cessation of Miocene mag-matism at Qulong (Fig. 10D). Minor amounts of magmatic fluid associated with the emplacement of the quartz diorite, plus the circulation of meteoric water, caused further altera-tion as represented by the low temperature alteration in the quartz diorite.
Implications for Porphyry Copper System GenesisRadioisotopic dating is widely applied to constrain the time-scales of porphyry copper deposit formation, and gives vari-able timescales from tens of k.y. to several m.y. (Chiaradia et al., 2014). Given the timescale is a primary feature of the systems studied, which should be an independent param-eter regardless of the dating methods used, the strong posi-tive relationship between analytical precision and the quoted duration is not expected (Fig. 11). Therefore, this relationship
A) ~17 Ma, Magma generated at the lower crust emplaced into the upper crust as represented by the emplacement of the Rongmucuola pluton and the aplite. Potential mineralization could be formed at this stage, in which case the N-S fault is a conduit for the transportation of magmatism and hydrothermal fluid. The meteoric water also can circulate downward through the fault system.
D) After ~15.860 Ma, the system experienced a relatively quiet period until 15.2 Ma when a thermal rejuvenation was initiated by a magma injection event, as represented by the quartz diorite. The minor fluid caused low temperature alteration to the quartz diorite without further mineralization.
fault
D)
++
+ + + + ++
+
C)
++
++ + + + +
++
B)
++
++ + + + + + + + + +
++
A)
++
++ + + + + + + + + +
++Rongmucuola pluton
Jurassic country rock
magma and fluidinput from magmachamber
magma from depth
apliteP porphyryX porphyry
breccia pipe quartz diorite
mineralization
current surface
+ ++ ++
uppe
r cru
stlo
wer
cru
st
C) Following this was the mechanical failure of the cupola and the crust in the upper crust, as represented by the formation of the breccia pipe.
B) ~16 Ma, Potentially accompanied with new magma injection events, metals bearing fluid periodically rose up via the fault and caused intensive alteration and mineralization. The P porphyry was emplaced at this time, and was followed by the formation of the X porphyry. The P porphyry and the fault were the main conduits. As an inter-mineral porphyry stock, P porphyry potentially remobilzed/distroyed the existed mineralization and formed the low Mo grade core. The system is thermally balanced by heat input from magmatism and volatile release, and heat removal through conduction and meteoric water circulation.
meteoric water
Fig. 10. Cartoon shows the genetic model of the Qulong porphyry Cu-Mo deposit. See Figure and text for detailed information.

GEOCHRONOLOGY CONSTRAINTS ON THE TIBETAN QULONG PORPHYRY Cu-Mo DEPOSIT 1437
(Fig. 11) suggests that at least some of the prolonged dura-tions proposed for porphyry systems are artefacts of over-interpreting low-precision dates without evaluation of their accuracy. Recent simulation studies suggest that the duration of ore formation is potentially one of the controlling factors for the formation of giant deposits (Chelle-Michou et al., 2017; Chiaradia and Caricchi, 2017). However, it is obvious that such a “long” duration (e.g., tens to hundreds of k.y.) is still beyond the precision of microbeam analysis (Chiaradia et al., 2014). Consequently, we reiterate that high-precision geochronology is essential for resolving the magmatic-miner-alization timescales of porphyry copper systems at the tens of k.y. level.
The genetic model of porphyry copper deposits suggests that the porphyry stocks are the conduits conveying metal-bearing volatile from the lower crustal magma chamber to shallow mineralization levels (Sillitoe, 2010; Richards, 2011; Cooke et al., 2014). However, in most cases this scenario is very difficult to test for crosscutting relationships for two reasons. First, the porphyry stock is exceptionally small compared to the size of the deposit (Sillitoe, 2010; Richards, 2011; Cooke et al., 2014), such that the crosscutting relationships between the porphyry stock and mineralization phases only occur in a very limited space, e.g., surrounding the porphyry stock. Sec-ondly, if there are mineralization phases before the emplace-ment of the porphyry stock, they will likely be overprinted/remobilized/destroyed by the emplacement of the porphyry stock where the potential crosscutting relationships would be located. Therefore, the best approach to test this hypothesis is via high-precision dating, and our high-precision dating at Qulong arguably suggests that it is possible to transport metal-bearing volatiles without the presence of a contemporaneous porphyry stock. This scenario has been supported by obser-vations at modern volcanoes, whereby degassing can occur before or without magma eruption at the surface (Shinohara, 2008). If this finding is correct, it further suggests that the absence of a contemporaneous porphyry stock does not indi-cate that the mineralization is not a porphyry-style deposit, which has broad implications for deposit type clarification and
mineral exploration. In addition, the presence of mineraliza-tion before the emplacement of a porphyry stock or even the absence of porphyry stocks imply that dating porphyry stocks does not necessarily bracket the entire porphyry ore forma-tion process. In this case, dating the mineralization directly is critical to yield a comprehensive understanding of the times-cale of ore formation (Stein, 2014).
The cyclic mineralization process inferred by our Re-Os dates suggests that the periodic mineralization process also operates for deposits with a short duration (e.g., hundreds of k.y. overall duration), which is the same as what has been observed in porphyry systems with prolonged (m.y. level) duration (Stein, 2014; Zimmerman et al., 2014; Spencer et al., 2015). A cyclic magmatic process in porphyry Cu deposits is ubiquitously recorded in many magmatic minerals, e.g., zoning/resorption textures of plagioclase, quartz, and zircon (Mercer et al., 2015; Buret et al., 2016; Tapster et al., 2016; Williamson et al., 2016). By inference, we suggest that the periodic magmatic-hydrothermal processes during ore forma-tion proposed here are common in porphyry copper deposits and are linked with the episodic magmatic process occurring at depth within the source pluton. The significance of this cyclic process is that each mineralization pulse can enhance the economic resource in a geologically focused area. As such, the cyclic process presented here potentially is one of the con-tributing factors to form giant deposits, and is the key to dif-ferentiate economic and subeconomic deposits. However, it is not clear yet what fundamentally controls this cyclic process, although the periodic refertilization of volatiles linked with source pluton evolution might be critical (Williamson et al., 2016).
The cyclic cooling process proposed here, together with the potential thermal resetting of the U-Th-He and Ar-Ar chronometers, should be considered in future cooling history studies of porphyry copper systems. In addition, the rapid cooling (0.55°–1.27°C/k.y.) and the periodic volatile recharge process proposed here suggests that external fluid potentially is a critical cooling agent, as recently proposed by numerical modeling and isotopic study of porphyry deposits (Weis et al., 2012; Fekete et al., 2016).
A final note concerns the uncertainties when comparing Re-Os dates from different laboratories and with U-Pb and other chronometers. Reporting the measured values of the RM8599 is a must to evaluate the (relative) accuracy of the Re-Os dates (Stein, 2014) and, also, the analysis of a suitable-sized aliquant from a mineral separate is of primary impor-tance (Stein et al., 2003; Selby and Creaser, 2004). Currently, the decay constant uncertainties (238U and 187Re) are the main source of uncertainties when comparing Re-Os and U-Pb sys-tems. In addition, the interlaboratory agreement of Re-Os sys-tems has only been demonstrated between a few laboratories (Markey et al., 2007), so direct comparison of dates beyond these laboratories potentially involves an unaccounted bias. Given that significant progress has been achieved for the pre-cision and accuracy of the zircon U-Pb chronometer in the past 10 years via the community-driven EARTHTIME initia-tive (Condon et al., 2015; McLean et al., 2015), and that the analytical precision of molybdenite Re-Os system is down to 1‰, it is now an appropriate time to start a further evaluation between the molybdenite Re-Os and zircon U-Pb systems
r² = 0.6031
0
1
2
3
4
5
6
Dur
atio
n in
m.y
.
Precision in m.y.0 0.5 1 2 2.51.5
Qulong
Fig. 11. Analytical precision used in porphyry copper deposit studies and inferred timescales exhibiting a positive relationship. Data is from Chiaradia et al. (2014). See text for discussion.

1438 LI ET AL.
(Selby et al., 2007), as suggested by Chiaradia et al. (2014). Following the example of the U-Pb community, shared tracer/reference solutions and transparent data reduction platform should be adopted in the Re-Os community with the aim of standardizing the Re-Os chronometer, reducing the potential bias between laboratories, and ultimately improving the accu-racy. Once achieved, data from all laboratories can be inte-grated without loss of resolution (due to interlaboratory bias) and will enable better utilization of data from the literature.
AcknowledgmentsYL thanks Prof. Xian-Hua Li for his continuing support and supervision, and acknowledges Richard Sillitoe and Jeremy Richards for generously sharing their expertise in ore-forming process and guidance regarding the clarification of veinlets. Access to Qulong is only possible with assistance from You-Ye Zheng, Guang-Wu Jiang, Jian-Wei Li, Zhi-Ming Yang, and Ke-Zhang Qin. Rui Wang and Jia Chang are acknowledged for support in the field. YL was financially funded by DU and CSC, with grant-in-aid from SEG, IAGC, GSL, UCCL, and University College of Durham. A NERC facility grant awarded to DS and YL funded the U-Pb study. DS acknowl-edges the Total Endowment Fund. An early version of the paper benefited from the comments from Derek Vance and an anonymous reviewer. Constructive suggestions from Cyril Chelle-Michou and an anonymous reviewer, plus comments from editors Massimo Chiaradia and Larry Meinert, greatly improved the quality of this final version.
REFERENCESBirck, J.L., RoyBarman, M., and Capmas, F., 1997, Re-Os isotopic measure-
ments at the femtomole level in natural samples: Geostandard Newsletter no. 21, p. 19–27.
Bowring, J., McLean, N.M., and Bowring, S., 2011, Engineering cyber infra-structure for U-Pb geochronology: Tripoli and U-Pb_Redux. Geochemistry, Geophysics, Geosystems, v. 12, p. 1–19, doi:10.1029/2010GC003479.
Buret, Y., von Quadt, A., Heinrich, C., Selby, D., Walle, M., and Peytcheva, I., 2016, From a long-lived upper-crustal magma chamber to rapid porphyry copper-emplacement: Reading the geochemistry of zircon crystals at Bajo de la Alumbrera (NW Argentina): Earth and Planetary Science Letters, v. 450, p. 120–131.
Burnham, A.D., and Berry, A.J., 2012, An experimental study of trace ele-ment partitioning between zircon and melt as a function of oxygen fugacity: Geochimica et Cosmochimica Acta, v. 95, p. 196–212.
Cathles, L.M., 1977, An analysis of the cooling of intrusives by ground-water convection which includes boiling: Economic Geology, v. 72, p. 804–826.
Cathles, L.M., Erendi, A.H.J., and Barrie, T., 1997, How long can a hydro-thermal system be sustained by a single intrusive event? Economic Geol-ogy, v. 92, p. 766–771.
Chelle-Michou, C., Chiaradia, M., Ovtcharova, M., Ulianov, A., and Wotzlaw, J.F., 2014, Zircon petrochronology reveals the temporal link between por-phyry systems and the magmatic evolution of their hidden plutonic roots (the Eocene Coroccohuayco deposit, Peru): Lithos, v. 198, p. 129–140.
Chelle-Michou, C., Chiaradia, M., Selby, D., Ovtcharova, M., and Spik-ings, R.A., 2015, High-resolution geochronology of the Coroccohuayco porphyry-skarn deposit, Peru: A rapid product of the Incaic orogeny: Eco-nomic Geology, v. 110, p. 423–443.
Chelle-Michou, C., Rottier, B., Caricchi, L., and Simpson, G., 2017, Tempo of magma degassing and the genesis of porphyry copper deposits: Scientific Reports 7, article no. 40566.
Cheng, H., Edwards, R.L., Hoff, J., Gallup, C.D., Richards, D.A., and Asmerom, Y., 2000, The half-lives of uranium-234 and thorium-230: Chem-ical Geology, v. 169, p. 17–33.
Chiaradia, M., and Caricchi, L., 2017, Stochastic modelling of deep mag-matic controls on porphyry copper deposit endowment: Scientific Reports 7, article no. 44523.
Chiaradia, M., Schaltegger, U., and Spikings, R., 2014, Time scales of mineral systems—advances in understanding over the past decade: Society of Eco-nomic Geologists, Special Publication 18, p. 37–58.
Cohen, A.S., and Waters, F.G., 1996, Separation of osmium from geological materials by solvent extraction for analysis by thermal ionisation mass spec-trometry: Analytica Chimica Acta, v. 332, p. 269–275.
Condon, D.J., Schoene, B., McLean, N.M., Bowring, S.A., and Parrish, R.R., 2015, Metrology and traceability of U-Pb isotope dilution geochronology (EARTHTIME Tracer Calibration Part I): Geochimica et Cosmochimica Acta, v. 164, p. 464–480.
Cooke, D.R., Hollings, P., Wilkinson, J.J., and Tosdal, R.M., 2014, 13.14—Geochemistry of porphyry deposits, in Turekian, H.D.H.K., ed., Treatise on Geochemistry (second edition): Oxford, Elsevier, p. 357–381.
Creaser, R.A., Papanastassiou, D.A., and Wasserburg, G.J., 1991, Negative thermal ion mass-spectrometry of osmium, rhenium, and iridium: Geochi-mica et Cosmochimica Acta, v. 55, p. 397–401.
Deckart, K., Clark, A.H., Cuadra, P., and Fanning, M., 2012, Refinement of the time-space evolution of the giant Mio-Pliocene Río Blanco-Los Bronces porphyry Cu-Mo cluster, central Chile: new U-Pb (SHRIMP II) and Re-Os geochronology and 40Ar/39Ar thermochronology data: Mineralium Depos-ita, v. 48, p. 57–79.
Fekete, S., Weis, P., Driesner, T., Bouvier, A.S., Baumgartner, L., and Hein-rich, C.A., 2016, Contrasting hydrological processes of meteoric water incursion during magmatic-hydrothermal ore deposition: An oxygen iso-tope study by ion microprobe: Earth and Planetary Science Letters, v. 451, p. 263–271.
Gerstenberger, H., and Haase, G., 1997, A highly effective emitter substance for mass spectrometric Pb isotope ratio determinations: Chemical Geology, v. 136, p. 309–312.
Gramlich, J.W., Murphy, T.J., Garner, E.L., and Shields, W.R., 1973, Absolute isotopic abundance ratio and atomic weight of a reference sample of rhe-nium: Journal of Research of the National Bureau of Standards-A. Physics Ch A 77, p. 691–698.
Gustafson, L.B., and Hunt, J.P., 1975, The porphyry copper deposit at El Salvador, Chile: Economic Geology, v. 70, p. 857–912.
Hiess, J., Condon, D.J., McLean, N., and Noble, S.R., 2012, 238U/235U System-atics in terrestrial uranium-bearing minerals: Science, v. 335, p. 1610–1614.
Hou, Z.Q., Gao, Y.F., Qu, X.M., Rui, Z.Y., and Mo, X.X., 2004, Origin of adakitic intrusives generated during mid-Miocene east-west extension in southern Tibet: Earth and Planetary Science Letters, v. 220, p. 139–155.
Hou, Z.Q., Yang, Z.M., Qu, X.M., Meng, X.J., Li, Z.Q., Beaudoin, G., Rui, Z.Y., Gao, Y.F., and Zaw, K., 2009, The Miocene Gangdese porphyry copper belt generated during post-collisional extension in the Tibetan orogen: Ore Geology Reviews, v. 36, p. 25–51.
Hu, Y.B., Liu, J.Q., Ling, M.X., Ding, W., Liu, Y., Zartman, R.E., Ma, X.F., Liu, D.Y., Zhang, C.C., Sun, S.J., Zhang, L.P., Wu, K., and Sun, W.D., 2015, The formation of Qulong adakites and their relationship with porphyry cop-per deposit: Geochemical constraints: Lithos, v. 220, p. 60–80.
Jaffey, A.H., Flynn, K.F., Glendenin, L.E., Bentley, W.C., and Essling, A.M., 1971, Precision measurement of half-lives and specific activities of 235U and 238U: Physical Review, C 4, p. 1889–1906.
Klötzli, U., Klötzli, E., Günes, Z., and Kosler, J., 2009, Accuracy of laser abla-tion U-Pb zircon dating: Results from a test using five different reference zircons: Geostandards and Geoanalytical Research, v. 33, p. 5–15.
Krogh, T., 1973, A low-contamination method for hydrothermal decomposi-tion of zircon and extraction of U and Pb for isotopic age determinations: Geochimica et Cosmochimica Acta, v. 37, p. 485–494.
Lawley, C.J.M., and Selby, D., 2012, Re-Os geochronology of quartz-enclosed ultrafine molybdenite: Implications for ore geochronology: Economic Geology, v. 107, p. 1499–1505.
Li, G.-M., and Rui, Z.-Y., 2004, Diagenetic and mineralization ages for the porphyry copper deposits in the Gangdise metallogenic belt, Southern Xizang: Geotectonica et Metallogenia, v. 28, p. 165–170 (in Chinese with English abstract).
Li, X.H., Liu, X.M., Liu, Y.S., Su, L., Sun, W.D., Huang, H.Q., and Yi, K., 2015, Accuracy of LA-ICPMS zircon U-Pb age determination: An inter-laboratory comparison: Science China Earth Sciences, v. 58, v. 1722–1730.
Li, Y., Selby, D., Feely, M., Costanzo, A., and Li, X.-H., 2017a, Fluid inclu-sion characteristics and molybdenite Re-Os geochronology of the Qulong porphyry copper-molybdenum deposit, Tibet: Mineralium Deposita, v. 52, p. 137–158.
Li, Y., Li, J.W., Li, X.H., Selby, D., Huang, G.H., Chen, L.J., and Zheng, K., 2017b, An Early Cretaceous carbonate replacement origin for the Xinqiao

GEOCHRONOLOGY CONSTRAINTS ON THE TIBETAN QULONG PORPHYRY Cu-Mo DEPOSIT 1439
stratabound massive sulfide deposit, Middle-Lower Yangtze metallogenic belt, China: Ore Geology Reviews, v. 80, p. 985–1003.
Luo, Y., and Ayers, J.C., 2009, Experimental measurements of zircon/melt trace-element partition coefficients: Geochimica et Cosmochimica Acta, v. 73, p. 3656–3679.
Markey, R., Stein, H.J., Hannah, J.L., Zimmerman, A., Selby, D., and Creaser, R.A., 2007, Standardizing Re-Os geochronology: A new molybdenite refer-ence material (Henderson, USA) and the stoichiometry of Os salts: Chemi-cal Geology, v. 244, p. 74–87.
Matthews, A., and Riley, J., 1970, The determination of rhenium in sea water: Analytica Chimica Acta, v. 51, p. 483–488.
Mattinson, J.M., 2005, Zircon U-Pb chemical abrasion (“CA-TIMS”) method: Combined annealing and multi-step partial dissolution analysis for improved precision and accuracy of zircon ages: Chemical Geology, v. 220, p. 47–66.
McInnes, B.I.A., and Evans, N.J., 2005, Application of thermochronology to hydrothermal ore deposits. Low-temperature thermochronology: Reviews in Mineralogy & Geochemistry, v. 58, p. 467–498.
McInnes, B.I., Evans, N.J., Fu, F., Garwin, S., Belousova, E., Griffin, W., Bertens, A., Sukarna, D., Permanadewi, S., and Andrew, R., 2005, Ther-mal history analysis of selected Chilean, Indonesian, and Iranian porphyry Cu-Mo-Au deposits, in Porter, T.M., ed., Super porphyry copper and gold deposits: A global perspective: Adelaide, Australia, Porter Geoconsultancy Publishing, p. 27–42.
McLean, N.M., Bowring, J.F., and Bowring, S.A., 2011, An algorithm for U-Pb isotope dilution data reduction and uncertainty propagation: Geo-chemistry Geophysics Geosystems 12, doi: 10.1029/2010GC003478.
McLean, N.M., Condon, D.J., Schoene, B., and Bowring, S.A., 2015, Evalu-ating uncertainties in the calibration of isotopic reference materials and multi-element isotopic tracers (EARTHTIME Tracer Calibration Part II): Geochimica et Cosmochimica Acta, v. 164, p. 481–501.
Mercer, C.N., Reed, M.H., and Mercer, C.M., 2015, Time scales of porphyry Cu deposit formation: Insights from titanium diffusion in quartz: Economic Geology, v. 110, p. 587–602.
Morgan, J.W., Golightly, D.W., and Dorrzapf, A.F., 1991, Methods for the separation of rhenium, osmium and molybdenum applicable to isotope geo-chemistry: Talanta, v. 38, p. 259–265.
Nier, A.O., 1950, A redetermination of the relative abundances of the iso-topes of carbon, nitrogen, oxygen, argon, and potassium: Physical Review, v. 77, p. 789.
Richards, J.P., 2011, Magmatic to hydrothermal metal fluxes in convergent and collided margins: Ore Geology Reviews, v. 40, p. 1–26.
——2015, Tectonic, magmatic, and metallogenic evolution of the Tethyan orogen: From subduction to collision: Ore Geology Reviews, v. 70, p. 323–345.
Roy-Barman, M., 1993, Mesure du rapport 187Os-186Os dans les basaltes et les péridotites: contribution à la systématique 187Re-187Os dans le manteau: Ph.D thesis, Université Paris Diderot (Paris 7), 268 p.
Rubatto, D., and Hermann, J., 2007, Experimental zircon/melt and zircon/garnet trace element partitioning and implications for the geochronology of crustal rocks: Chemical Geology, v. 241, p. 38–61.
Schaltegger, U., Schmitt, A.K., and Horstwood, M.S.A., 2015, U-Th-Pb zircon geochronology by ID-TIMS, SIMS, and laser ablation ICP-MS: Recipes, interpretations, and opportunities: Chemical Geology, v. 402, p. 89–110.
Schärer, U., 1984, The effect of initial 230Th disequilibrium on young UPb ages: The Makalu case, Himalaya: Earth and Planetary Science Letters, v. 67, p. 191–204.
Schoene, B., 2014, 4.10—U-Th-Pb Geochronology, in Turekian, H.D.H.K., ed., Treatise on Geochemistry (second edition): Oxford, Elsevier, p. 341–378.
Selby, D., and Creaser, R.A., 2001, Re-Os geochronology and systematics in molybdenite from the Endako porphyry molybdenum deposit, British Columbia, Canada: Economic Geology, v. 96, p. 197–204.
——2004, Macroscale NTIMS and microscale LA-MC-ICP-MS Re-Os iso-topic analysis of molybdenite: Testing spatial restrictions for reliable Re-Os age determinations, and implications for the decoupling of Re and Os within molybdenite: Geochimica et Cosmochimica Acta, v. 68, p. 3897–3908.
Selby, D., Creaser, R.A., Stein, H.J., Markey, R.J., and Hannah, J.L., 2007, Assessment of the 187Re decay constant by cross calibration of Re-Os molybdenite and U-Pb zircon chronometers in magmatic ore systems: Geo-chimica et Cosmochimica Acta, v. 71, p. 1999–2013.
Shen, J.J., Papanastassiou, D.A., and Wasserburg, G.J., 1996, Precise Re-Os determinations and systematics of iron meteorites: Geochimica et Cosmo-chimica Acta, v. 60, p. 2887–2900.
Shinohara, H., 2008, Excess degassing from volcanoes and its role on eruptive and intrusive activity: Reviews of Geophysics, v. 46, doi: 10.1029/2007RG000244.
Shirey, S.B., and Walker, R.J., 1995, Carius tube digestion for low-blank rhe-nium-osmium analysis: Analytical Chemistry, v. 67, p. 2136–2141.
Sillitoe, R.H., 2000, Gold-rich porphyry deposits: Descriptive and genetic models and their role in exploration and discovery: Reviews in Economic Geology, v. 13, p. 315–345.
——2010, Porphyry copper systems: Economic Geology, v. 105, p. 3–41.Sillitoe, R.H., and Mortensen, J.K., 2010, Longevity of porphyry copper for-
mation at Quellaveco, Peru: Economic Geology, v. 105, p. 1157–1162.Smoliar, M.I., Walker, R.J., and Morgan, J.W., 1996, Re-Os ages of group IIA,
IIIA, IVA, and IVB iron meteorites: Science, v. 271, p. 1099–1102.Spencer, E.T., Wilkinson, J.J., Creaser, R.A., and Seguel, J., 2015, The distri-
bution and timing of molybdenite mineralization at the El Teniente Cu-Mo porphyry deposit, Chile: Economic Geology, v. 110, p. 387–421.
Stein, H., Scherstén, A., Hannah, J., and Markey, R., 2003, Subgrain-scale decoupling of Re and 187Os and assessment of laser ablation ICP-MS spot dating in molybdenite: Geochimica et Cosmochimica Acta, v. 67, p. 3673–3686.
Stein, H.J., 2006, Low-rhenium molybdenite by metamorphism in north-ern Sweden: Recognition, genesis, and global implications: Lithos, v. 87, p. 300–327.
——2014, 13.4—Dating and tracing the history of ore formation, in Turekian, H.D.H.K., ed., Treatise on Geochemistry (second edition). Oxford, Else-vier, p. 87–118.
Stein, H.J., Markey, R.J., Morgan, J.W., Hannah, J.L., and Schersten, A., 2001, The remarkable Re-Os chronometer in molybdenite: How and why it works: Terra Nova, v. 13, p. 479–486.
Tapster, S., Condon, D.J., Naden, J., Noble, S.R., Petterson, M.G., Roberts, N.M.W., Saunders, A.D., and Smith, D.J., 2016, Rapid thermal rejuvena-tion of high-crystallinity magma linked to porphyry copper deposit forma-tion; evidence from the Koloula porphyry prospect, Solomon Islands: Earth and Planetary Science Letters, v. 442, p. 206–217.
Völkening, J., Walczyk, T., and Heumann, K.G., 1991, Osmium isotope ratio determinations by negative thermal ionization mass spectrometry: Interna-tional Journal of Mass Spectrometry and Ion Processes, v. 105, p. 147–159.
von Quadt, A., Erni, M., Martinek, K., Moll, M., Peytcheva, I., and Hein-rich, C.A., 2011, Zircon crystallization and the lifetimes of ore-forming magmatic-hydrothermal system: Geology, v. 39, p. 731–734.
Wang, L.-L., Mo, X.-X., B, L., G-C, D., and Zhao, Z.-D., 2006, Geochro-nology and geochemistry of the ore-bearing porphyry in Qulong Cu (Mo) deposit, Tibe: Acta Petrologica Sinica, v. 22, p. 1001–1008 (in Chinese with English abstract).
Wang, R., Richards, J.P., Hou, Z.Q., and Yang, Z.M., 2014, Extent of under-thrusting of the Indian plate beneath Tibet controlled the distribution of Miocene porphyry Cu-Mo ± Au deposits: Mineralium Deposita, v. 49, p. 165–173.
Wang, R., Richards, J.P., Zhou, L.M., Hou, Z.Q., Stern, R.A., Creaser, R.A., and Zhu, J.J., 2015, The role of Indian and Tibetan lithosphere in spatial distribution of Cenozoic magmatism and porphyry Cu-Mo deposits in the Gangdese belt, southern Tibet: Earth-Science Reviews, v. 150, p. 68–94.
Weis, P., 2015, The dynamic interplay between saline fluid flow and rock per-meability in magmatic-hydrothermal systems: Geofluids, v. 15, p. 350–371.
Weis, P., Driesner, T., and Heinrich, C.A., 2012, Porphyry-copper ore shells form at stable pressure-temperature fronts within dynamic fluid plumes: Science, v. 338, p. 1613–1616.
Wendt, I., and Carl, C., 1991, The statistical distribution of the mean squared weighted deviation: Chemical Geology, v. 86, p. 275–285.
Williamson, B.J., Herrington, R.J., and Morris, A., 2016, Porphyry copper enrichment linked to excess aluminium in plagioclase: Nature Geoscience, v. 9, no. 237-U169, doi: 10.1038/ngeo2651.
Xiao, B., Qin, K.Z., Li, G.M., Li, J.X., Xia, D.X., Chen, L., and Zhao, J.X., 2012, Highly oxidized magma and fluid evolution of Miocene Qulong giant porphyry Cu-Mo deposit, southern Tibet, China: Resource Geology, v. 62, p. 4–18.
Yang, Z.M., Hou, Z.Q., White, N.C., Chang, Z.S., Li, Z.Q., and Song, Y.C., 2009, Geology of the post-collisional porphyry copper-molybdenum deposit at Qulong, Tibet: Ore Geology Reviews v. 36, p. 133–159.
Yang, Z.M., Lu, Y.J., Hou, Z.Q., and Chang, Z.S., 2015, High-Mg diorite from Qulong in southern Tibet: Implications for the genesis of adakite-like intru-sions and associated porphyry Cu deposits in collisional orogens: Journal of Petrology, v., 56, p. 227–253.

1440 LI ET AL.
Yin, Q.Z., Jacobsen, S.B., Lee, C.T., McDonough, W.F., Rudnick, R.L., and Horn, I., 2001, A gravimetric K2OsCl6 standard: Application to precise and accurate Os spike calibration: Geochimica et Cosmochimica Acta, v. 65, p. 2113–2127.
Zhang, Z.M., Dong, X., Santosh, M., and Zhao, G.C., 2014, Metamorphism and tectonic evolution of the Lhasa terrane, central Tibet: Gondwana Research, v. 25, p. 170–189.
Zhao, J., Qin, K., Xiao, B., McInnes, B., Li, G., Evans, N., Cao, M., and Li, J., 2016, Thermal history of the giant Qulong Cu-Mo deposit, Gangdese metallogenic belt, Tibet: Constraints on magmatic-hydrothermal evolution and exhumation: Gondwana Research, v. 36, p. 390–409.
Zheng, Y.Y., Xue, Y.X., Cheng, L.J., Fan, Z.H., and Gao, S.B., 2004, Find-ings, characteristics and significance of Qulong superlarge porphyry copper (molybdenum) deposit, Tibet: Earth Sciences, v. 29, p. 103–108 (in Chinese with English abstract).
Zheng, Y.Y., Sun, X., Gao, S.B., Wu, S., Xu, J., Jiang, J.S., Chen, X., Zhao, Z.Y., and Liu, Y., 2015, Metallogenesis and the minerogenetic series in the Gangdese polymetallic copper belt: Journal of Asian Earth Sciences, v. 103, p. 23–39.
Zhu, D.C., Wang, Q., Zhao, Z.D., Chung, S.L., Cawood, P.A., Niu, Y., Liu, S.A., Wu, F.Y., and Mo, X.X., 2015, Magmatic record of India-Asia collision: Scientific Reports 5, article no. 14289.
Zimmerman, A., Stein, H.J., Morgan, J.W., Markey, R.J., and Watanabe, Y., 2014, Re-Os geochronology of the El Salvador porphyry Cu-Mo deposit, Chile: Tracking analytical improvements in accuracy and precision over the past decade: Geochimica et Cosmochimica Acta, v. 131, p. 13–32.