Embed Size (px)
Citation preview

CYBERBASED ANALYSIS, MODELING AND SIMULATION OF WIND
LOAD EFFECTS IN VORTEX-WINDS
Ahsan Kareema, Dae Kun Kwon
b
aRobert M. Moran Professor, NatHaz Modeling Laboratory, Department of Civil and Environmental
Engineering and Earth Sciences, University of Notre Dame, Notre Dame, IN 46545, USA,
bResearch Assistant Professor, NatHaz Modeling Laboratory, Department of Civil and Environmental
Engineering and Earth Sciences , University of Notre Dame, Notre Dame, IN 46545, USA,
1. Introduction
Wind-related catastrophes (e.g., hurricanes, tornadoes, thunderstorms/downbursts) inflict enormous
devastation on the built environment and result in a staggering number of fatalities. To better manage the
impact of extreme wind events, a new culture of resilience needs to be developed based on innovative
design solutions. By harnessing new technologies, quality of life and economic strength can be improved.
The concept of shared resources is at the center of any plan and includes the exchanging of databases,
computational and experimental resources, and full-scale data, as well as participating in collaborative
research. Current examples of networked facilities for hazard reduction are the Network for Earthquake
Engineering Simulation (NEES) (Van Den Einde et al., 2007). These facilities have made high-end
resources accessible to groups otherwise limited by their personal research tools allowing them to expand
the scope of their research to address complex problems. A similar model in the area of wind effects that
shares resources and includes global engagement with centers of research, education, and design would
result in similar productive advances.
The interdisciplinary nature of wind effects on structures requires a knowledge base from a number of
subject areas, including structural engineering, engineering mechanics, probabilistic methods, fluid
dynamics, turbulence, structural dynamics, experimental methods and risk and reliability, to better
quantify the load effects (e.g., Simiu and Scanlan, 1996; Kareem, 2005). Under this umbrella, reliance is
on analytical (Chen and Kareem, 2003, 2005), computational (Kareem, 1987; Yu and Kareem, 1998;
Fluent, 2006; Kareem, 2008; OpenFOAM, 2011), and experimental tools (Denoon et al., 2001; Bi and
Smith, 2005; Burton et al., 2006; Sarkar et al., 2006; Butler and Kareem, 2007), full-scale measurements
(Kareem, 1985, 1986; Main and Jones, 1999; Tamura et al., 2002; Masters et al., 2003; Jain and Smith,
2003; Satake et al., 2003; Campbell et al., 2004; Gurley et al., 2005; Smith et al., 2005; Kijewski-Correa
et al., 2006a, 2006b; Kwon et al., 2010), codes and standards (SA/SNZ, 2002; AIJ, 2004; BSI, 2004;
ASCE, 2005; NRC, 2005; Tamura et al., 2005; ISO, 2009), and databases (Simiu et al., 2003; Zhou et al.,
2003; Cheng and Wang, 2004; Cheng et al., 2007; Kwon et al., 2005, 2008; NIST, 2006; TPU, 2011;
FCMP, 2011; NIST, 2011). This presents a large set of subject areas and topics worthy of an Engineering
Virtual Organization (EVO) to help assimilate information and resources into a publicly-accessible
collaboratory. The resulting EVO would serve as an end-to-end system that integrates domestic and
international community resources to facilitate an effective, transformative, and conveniently accessible
venue for the acceleration of advances in research and development, as well as teaching and learning, in
the area of wind effects.
Despite many advances in the area of wind effects on structures in recent decades, research has been
conducted with limited resources scattered physically throughout universities, government, and private
research laboratories as well as industry and trade organizations. With the trend toward increasingly
complex designs such as free form architectures and the escalating potential for losses in coastal

communities, the old paradigm is no longer optimal and requires the pooling of resources through a
virtual organization reliant on cyberinfrastructure (CI). By centralizing tools and services within a flexible
CI architecture to support research and education objectives in real-time, this synergistic, integrative
approach offers efficacious tools that the community can use to minimize windstorm damage and meet
the challenges posed by burgeoning emergence of wind sensitive structures in expanding urban and
suburban locales.
Interestingly, other technology fields are fast recognizing the potential impact of virtual organizations,
as evidenced by digital airports and, more recently, digital oil fields, which involve effective gathering,
analyzing, and visualization of data in real-time during drilling to quickly react to problem spots as they
are detected (Holland and Campbell, 2007). This is serving as a catalyst to gain competitive advantage
over others in a business with astronomical stakes. Similarly, the structural engineering field is currently
at the dawn of a new information technology (IT) known as Building Information Modeling (BIM),
which promises to revolutionize the design and construction of buildings. Building Information Models
are 3-D, smart, parametric e-models of buildings that are shared by a team of designers and builders to
facilitate the exchange and interoperability of information in a digital format. While BIM addresses the
visualization and information exchange associated with structural projects, it possesses limited if any
advanced analytical resources requisite for the design process. Certainly, the enormous reported losses
from wind-related events and the increased sensitivity of freeform and super tall buildings, long-span
bridges, and deep water offshore platforms to wind make it an ideal hazard for an EVO providing these
much needed design tools.
An engineering virtual organization (EVO) would enable such a paradigm shift by offering real-time
shared access to geographically dispersed resources for more effective research and education to achieve
improved understanding and modeling of wind effects on structures. This paper summarizes such a
program recently launched by the authors to develop a prototype EVO, Virtual Organization for
Reducing the Toll of EXtreme Winds (VORTEX-Winds). The goals of this initiative are (i) to establish
and sustain such a virtual community for wind hazard mitigation; (ii) to enhance this community’s
analysis and design capabilities to address next generation challenges posed by wind; and (iii) to facilitate
education and training of the future workforce in the field. The steps toward the former goal have already
been initiated through the collection of the field’s leading universities, organizations, firms and
government agencies to form this prototype collaboratory and their commitments to contribute their
resources. The latter two goals will be accomplished through the formation of a virtual organization
utilizing cyberinfrastructure technologies to stitch these geographically dispersed e-analysis and design
modules encompassing Database-Assisted Design, Full-Scale Data, Stochastic Tools, Tele-
Experimentation, Uncertainty Modeling, Damage Assessment, and Computational Platforms. The
prototype EVO will allow access to the modules, while the fully functional EVO will also have the
capability for automated, integrated analysis and design using multiple modules. In addition, both the
prototype and full version of the EVO will offer an interactive knowledge base intended to aggregate and
centralize the shared knowledge of the collaboratory, including a wind-wiki, damage database, help
desk/FAQ, bulletin boards and curriculum tools to facilitate dissemination and education.
2. Overview of VORTEX-Winds
In order to mitigate escalating damage to property, loss of lives and disruption of local economies
(AAWE, 2004; Burton et al., 2006; Prietula et al., 2007), a new research, teaching and design paradigm is
proposed addressing wind effects on structures through the formation of a virtual organization utilizing an
integrated cyberinfrastructure technologies, VORTEX-Winds (Figure 1). Wind hazards would
particularly benefit from this paradigm given the reliance on experimental and empirical data in the
design process.

Figure 1. Front page of VORTEX-Winds portal
Vision and goals
The basic vision of VORTEX-Winds is the development a comprehensive gateway for research and
education to achieve improved understanding and modeling of wind effects on structures to counter the
escalating loss of property and associated indirect losses and the increase in the sensitivity of emerging
structural systems to winds. In response to this vision, the authors have established a virtual organization
employing integrated cyberinfrastructure-based system that facilitates real-time, shared access to
integrated design aids and services using geographically dispersed databases, specialized design/analysis
tools, experimental facilities and full-scale monitoring networks, as well as providing a knowledge-base,
with the following goals:
(i) To establish and sustain a community contributing to and employing the resources integrated by
cyberinfrastructure technologies to facilitate the mitigation of escalating damage, loss of lives and
disruption of local economies posed by wind;
(ii) To enhance analysis and design capabilities to address the challenges of innovative structural
systems needed to realize, in a cost effective manner, buildings with ever increasing heights,
bridges that span oceans, and offshore platforms tapping hydrocarbons in deeper waters exposed
to weather extremes like hurricanes;
(iii) To facilitate education and training of the future workforce in the field so that the growing
competition in the global market is met through a cadre of well trained professionals and
educators.
Structure & Shared Resources
The EVO structure is conceptually defined in Figure 1 as having two branches: the e-analysis and
design modules and the Knowledge Base. The e-analysis and design modules are harvested from the
independent work of a number of universities (largely supported by federal funding) and NIST and will
be classified into seven divisions. These seven divisions are Database-Assisted Design, Full-Scale/Field
Site Data Repository, Statistical/Stochastic Toolboxes, Tele-Experimentation Services, Uncertainty
Modeling, Damage Assessment, and Computational Platforms. Examples of the modules offered within
each of the divisions are shown in Figure 2. As discussed later in this paper, the modules can be
interrogated independently or automatically queried and input into an integrated analysis and design
approach. This integrated approach mimics the traditional off-line analysis and design processes, pooling
contributions from a number of different disciplines. The second branch of VORTEX-Winds is the
knowledge base intended to aggregate and centralize the shared knowledge of the collaboratory. Services
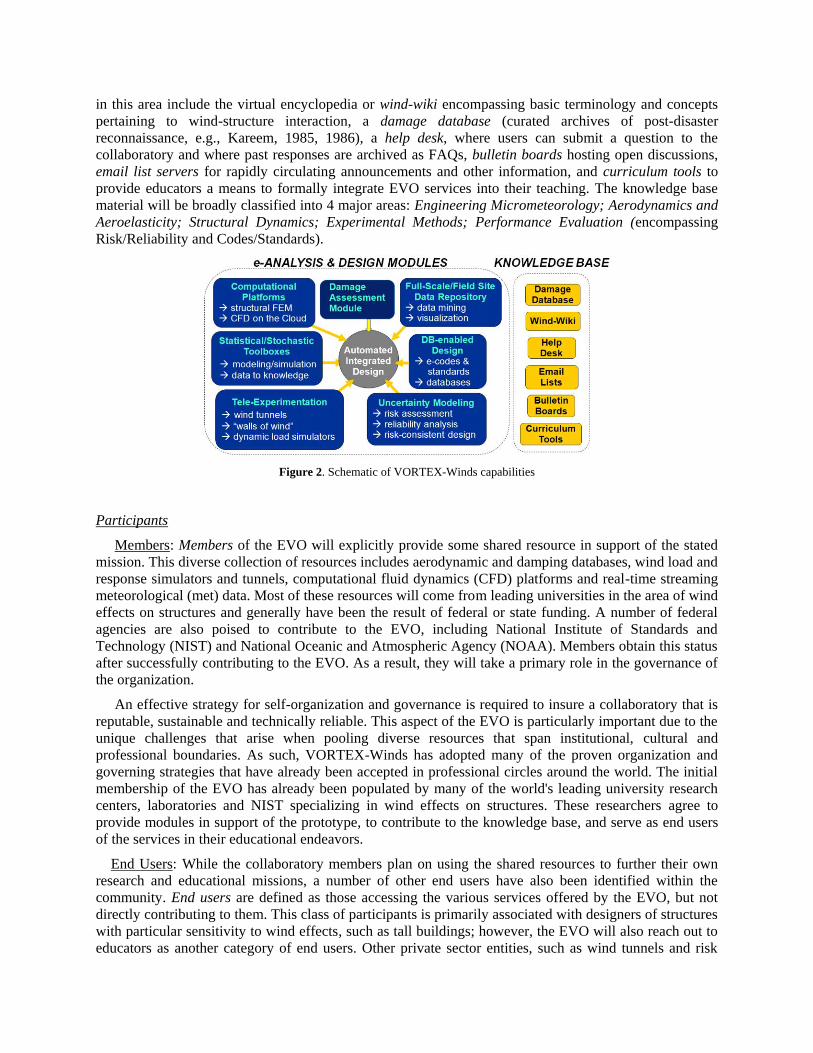
in this area include the virtual encyclopedia or wind-wiki encompassing basic terminology and concepts
pertaining to wind-structure interaction, a damage database (curated archives of post-disaster
reconnaissance, e.g., Kareem, 1985, 1986), a help desk, where users can submit a question to the
collaboratory and where past responses are archived as FAQs, bulletin boards hosting open discussions,
email list servers for rapidly circulating announcements and other information, and curriculum tools to
provide educators a means to formally integrate EVO services into their teaching. The knowledge base
material will be broadly classified into 4 major areas: Engineering Micrometeorology; Aerodynamics and
Aeroelasticity; Structural Dynamics; Experimental Methods; Performance Evaluation (encompassing
Risk/Reliability and Codes/Standards).
Figure 2. Schematic of VORTEX-Winds capabilities
Participants
Members: Members of the EVO will explicitly provide some shared resource in support of the stated
mission. This diverse collection of resources includes aerodynamic and damping databases, wind load and
response simulators and tunnels, computational fluid dynamics (CFD) platforms and real-time streaming
meteorological (met) data. Most of these resources will come from leading universities in the area of wind
effects on structures and generally have been the result of federal or state funding. A number of federal
agencies are also poised to contribute to the EVO, including National Institute of Standards and
Technology (NIST) and National Oceanic and Atmospheric Agency (NOAA). Members obtain this status
after successfully contributing to the EVO. As a result, they will take a primary role in the governance of
the organization.
An effective strategy for self-organization and governance is required to insure a collaboratory that is
reputable, sustainable and technically reliable. This aspect of the EVO is particularly important due to the
unique challenges that arise when pooling diverse resources that span institutional, cultural and
professional boundaries. As such, VORTEX-Winds has adopted many of the proven organization and
governing strategies that have already been accepted in professional circles around the world. The initial
membership of the EVO has already been populated by many of the world's leading university research
centers, laboratories and NIST specializing in wind effects on structures. These researchers agree to
provide modules in support of the prototype, to contribute to the knowledge base, and serve as end users
of the services in their educational endeavors.
End Users: While the collaboratory members plan on using the shared resources to further their own
research and educational missions, a number of other end users have also been identified within the
community. End users are defined as those accessing the various services offered by the EVO, but not
directly contributing to them. This class of participants is primarily associated with designers of structures
with particular sensitivity to wind effects, such as tall buildings; however, the EVO will also reach out to
educators as another category of end users. Other private sector entities, such as wind tunnels and risk

analysis firms, may also become end users of various modules within VORTEX-Winds. All persons
accessing the EVO (as end users or members) will be required to register, which will not only streamline
operations, but will also gather data important to the evaluation and assessment of the EVO’s impacts.
A selective group of end users has also been identified and will help to drive the services and features
of the EVO and beta test the prototype developed. These private sector end users are leading design firms:
Skidmore Owings and Merrill LLP (Chicago, USA), Samsung Corporation (Seoul, Korea), LERA (New
York, USA), Shimizu Corporation (Tokyo, Japan), McNamara-Salvia (Boston, USA) and Weidlinger
(Los Angeles, USA).
Stakeholders: Stakeholders indirectly benefit from the EVO through the actions of members and end
users using the VORTEX-Winds’ services to improve wind-resistant design. These stakeholders represent
all who benefit from safer civil infrastructure. Obvious examples of stakeholders include risk
management firms like Aon, Institute of Business and Home Safety (IBHS) and Risk Management
Services (RMS), the wider professional community representing end users, such as Council on Tall
Buildings and Urban Habitat (CTBUH), American Association for Wind Engineering (AAWE), and
American Society of Civil Engineers’ (ASCE) committee on Tall Buildings and Technical Council on
Wind Engineering, and organizations dealing with codes and standards, such as the International Code
Council (ICC). However, all of society, as users of civil infrastructure, would benefit from more wind-
resistant structures and thus also become indirect stakeholders.
Conceptual CI Design
VORTEX-Winds envisions to include all aspects of cyberinfrastructure support capabilities for the
wind effects on structures research and engineering community, including: 1) communication tools to
support collaboration, 2) high performance computational infrastructure, 3) data storage, data mining,
visualizations, and data warehousing, and 4) access to remote sensors and tele-experimentation. As a
result, VORTEX-Winds will ultimately offer three levels of functionality:
a) Level 1: Knowledge Base Queries – these would be handled within the Knowledge Base’s resources
such as the help desk, Wind-Wiki or bulletin boards.
b) Level 2: Module Stitching/Integration – utilization of specific e-analysis and design modules, e.g.,
retrieval of wind field data from the data repository for a specific region.
c) Level 3: Integrated Analysis and Design – integrated analysis and design using multiple modules, e.g.,
online execution of basic wind-resistant design with computation hosted by the EVO and automated
queries to multiple modules as shown in Figure 3.
These services will be hosted on the front-side by a single gateway server, with computation and
analysis conducted on backside parallel servers. With the organizational and governance structure of
VORTEX-Winds already defined, the primary technical hurdle is in achieving the three levels of
functionality introduced in the previous section. This will require significant effort and coordination,
particularly with respect to the integrated design feature. As a result, the prototype deployment that will
be pursued in this study will establish the basic components of the Knowledge Base and stitch together a
number of geographically distributed resources representative of the seven module divisions identified in
Figure 2. At this stage, VORTEX-Winds has been focused on the achievement of the Level 2
functionality. The next section will discuss more detailed information about a highlight of CI modules for
analysis, modeling and simulation modules of wind load effects on structures.

Figure 3. Schematic of integrated analysis and design concept
3. Cyberbased analysis, modeling and simulation modules of wind load effects in the
VORTEX-Winds
Damage Database in the Knowledge Base
The Damage Database is a digital repository of reconnaissance documenting damage to structures
during wind events such as hurricane/typhoon/cyclone, tornado, thunderstorm/downburst, extratropical
winds etc. This has been established based on a typical database-query method and powered by Google
Map/Earth API, which allows users to geographically view submissions of fellow VORTEX-Winds
members, sorting by location, event classification and damage attributes (Figure 4). User can search
damage archives either by pointing a spot in the Google map or by using query-criteria in the right side of
the map. Each damage report is comprised of wind event on damage, maximum wind speed, damage
location in either address or GPS coordinates, structural properties, damage photos etc. which registered
members can upload their own damage reports to the database via a user interface (Figure 5). It is
envisioned that the database will be enriched more with members’ contributions.
Figure 4. User interface of Damage Database: damage archive in the Google map and query-based database search (left);
damage information with photos (right).
NatHaz Aerodynamic Loads Database in the Database-Enabled Design
Most international wind codes and standards traditionally have relied on reductive formats and

simplifications, which often lead to tables and plots that describe wind loads on structures. The level of
accuracy inherent in codification information in this format and the uncertainty associated with
interpolation or extrapolation of information may compromise the overall accuracy in code-specified load
effects. This has led to database-enabled design procedures, which offer convenient meshing with existing
analysis software. Primarily, such databases rely on wind tunnel-derived data, which may be couched in
analysis portals to provide desired load effects.
Figure 5. User interface for uploading damage report in the Damage Database
The NatHaz Aerodynamic Loads Database (NALD) introduced in 2000 has served an important first
step in establishing an on-line experimental archive of high frequency base balance (HFBB) data for use
in the preliminary design of high-rise buildings subjected to wind loads. As a result, NALD was recently
introduced in the Commentary of ASCE 7-05 (C6.5.8) as an alternative means of assessing the dynamic
wind load effects on high-rise buildings. The NALD ver. 2.0 has integrated the latest advances in data
management and mining for interactive queries of aerodynamic load data and an integrated on-line
analysis framework for determining the resulting base moments and equivalent static wind loads (ESWL)
for survivability and accelerations for serviceability (habitability). The key feature of NALD ver. 2.0 is
the flexibility its analysis module offers: users may select not only the data from the on-line NatHaz
aerodynamic loads database, but also may input desired power spectral density (PSD) expression or wind
tunnel-derived PSD data set obtained from HFBB experiment for the evaluation of wind load effects on
high-rise buildings. Thus it serves as a stand-alone analysis engine. The NALD ver. 2.0 provides a
platform that can be readily expanded and supplemented to yield a comprehensive, simplified and
efficient avenue for e-analysis of high-rise buildings. The architecture of NALD ver. 2.0 and the role of
various web-based tools are summarized in Figure 6 and more detailed information can be found in Kwon
et al. (2005, 2008).

Figure 6. Diagram of NALD ver. 2.0 architecture
NatHaz Gust-front factor in the Database-Enabled Design
In comparison with atmospheric boundary layer winds, which are customarily treated as stationary,
winds associated with gust-fronts originating from a thunderstorm/downburst exhibit rapid changes
during a short time period which may be accompanied by changes in direction. This introduces
nonstationarity both in the mean and the standard deviation of wind fluctuations. In order to realistically
capture characteristics of gust-front winds and their attendant load effects, a new analysis framework is
presented which is named here as the gust-front factor approach. This is akin to the gust loading factor
format used in codes and standards world-wide for the treatment of conventional boundary layer winds.
The gust-front factor expresses a generalized description of the genesis of the overall wind load effects on
structures under both gust-front and boundary layer winds and it reduces simply to the gust loading factor
for the case of conventional boundary layer winds. This approach encapsulates both the kinematic and
dynamic features of gust-front induced wind effects on structures which distinguish themselves from
those experienced in conventional boundary layer flows, i.e., variation in the kinematics of the velocity
profile and its effects on the associated aerodynamics; dynamic effects induced by the sudden rise in wind
speed; non-stationarity of turbulence in gust-front winds; transient aerodynamics (Figure 7).
Figure 7. Schematic diagram of gust-front factor framework
To facilitate expeditious utilization of this framework in design practice and inclusion in codes and
standards, the analysis framework and its workflow is introduced within a web-based portal. This
eliminates the need for an in-depth understanding of the background within the framework and the need

for associated computational effort. The portal has a user-friendly interface, permitting convenient
analysis of several design scenarios with a host of potential loading conditions including the current
ASCE 7-05 procedure in boundary layer winds for immediate comparison. More detailed information can
be found in Kwon and Kareem (2007, 2009).
NatHaz on-line wind simulator in the Statistical/Stochastic Toolboxes
The NatHaz On-line Wind Simulator (NOWS) provides user with on-line simulation of stationary
Gaussian multivariate wind fields for the longitudinal direction on-the-fly. With the help of rapid
development of Internet/information technologies, the NOWS enables user to simulate stationary random
wind fields at any time/space through network-enabled computer system and a general web browser such
as Internet Explorer, Firefox etc. In addition, intuitive user-friendly interface and result interface makes
user easy to input any terms and to check simulation results such as display of simulated wind histories.
This web framework features supporting both Metric (SI) and English units as input/output with on-line
unit converter, location inputs for vertical, horizontal or arbitrary 2-D coordinates, ASCE 7-based mean
wind calculation in terms of terrain roughness to minimize user's input, offering to download simulation
results providing user with further off-line analysis such as structural dynamic analysis under wind loads.
Figure 8. Web-based on-line gust-front factor framework : user interface
In particular, one unique feature of this on-line analysis module is the flexibility for user to choose one
of four simulation schemes such as Discrete frequency function with FFT (Wittig and Sinha, 1975), Schur
decomposition approach with autoregressive (Di Paola, 1998; Di Paola and Gullo, 2001), Ergodic spectral
representation method (Deodatis, 1996; Ding et al., 2006) and Conventional spectral representation
method (Shinozuka and Deodatis, 1991). Modified Kaimal spectrum is adopted for the PSD of
longitudinal wind velocity fluctuations (Kaimal et al., 1972; Simiu, 1974), and Davenport coherence
function (Davenport, 1967) is utilized to describe spatial correlation in the frequency domain. The user
and results interfaces are given in Figure 9.

Figure 9. NatHaz on-line wind simulator (NOWS): user (left) and result (right) interfaces
VORTEX-Winds on-line wind simulator in the Statistical/Stochastic Toolboxes
The VORTEX-Winds on-line wind simulator (VOWS) offers wind simulations for three directions
such as the longitudinal (u), lateral (v) or vertical (w) atmospheric turbulence components of winds. The
wind profile is described by logarithmic law, which this framework accepts one of four different inputs
such as friction velocity & roughness length, reference velocity at 10 m & roughness length, Eurocode
(BSI, 2004) based inputs, and mean wind velocity & standard deviation/integral length scale of wind
components. In addition, users can select one of three wind turbulence components (u, v or w) to be
simulated (Carassale and Solari, 2006). Similar to NOWS, VOWS also offers to download simulation
results as a file in the result interface, in addition to a comparison between target and simulated PSD for
verification (Figure 10).
The VOWS is established in collaboration between Dr. Luigi Carassale, Univ. of Genoa (Italy) and
NatHaz Modeling Laboratory, Univ. of Notre Dame (USA), which is the first international collaboratory
to develop a cyberbased module in the VORTEX-Winds.
Damping database in the Data Repository
Despite the advancements that have been made in structural engineering in the last century, one
critical parameter, damping, remains the complexity which is in part due to the diversity of sources
contributing to the overall energy dissipation capability. The shortcomings of assuming viscous damping
levels became apparent with the transition to light and flexible structures, as assumed levels of damping,
on the order of 1% critical damping for steel structures and 2% for concrete, were often not realized in the
constructed building. For this class of tall, wind-sensitive structures, the diminished levels of damping
realized in practice led to a host of serviceability and especially habitability problems that were not
anticipated in design. The resounding difficulty in engineering known levels of damping in design was
partly responsible for the flurry of auxiliary damping devices in recent years, which were found to
provide measurable and controllable levels of this critical parameter (Kareem et al., 1999).

Figure 10. VORTEX-Winds on-line wind simulator (VOWS): user (left) and result (right) interfaces
The Damping database is an initiative project to provide users with on-line damping information for
various building structures in terms of query-based module. The query parameters include not only
building information such as cross-sectional shapes, widths, depths and heights but also test excitations,
damping estimation methods, ranges of damping ratios etc. (Figure 11). This database is currently
established with the Japanese damping data sets (AIJ, 2000; Satake et al., 2003), however, it is expected
that the contents will be expanded with other damping data in the future.
Figure 11. Damping Database: database-query (left) and result (right) interfaces
Database-enabled design module – high-rise in the Database-Enabled Design
The Database-enabled design module – high-rise (DEDM-HR) provides a web-based on-line tool for
the preliminary design of high-rise buildings subjected to wind loads utilizing experimental archives of
HFBB results, similar to NALD ver. 2.0 described earlier. It offers building response estimates, i.e., base
moments, maximum displacements & accelerations, and equivalent static wind loads (ESWL) etc. (Fig.

10). This e-module offers a unique feature, accommodating multiple data sets in collaboration with other
research groups to overcome a limitation of database-enabled design procedure being a lack of data sets.
Note that the DEDM-HR utilizes an advanced approach, distributed databases, which a central server
communicates with multiple databases in terms of advanced IT solutions. This is more efficient way not
to modify pre-existing web servers located in other regional/international groups, especially in view of
disparate web server environments each other. Currently, the DEDM-HR is associated with two databases:
one is NatHaz database from NatHaz modeling laboratory, University of Notre Dame, USA, which is the
same with the one used in the NALD (Zhou et al., 2003; Kwon et al., 2005, 2008), and the other is
Tamkang database from Wind Engineering Research Center (WERC), Tamkang University, Taiwan
(Cheng and Wang, 2004; Cheng et al., 2007). Accordingly, the DEDM-HR offers data that pools
information from both sources, thus expanding the range of building configurations and exposures. The
examples of user and result interfaces are shown in Figures 12 and 13.
A bank of database involving synchronously measured pressure field around building surface is being
developed to supplement the HFBB DEDM-HR. A schematic diagram is shown in Figure 14.
Database-enabled design module – low-rise in the Database-Enabled Design
The Database-enabled design module – low-rise (DEDM-LR) provides a web-based on-line tool for
the preliminary design of low-rise buildings subjected to wind loads utilizing experimental archives of
synchronous wind pressure measurements for a variety of models (Figure 15). The wind load associated
with each of the pressure taps is distributed to the primary structural system at a number of discrete
locations, i.e., the wind loads are distributed to the structural frames at the attachment points of girts and
purlins which support the cladding panels. Time series of structural loads are obtained from the measured
time series of wind pressures for each wind direction. Then, these pressure time series are utilized to
compute peak wind effects of the structural frames corresponding to winds with various speeds and
directions.
Figure 12. User interfaces of the DEDM-HR

The analysis codes are similar to WindPRESSURE software, which is an off-line codes provided by
NIST (Main and Fritz 2006). The wind pressure data sets used in this DEDM-LR are TPU (Tokyo
Polytechnic University, Japan) aerodynamic database which is available at http://wind.arch.t-
kougei.ac.jp/system/eng/contents/code/tpu (TPU 2011). The TPU database contains numerous results of
low-rise models for three roof types such as Gable, Hip and Flat and each model was tested in various
wind directions. This project is in the progress of a beta testing and it is expected to be finalized in the
near future. The user interface is shown in Figure 16.
Figure 13. Result interface of the DEDM-HR
Figure 14. A schematic diagram of analysis of high-rise building using synchronous pressure data

Figure 15. A schematic diagram of DEDM-LR
Figure 16. User interface of the DEDM-LR
CloudCFD in the Computational Platform
Computational Fluid Dynamics (CFD) has been extensively developed over the last three decades and
widely used in many fields in both academic research and industrial applications. From the basic
discretization scheme, mesh generation and treatment, turbulence modeling, matrix solver, to parallel
computing, all have advanced over the last thirty years. But what has not improved is the steep learning
curve needed for using CFD despite availability of numerous CFD documentations and textbooks in the
market. A beginner may easily get lost while deciding which turbulence model to choose, or what
parameters to set and how to control the solver, not even mentioning mesh generation and complex post-
processing. From the programming point of view, when a code is written to solve a practical problem, the
complexity of Navier-Stokes equation will soon make any good code unwieldy, and the final software is
usually so difficult to handle (definitely needs a team to maintain) that even some basic verification and
validation would require months to finish. Another fact is that CFD by nature needs more powerful
computational resources than most other disciplines. For medium to large simulation cases, even if the
code is tailored to perform effectively in a parallel mode, Infiniband support is still crucial to get a good
scalability. And beginners usually have no understanding of these details.
What we see here are two road blocks; one is the lack of a user-friendly access platform that can
encourage “trial and error”, another is the availability of computational resources. The CloudCFD project
is designed to remove these barriers; it aims to provide a platform for a broader user’s community with
various levels of skill, including amateurs, beginners, intermediate and even advanced CFD users. It also
aims to be user-friendly and easily accessed and operated from a remote interface as well as offers
resources needed to run the CFD solver with dynamic allocation (including server, cloud and computing
nodes). Our philosophy in this endeavor is: to provide easy to use hands on experiences to beginners so
that they are more enthused by the capabilities of CFD so that they start developing their own codes and
on the other hand offer a versatile robust platform to those who are interested in application only. To
accomplish this we need to design a task management system in such a way that it can dynamically
allocate resources to the end-users, so that the end-users can focus more on their applications and not be
distracted by the hardware issues. And just as in new field, our platform is not without guidelines; it is
created with many useful “templates”, so that users can start from a template most fitting to their needs.
Additionally, the default numerical settings for categories such as boundary conditions, discretization
schemes, and turbulence modeling are preset, so that users can input minimal parameters and their
simulations do not blow-up.
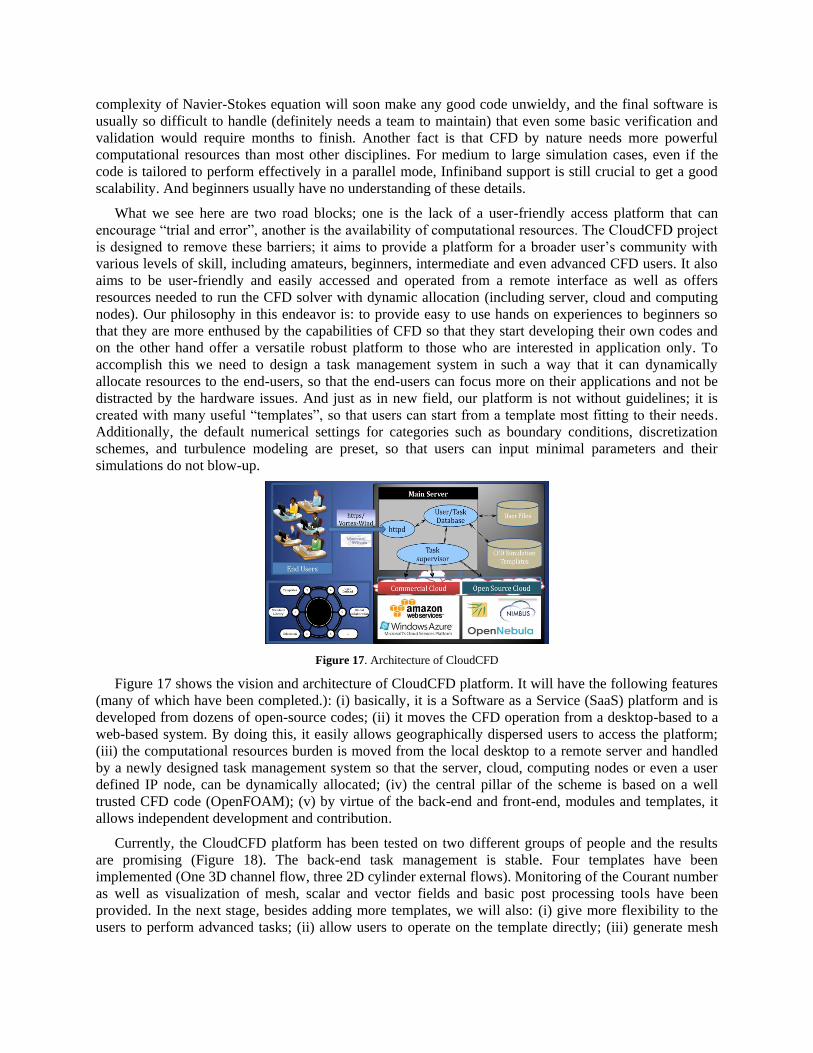
Figure 17. Architecture of CloudCFD
Figure 17 shows the vision and architecture of CloudCFD platform. It will have the following features
(many of which have been completed.): (i) basically, it is a Software as a Service (SaaS) platform and is
developed from dozens of open-source codes; (ii) it moves the CFD operation from a desktop-based to a
web-based system. By doing this, it easily allows geographically dispersed users to access the platform;
(iii) the computational resources burden is moved from the local desktop to a remote server and handled
by a newly designed task management system so that the server, cloud, computing nodes or even a user
defined IP node, can be dynamically allocated; (iv) the central pillar of the scheme is based on a well
trusted CFD code (OpenFOAM); (v) by virtue of the back-end and front-end, modules and templates, it
allows independent development and contribution.
Currently, the CloudCFD platform has been tested on two different groups of people and the results
are promising (Figure 18). The back-end task management is stable. Four templates have been
implemented (One 3D channel flow, three 2D cylinder external flows). Monitoring of the Courant number
as well as visualization of mesh, scalar and vector fields and basic post processing tools have been
provided. In the next stage, besides adding more templates, we will also: (i) give more flexibility to the
users to perform advanced tasks; (ii) allow users to operate on the template directly; (iii) generate mesh

for arbitrary 2D shapes automatically; (iv) enhance the post-processing utility and visualization tools; (v)
provide an even more user-friendly interface.
Figure 18. User and result interfaces of CloudCFD
NatHaz Interactive Wind Tunnel (NH-GUST) in the Tele-Experimentation Services
Given the interconnectedness of research, and the lack of available experimental hardware at every
research location, developing a system that can bring the greatest amount of technology to as many
people as possible is certainly warranted. To that end, a prototype system for an interactive wind tunnel,
NH-GUST, has been developed. This system, conceptualized in Figure 19, consists of various components
arranged within a local network. The end user does not interact will all of the local network components,
only with the front end system displayed on a webpage or other similar form. A dedicated web interface
connects to the networked components. The prototype interface was originally designed to be controlled
from a series of LabView (National Instruments) based control panels, however this is highly
cumbersome and does not work with many operating systems.
Creating a cross-platform simulation framework, similar to that of the Network for Earthquake
Engineering Simulation (NEES), for severe wind experiments can be a method for improving both the
range and quantity of experimental data and for enhancing the wind engineering field as a whole. Instead
of only a few schools sharing a limited number of wind tunnel facilities, a customizable (although limited)
wind tunnel framework can be developed for anyone to input a wind field scenario to see how it will
impact a physical model, either through the measurement of surface pressures or through a high frequency
force balance (HFFB). Modification of existing wind tunnels and the development of research portals can
have the effect of quickly building the body of knowledge for the effect of severe storm events, matching
the body of knowledge that has been produced over several decades regarding the effects of boundary
layer flows on prismatic structures.
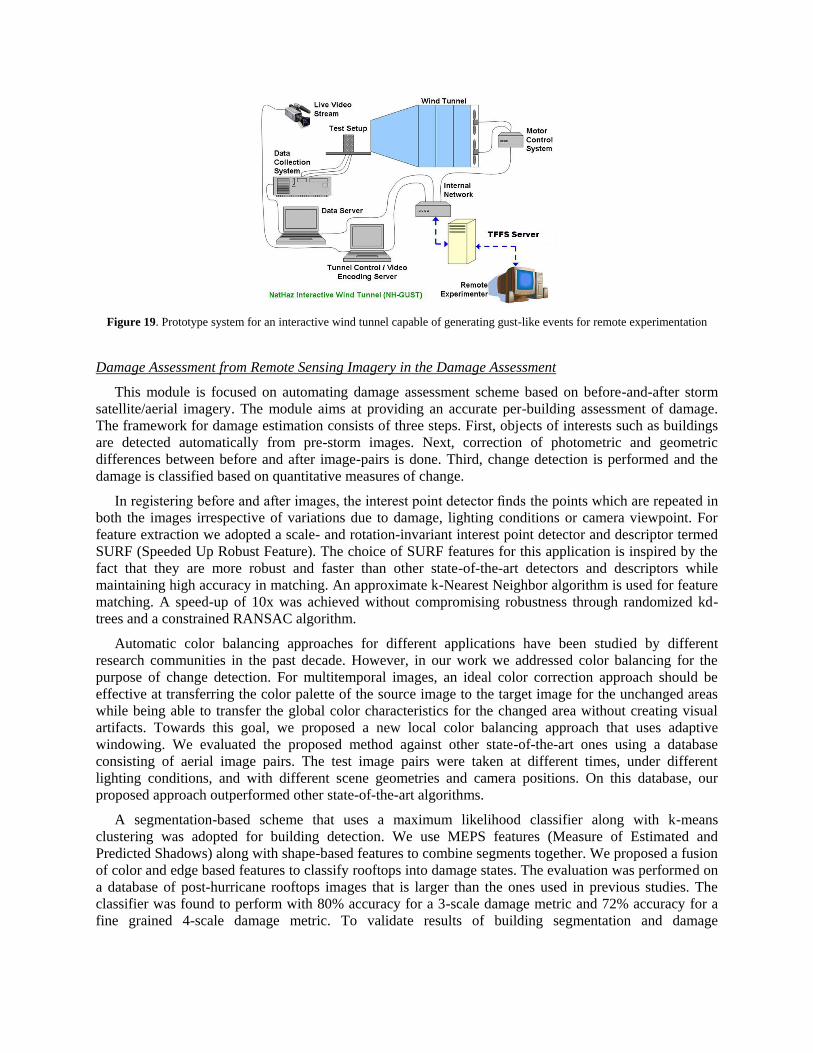
Figure 19. Prototype system for an interactive wind tunnel capable of generating gust-like events for remote experimentation
Damage Assessment from Remote Sensing Imagery in the Damage Assessment
This module is focused on automating damage assessment scheme based on before-and-after storm
satellite/aerial imagery. The module aims at providing an accurate per-building assessment of damage.
The framework for damage estimation consists of three steps. First, objects of interests such as buildings
are detected automatically from pre-storm images. Next, correction of photometric and geometric
differences between before and after image-pairs is done. Third, change detection is performed and the
damage is classified based on quantitative measures of change.
In registering before and after images, the interest point detector finds the points which are repeated in
both the images irrespective of variations due to damage, lighting conditions or camera viewpoint. For
feature extraction we adopted a scale- and rotation-invariant interest point detector and descriptor termed
SURF (Speeded Up Robust Feature). The choice of SURF features for this application is inspired by the
fact that they are more robust and faster than other state-of-the-art detectors and descriptors while
maintaining high accuracy in matching. An approximate k-Nearest Neighbor algorithm is used for feature
matching. A speed-up of 10x was achieved without compromising robustness through randomized kd-
trees and a constrained RANSAC algorithm.
Automatic color balancing approaches for different applications have been studied by different
research communities in the past decade. However, in our work we addressed color balancing for the
purpose of change detection. For multitemporal images, an ideal color correction approach should be
effective at transferring the color palette of the source image to the target image for the unchanged areas
while being able to transfer the global color characteristics for the changed area without creating visual
artifacts. Towards this goal, we proposed a new local color balancing approach that uses adaptive
windowing. We evaluated the proposed method against other state-of-the-art ones using a database
consisting of aerial image pairs. The test image pairs were taken at different times, under different
lighting conditions, and with different scene geometries and camera positions. On this database, our
proposed approach outperformed other state-of-the-art algorithms.
A segmentation-based scheme that uses a maximum likelihood classifier along with k-means
clustering was adopted for building detection. We use MEPS features (Measure of Estimated and
Predicted Shadows) along with shape-based features to combine segments together. We proposed a fusion
of color and edge based features to classify rooftops into damage states. The evaluation was performed on
a database of post-hurricane rooftops images that is larger than the ones used in previous studies. The
classifier was found to perform with 80% accuracy for a 3-scale damage metric and 72% accuracy for a
fine grained 4-scale damage metric. To validate results of building segmentation and damage

classification, preparation of ground truth datasets is being done and is hoped to be made publicly
available for research communities.
Figure 20. Source images (left), Target images (middle) that have been corrected geometrically. New target image transformed
using the proposed local color transfer technique (right)
Figure 21. Example of a satellite image (left) and extracted buildings in white (right)
The first row in Figure 22 shows a collapsed building and the corresponding false color images for
edge density, V Histogram (edge based features) and H means (color based feature). Notice that the edge
density values are significantly higher in this case. The second row corresponds to a partially damaged
building with a cavity in the rooftop. V histogram indicates a significant change in the cavity area and H
means shows a minor damage on the roof.
Figure 22. Damage assessment: extracted features for a collapsed building (top) and a partially damaged building (bottom)
This automated damage assessment scheme based on satellite imagery is being transported to a web-
based portal for inclusion in VORTEX-Winds.
4. Concluding Remarks
Despite many advances in the area of wind effects on structures in recent decades, research has been
conducted with limited resources scattered physically throughout universities, government, and private
research laboratories as well as industry and trade organizations. This has not permitted the community to
fully benefit from the collective physical, computational and intellectual resources dedicated to this topic.
The enormous reported losses from wind-related events and the increased sensitivity of freeform and
super tall buildings, long-span bridges, and deep water offshore platforms to wind make it an ideal hazard
for a virtual organization and associated cyberbased modules providing these much needed design tools.
Through a collection of tools and services networked with a flexible architecture and interfaces to support
research and education objectives in real-time, these cyberbased analysis, modelling and simulation tools
in the VORTEX-Winds EVO promise to enhance the capability of each individual beyond one’s current
resources through a synergistic, integrative approach to understanding and modeling the complex wind-
structure interactions. The result will be a community as a whole better positioned to address the next
frontiers in the field. Accordingly, VORTEX-Winds and associated cyberbased modules would serve as
an end-to-end system that integrates domestic and international community resources related to wind
effects on structures. It would facilitate an effective, transformative, and conveniently accessible venue
for the acceleration of advances in research and development, as well as teaching and learning, in this
area and would have a revolutionary impact on this field due to its unprecedented dissemination of
knowledge and resources.
Acknowledgements
The authors are grateful for the financial support by the National Science Foundation via grant CBET
07-42191 and the matching support provided by the University of Notre Dame in the initial phase of the
project. Support by the Global Center of Excellence (GCOE): New Frontiers of Education and Research
in Wind Engineering at Tokyo Polytechnic University, Ministry of Education, Culture, Sports, Science
and Technology (MEXT), Japan, has been critical in sustaining the long term goals of this cyberbased
vision and it is gratefully acknowledged. The authors are grateful to their colleagues who kindly agreed to
serve as members of the collaboratory and have contributed many fundamental developments at various
stages of the project. The authors would also acknowledge the Co-PIs of the initial phase of VORTEX-
Winds, Profs. Tracy Kijewski-Correa & Greg Madey and collaborator for the second phase, Prof. Yukio
Tamura of the Tokyo Polytechnic University. Without their contributions, this vision may not have been
realized.
5. References
American Association for Wind Engineering (AAWE) (2004). “Wind engineering research and outreach
plan to reduce losses due to wind hazards.” Report prepared by the American Association for Wind
Engineering in Collaboration with American Society of Civil Engineers, February 2004, Revised May
2004.
American Society of Civil Engineers (ASCE) (2005). Minimum design loads for buildings and other
structures, ASCE 7-05, ASCE, Reston, VA.
Architectural Institute of Japan (AIJ) (2000). Damping in Japan, Maruzen, Japan.
Architectural Institute of Japan (AIJ) (2004). RLB Recommendations for loads on buildings, Structural
Standards Committee, Tokyo, Japan.
Bi, A., and Smith, D. A. (2005). “Wall-area-averaged pressure coefficients measured in full-scale.” 10th
Americas Conference on Wind Engineering, Baton Rouge, LA.
British Standards Institute (BSI) (2004). Part 1-4: Wind actions, Eurocode 1: Actions on structures,
Eurocode, British Standards Institute, London, England.
Burton, M., Kwok, K.C.S., Hitchcock, P.A., and Denoon, R.O. (2006). “Frequency dependence of human
response to wind-induced building motion.” Journal of Structural Engineering, 132(2), 296-303.
Butler, K., and Kareem, A., (2007). “Physical and numerical modeling of downburst generated gust
fronts.” Proceedings of the 12th International Conference on Wind Engineering, Cairns, Australia,
July 1-7.
Campbell, S., Kwok, K.C.S., and Hitchcock, P.A. (2004). “Full-scale measurements of two high-rise
residential buildings in Hong Kong during a typhoon.” Proc. 5th International Colloquium on Bluff
Body Aerodynamics and Applications, Ottawa, July 11-15, 313-316.
Carassale, L., and Solari, G. (2006). “Monte Carlo simulation of wind velocity fields on complex
structures.” Journal of Wind Engineering and Industrial Aerodynamics, 94, 323-339.
Chen, X., and Kareem, A. (2003). “New frontiers in aerodynamics of long-span bridges: an advanced
analysis framework.” Journal of Wind Engineering and Industrial Aerodynamics, 91, 1511-1528.
Chen, X., and Kareem, A. (2005). “Dynamic wind effects on buildings with 3-D coupled modes:
application of HFFB measurements.” Journal of Engineering Mechanics, ASCE, 131(11), 1115-1125.
Cheng, C.-M., and Wang, J. (2004). “Wind tunnel database for an intermediate wind resistance design of
tall buildings.” Proc. 1st International Symposium on Wind Effects on Buildings and Urban
Environment, Tokyo, Japan.
Cheng, C.-M., Lin, Y.-Y., Wang, J., Wu, J.-C., and Chang, C.-H. (2007). "The Aerodynamic Database for
the Interference Effects of Adjacent Tall Buildings." Proc. 12th International Conference on Wind
Engineering, Cairns, Australia, 359-366.
Davenport, A. G. (1967). “The dependence of wind load upon meteorological parameters.” Proceedings
of the International Research Seminar on Wind Effects on Building and Structures, University of
Toronto Press, Toronto, 19-82.
Denoon, R.O., Kwok, K.C.S., and Roberts, R.D. (2001). “The use of motion simulators in the
investigation of occupant response to wind-induced building motion.” Proceedings of 5th Asia Pacific
Conference in Wind Engineering, Kyoto, Journal of Wind Engineering, 89, 97-100.
Deodatis, G (1996). “Simulation of ergodic multivariate stochastic processes.” Journal of Engineering
Mechanics, 122(8), 778-787.
Di Paola, M. (1998). “Digital simulation of wind field velocity.” Journal of Wind Engineering and
Industrial Aerodynamics, 74-76, 91-109.
Di Paola, M., and Gullo, I. (2001). “Digital generation of multivariate wind field processes.” Probabilistic
Engineering Mechanics, 16, 1-10.
Ding, Q., Zhu, L., and Xiang, H. (2006). “Simulation of stationary Gaussian stochastic wind velocity
field.” Wind and Structure, 9(3), 231-243.
FCMP (2011). FCMP Hurricane data, The Florida Coastal Monitoring Program (FCMP).
http://fcmp.ce.ufl.edu/index.htm
Fluent (2006). Fluent 6.3 Documentation, Fluent, Inc.
Gurley, K., Masters, F., Prevatt, D., and Reinhold, T. (2005). “Hurricane data collection: FCMP
deployments during the 2004 Atlantic hurricane season.” 10th Americas Conference on Wind
Engineering, Baton Rouge, Louisiana, May 31 - June 4.
Holland, D., and Campbell, M. (2007). “The DOF wave is here - Who can hang ten ?” Offshore Engineer,
May 2007, 43-45.
International Organization for Standardization (ISO) (2009). 4354: Wind actions on structures, ISO,
Switzerland.
Jain, S., and Smith, D. A. (2003). “A comparison of load effects on a frame using full and model scale
data.” 11th International Conference on Wind Engineering, Lubbock, TX.
Kaimal, J. C., Wyngaard, J. C., Izumi, Y., and Cote, O. R. (1972). “Spectral characteristics of surface-
layer turbulence.” Journal of Royal Meteorological Society, 98, 563-589.
Kareem, A. (1985). “Structural performance and wind speed-damage correlation in hurricane Alicia.”
Journal of Structural Engineering, ASCE, 112(12), 2596-2610.
Kareem, A. (1986). “Performance of cladding in hurricane Alicia.” Journal of Structural Engineering,
ASCE, 112(12), 2679-2693.
Kareem, A., (1987). “Wind effects on structures: a probabilistic viewpoint.” Probabilistic Engineering
Mechanics, 2(4), 166-200.
Kareem, A., Kijewski, T., and Tamura, Y. (1999). “Mitigation of motions of tall buildings with specific
examples of recent applications,” Wind and Structures, 2(3), 132-184.
Kareem A. (2005). “Bluff body aerodynamics and aeroelasticity: a wind effects perspective.” Proc. the
Fourth European & Africa Conference on Wind Engineering, July 11-15, Prague, Czech Republic.
Kareem, A., Kijewski-Correa, T., Tamura, Y. and Madey, G. (2008), “Next frontiers of innovation,
discovery and learning in wind engineering: a cyberinfrastructure perspective,” American Association
of Wind Engineers (AAWE) Workshop, Vail, CO, August 20-22.
Kareem, A. (2008). “Numerical simulation of wind effects: A probabilistic perspective” Journal of Wind
Engineering and Industrial Aerodynamics, 96(10-11), 1472-1497.
Kijewski-Correa, T., Kareem, A., and Kochly, M. (2006a). “Experimental verification and full-scale
deployment of global positioning systems to monitor the dynamic response of tall buildings.” Journal
of Structural Engineering, ASCE, 132(8), 1242-1253.
Kijewski-Correa, T., Kilpatrick, J., Kareem, A., Kwon, D. K., Bashor, R., Kochly, M., Young, B. S.,
Abdelrazaq, A., Galsworthy, J., Isyumov, N., Morrish, D., Sinn, R. C., and Baker, W. F. (2006b),
“Validating the wind-induced response of tall buildings: a synopsis of the Chicago full-scale
monitoring program.” Journal of Structural Engineering, ASCE, 132(10), 1509-1523.
Kwon, D., Kijewski-Correa, T., and Kareem, A. (2005). “e-analysis/design of tall buildings subjected to
wind loads.” Proc. 10th Americas Conference on Wind Engineering, AAWE, Baton Rouge, LA, USA.
Kwon, D., Kijewski-Correa, T., and Kareem, A. (2010). “SmartSync: An Integrated Real-Time
Monitoring and SI System for Tall Buildings.” ASCE 2010 Structures Congress, Orlando, Florida,
May.
Kwon, D., and Kareem, A. (2007). “Gust-front factor: A new framework for the analysis of wind load
effects in gust-fronts.” Proc. 12th International Conference on Wind Engineering (ICWE12), Cairns,
Australia, 767-774.
Kwon, D. K., Kijewski-Correa, T., and Kareem, A. (2008). “e-Analysis of high-rise buildings subjected
to wind loads.” Journal of Structural Engineering, ASCE, 134(7), 1139-1153.
Kwon, D., and Kareem, A. (2009). “Gust-front factor: new framework for wind load effects on structures.”
Journal of Structural Engineering, ASCE, 135(6), 717-732.
Main, J. A., and Jones, N. P. (1999). “Full-scale measurements of stay cable vibration.” Proceedings of
the 10th International Conference on Wind Engineering, 2, 963-970.
Main, J. A., and Fritz, W. P. (2006). “Database-assisted design for wind: concepts, software, and
examples for rigid and flexible buildings.” NIST Building Science Series 180, NIST.
Masters, F., K. Gurley, and T. Reinhold. (2003). “Ground level wind characteristics of Isidore and Lili.”
11th International Conference on Wind Engineering, Lubbock, Texas, June 2-5.
National Research Council (NRC) (2005). National building code of Canada, Associate Committee on
the National Building Code, National Research Council, Ottawa, Canada.
NIST (2006). NIST Aerodynamic Database, Building and Fire Research Laboratory, National Institute of
Standards and Technology (NIST). http://fris2.nist.gov/winddata/
NIST (2011). NIST Extreme wind speeds data, National Institute of Standards and Technology (NIST).
http://www.itl.nist.gov/div898/winds/datasets.htm
OpenFOAM (2011). Open source CFD software package, OpenFOAM Team, Silicon Graphics
International Corp. http://www.openfoam.com/

Prietula, B. M., Madey, G., and Rodriguez, D. (2007). “Project ENSAYO: a virtual emergency operations
center for disaster management research, training, and discovery.” The International Conference on
Global Defense and Business Continuity (ICGDBC 2007), San Jose, CA: IEEE.
Sarkar, P. P, Haan, F. L., Balaramudu, V., and Sengupta, A. (2006). ”Laboratory simulation of tornado
and microburst to assess wind loads on buildings.” ASCE 2006 Structures Congress, St. Louis, MO.
Satake, N., Suda, K., Arakawa, T., Sasaki, A., and Tamura, Y. (2003). “Damping evaluation using full-
scale data of buildings in Japan.” Journal of Structural Engineering, 129(4), 470-477.
Simiu, E. (1974). “Wind spectra and dynamic alongwind response” Journal of Structural Division, ASCE,
100(9), 1897-1910.
Simiu, E., and Scanlan, R. H. (1996). Wind Effects on Structures, 3rd edition, Wiley-Interscience, John
WILEY & SONS, INC.
Simiu, E., Sadek, F., Whalen, T. M., Jang, S., Lu, L.-W., Diniz, S., Grazini, A., and Riley, M. A., (2003).
“Achieving safer and more economical buildings through database-assisted, reliability-based design
for wind.” Journal of Wind Engineering and Industrial Aerodynamics, 91(12-15), 1587-1611.
Shinozuka, M., and Deodatis, G. (1991). “Simulation of stochastic processes by spectral representation.”
Applied Mechanics Reviews, 44(4), 191-204.
Smith, D. A., Mehta, K. C., Letchford, C., and Zhu, H. (2005). “Testing of structures using the prop-wash
from a C-130 aircraft.” The Ninth International Conference on Structural Safety and Reliability
(ICOSSAR 2005), Rome, Italy.
Standards Australia/Standards New Zealand (SA/SNZ) (2002). AS/NZS 1170.2:2002 structural design
actions part 2: wind actions, Australian/New Zealand Standard, Standards Australia, Sydney,
Australia/New Zealand.
Tamura, Y., Matsui, M., Pagnini, L.-C., Ishibashi, R., and Yoshida, A. (2002). “Measurement of wind-
induced response of buildings using RTK-GPS.” Journal of Wind Engineering and Industrial
Aerodynamics, 90, 1783-1793.
Tamura, Y, Kareem, A., Solari, G., Kwok, K. C. S., and Holmes, J. D. (2005). “Aspects of the dynamic
wind-induced response of structures and codification.” Wind and Structures, 8(4), 251-268.
Tokyo Polytech University (TPU) (2011). TPU aerodynamic database, Global COE program, Tokyo
Polytech University. http://wind.arch.t-kougei.ac.jp/system/eng/contents/code/tpu
Van Den Einde, L., Kinderman, T. L., Masuda, M., and Elgamal, A. (2007). “NEES IT tools to advance
earthquake engineering research.” Proceedings of Structures Congress 2007, May 17-19, Long Beach,
CD-ROM.
Wittig, L. E., and Sinha, A. K. (1975). “Simulation of multicorrelated random processes using the FFT
algorithm.” Journal of the Acoustical Society of America, 58(3), 630-633.
Yu, D., and Kareem, A. (1998). “Parametric study of flow around rectangular prisms using les,” Journal
of Wind Engineering and Industrial Aerodynamics, 77-78, 653-662.
Zhou, Y., Kijewski, T., and Kareem, A. (2003). “Aerodynamic loads on tall buildings: an interactive
database.” Journal of Structural Engineering, ASCE, 129(3), 394-404.