Embed Size (px)
Citation preview
EPA Region 10 March 2016 R. Stumpf NOAA #1
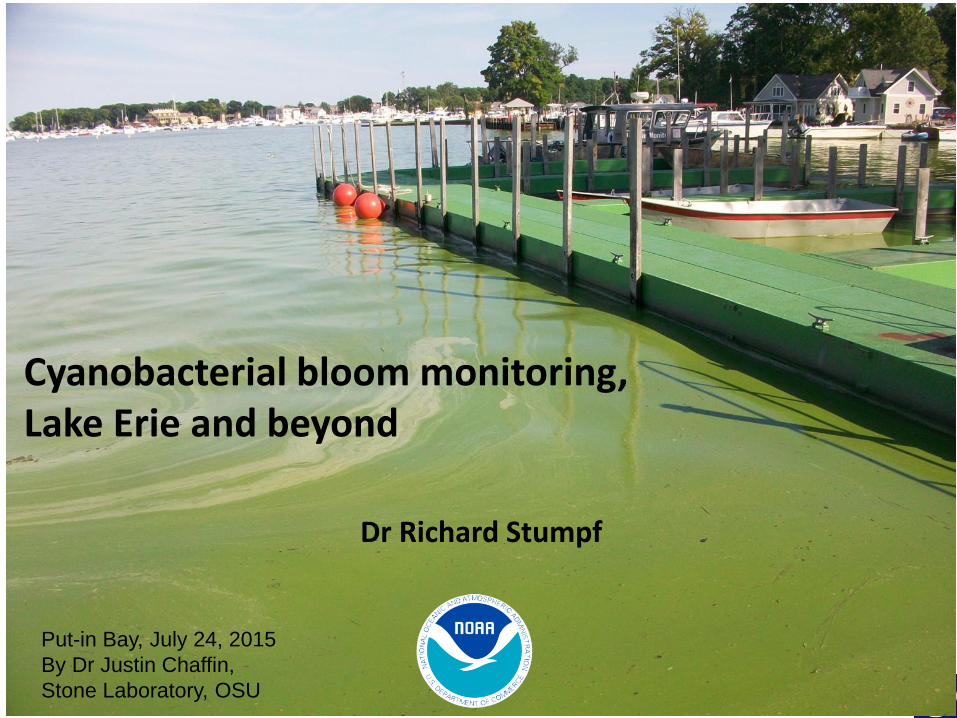
Cyanobacterial bloom monitoring,Lake Erie and beyond
Dr Richard Stumpf
Put-in Bay, July 24, 2015
By Dr Justin Chaffin,
Stone Laboratory, OSU

EPA Region 10 March 2016 R. Stumpf NOAA #2
Emphasis on medium resolution (more frequent)
Lake Erie, 09 Oct 2011, MERIS
Upper Klamath Lake,
Oregon
2011 MERIS
19Aug 23 Sep

EPA Region 10 March 2016 R. Stumpf NOAA #3
Cyanobacterial bloom problems that satellite monitoring might help
• Where are blooms now? – How bad are they (concentration)?
• Will it be worse tomorrow – For swimming or for water suppliers?
• Which lakes are typically bad• Have lakes changed over the last decade?• Can we explain what causes blooms
– Predict how bad the bloom will be this summer– Inform management to reduce blooms by
reducing nutrients

EPA Region 10 March 2016 R. Stumpf NOAA #4
Satellite Comparison for cyano applications
Clouds take out 1/2 to 2/3 of imagerySome sunglint is not a problem for our algorithmsMinimum resolution, 3 pixels across (2 mixed land/water)
Satellite Spatial Temporal Key Spectral
MERIS (2002-12)
OLCI Sentinel-3 2015
300 m 2 day 10 (5 on red edge)
MODIS high res Terra 1999; Aqua 2002
250/500 m 1-2 day 4 (1 red, 1 NIR)
MODIS low res& SeaWiFS
1 km 1-2 day 7-8 (2 in red edge)
Landsat 30 m 8 or 16 day 4 (1 red, 1 NIR)
Sentinel-2(2015)
20 m 10 day (5 day with 2nd
satellite in 2017)5 (1 red; 2 NIR, 1 in red edge)
OK good good
OK
OK
good
good
good
good
poor
Potential with 2
poor marginal
potential
marginal

EPA Region 10 March 2016 R. Stumpf NOAA #5
Resolution and water bodies
Note: false color sharpens distinction between land and water. Reddish pixels at right include land.
Land Land Land Land Land
Land Water Water Mixed Land
Land Mixed Water Water Mixed
Land Land Land Land Land
Mixed pixels limit our ability to
monitor small water bodies.
No
Yes
Some

EPA Region 10 March 2016 R. Stumpf NOAA #6
Where are we with satellite• All sensors can find scum
• All sensors can find turbid “eutrophic” water
– Defining the right answer for mgmt is the problem
• We can find cyanobacteria blooms (with MERIS)
• All usable methods produce false positives• Some produce false negatives
• All sensors have limitations (time, space, spectra)
• MERIS was the best sensor for cyano detection, – Several bands in red and near-IR, 2-day repeat
– 300 m and 1.2 km
• The future is OLCI on Sentinel-3 (Feb 2016 launch)– Replaces MERIS

EPA Region 10 March 2016 R. Stumpf NOAA #7
MERIS bands
Phycocyanin
Chl-a
scattering
Also have to correct for atmosphere;
Landsat runs out of information content to discriminate everything
blue green red near infrared
Landsat-8 bands
Chlorophyll,
sediment,
tannins, iron
MERIS (and Landsat) Bands on water spectra from Microcystis

EPA Region 10 March 2016 R. Stumpf NOAA #8
The extra wavelengths give a cyanobacteria index, “CI”, which equates to concentration
True color Cyano Index (CI)
13 Sep 2010
low high

EPA Region 10 March 2016 R. Stumpf NOAA #9
Validation of Lake Erie concentration algorithm for other areas
• Remote Sensing
– Uniform and systematic approach for identifying & quantifying cyanobacteria blooms.
• Second derivative spectral shape algorithms (SS; Wynne et al. 2008)
0
500
1000
1500
2000
Measured
MERIS-Derived
Lunetta, Schaeffer, Stumpf et al. Remote Sensing of Environment

EPA Region 10 March 2016 R. Stumpf NOAA #10
And Between CI and chl-a from Florida (St Johns River WMD)
• r2=0.96
• Est chl a =
• 4020*(CI) + 20
• Detection of chlorophyll > 20 µg/L– (working on > 10 µg/L)

EPA Region 10 March 2016 R. Stumpf NOAA #11
Planktothrix example
• Sandusky Bay, dispersed
2010

EPA Region 10 March 2016 R. Stumpf NOAA #12
Microcystis example, it rises when it needs to make food
• Aug 2010, Lake Erie

EPA Region 10 March 2016 R. Stumpf NOAA #13
Examples from California
Aphanizomenon flos-aquae Microcystis spp.
Background
Photos from R. Kudela, UCSC
EPA Region 10 March 2016 R. Stumpf NOAA #14
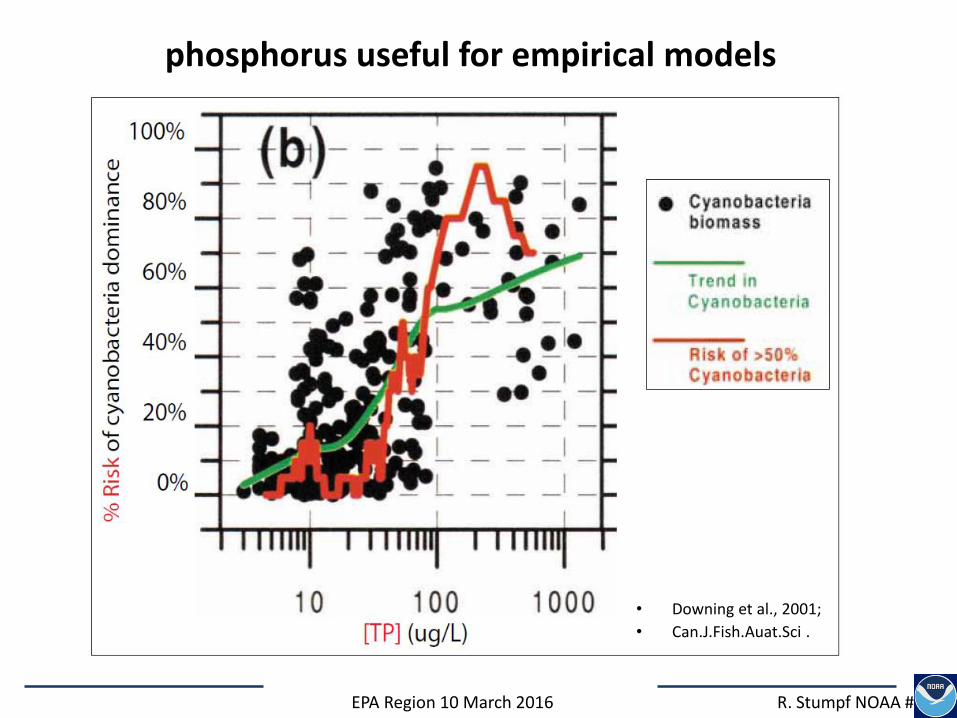
phosphorus useful for empirical models
• Downing et al., 2001;
• Can.J.Fish.Auat.Sci .
EPA Region 10 March 2016 R. Stumpf NOAA #15
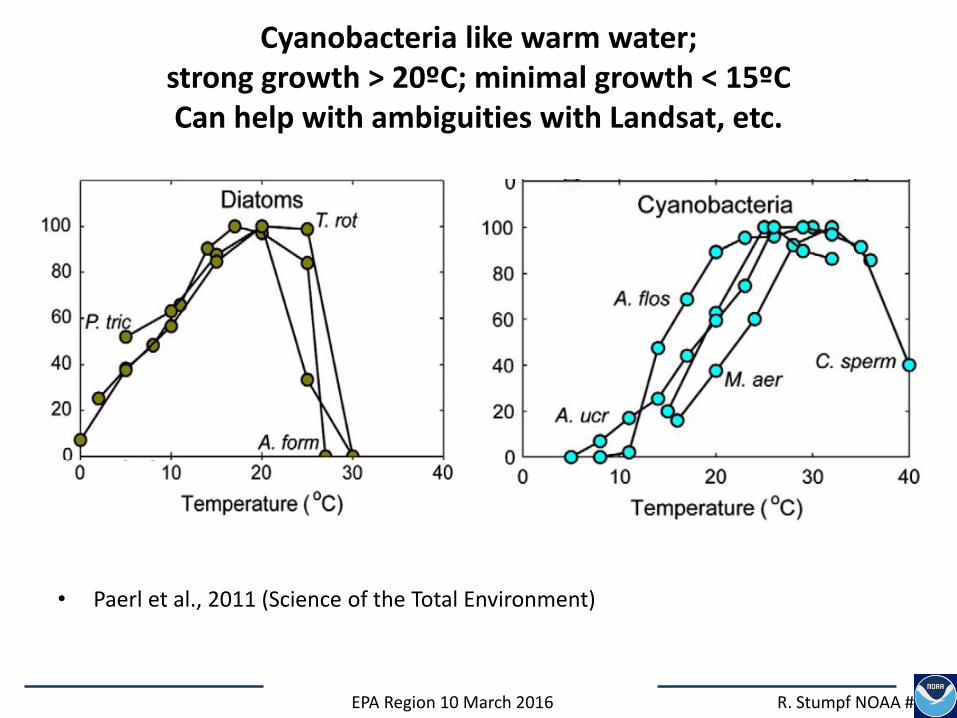
Cyanobacteria like warm water; strong growth > 20ºC; minimal growth < 15ºCCan help with ambiguities with Landsat, etc.
• Paerl et al., 2011 (Science of the Total Environment)

EPA Region 10 March 2016 R. Stumpf NOAA #16
Spring loads from Maumee River into Lake Erie
•Data from National Center for Water Quality Research
Maumee River average
discharge (m3/s)
dissolved phosphorus
load (m.tons)
total phosphorus
load (m.tons)

EPA Region 10 March 2016 R. Stumpf NOAA #17
Lake Erie. 13 years of
satellite data provide
bloom extent
Data from
MERIS 2002-2011,
MODIS 2012
high
medium
low

EPA Region 10 March 2016 R. Stumpf NOAA #18
Cyanobacterial biomass related to total bio-available phosphorus (TBP) load from Maumee River, Lake Erie

EPA Region 10 March 2016 R. Stumpf NOAA #19
2015 Forecast, depends on Heidelberg Univmonitoring program
Similar to 2013,
scale is worse than
2014.
What does this
mean?
Advanced warning
reduces risks.
Monitor lake
conditions.
EPA Region 10 March 2016 R. Stumpf NOAA #20
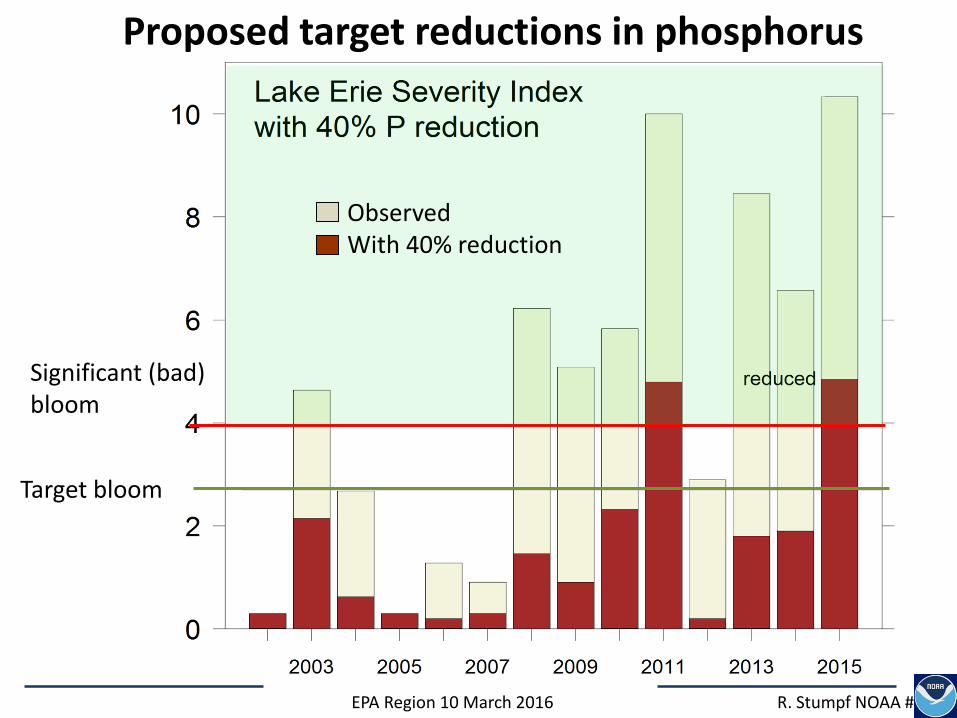
Target bloom
Significant (bad) bloom
ObservedWith 40% reduction
Proposed target reductions in phosphorus
EPA Region 10 March 2016 R. Stumpf NOAA #21
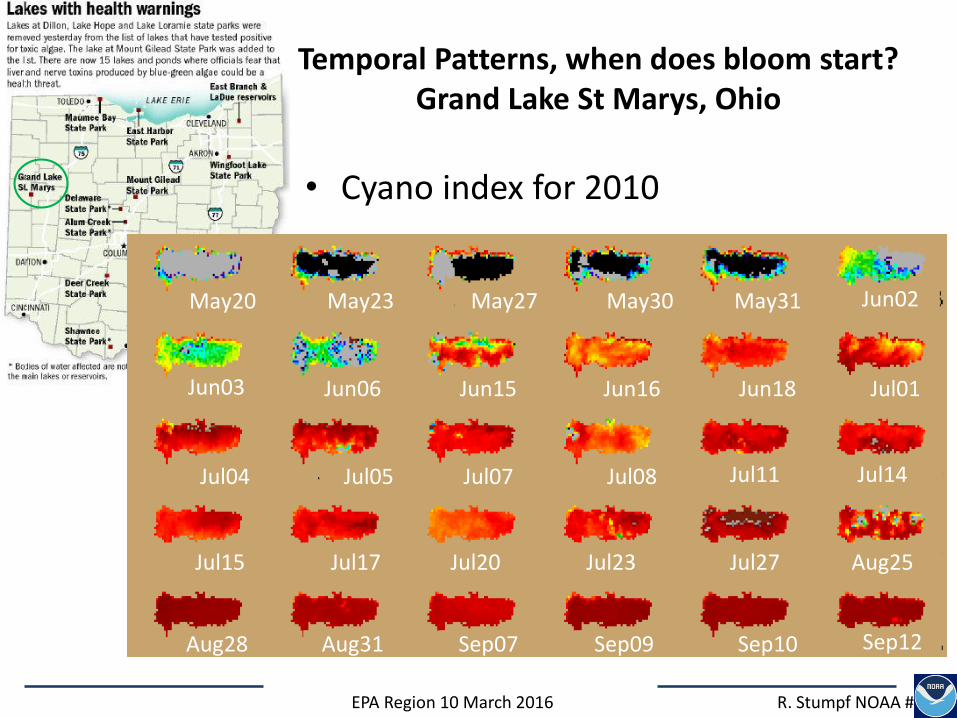
Temporal Patterns, when does bloom start?Grand Lake St Marys, Ohio
• Cyano index for 2010
Jul11
Jul27
Sep12
Jun15
Jun02
Jun16 Jun18 Jul01
May31
Jul05 Jul07 Jul08Jul04 Jul14
Jul15 Jul17 Jul20 Jul23 Aug25
Sep10Sep09Sep07Aug31Aug28
Jun06
May30May27May23
Jun03
May20
EPA Region 10 March 2016 R. Stumpf NOAA #22
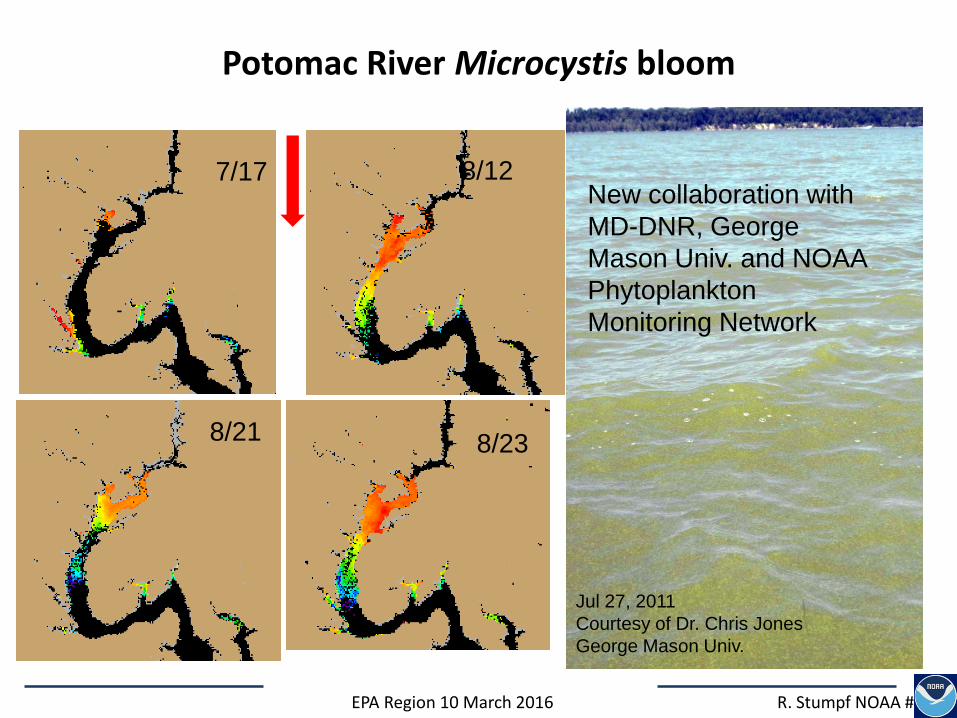
Potomac River Microcystis bloom
7/17 8/12
8/21 8/23
Jul 27, 2011
Courtesy of Dr. Chris Jones
George Mason Univ.
Improved CI
New collaboration with
MD-DNR, George
Mason Univ. and NOAA
Phytoplankton
Monitoring Network

EPA Region 10 March 2016 R. Stumpf NOAA #23
Compare chl-a in lakes over time
(2 ½ years)
MERIS Field
EPA Region 10 March 2016 R. Stumpf NOAA #24
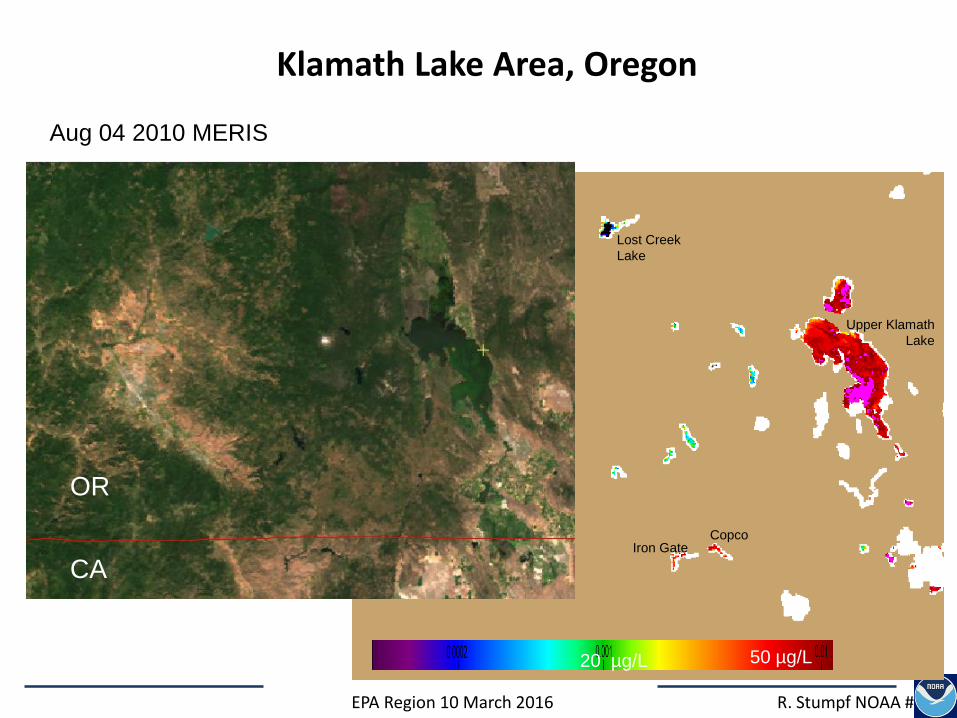
Klamath Lake Area, Oregon
Aug 04 2010 MERIS
Upper Klamath
Lake
Lost Creek
Lake
CopcoIron Gate
OR
CA
20 µg/L 50 µg/L

EPA Region 10 March 2016 R. Stumpf NOAA #25
Klamath River (California) reservoirs.
MERIS composites
Aug 11-20, 2010 top
Feb 1-10, 2011 bottom
Iron Gate
Copco
20 µg/L 50 µg/L
EPA Region 10 March 2016 R. Stumpf NOAA #26
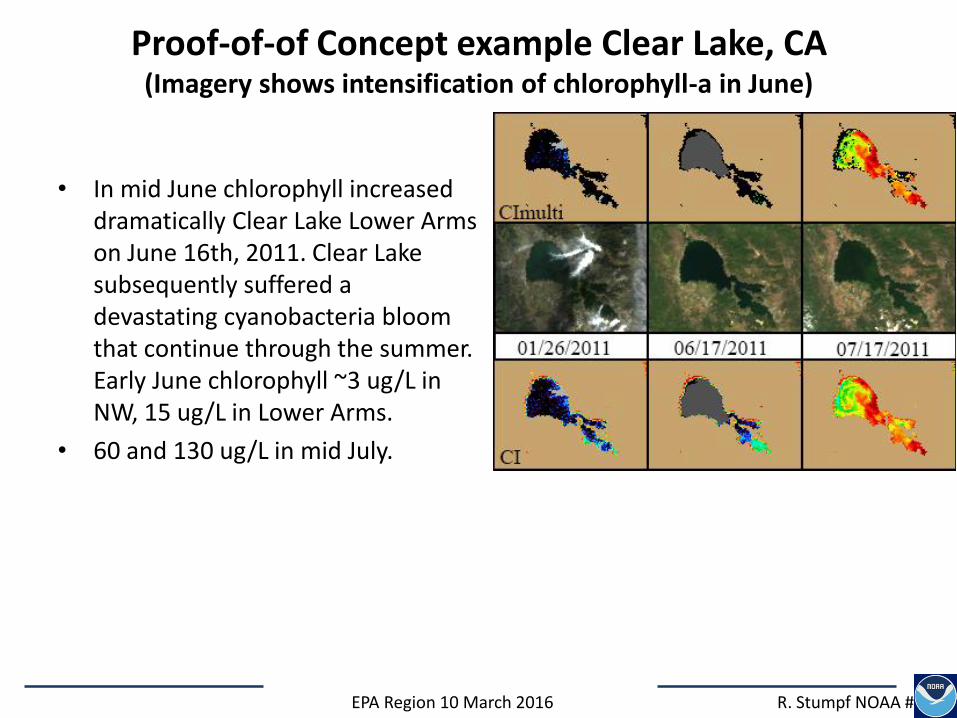
Proof-of-of Concept example Clear Lake, CA(Imagery shows intensification of chlorophyll-a in June)
• In mid June chlorophyll increased dramatically Clear Lake Lower Arms on June 16th, 2011. Clear Lake subsequently suffered a devastating cyanobacteria bloom that continue through the summer. Early June chlorophyll ~3 ug/L in NW, 15 ug/L in Lower Arms.
• 60 and 130 ug/L in mid July.
EPA Region 10 March 2016 R. Stumpf NOAA #27
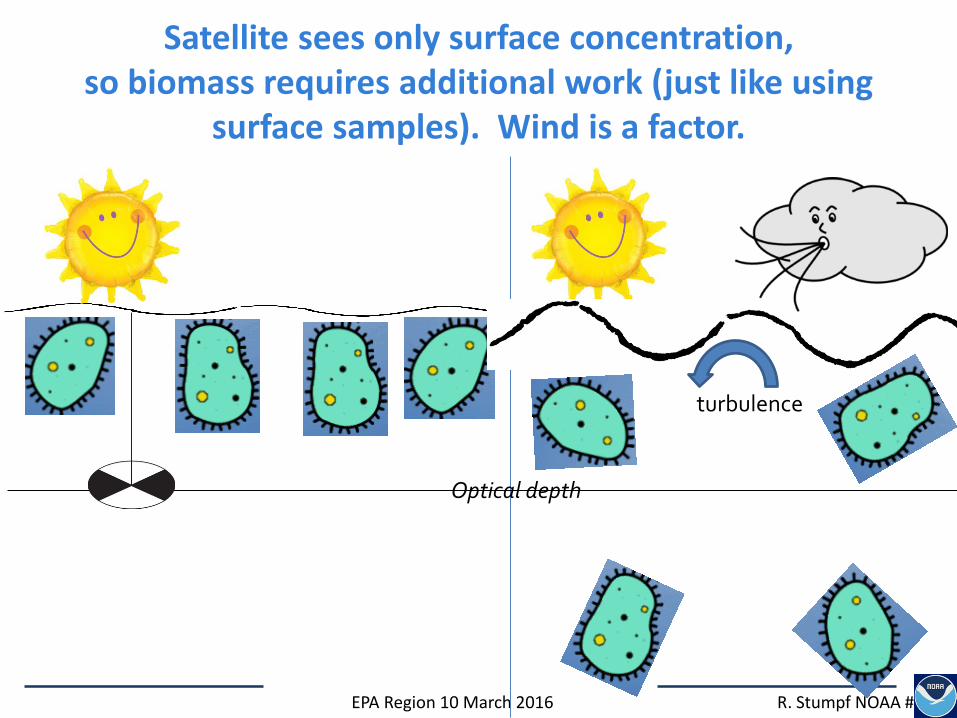
Satellite sees only surface concentration, so biomass requires additional work (just like using
surface samples). Wind is a factor.
Optical depth
turbulence

EPA Region 10 March 2016 R. Stumpf NOAA #28
Satellite sees either surface scum or surface concentration. Avoid “averaging” buoyant blooms
mild wind Mod. wind Mild wind Strong wind
Image totals
Wind stress
Figure from
Wynne et al., 2013)
EPA Region 10 March 2016 R. Stumpf NOAA #29
Satellite data
• Buoyant cyanos can cause a major problem with satellite statistics. (also with surface water samples)
• Calm day, high surface concentration
• Windy day, low surface concentration
Simple time-averaging will give inconsistent estimates of bloom severity with ALL algorithms. (worse with scum-specific algorithms, like floating algae index)
EPA Region 10 March 2016 R. Stumpf NOAA #30
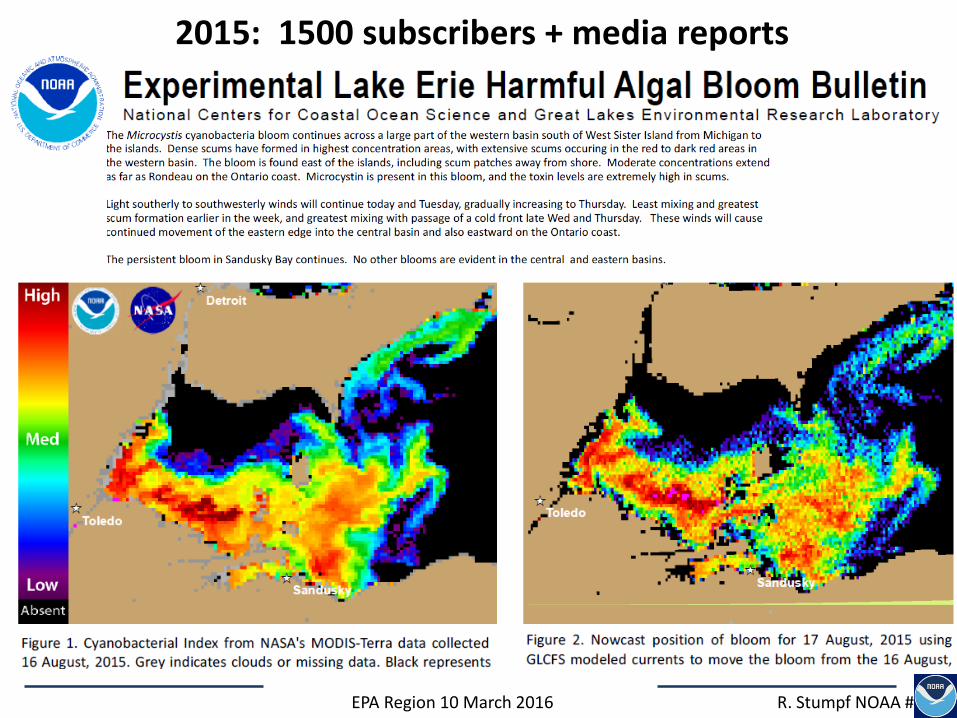
2015: 1500 subscribers + media reports

EPA Region 10 March 2016 R. Stumpf NOAA #31
Example: Satellite Health Bulletin
EPA Region 10 March 2016 R. Stumpf NOAA #32
Where from here?
• CyAN project is testing MERIS data sets for several states. – (More in Blake Schaeffer’s talk)
• OLCI (ocean land colour imager) launched February! – MERIS replacement– Monitoring with OLCI, retrospective with MERIS (2002-2012).
• Evaluating Landsat and Sentinel-2 (~30 m resolution). – Landsat may give eutrophic measure
• working on cyano likelihood.
– Less frequent, post season evaluation only (16-day Landsat, 10-day Sentinel-2 without clouds)
– Sentinel-2 may give estimation of bloom concentration (but not spectral discrimination of cyanos)
– Work in progress
EPA Region 10 March 2016 R. Stumpf NOAA #33
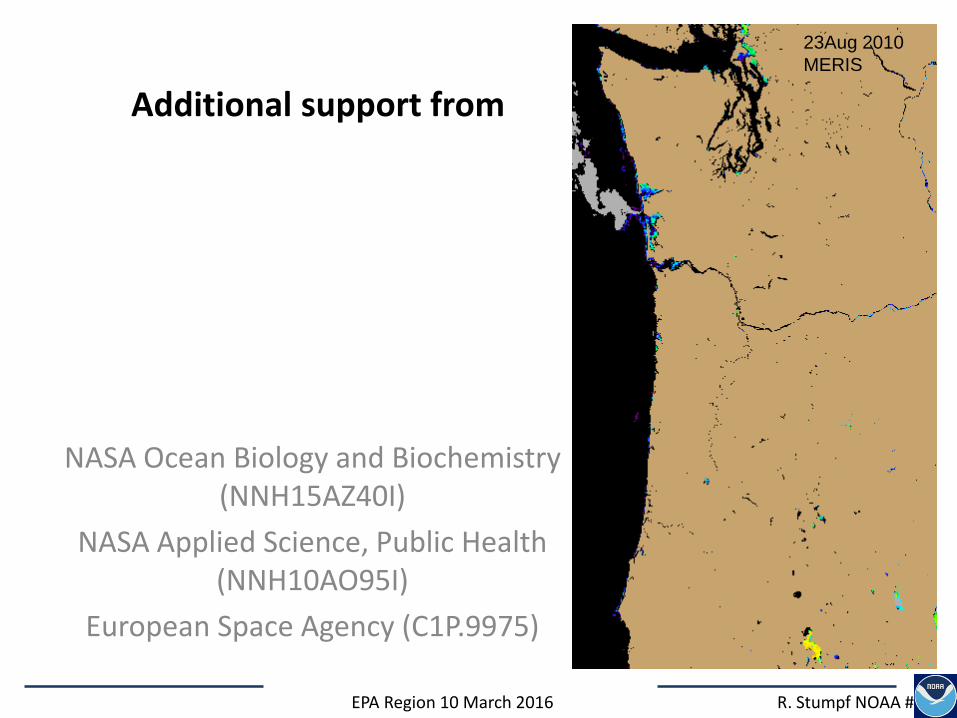
Additional support from
NASA Ocean Biology and Biochemistry (NNH15AZ40I)
NASA Applied Science, Public Health (NNH10AO95I)
European Space Agency (C1P.9975)
23Aug 2010
MERIS