Embed Size (px)
Citation preview

CUSTOMER SERVICE ENVIRONMENTAL AUDIT OF CITY OF
TSHWANE METROPOLITAN MUNICIPALITY: REGIONS 5 AND 7
Study commissioned by
CITY OF TSHWANE METROPOLITAN MUNICIPALITY Customer Relations Management Division
Study conducted by
B U R E A U O F M A R K E T R E S E A R C H College of Economic and Management Sciences
Project Owner
CUSTOMER RELATIONS MANAGEMENT DIVISION: CITY OF TSHWANE

CUSTOMER SERVICE ENVIRONMENTAL AUDIT OF CITY OF TSHWANE
METROPOLITAN MUNICIPALITY: REGIONS 5 AND 7
May 2012
Study commissioned by
CITY OF TSHWANE METROPOLITAN MUNICIPALITY Customer Relations Management Division
Compiled by
Prof DH Tustin (Executive Research Director)
Prof AA Ligthelm (Research Director) Ms M Goetz (Senior Research Coordinator)
BUREAU OF MARKET RESEARCH College of Economic and Management Sciences
Project Owner
CUSTOMER RELATIONS MANAGEMENT DIVISION: CITY OF TSHWANE
CR036 Pretoria
2012

ACKNOWLEDGEMENTS
The following individuals have contributed to the completion of this research project: Ms M Khaebana (Executive Director: Customer Relations Management Division, Corporate
and Shared Services Department - City of Tshwane)
Ms M Oosthuizen (Deputy Director: Customer Relations Strategy and Process Development - City of Tshwane)
Ms NJ Leriba (Bureau of Market Research: Data capturing)
Ms C Kemp (Bureau of Market Research: Language Editing)
Ms E Koekemoer (Bureau of Market Research: Report typing)
Ms M Goetz and Ms P de Jongh (Bureau of Market Research: Report typing, technical layout, data editing, cleaning and analysis)
Other City of Tshwane officials who played a key role in the success of the project:
Survey Projects Committee
Kishore Bedhesi; Barry Gerber; Melato Chikane; Pieter Cronje; Nico Manyelo; Nkagi Ndlovu; Willemien Hamman; Motladiile Zungu; Veronica Selatole; Thandi Madi; Aubrey Baloyi; Victor Seroka; Prudence Maisela; Terrence Melly;
Region 5 Regional Executive Director: Adv Frederick Lekwane; Goodwill Rahotsi; Veronica Selatole;
Region 7 Regional Executive Director: Oscar Moalusi; Aubrey Baloyi; Thandi Madi; Nonhlanhla S. Magagula; Prudence Maisela
Fieldworkers conducting intercept interviews at customer care walk-in centres/pay points in
regions 5 and 7
City of Tshwane personnel at all the customer interaction points in regions 5 and 7
Interviewers conducting computer-aided telephone interviews
Participating CoT customers
Councillors in regions 5 and 7
Language Services, Strategic Communication Division; Communication, Marketing and Events
The Customer Relations Management Division of the City of Tshwane would like to thank Prof
Deon Tustin and Prof André Ligthelm of the Bureau of Market Research for sharing their
knowledge and experience with us and for once again conducting a professional and exceptional
survey.
Exclusion of claims. Despite all efforts to ensure accuracy in the assembly of information and
data or the compilation thereof, the BMR is unable to warrant the accuracy of the information,
data and compilations as contained in its reports or any other publication for which it is
responsible. Readers of all the publications referred to above are deemed to have waived and
renounced all rights to any claim against Unisa and the BMR, its officers, project committee
members, servants or agents for any loss or damage of any nature whatsoever arising from any

use or reliance upon such information, data or compilations.

i
TABLE OF CONTENTS Page LIST OF TABLES .............................................................................................................................. iii LIST OF FIGURES ............................................................................................................................ iv LIST OF EXHIBITS ............................................................................................................................. v EXECUTIVE SUMMARY .................................................................................................................. vi CHAPTER 1: INTRODUCTION AND STUDY OBJECTIVE 1.1 INTRODUCTION ............................................................................................................... 1 1.2 OBJECTIVE OF THE STUDY ............................................................................................... 2 1.3 OUTLINE OF THE REPORT ................................................................................................ 2 CHAPTER 2: SURVEY METHODOLOGY 2.1 INTRODUCTION ............................................................................................................... 3 2.2 RESEARCH SCOPE ............................................................................................................ 3 2.3 QUANTITATIVE RESEARCH .............................................................................................. 4 2.3.1 Survey population ........................................................................................................... 4 2.3.2 Sampling plan .................................................................................................................. 4 2.3.3 Sample size ...................................................................................................................... 5 2.3.4 Research instrument ....................................................................................................... 6 2.3.5 Fieldwork ......................................................................................................................... 7 2.3.6 Data coding and capturing .............................................................................................. 7 2.4 QUALITATIVE PHASE ....................................................................................................... 7 2.5 CONCLUDING REMARKS ................................................................................................. 7

ii
CHAPTER 3: RESEARCH ANALYSIS 3.1 INTRODUCTION ............................................................................................................... 8 3.2 RESPONDENT PROFILE .................................................................................................... 8 3.3 CUSTOMER INTERACTION ............................................................................................. 10 3.4 PERSONAL INTRACTION WITH THE CoT ....................................................................... 14 3.4.1 Customer satisfaction ................................................................................................... 21 3.5 TELEPHONIC INTERACTION WITH THE CoT .................................................................. 32 3.6 e-MAIL CORRESPONDENCE WITH THE CoT .................................................................. 36 3.7 MUNICIPAL ACCOUNT PAYMENTS ............................................................................... 38 3.8 CUSTOMER RIGHTS ....................................................................................................... 40 3.9 QUALITATIVE RESEARCH ............................................................................................... 42 3.10 CONCLUSION ................................................................................................................. 44 3.11 CLOSURE ........................................................................................................................ 48

iii
LIST OF TABLES
Table Page
2.1 SAMPLE SIZE ....................................................................................................................... 6 3.1 SAMPLE POPULATION BY REGION AND CUSTOMER TYPE ............................................... 8 3.2 SAMPLE POPULATION BY REGION AND SURVEY TYPE .................................................... 9 3.3 NATURE OF INTERACTION BY REGION ........................................................................... 12 3.4 CUSTOMER CARE WALK-IN CENTRES/PAYPOINTS MOST RECENTLY VISITED BY BY REGION ....................................................................................................................... 15 3.5 AWARENESS OF OTHER CUSTOMER CARE WALK-IN CENTRES/PAYPOINTS BY REGION ............................................................................................................................. 16 3.6 CUSTOMER AWARENESS OF OTHER CUSTOMER CARE WALK-IN CENTRES/ PAYPOINTS IN- AND OUTSIDE SURVEY REGIONS ........................................................... 17 3.7 OTHER INTER-REGION CUSTOMER CARE WALK-IN CENTRES/PAYPOINTS USED BY REGION .............................................................................................................. 18 3.8 OTHER CUSTOMER CARE WALK-IN CENTRES/PAYPOINTS USED BY REGION ............... 19 3.9(a) AVERAGE SATISFACTION RATING SCORES FOR PAYPOINT CONSTRUCTS/ ATTRIBUTES BY REGION .................................................................................................. 22 3.9(b) AVERAGE SATISFACTION RATING SCORES FOR PAYPOINT CONSTRUCTS/ ATTRIBUTES BY CUSTOMER TYPE ................................................................................... 25 3.10 CUSTOMER SATISFACTION RATINGS WITH CoT’s HANDLING TELEPHONIC REQUESTS/COMPLAINTS ................................................................................................. 34 3.11(a) PAYMENT METHODS USED ............................................................................................. 39 3.11(b) PAYMENT METHODS PREFERRED ................................................................................... 39 3.12 PERCENTAGE OF CUSTOMERS IN RATING GROUPS REGARDING CUSTOMER RIGHTS .............................................................................................................................. 41
iv
LIST OF FIGURES
Figure Page
3.1 TYPE OF INTRACTIONS WITH CoT BY REGION ................................................................ 11 3.2 PROXIMITY OF CUSTOMER CARE WALK-IN CENTRES/PAYPOINTS ................................ 14 3.3 OVERALL CUSTOMER SATISFACTION RATINGS FOR PERSONAL INTERACTION BY REGION ........................................................................................................................ 29 3.4 MAGNITUDE OF CUSTOMER SATISFACTION FOR PERSONAL INTERACTION BY REGION ....................................................................................................................... 30 3.5 AWARENESS AND USAGE OF CoT TOLL-FREE NUMBER ................................................. 33 3.6 OVERALL CUSTOMER SATISFACTION RATINGS WITH CoT’S HANDLING OF TELEPHONE REQUESTS/COMPLAINTS ............................................................................ 35 3.7 SERVICE EXPERIENCE OF CUSTOMERS CORRESPONDING WITH CoT VIA e-MAIL ......... 37 3.8 OVERALL CUSTOMER SATISFACTION RATINGS WITH CoT IN HANDLING e-MAIL REQUESTS/COMPLAINTS .................................................................................... 37

v
LIST OF EXHIBITS
Exhibit Page
3.1 TOP AND BOTTOM SATISFACTION ITEMS BY REGION ................................................... 24 3.2 TOP AND BOTTOM SATISFACTION ITEMS BY CUSTOMER TYPE .................................... 27 3.3 TOP AND BOTTOM SATISFACTION ITEMS BY REGION AND CUSTOMER TYPE .............. 28 3.4 MAJOR REASONS FOR AVERAGE AND BELOW AVERAGE SERVICE EXPERIENCE ...................................................................................................................... 31 3.5 MAJOR REASONS FOR AVERAGE AND BELOW AVERAGE TELEPHONIC SERVICE EXPERIENCE ....................................................................................................... 35 3.6 AVERAGE CUSTOMER RATINGS REGARDING CUSTOMER RIGHTS ................................ 42

vi
EXECUTIVE SUMMARY
Background Following past trends in the private sector, heightened customer expectations of service quality
and standards have also emerged in the public sector, providing a sound rationale for the
Customer Relations Management Division of the City of Tshwane (CoT) to conduct a research
study on service quality and standards. In fact, the Customer Relations Management Division of
the CoT has taken the lead in conducting customer satisfaction studies since 2009.
After the local municipal elections in May 2011 the Metsweding District Municipality, Kungwini
Local Municipality and Nokeng Tsa Taemane Local Municipality merged with the City of
Tshwane. Previous customer satisfaction studies included only the pre-election demarcated
geographic areas within the CoT. The newly incorporated areas were added to the City of
Tshwane as Region 5 and Region 7 and resulted in changes in the regional borders and existing
wards. These expanded geographic boundaries and resulting changes created a need for
information on public service quality and standards within the newly established regions.
Consequently, the CoT Customer Relations Management Division commissioned the Bureau of
Market Research (BMR) at the University of South Africa (Unisa) to conduct a customer service
quality audit in regions 5 and 7. The aim of the study is to establish customers’ needs and
satisfaction ratings with regard to the standard and quality of services rendered at the different
CoT service interaction points (customer care walk in centre/paypoints ) in regions 5 and 7 and
to inform the planning of the intended new CoT customer satisfaction survey envisaged for
2013.
A service quality audit was conducted in the second quarter of 2012 among 359 customers
serviced across nine different customer care walk-in centres/paypoints within regions 5 and 7.
The research study included a primary survey among both households (90.5% of survey
population) and businesses (9.5% of survey population). These sample units were incorporated
into the research survey that incorporated a combination of computer-aided telephone (25.6%
of survey sample) and paypoint intercept (74.4% of survey sample) interviews to collect

vii
relevant customer data across regions 5 (45.7% of survey sample) and 7 (54.3% of survey
sample). The research methodology resulted in the majority of customers being interviewed
personally at customer care walk-in centres/paypoints (90.3%). However, the research model
designed for the study also ensured the inclusion of customers’ views on service quality and
standards experienced primarily during telephone (7.5% of survey population) and e-mail (2.2%
of survey population) communication with the CoT.
Research analysis When analysing the survey findings among those customers who interacted with the CoT
during the preceding 12 months, it is evident that almost half the customers who were
interviewed, interacted primarily with the CoT to pay municipal accounts (47.6%). Other forms
of interaction included information (36.8%) and service (13.6%) requests and lodging of
complaints (1.9%).
Personal interaction Turning the attention to those customers whose most recent interaction with a CoT paypoint
was in person (90.3% of surveyed population), it is clear that most customers (73.2%) are
located fairly close (less than 5km or 30 minutes’ walking time) to a regional customer care
walk-in centre/paypoint. Of those customers who visited any of the nine customer care walk-in
centres/paypoints in regions 5 and 7 personally, approximately half (53.1%) indicated that they
are also aware of other customer care walk-in centres/paypoints besides the one visited most
recently. Of those aware of other customer care walk-in centres/paypoints, 69.2% also
confirmed that they had used other customer care walk-in centres/paypoints besides the one
visited most recently. This finding not only displays fairly high levels of awareness of other
customer care walk-in centres/paypoints in- and outside the survey regions but also supports
the aim of the survey to capture a broad picture on service quality and standards of multiple
customer care walk-in/paypoint interactions.

viii
With the primary focus of the study on customer satisfaction, the survey findings revealed an
overall ‘average’ satisfaction with service quality attributes such as facilities, account payment
processing, trading hours, counter staff and resolution of queries/complaints. Figure A1 shows
the average satisfaction scores for each service attribute separately where ‘1’ = very dissatisfied
and ‘5’ = very satisfied. It should be noted that the average satisfaction scores relate only to
the most recent personal interactions with at least one of the nine CoT customer care walk-in
centres/paypoints located within regions 5 and 7.
FIGURE A1
AVERAGE SATISFACTION WITH QUALITY OF SERVICE DELIVERY AT CoT CUSTOMER CARE
WALK-IN CENTRES/PAYPOINTS
3.25
3.48
4.31
3.95
3.37
3.63
3.17
3.38
3.91
3.98
2.80
3.52
3.22
3.42
4.08
3.97
3.03
3.56
0 1 2 3 4 5
Facilities
Processing account payments
Trading hours and accessibility
Counter staff
Dealing with queries/complaints
Total
Very dissatisfied Very satisfied
Total Region 7 Region 5
ix
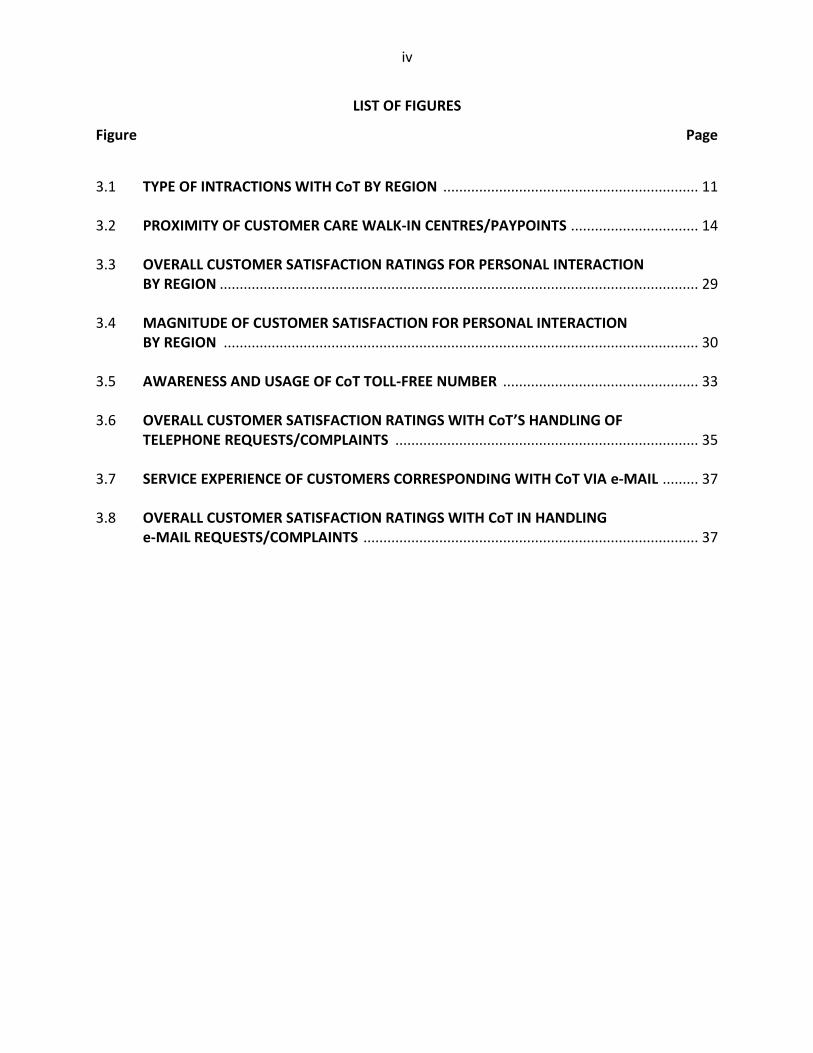
When comparing service attributes, the CoT’s ability to deal with queries and complaints
received a relatively low rating (average ratings score = 3.03) by customers who last visited a
customer care walk-in centre/paypoint in person. As a complaint is regarded as an expression
of dissatisfaction about the standard of service, action or lack of action affecting a customer,
this survey finding is cause for concern.
Exhibit A provides a detailed analysis of the top and bottom items among the 29 different
service attributes used to measure the satisfaction levels of customers regarding the quality of
service delivery.
EXHIBIT A
TOP AND BOTTOM SATISFACTION ITEMS BY REGION
Region 5 Region 7
Variable Score Variable Score
Top
Convenience of customer care walk-in centre/paypoint operating hours
Staff ability to pay attention to customer details
Cashier preciseness in handling money(receiving money/return appropriate change)
All paypoint stations are manned during CoT office hours
Staff friendliness
4.31 4.06
4.03
4.01 4.01
Staff appearance (neatly and appropriately dressed)
Staff friendliness
Promptness of cashiers in handling money
Cashier preciseness in handling money (receiving money/return appropriate change)
Staff skills to do jobs well
Staff ability to pay attention to customer details
4.44 4.12 4.11 4.09
4.05
4.03
Bo
tto
m
Promptness in resolving misallocations of a payment
Adequacy of parking facilities
Promptness in opening a new municipal service account
Promptness in providing details on water leakage
2.82 2.92
2.95 2.98
Promptness in providing details on water leakage
Adequacy of parking facilities
Promptness in resolving misallocations of a payment
Promptness in resolving complaints
Promptness in resolving service requests
Promptness in providing electricity/water consumption reading and financial details
Equipment
Resolving information requests on first contact
2.25 2.41
2.64 2.69 2.75 2.79
2.94
2.96
It is clear from exhibit A that certain counter staff attributes/skills in both regions
received fairly positive satisfaction ratings. However, from a strategic perspective, items

x
with low rating scores require priority attention. Service areas such as promptness in
resolving misallocations of payments, adequacy of parking facilities and promptness in
providing details on water leakages, should receive prompt attention to improve the
quality of future service delivery at CoT customer care walk-in centres/paypoints in both
regions 5 and 7.
The overall satisfaction scores for customers who last interacted with the CoT in person
at a paypoint, are shown in figure A2 by region.
FIGURE A2
OVERALL CUSTOMER SATISFACTION RATINGS
Although the average scores displayed in figure B generally seem satisfactory, a closer analysis
of the satisfaction category frequency distributions show some level of uncertainty and
dissatisfaction among customers in both regions 5 and 7. In this regard, 21.3% of customers
seem dissatisfied with the quality of service delivery at customer care walk-in
centres/paypoints while 17.9% perceive service delivery as ‘average’. A regional analysis shows
11.7 9.6 10.5
8.8
12.3 10.8
13.9
20.9
17.9
41.6
37.4 39.2
24.1
19.8 21.6
0
25
50
Region 5 Region 7 Total
%
Very dissatisfied Dissatisfied Average Satisfied Very satisfied
Average score = 3.45 Average score = 3.58 Average score = 3.51
xi
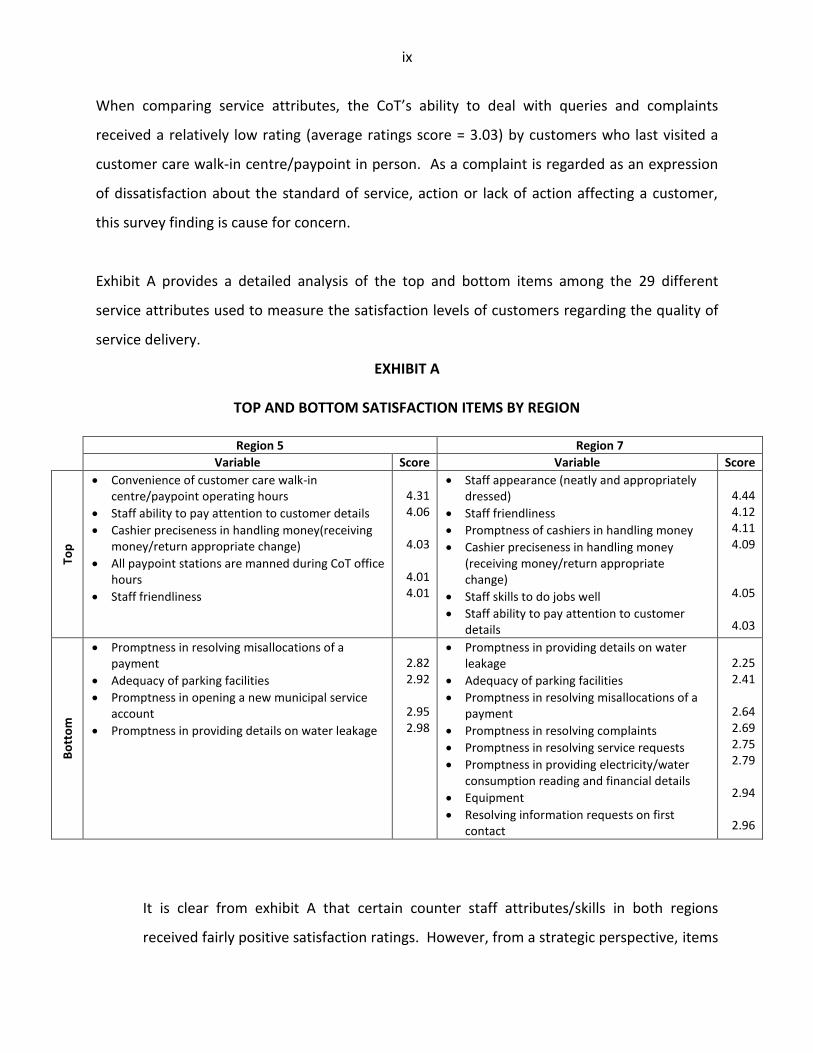
that approximately a third (34.3%) of customers in region 5 rated overall service delivery at
customer care walk-in centres/paypoints as ‘average’ (rating score of 3 out of 5) or were
‘dissatisfied’ (rating scores below 3) while about two in every five customers (42.8%) recorded
similar ratings (3 and below) in region 7. From a strategic planning perspective it is important
to elaborate on those service aspects about which customers are dissatisfied. These customer
complaints are thematically summarised in exhibit B by region.
EXHIBIT B
MAJOR REASONS FOR AVERAGE AND BELOW-AVERAGE SERVICE EXPERIENCE
Region Major concerns
Re
gio
n 5
(34
.3%
allo
cate
d a
vera
ge a
nd
dis
sati
sfie
d r
atin
gs)
Office facilities are old
Customer complaints not addressed immediately
Customers not served aptly
Electricity not reconnected despite being paid
High electricity rates
Slow RDP house allocation and maintenance
Incorrect accounts and inability to solve high accounts
People are placed in jobs for which they are not skilled
Poor road facilities
Public toilets are dirty
Water is not readily available
Unequal treatment of customers
Staff are not interested in assisting customers
Payment systems offline, which requires re-visit
Meter readings are ignored

xii
Re
gio
n 7
(42
.8%
allo
cate
d a
vera
ge a
nd
dis
sati
sfie
d r
atin
gs)
Account problems not solved in reasonable time
Staff lack commitment by implementing closure times well before actual closure
Close offices before official closing times
No service at point-of-sale during lunch time
Computer system/machines often offline, slow and broken
Long queues
No follow-up on complaints about electricity meter box
Customer complaints not addressed immediately
Application forms for change in ownership are lost
Referred from pillar to post without being serviced
No library services
High municipal rates
Statements do not reflect payments
Some staff not equipped to do a good job/not trained
Point-of-sale staff are stressed
Meter readings are ignored
Water leakage/meter complaints not addressed or take too long to address
Staff are self-centered and focus on their own rather than customers’ concerns
Street lights not fixed
Restricted parking
Library services closed without reason
Offices are small and not in good condition
Take long to respond to service request
Often referred to other customer care walk-in centres/paypoints
No follow-up on promised service
When comparing the experience of customers who last interacted with the CoT personally with
those who last interacted with the CoT via telephone or e-mail, higher satisfaction is evident
among customers who interacted with the CoT personally. This finding is displayed in figure A3.

xiii
FIGURE A3
COMPARATIVE CUSTOMER SATISFACTION RATINGS BY FORM OF INTERACTION
Telephonic interaction Almost a third (29.3%) of the computer-aided telephone interview (CATI) survey population last
interacted with the CoT via the Contact/Call Centre (012 358 9999). The experience of these
customers during their telephonic interaction are summarised in figure A4.
1
2
3
4
5
Personal interactionTelephone interaction
e-Mail interaction
3.51
2.37 2.50
Ver
y d
issa
tisf
ied
V
ery
sati
sfie
d

xiv
FIGURE A4
CUSTOMER SATISFACTION RATINGS FOR TELEPHONIC INTERACTION
A closer analysis of the research findings shows that 55.6% of customers who interacted with
the CoT telephonically were dissatisfied with the service experienced. The major reasons
advanced for dissatisfaction include:
wait too long before being assisted
promptness in resolving service requests
efficiency of requests/complaints follow-up
promptness in resolving complaints
Other major concerns raised by customers included the following:
addressing of previous complaints long overdue and no follow-up actions
call agents difficult to reach
call agents are rude
call agents are not helpful
1
2
3
4
5
Call Centre agentsDealing with
queries/complaintsTotal
2.58
2.10 2.37
Extr
emel
y d
issa
tisf
ied
Extr
emel
y sa
tisf
ied

xv
e-Mail interaction Almost one in every 10 (8.7%) of the CATI respondents last interacted with the CoT via e-mail.
The experiences of these customers through e-mail interaction are summarised in figure A5. It
is clear from the analysis that approximately 62.5% of customers were dissatisfied with the
CoT’s handling of e-mail requests/enquiries. When probed regarding the major reasons for
dissatisfaction, participating customers indicated that the CoT does not respond to e-mails nor
provide feedback on e-mail enquiries.
FIGURE A5
PERCENTAGE OF CUSTOMERS IN SATISFACTION RATING CATEGORIES
FOR CoT’s HANDLING OF e-MAIL REQUESTS/COMPLAINTS
Municipal account payment Besides measuring customer satisfaction, the survey also explored the current and preferred
methods of municipal account payments of participating customers. Although most customers
currently pay accounts at the cashier desk at customer care walk-in centres/paypoints (72.1%),
customers show keen interest in paying accounts at external paypoints and banks or
electronically via Internet banking in future.
0
25
50
Total
37.5
25.0 25.0
12.5
%
Very dissatisfied Dissatisfied Satisfied Very satisfied
Average score = 2.50

xvi
Customer rights The research model was also designed to measure customer views regarding the eight Batho
Pele principles aspired to by the CoT. These survey findings are presented in table A1. The
analysis shows that participating customers regard openness and transparency and value for
money as the most neglected principles. In turn, courtesy and access were identified as the
two best implemented principles.
TABLE A1
CUSTOMER RATINGS REGARDING CUSTOMER RIGHTS
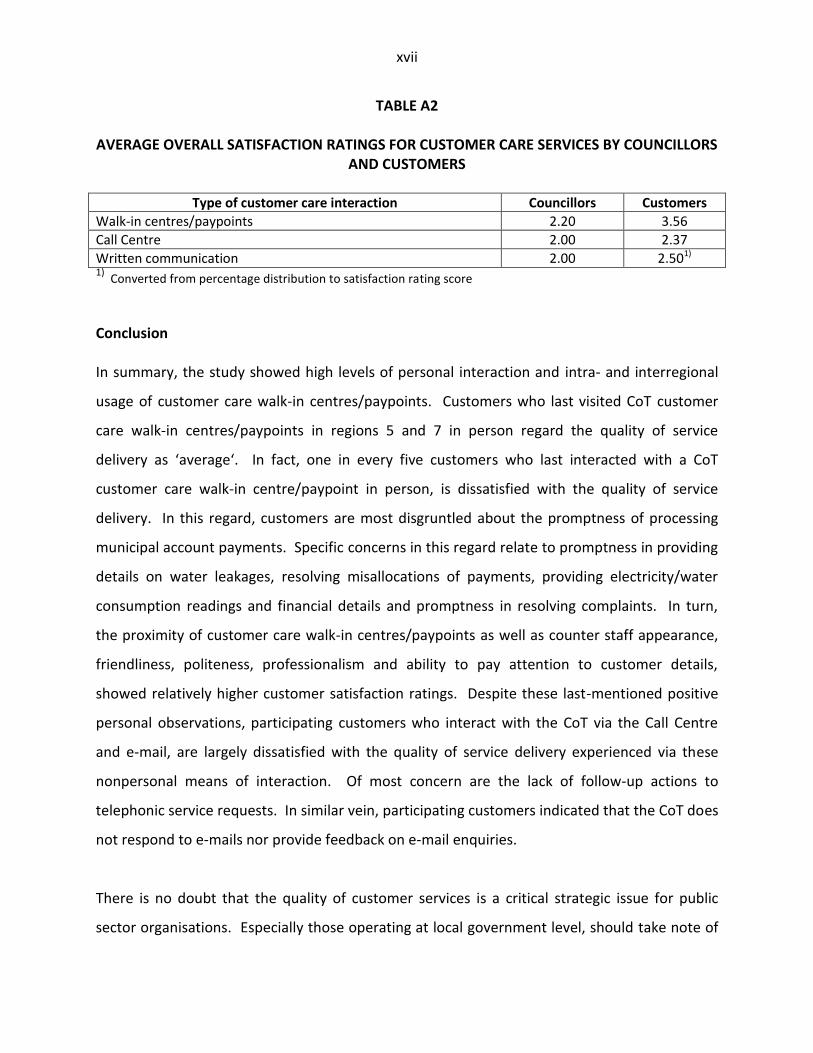
Councillor perspective Table A2 shows that the perceived levels of customer care satisfaction of councillors of regions
5 and 7, that ranged from 2.2 (out of 5) for walk-in centres to 2.0 for Call Centre and written
communication, are slightly lower than those reported by customers themselves.
Statements
Total
Disagree Neither agree
Agree
The Tshwane Municipality makes attempts to consult citizens about the services they need (consultation).
42.3 21.4 36.2
Citizens are told what level and quality of public services they can expect to receive (service standards)
40.9 21.7 37.3
All citizens have equal access to the services to which they are entitled (access) 27.3 26.7 46.0
Citizens are treated with courtesy and consideration (courtesy) 27.6 25.6 46.8
Citizens are given full, accurate information about the public services they are entitled to receive (information)
40.1 23.4 36.5
Citizens are told how services/departments are run, how much they cost and who is in charge (openness and transparency)
44.6 23.7 31.8
It is easy for citizens to lodge a complaint/enquiry (redress) 35.4 23.1 41.5
Citizens who pay for services get value for their money/CoT spends wisely (value for money) 40.9 25.6 33.4
xvii
TABLE A2
AVERAGE OVERALL SATISFACTION RATINGS FOR CUSTOMER CARE SERVICES BY COUNCILLORS AND CUSTOMERS
Type of customer care interaction Councillors Customers
Walk-in centres/paypoints 2.20 3.56
Call Centre 2.00 2.37
Written communication 2.00 2.501)
1) Converted from percentage distribution to satisfaction rating score
Conclusion In summary, the study showed high levels of personal interaction and intra- and interregional
usage of customer care walk-in centres/paypoints. Customers who last visited CoT customer
care walk-in centres/paypoints in regions 5 and 7 in person regard the quality of service
delivery as ‘average‘. In fact, one in every five customers who last interacted with a CoT
customer care walk-in centre/paypoint in person, is dissatisfied with the quality of service
delivery. In this regard, customers are most disgruntled about the promptness of processing
municipal account payments. Specific concerns in this regard relate to promptness in providing
details on water leakages, resolving misallocations of payments, providing electricity/water
consumption readings and financial details and promptness in resolving complaints. In turn,
the proximity of customer care walk-in centres/paypoints as well as counter staff appearance,
friendliness, politeness, professionalism and ability to pay attention to customer details,
showed relatively higher customer satisfaction ratings. Despite these last-mentioned positive
personal observations, participating customers who interact with the CoT via the Call Centre
and e-mail, are largely dissatisfied with the quality of service delivery experienced via these
nonpersonal means of interaction. Of most concern are the lack of follow-up actions to
telephonic service requests. In similar vein, participating customers indicated that the CoT does
not respond to e-mails nor provide feedback on e-mail enquiries.
There is no doubt that the quality of customer services is a critical strategic issue for public
sector organisations. Especially those operating at local government level, should take note of

xviii
and act on pressure to improve customer service on a continuous basis. Some pressure in the
public sector arises internally from a genuine desire by managers to improve the quality of
services while further pressure is imposed through initiatives like the White Paper on
Transforming Public Service Delivery or the so-called ‘Batho Pele’ White Paper that requires
from government departments to improve service delivery in terms of the eight ‘Batho Pele’
service delivery principles. In aspiring to these principles and in demonstrating its resolve to
improve service quality, the Customer Relations Management Division of the City of Tshwane
(CoT) initiated a customer satisfaction survey that presented customers with an opportunity to
provide their perceptions of service delivery and to express their expectations regarding service
quality. The fact that customers typically assess service quality by comparing the service they
actually experience with the service they expect, makes the outcome of this survey of strategic
importance for the CoT. The core survey findings emerging from the 2012 study in regions 5
and 7, display average to below-average satisfaction relative to the type of customer
interaction. The survey revealed key strategic focus areas that the CoT needs to address to
improve future customer satisfaction. It is recommended that the CoT, in regions 5 and 7, focus
primarily on those service items that recorded below-average satisfaction ratings among
customers who participated in the 2012 study. However, the success of any strategies will
depend on management’s commitment as well as the degree to which management proactively
resolves customer complaints through the involvement of the customer. It is therefore
recommended that customers should be consulted and involved when determining service
quality standards and measurement.

1
CHAPTER 1
INTRODUCTION AND STUDY OBJECTIVE 1.1 INTRODUCTION
The incorporation of the Metsweding District Municipality, the Nokeng Tsa Taemane
Local Municipality and the Kungwini Local Municipality into the City of Tshwane (CoT)
created several challenges with regard to the merger of the customer care services
(CCS) functions of the various institutions. Some of these challenges relate to different
CCS systems/procedures followed in the various municipalities prior to the merger,
differences in tariff/cost structures for municipal services, variations in human resources
capacities (levels of staffing) and the strong rural orientation of the newly-incorporated
areas compared to the metropolitan structures of the CoT. The latter may also affect
the capacity of households and businesses to afford the increased tariff structures of
municipal services.
Satisfaction with CCS in the pre-merger five regions of the CoT was measured in an
extensive customer satisfaction survey in January/February 2011. The 2011 study focus
was on satisfaction with services provided by the customer call centre, walk-in centres
and written communication with the CoT. The study in the newly-incorporated regions
(new regions 5 and 7) would not only put the two new regions on par with the previous
CoT regions but would also be valuable in establishing empirically what the needs,
expectations and satisfaction are with regard to customer care provision and service
delivery. Furthermore, the value of such research is important especially in an
environment where different systems and expectations have to be accommodated.
2
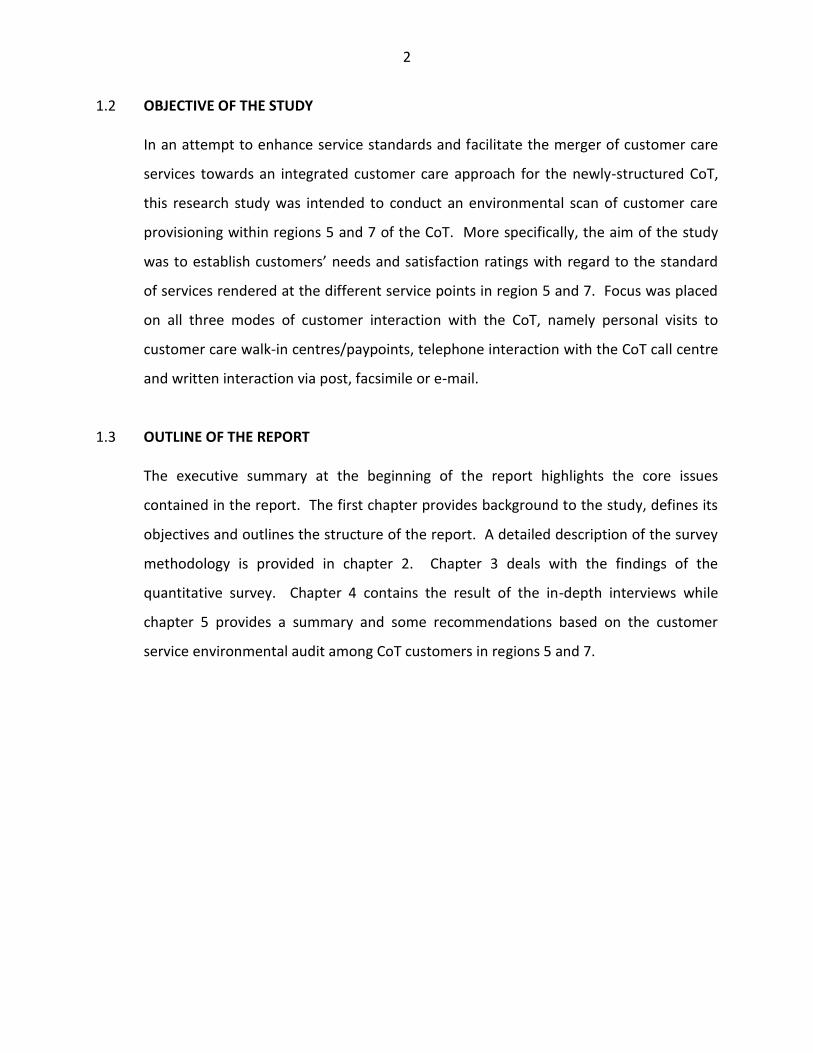
1.2 OBJECTIVE OF THE STUDY
In an attempt to enhance service standards and facilitate the merger of customer care
services towards an integrated customer care approach for the newly-structured CoT,
this research study was intended to conduct an environmental scan of customer care
provisioning within regions 5 and 7 of the CoT. More specifically, the aim of the study
was to establish customers’ needs and satisfaction ratings with regard to the standard
of services rendered at the different service points in region 5 and 7. Focus was placed
on all three modes of customer interaction with the CoT, namely personal visits to
customer care walk-in centres/paypoints, telephone interaction with the CoT call centre
and written interaction via post, facsimile or e-mail.
1.3 OUTLINE OF THE REPORT
The executive summary at the beginning of the report highlights the core issues
contained in the report. The first chapter provides background to the study, defines its
objectives and outlines the structure of the report. A detailed description of the survey
methodology is provided in chapter 2. Chapter 3 deals with the findings of the
quantitative survey. Chapter 4 contains the result of the in-depth interviews while
chapter 5 provides a summary and some recommendations based on the customer
service environmental audit among CoT customers in regions 5 and 7.

3
CHAPTER 2
SURVEY METHODOLOGY 2.1 INTRODUCTION
This chapter elaborates on the research methodology applied during the execution of
the customer service environmental audit in regions 5 and 7. The discussion provides a
basis for the scientific foundation of the study and hence the quality, validity and
reliability of the survey findings.
2.2 RESEARCH SCOPE
A multidimensional research method, applying both quantitative and qualitative
methods, was used in conducting the research. These methodologies target different
target groups that are explained in more detail below. Prior to this discussion, it ought
to be mentioned that the design of the research model for the study in CoT regions 5
and 7 was preceded by extensive exploratory research. These activities included the
following:
Discussions with representatives of the former municipalities and the CoT with
regard to the vision, mission and roles of customer relations management.
Secondary research on the service delivery profile and responsibilities of the
customer service regime of the CoT.
Analysis of the customer care service satisfaction measurement of the CoT in
2009 and 2011.
Proper environmental scan of the situation in regions 5 and 7 to ensure an
appropriate approach towards information gathering.
4
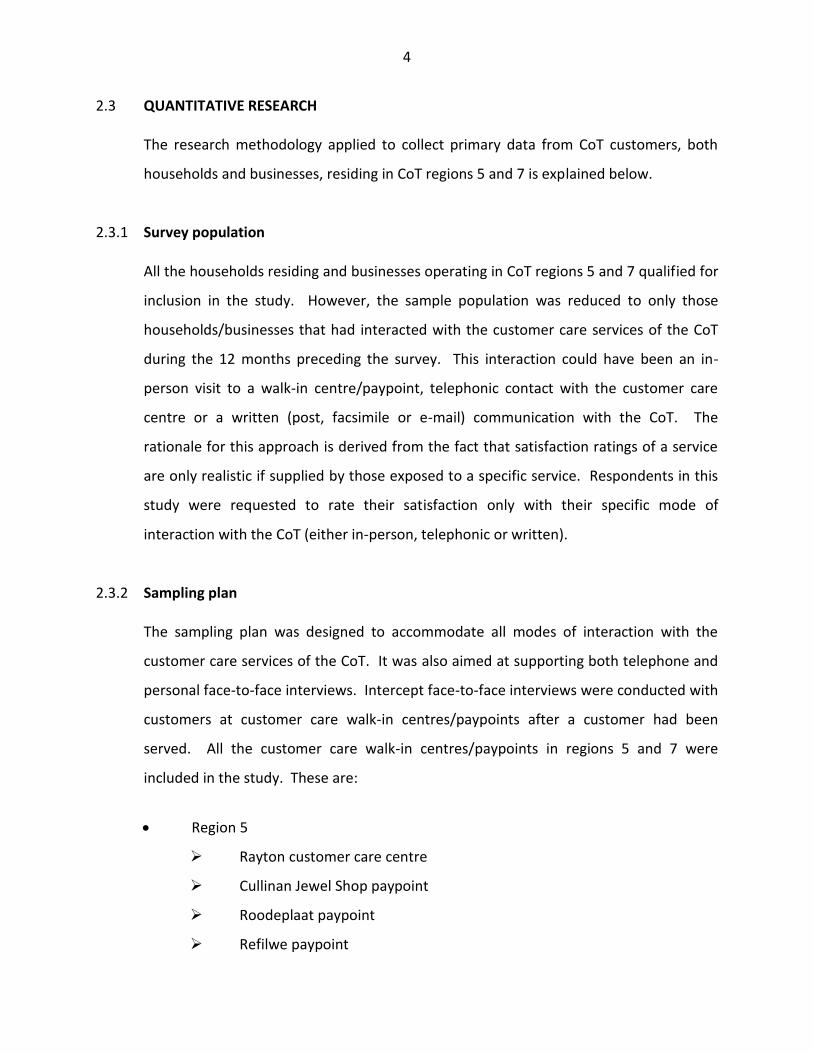
2.3 QUANTITATIVE RESEARCH
The research methodology applied to collect primary data from CoT customers, both
households and businesses, residing in CoT regions 5 and 7 is explained below.
2.3.1 Survey population
All the households residing and businesses operating in CoT regions 5 and 7 qualified for
inclusion in the study. However, the sample population was reduced to only those
households/businesses that had interacted with the customer care services of the CoT
during the 12 months preceding the survey. This interaction could have been an in-
person visit to a walk-in centre/paypoint, telephonic contact with the customer care
centre or a written (post, facsimile or e-mail) communication with the CoT. The
rationale for this approach is derived from the fact that satisfaction ratings of a service
are only realistic if supplied by those exposed to a specific service. Respondents in this
study were requested to rate their satisfaction only with their specific mode of
interaction with the CoT (either in-person, telephonic or written).
2.3.2 Sampling plan
The sampling plan was designed to accommodate all modes of interaction with the
customer care services of the CoT. It was also aimed at supporting both telephone and
personal face-to-face interviews. Intercept face-to-face interviews were conducted with
customers at customer care walk-in centres/paypoints after a customer had been
served. All the customer care walk-in centres/paypoints in regions 5 and 7 were
included in the study. These are:
Region 5
Rayton customer care centre
Cullinan Jewel Shop paypoint
Roodeplaat paypoint
Refilwe paypoint

5
Region 7
Bronkhorstspruit customer care centre
Zithobeni paypoint
Rethabiseng paypoint
Ekangala paypoint
Dark City paypoint
These interviews ensured that customers without access to Telkom telephones were
included in the sample.
The intercept interviews at walk-in centres were supplemented with CATI (Computer-
Aided Telephone) interviews. These interviews were aimed at capturing the level of
satisfaction of customers more inclined to interact telephonically and through
post/facsimile/e-mail with the CoT. The following subpopulations were identified for
this purpose:
Households in Bronkhorstspruit
Households in Cullinan/Rayton
Businesses in regions 5 and 7
The Bronkhorstspruit and Cullinan portions of the Pretoria 2011/2012 telephone
directory were used to randomly select households for interviewing. The business
information provided by the CoT was used to randomly select businesses in
Bronkhorstspruit, Cullinan and Rayton for interviews.
2.3.3 Sample size
Table 2.1 shows the distribution of the 360 interviews. In total, 30 interviews were
conducted in each of the selected areas/customer care centres. This resulted in a total
of 270 intercept face-to-face interviews and 90 telephone interviews.

6
TABLE 2.1
SAMPLE SIZE Sample Sample size
(a) Intercept survey (i) Region 5
Rayton customer care centre
Cullinan Jewel Centre paypoint
Roodeplaat, Kameeldrift East paypoint
Refilwe paypoint
270
30 30 30 30
(ii) Region 7
Bronkhorstspruit customer care centre
Zithobeni paypoint
Rethabiseng paypoint
Ekangala paypoint
Dark City paypoint
30 30 30 30 30
(b) CATI interviews
Bronkhorstspruit
Cullinan/Rayton
Businesses regions 5 and 7
90 30 30 30
Total 360
2.3.4 Research instrument
Structured survey questionnaires were designed to measure satisfaction levels and
reasons for dissatisfaction regarding the main CCS delivery aspects of each of the main
customer communication modes (in-person, telephone and written). The design and
structure of the questionnaires used in this study were shaped and guided mainly by the
content of questionnaires used in the previous CoT studies. The rating scale in these
questionnaires used a 5-point Likert scale compared to the 10-point numerical scale
used in previous questionnaires.
Prior to final approval, the questionnaire was circulated among relevant staff in the CoT
for scrutiny, inputs and recommendations. Finally, the questionnaire was transformed
into a Web-based format for conducting the CATI interviews.
2.3.5 Fieldwork
Fieldworkers for the intercept survey were recruited by the CoT while experienced BMR
CATI interviews concluded the CATI interviews. The fieldworkers were trained by the
BMR.

7
The interviews were conducted during the period 26 April 2012 to 11 May 2012.
Although no major problems were experienced during the fieldwork process, it should
be noted that the initial training session and some interviews had to be rescheduled due
to unrest experienced at Ekangala in particular.
2.3.6 Data coding and capturing
The CATI survey approach allowed for electronic data capturing. Face-to-face
questionnaires were coded prior to data capturing. Upon completion of data capturing,
all data were merged into a single dataset. Final electronic editing and verification
checks were conducted prior to storing the data for analysis purposes. In addition,
during the editing process, all open-ended responses (dissatisfaction with service
delivery) were thematically coded.
2.4 QUALITATIVE PHASE
The findings of the survey were summarised in a discussion guide. This guide was
intended to be used for a focus group discussion with ward councillors of regions 5 and
7. Due to logistical and other reasons, the focus group discussion was substituted with
individual in-depth interviews with the councillors. A short questionnaire reflecting on
the councillors’ perception of service delivery levels at customer centres/paypoints, the
Call Centre and communication through written means, was also completed by
councillors.
2.5 CONCLUDING REMARKS
This chapter provides an overview of the research methodology for the customer
service environmental audit among CoT customers of regions 5 and 7 conducted among
360 customers. The outcomes of the research findings are presented in chapter 3.

8
CHAPTER 3
RESEARCH ANALYSIS
3.1 INTRODUCTION
This chapter presents the findings emerging from the 2012 CoT service quality audit
survey among 359 customers (households and businesses). To better contextualise the
findings emerging from the intercept and computer-aided telephonic surveys, the
chapter commences with an overview of the survey participants across the sampled
regions. This overview is followed by a presentation of the outcome of the research
findings. Finally, the chapter concludes with a summary and some recommendations
based on the research findings.
3.2 RESPONDENT PROFILE This section presents an overview of the survey population according to selected
research constructs. Firstly, table 3.1 presents an overview of the survey participants
according to region and customer type.
TABLE 3.1
SAMPLE POPULATION BY REGION AND CUSTOMER TYPE
Region
Customer type
Household Business Total
n % n % n %
Region 5 148 90.2 16 9.8 164 100.0
Region 7 177 90.8 18 9.2 195 100.0
Total 325 90.5 34 9.5 359 100.0
Table 3.1 shows that the sample population comprised 325 (or 90.5%) households and
34 (or 9.4%) businesses. In total, 359 customers were interviewed. Of these,
approximately a quarter (25.6%) were interviewed telephonically (computer-aided
telephone interviews - CATI) while 267 (or 74.4%) of the customers were interviewed at

9
CoT customer care walk-in centres/pay points using intercept interviews. Of the total
sample, 45.7% of all participating customers were interviewed in region 5 while 54.3%
were interviewed in region 7. The distribution of the total sample by region and survey
type is displayed in more detail in table 3.2.
TABLE 3.2
SAMPLE POPULATION BY REGION AND SURVEY TYPE
Region
Survey type
CATI survey Intercept survey Total
n % n % n %
Region 5 46 28.0 118 72.0 164 100.0
Region 7 46 23.6 149 76.4 195 100.0
Total 92 25.6 267 74.4 359 100.0
Table 3.2 shows a fairly equal distribution of the regional sample population by survey
type. Whereas approximately a quarter of the sample was interviewed via telephone
interviews, 74.4% of customers were interviewed in person at the actual municipality
service point (customer care walk-in centres/paypoints).
In profiling the households and businesses the survey findings also revealed the
following:
Approximately a third (32.9%) of the participating households speak Sesotho sa
Leboa. Almost half the Sesotho-speaking households reside in region 5 (49.3% of all
participating Sesotho speaking households). Furthermore, approximately a quarter
(23.7%) of participating households speak IsiZulu, of which just more than a third
reside in region 7 (37.3% of all IsiZulu speaking participating households). More
than 10% of the participating households speak IsiNdebele (13.8%) and Afrikaans
(10.8%). Of the participating households in region 7, approximately one in every
five (21.5%) speak IsiNdebele. Other languages spoken by participating households
included English (1.8%), siSwati (2.2%), isiXhosa (0.9%), Xitsonga (2.5%), Sesotho
(7.1%), Setswana (2.8%) and Tshivenda (1.5%).

10
Approximately seven in every 10 participating households (76.6%) reside in formal
houses while 7.7% reside in informal dwellings. A higher proportion of participating
households who reside in formal houses (81.4%) were included from region 7. In
turn, more participating households who reside in informal dwellings in region 5
(10.8%) were included in the sample when compared with region 7 (5.1%).
Only 12.6% of the participating households live in a security complex.
Approximately a third (35.3%) of the participating businesses are located within
suburban areas, while 29.4% and 5.9% are located in formal townships and informal
settlement areas respectively.
Approximately half (52.9%) the participating businesses are classified as small
enterprises, while 26.5% and 20.6% were medium and large businesses
respectively.
The bulk of participating businesses were wholesalers/retailers (44.2%) and
businesses who operate within the financial insurance, real estate and business
services sectors (44.1%). Other participating businesses operated in the mining and
quarrying (8.8%), manufacturing (2.9%) and community, social and personal
services (2.9%).
3.3 CUSTOMER INTERACTION
This section of the report deals with the type of customer interaction of the 359
customers participating in the survey. Figure 3.1 displays the type of customer
interaction with the CoT during the preceding 12 months. It is important to note that
the table reflects customers’ most recent type of interaction with the CoT. As the bulk
of the interviews occurred at the actual municipal service customer care walk-in
centres/paypoints, most of the recent interactions with the CoT were in person.

11
FIGURE 3.1
TYPE OF INTERACTIONS WITH CoT BY REGION
It is clear from figure 3.1 that most respondents visited a CoT customer care walk-in
centre/paypoint personally during the preceding 12 months. Although measured, no
customers had any postal or facsimile contact with the CoT during the preceding 12
months. Of the total participating respondents, only 7.5% and 2.2% corresponded with
the CoT via the Contact (Call) Centre or e-mail respectively. The relatively high
proportion of walk-in centre respondents relative to those who interacted
telephonically or via e-mail resulted from the sampling methodology (intercept
interviews at walk-in centres represented 74.4% of the total sample population).
It is also interesting to note that the following interaction with the CoT was recorded
from the CATI interviews (ie with households and businesses with access to landline
telephone facilities):
Personal visit to a customer care walk-in centre/paypoint: 62.0%
Telephone contact with the Contact (Call) Centre: 29.3%
Correspondence via e-mail: 8.7%
83.5
12.2
4.3
95.9
3.6
0.5
90.3
7.5
2.2
0.0 20.0 40.0 60.0 80.0 100.0 120.0
Personally visited a CoT regional customer carewalk-in centre/paypoint
Corresponded with the CoT via telephone -Contact (Call) Centre
Corresponded with the CoT via e-mail
Total Region 7 Region 5

12
It was also evident from the CATI interviews that just more than half (57.6%) the
successful telephonic contacts confirmed interaction with the CoT during the preceding
12 months. A more confined analysis of the CATI interviews shows a considerably
higher level of personal contact by households compared to businesses. Businesses are
more inclined to make contact with the CoT via telephone or e-mail as is evident from
the following interaction pattern that emerged from the CATI survey:
Households Business
Personal contact 76.6% 34.4%
Telephone contact 18.3% 50.0%
e-Mail contact 5.0% 15.6%
As mentioned, it is important to note that the data displayed in figure 3.1 reflect only
the most recent interaction of the surveyed customers. The nature of the most recent
interaction with the CoT, irrespective of the mode of interaction, is displayed in table 3.3
by region.
TABLE 3.3
NATURE OF INTERACTION BY REGION
Nature of interaction Region 5 Region 7 Total
n % n % n %
Information request 63 38.4% 69 35.4% 132 36.8%
Service request 34 20.7% 15 7.7% 49 13.6%
Lodge a complaint 2 1.2% 5 2.6% 7 1.9%
Pay municipal account 65 39.6% 106 54.4% 171 47.6%
Total 164 100.0% 195 100.0% 359 100.0%
Table 3.2 shows that almost half the participating customers, who interacted with the
CoT, paid their municipal accounts during their most recent interaction. Approximately
a third of customers sought information during their most recent interaction. When
compared across region, it is clear that more customers in region 5 made service
requests. In turn, a much higher proportion of customers in region 7 paid their
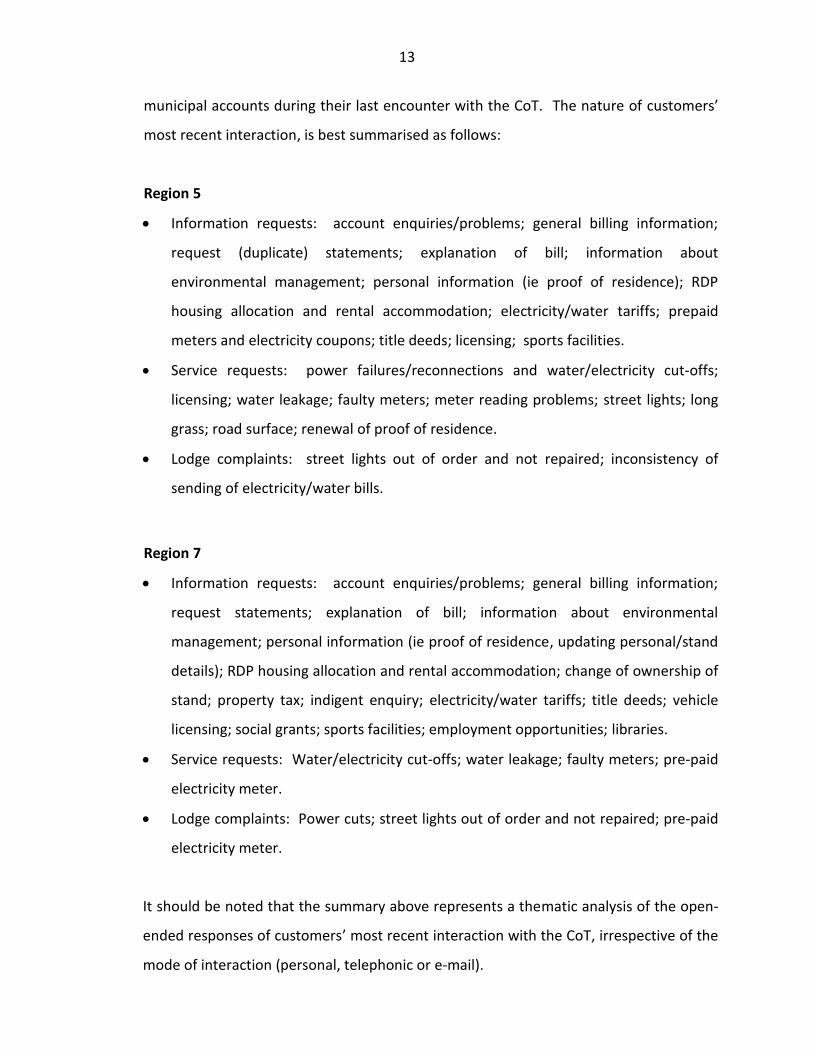
13
municipal accounts during their last encounter with the CoT. The nature of customers’
most recent interaction, is best summarised as follows:
Region 5
Information requests: account enquiries/problems; general billing information;
request (duplicate) statements; explanation of bill; information about
environmental management; personal information (ie proof of residence); RDP
housing allocation and rental accommodation; electricity/water tariffs; prepaid
meters and electricity coupons; title deeds; licensing; sports facilities.
Service requests: power failures/reconnections and water/electricity cut-offs;
licensing; water leakage; faulty meters; meter reading problems; street lights; long
grass; road surface; renewal of proof of residence.
Lodge complaints: street lights out of order and not repaired; inconsistency of
sending of electricity/water bills.
Region 7
Information requests: account enquiries/problems; general billing information;
request statements; explanation of bill; information about environmental
management; personal information (ie proof of residence, updating personal/stand
details); RDP housing allocation and rental accommodation; change of ownership of
stand; property tax; indigent enquiry; electricity/water tariffs; title deeds; vehicle
licensing; social grants; sports facilities; employment opportunities; libraries.
Service requests: Water/electricity cut-offs; water leakage; faulty meters; pre-paid
electricity meter.
Lodge complaints: Power cuts; street lights out of order and not repaired; pre-paid
electricity meter.
It should be noted that the summary above represents a thematic analysis of the open-
ended responses of customers’ most recent interaction with the CoT, irrespective of the
mode of interaction (personal, telephonic or e-mail).
14
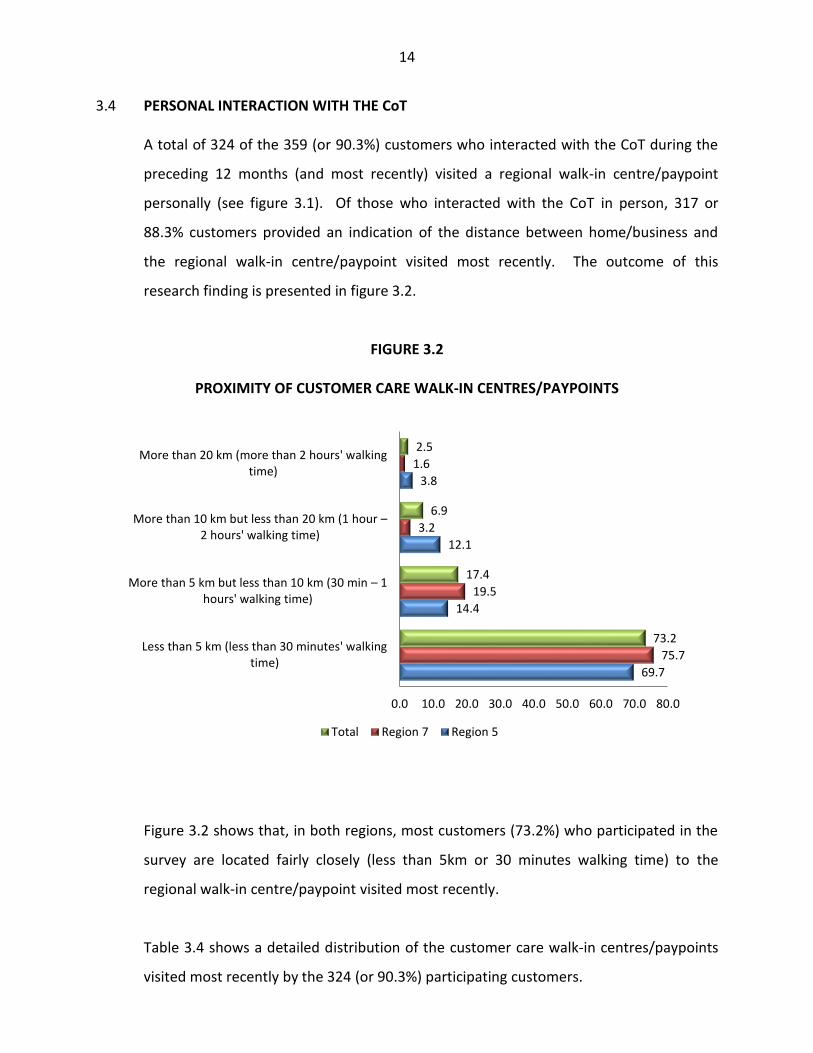
3.4 PERSONAL INTERACTION WITH THE CoT
A total of 324 of the 359 (or 90.3%) customers who interacted with the CoT during the
preceding 12 months (and most recently) visited a regional walk-in centre/paypoint
personally (see figure 3.1). Of those who interacted with the CoT in person, 317 or
88.3% customers provided an indication of the distance between home/business and
the regional walk-in centre/paypoint visited most recently. The outcome of this
research finding is presented in figure 3.2.
FIGURE 3.2
PROXIMITY OF CUSTOMER CARE WALK-IN CENTRES/PAYPOINTS
Figure 3.2 shows that, in both regions, most customers (73.2%) who participated in the
survey are located fairly closely (less than 5km or 30 minutes walking time) to the
regional walk-in centre/paypoint visited most recently.
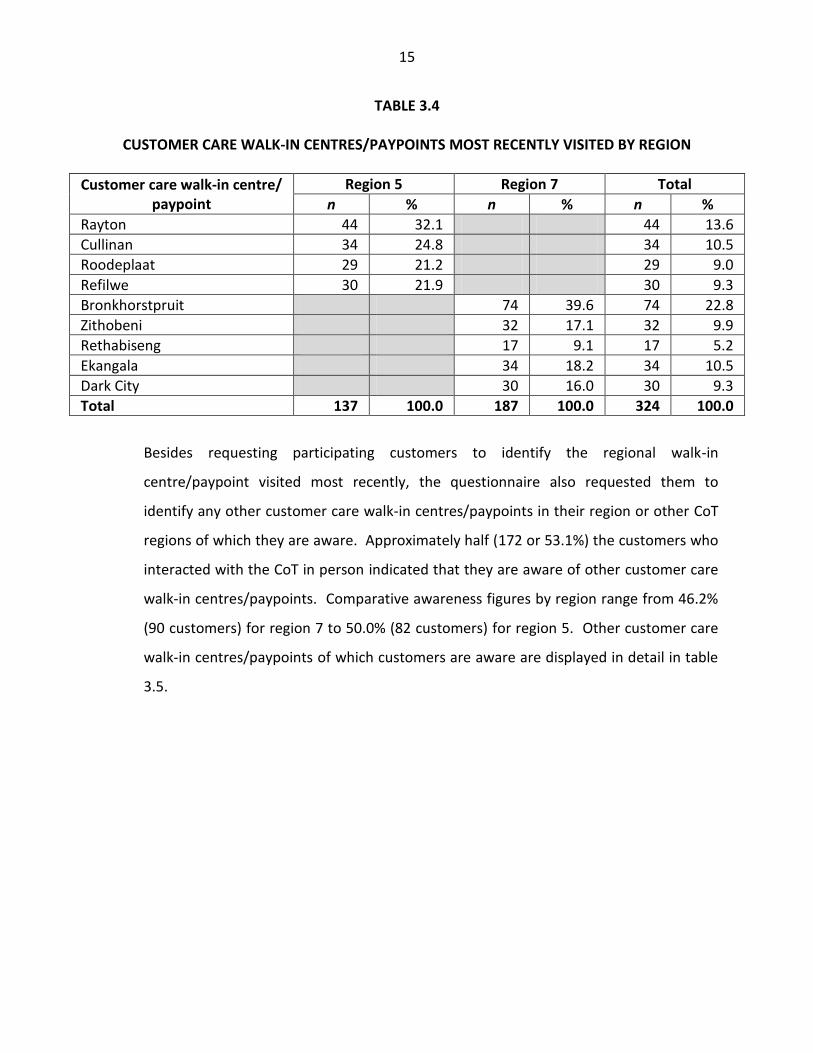
Table 3.4 shows a detailed distribution of the customer care walk-in centres/paypoints
visited most recently by the 324 (or 90.3%) participating customers.
69.7
14.4
12.1
3.8
75.7
19.5
3.2
1.6
73.2
17.4
6.9
2.5
0.0 10.0 20.0 30.0 40.0 50.0 60.0 70.0 80.0
Less than 5 km (less than 30 minutes' walkingtime)
More than 5 km but less than 10 km (30 min – 1 hours' walking time)
More than 10 km but less than 20 km (1 hour – 2 hours' walking time)
More than 20 km (more than 2 hours' walkingtime)
Total Region 7 Region 5
15
TABLE 3.4
CUSTOMER CARE WALK-IN CENTRES/PAYPOINTS MOST RECENTLY VISITED BY REGION
Customer care walk-in centre/ paypoint
Region 5 Region 7 Total
n % n % n %
Rayton 44 32.1 44 13.6
Cullinan 34 24.8 34 10.5
Roodeplaat 29 21.2 29 9.0
Refilwe 30 21.9 30 9.3
Bronkhorstpruit 74 39.6 74 22.8
Zithobeni 32 17.1 32 9.9
Rethabiseng 17 9.1 17 5.2
Ekangala 34 18.2 34 10.5
Dark City 30 16.0 30 9.3
Total 137 100.0 187 100.0 324 100.0
Besides requesting participating customers to identify the regional walk-in
centre/paypoint visited most recently, the questionnaire also requested them to
identify any other customer care walk-in centres/paypoints in their region or other CoT
regions of which they are aware. Approximately half (172 or 53.1%) the customers who
interacted with the CoT in person indicated that they are aware of other customer care
walk-in centres/paypoints. Comparative awareness figures by region range from 46.2%
(90 customers) for region 7 to 50.0% (82 customers) for region 5. Other customer care
walk-in centres/paypoints of which customers are aware are displayed in detail in table
3.5.

16
TABLE 3.5
AWARENESS OF OTHER CUSTOMER CUSTOMER CARE WALK-IN CENTRES/ PAYPOINTS BY REGION
Customer care walk-in centre/
paypoint
Region 5 Region 7 Total
n % n % n %
Zithobeni 0 0.0 14 15.6 14 8.1
Eersterus 3 3.7 1 1.1 4 2.3
Refilwe 7 8.5 0 0.0 7 4.1
Rayton 43 52.4 0 0.0 43 25.0
Mamelodi 1 1.2 0 0.0 1 0.6
Ekangala 0 0.0 16 17.8 16 9.3
Dark City 0 0.0 10 11.1 10 5.8
Cullinan 22 26.8 0 0.0 22 12.8
Bronkhorstspruit 4 4.9 43 47.8 47 27.3
BKS 1 1.2 6 6.7 7 4.1
Sinoville 1 1.2 0 0.0 1 0.6
Total 82 100.0 90 100.0 172 100.0
A matrix analysis between the paypoint most recently visited and other customer care
walk-in centres/paypoints which customers are aware of is presented in table 3.6 by
region. The table reflects the number of customers who claimed to be aware of other
customer care walk-in centres/paypoints. The fact that 53.1% of customers who last
interacted with the CoT in person indicated that they are also aware of other customer
care walk-in centres/paypoints besides the one visited most recently displays fairly high
levels of awareness of other customer care walk-in centres/paypoints in- and outside
the survey regions. Table 3.6 clearly shows that participating customers who last
interacted with Rethabiseng (100.0%), Cullinan (79.4%) and Refilwe (76.7%), are also
aware of other customer care walk-in centres/paypoints. Of those customers who are
aware of other customer care walk-in centres/paypoints, most claim to be aware of the
Bronkhorstspruit (26.1%) and Rayton (25.0%) customer care walk-in centres/paypoints.
The BKS customer care centre (Pretorius Street) recorded the highest level of awareness
(4.1%) among regions outside the survey areas (regions 5 and 7).

17
TABLE 3.6
CUSTOMER AWARENESS OF OTHER CUSTOMER CARE WALK-IN CENTRES/PAYPOINTS IN- AND OUTSIDE SURVEY REGIONS
Customer care walk-in centre/ paypoint
Region 5 Region 7 Total
Last visited
Aware
Rayton Cullinan Roodeplaat Refilwe Bronkhorstspruit Zithobeni Rethabiseng Ekangala Dark City
n n n n n n n n n n
Region 5
Rayton 0 26 6 11 0 0 0 0 0 43
Cullinan 9 0 1 12 0 0 0 0 0 22
Roodeplaat 0 0 0 0 0 0 0 0 0 0
Refilwe 7 0 0 0 0 0 0 0 0 7
Region 7
Bronkhorstspruit 2 0 2 0 0 11 11 9 12 47
Zithobeni 0 0 0 0 8 0 6 0 0 14
Rethabiseng 0 0 0 0 0 0 0 0 0 0
Ekangala 0 0 0 0 16 0 0 0 0 16
Dark City 0 0 0 0 0 0 0 10 0 10
Other regions
Eersterus 2 0 1 0 1 0 0 0 0 4
Mamelodi 0 1 0 0 0 0 0 0 0 1
BKS 1 0 0 0 2 0 0 4 0 7
Sinoville 0 0 1 0 0 0 0 0 0 1
Total aware 21 27 11 23 27 11 17 23 12 172
Total used 44 34 29 30 74 32 17 34 30 324
% aware 47.7 79.4 37.9 76.7 36.5 34.4 100.0 67.6 40.0 53.1

18
Besides enquiring about the awareness of other customer care walk-in
centres/paypoints, the questionnaire requested customers who last interacted with the
CoT in person to indicate which other customer care walk-in centres/paypoints they had
used (see table 3.7). Of the total customers who are aware of other customer care
walk-in centres/paypoints (172 or 53.1% of customers (n = 324) who last interacted with
the CoT in person), 119 (69.2%) customers indicated that they had also used other
customer care walk-in centres/paypoints in the preceding 12 months.
TABLE 3.7
OTHER INTER-REGION CUSTOMER CARE WALK-IN CENTRES/PAYPOINTS USED BY REGION
Customer care walk-in
centres/paypoints
Aware of other customer care
walk-in centres/paypoints
Used other customer care
walk-in centres/paypoints
% using other customer care
walk-in centres/paypoints
n n %
Region 5
Rayton 43 21 48.8
Cullinan 22 20 90.9
Refilwe 7 7 100.0
Region 7
Bronkhorstspruit 47 31 66.0
Zithobeni 14 10 71.4
Ekangala 16 15 93.8
Dark City 10 8 80.0
Other regions
Eersterus 4 2 50.0
Mamelodi 1 0 0.0
BKS 7 4 57.1
Sinoville 1 1 100.0
Total 172 119 69.2
Table 3.8 provides a more detailed analysis of the use of other customer care walk-in
centres/paypoints besides the latest one used. The exhibit shows that 17.6% of all
customers using other customer care walk-in centres/paypoints (n = 119), last visited
the Bronkhorstspruit paypoint. Most customers who last used Bronkhorstspruit (71.4%)

19
had also used Ekangala. Similarly, most customers (60.0%), who recently visited Refilwe
had also visited the Cullinan paypoint during the preceding 12 months. Likewise, 62.5%
of Rethabiseng customers had previously visited the Bronkhorstspruit paypoint. Table
3.8 clearly shows the highest ‘migration rate’ for Bronkhorstspruit (17.6%), Refilwe
(16.8%) and Ekangala (14.3%).
TABLE 3.8
OTHER CUSTOMER CARE WALK-IN CENTRES/PAYPOINTS USED BY REGION
Other used Latest used
Region 5 Region 7 Other
regions Total %
Rayton Cullinan Roode-plaat
Refilwe Bronkhorst-
spruit Zithobeni Rethabiseng Ekangala
Dark City
Region 5 Rayton
7
7 1
1 16 13.4
Cullinan 9
9 7.6
Roodeplaat 4 1
1 6 5.0
Refilwe 8 12
20 16.8
Region 7
Bronkhorstspruit
4
15
2 21 17.6
Zithobeni
8
8 6.7
Rethabiseng
10 6
16 13.4
Ekangala
6
8 3 17 14.3
Dark City
6
6 5.0
Total 21 20 0 7 31 10 0 15 8 7 119 100.0
The information displayed in table 3.8 shows clear multiple and inter- and intraregional
paypoint usage levels. Intraregional usage is especially notable among Rethabiseng
customers, who indicated that they had also used the Bronkhorstspruit customer care
walk-in centre and Zithobeni paypoint within the same region during the preceding 12
months. In region 5, similar intraregional usage levels are visible where, especially
Refilwe customers, indicated that they had also visited the Rayton customer care walk-
in centre and Cullinan paypoint during the preceding 12 months. With regard to inter-
regional usage levels, it is interesting to note from table 3.8 that customers who last
interacted with a paypoint in region 7, had not visited another paypoint in region 5.
Despite the latter, some interregional usage trends are notable where especially

20
Bronkhorstspruit and Ekangala customers also indicated that they had used customer
care walk-in centres/paypoints (mainly the BKS customer care centre).
The inter- and intraregional exposure to paypoint service delivery and multiple paypoint
usage is regarded as an advantage for the survey as respondents could base their
satisfaction ratings of the quality of service delivery on their experience with more than
one paypoint.
The main reasons cited by participating customers for using other customer care walk-in
centres/paypoints are summarised as follows:
Region 5
No assistance received
Safety issues
Distance (closer to home/work)
Visiting an area close to paypoint
Queuing problems
Other customer care walk-in centres/paypoints more accessible
Referred to other customer care walk-in centres/paypoints
Region 7
Computers offline
No assistance/ poor service
Distance (closer to home/work)
Card facilities not working
Paypoint damaged
Referred to other customer care walk-in centres/paypoints
Queuing problems
Alleged corruption

21
3.4.1 Customer satisfaction
A crucial part of the questionnaire was devoted to measuring the level of customer
satisfaction with the quality of service delivery at the customer care walk-in
centres/paypoints most recently visited in person. The customer ratings for the five
major service quality constructs (facilities, account payment processing, trading hours,
counter staff and dealing with queries/complaints) and individual service attributes are
displayed in tables 3.9a (region) and 3.9b (customer type). Tables 3.9(a) and (b) use a
colour coded analysis approach showcasing the average (mean) rating scores for
customers who last interacted with a CoT paypoint in person and who were requested
to rate the CoT on a 5-point satisfaction scale, where ‘1’ = very dissatisfied and ‘5’ = very
satisfied. Therefore, average scores closer to ‘1’ reflect higher levels of dissatisfaction
while scores closer to ‘5’ reflect higher levels of satisfaction with the various paypoint
constructs/attributes. The following colour codes denote customer satisfaction levels as
follows:
Red (average scores between 1.00 – 2.00): Very dissatisfied
Orange (average scores between 2.01 – 3.00): Dissatisfied
Yellow (average scores between 3.01 – 4.00): Satisfied
Green (average scores between 4.01 – 5.00): Very satisfied
For convenience, the actual number of customers who ranked a specific variable (valid
n) are provided. These additional statistics are important to note as not all customers
experienced (or used) the listed services for which satisfaction ratings were requested.
In fact, respondents were only allowed to provide a satisfaction rating for a specific
service if he/she actually experienced such a service.

22
TABLE 3.9(a)
AVERAGE SATISFACTION RATING SCORES FOR PAYPOINT CONSTRUCTS/ATTRIBUTES BY REGION
Evaluation criteria Region 5 Region 7 Total
Valid n Mean Valid n Mean Valid n Mean
Appearance of facilities 136 3.41 186 3.45 322 3.43
Equipment 136 3.44 186 2.94 322 3.15
Adequacy of parking facilities 108 2.92 128 2.41 236 2.64
Adequacy of security 112 3.23 186 3.89 298 3.64
Average: Facilities 3.25 3.17 3.22
Efficiency of the queuing system 135 3.85 183 3.40 318 3.59
All paypoint stations are manned during CoT office hours hours
127 4.01 164 3.78 291 3.88
Promptness in providing duplicate statements 96 3.46 129 3.26 225 3.35
Promptness in providing electricity/water consumption reading and financial details
93 3.06 139 2.79 232 2.90
Promptness in providing details on water leakage
89 2.98 128 2.25 217 2.55
Promptness in resolving misallocations of a payment
87 2.82 118 2.64 205 2.72
Promptness in opening a new municipal service account
76 2.95 88 3.43 164 3.21
Promptness in processing financial transactions 93 3.43 123 3.62 216 3.54
Efficiency of the cashier payment system 111 3.88 154 3.85 265 3.86
Promptness of cashiers in handling money 113 3.84 151 4.11 264 3.99
Cashier preciseness in handling money (receiving money/return appropriate change)
114 4.03 154 4.09 268 4.06
Average: Processing account payments 3.48 3.38 3.42
Convenience of customer care walk-in centre/paypoint operating hours
133 4.31 170 3.91 303 4.08
Average: Trading hours and accessibility 4.31
3.91
4.08
Staff friendliness 137 4.01 187 4.12 324 4.07
Staff politeness and professionalism with customers
137 3.99 187 4.01 324 4.00
Staff trustworthiness and honesty 134 3.85 182 3.96 316 3.91
Staff skills to do jobs well 135 3.93 186 4.05 321 4.00
Staff appearance (neatly and appropriately dressed)
134 3.90 186 4.44 320 4.21
(continue…)

23
TABLE 3.9(a) (cont)
Evaluation criteria Region 5 Region 7 Total
Valid n Mean Valid n Mean Valid n Mean
Staff ability to pay attention to customer details 133 4.06 187 4.03 320 4.04
Staff helpfulness and sympathy towards customers
136 3.87 187 3.75 323 3.80
Promptness of staff in assisting customers 134 4.00 186 3.85 320 3.91
Staff focus on customers 136 3.99 187 3.83 323 3.89
Availability of staff 136 3.96 186 3.72 322 3.82
Average: Counter staff 3.95 3.98 3.97
Resolving information requests on first contact 121 3.58 171 2.96 292 3.22
Promptness in resolving service requests 119 3.44 170 2.75 289 3.03
Promptness in resolving complaints 106 3.08 165 2.69 271 2.85
Average: Dealing with queries/complaints 3.37 2.80 3.03
Total Average 3.63 3.52 3.56
No statistically significant differences is noted between the overall satisfaction scores
for regions 5 (average score = 3.63) and 7 (average score = 3.52). However, when
ranking the rated scores, a number of clear differences are observed. In order to
identify the top and bottom customer satisfaction items, the average scores for all 29
service attributes were ranked for each region. The top and bottom satisfaction scores
for both regions are displayed in exhibit 3.1.

24
EXHIBIT 3.1
TOP AND BOTTOM SATISFACTION ITEMS BY REGION
Region 5 Region 7
Variable Score Variable Score
Top
Convenience of customer care walk-in centre/paypoint operating hours
Staff ability to pay attention to customer details
Cashier preciseness in handling money(receiving money/return appropriate change)
All paypoint stations are manned during CoT office hours hours
Staff friendliness
4.31 4.06 4.03 4.01 4.01
Staff appearance (neatly and appropriately dressed)
Staff friendliness
Promptness of cashiers in handling money
Cashier preciseness in handling money (receiving money/return appropriate change)
Staff skills to do jobs well
Staff ability to pay attention to customer details
4.44 4.12 4.11 4.09
4.05
4.03
Bo
tto
m
Promptness in resolving misallocations of a payment
Adequacy of parking facilities
Promptness in opening a new municipal service account
Promptness in providing details on water leakage
2.82 2.92 2.95 2.98
Promptness in providing details on water leakage
Adequacy of parking facilities
Promptness in resolving misallocations of a payment
Promptness in resolving complaints
Promptness in resolving service requests
Promptness in providing electricity/water consumption reading and financial details
Equipment
Resolving information requests on first contact
2.25 2.41
2.64 2.69 2.75 2.79
2.94
2.96
It is clear from exhibit 3.1 that certain counter staff attributes/skills in both regions
received fairly positive satisfaction ratings. However, from a strategic perspective, items
with low scores require priority attention. Service areas such as promptness in resolving
misallocations of payments, adequacy of parking facilities and promptness in providing
details on water leakages, should receive prompt attention to improve the quality of
future service delivery at CoT customer care walk-in centres/paypoints in both regions 5
and 7.
As mentioned, the satisfaction ratings were also analysed by customer type
(households/businesses). This analysis is presented in table 3.9(b).

25
TABLE 3.9(b)
AVERAGE SATISFACTION RATING SCORES FOR PAYPOINT CONSTRUCTS/ATTRIBUTES BY CUSTOMER TYPE
Evaluation criteria Household Business Total
Valid n Mean Valid n Mean Valid n Mean
Appearance of facilities 309 3.48 13 2.38 322 3.43
Equipment 309 3.17 13 2.69 322 3.15
Adequacy of parking facilities 223 2.61 13 3.15 236 2.64
Adequacy of security 285 3.67 13 3.00 298 3.64
Average: Facilities 3.23 2.81 3.22
Efficiency of the queuing system 305 3.64 13 2.46 318 3.59
All paypoint stations are manned during CoT office hours
279 3.93 12 2.67 291 3.88
Promptness in providing duplicate statements 212 3.42 13 2.08 225 3.35
Promptness in providing electricity/water consumption reading and financial details
219 2.96 13 1.85 232 2.90
Promptness in providing details on water leakage 205 2.58 12 2.00 217 2.55
Promptness in resolving misallocations of a payment
193 2.78 12 1.75 205 2.72
Promptness in opening a new municipal service account
154 3.27 10 2.20 164 3.21
Promptness in processing financial transactions 204 3.60 12 2.50 216 3.54
Efficiency of the cashier payment system 252 3.91 13 3.00 265 3.86
Promptness of cashiers in handling money 252 4.04 12 3.00 264 3.99
Cashier preciseness in handling money (receiving money/return appropriate change)
255 4.13 13 2.85 268 4.06
Average: Processing account payments 3.48 2.40 3.42
Convenience of customer care walk-in centre/paypoint operating hours
290 4.12 13 3.31 303 4.08
Average: Trading hours and accessibility 4.12 3.31 4.08
Staff friendliness 311 4.11 13 3.15 324 4.07
Staff politeness and professionalism with customers
311 4.04 13 3.00 324 4.00
Staff trustworthiness and honesty 305 3.96 11 2.55 316 3.91
Staff skills to do jobs well 308 4.06 13 2.62 321 4.00
Staff appearance (neatly and appropriately dressed)
307 4.25 13 3.31 320 4.21
Staff ability to pay attention to customer details 307 4.10 13 2.77 320 4.04
(continue…)

26
TABLE 3.9(b) (cont)
Evaluation criteria Household Business Total
Valid n Mean Valid n Mean Valid n Mean
Staff helpfulness and sympathy towards customers 310 3.85 13 2.69 323 3.80
Promptness of staff in assisting customers 307 3.98 13 2.38 320 3.91
Staff focus on customers 310 3.96 13 2.38 323 3.89
Availability of staff 309 3.88 13 2.54 322 3.82
Average: Counter staff 4.02 2.74 3.97
Resolving information requests on first contact 279 3.26 13 2.23 292 3.22
Promptness in resolving service requests 276 3.08 13 2.08 289 3.03
Promptness in resolving complaints 258 2.88 13 2.15 271 2.85
Average: Dealing with queries/complaints 3.07 2.15 3.03
Total average 270 3.61 13 2.58 283 3.56
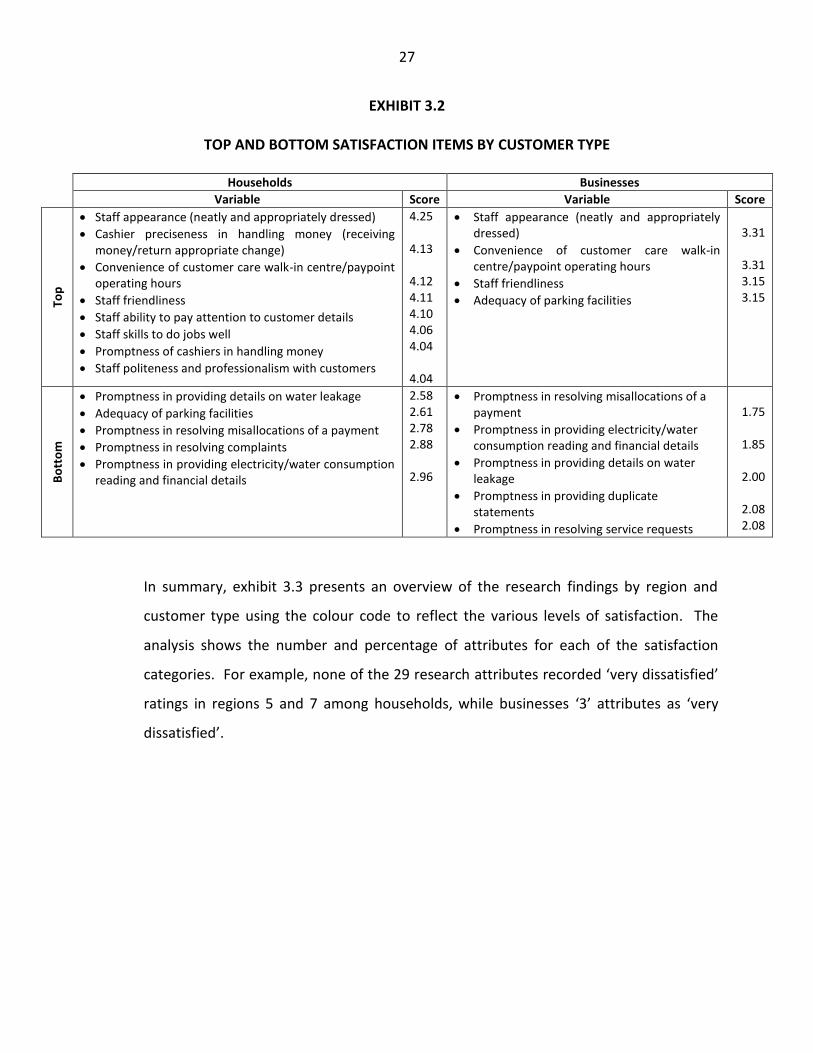
When analysing the overall average satisfaction scores by customer type, it is clear that
satisfaction with CoT customer care walk-in centres/paypoints is far lower among
businesses than households. Despite this, many of the top and bottom satisfaction
scores of households and businesses are fairly similar. To showcase these findings, the
top and bottom satisfaction scores for both customer types are displayed in exhibit 3.2.
27
EXHIBIT 3.2
TOP AND BOTTOM SATISFACTION ITEMS BY CUSTOMER TYPE
Households Businesses
Variable Score Variable Score
Top
Staff appearance (neatly and appropriately dressed)
Cashier preciseness in handling money (receiving money/return appropriate change)
Convenience of customer care walk-in centre/paypoint operating hours
Staff friendliness
Staff ability to pay attention to customer details
Staff skills to do jobs well
Promptness of cashiers in handling money
Staff politeness and professionalism with customers
4.25 4.13 4.12 4.11 4.10 4.06 4.04 4.04
Staff appearance (neatly and appropriately dressed)
Convenience of customer care walk-in centre/paypoint operating hours
Staff friendliness
Adequacy of parking facilities
3.31
3.31 3.15 3.15
Bo
tto
m
Promptness in providing details on water leakage
Adequacy of parking facilities
Promptness in resolving misallocations of a payment
Promptness in resolving complaints
Promptness in providing electricity/water consumption reading and financial details
2.58 2.61 2.78 2.88 2.96
Promptness in resolving misallocations of a payment
Promptness in providing electricity/water consumption reading and financial details
Promptness in providing details on water leakage
Promptness in providing duplicate statements
Promptness in resolving service requests
1.75
1.85
2.00
2.08 2.08
In summary, exhibit 3.3 presents an overview of the research findings by region and
customer type using the colour code to reflect the various levels of satisfaction. The
analysis shows the number and percentage of attributes for each of the satisfaction
categories. For example, none of the 29 research attributes recorded ‘very dissatisfied’
ratings in regions 5 and 7 among households, while businesses ‘3’ attributes as ‘very
dissatisfied’.

28
EXHIBIT 3.3
TOP AND BOTTOM SATISFACTION ITEMS BY REGION AND CUSTOMER TYPE
Criteria Rating range
Region 5 (n = 164)
Region 7 (n = 195)
Households (n = 325)
Businesses (n = 34)
No of items
% No of items
% No of items
% No of items
%
Very dissatisfied 1.00 - 2.00 0 0.00 0 0.00 0 0.00 3 10.34
Dissatisfied 2.01 - 3.00 4 13.79 8 27.59 5 17.24 22 75.86
Satisfied 3.00 - 4.00 20 68.97 14 48.28 16 55.17 4 13.79
Very satisfied 4.01 - 5.00 5 17.24 7 24.14 8 27.59 0 0.00
Total items 29 100.00 29 100.00 29 100.00 29 100.00
Besides requesting customers who last visited a CoT paypoint in person to rate the 29
service items separately, participants were also requested to provide an overall rating
on a 5-point satisfaction scale on the quality of service delivery experienced during their
last visit. The outcome of this finding is presented in figure 3.3 by region. The overall
customer satisfaction scores are plotted alongside the average overall satisfaction
scores (as computed for all 29 items separately in table 3.9(a)). Clearly, customers’
independent overall ratings appear fairly objective as these closely resemble the overall
average satisfaction scores displayed at the bottom of table 3.9(a).

29
FIGURE 3.3
OVERALL AND AVERAGE CUSTOMER SATISFACTION RATINGS FOR PERSONAL INTERACTION BY REGION
Although the average scores generally appear satisfactory, a closer analysis of the
satisfaction category frequency distributions shows a measure of indecision and
dissatisfaction among customers in both regions 5 and 7. A more detailed analysis of
this finding is shown in figure 3.4.
1
2
3
4
5
Region 5Region 7
Total
3.58 3.45 3.51
3.63 3.52 3.56
Overall customer rating Survey average

30
FIGURE 3.4
MAGNITUDE OF CUSTOMER SATISFACTION FOR PERSONAL INTERACTION BY REGION
From a strategic planning perspective it is important to note and elaborate on those
service aspects recording low customer satisfaction. From the analysis presented in
figure 3.4, just more than one fifth (21.3%) of customers seem dissatisfied with the
quality of service delivery at customer care walk-in centres/paypoints, while 17.9%
perceive service delivery as ‘average’. In exploring the reasons for average and
dissatisfied ratings, the research questionnaire included an open-ended response to
encourage participating dissatisfied customers to list the main reason for their concerns
about the quality of service delivery during their last visit to a customer care walk-in
centre/paypoint. The outcomes of these findings are displayed in exhibit 3.4 by region.
From the analysis presented in exhibit 3.4 it is clear that approximately a third (34.3%)
of customers in region 5 allocated an average rating (score = 3) or dissatisfied rating
(scores below 3). These respondents were requested to advance the main reason for
their disillusionment with their service experience. Similarly, about two in every five
customers (42.8%) in region 7 allocated an average rating (score = 3) or dissatisfied
11.7 9.6 10.5
8.8
12.3 10.8
13.9
20.9
17.9
41.6
37.4 39.2
24.1
19.8 21.6
0
25
50
Region 5 Region 7 Total
Very dissatisfied Dissatisfied Average Satisfied Very satisfied
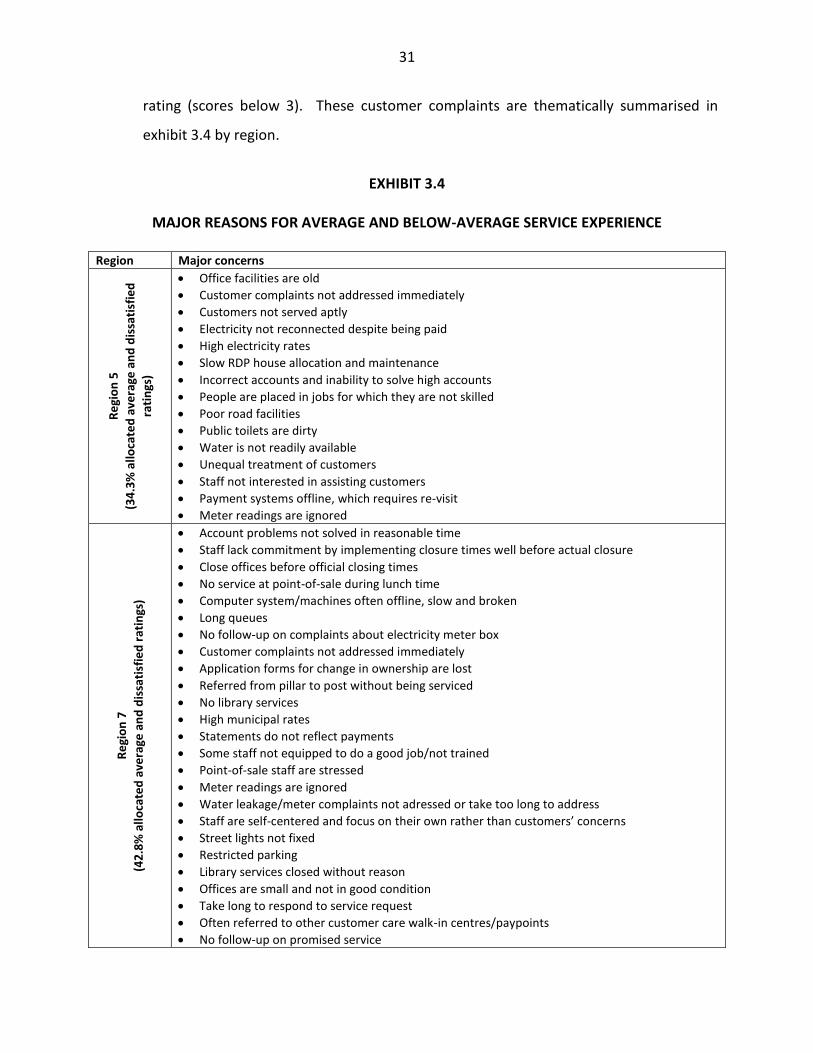
31
rating (scores below 3). These customer complaints are thematically summarised in
exhibit 3.4 by region.
EXHIBIT 3.4
MAJOR REASONS FOR AVERAGE AND BELOW-AVERAGE SERVICE EXPERIENCE
Region Major concerns
Re
gio
n 5
(34
.3%
allo
cate
d a
vera
ge a
nd
dis
sati
sfie
d
rati
ngs
)
Office facilities are old
Customer complaints not addressed immediately
Customers not served aptly
Electricity not reconnected despite being paid
High electricity rates
Slow RDP house allocation and maintenance
Incorrect accounts and inability to solve high accounts
People are placed in jobs for which they are not skilled
Poor road facilities
Public toilets are dirty
Water is not readily available
Unequal treatment of customers
Staff not interested in assisting customers
Payment systems offline, which requires re-visit
Meter readings are ignored
Re
gio
n 7
(42
.8%
allo
cate
d a
vera
ge a
nd
dis
sati
sfie
d r
atin
gs)
Account problems not solved in reasonable time
Staff lack commitment by implementing closure times well before actual closure
Close offices before official closing times
No service at point-of-sale during lunch time
Computer system/machines often offline, slow and broken
Long queues
No follow-up on complaints about electricity meter box
Customer complaints not addressed immediately
Application forms for change in ownership are lost
Referred from pillar to post without being serviced
No library services
High municipal rates
Statements do not reflect payments
Some staff not equipped to do a good job/not trained
Point-of-sale staff are stressed
Meter readings are ignored
Water leakage/meter complaints not adressed or take too long to address
Staff are self-centered and focus on their own rather than customers’ concerns
Street lights not fixed
Restricted parking
Library services closed without reason
Offices are small and not in good condition
Take long to respond to service request
Often referred to other customer care walk-in centres/paypoints
No follow-up on promised service

32
In summary, it ought to be mentioned that, although the average rating scores seem to
be relatively high, no less than 21.8% of respondents recorded dissatisfaction with
service delivery. Together with the 17.9% of respondents who allocated ‘average’
ratings, no less than two in every five (39.2%) customers expressed dissatisfaction with
service delivery at customer care walk-in centres/paypoints in regions 5 and 7.
3.5 TELEPHONIC INTERACTION WITH THE CoT
As discussed in section 3.3, not all participating customers interacted with the CoT in
person during the preceding 12 months. In fact, 27 of the 92 customers or 29.3% of all
CATI respondents last corresponded with the CoT via telephone (Contact/Call Centre). It
is also important to reiterate that the intercept surveys excluded questions on
telephonic or written correspondence with the CoT due to the research model design
that only allowed feedback on customer experience at the last point of contact prior to
the interview. This section of the report deals only with the experience of those
participating customers whose most recent interacted with the CoT was via telephone.
As mentioned, these customers’ views were obtained via the computer-aided
interviewer-administrated telephone survey. Since regional subanalyis is not possible
when evaluating customer interaction with the Call Centre and only a fairly limited
number of customers who were sampled actually interacted with the CoT via the Call
Centre, the research findings related to telephonic enquiries are restricted to a holistic
analysis.
The first question addressed to requested survey CoT customers who interacted with
the CoT via the Call Centre participants to indicate whether they (i) are aware that the
CoT has a toll-free number to lodge enquiries/queries and (ii) had used the toll-free
number. The outcome of this finding is presented in figure 3.5. It is clear that
approximately two thirds of the participating customers are aware of the CoT toll-free
number, while only a third had used the toll-free number.

33
FIGURE 3.5
AWARENESS AND USAGE OF CoT TOLL-FREE NUMBER
The majority of questions posed to those customers whose most recent interaction with
the CoT was via the Call Centre focused on an evaluation of Call Centre agents and the
CoT in dealing with telephone queries and complaints. Once again, a 5-point
satisfaction scale (where ‘1’ = very dissatisfied and ‘5’ = very satisfied) was used to rate
the levels of satisfaction with Call Centre agents and the handling of telephone
enquiries/complaints. The outcomes of these service ratings by participating customers
are displayed in table 3.10. No sample loss was recorded, which implies that all 27
participating customers provided ratings for each of the 13 service attributes included in
the research questionnaire. The table also displays the average score for the 13 service
items as well as the overall average rating score of participating customers of the CoT
for handling requests or complaints via telephone.
0 25 50 75 100
Aware
Used
66.7
33.3

34
TABLE 3.10
CUSTOMER SATISFACTION RATINGS FOR CoT’s HANDLING OF TELEPHONIC REQUESTS/COMPLAINTS
Service item Mean
Call Centre agents 2.58
Ease of reaching agent 2.19
Promptness of reaching agent 2.15
Friendliness of agent 3.00
Politeness and professionalism of agent 3.00
Helpfulness of agent 2.74
Agents’ interest in customer needs 2.67
Agents’ communication skills 2.56
Agents’ knowledge to handle enquiry 2.48
Agents’ ability to accurately/effectively resolve queries 2.41
Dealing with telephone queries/complaints 2.10
Resolving information requests on first contact 2.33
Promptness in resolving service requests 1.96
Promptness in resolving complaints 2.07
Efficiency of requests/complaints follow-up 2.04
Survey average 2.43
Overall participant rating 2.37
A closer analysis of the frequency distribution of satisfaction categories related to the
overall handling of telephone requests/complaints is displayed in figure 3.6. The figure
clearly shows that more than half (55.6%) the respondents expressed their
dissatisfaction with the CoT Contact (Call) Centre (51.9% were very dissatisfied and 3.7%
dissatisfied). Less than a third (29.6%) expressed their satisfaction with their telephonic
interaction with the CoT (14.8% satisfied and very satisfied respectively).
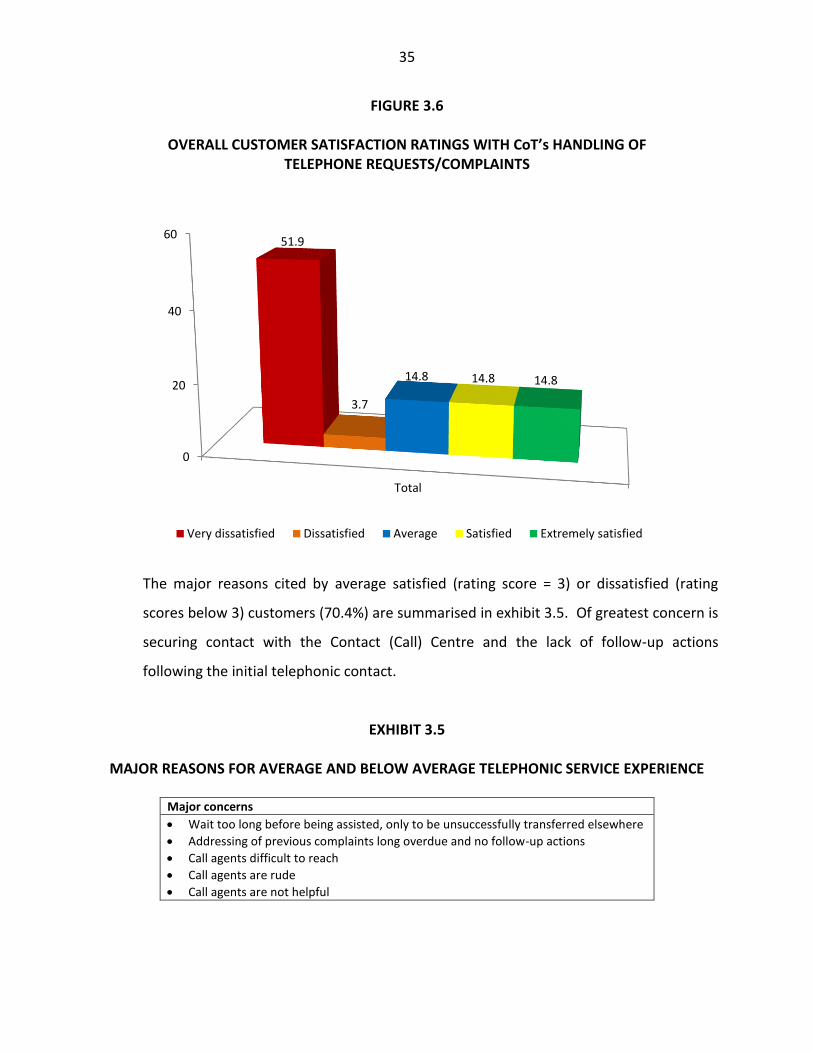
35
FIGURE 3.6
OVERALL CUSTOMER SATISFACTION RATINGS WITH CoT’s HANDLING OF TELEPHONE REQUESTS/COMPLAINTS
The major reasons cited by average satisfied (rating score = 3) or dissatisfied (rating
scores below 3) customers (70.4%) are summarised in exhibit 3.5. Of greatest concern is
securing contact with the Contact (Call) Centre and the lack of follow-up actions
following the initial telephonic contact.
EXHIBIT 3.5
MAJOR REASONS FOR AVERAGE AND BELOW AVERAGE TELEPHONIC SERVICE EXPERIENCE
Major concerns
Wait too long before being assisted, only to be unsuccessfully transferred elsewhere
Addressing of previous complaints long overdue and no follow-up actions
Call agents difficult to reach
Call agents are rude
Call agents are not helpful
0
20
40
60
Total
51.9
3.7
14.8 14.8 14.8
Very dissatisfied Dissatisfied Average Satisfied Extremely satisfied

36
3.6 e-MAIL CORRESPONDENCE WITH THE CoT
Besides the customers who made personal and telephonic contact, only 8.7% of the
CATI respondents corresponded with the CoT via e-mail. The service quality perceptions
of these customers, as obtained via the CATI survey, are discussed in this section of the
report. Once again the analyses are restricted to a holistic approach due to similar
reasons stated at the start of section 3.5. It should also be reiterated that no customers
who were included in the sample had any postal or facsimile interaction with the CoT.
Consequently, the discussion is limited to those participating customers whose most
recent interaction with the CoT was via e-mail.
The first section of the research questionnaire dealing with written interaction with the
CoT (post/fax/e-mail) used a dichotomous (yes/no) response approach to measure the
service experience of those customers whose most recent interaction with the CoT was
in writing. The outcomes of the survey findings for those participants who interacted
with the CoT via e-mail are summarised in figure 3.7. Based on the analysis presented in
figure 3.7, customers are generally disillusioned with the CoT informing them when to
expect a full response on their e-mail request/enquiry. Also, only 12.5% of the
respondents were informed when to expect a full response. Furthermore, only a
quarter (25.0%) of the respondents confirmed that the CoT took control of the enquiry,
were provided with a reference number or their correspondence was acknowledged
within seven days.

37
FIGURE 3.7
SERVICE EXPERIENCE OF CUSTOMERS CORRESPONDING WITH CoT VIA e-MAIL
Besides the pronouncement by respondents regarding the service expectations cited in
figure 3.7, participating customers who last interacted with the CoT via e-mail, were also
requested to rate the overall handling of requests/complaints via e-mail. Using a 5-
point satisfaction scale (where ‘1’ = very dissatisfied and ‘5’ = very satisfied), an average
rating score of 2.5 (out of 5) was returned. The frequency distribution of satisfaction
categories related to the overall handling of e-mail requests/complaints is displayed in
figure 3.8. It is clear from this analysis that approximately six in every 10 customers
(62.5%) are dissatisfied with the CoT’s handling of enquiries/complaints via e-mail.
When probed regarding the major reasons for dissatisfaction, participating customers
indicated that the CoT does not respond to e-mails nor provide feedback on e-mail
enquiries.
62.5
37.5
25.0
25.0
25.0
12.5
0.0 25.0 50.0 75.0 100.0
Customer was provided with telephone/e-mail contactdetails
Customer was treated with courtesy, respect anddignity
Correspondence was acknowledged within 7 days ofsending it
Customer was provided with a reference number
The CoT took control and ownership of customerenquiry/complaint
Customer was informed when to expect to receive afull response

38
FIGURE 3.8
PERCENTAGE OF CUSTOMERS IN SATISFACTION RATING CATEGORIES FOR CoT’s HANDLING OF e-MAIL REQUESTS/COMPLAINTS
3.7 MUNICIPAL ACCOUNT PAYMENTS
Besides measuring customer interaction with the CoT, the research questionnaire was
also designed to determine the current and preferred methods of paying CoT municipal
accounts. This section of the questionnaire measured payment preferences for seven
pre-determined payment methods. The corresponding outcome of these findings are
shown in tables 3.11(a) and 3.11(b). It is important to note that the tables exclude
customers who use pre-paid electricity meters who consequently do not have to pay
municipal accounts for electricity. It is also important to note that the figures add up to
more than 100%, implying that some of the customers use more than one form of
payment method.
0.0
25.0
50.0
Total
37.5
25.0 25.0
12.5
%
Very dissatisfied Dissatisfied Satisfied Very satisfied

39
TABLE 3.11(a)
PAYMENT METHODS USED
Payment method
Currently used
Region 5 Region 7 Total
% % %
Municipal office/Cashier desk at paypoint 60.4 82.1 72.1
Drive-through cashiers 6.7 2.6 4.5
Debit Order 6.7 3.1 4.7
Bank deposit: Over-the-counter and Internet payment at bank 7.3 3.6 5.3
Electronic payments (Internet banking) 15.2 6.7 10.6
Approved external pay point (Easy Pay counter ie Pick ‘n Pay or Shoprite/Checkers)
22.0 2.6 11.4
TABLE 3.11(b)
PAYMENT METHODS PREFERRED
Payment method
Preferred method
Region 5 Region 7 Total
% % %
Municipal office/Cashier desk at paypoint 34.8 47.7 41.8
Drive-through cashiers 3.0 5.1 4.2
Debit Order 6.1 3.1 4.5
Bank deposit: Over-the-counter and Internet payment at bank 9.8 11.8 10.9
Electronic payments (Internet banking) 15.2 15.9 15.6
Approved external pay point (Easy Pay counter ie Pick ‘n Pay or Shoprite/Checkers)
20.7 15.4 17.8
It is clear from tables 3.11(a) and 3.11(b) that customers would prefer to use customer
care walk-in centres/paypoints less often for paying accounts (engage less with the CoT
in person) and rather pay accounts personally at external customer care walk-in
centres/paypoints and banks or electronically via Internet banking.

40
3.8 CUSTOMER RIGHTS
Due to the fact that the Batho Pele (People first) principles are key to the quality of
service delivery at municipality level, an entire separate section of the questionnaire
measured the level of customer agreement with eight Batho Pele values advocated by
the CoT. The outcomes of these findings are presented in table 3.12. The customer
ratings regarding customer rights are summarised in exhibit 3.6, which presents the
ranking scores based on the average agreement ratings on the 3-point agreement scale
(agree, neither agree nor disagree, disagree) used to measure customers’ agreement
with the eight service principles. The exhibit shows that none of the Batho Pele values
yielded an agreement or performance score of above 50%. The three service areas with
the lowest performance are:
Agreement
Openness and transparency 37.8%
Value for money 33.4%
Consultation 36.2%
Exhibit 3.6 shows the ranking of the Batho Pele values in order of performance by
region.

41
TABLE 3.12
PERCENTAGE OF CUSTOMERS IN RATING GROUPS REGARDING CUSTOMER RIGHTS
Region 5 (%) Region 7 (%) Total (%)
Disagree Neither agree
Agree Disagree Neither agree
Agree Disagree Neither agree
Agree
The Tshwane Municipality makes attempts to consult citizens about the services they need (consultation)
39.6 25.0 35.4 44.6 18.5 36.9 42.3 21.4 36.2
Citizens are told what level and quality of public services they can expect to receive (service standards)
39.6 23.8 36.6 42.1 20.0 37.9 40.9 21.7 37.3
All citizens have equal access to the services to which they are entitled (access)
30.5 25.0 44.5 24.6 28.2 47.2 27.3 26.7 46.0
Citizens are treated with courtesy and consideration (courtesy) 29.3 31.7 39.0 26.2 20.5 53.3 27.6 25.6 46.8
Citizens are given full, accurate information about the public services they are entitled to receive (information)
37.2 26.2 36.6 42.6 21.0 36.4 40.1 23.4 36.5
Citizens are told how services/departments are run, how much they cost and who is in charge (openness and transparency)
39.0 30.5 30.5 49.2 17.9 32.8 44.6 23.7 31.8
It is easy for citizens to lodge a complaint/enquiry (redress) 37.8 29.3 32.9 33.3 17.9 48.7 35.4 23.1 41.5
Citizens who pay for services get value for their money/CoT spends wisely (value for money)
42.1 27.4 30.5 40.0 24.1 35.9 40.9 25.6 33.4

42
EXHIBIT 3.6
AVERAGE CUSTOMER RATINGS REGARDING CUSTOMER RIGHTS
Statement Rating
Region 5 Region 7 Total
Citizens are treated with courtesy and consideration (courtesy) 2 1 1
All citizens have equal access to the services to which they are entitled (access) 1 2 2
It is easy for citizens to lodge a complaint/enquiry (redress) 6 3 3
Citizens are told what level and quality of public services they can expect to receive (service standards)
4 4 4
Citizens are given full, accurate information about the public services they are entitled to receive (information)
3 6 5
The Tshwane Municipality makes attempts to consult citizens about the services they need (consultation)
5 7 6
Citizens who pay for services get value for their money/CoT spends wisely (value for money)
8 5 7
Citizens are told how services/departments are run, how much they cost and who is in charge (openness and transparency)
7 8 8
3.9 QUALITATIVE RESEARCH
The results of in-depth and CATI interviews conducted with five of the seven councillors
of regions 5 and 7 are summarised in this section.
Table 3.13 reflects the overall mean ratings as perceived by the councillors for the
different communication modes with the CoT. They range from 2.20 (out of 5) for
customer care walk-in centres to only 2.00 for both the Call Centre and written
correspondence. The table also confirms that the levels of satisfaction as perceived by
councillors are somewhat lower than recorded by customers themselves. For the
customer walk-in centres, councillors perceived a mean satisfaction rating of 2.20
compared to the 3.56 recorded by customers themselves. The differentials were
substantially smaller for the CoT Call Centre (2.00 compared to 2.37) and for written
communication (2.00 compared to 2.50).

43
TABLE 2.13
AVERAGE OVERALL SATISFACTION RATING SCORES FOR CUSTOMER CARE SERVICES BY COUNCILLORS AND CoT CUSTOMERS BY TYPE OF INTERACTION
TYPE OF INTERACTION COUNCILLORS CUSTOMERS
Personal interaction at customer care walk-in centres/paypoints 2.20 3.56
Telephone contact via the Call Centre 2.20 2.37
Written communication 2.00 2.51)
1) Converted from percentage distribution to rating score
The following major concerns were highlighted by the councillors:
(a) Customer care walk-in centres
Information requested from customer care agents is not readily available at
the centres.
No easy access for people with disabilities.
Customers were provided with wrong readings (water and electricity).
Not willing to help and rude to customers.
(b) CoT Call Centre
Phones are not answered.
Information requested from call centre agents is not readily available.
(c) Written communication
Lack of feedback on requests/complaints.
Acknowledge receipt of mail but never respond to real issues.
(d) General problems
Billing (wrong bills, high rates, infrequent billing, wrong addresses are
reported as the major problem in regions 5 and 7).
Bridging (illegal connections) of electricity.

44
High differentiation in customer profile (city, towns, farms, villages) requires
different approaches.
No proper communication/consultation with communities.
Poor service delivery in some of the areas.
Service delivery issues are politicised by political parties to gain support.
Peculiar ward demarcations resulted in customers having to report service
delivery problems at service centres kilometres away from their residences
(and not to service centres adjacent to them but located in other wards).
The following suggestions were made in an effort to remedy customer care problems:
Regionalisation of customer care functions (including the Call Centre) to address the
peculiar problems of regions 5 and 7, accommodate more town/farm/village-related
problems compared to the city -orientation of the old CoT, and improve the
communication/interaction between the municipality and its customers.
Introduction of mobile customer care facilities to serve the not so well-to-do
communities in regions 5 and 7 who favour walk-in centres often due to lack of
communication infrastructure (telephones and e-mail) and the inability to read and
write.
3.10 CONCLUSION
This chapter provided an overview of the outcome of the study of the customer
satisfaction study among 359 customers residing in regions 5 and 7 of the CoT and who
interacted with any of the nine CoT customer care walk-in centres/paypoints. The study
showed high levels of interaction and multiple customer care walk-in centres/paypoint
usage. Customers who last visited CoT customer care walk-in centres/paypoints in
regions 5 and 7 in person regard the quality of service delivery as ‘average and below
average‘. In fact, one in every five customers who last interacted with a CoT paypoint in
person, is dissatisfied with the quality of service delivery. In this regard, customers are
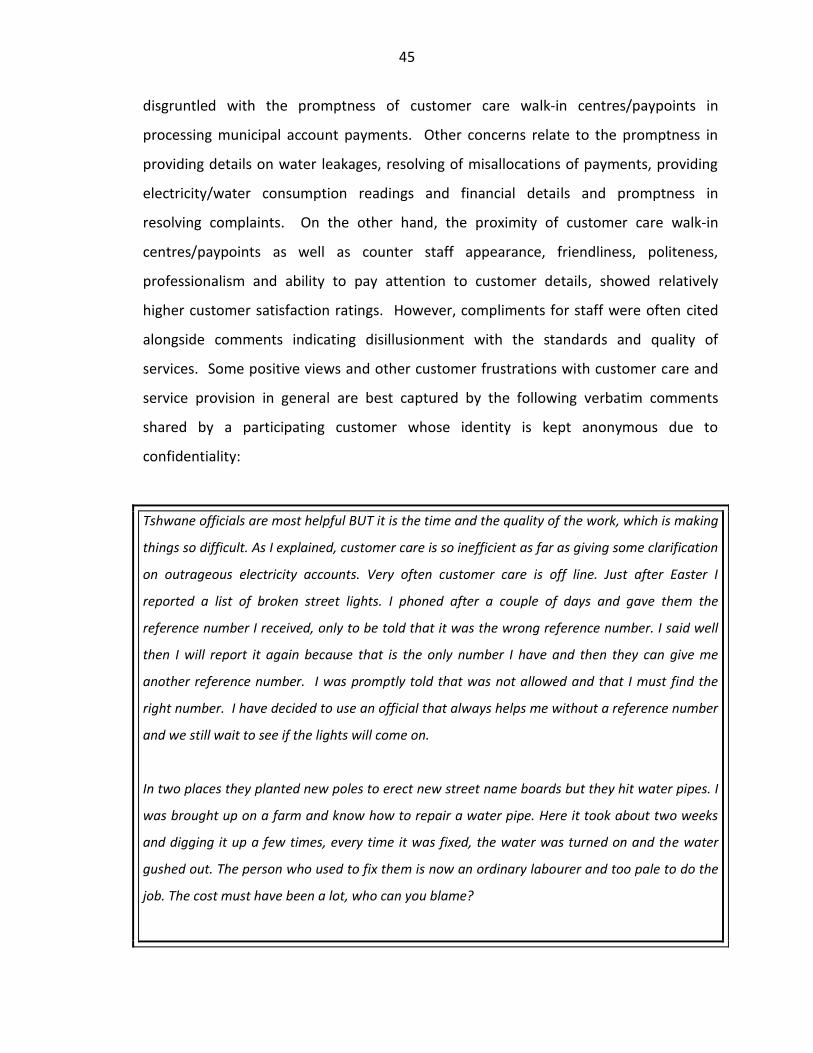
45
disgruntled with the promptness of customer care walk-in centres/paypoints in
processing municipal account payments. Other concerns relate to the promptness in
providing details on water leakages, resolving of misallocations of payments, providing
electricity/water consumption readings and financial details and promptness in
resolving complaints. On the other hand, the proximity of customer care walk-in
centres/paypoints as well as counter staff appearance, friendliness, politeness,
professionalism and ability to pay attention to customer details, showed relatively
higher customer satisfaction ratings. However, compliments for staff were often cited
alongside comments indicating disillusionment with the standards and quality of
services. Some positive views and other customer frustrations with customer care and
service provision in general are best captured by the following verbatim comments
shared by a participating customer whose identity is kept anonymous due to
confidentiality:
Tshwane officials are most helpful BUT it is the time and the quality of the work, which is making
things so difficult. As I explained, customer care is so inefficient as far as giving some clarification
on outrageous electricity accounts. Very often customer care is off line. Just after Easter I
reported a list of broken street lights. I phoned after a couple of days and gave them the
reference number I received, only to be told that it was the wrong reference number. I said well
then I will report it again because that is the only number I have and then they can give me
another reference number. I was promptly told that was not allowed and that I must find the
right number. I have decided to use an official that always helps me without a reference number
and we still wait to see if the lights will come on.
In two places they planted new poles to erect new street name boards but they hit water pipes. I
was brought up on a farm and know how to repair a water pipe. Here it took about two weeks
and digging it up a few times, every time it was fixed, the water was turned on and the water
gushed out. The person who used to fix them is now an ordinary labourer and too pale to do the
job. The cost must have been a lot, who can you blame?

46
The increase in tariffs is too high and we do not have high salaries. We do not have a bus service
or a regular fire service. We have a RED who promised frequent meetings with the councillors -
this has not materialised. We were promised a bus would come from Pretoria with
knowledgeable officials to sort out problems, we were told two MMCs would be deployed here
till things were up and running. The Mayor would come once a month but nothing has happened.
What I must say is the streets are being resurfaced and the water, sewerage and electricity
infrastructure is being upgraded.
Participating customers who interacted with the CoT via the Call Centre and e-mail, are
generally dissatisfied with the quality of service delivery experienced via these
nonpersonal modes of interaction. In fact, the overall satisfaction ratings of customers
who had nonpersonal interaction with the CoT (average rating scores of 2.37 and 2.50
for telephonic and e-mail correspondence respectively) are significantly lower than the
overall average rating for customers who had personal interaction with the CoT at
customer care walk-in centres/paypoints (average rating score of 3.51). A possible
reason for the difference may be that customer complaints are handled more efficiently
in the personal presence of customers and CoT officials when visiting customer care
walk-in centres/paypoints in person.
A more detailed analysis of the telephonic correspondence and experience of customers
reveals high levels of disillusionment among customers regarding the lack or tardiness of
follow-up actions following the initial telephonic contact and requests. Participating
customers also indicated that the CoT does not respond to e-mails nor provide feedback
on e-mail enquiries.
In evaluating customers’ perceptions regarding the application of the eight Batho Pele
principles aspired to by the CoT, participating customers regarded ‘openness and
transparency’, ‘value for money’ and ‘consultation’ as the most neglected principles. In

47
turn, ‘courtesy’ and ‘access’ were identified as the two best implemented principles,
albeit at a level of agreement below 50%.
The survey showed a clear preference among customers to pay municipal accounts at a
cashier desk at a paypoint, external customer care walk-in centres/paypoints, or
electronically via Internet banking, or at banks.
Finally, the in-depth interviews with councillors show that their perceived levels of
services at customer care walk-in centres are lower than those recorded by customers
themselves. They also rate services through the Call Centre and written communication
with the CoT as poor.
When analysing the survey environment prior to the start of the survey, major concerns
were expressed regarding safety conditions and the alleged antagonistic attitude of
customers towards the CoT in both regions 5 and 7. This hostile mind-set resulted
largely from the recent integration of the two regions into the CoT municipal
boundaries. However, despite the insecure environment, the fieldwork for the survey
was concluded without any major disruptions and, surprisingly, the survey showed a
higher than expected overall satisfaction rating among customers especially at customer
care walk-in centres in regions 5 and 7. In an attempt to elucidate the relatively
satisfactory outcome of the survey, it could be argued that customers’ service
expectations are lower than initially anticipated with a correspondingly relatively higher
satisfaction rating being recorded for the quality of service delivery.

48
3.11 CLOSURE In conclusion, there is no doubt that quality of customer services is a critical strategic
issue for public sector organisations. Especially those operating at local governmental
level, should not ignore pressure to improve customer service on a continuous basis.
Some pressure in the public sector arises internally from a genuine desire by managers
to improve the quality of services while further pressure is imposed through initiatives
like the White Paper on Transforming Public Service Delivery or the so-called ‘Batho
Pele’ White Paper that requires from government departments to improve service
delivery in terms of the eight ‘Batho Pele’ service delivery principles. In aspiring to these
principles and demonstrating its resolve to improve service quality, the Customer
Relations Management Division of the City of Tshwane (CoT) initiated a customer
satisfaction survey that presented customers an opportunity to provide their
perceptions of service delivery and to express their expectations regarding service
quality. The fact that customers typically assess service quality by comparing the service
they actually experience with the service they expect, the outcome of this survey is of
strategic importance for the CoT. The core survey findings emerging from the 2012
study in regions 5 and 7, display average to below-average satisfaction relative to the
type of customer interaction. The survey revealed key strategic focus areas that the CoT
needs to address to improve future customer satisfaction. It is recommended that the
CoT, in regions 5 and 7, focus primarily on those service items that recorded below-
average satisfaction ratings among customers who participated in the 2012 study.
However, the success of such strategies will depend on management’s commitment as
well as the degree to which management proactively resolves customer complaints
through the involvement of the customer. It is therefore recommended that service
quality standards and measurement be widely published so that the communities can
comment on the implementation thereof and voice their satisfaction with regards to the
set standards.