Embed Size (px)
Citation preview
2013-14 Customer Satisfaction Survey
Final Results
[Cases Closed April 1, 2013 through March 31, 2014]
Division of Blind Services (DBS) Clients
Page 1
Customer Satisfaction Survey
Report to theThe Florida Rehabilitation Council for the Blind
Customer Satisfaction Survey ofDivision of Blind Services’ Clients
2013 – 14Final Survey Results
DBS Employment Bound ClientsCases Closed April 1, 2013 to March 31, 2014
June 11, 2014
Dr. Minna Jia, Director
FSU Survey Research LaboratoryFlorida State University
FSU Survey Research Laboratory
College of Social Sciences and Public Policy
Dr. Minna Jia, Director
http://coss.fsu.edu/srl
Conducted for The Florida Rehabilitation Council for the Blind
Beginning in 2004, the Florida Rehabilitation Council for the Blind decided to collect customer satisfaction data on a more “real time” basis. Rather than conduct one survey that included all of the clients who had their cases closed the preceding year, the Council decided to have the data collected on a monthly basis and review the results at their quarterly meetings. This report summarizes the data collected for the 2013-14 fiscal year. This report includes cases closed between April 1, 2013 and March 31, 2014. The Customer Satisfaction Survey of former Division of Blind Services (DBS) clients gathers perspectives of former DBS clients concerning program services, levels of satisfaction, and areas for program improvement. This report describes the methods used and presents the 2013-14 results for clients with cases closed between April 1, 2013 and March 31, 2014. In the Fall of 2009, the Florida Rehabilitation Council for the Blind modified the previous survey to streamline the interviews and update information in new areas. Some minor modifications to this survey were made October 2010. Many of the items remained comparable or identical to the survey administered the previous 9 years. In these instances, data for the 10 previous years are provided for comparison purposes. For new questions, major modifications made to question wording, or questions asked of different populations (new screens), no comparisons to prior years can be made.
SURVEY PROCEDURESPopulation Surveyed. The Florida State University Survey Research Laboratory (SRL), College of Social Sciences, conducted a telephone survey of former Division of Blind Services (DBS) clients on a monthly basis. Employment-bound clients with cases “closed“ between April 1, 2013 and March 31, 2014 comprises the population surveyed for this year-end report. DBS provided the names, addresses, phone numbers and demographic information for 1,257 former clients. Case closures are classified into two major groupings, those with successful and unsuccessful closures.
Successful Closure –479 Clients
Closure Status 26
Unsuccessful Closure -- 778 Clients
Closure Status 28 –Unsuccessful after plan development
Closure Status 30 – Unsuccessful before plan development
Page 2

Survey Instrument. Originally, the Florida Rehabilitation Council for the Blind, in conjunction with FSU Survey Research Laboratory staff, developed the questionnaire in 2002. The FSU Survey Research Laboratory staff and the Council met and refined the questionnaire in the Fall of 2009. A couple of minor modifications to help the flow of the survey were made October 2010 (Appendix A contains the 2013-2014 Instrument). Many of the questions asking about the most and least helpful program services remain “open-ended.” This allows the clients to tell us in their own words about their views and have them recorded. The survey instrument continues to be translated into Spanish. Changes to the 2009-10 DBS Customer Survey instrument include:
Training Questions. Changes to questions concerning training experiences were minor, replacing the term DBS staff to more clearly focus on the DBS counselor. In order to make the interview process smoother, respondents were asked specifically if they participated in a particular training program (screened). If they answered “Yes”, then they were asked about their experience. In the prior version of the survey, respondents had to tell us that they did not have the training.
Employment Questions. To better focus the questions about employment, a new question asking whether or not they sought services to maintain or obtain employment. Only clients seeking employment services were asked the series of questions about employment training and satisfaction with their current job. Clients were also asked if they received a formal Vocational Evaluation and whether or not they were provided results of that Evaluation.
Respondent Characteristics. Questions about the specific services they received and whether they were a new or previous client of DBS were added.
Case Closure. When asking the open-ended question about why the client left the program, a number of them reported they did not know their case was closed. A new question to specifically ask the clients about their case closure was added.
Types of Services Received. A new series of questions asked clients whether they received the following services:
o Medical serviceso Assistance with education o Technical aids, equipment and/or softwareo Training in independent living skills.
Rights and Responsibilities. A question was added concerning the DBS Counselor informing them of their rights and responsibilities as a VR client.
Fieldwork. Paid interviewers are trained and monitored for this survey effort. The training explains program requirements and services, and helps develop the probes. Fieldwork is conducted in an ongoing manner. At the
Page 3
end of every month, the DBS sends a list of clients whose cases have been closed during that month. Interviewers then try to reach the clients. At least 5 attempts are made to reach the former DBS clients. Calls are rotated at different times of the day, and attempted during the week and weekends in order to maximize the chances of reaching the former client.
Nonworking numbers. When conducting a survey of former clients in any program, telephone numbers are often wrong: Clients move and the numbers are no longer in service; agency databases may not be updated at the time of case closure, and the like. Fifteen percent (183 of 1,257) of the telephone numbers attempted from May 1, 2013 to April 30, 2014 were nonworking. This is a slightly lower proportion of non-working numbers than in previous years: 2012-13 (17%), 2011-12 (20%), 2010-11 (22%), 2009-10 (25%), 2008-09 (29%), 2007-08 (30%) and 2006-07 (30%). In 2005-06, 38 percent of the numbers were non-working.
Sample Characteristics. The combined efforts of repeated attempts, callbacks, and obtaining new numbers resulted in completed interviews for 28% (n=353) of former clients (n=1,257) who left the program between April 1, 2013 and May 30, 2014. This response rate is slightly lower than the previous year where 35 percent of former clients participated in the Customer Survey. In 2011-12, 36 percent responded, while 30 percent responded in 2010-11 and 35 percent responded in 2009-10. In 2008-09, 31 percent of the clients participated. In 2007-08 (36%) and 2006-07 (36%) response rates were slightly higher. The response rates differ for those clients with cases successfully closed compared to unsuccessful closures. Response rates are higher for successful clients than for clients with unsuccessful case closures: In the 2013-14 Customer Survey 44 percent of clients with successful case closures (209 of 479) completed an interview. During 2012-13, 40 percent of those completing successfully completed an interview, while 45 percent completed an interview in 2011-12, 37 percent in 2010-11, 43 percent in 2009-10, and 40 percent in 2008-09 and 2007-08. Only 19 percent (144 of 778) of the clients whose cases were unsuccessfully closed participated in the 2013-14 Customer Survey. In 2012-11, 30 percent of the clients whose cases were unsuccessfully closed participated, while 28 percent participated in 2011-12, 26 percent participated in 2010-11, and 28 percent participated in 2009-10. During 2008-09, 23 percent of clients completed an interview while 27 percent of clients with unsuccessful closures in 2007-08 participated.
Refusals were lower than the previous year. Only 7 percent of potential respondents declining to participate (94 of 1,257) in the Customer Survey, compared to 11 percent in the previous year. This is a very low refusal rate for any type of survey. If we were able to “reach” the household, we had high cooperation. Refusal rates are typically low for this Customer Survey: In 2011-12 – 11%; in 2010-11 – 8%; 2009-10 – 9%; 2008-09 – 6%; 2007-08 – 11%; 2005 -06 – 5% and 2006-07 -- 5% of former DBS clients refused to participate.
Data Preparation and Analysis. FSU Survey Research Laboratory staff coded the open-ended data and used SPSS statistics to analyze the frequencies and patterns of responses. Besides reporting the data collected for the period between April 1, 2013 and March 31, 2014, this report provides comparative data between the other years surveyed: 2012, 2011, 2010, 2009, 2008, 2007, 2006, 2005, 2004, 2003, and 2002 when survey items are comparable.
Page 4
SURVEY RESPONDENTS & PROGRAM CHARACTERISTICS
Survey Respondent Characteristics
Most of the respondents are first-time clients. The 2013-2014 Customer Survey asked respondents if it was their first time as a DBS client. Fifty-one percent said this was their first time as a DBS client. Forty percent of the respondents reported they were a client before in Florida and only 9 percent were a client before in another state. (See Q2 in Appendix B.)
Clients participating in the survey received medical services and technical aid, equipment and software more than training and assistance with education. (See Q26 in Appendix B.) The respondents received:
Medical services – 53% Technical aids, equipment, and/or software – 62% Assistance with education – 39% Training in independent living skills such as orientation and mobility, cooking, personal management
and the like – 38%
Less than one-half of the respondents (42%) said they sought DBS services to obtain employment. Forty-one percent of the respondents sought services to maintain their current job while 17 percent sought services for other reasons.
Case Closure Status. More respondents whose cases were closed successfully (59%) participated in the 2013-14 Customer Survey than those whose cases were closed unsuccessfully (41%).
Learning about the Program
Clients hear about DBS services through the medical community and family or friends. When asked how they heard about and knew how to contact DBS for services nearly one-half of the clients (48%) identified people in the medical community, family members, or friends. Other sources of information about DBS services included school contacts, agencies, the media, and associations. Thirteen percent of all former clients said they had heard about DBS services from other agencies and twenty four percent stated they were previous clients of a blind services program. This was an open-ended question. The following lists the proportion of clients identifying how they learned about the program grouped by major category.
Respondent and Program Characteristics 2013-14 Page 5
Medical community 2013-14-25% (2012-25%) (2011-23%) (2010--27%) (2009 - 27%) (2008– 25%) (2007– 27%) (2006 -21%) (2005 -19%) (2004 -22%) (2003- 36%) (2002- 33%)
Family/Friends2013-14-23% (2012-23%) (2011-20% ) (2010--24%) (2009-25%) (2008– 19%) (2007– 22%) (2006 29%) (2005 21%) (2004 22%) (2003 18%) (2002 25%)
School Contacts2013-14-2% (2012-7%) (2011-7%) (2010-7%) (2009-10%) (2008– 10%) (2007– 7%) (2006 –14%) (2005– 15%) (2004–14%) (2003 –13%) (2002 –11%)
Previous Client/Program 2013-14-15% (2012-16%) (2011-24%) (2010-20%) (2009– 16% ) 2008– 15%) (2007– 14%) (2006– 18%) (2005 –23%) (2004 –16%) (2003– 16%) (2002 –13%)
Other Agencies2013-14-16% (2012--16%) (2011-13%) (2010-13%) (2009– 13%) (2008– 19%) (2007– 19%) (2006– 10%) (2005– 7%) (2004 –9%) (2003 –14%) (2002– 12%)
Associations2013-14-1% (2012-3%) (2011-3%) (2010-2%) (2009 – 1%) (2008– 1%) (2007– 3%) (2006– 1%) (2005– 2%) (2004– 2%) (2003 –3%) (2002– 3%)
General Information2013-14-9% (2012-11%) (2011-9%) (2010-7%) (2009– 8%) (2008– 12%) (2007– 9%) (2006– 7%) (2005 –7%) (2004 –9%) (2003– 4%) (2002– 6%)
Respondent and Program Characteristics 2013-14 Page 6

Counselor Responsiveness
Division of Blind Services (DBS) counselors are responsive to clients. Former clients were asked to rate their experiences with DBS counselors. These questions were modified slightly from the previous version of the Customer Survey administered between 2002 and 2008. In previous years the question was a bit more general and asked about “DBS staff”; in the new survey it was a bit more specific and refers to “DBS Counselors”. Prior year’s results are listed for comparative purposes.
Overall, DBS clients expressed a high level of satisfaction concerning their experiences and contact with program staff. (See Q3 to Q7, Q16 in Appendix B).
Experiences with Counselors. Access to counselors received the lowest rating with 82% of client reporting counselors were easy to contact “all or most of the time”.
DBS counselors were easy to contact 2013-14-82% (2012-79%) (2011-78%) (2010-85%) (2009– 84%) (2008–82%) (2007–86%) (2006 81%) (2005 87%) (2004 87%) (2003 85%) (2002 85%)
DBS counselors treated them in a professional manner2013-14-91% (2012-89%) (2011-90%) (2010-88%) (2009– 90%) (2008–88%) (2007–93%) (2006 90%) (2005 91%) (2004 92%) (2003 89%) (2002 84%)
DBS counselors were responsive to their requests for services2013-14-85% (2012-80%) (2011-81%) (2010-83%) (2009– 86%) (2008–82%) (2007–86%) (2006 84%) (2005 86%) (2004 87%) (2003 83%) (2002 83%)
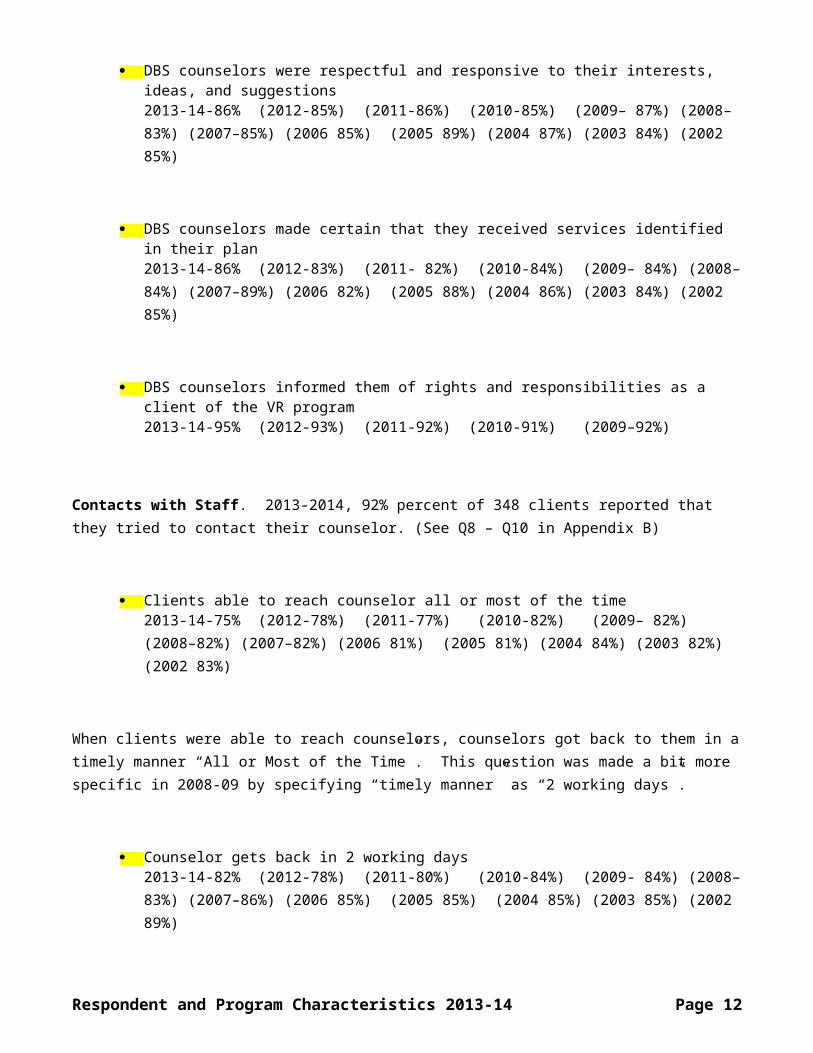
DBS counselors were respectful and responsive to their interests, ideas, and suggestions 2013-14-86% (2012-85%) (2011-86%) (2010-85%) (2009– 87%) (2008–83%) (2007–85%) (2006 85%) (2005 89%) (2004 87%) (2003 84%) (2002 85%)
DBS counselors made certain that they received services identified in their plan 2013-14-86% (2012-83%) (2011- 82%) (2010-84%) (2009– 84%) (2008–84%) (2007–89%) (2006 82%) (2005 88%) (2004 86%) (2003 84%) (2002 85%)
Respondent and Program Characteristics 2013-14 Page 7
DBS counselors informed them of rights and responsibilities as a client of the VR program2013-14-95% (2012-93%) (2011-92%) (2010-91%) (2009–92%)
Contacts with Staff. 2013-2014, 92% percent of 348 clients reported that they tried to contact their counselor. (See Q8 – Q10 in Appendix B)
Clients able to reach counselor all or most of the time2013-14-75% (2012-78%) (2011-77%) (2010-82%) (2009– 82%) (2008–82%) (2007–82%) (2006 81%) (2005 81%) (2004 84%) (2003 82%) (2002 83%)
When clients were able to reach counselors, counselors got back to them in a timely manner “All or Most of the Time”. This question was made a bit more specific in 2008-09 by specifying “timely manner” as “2 working days”.
Counselor gets back in 2 working days2013-14-82% (2012-78%) (2011-80%) (2010-84%) (2009- 84%) (2008–83%) (2007–86%) (2006 85%) (2005 85%) (2004 85%) (2003 85%) (2002 89%)
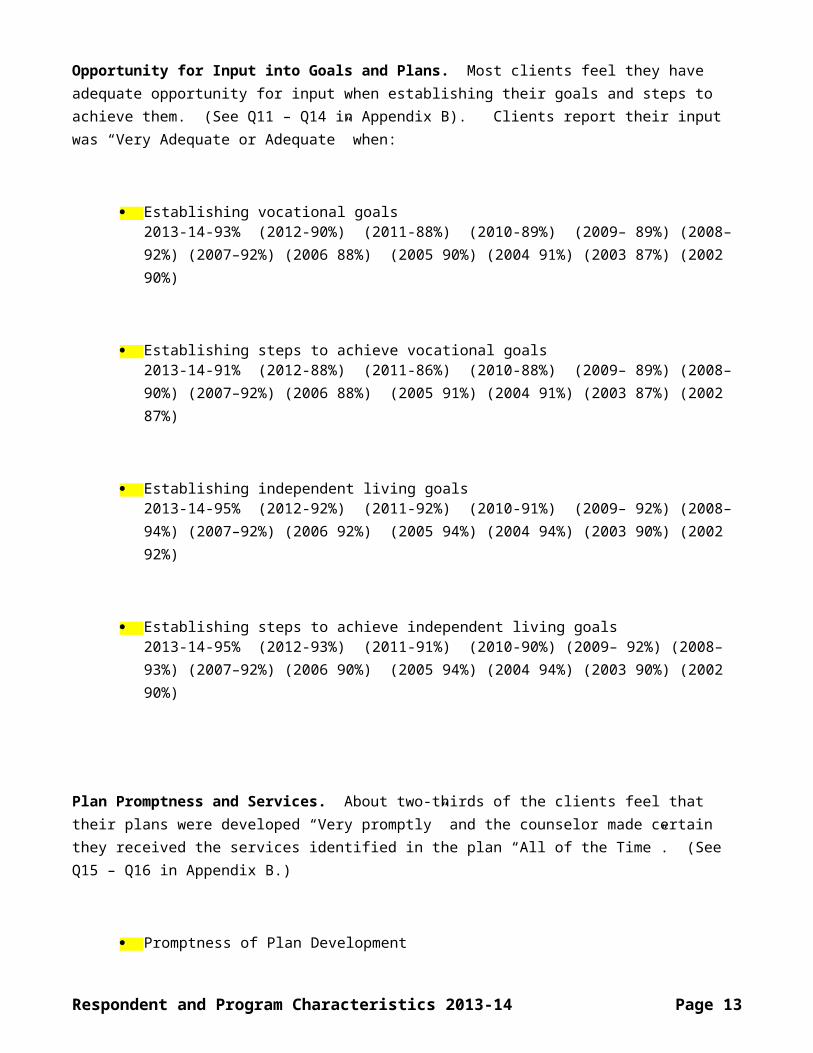
Opportunity for Input into Goals and Plans. Most clients feel they have adequate opportunity for input when establishing their goals and steps to achieve them. (See Q11 – Q14 in Appendix B). Clients report their input was “Very Adequate or Adequate” when:
Establishing vocational goals2013-14-93% (2012-90%) (2011-88%) (2010-89%) (2009– 89%) (2008–92%) (2007–92%) (2006 88%) (2005 90%) (2004 91%) (2003 87%) (2002 90%)
Establishing steps to achieve vocational goals2013-14-91% (2012-88%) (2011-86%) (2010-88%) (2009– 89%) (2008–90%) (2007–92%) (2006 88%) (2005 91%) (2004 91%) (2003 87%) (2002 87%)
Establishing independent living goals 2013-14-95% (2012-92%) (2011-92%) (2010-91%) (2009– 92%) (2008–94%) (2007–92%) (2006 92%) (2005 94%) (2004 94%) (2003 90%) (2002 92%)
Respondent and Program Characteristics 2013-14 Page 8

Establishing steps to achieve independent living goals 2013-14-95% (2012-93%) (2011-91%) (2010-90%) (2009– 92%) (2008–93%) (2007–92%) (2006 90%) (2005 94%) (2004 94%) (2003 90%) (2002 90%)
Plan Promptness and Services. About two-thirds of the clients feel that their plans were developed “Very promptly” and the counselor made certain they received the services identified in the plan “All of the Time”. (See Q15 – Q16 in Appendix B.)
Promptness of Plan Development 2013-14-67% (2012-64%) (2011-63%) (2010-66%) (2009– 66%) (2008–65%) (2007–64%) (2006 62%) (2005 63%) (2004 63%) (2003 56%) (2002 61%)
Received Services Identified in Plan 2013-14-60% (2012-83%) (2011- 82%) (2010-84%) (2009– 84%) (2008–84%) (2007–89%) (2006 82%) (2005 88%) (2004 86%) (2003 84%) (2002 85%)
Respondent and Program Characteristics 2013-14 Page 9
QUALITY OF SERVICES
The customer survey included a number of items related to the types and quality of services provided by the Division of Blind Services (DBS): Clients were asked about the materials provided, options suggested, transportation services, equipment, and training. (See Q21 – Q23 in Appendix B for more detailed information.)
Materials Provided in Accessible Formats. During 2013-14, 84 percent of all clients received materials in an accessible format [2012-81%, 2011-71%, 2010-70%; 2009-78%; 2008-83%; 2007-85%].
Transportation Needs. During 2013-14, 41 percent of the clients, reported they needed transportation [2012-44%, 2011-47%, 2010-39%; 2009-43%; 2008-54%; 2007-58; 2006-62%; 2005-58%; 2004-54%]. Among these clients, 84 percent strongly agreed or agreed that DBS provided adequate transportation when needed; in the previous two years, 2012-13 and 2011-12, 81 percent strongly agreed or agreed.
Equipment Needs Generally Met. Clients felt that DBS provided tools and equipment that help solve problems and allow them to work independently. During 2013-14, 90 percent of the clients (“Strongly Agreed or Agreed” that DBS provided equipment or accommodations they need for employment. In 2012-13, 88 percent strongly agreed or agreed, compared to 84% in 2011-12, 82% in 2010-2011, and 85% in 2009-10. This survey question was changed substantially in 2009, so comparisons with responses prior to 2009 cannot be made.
Quality of Services 2013-14 Page 10

EDUCATION AND TRAINING
The Customer Satisfaction Survey also explored clients’ experiences with education and training.
When plans required vocational school and/or rehabilitation center training, clients were sent to training. Clients were asked if their training plan required education at a college, vocational school and/or a rehabilitation center. During 2013-14, 46 percent of the clients reported their plans required this formal education [2012-43%, 2011-42%, 2010-40%, 2009-41%; 2008-38%; 2007-38%; 2006-38%; 2005—38%]. Of those with plans requiring education, DBS sent 82 percent of these clients to this type of training [2012-76%, 2011-68%, 2010-71%; 2009-72%; 2008-78%; 2007-78%; 2006-75%; 2005-84%]. (See Q18 and Q19 in Appendix B.)
Training Options Offered. Over three-fourths (78%) of the 329 clients responding reported their counselors offered different training options [2012-69%, 2011-68%, 2010-70%; 2009-66%]. This question replaced a similar one asked in surveys prior to 2009.
Education and Training 2013-14 Page 11
Training: Participation and Satisfaction
Participation in Training. The Customer Satisfaction Survey asked clients how satisfied they were with the training they received in a number of areas. Beginning with the 2009-2010 survey a specific question asking whether or not the client received training in the area was added to the instrument and then those who received the training were asked to rate it. In the previous version of the survey all clients were asked to rate the training and those telling us they did not receive the training did not rate the training. The independent living skills and orientation and mobility questions were changed in the 2009 so that comparison with prior year ratings is not available. In the other areas, comparisons with previous years can be made.
Between approximately one third and half of all clients received training in the following areas.
Orientation and mobility 2013-14-35% (2012-38%) (2011-34%) (2010-31%) (2009– 30%) Technology 2013-14-53% (2012-41%) (2011-41%) (2010-40%) (2009– 40%) (2008–57%) (2007–
53%) (2006-59%) (2005 45%) (2004 47%) Low vision 2013-14-50% (2012-40%) (2011-41%) (2010-36%) (2009– 40%) (2008–41%) (2007–
44%) (2006 45%) (2005 35%) (2004 33%)
Fewer clients received training in Braille, Independent Living Skills, and Career Counseling.
Braille 2013-14-23% (2012-13%) (2011-12%) (2010-11%) (2009–12%) (2008–17%) (2007–14%) (2006-20%) (2005-15%) (2004-16%)
Independent living skills 2013-14-27% (2012-25%) (2011-26%) (2010-23%) (2009– 24%) Career counseling 2013-14-31% (2012-20%) (2011-23%) (2010-17%) (2009– 18%)
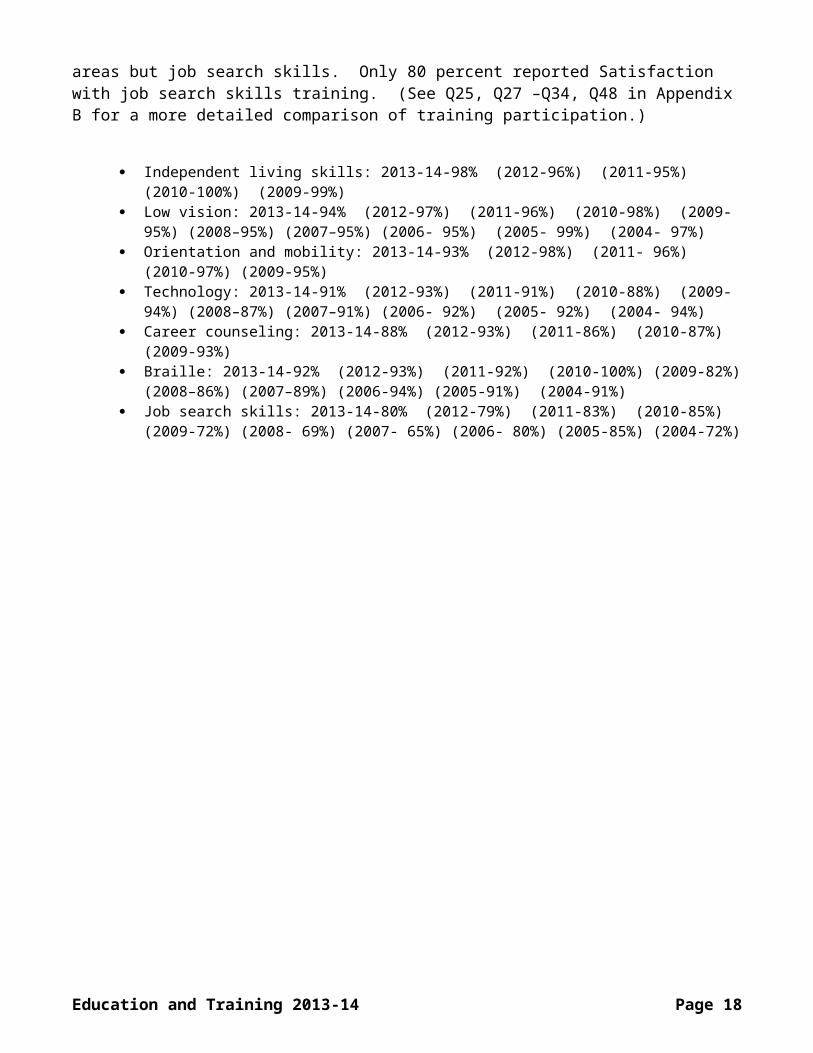
High Levels of Satisfaction with Training. Clients were asked how satisfied they were with training they received. Most clients (88 percent or more) were “Very Satisfied” or “Satisfied” training in all areas but job search skills. Only 80 percent reported Satisfaction with job search skills training. (See Q25, Q27 –Q34, Q48 in Appendix B for a more detailed comparison of training participation.)
Independent living skills: 2013-14-98% (2012-96%) (2011-95%) (2010-100%) (2009-99%) Low vision: 2013-14-94% (2012-97%) (2011-96%) (2010-98%) (2009-95%) (2008–95%) (2007–95%)
(2006- 95%) (2005- 99%) (2004- 97%) Orientation and mobility: 2013-14-93% (2012-98%) (2011- 96%) (2010-97%) (2009-95%) Technology: 2013-14-91% (2012-93%) (2011-91%) (2010-88%) (2009-94%) (2008–87%) (2007–
91%) (2006- 92%) (2005- 92%) (2004- 94%) Career counseling: 2013-14-88% (2012-93%) (2011-86%) (2010-87%) (2009-93%) Braille: 2013-14-92% (2012-93%) (2011-92%) (2010-100%) (2009-82%) (2008–86%) (2007–89%)
(2006-94%) (2005-91%) (2004-91%) Job search skills: 2013-14-80% (2012-79%) (2011-83%) (2010-85%) (2009-72%) (2008- 69%) (2007-
65%) (2006- 80%) (2005-85%) (2004-72%)
Education and Training 2013-14 Page 12
EMPLOYMENT SERVICES
Employment is a major goal of DBS services. Beginning in 2009-10 Customer Survey revisions streamlined and focused the employment questions more clearly. Therefore, comparisons with previous years are not appropriate due to the different client bases asked. In the previous surveys, clients with vocational goals in their plan or employed since leaving DBS were asked about experiences with employment services provided by DBS. The revised survey instrument asked the questions based on whether clients sought services to maintain their current job or to obtain employment, (See Q35 – Q50 in Appendix B).
Employment-related services received lower levels of customer satisfaction than other service areas. Other services and areas consistently receive higher ratings. Staff assistance in securing employment was rated the lowest of any service provided by DBS.
Clients Seeking Services to Maintain their Current Employment. Forty-one percent of the 347 responding clients sought services to maintain their current employment when they became a client of DBS. When asked if the DBS services helped them maintain their job, 90% percent “Strongly Agreed” or “Agreed”.
Clients Seeking Services to Obtain Employment. Forty-two percent of the 347 responding clients sought services to obtain employment. Sixty-five percent of these clients (134 of 206) reported they received a formal Vocational Evaluation. Seventy-seven percent of those receiving a formal Vocational Evaluation said they were provided results of that evaluation (102 of 132).
Job Skills Services. Seventy-three percent of the 176 clients indicated they “Strongly Agreed or Agreed” that DBS provided skills necessary to conduct a job search independently and 69 percent agreed that DBS services prepared them for employment.
Provide skills necessary to conduct job search (Strongly Agree/Agree)2013-14-73% (2012-72%) (2011-71%) (2010-65%) (2009-63%)
Services prepare for employment (Strongly Agree/Agree)2013-14-69% (2012-74%) (2011-64%) (2010-61%) (2009-62%)
Counselor assisted in securing employment (Strongly Agree/Agree)2013-14-55% (2012-59%) (2011-50%) (2010-48%) (2009-54%)
Employment Services 2013-14 Page 13

Characteristics of Jobs for Clients Seeking Services to Obtain Employment
Clients Currently Employed. During 2013-2014, 35 percent of the 206 clients who came to DBS to receive services to obtain employment reported they were employed during the time of the Customer Satisfaction Survey. (See Q42 – Q46 in Appendix B).
Present job in keeping with career goals (Strongly Agree/Agree)2013-14-84% (2012-87%) (2011-78%) (2010-82%) (2009-79%)
Potential career advancement (Strongly Agree/Agree)2013-14-32% (2012-66%) (2011-64%) (2010-65%) (2009-75%)
Current salary appropriate (Strongly Agree/Agree)2013-14-75% (2012-73%) (2011-77%) (2010-71%) (2009-74%)
Present job in keeping with DBS training (Strongly Agree/Agree)2013-14-66% (2012-65%) (2011-64%) (2010-52%) (2009-66%)
Employment Services 2013-14 Page 14

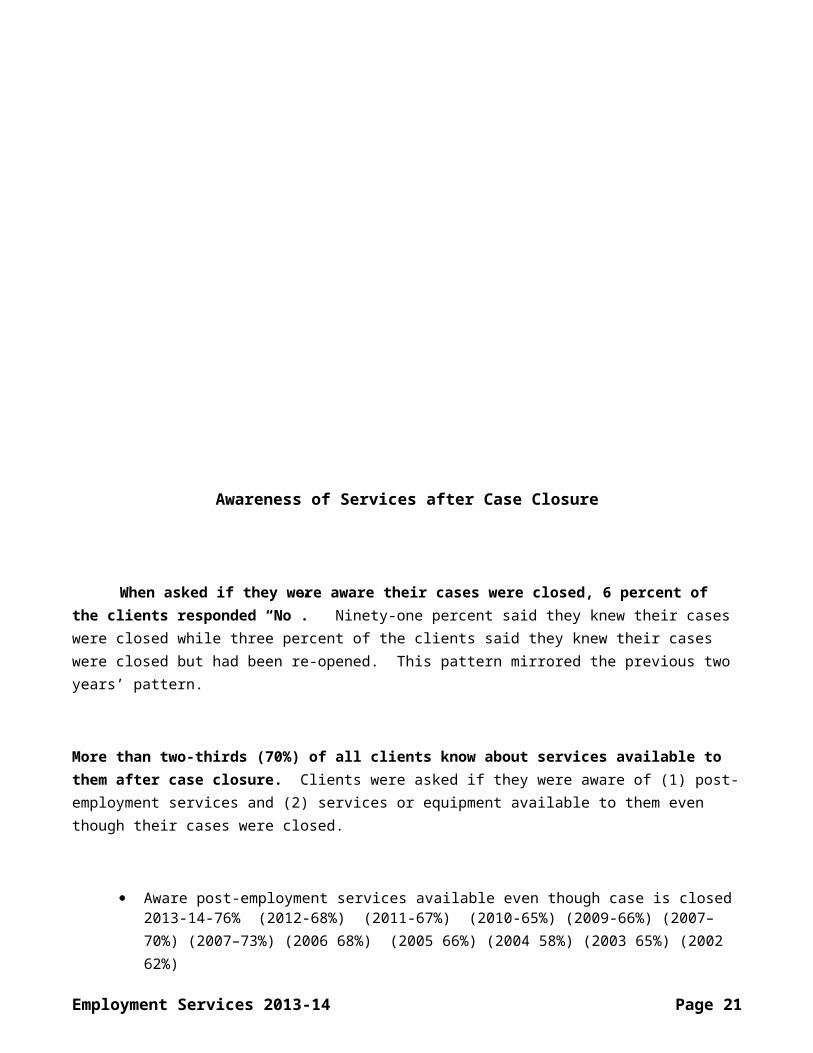
Awareness of Services after Case Closure
When asked if they were aware their cases were closed, 6 percent of the clients responded “No”. Ninety-one percent said they knew their cases were closed while three percent of the clients said they knew their cases were closed but had been re-opened. This pattern mirrored the previous two years’ pattern.
More than two-thirds (70%) of all clients know about services available to them after case closure. Clients were asked if they were aware of (1) post-employment services and (2) services or equipment available to them even though their cases were closed.
Aware post-employment services available even though case is closed2013-14-76% (2012-68%) (2011-67%) (2010-65%) (2009-66%) (2007–70%) (2007–73%) (2006 68%) (2005 66%) (2004 58%) (2003 65%) (2002 62%)
Aware services/equipment available even though case is closed2013-14-70% (2012-63%) (2011-63%) (2010-64%) (2009-61%) (2007–70%) (2007–73%) (2006 69%) (2005 68%) (2004 60%) (2003 65%) (2002 58%)
Employment Services 2013-14 Page 15

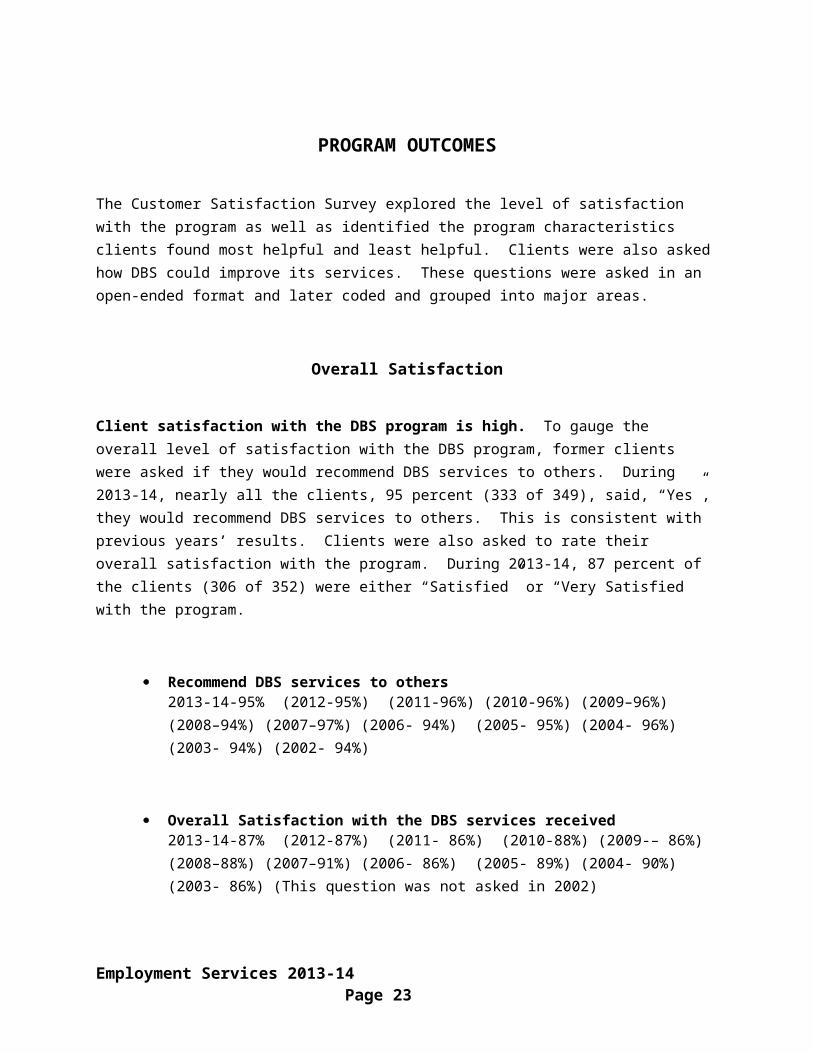
PROGRAM OUTCOMES
The Customer Satisfaction Survey explored the level of satisfaction with the program as well as identified the program characteristics clients found most helpful and least helpful. Clients were also asked how DBS could improve its services. These questions were asked in an open-ended format and later coded and grouped into major areas.
Overall Satisfaction
Client satisfaction with the DBS program is high. To gauge the overall level of satisfaction with the DBS program, former clients were asked if they would recommend DBS services to others. During 2013-14, nearly all the clients, 95 percent (333 of 349), said, “Yes”, they would recommend DBS services to others. This is consistent with previous years’ results. Clients were also asked to rate their overall satisfaction with the program. During 2013-14, 87 percent of the clients (306 of 352) were either “Satisfied” or “Very Satisfied with the program.
Recommend DBS services to others2013-14-95% (2012-95%) (2011-96%) (2010-96%) (2009–96%) (2008–94%) (2007–97%) (2006- 94%) (2005- 95%) (2004- 96%) (2003- 94%) (2002- 94%)
Overall Satisfaction with the DBS services received2013-14-87% (2012-87%) (2011- 86%) (2010-88%) (2009-– 86%) (2008–88%) (2007–91%) (2006- 86%) (2005- 89%) (2004- 90%) (2003- 86%) (This question was not asked in 2002)
Why Recommend Services. Clients were asked to explain the reasons why they would or would not recommend DBS services to others. When asked why they would recommend DBS services, 23 percent
Employment Services 2013-14Page 16

of the clients felt that the program and services were good and 45 percent felt that it provided the help that people need. The following lists the major reasons cited for recommending the program.
Good services and programs 2013-14-23% (2012-44%) (2011-31%) (2010-35%) (2009 – 29%) (2008–23%) (2007–36%) (2006- 43%) (2005- 38%) (2004- 40 %) (2003- 29%) (2002- 35%)
Helpful2013-14-47% (2012-31%) (2011-29%) (2010-27%) (2009– 32%) (2008–33%) (2007–26%) (2006- 31%) (2005- 34%) (2004- 30%) (2003 -26%) (2002- 31%)
Counselor Characteristics2013-14-8% (2012-11%) (2011-11%) (2010-15%) (2009 – 17%) (2008–17%) (2007–14%) (2006- 15%) (2005- 13%) (2004- 12%) (2003- 18%) (2002- 19%)
Independence/Community2013-14-8% (2012-8%) (2011-16%) (2010-12%) (2009 – 11%) (2008–19%) (2007–12%) (2006- 10%) (2005 -15%) (2004- 11%) (2003- 7%) (2002- 12%)
Employment services, training, financial help, medical services, only opportunity, and equipment features were also given as reasons.
Reasons for Not Recommending Services. Few clients offered reasons for not recommending DBS services to others.
Reasons for Leaving the Program. Former clients were asked why they left the program. One-fifth (20%) of the 349 clients responding stated they left since they obtained employment. In part, this question was asked to see if dissatisfaction with services could play a part in leaving the program (see
Employment Services 2013-14Page 17
Q54 in Appendix B). Dissatisfaction with services was one of the least cited reasons for leaving (3%). More than two-thirds of clients (68%) responding cited obtaining employment, medical services complete, used the time or benefits, personal decision, and completing the goal, plan or services as reasons for leaving the program.
Confusion over Case Closure. In response to the question, “Why did you leave the blind services program? (That is why was your case “Closed”?)”, a number of former clients were not aware that their cases were closed or expressed some other concern over their closure status. During 2008-09, 29 of the 286 clients (10%) reported some type of confusion about their case status [2007 -10%; 2006-11%; 2005 7%; 2004 10%]. In order to discover how many clients did not know their case had been closed, a specific question regarding the client’s closure status was added to the 2009-2010 Revised Customer Survey. (See Q51 in Appendix B). In the 2013-2014 survey, 6 percent of the 349 clients who were asked if they were aware that their case had been closed responded “No”, 91 percent responded “Yes”, and 3 percent said they were aware their cases were closed but had been re-opened.
Employment Services 2013-14Page 18

Assessment of Program
Former clients were asked a series of open-ended questions to assess the most helpful and least helpful program services they received. They also were asked what they would recommend to improve DBS services. Former clients were very positive about the program and its services.
Most Helpful Services. Training was cited as the most helpful service by 37 percent of the clients during 2013-2014, followed by Medical Services (22%) and Equipment (18%). Q55 in Appendix B lists the major categories of services clients found most helpful.
Equipment2013-14-18% (2012-36%) (2011-41%) (2010-20%) (2009-39%) (2008–42 %) (2007–44%) (2006- 40%) (2005- 34%) (2004 -37%) (2003 -28%) (2002 -24%)
Training2013-14-37% (2012-39%) (2011-39%) (2010-26%) (2009-32%) (2008–38 %) (2007–34%) (2006 -38%) (2005 -37%) (2004- 33 %) (2003- 42%) (2002- 40%)
Medical Services2013-14-22% (2012-15%) (2011-21%) (2010-22%) (2009-26%) (2008–19%) (2007–16%) (2006- 16%) (2005- 12%) (2004 -13%) (2003- 17%) (2002- 20%)
Counselors2013-14-3% (2012-11%) (2011-13%)(2010-9%) (2009-11%) (2008–14%) (2007–11%) (2006- 11%) (2005- 11%) (2004- 15%) (2003- 13%) (2002- 8%)
Employment2013-14-11% (2012-5%) (2011-5%) (2010-2%) (2009-6%) (2008–8 %) (2007–3%) (2006- 7%) (2005- 10%) (2004- 7%) (2003- 6%) (2002- 6%)
Employment Services 2013-14Page 19

Services2013-14-3% (2012-1%) (2011-1%) (2010-2%) (2009-2%) (2008–3%) (2007–6%) (2006- 3%) (2005- 5%) (2004- 3%) (2003- 6%) (2002- 6%)
Financial2013-14-1% (2012-5%) (2011-2%) (2010-1%) (2009-1%) (2008–5 %) (2007–2%) (2006- 3%) (2005- 2%) (2004- 3%) (2003- 2%) (2002- 5%)
Education2013-14-9% (2012-10%) (2011-9%) (2010-6%) (2009-9%) (2008–8 %) (2007– 10%) (2006- 6%) (2005- 5%) (2004- 10%) (2003- 7%) (2002 -10%)
Transportation2013-14-1% (2012-2%) (2011-3%) (2010-1%) (2009-2%) (2008–3 %) (2007–3%) (2006- 5%) (2005- 2%) (2004- 2%) (2003- 2%) (2002- 3%)
Everything Helpful2013-14-5% (2012--2%) (2011-4%) (2010-6%) (2009-4%) (2008–3%) (2007–3%) (2006-6%) (2005- 8%) (2004- 3%) (2003- 2%) (2002- 2%)
Nothing Helpful2013-14-4% (2012--3%) (2011- 3%) (2010-5%) (2009-3%) (2008–2%) (2007–2%) (2006- 3%) (2005- 2%) (2004- 4%) (2003- 5%) (2002- 5%)
Employment Services 2013-14Page 20
Least Helpful Services. Former clients were asked to identify the least helpful services they received. Fifty-one percent of former clients offering suggestions (n=285) indicated that the program was “fine”. Training, counselors and service, and employment services were mentioned as services considered least helpful by clients responding to this question.
Everything is Fine2013-14-51% (2012-49%) (2011-62%) (2010-55%) (2009-48%) (2008–57 %) (2007–69%) (2006- 60%) (2005- 60%) (2004- 58% (2003- 54%) (2002- 58%)
Training2013-14-12% (2012-17%) (2011-14%) (2010-17%) (2009-13%) (2008–13%) (2007–10%) (2006- 16%) (2005- 14%) (2004- 14%) (2003 -13%) (2002- 15%)
Counselors and Service2013-14-10% (2012-14%) (2011-15%) (2010-11%) (2009-15%) (2008–16 %) (2007–11%) (2006- 12%) (2005- 10%) (2004- 10%) (2003- 15%) (2002- 16%)
Employment2013-14-11% (2012-12%) (2011-5%) (2010-9%) (2009-14%) (2008–9 %) (2008–97%) (2007–6%) (2006- 8%) (2005- 11%) (2004- 11%) (2003- 9%) (2002- 7%)
Medical Services2013-14-2% (2012-3%) (2011-1%) (2010-2%) (2009-4%) (2008–1 %) (2007–2%) (2006- 1%) (2005- 1%) (2004- 2%) (2003 -1%) (2002- 1%)
Financial 2013-14-0% (2012-1%) (2011-1%) (2010-2%) (2009-1%) (2008–1 %) (2007–1%) (2006- 1%) (2005 -1%) (2004- 1%) (2003- 1%) (2002- 1%)
Transportation2013-14-9% (2012-2%) (2011-2%) (2010-4%) (2009-4%) (2008–2 %) (2007–1%) (2006- 2%) (2005 -2%) (2004- 4%) (2003- 7%) (2002 -5%)
Employment Services 2013-14Page 21

Program Improvements. In response to the question, “How could DBS improve its services?” Forty-six percent of clients responding (153 of 333) indicated that no improvement was needed. Suggestions for improvements include:
No improvement needed2013-14-46% (2012-45%) (2011-47%) (2010-43%) (2009-45%) (2008–44%) (2007–50%) (2006- 46%) (2005- 51%) (2004- 48% (2003- 49%) (2002- 34%)
Counselors2013-14-7% (2012-26%) (2011-29%) - (2010-25%) (2009-24%) (2008–24 %) (2007–22%) (2006- 23%) (2005- 18%) (2004- 20% (2003- 32%) (2002- 33%)
Employment2013-14-6% (2012-4%) (2011-6%) (2010-5%) (2009-7%) (2008–8 %) (2008–97%) (2007–5%) (2006- 7%) (2005- 7%) (2004- 12%) (2003- 8%) (2002- 9%)
Funding/Staffing2013-14-4% (2012-5%) (2011-6%) (2010-8%) (2009-4%) (2008–7%) (2007–8%) (2006- 7%) (2005- 7%) (2004- 7%) (2003- 8%) (2002- 9%)
Services and Programs2013-14-12% (2012-13%) (2011-8%) (2010-6%) (2009-7%) (2008–8 %) (2007–8%) (2006- 7%) (2005- 7%) (2004- 6%) (2003- 9%) (2002- 8%)
Advertise2013-14-3% (2012-2%) (2011-2%) (2010-<1%) (2009-5%) (2008–4%) (2007–3%) (2006- 6%) (2005- 5%) (2004- 3%) (2003- 6%) (2002- 6%)
Training 2013-14-2% (2012-2%) (2011-2%) (2010-9%) (2009- 4%) (2008–3 %) (2007–3%) (2006- 5%) (2005- 4%) (2004- 3%) (2003- 4%) (2002- 5%)
Employment Services 2013-14Page 22
Transportation2013-14-2% (2012-3%) (2011-3%) (2010-1%) (2009-3%) (2008–3 %) (2007–3%) (2006- 3%) (2005- 3%) (2004- 3%) (2003- 2%) (2002- 4%)
Financial 2013-14-1% (2012-1%) (2011-<1%) (2010-<1%) (2009-1%) (2008–1 %) (2007–1%) (2006- 2%) (2005- 2%) (2004- 1%) (2003- 0%) (2002- 2%)
Equipment2013-14-1% (2012-1%) (2011-<1%) (2010-1%) (2009-1%) (2008–1%) (2007–1%) (2006- 2%) (2005- 0%) (2004- 3%) (2003- 2%) (2002- 2%)
Employment Services 2013-14Page 23