Embed Size (px)
Citation preview
Customer Satisfaction Research (Q4 2014/15) Summary of Data April – June 2015
Prepared for
Prepared by newfocus Pty Ltd
June, 2015 nf:8338-ld/am
Contents 1. Executive Summary (Key Insights) ................................................................................................................................. 1
2. About this Report ............................................................................................................................................................ 4
3. Summary of Results ....................................................................................................................................................... 6
3.1 Overall Customer Satisfaction Results ............................................................................................................... 6 3.2 Customer Satisfaction Results – Aligned with ESCOSA Service Standards .................................................. 12
4. Results by Channel / Customer Service Area .............................................................................................................. 13
4.1 Customer service centre (CSC) ....................................................................................................................... 13
4.2 Faults and Service Problems ........................................................................................................................... 16
4.3 Customer experience ....................................................................................................................................... 25
4.4 Water quality .................................................................................................................................................... 32
4.5 Billing ................................................................................................................................................................ 36
4.6 Written correspondence ................................................................................................................................... 38
4.7 Connections ..................................................................................................................................................... 40
___________________________ Figure 1a: Total All Customers Satisfaction Results (Q44) ................................................................................................................................ 7
Figure 1b: Total All Customers Satisfaction Results – split by location (Q44) ................................................................................................... 7
Figure 1c: Residential Customers Satisfaction Results – split by location (Q44)............................................................................................... 8
Figure 1d: Business Customers Satisfaction Results – split by location(Q44)................................................................................................... 8
Figure 2: Summary Results ................................................................................................................................................................................ 9
Figure 2a: Advocacy by touchpoint .................................................................................................................................................................. 10
Figure 3: Customer Satisfaction with Timeliness – split by location ................................................................................................................. 12
Figure 4: Customer Satisfaction with the customer service centre (Q7) .......................................................................................................... 13
Figure 4a: Customer Satisfaction with the customer service centre – split by location (Q7) ........................................................................... 14
Figure 5: Drivers of Satisfaction (Ranked in order of importance) – Customer Service Centre ....................................................................... 15
Figure 6: Customer Satisfaction with faults and services (Q16, Q17) .............................................................................................................. 17
Figure 7: Drivers of Satisfaction (Ranked in order of importance) – Faults and Services................................................................................ 17
Figure 8: Customer Satisfaction with faults and services – split by location (Q16, Q17) ................................................................................. 18
Figure 9: Customer Satisfaction with faults and services - split by region (Q16, Q17) .................................................................................... 19
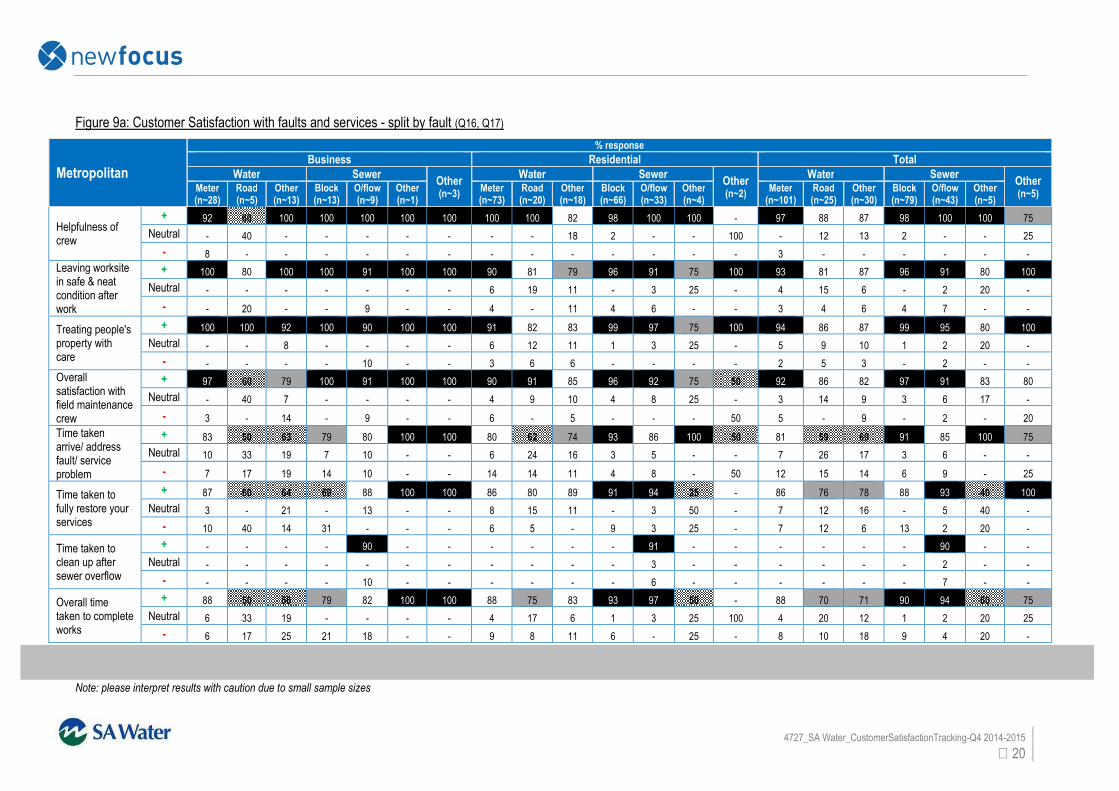
Figure 9a: Customer Satisfaction with faults and services - split by fault (Q16, Q17) ..................................................................................... 20
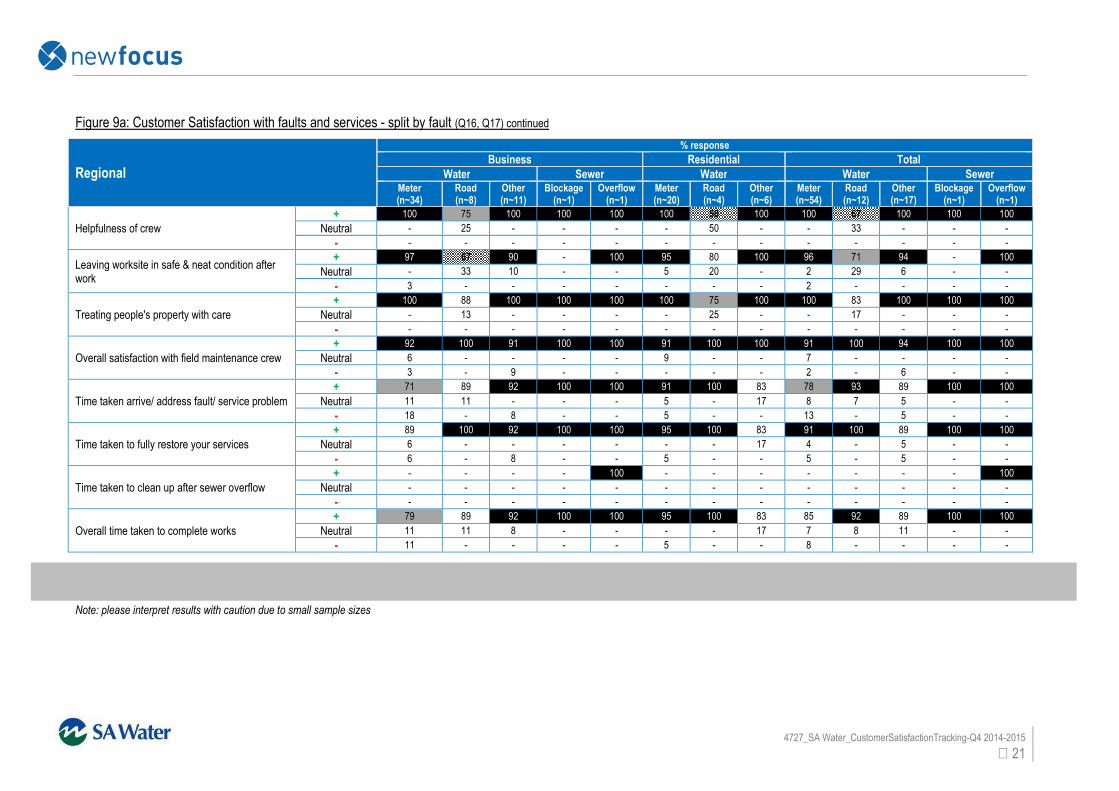
Figure 9a: Customer Satisfaction with faults and services - split by fault (Q16, Q17) continued ..................................................................... 21
Figure 9a: Customer Satisfaction with faults and services - split by fault (Q16, Q17) continued ..................................................................... 22
Figure 10: Tracking: Customer Satisfaction with faults & services – metro areas – split by quarter (Q16, Q17) ............................................ 23
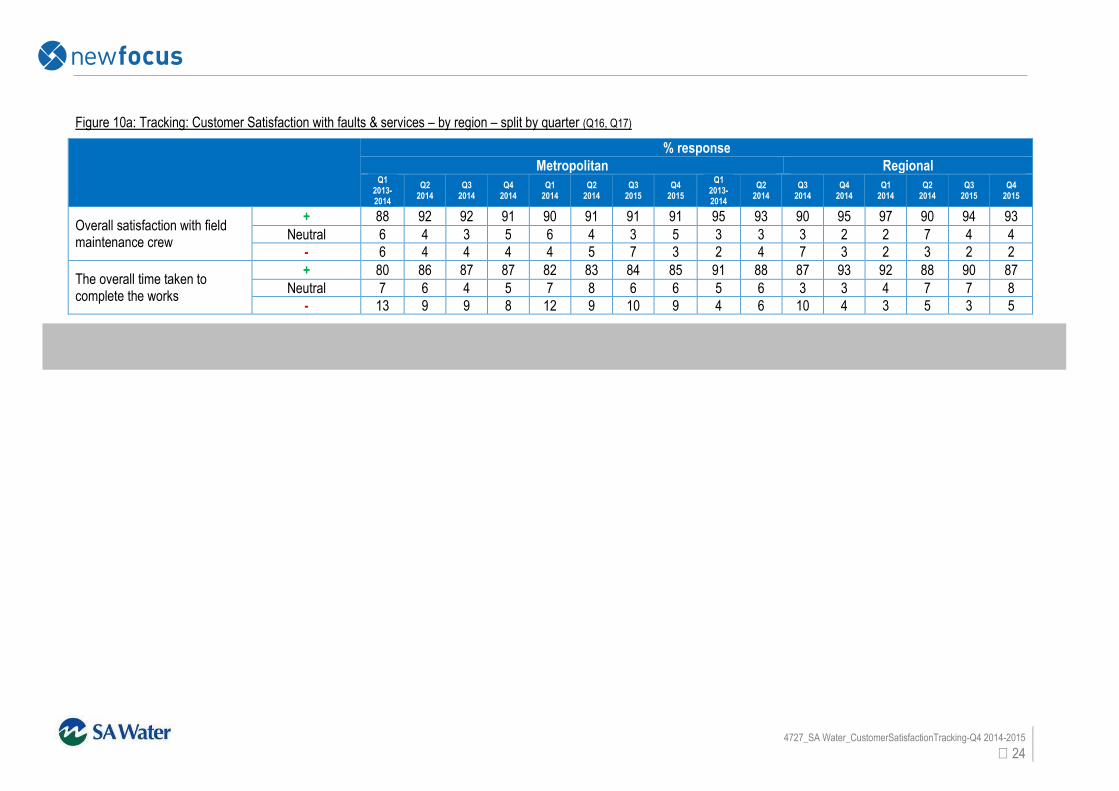
Figure 10a: Tracking: Customer Satisfaction with faults & services – by region – split by quarter (Q16, Q17) ............................................... 24
Figure 11: Customer Satisfaction with problem resolution (Q10N13) .............................................................................................................. 27
Figure 11a: Satisfaction with SA Water’s effort by touchpoint (Q10N13) ......................................................................................................... 27
Figure 12: How many times did you contact SA Water to resolve this specific issue (Q14N13) .................................................................... 27
Figure 13: Ease of doing business (Q19N14) ................................................................................................................................................. 27
Figure 14: Customer effort by touchpoint (Q21N14) ........................................................................................................................................ 28
Figure 15: Supplier of choice (Q22N14) .......................................................................................................................................................... 28
Figure 16: Last contact type (Q51) - was this the preferred way of contact (Q35N14) ................................................................................... 28
Figure 17: Preferred way to be contacted by SA Water (Q18N14) ................................................................................................................. 28
Figure 18a: Advocacy – Total (Q36n14, Q37n14) ........................................................................................................................................... 29
Figure 18b: Advocacy – Residential (Q36n14, Q37n14) ................................................................................................................................. 30
Figure 18c: Advocacy – Business (Q36n14, Q37n14) .................................................................................................................................... 31
Figure 19: Customer Satisfaction with water quality (Q38) .............................................................................................................................. 32
Figure 20: Drivers of Satisfaction (Ranked in order of importance) – Water Quality ....................................................................................... 33
Figure 21: Satisfaction of water quality based on regular vs. not regular tap water drinker – Residential (Q38, Q17N14) ............................ 33
Figure 22: Satisfaction of water quality based on regular vs. not regular tap water drinker - Business (Q38, Q17N14) ................................ 34
Figure 23: Customer Satisfaction with water quality by location (Q38) ............................................................................................................ 35
Figure 24: Affordability of SA Water bill (Q4N14) ............................................................................................................................................. 36
Figure 25: Preference to receive SA Water bill (Q5N14) ................................................................................................................................. 36
Figure 26: Choice of meter reading frequency (Q7N14) .................................................................................................................................. 36
Figure 27: Appeal to read own meter for bill (Q8N14)...................................................................................................................................... 37
Figure 28: Awareness of what to do if have trouble paying SA Water bill (Q10N14) ....................................................................................... 37
Figure 29: Financial stress indicator (Q9N14) .................................................................................................................................................. 37
Figure 30: Customer satisfaction with timeliness of SA Water’s response by customer contact type (Q4N13) .............................................. 38
Figure 31: How long did it take for you to receive a response to your email/letter? (Q3N13) .......................................................................... 38
Figure 32: Satisfaction with written response from SA Water – split by contact type (Q5N13) ...................................................................... 39
Figure 33: Drivers of Satisfaction (Ranked in order of importance) – Written Correspondence ...................................................................... 39
Figure 34: Satisfaction with handling correspondence by having to contact SA Water about this issue again for any reason (Q7N13, Q6N13) ............................................................................................................................................................................................................. 39
Figure 35: Customer satisfaction with connection by location ........................................................................................................................ 40
Figure 36: Contacted and advised of the date the work would occur (Q29N14).............................................................................................. 41
Figure 37: Connection request for vacant land (Q30N14)................................................................................................................................ 41
Figure 38: Notice given (number of days) (Q31N14) ....................................................................................................................................... 41
Figure 39: Notice preference (number of days) (Q32N14) ............................................................................................................................... 41
Figure 40: Drivers of Satisfaction (Ranked in order of importance) – Land development/connections ........................................................... 42

4727_SA Water_CustomerSatisfactionTracking-Q4 2014-2015
1
1. Executive Summary (Key Insights)
Between 22nd April and 15th June 2015 telephone interviews were conducted with 801 customers who recently
had a service experience with SA Water. These are the results from the fourth quarter 2014-2015.
Overall Q4 findings
The key findings from the research are as follows:
• overall customer satisfaction with SA Water is at 81%, only 4% below SA Water’s Strategic Plan target of
85% (highest score recorded for SA Water)
− satisfaction growth has been halted by the regional sector which last quarter dropped 2% in
satisfaction and saw a growth of 4% in those who are dissatisfied
• the following channels have achieved the highest levels of overall satisfaction (illustrated in figure 2):
− field maintenance crew - faults (92% resident satisfaction, 92% business satisfaction)
− connections office staff (93% resident satisfaction, 100% business satisfaction)
− field maintenance crew - connections (90% resident satisfaction, 100% business satisfaction)
• the areas of customer service with levels of overall satisfaction
were:
− handling of correspondence (63% residential satisfaction) − keeping you informed of the progress of your query or problem (69% residential satisfaction, 55%
business satisfaction)
• overall, 44% of business and 48% of residential customers were likely to tell others about their SA Water
experience and likely to speak positively (promoters)
− 12% of business and 12% of residential customers were likely to tell others about their SA Water
experience and likely to speak negatively (vocal detractors)
• if given a choice of provider, 81% of customers would choose SA Water
Customer Service Centre (CSC)
• the CSC scored 90% positive satisfaction among residents and 86% among businesses both of which
− results were slightly higher among residential customers compared to the business sample across
most of the attributes measured
− similarly, metropolitan callers remain slightly more satisfied than their regional counterparts

4727_SA Water_CustomerSatisfactionTracking-Q4 2014-2015
2
Faults and service problems
• for faults and service issues, results remain at best practice standards with 92% overall satisfaction with the
service provided by the field maintenance crews
− best practice satisfaction levels (above 90% combined satisfied and very satisfied results) were
achieved among both the residential and business segments for crew performance with regard to:
o helpfulness of crew
o leaving the worksite in a safe and neat condition after work
o treating people’s property with care
o overall satisfaction with field maintenance crew
o the crew working efficiently while they were on site
• faults and services timeliness:
− this quarter has seen improvement is satisfaction with timeliness, especially amongst the business
group:
o time taken to arrive to address the fault/service problem has increased by 5% to 78% this
quarter
o overall time taken to complete the works has increased 1% to 80% to
• analysis by region:
− satisfaction among regionally based businesses and residents are directionally higher than those
for metropolitan businesses and residents
− across metropolitan and regional many measures achieved best practice satisfaction. Differences
to this across locations include:
o the crew worked efficiently while they were on site is less positive for metropolitan
businesses,
o time taken to arrive to address the fault/service problem achieved higher satisfaction with
residents when compared to business (metropolitan businesses – 77%, rural business – 79%)
o satisfaction with time taken to fully restore your services for
metropolitan businesses (78%) while rural customers overall are more satisfied (regional –
92%, metropolitan – 85%)
o satisfaction with the overall time taken to complete the works for
metropolitan business (77%)
Water quality
• total satisfaction with water quality increased by 3% this quarter to 81%,
range:
− this quarter, there is a 7% difference in satisfaction between customer types (83% residential,
previously 79%; 76% business, previously 76%)
− tap water with an additional filter (46%), tap water (28%) and rain water/tank water (18%) were the
main sources of drinking water across the samples
− colour and pressure of water remain the top performing attributes in regard to water quality
o smell/odour
o overall quality (business only)
− taste continues to be the area of lowest satisfaction with results
across both customer types and locations:
o taste is also a concern for regular drinkers of tap water with no additional filter
o taste has the highest levels of dissatisfaction among customers surveyed (nearly a quarter
of all respondents are dissatisfied with taste)
o regular drinkers of tap water (with no additional filter) were much more satisfied with the
water quality attributes tested compared to those who do not regularly drink tap water
Clause 7(1)(a), Clause 7(1)(b)
4727_SA Water_CustomerSatisfactionTracking-Q4 2014-2015
3
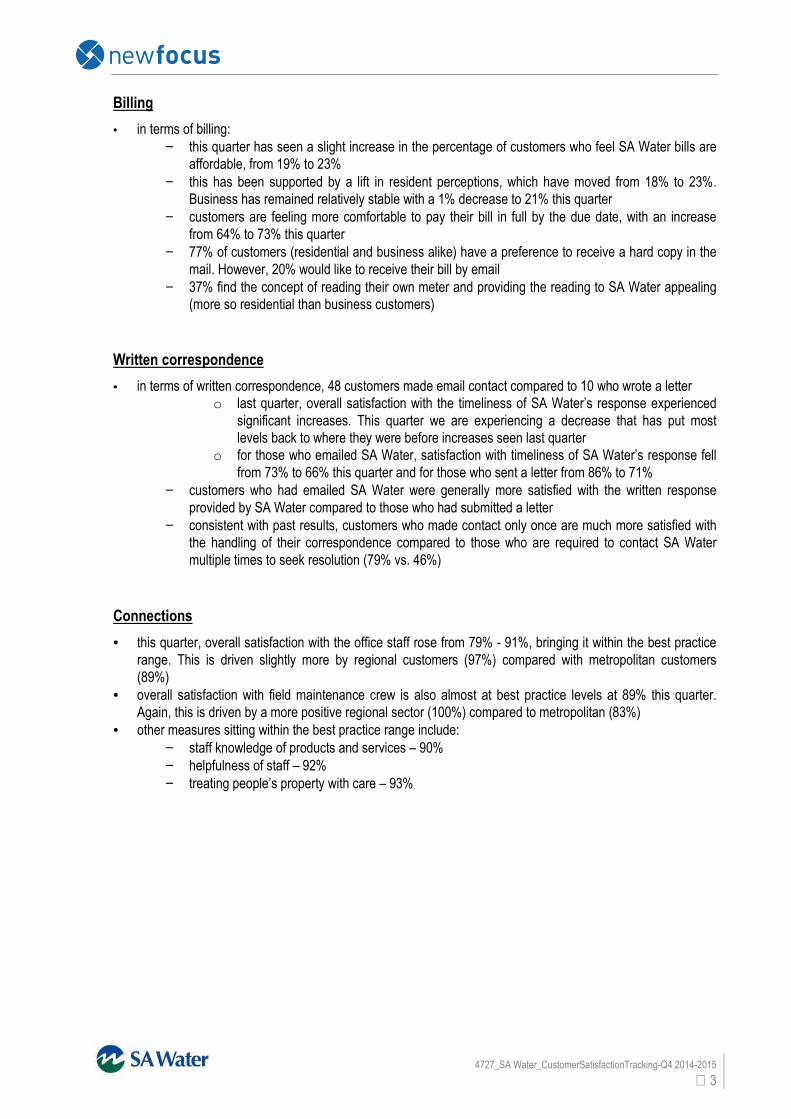
Billing
• in terms of billing:
− this quarter has seen a slight increase in the percentage of customers who feel SA Water bills are
affordable, from 19% to 23%
− this has been supported by a lift in resident perceptions, which have moved from 18% to 23%.
Business has remained relatively stable with a 1% decrease to 21% this quarter
− customers are feeling more comfortable to pay their bill in full by the due date, with an increase
from 64% to 73% this quarter
− 77% of customers (residential and business alike) have a preference to receive a hard copy in the
mail. However, 20% would like to receive their bill by email
− 37% find the concept of reading their own meter and providing the reading to SA Water appealing
(more so residential than business customers)
Written correspondence
• in terms of written correspondence, 48 customers made email contact compared to 10 who wrote a letter
o last quarter, overall satisfaction with the timeliness of SA Water’s response experienced
significant increases. This quarter we are experiencing a decrease that has put most
levels back to where they were before increases seen last quarter
o for those who emailed SA Water, satisfaction with timeliness of SA Water’s response fell
from 73% to 66% this quarter and for those who sent a letter from 86% to 71%
− customers who had emailed SA Water were generally more satisfied with the written response
provided by SA Water compared to those who had submitted a letter
− consistent with past results, customers who made contact only once are much more satisfied with
the handling of their correspondence compared to those who are required to contact SA Water
multiple times to seek resolution (79% vs. 46%)
Connections
• this quarter, overall satisfaction with the office staff rose from 79% - 91%, bringing it within the best practice
range. This is driven slightly more by regional customers (97%) compared with metropolitan customers
(89%)
• overall satisfaction with field maintenance crew is also almost at best practice levels at 89% this quarter.
Again, this is driven by a more positive regional sector (100%) compared to metropolitan (83%)
• other measures sitting within the best practice range include:
− staff knowledge of products and services – 90%
− helpfulness of staff – 92%
− treating people’s property with care – 93%
4727_SA Water_CustomerSatisfactionTracking-Q4 2014-2015
4
2. About this Report
Context
In 2012, SA Water commenced an enhanced customer research program with a commitment to include quarterly
customer satisfaction research with recent contact customers. A new survey was designed in consultation with
key internal stakeholders to reflect business needs across the Corporation, in particular regulatory needs and
alignment with ESCOSA service standards.
This report provides the results from Quarter 4 2014/15.
Reading the results
newfocus benchmarks for customer satisfaction:
In most instances data is presented as percentages for:
• satisfaction (+) – total customers who have answered either satisfied or very satisfied on the scale
• neutral satisfaction – customers who have answerer neither satisfied nor dissatisfied on the scale
• dissatisfaction (-) – total customers who have answered with dissatisfied or very dissatisfied on the scale
Due to rounding some scores may range from 99% to 101%.
Sample sizes have been included in all tables as “n”. The n value represents the total number of respondents
included in the study and the number of respondents who answered a specific question (excluding ‘don’t know’
responses except where noted). Where sample sizes are small, results should not be considered on their own,
rather as an indicator only. In some cases n~ is used. This represents the average number of respondents across
two or more questions.
Results are segmented by location and customer type (residential, business) where relevant.
The results reference:
• industry accepted benchmark ranges for customer service
• results which relate to ESCOSA service standards
• SA Water Strategic Plan KPIs
Survey methodology

4727_SA Water_CustomerSatisfactionTracking-Q4 2014-2015
5
SA Water provided newfocus with recent contact customer data using extracts from CSIS and Maximo. Data
extracts consisted of customers who had contacted SA Water by phone and written correspondence.
Customer Type Location Sample size
Recent contact customers (residential) Metro 401
Regional 100
Sub-total 501
Recent contact customers (business)
Metro 108
Regional 86
Both 6
Sub-total 200
Land development/connections Mix 100
Sub-total 100
TOTAL 801 Customers
Breakdown by touchpoint and call nature
Contact touch point Call nature Sample size
Customer Service Centre
Fault/service problem 475
Account and/or general enquiry 226
Complaint -
Land development and/or connection Land development and/or connection 100
Written contact Email
58 Letter contact
TOTAL 801
Identifying drivers of customer satisfaction
Using statistical analysis techniques including regression and correlation analysis, the results have been
analysed to identify drivers of customer satisfaction.
This is important to consider when interpreting the results because it identifies what is of most importance to
customers. The best results deliver high satisfaction against the measures which are of most importance to
customers.
Where possible, regression results have been highlighted in the results throughout this report.

4727_SA Water_CustomerSatisfactionTracking-Q4 2014-2015
6
3. Summary of Results
3.1 Overall Customer Satisfaction Results
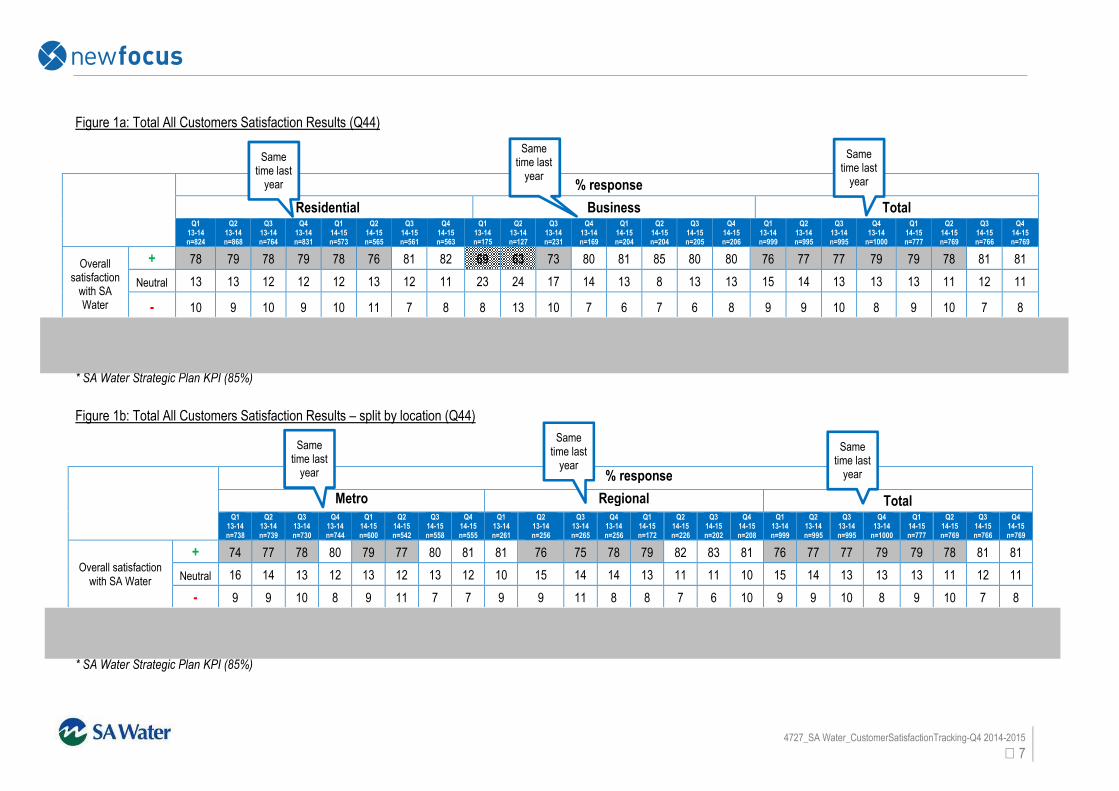
As illustrated in Figure 1a over the page, overall customer satisfaction with SA Water has remained stable this
quarter at 81%. This is still below the SA Water Strategic Plan KPI of 85%
However, looking back over the last 2 years the longer term trend paints a positive picture with
directional uplifts with both residential and business customers.
Further growth in satisfaction is currently being halted by the regional sector which in the last quarter dropped 2%
in satisfaction and saw a growth of 4% in those who are dissatisfied. This drop is being driven by regional
business where satisfaction has fallen 7% over the last quarter to 79%,
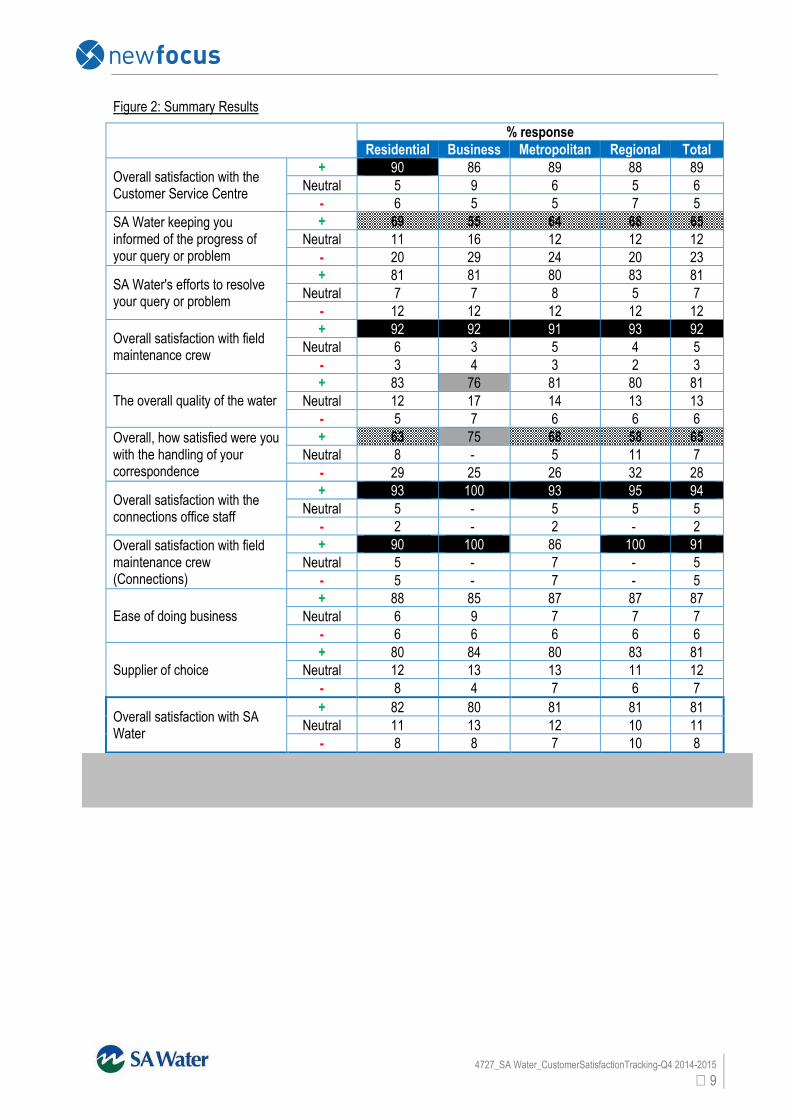
The following channels have achieved the highest levels of overall satisfaction (illustrated in figure 2 overleaf):
• field maintenance crew - faults (92% resident satisfaction, 92% business satisfaction)
• connections office staff (93% resident satisfaction, 100% business satisfaction)
• field maintenance crew - connections (90% resident satisfaction, 100% business satisfaction)
The areas of customer service were:
• handling of correspondence (63% residential satisfaction) • keeping you informed of the progress of your query or problem (69% residential satisfaction, 55% business
satisfaction)
Further information regarding a breakdown of the results can be found in the relevant sections of this report.
4727_SA Water_CustomerSatisfactionTracking-Q4 2014-2015
7
Figure 1a: Total All Customers Satisfaction Results (Q44)
% response
Residential Business Total
Q1
13-14 n=824
Q2 13-14 n=868
Q3 13-14 n=764
Q4 13-14 n=831
Q1 14-15 n=573
Q2 14-15 n=565
Q3 14-15 n=561
Q4 14-15 n=563
Q1 13-14 n=175
Q2 13-14 n=127
Q3 13-14 n=231
Q4 13-14 n=169
Q1 14-15 n=204
Q2 14-15 n=204
Q3 14-15 n=205
Q4 14-15 n=206
Q1 13-14 n=999
Q2 13-14 n=995
Q3 13-14 n=995
Q4 13-14 n=1000
Q1 14-15 n=777
Q2 14-15 n=769
Q3 14-15 n=766
Q4 14-15 n=769
Overall satisfaction
with SA Water
+ 78 79 78 79 78 76 81 82 69 63 73 80 81 85 80 80 76 77 77 79 79 78 81 81
Neutral 13 13 12 12 12 13 12 11 23 24 17 14 13 8 13 13 15 14 13 13 13 11 12 11
- 10 9 10 9 10 11 7 8 8 13 10 7 6 7 6 8 9 9 10 8 9 10 7 8
* SA Water Strategic Plan KPI (85%)
Figure 1b: Total All Customers Satisfaction Results – split by location (Q44)
% response
Metro Regional Total
Q1
13-14 n=738
Q2 13-14 n=739
Q3 13-14 n=730
Q4 13-14 n=744
Q1 14-15 n=600
Q2 14-15 n=542
Q3 14-15 n=558
Q4 14-15 n=555
Q1 13-14 n=261
Q2 13-14 n=256
Q3 13-14 n=265
Q4 13-14 n=256
Q1 14-15 n=172
Q2 14-15 n=226
Q3 14-15 n=202
Q4 14-15 n=208
Q1 13-14 n=999
Q2 13-14 n=995
Q3 13-14 n=995
Q4 13-14 n=1000
Q1 14-15 n=777
Q2 14-15 n=769
Q3 14-15 n=766
Q4 14-15 n=769
Overall satisfaction with SA Water
+ 74 77 78 80 79 77 80 81 81 76 75 78 79 82 83 81 76 77 77 79 79 78 81 81
Neutral 16 14 13 12 13 12 13 12 10 15 14 14 13 11 11 10 15 14 13 13 13 11 12 11
- 9 9 10 8 9 11 7 7 9 9 11 8 8 7 6 10 9 9 10 8 9 10 7 8
* SA Water Strategic Plan KPI (85%)
Same
time last year
Same
time last year
Same
time last year
Same time last
year
Same time last
year
Same time last
year
4727_SA Water_CustomerSatisfactionTracking-Q4 2014-2015
8
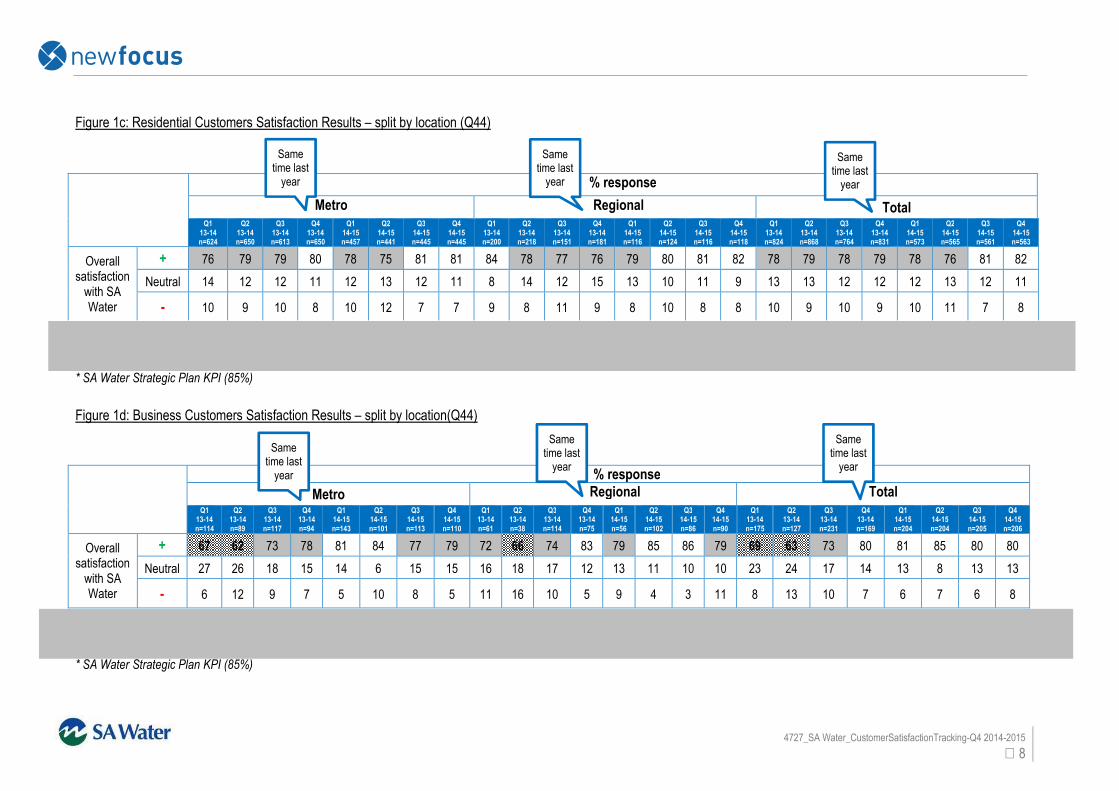
Figure 1c: Residential Customers Satisfaction Results – split by location (Q44)
% response
Metro Regional Total
Q1
13-14 n=624
Q2 13-14 n=650
Q3 13-14 n=613
Q4 13-14 n=650
Q1 14-15 n=457
Q2 14-15 n=441
Q3 14-15 n=445
Q4 14-15 n=445
Q1 13-14 n=200
Q2 13-14 n=218
Q3 13-14 n=151
Q4 13-14 n=181
Q1 14-15 n=116
Q2 14-15 n=124
Q3 14-15 n=116
Q4 14-15 n=118
Q1 13-14 n=824
Q2 13-14 n=868
Q3 13-14 n=764
Q4 13-14 n=831
Q1 14-15 n=573
Q2 14-15 n=565
Q3 14-15 n=561
Q4 14-15 n=563
Overall satisfaction
with SA Water
+ 76 79 79 80 78 75 81 81 84 78 77 76 79 80 81 82 78 79 78 79 78 76 81 82
Neutral 14 12 12 11 12 13 12 11 8 14 12 15 13 10 11 9 13 13 12 12 12 13 12 11
- 10 9 10 8 10 12 7 7 9 8 11 9 8 10 8 8 10 9 10 9 10 11 7 8
* SA Water Strategic Plan KPI (85%)
Figure 1d: Business Customers Satisfaction Results – split by location(Q44)
% response
Metro Regional Total
Q1
13-14 n=114
Q2 13-14 n=89
Q3 13-14 n=117
Q4 13-14 n=94
Q1 14-15 n=143
Q2 14-15 n=101
Q3 14-15 n=113
Q4 14-15 n=110
Q1 13-14 n=61
Q2 13-14 n=38
Q3 13-14 n=114
Q4 13-14 n=75
Q1 14-15 n=56
Q2 14-15 n=102
Q3 14-15 n=86
Q4 14-15 n=90
Q1 13-14 n=175
Q2 13-14 n=127
Q3 13-14 n=231
Q4 13-14 n=169
Q1 14-15 n=204
Q2 14-15 n=204
Q3 14-15 n=205
Q4 14-15 n=206
Overall satisfaction
with SA Water
+ 67 62 73 78 81 84 77 79 72 66 74 83 79 85 86 79 69 63 73 80 81 85 80 80
Neutral 27 26 18 15 14 6 15 15 16 18 17 12 13 11 10 10 23 24 17 14 13 8 13 13
- 6 12 9 7 5 10 8 5 11 16 10 5 9 4 3 11 8 13 10 7 6 7 6 8
* SA Water Strategic Plan KPI (85%)
Same
time last year
Same
time last year
Same
time last year
Same
time last year
Same
time last year
Same
time last year
4727_SA Water_CustomerSatisfactionTracking-Q4 2014-2015
9
Figure 2: Summary Results
% response
Residential Business Metropolitan Regional Total
Overall satisfaction with the Customer Service Centre
+ 90 86 89 88 89
Neutral 5 9 6 5 6
- 6 5 5 7 5
SA Water keeping you informed of the progress of your query or problem
+ 69 55 64 68 65
Neutral 11 16 12 12 12
- 20 29 24 20 23
SA Water's efforts to resolve your query or problem
+ 81 81 80 83 81
Neutral 7 7 8 5 7
- 12 12 12 12 12
Overall satisfaction with field maintenance crew
+ 92 92 91 93 92
Neutral 6 3 5 4 5
- 3 4 3 2 3
The overall quality of the water
+ 83 76 81 80 81
Neutral 12 17 14 13 13
- 5 7 6 6 6
Overall, how satisfied were you with the handling of your correspondence
+ 63 75 68 58 65
Neutral 8 - 5 11 7
- 29 25 26 32 28
Overall satisfaction with the connections office staff
+ 93 100 93 95 94
Neutral 5 - 5 5 5
- 2 - 2 - 2
Overall satisfaction with field maintenance crew (Connections)
+ 90 100 86 100 91
Neutral 5 - 7 - 5
- 5 - 7 - 5
Ease of doing business
+ 88 85 87 87 87
Neutral 6 9 7 7 7
- 6 6 6 6 6
Supplier of choice
+ 80 84 80 83 81
Neutral 12 13 13 11 12
- 8 4 7 6 7
Overall satisfaction with SA Water
+ 82 80 81 81 81
Neutral 11 13 12 10 11
- 8 8 7 10 8
4727_SA Water_CustomerSatisfactionTracking-Q4 2014-2015
10
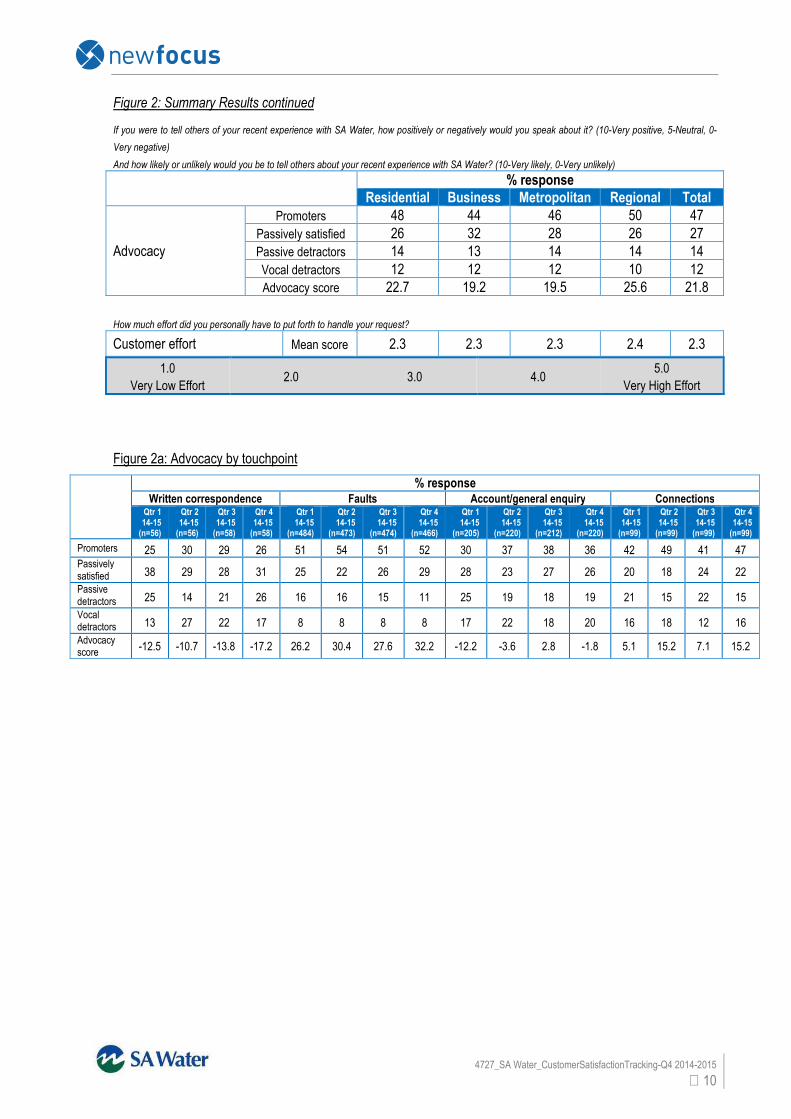
Figure 2: Summary Results continued
If you were to tell others of your recent experience with SA Water, how positively or negatively would you speak about it? (10-Very positive, 5-Neutral, 0-
Very negative)
And how likely or unlikely would you be to tell others about your recent experience with SA Water? (10-Very likely, 0-Very unlikely)
% response
Residential Business Metropolitan Regional Total
Advocacy
Promoters 48 44 46 50 47
Passively satisfied 26 32 28 26 27
Passive detractors 14 13 14 14 14
Vocal detractors 12 12 12 10 12
Advocacy score 22.7 19.2 19.5 25.6 21.8
How much effort did you personally have to put forth to handle your request?
Customer effort Mean score 2.3 2.3 2.3 2.4 2.3
1.0
Very Low Effort 2.0 3.0 4.0
5.0
Very High Effort
Figure 2a: Advocacy by touchpoint
% response Written correspondence Faults Account/general enquiry Connections
Qtr 1 14-15 (n=56)
Qtr 2 14-15 (n=56)
Qtr 3 14-15 (n=58)
Qtr 4 14-15 (n=58)
Qtr 1 14-15
(n=484)
Qtr 2 14-15
(n=473)
Qtr 3 14-15
(n=474)
Qtr 4 14-15
(n=466)
Qtr 1 14-15
(n=205)
Qtr 2 14-15
(n=220)
Qtr 3 14-15
(n=212)
Qtr 4 14-15
(n=220)
Qtr 1 14-15 (n=99)
Qtr 2 14-15 (n=99)
Qtr 3 14-15 (n=99)
Qtr 4 14-15 (n=99)
Promoters 25 30 29 26 51 54 51 52 30 37 38 36 42 49 41 47 Passively satisfied 38 29 28 31 25 22 26 29 28 23 27 26 20 18 24 22
Passive detractors 25 14 21 26 16 16 15 11 25 19 18 19 21 15 22 15
Vocal detractors 13 27 22 17 8 8 8 8 17 22 18 20 16 18 12 16
Advocacy score
-12.5 -10.7 -13.8 -17.2 26.2 30.4 27.6 32.2 -12.2 -3.6 2.8 -1.8 5.1 15.2 7.1 15.2
4727_SA Water_CustomerSatisfactionTracking-Q4 2014-2015
11
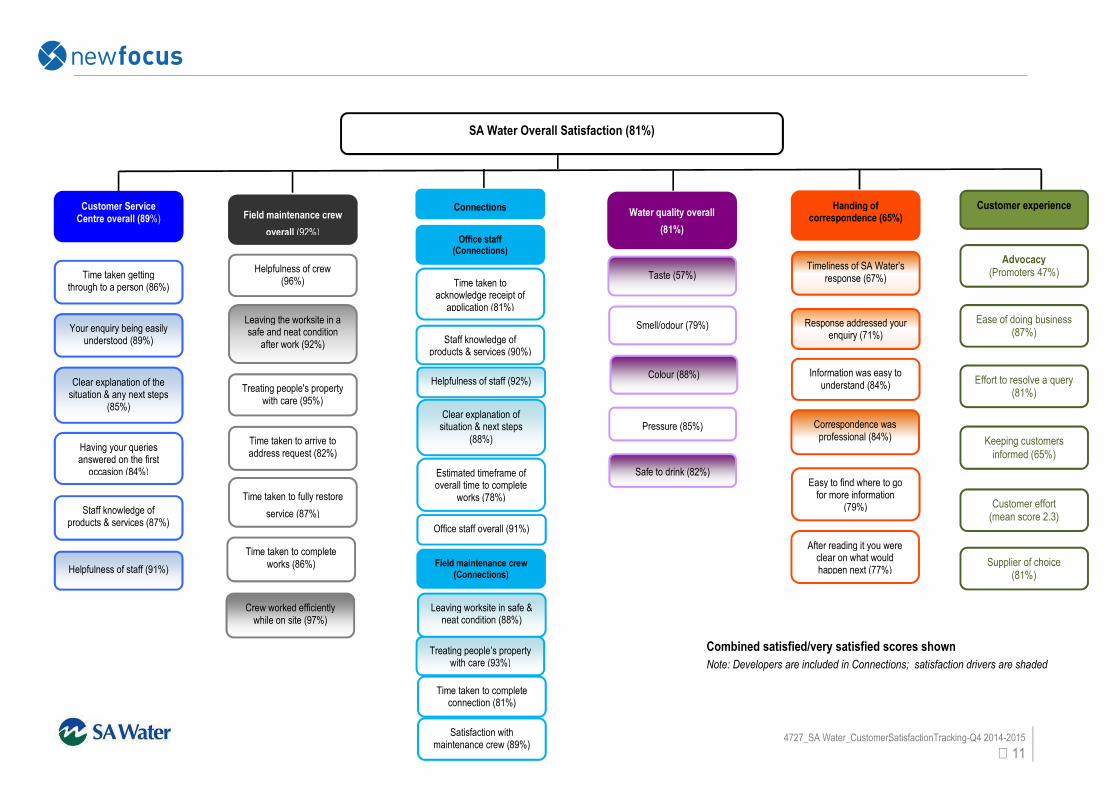
SA Water Overall Satisfaction (81%)
Combined satisfied/very satisfied scores shown
Note: Developers are included in Connections; satisfaction drivers are shaded
Customer Service Centre overall (89%)
Staff knowledge of products & services (87%)
Time taken getting through to a person (86%)
Your enquiry being easily understood (89%)
Having your queries answered on the first
occasion (84%)
Helpfulness of staff (91%)
Clear explanation of the situation & any next steps
(85%)
Connections
Helpfulness of staff (92%)
Time taken to acknowledge receipt of
application (81%)
Staff knowledge of products & services (90%)
Clear explanation of situation & next steps
(88%)
Water quality overall
(81%)
Colour (88%)
Smell/odour (79%)
Taste (57%)
Pressure (85%)
Handing of correspondence (65%)
Easy to find where to go for more information
(79%)
Correspondence was professional (84%)
Information was easy to understand (84%)
Response addressed your enquiry (71%)
After reading it you were clear on what would happen next (77%)
Office staff (Connections)
Time taken to complete connection (81%)
Leaving worksite in safe & neat condition (88%)
Treating people’s property
with care (93%)
Satisfaction with maintenance crew (89%)
Field maintenance crew (Connections)
Estimated timeframe of overall time to complete
works (78%)
Office staff overall (91%)
Safe to drink (82%)
Customer experience
Advocacy (Promoters 47%)
Ease of doing business (87%)
Effort to resolve a query (81%)
Keeping customers
informed (65%)
Customer effort (mean score 2.3)
Supplier of choice (81%)
Field maintenance crew
overall (92%)
Treating people's property with care (95%)
Time taken to arrive to address request (82%)
Time taken to fully restore
service (87%)
Time taken to complete
works (86%)
Helpfulness of crew (96%)
Leaving the worksite in a safe and neat condition
after work (92%)
Crew worked efficiently while on site (97%)
Timeliness of SA Water’s response (67%)
4727_SA Water_CustomerSatisfactionTracking-Q4 2014-2015
12
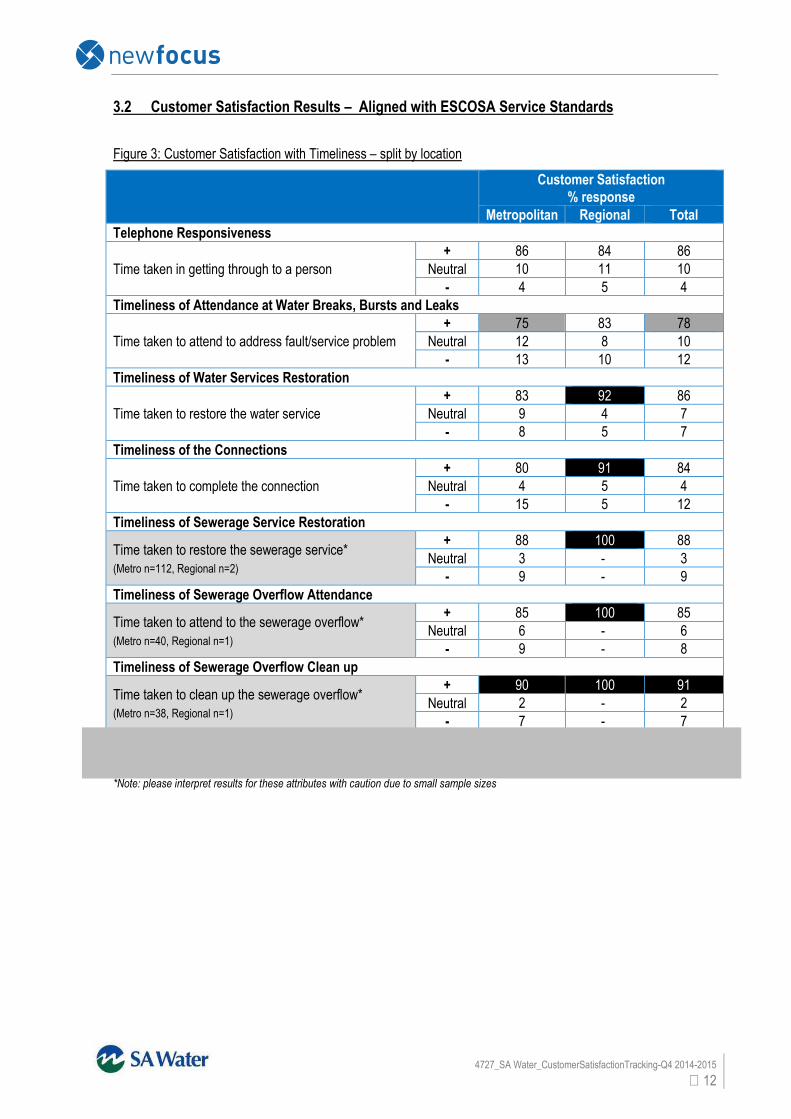
3.2 Customer Satisfaction Results – Aligned with ESCOSA Service Standards
Figure 3: Customer Satisfaction with Timeliness – split by location
Customer Satisfaction
% response
Metropolitan Regional Total
Telephone Responsiveness
Time taken in getting through to a person
+ 86 84 86
Neutral 10 11 10
- 4 5 4
Timeliness of Attendance at Water Breaks, Bursts and Leaks
Time taken to attend to address fault/service problem
+ 75 83 78
Neutral 12 8 10
- 13 10 12
Timeliness of Water Services Restoration
Time taken to restore the water service
+ 83 92 86
Neutral 9 4 7
- 8 5 7
Timeliness of the Connections
Time taken to complete the connection
+ 80 91 84
Neutral 4 5 4
- 15 5 12
Timeliness of Sewerage Service Restoration
Time taken to restore the sewerage service*
(Metro n=112, Regional n=2)
+ 88 100 88
Neutral 3 - 3
- 9 - 9
Timeliness of Sewerage Overflow Attendance
Time taken to attend to the sewerage overflow*
(Metro n=40, Regional n=1)
+ 85 100 85
Neutral 6 - 6
- 9 - 8
Timeliness of Sewerage Overflow Clean up
Time taken to clean up the sewerage overflow*
(Metro n=38, Regional n=1)
+ 90 100 91
Neutral 2 - 2
- 7 - 7
*Note: please interpret results for these attributes with caution due to small sample sizes
4727_SA Water_CustomerSatisfactionTracking-Q4 2014-2015
13
4. Results by Channel / Customer Service Area
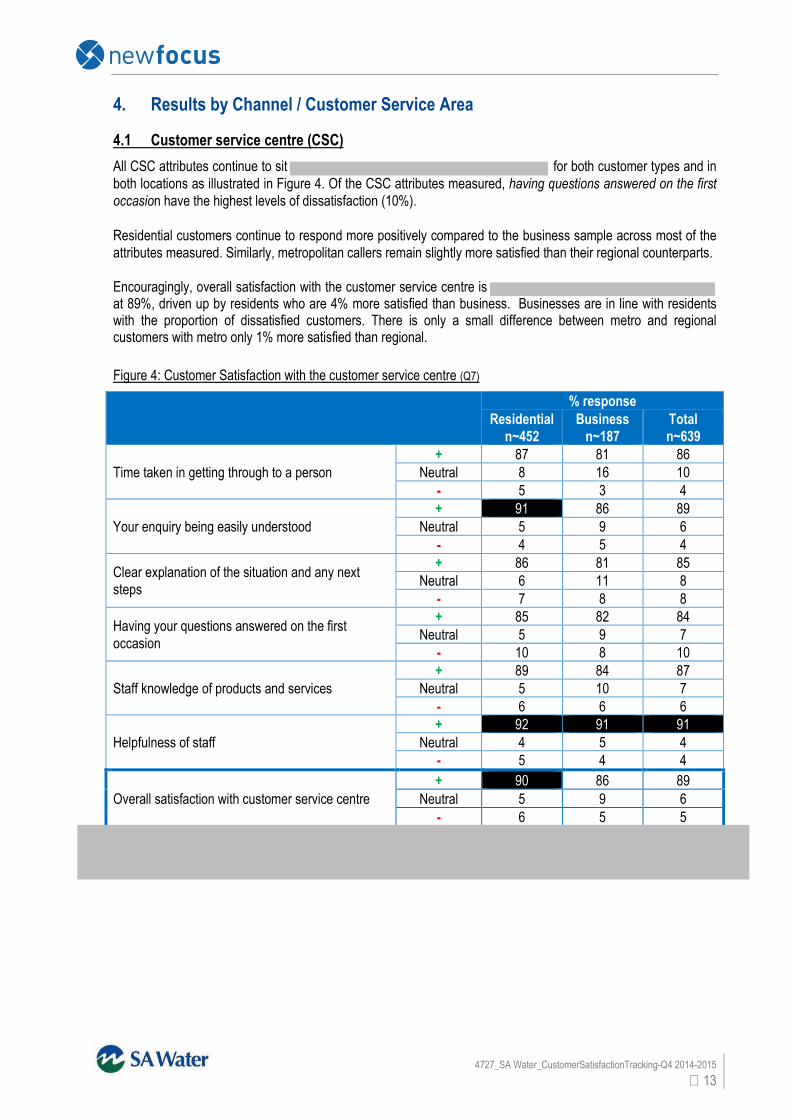
4.1 Customer service centre (CSC)
All CSC attributes continue to sit for both customer types and in
both locations as illustrated in Figure 4. Of the CSC attributes measured, having questions answered on the first
occasion have the highest levels of dissatisfaction (10%).
Residential customers continue to respond more positively compared to the business sample across most of the
attributes measured. Similarly, metropolitan callers remain slightly more satisfied than their regional counterparts.
Encouragingly, overall satisfaction with the customer service centre is at 89%, driven up by residents who are 4% more satisfied than business. Businesses are in line with residents with the proportion of dissatisfied customers. There is only a small difference between metro and regional customers with metro only 1% more satisfied than regional.
Figure 4: Customer Satisfaction with the customer service centre (Q7)
% response
Residential
n~452
Business
n~187
Total
n~639
Time taken in getting through to a person
+ 87 81 86
Neutral 8 16 10
- 5 3 4
Your enquiry being easily understood
+ 91 86 89
Neutral 5 9 6
- 4 5 4
Clear explanation of the situation and any next
steps
+ 86 81 85
Neutral 6 11 8
- 7 8 8
Having your questions answered on the first
occasion
+ 85 82 84
Neutral 5 9 7
- 10 8 10
Staff knowledge of products and services
+ 89 84 87
Neutral 5 10 7
- 6 6 6
Helpfulness of staff
+ 92 91 91
Neutral 4 5 4
- 5 4 4
Overall satisfaction with customer service centre
+ 90 86 89
Neutral 5 9 6
- 6 5 5
4727_SA Water_CustomerSatisfactionTracking-Q4 2014-2015
14
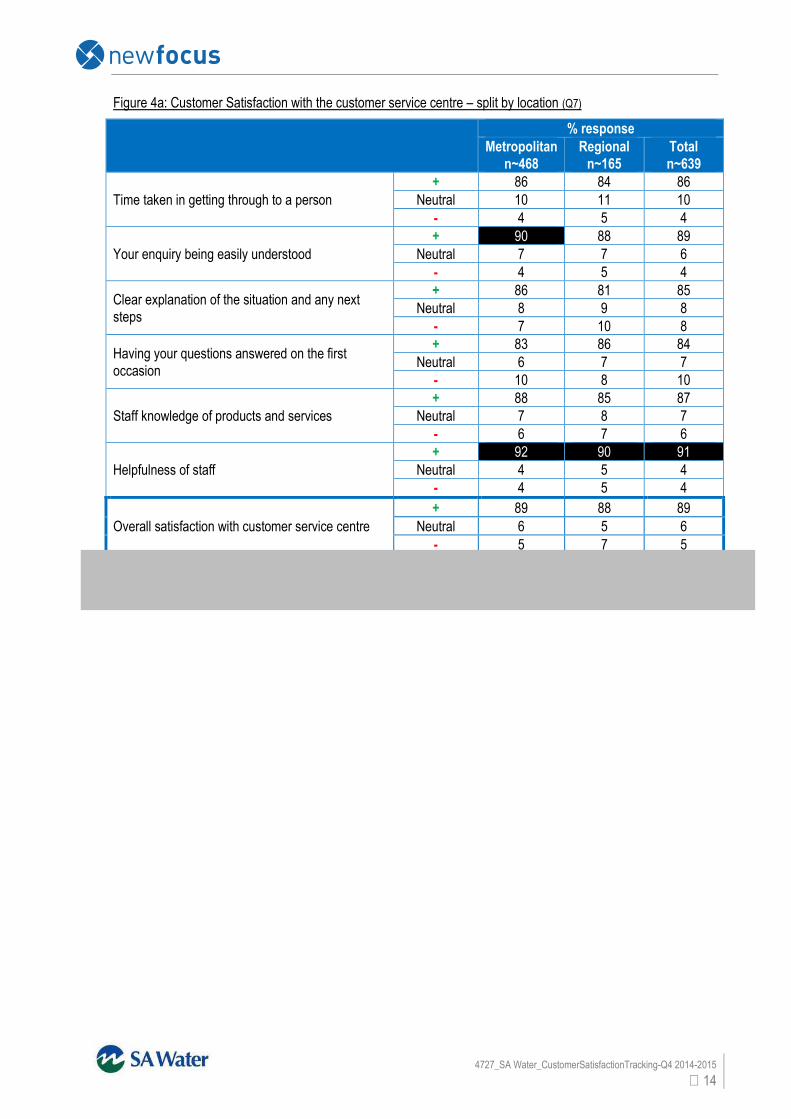
Figure 4a: Customer Satisfaction with the customer service centre – split by location (Q7)
% response
Metropolitan
n~468
Regional
n~165
Total
n~639
Time taken in getting through to a person
+ 86 84 86
Neutral 10 11 10
- 4 5 4
Your enquiry being easily understood
+ 90 88 89
Neutral 7 7 6
- 4 5 4
Clear explanation of the situation and any next
steps
+ 86 81 85
Neutral 8 9 8
- 7 10 8
Having your questions answered on the first
occasion
+ 83 86 84
Neutral 6 7 7
- 10 8 10
Staff knowledge of products and services
+ 88 85 87
Neutral 7 8 7
- 6 7 6
Helpfulness of staff
+ 92 90 91
Neutral 4 5 4
- 4 5 4
Overall satisfaction with customer service centre
+ 89 88 89
Neutral 6 5 6
- 5 7 5
4727_SA Water_CustomerSatisfactionTracking-Q4 2014-2015
15
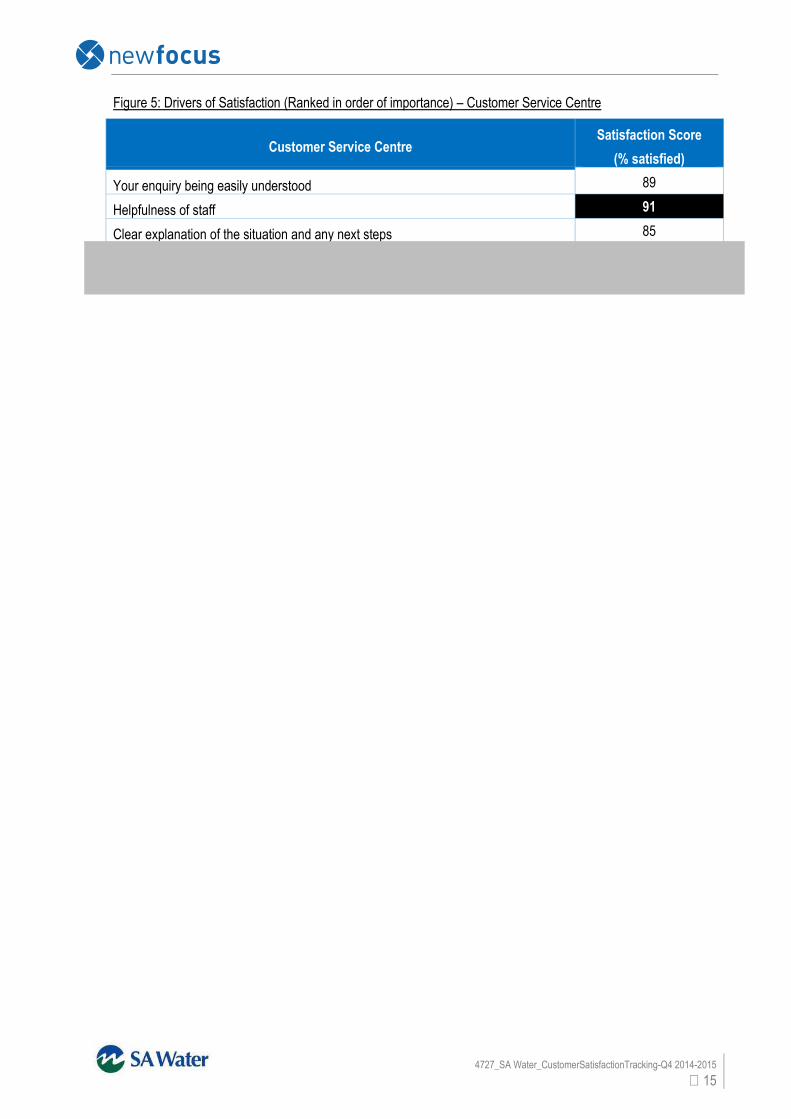
Figure 5: Drivers of Satisfaction (Ranked in order of importance) – Customer Service Centre
Customer Service Centre Satisfaction Score
(% satisfied)
Your enquiry being easily understood 89
Helpfulness of staff 91
Clear explanation of the situation and any next steps 85
4727_SA Water_CustomerSatisfactionTracking-Q4 2014-2015
16
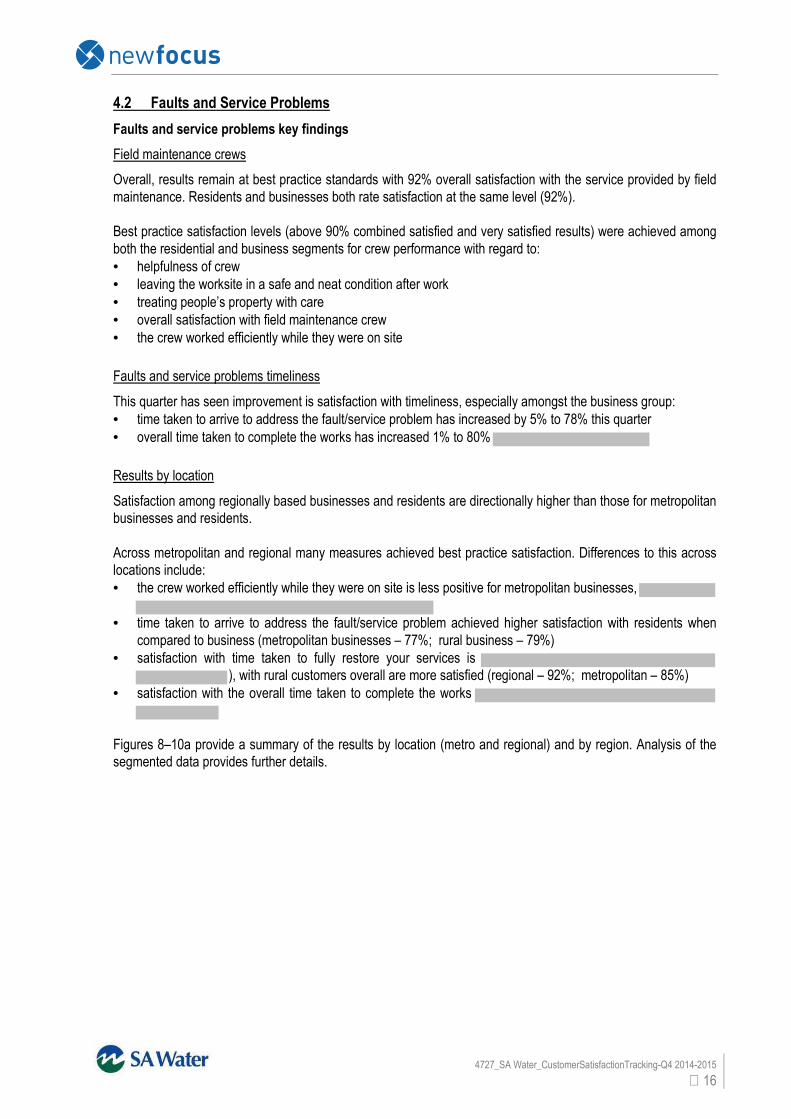
4.2 Faults and Service Problems
Faults and service problems key findings
Field maintenance crews
Overall, results remain at best practice standards with 92% overall satisfaction with the service provided by field
maintenance. Residents and businesses both rate satisfaction at the same level (92%).
Best practice satisfaction levels (above 90% combined satisfied and very satisfied results) were achieved among
both the residential and business segments for crew performance with regard to:
• helpfulness of crew
• leaving the worksite in a safe and neat condition after work
• treating people’s property with care
• overall satisfaction with field maintenance crew
• the crew worked efficiently while they were on site
Faults and service problems timeliness
This quarter has seen improvement is satisfaction with timeliness, especially amongst the business group:
• time taken to arrive to address the fault/service problem has increased by 5% to 78% this quarter
• overall time taken to complete the works has increased 1% to 80%
Results by location
Satisfaction among regionally based businesses and residents are directionally higher than those for metropolitan
businesses and residents.
Across metropolitan and regional many measures achieved best practice satisfaction. Differences to this across
locations include:
• the crew worked efficiently while they were on site is less positive for metropolitan businesses,
• time taken to arrive to address the fault/service problem achieved higher satisfaction with residents when
compared to business (metropolitan businesses – 77%; rural business – 79%)
• satisfaction with time taken to fully restore your services is
), with rural customers overall are more satisfied (regional – 92%; metropolitan – 85%)
• satisfaction with the overall time taken to complete the works
Figures 8–10a provide a summary of the results by location (metro and regional) and by region. Analysis of the
segmented data provides further details.
4727_SA Water_CustomerSatisfactionTracking-Q4 2014-2015
17
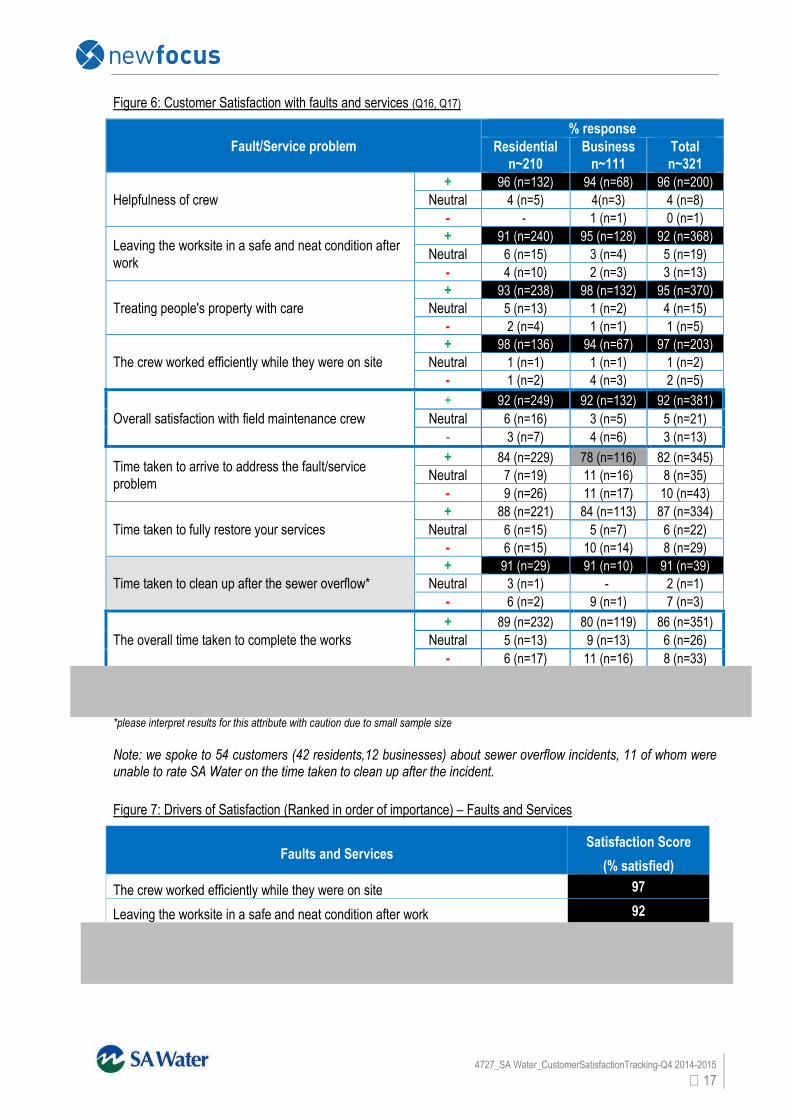
Figure 6: Customer Satisfaction with faults and services (Q16, Q17)
Fault/Service problem
% response
Residential
n~210
Business
n~111
Total
n~321
Helpfulness of crew
+ 96 (n=132) 94 (n=68) 96 (n=200)
Neutral 4 (n=5) 4(n=3) 4 (n=8)
- - 1 (n=1) 0 (n=1)
Leaving the worksite in a safe and neat condition after
work
+ 91 (n=240) 95 (n=128) 92 (n=368)
Neutral 6 (n=15) 3 (n=4) 5 (n=19)
- 4 (n=10) 2 (n=3) 3 (n=13)
Treating people's property with care
+ 93 (n=238) 98 (n=132) 95 (n=370)
Neutral 5 (n=13) 1 (n=2) 4 (n=15)
- 2 (n=4) 1 (n=1) 1 (n=5)
The crew worked efficiently while they were on site
+ 98 (n=136) 94 (n=67) 97 (n=203)
Neutral 1 (n=1) 1 (n=1) 1 (n=2)
- 1 (n=2) 4 (n=3) 2 (n=5)
Overall satisfaction with field maintenance crew
+ 92 (n=249) 92 (n=132) 92 (n=381)
Neutral 6 (n=16) 3 (n=5) 5 (n=21)
- 3 (n=7) 4 (n=6) 3 (n=13)
Time taken to arrive to address the fault/service
problem
+ 84 (n=229) 78 (n=116) 82 (n=345)
Neutral 7 (n=19) 11 (n=16) 8 (n=35)
- 9 (n=26) 11 (n=17) 10 (n=43)
Time taken to fully restore your services
+ 88 (n=221) 84 (n=113) 87 (n=334)
Neutral 6 (n=15) 5 (n=7) 6 (n=22)
- 6 (n=15) 10 (n=14) 8 (n=29)
Time taken to clean up after the sewer overflow*
+ 91 (n=29) 91 (n=10) 91 (n=39)
Neutral 3 (n=1) - 2 (n=1)
- 6 (n=2) 9 (n=1) 7 (n=3)
The overall time taken to complete the works
+ 89 (n=232) 80 (n=119) 86 (n=351)
Neutral 5 (n=13) 9 (n=13) 6 (n=26)
- 6 (n=17) 11 (n=16) 8 (n=33)
*please interpret results for this attribute with caution due to small sample size Note: we spoke to 54 customers (42 residents,12 businesses) about sewer overflow incidents, 11 of whom were unable to rate SA Water on the time taken to clean up after the incident.
Figure 7: Drivers of Satisfaction (Ranked in order of importance) – Faults and Services
Faults and Services Satisfaction Score
(% satisfied)
The crew worked efficiently while they were on site 97
Leaving the worksite in a safe and neat condition after work 92

4727_SA Water_CustomerSatisfactionTracking-Q4 2014-2015
18
Results by location
Figure 8: Customer Satisfaction with faults and services – split by location (Q16, Q17)
% response
Metropolitan Regional
Resident
(n~185)
Business
(n~62)
Total
(n~246)
Residential
(n~28)
Business
(n~46)
Total
(n~71)
Helpfulness of crew*
+ 97 (n=116) 92 (n=35) 96 (n=151) 94 (n=16) 97 (n=32) 96 (n=48)
Neutral 3 (n=4) 5 (n=2) 4 (n=6) 6 (n=1) 3 (n=1) 4 (n=2)
- - 3 (n=1) 1 (n=1) - - -
Leaving the worksite in a
safe and neat condition
after work
+ 90 (n=209) 97 (n=74) 92 (n=283) 94 (n=31) 91 (n=50) 92 (n=81)
Neutral 6 (n=13) - 4 (n=13) 6 (n=2) 7 (n=4) 7 (n=6)
- 4 (n=10) 3 (n=2) 4 (n=12) - 2 (n=1) 1 (n=1)
The crew worked
efficiently while they
were on site
+ 98 (n=119) 89 (n=33) 96 (n=152) 100 (n=17) 100 (n=33) 100 (n=50)
Neutral 1 (n=1) 3 (n=1) 1 (n=2) - - -
- 2 (n=2) 8 (n=3) 3 (n=5) - - -
Treating people's
property with care
+ 93 (n=207) 97 (n=74) 94 (n=281) 97 (n=31) 98 (n=54) 98 (n=85)
Neutral 5 (n=12) 1 (n=1) 4 (n=13) 3 (n=1) 2 (n=1) 2 (n=2)
- 2 (n=4) 1 (n=1) 2 (n=5) - - -
Overall satisfaction with
field maintenance crew
+ 91 (n=218) 91 (n=73) 91 (n=291) 94 (n=31) 93 (n=54) 93 (n=85)
Neutral 6 (n=14) 4 (n=3) 5 (n=17) 6 (n=2) 3 (n=2) 4 (n=4)
- 3 (n=7) 5 (n=4) 3 (n=11) - 3 (n=2) 2 (n=2)
Time taken to arrive to
address the fault/service
problem
+ 83 (n=199) 77 (n=63) 81 (n=262) 91 (n=30) 79 (n=49) 83 (n=79)
Neutral 7 (n=17) 12 (n=10) 8 (n=27) 6 (n=2) 8 (n=5) 7 (n=7)
- 10 (n=25) 11 (n=9) 11 (n=34) 3 (n=1) 13 (n=8) 9 (n=9)
Time taken to fully
restore your services
+ 87 (n=193) 78 (n=58) 85 (n=251) 93 (n=28) 91 (n=51) 92 (n=79)
Neutral 6 (n=14) 7 (n=5) 6 (n=19) 3 (n=1) 4 (n=2) 3 (n=3)
- 6 (n=14) 15 (n=11) 8 (n=25) 3 (n=1) 5 (n=3) 5 (n=4)
Time taken to clean up
after the sewer overflow*
+ 91 (n=29) 90 (n=9) 90 (n=38) - 100 (n=1) 100 (n=1)
Neutral 3 (n=1) - 2 (n=1) - - -
- 6 (n=2) 10 (n=1) 7 (n=3) - - -
The overall time taken to
complete the works
+ 88 (n=203) 77 (n=64) 85 (n=267) 94 (n=29) 84 (n=51) 87 (n=80)
Neutral 5 (n=12) 8 (n=7) 6 (n=19) 3 (n=1) 10 (n=6) 8 (n=7)
- 7 (n=16) 14 (n=12) 9 (n=28) 3 (n=1) 7 (n=4) 5 (n=5)
*please interpret results with caution due to small sample sizes
4727_SA Water_CustomerSatisfactionTracking-Q4 2014-2015
19
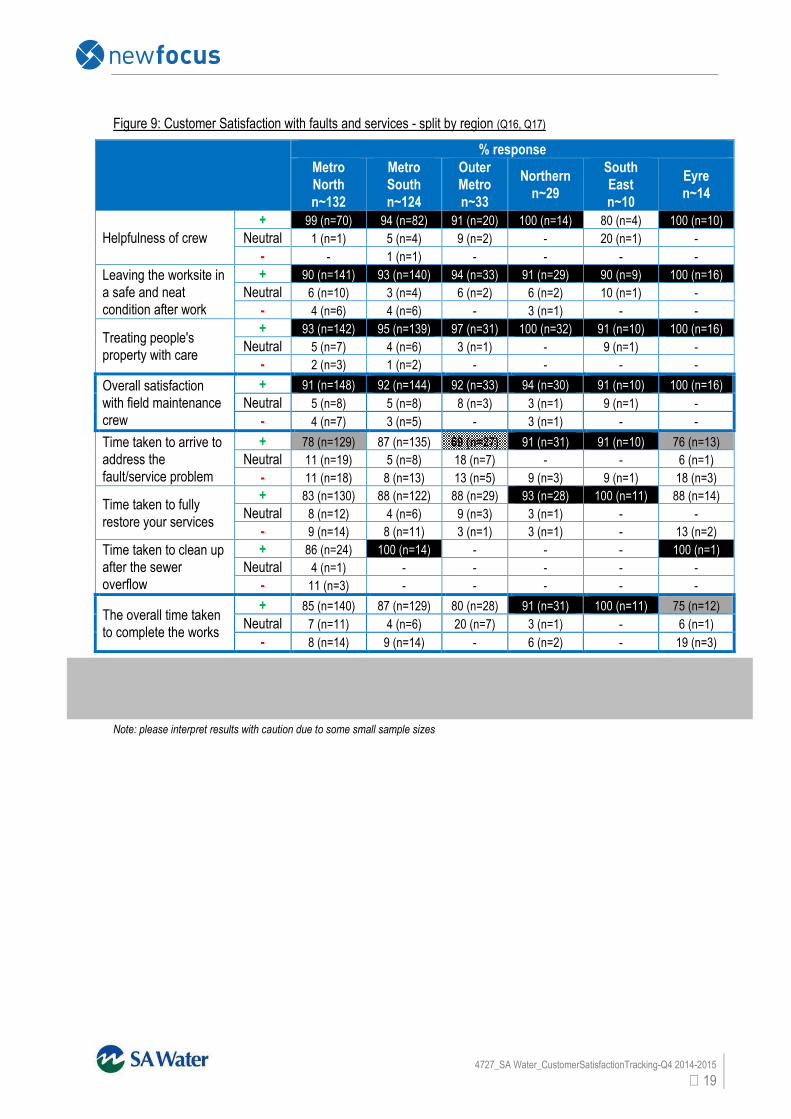
Figure 9: Customer Satisfaction with faults and services - split by region (Q16, Q17)
% response
Metro
North
n~132
Metro
South
n~124
Outer
Metro
n~33
Northern
n~29
South
East
n~10
Eyre
n~14
Helpfulness of crew
+ 99 (n=70) 94 (n=82) 91 (n=20) 100 (n=14) 80 (n=4) 100 (n=10)
Neutral 1 (n=1) 5 (n=4) 9 (n=2) - 20 (n=1) -
- - 1 (n=1) - - - -
Leaving the worksite in
a safe and neat
condition after work
+ 90 (n=141) 93 (n=140) 94 (n=33) 91 (n=29) 90 (n=9) 100 (n=16)
Neutral 6 (n=10) 3 (n=4) 6 (n=2) 6 (n=2) 10 (n=1) -
- 4 (n=6) 4 (n=6) - 3 (n=1) - -
Treating people's
property with care
+ 93 (n=142) 95 (n=139) 97 (n=31) 100 (n=32) 91 (n=10) 100 (n=16)
Neutral 5 (n=7) 4 (n=6) 3 (n=1) - 9 (n=1) -
- 2 (n=3) 1 (n=2) - - - -
Overall satisfaction
with field maintenance
crew
+ 91 (n=148) 92 (n=144) 92 (n=33) 94 (n=30) 91 (n=10) 100 (n=16)
Neutral 5 (n=8) 5 (n=8) 8 (n=3) 3 (n=1) 9 (n=1) -
- 4 (n=7) 3 (n=5) - 3 (n=1) - -
Time taken to arrive to
address the
fault/service problem
+ 78 (n=129) 87 (n=135) 69 (n=27) 91 (n=31) 91 (n=10) 76 (n=13)
Neutral 11 (n=19) 5 (n=8) 18 (n=7) - - 6 (n=1)
- 11 (n=18) 8 (n=13) 13 (n=5) 9 (n=3) 9 (n=1) 18 (n=3)
Time taken to fully
restore your services
+ 83 (n=130) 88 (n=122) 88 (n=29) 93 (n=28) 100 (n=11) 88 (n=14)
Neutral 8 (n=12) 4 (n=6) 9 (n=3) 3 (n=1) - -
- 9 (n=14) 8 (n=11) 3 (n=1) 3 (n=1) - 13 (n=2)
Time taken to clean up
after the sewer
overflow
+ 86 (n=24) 100 (n=14) - - - 100 (n=1)
Neutral 4 (n=1) - - - - -
- 11 (n=3) - - - - -
The overall time taken
to complete the works
+ 85 (n=140) 87 (n=129) 80 (n=28) 91 (n=31) 100 (n=11) 75 (n=12)
Neutral 7 (n=11) 4 (n=6) 20 (n=7) 3 (n=1) - 6 (n=1)
- 8 (n=14) 9 (n=14) - 6 (n=2) - 19 (n=3)
Note: please interpret results with caution due to some small sample sizes
4727_SA Water_CustomerSatisfactionTracking-Q4 2014-2015
20
Figure 9a: Customer Satisfaction with faults and services - split by fault (Q16, Q17)
Metropolitan
% response
Business Residential Total
Water Sewer Other (n~3)
Water Sewer Other (n~2)
Water Sewer Other (n~5)
Meter (n~28)
Road (n~5)
Other (n~13)
Block (n~13)
O/flow (n~9)
Other (n~1)
Meter (n~73)
Road (n~20)
Other (n~18)
Block (n~66)
O/flow (n~33)
Other (n~4)
Meter (n~101)
Road (n~25)
Other (n~30)
Block (n~79)
O/flow (n~43)
Other (n~5)
Helpfulness of crew
+ 92 60 100 100 100 100 100 100 100 82 98 100 100 - 97 88 87 98 100 100 75
Neutral - 40 - - - - - - - 18 2 - - 100 - 12 13 2 - - 25
- 8 - - - - - - - - - - - - - 3 - - - - - -
Leaving worksite in safe & neat condition after work
+ 100 80 100 100 91 100 100 90 81 79 96 91 75 100 93 81 87 96 91 80 100
Neutral - - - - - - - 6 19 11 - 3 25 - 4 15 6 - 2 20 -
- - 20 - - 9 - - 4 - 11 4 6 - - 3 4 6 4 7 - -
Treating people's property with care
+ 100 100 92 100 90 100 100 91 82 83 99 97 75 100 94 86 87 99 95 80 100
Neutral - - 8 - - - - 6 12 11 1 3 25 - 5 9 10 1 2 20 -
- - - - - 10 - - 3 6 6 - - - - 2 5 3 - 2 - -
Overall satisfaction with field maintenance crew
+ 97 60 79 100 91 100 100 90 91 85 96 92 75 50 92 86 82 97 91 83 80
Neutral - 40 7 - - - - 4 9 10 4 8 25 - 3 14 9 3 6 17 -
- 3 - 14 - 9 - - 6 - 5 - - - 50 5 - 9 - 2 - 20
Time taken arrive/ address fault/ service problem
+ 83 50 63 79 80 100 100 80 62 74 93 86 100 50 81 59 69 91 85 100 75
Neutral 10 33 19 7 10 - - 6 24 16 3 5 - - 7 26 17 3 6 - -
- 7 17 19 14 10 - - 14 14 11 4 8 - 50 12 15 14 6 9 - 25
Time taken to fully restore your services
+ 87 60 64 69 88 100 100 86 80 89 91 94 25 - 86 76 78 88 93 40 100
Neutral 3 - 21 - 13 - - 8 15 11 - 3 50 - 7 12 16 - 5 40 -
- 10 40 14 31 - - - 6 5 - 9 3 25 - 7 12 6 13 2 20 -
Time taken to clean up after sewer overflow
+ - - - - 90 - - - - - - 91 - - - - - - 90 - -
Neutral - - - - - - - - - - - 3 - - - - - - 2 - -
- - - - - 10 - - - - - - 6 - - - - - - 7 - -
Overall time taken to complete works
+ 88 50 56 79 82 100 100 88 75 83 93 97 50 - 88 70 71 90 94 60 75
Neutral 6 33 19 - - - - 4 17 6 1 3 25 100 4 20 12 1 2 20 25
- 6 17 25 21 18 - - 9 8 11 6 - 25 - 8 10 18 9 4 20 -
Note: please interpret results with caution due to small sample sizes
4727_SA Water_CustomerSatisfactionTracking-Q4 2014-2015
21
Figure 9a: Customer Satisfaction with faults and services - split by fault (Q16, Q17) continued
Regional
% response
Business Residential Total
Water Sewer Water Water Sewer Meter (n~34)
Road (n~8)
Other (n~11)
Blockage (n~1)
Overflow (n~1)
Meter (n~20)
Road (n~4)
Other (n~6)
Meter (n~54)
Road (n~12)
Other (n~17)
Blockage (n~1)
Overflow (n~1)
Helpfulness of crew
+ 100 75 100 100 100 100 50 100 100 67 100 100 100
Neutral - 25 - - - - 50 - - 33 - - -
- - - - - - - - - - - - - -
Leaving worksite in safe & neat condition after work
+ 97 67 90 - 100 95 80 100 96 71 94 - 100
Neutral - 33 10 - - 5 20 - 2 29 6 - -
- 3 - - - - - - - 2 - - - -
Treating people's property with care
+ 100 88 100 100 100 100 75 100 100 83 100 100 100
Neutral - 13 - - - - 25 - - 17 - - -
- - - - - - - - - - - - - -
Overall satisfaction with field maintenance crew
+ 92 100 91 100 100 91 100 100 91 100 94 100 100
Neutral 6 - - - - 9 - - 7 - - - -
- 3 - 9 - - - - - 2 - 6 - -
Time taken arrive/ address fault/ service problem
+ 71 89 92 100 100 91 100 83 78 93 89 100 100
Neutral 11 11 - - - 5 - 17 8 7 5 - -
- 18 - 8 - - 5 - - 13 - 5 - -
Time taken to fully restore your services
+ 89 100 92 100 100 95 100 83 91 100 89 100 100
Neutral 6 - - - - - - 17 4 - 5 - -
- 6 - 8 - - 5 - - 5 - 5 - -
Time taken to clean up after sewer overflow
+ - - - - 100 - - - - - - - 100
Neutral - - - - - - - - - - - - -
- - - - - - - - - - - - - -
Overall time taken to complete works
+ 79 89 92 100 100 95 100 83 85 92 89 100 100
Neutral 11 11 8 - - - - 17 7 8 11 - -
- 11 - - - - 5 - - 8 - - - -
Note: please interpret results with caution due to small sample sizes

4727_SA Water_CustomerSatisfactionTracking-Q4 2014-2015
22
Figure 9a: Customer Satisfaction with faults and services - split by fault (Q16, Q17) continued
Total
% response
Residential Business
Water Sewer Other (n~2)
Water Sewer Other (n~4) Meter
(n~93) Road (n~24)
Other (n~23)
Blockage (n~66)
Overflow (n~33)
Other (n~4)
Meter (n~64)
Road (n~13)
Other (n~24)
Blockage (n~15)
Overflow (n~10)
Other (n~1)
Helpfulness of crew
+ 100 93 88 98 100 100 - 97 67 100 100 100 100 100
Neutral - 7 13 2 - - 100 - 33 - - - - -
- - - - - - - - 3 - - - - - -
Leaving worksite in safe & neat condition after work
+ 91 81 84 96 91 75 100 99 71 95 100 92 100 100
Neutral 6 19 8 - 3 25 - - 21 5 - - - -
- 3 - 8 4 6 - - 1 7 - - 8 - -
Treating people's property with care
+ 93 81 88 99 97 75 100 100 92 96 100 91 100 100
Neutral 5 14 8 1 3 25 - - 8 4 - - - -
- 2 5 4 - - - - - - - - 9 - -
Overall satisfaction with field maintenance crew
+ 90 93 88 96 92 75 50 94 86 84 100 92 100 100
Neutral 5 7 8 4 8 25 - 3 14 4 - - - -
- 5 - 4 - - - 50 3 - 12 - 8 - -
Time taken arrive/ address fault/ service problem
+ 82 69 76 93 86 100 50 77 73 76 81 82 100 80
Neutral 6 19 16 3 5 - - 10 20 10 6 9 - 20
- 12 12 8 4 8 - 50 13 7 14 13 9 - -
Time taken to fully restore your services
+ 88 83 88 91 94 25 - 88 80 78 73 89 100 100
Neutral 6 13 13 - 3 50 - 4 - 11 - 11 - -
- 6 4 - 9 3 25 - 7 20 11 27 - - -
Time taken to clean up after sewer overflow
+ - - - - 91 - - - - - - 91 - -
Neutral - - - - 3 - - - - - - - - -
- - - - - 6 - - - - - - 9 - -
Overall time taken to complete works
+ 89 79 83 93 97 50 - 83 73 71 81 83 100 100
Neutral 3 14 8 1 3 25 100 8 20 14 - - - -
- 8 7 8 6 - 25 - 8 7 14 19 17 - -
Note: please interpret results with caution due to small sample sizes

4727_SA Water_CustomerSatisfactionTracking-Q4 2014-2015
23
Figure 10: Tracking: Customer Satisfaction with faults & services – metro areas – split by quarter (Q16, Q17)
% response
Metropolitan North Metropolitan South Q1
2013-2014
Q2 2014
Q3 2014
Q4 2014
Q1 2014
Q2 2014
Q3 2015
Q4 2015
Q1 2013-2014
Q2 2014
Q3 2014
Q4 2014
Q1 2014
Q2 2014
Q3 2015
Q4 2015
Helpfulness of crew + 87 93 93 94 93 97 91 99 92 96 92 94 91 95 89 94
Neutral 7 5 3 3 6 - 6 1 4 2 2 3 5 3 5 5
- 6 2 4 3 1 3 2 - 3 2 6 2 4 3 6 1
Leaving the worksite in a safe and neat condition after completing the work
+ 86 94 95 91 91 89 95 90 93 94 93 91 88 94 89 93
Neutral 5 3 2 4 8 5 2 6 2 5 2 5 5 3 5 3
- 10 3 3 5 1 5 2 4 4 2 4 3 7 3 6 4
Treating people's property with care + 91 97 97 95 94 92 97 93 98 94 95 95 91 91 96 95
Neutral 5 2 2 3 5 3 2 5 1 3 1 3 5 5 2 4
- 5 1 1 3 1 4 1 2 1 2 4 2 4 4 2 1
Overall satisfaction with field maintenance crew + 84 93 93 92 90 90 92 91 93 89 92 90 88 91 91 92
Neutral 7 3 3 4 6 5 4 5 4 6 3 6 7 4 1 5
- 9 3 4 4 4 5 5 4 3 5 5 4 5 5 8 3
Time taken to arrive to address the fault/service problem
+ 60 78 85 81 71 79 76 78 78 81 81 80 75 77 84 87
Neutral 12 9 6 6 12 10 11 11 11 8 4 7 10 6 7 5
- 28 13 10 12 17 12 13 11 11 12 15 13 15 17 8 8
Time taken to fully restore your services + 80 88 88 91 88 84 84 83 84 85 86 85 85 84 87 88
Neutral 6 6 3 3 5 8 4 8 10 7 4 9 5 9 3 4
- 13 6 9 7 7 8 12 9 6 8 10 6 10 7 10 8
Time taken to clean up after the sewer overflow + 76 74 75 96 90 92 85 86 86 80 95 83 83 82 92 100
Neutral 6 21 - 4 - - 8 4 5 13 5 17 8 9 8 -
- 18 5 25 - 10 8 8 11 10 7 - - 8 9 - -
The overall time taken to complete the works + 74 84 88 89 81 84 80 85 89 87 86 85 81 82 88 87
Neutral 8 6 3 5 8 8 9 7 5 6 4 5 5 7 3 4
- 18 10 9 7 11 8 11 8 6 7 11 10 13 11 9 9
4727_SA Water_CustomerSatisfactionTracking-Q4 2014-2015
24
Figure 10a: Tracking: Customer Satisfaction with faults & services – by region – split by quarter (Q16, Q17)
% response
Metropolitan Regional Q1
2013-2014
Q2 2014
Q3 2014
Q4 2014
Q1 2014
Q2 2014
Q3 2015
Q4 2015
Q1 2013-2014
Q2 2014
Q3 2014
Q4 2014
Q1 2014
Q2 2014
Q3 2015
Q4 2015
Overall satisfaction with field maintenance crew
+ 88 92 92 91 90 91 91 91 95 93 90 95 97 90 94 93
Neutral 6 4 3 5 6 4 3 5 3 3 3 2 2 7 4 4
- 6 4 4 4 4 5 7 3 2 4 7 3 2 3 2 2
The overall time taken to complete the works
+ 80 86 87 87 82 83 84 85 91 88 87 93 92 88 90 87
Neutral 7 6 4 5 7 8 6 6 5 6 3 3 4 7 7 8
- 13 9 9 8 12 9 10 9 4 6 10 4 3 5 3 5
4727_SA Water_CustomerSatisfactionTracking-Q4 2014-2015
25
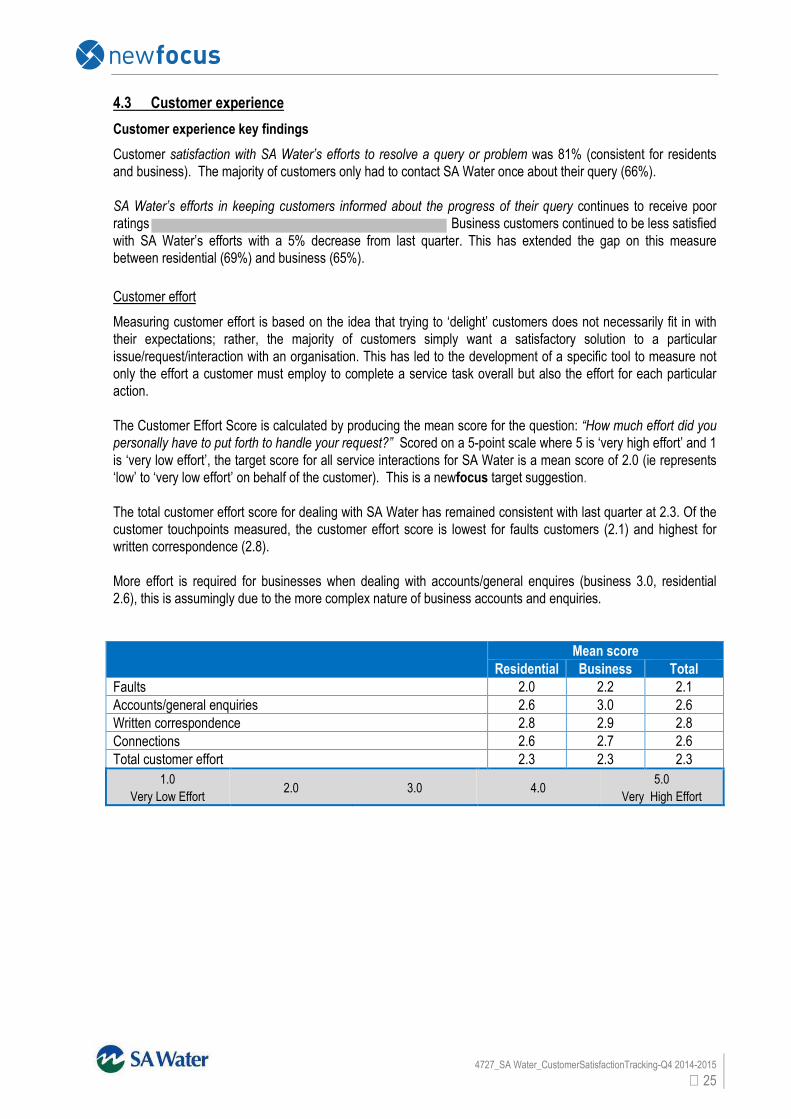
4.3 Customer experience
Customer experience key findings
Customer satisfaction with SA Water’s efforts to resolve a query or problem was 81% (consistent for residents
and business). The majority of customers only had to contact SA Water once about their query (66%).
SA Water’s efforts in keeping customers informed about the progress of their query continues to receive poor
ratings Business customers continued to be less satisfied
with SA Water’s efforts with a 5% decrease from last quarter. This has extended the gap on this measure
between residential (69%) and business (65%).
Customer effort
Measuring customer effort is based on the idea that trying to ‘delight’ customers does not necessarily fit in with
their expectations; rather, the majority of customers simply want a satisfactory solution to a particular
issue/request/interaction with an organisation. This has led to the development of a specific tool to measure not
only the effort a customer must employ to complete a service task overall but also the effort for each particular
action.
The Customer Effort Score is calculated by producing the mean score for the question: “How much effort did you
personally have to put forth to handle your request?” Scored on a 5-point scale where 5 is ‘very high effort’ and 1
is ‘very low effort’, the target score for all service interactions for SA Water is a mean score of 2.0 (ie represents
‘low’ to ‘very low effort’ on behalf of the customer). This is a newfocus target suggestion.
The total customer effort score for dealing with SA Water has remained consistent with last quarter at 2.3. Of the
customer touchpoints measured, the customer effort score is lowest for faults customers (2.1) and highest for
written correspondence (2.8).
More effort is required for businesses when dealing with accounts/general enquires (business 3.0, residential
2.6), this is assumingly due to the more complex nature of business accounts and enquiries.
Mean score
Residential Business Total
Faults 2.0 2.2 2.1
Accounts/general enquiries 2.6 3.0 2.6
Written correspondence 2.8 2.9 2.8
Connections 2.6 2.7 2.6
Total customer effort 2.3 2.3 2.3
1.0
Very Low Effort 2.0 3.0 4.0
5.0
Very High Effort
4727_SA Water_CustomerSatisfactionTracking-Q4 2014-2015
26
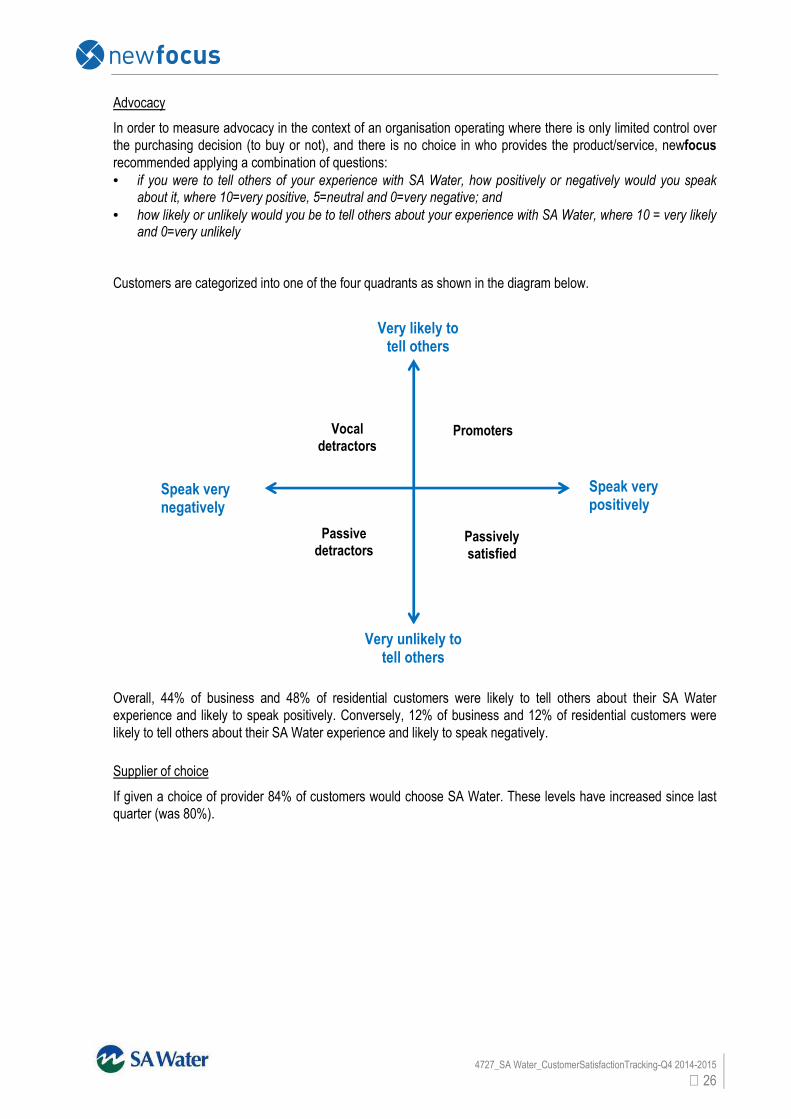
Advocacy
In order to measure advocacy in the context of an organisation operating where there is only limited control over
the purchasing decision (to buy or not), and there is no choice in who provides the product/service, newfocus
recommended applying a combination of questions:
• if you were to tell others of your experience with SA Water, how positively or negatively would you speak about it, where 10=very positive, 5=neutral and 0=very negative; and
• how likely or unlikely would you be to tell others about your experience with SA Water, where 10 = very likely and 0=very unlikely
Customers are categorized into one of the four quadrants as shown in the diagram below.
Overall, 44% of business and 48% of residential customers were likely to tell others about their SA Water
experience and likely to speak positively. Conversely, 12% of business and 12% of residential customers were
likely to tell others about their SA Water experience and likely to speak negatively.
Supplier of choice
If given a choice of provider 84% of customers would choose SA Water. These levels have increased since last
quarter (was 80%).
Very unlikely to tell others
Very likely to tell others
Speak very negatively
Speak very positively
Vocal
detractors Promoters
Passive detractors
Passively
satisfied
4727_SA Water_CustomerSatisfactionTracking-Q4 2014-2015
27
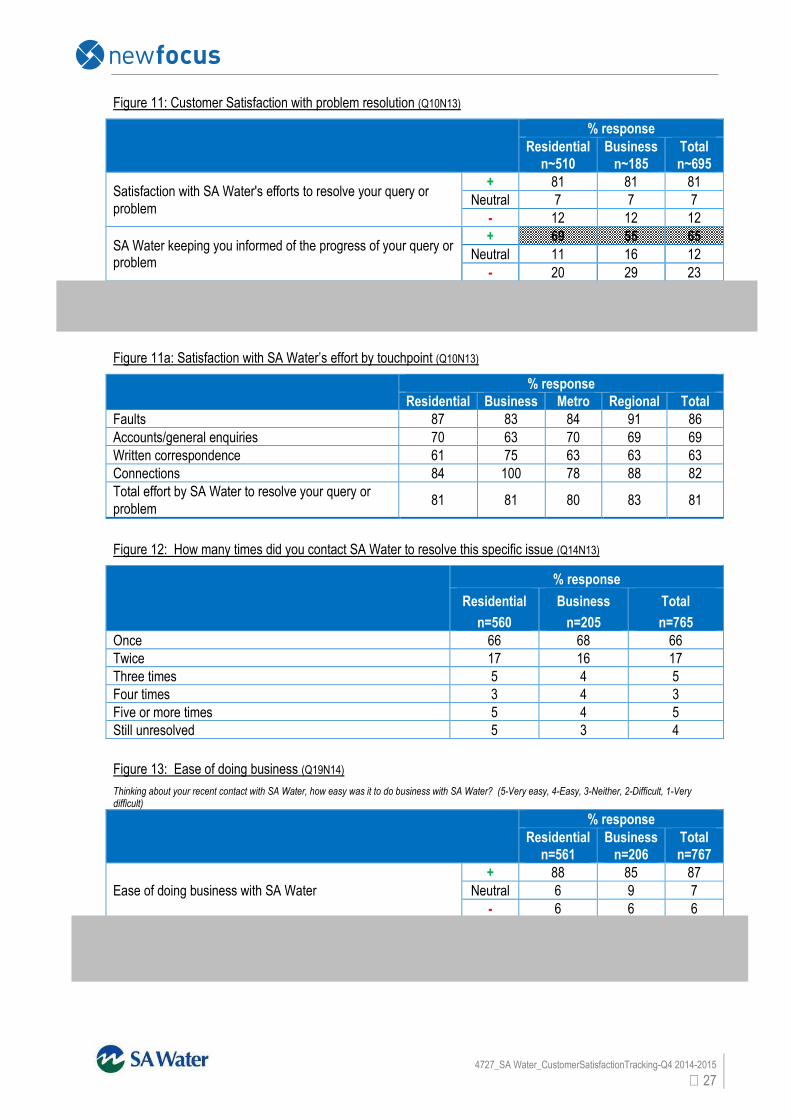
Figure 11: Customer Satisfaction with problem resolution (Q10N13)
% response
Residential
n~510
Business
n~185
Total
n~695
Satisfaction with SA Water's efforts to resolve your query or
problem
+ 81 81 81
Neutral 7 7 7
- 12 12 12
SA Water keeping you informed of the progress of your query or problem
+ 69 55 65
Neutral 11 16 12
- 20 29 23
Figure 11a: Satisfaction with SA Water’s effort by touchpoint (Q10N13)
% response
Residential Business Metro Regional Total
Faults 87 83 84 91 86
Accounts/general enquiries 70 63 70 69 69
Written correspondence 61 75 63 63 63
Connections 84 100 78 88 82
Total effort by SA Water to resolve your query or
problem 81 81 80 83 81
Figure 12: How many times did you contact SA Water to resolve this specific issue (Q14N13)
% response
Residential
n=560
Business
n=205
Total
n=765
Once 66 68 66
Twice 17 16 17
Three times 5 4 5
Four times 3 4 3
Five or more times 5 4 5
Still unresolved 5 3 4
Figure 13: Ease of doing business (Q19N14)
Thinking about your recent contact with SA Water, how easy was it to do business with SA Water? (5-Very easy, 4-Easy, 3-Neither, 2-Difficult, 1-Very difficult)
% response
Residential
n=561
Business
n=206
Total
n=767
Ease of doing business with SA Water
+ 88 85 87
Neutral 6 9 7
- 6 6 6
4727_SA Water_CustomerSatisfactionTracking-Q4 2014-2015
28
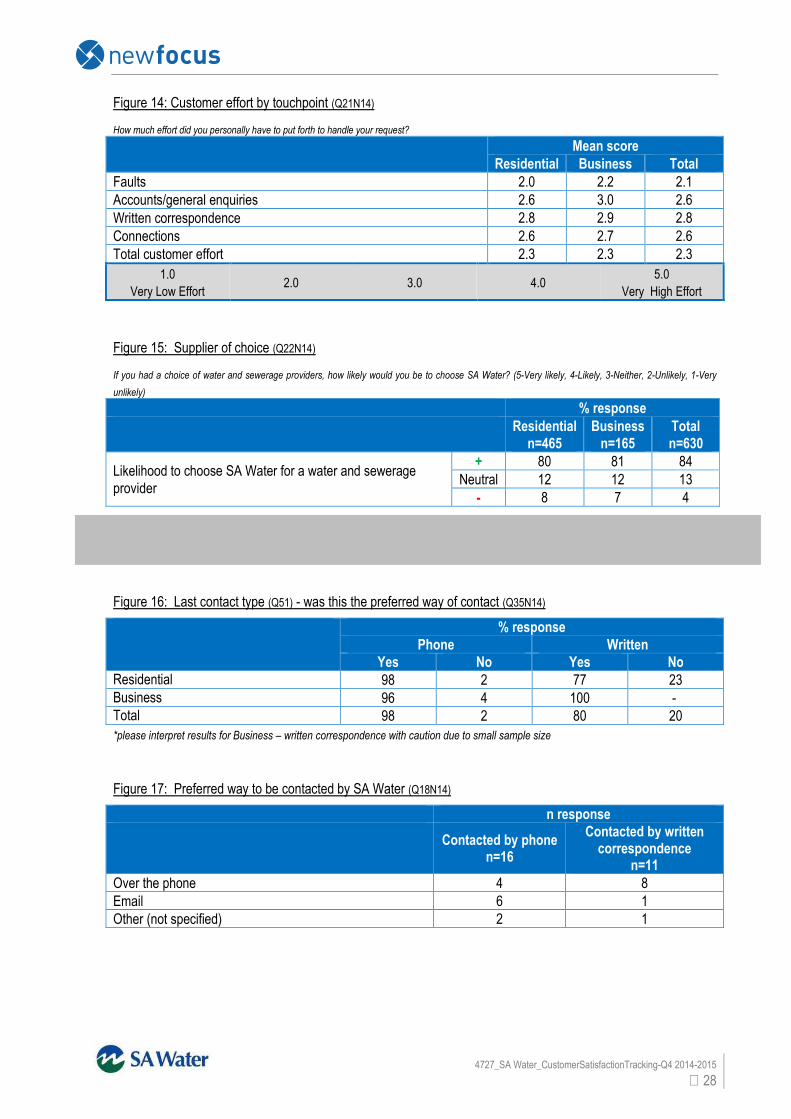
Figure 14: Customer effort by touchpoint (Q21N14)
How much effort did you personally have to put forth to handle your request?
Mean score
Residential Business Total
Faults 2.0 2.2 2.1
Accounts/general enquiries 2.6 3.0 2.6
Written correspondence 2.8 2.9 2.8
Connections 2.6 2.7 2.6
Total customer effort 2.3 2.3 2.3
1.0
Very Low Effort 2.0 3.0 4.0
5.0
Very High Effort
Figure 15: Supplier of choice (Q22N14)
If you had a choice of water and sewerage providers, how likely would you be to choose SA Water? (5-Very likely, 4-Likely, 3-Neither, 2-Unlikely, 1-Very
unlikely)
% response
Residential
n=465
Business
n=165
Total
n=630
Likelihood to choose SA Water for a water and sewerage
provider
+ 80 81 84
Neutral 12 12 13
- 8 7 4
Figure 16: Last contact type (Q51) - was this the preferred way of contact (Q35N14)
% response
Phone Written
Yes No Yes No
Residential 98 2 77 23
Business 96 4 100 -
Total 98 2 80 20
*please interpret results for Business – written correspondence with caution due to small sample size
Figure 17: Preferred way to be contacted by SA Water (Q18N14)
n response
Contacted by phone
n=16
Contacted by written correspondence
n=11
Over the phone 4 8
Email 6 1
Other (not specified) 2 1
4727_SA Water_CustomerSatisfactionTracking-Q4 2014-2015
29
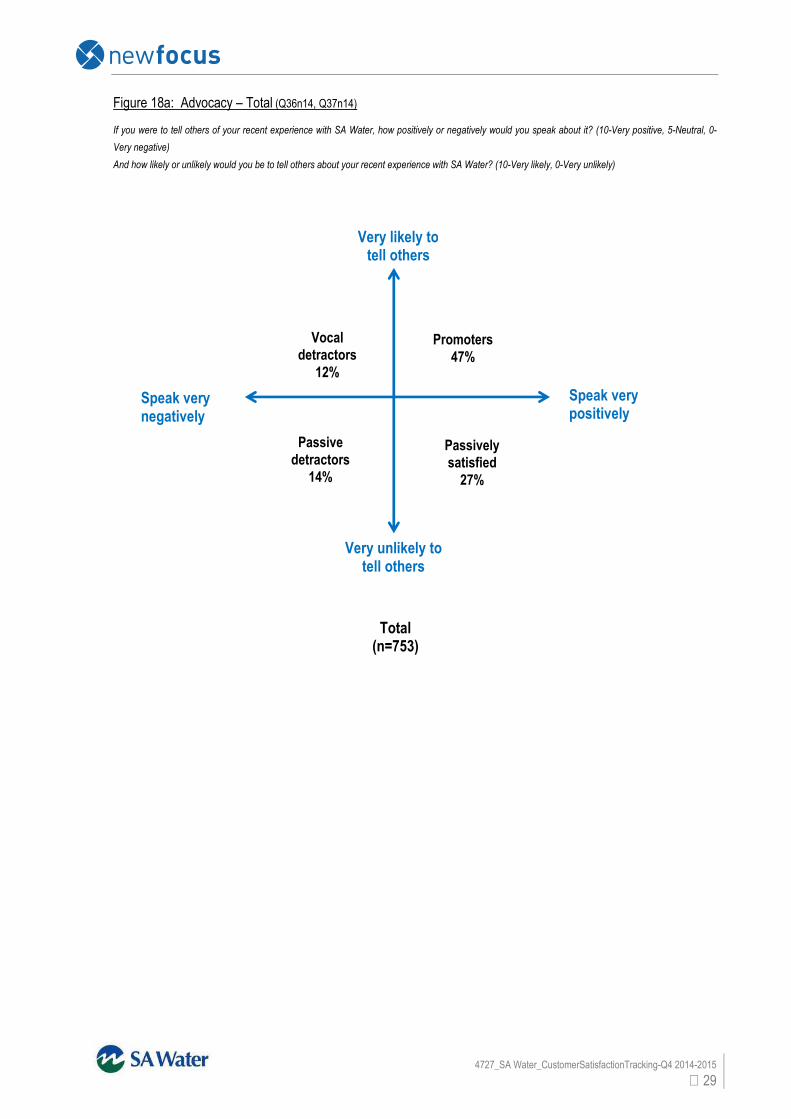
Figure 18a: Advocacy – Total (Q36n14, Q37n14)
If you were to tell others of your recent experience with SA Water, how positively or negatively would you speak about it? (10-Very positive, 5-Neutral, 0-
Very negative)
And how likely or unlikely would you be to tell others about your recent experience with SA Water? (10-Very likely, 0-Very unlikely)
Very unlikely to tell others
Very likely to tell others
Speak very negatively
Speak very positively
Vocal
detractors
12%
Promoters
47%
Passive
detractors
14%
Passively
satisfied
27%
Total (n=753)
4727_SA Water_CustomerSatisfactionTracking-Q4 2014-2015
30
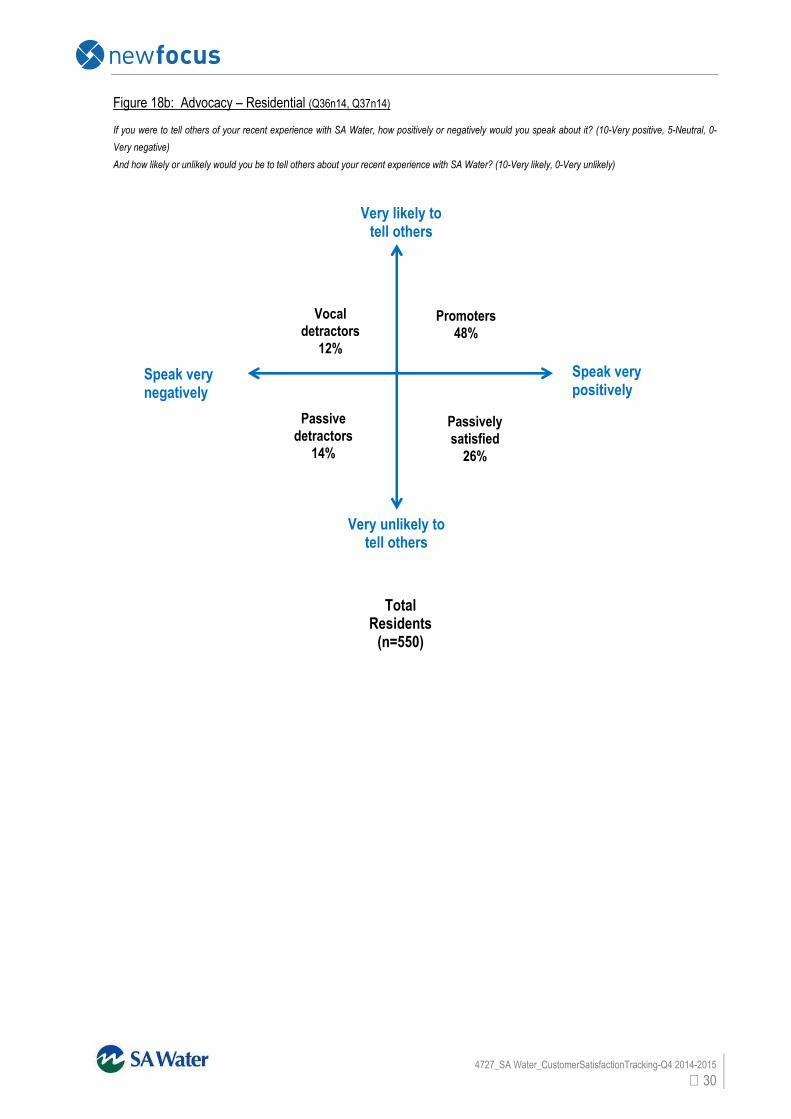
Figure 18b: Advocacy – Residential (Q36n14, Q37n14)
If you were to tell others of your recent experience with SA Water, how positively or negatively would you speak about it? (10-Very positive, 5-Neutral, 0-
Very negative)
And how likely or unlikely would you be to tell others about your recent experience with SA Water? (10-Very likely, 0-Very unlikely)
Very unlikely to tell others
Very likely to tell others
Speak very negatively
Speak very positively
Vocal
detractors
12%
Promoters
48%
Passive
detractors
14%
Passively
satisfied
26%
Total Residents (n=550)
4727_SA Water_CustomerSatisfactionTracking-Q4 2014-2015
31
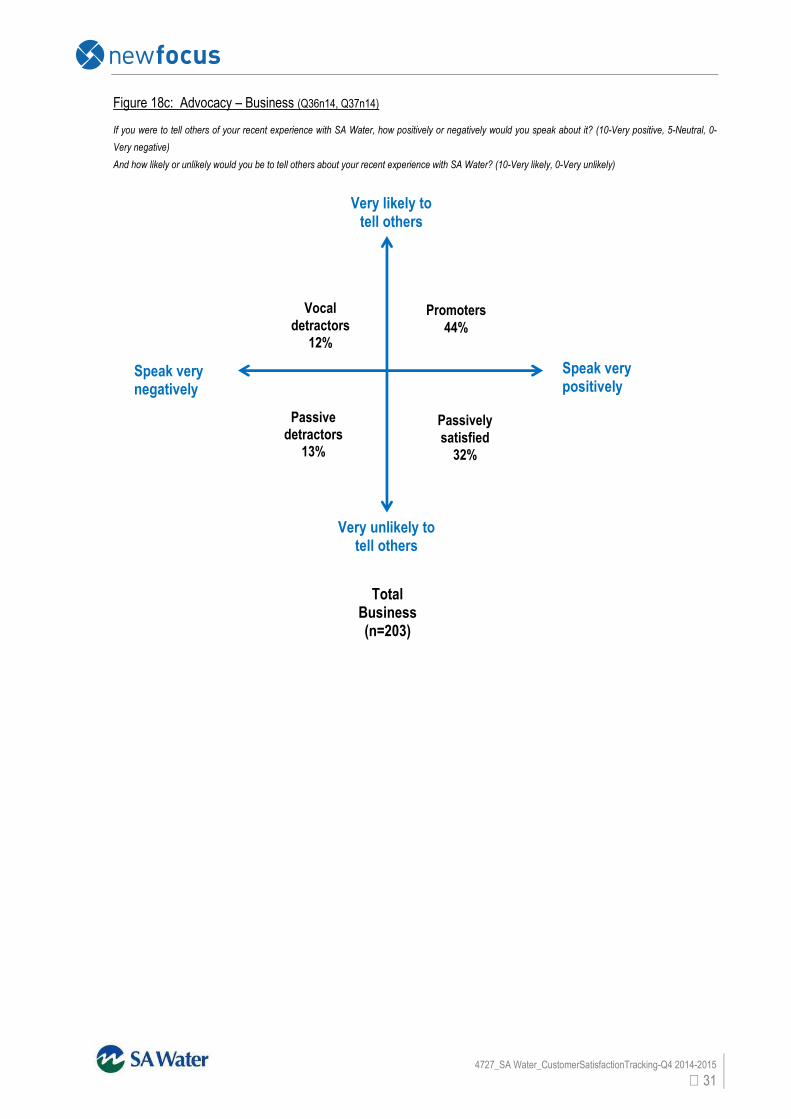
Figure 18c: Advocacy – Business (Q36n14, Q37n14)
If you were to tell others of your recent experience with SA Water, how positively or negatively would you speak about it? (10-Very positive, 5-Neutral, 0-
Very negative)
And how likely or unlikely would you be to tell others about your recent experience with SA Water? (10-Very likely, 0-Very unlikely)
Very unlikely to tell others
Very likely to tell others
Speak very negatively
Speak very positively
Vocal
detractors
12%
Promoters
44%
Passive
detractors 13%
Passively
satisfied
32%
Total Business (n=203)

4727_SA Water_CustomerSatisfactionTracking-Q4 2014-2015
32
4.4 Water quality
Water quality key findings
Total satisfaction with water quality increased by 3% this quarter to 81%,
The increase seen at the total level has been influenced by an increase in resident satisfaction with water quality
which went from 79% to 83% this quarter whilst business stayed consistent at 76%.
Tap water with an additional filter (46%), tap water (28%) and rain water/tank water (18%) were the main sources
of drinking water across the samples.
Colour and pressure of water remain the top performing attributes in regard to water quality (
• smell/odour
• overall quality (business only)
Taste continues to be the area of lowest satisfaction with both
customer types and locations. Taste is also a concern for regular drinkers of tap water with no additional filter. In
addition, taste has the highest levels of dissatisfaction among customers surveyed (nearly a quarter of all
respondents are dissatisfied with taste). These measures remain consistent with what we saw last quarter.
Those who regularly drink tap water are more positive on water quality overall than those who do not regularly
drink tap water, particularly in the business sector.
Figure 19: Customer Satisfaction with water quality (Q38)
% response
Residential
n~541
Business
n~186
Total
n~727
Taste
+ 57 55 57
Neutral 19 21 20
- 23 25 24
Safe to drink
+ 82 82 82
Neutral 11 11 11
- 7 6 7
Colour
+ 88 86 88
Neutral 9 9 9
- 3 5 3
Smell/odour
+ 79 77 79
Neutral 12 17 14
- 8 6 8
Pressure
+ 85 85 85
Neutral 9 9 9
- 6 6 6
The overall quality of the water
+ 83 76 81
Neutral 12 17 13
- 5 7 6

4727_SA Water_CustomerSatisfactionTracking-Q4 2014-2015
33
Figure 20: Drivers of Satisfaction (Ranked in order of importance) – Water Quality
Water Quality Satisfaction Score
(% satisfied)
Taste 57
Colour 88
Safe to drink 82
Figure 21: Satisfaction of water quality based on regular vs. not regular tap water drinker – Residential
(Q38, Q17N14)
% response
Residential Regularly drink tap
water n~313
Do not drink tap water regularly n~160
Taste
+ 69 35
Neutral 16 27
- 15 38
Safe to drink
+ 89 68
Neutral 7 17
- 4 15
Colour
+ 92 84
Neutral 7 13
- 2 4
Smell/odour
+ 86 69
Neutral 10 16
- 5 15
Pressure
+ 87 79
Neutral 8 14
- 5 7
The overall quality of the water
+ 88 75
Neutral 9 14
- 3 11
4727_SA Water_CustomerSatisfactionTracking-Q4 2014-2015
34
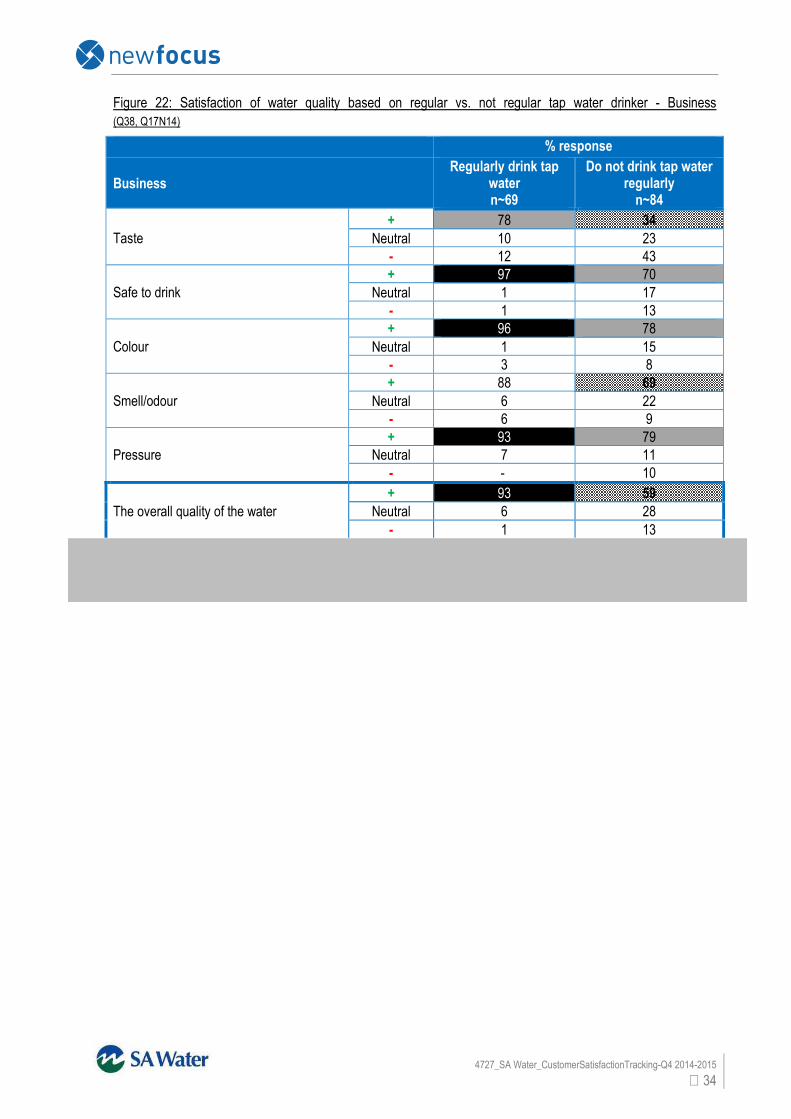
Figure 22: Satisfaction of water quality based on regular vs. not regular tap water drinker - Business
(Q38, Q17N14)
% response
Business Regularly drink tap
water n~69
Do not drink tap water regularly n~84
Taste
+ 78 34
Neutral 10 23
- 12 43
Safe to drink
+ 97 70
Neutral 1 17
- 1 13
Colour
+ 96 78
Neutral 1 15
- 3 8
Smell/odour
+ 88 69
Neutral 6 22
- 6 9
Pressure
+ 93 79
Neutral 7 11
- - 10
The overall quality of the water
+ 93 59
Neutral 6 28
- 1 13
4727_SA Water_CustomerSatisfactionTracking-Q4 2014-2015
35
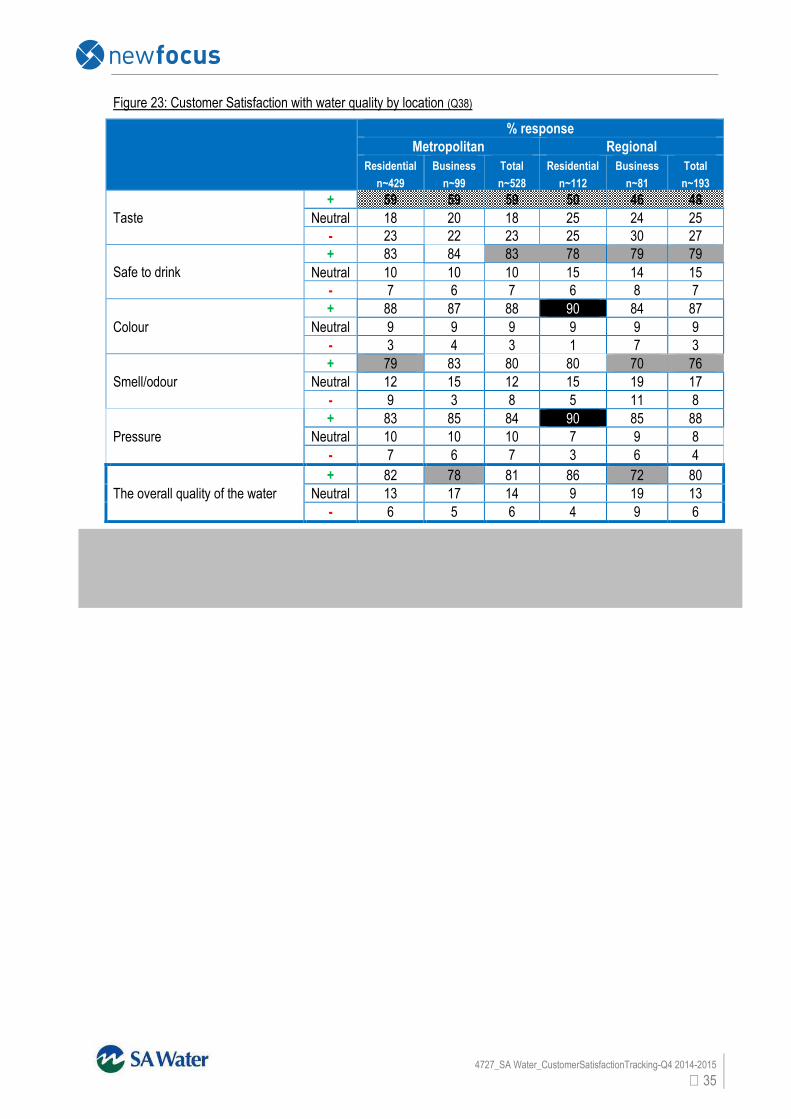
Figure 23: Customer Satisfaction with water quality by location (Q38)
% response
Metropolitan Regional
Residential
n~429
Business
n~99
Total
n~528
Residential
n~112
Business
n~81
Total
n~193
Taste
+ 59 59 59 50 46 48
Neutral 18 20 18 25 24 25
- 23 22 23 25 30 27
Safe to drink
+ 83 84 83 78 79 79
Neutral 10 10 10 15 14 15
- 7 6 7 6 8 7
Colour
+ 88 87 88 90 84 87
Neutral 9 9 9 9 9 9
- 3 4 3 1 7 3
Smell/odour
+ 79 83 80 80 70 76
Neutral 12 15 12 15 19 17
- 9 3 8 5 11 8
Pressure
+ 83 85 84 90 85 88
Neutral 10 10 10 7 9 8
- 7 6 7 3 6 4
The overall quality of the water
+ 82 78 81 86 72 80
Neutral 13 17 14 9 19 13
- 6 5 6 4 9 6

4727_SA Water_CustomerSatisfactionTracking-Q4 2014-2015
36
4.5 Billing
Billing key findings
This quarter has seen a slight increase in the percentage of customers who feel that SA Water bills are
affordable, from 19% to 23%. This has been supported by a lift in resident perceptions, which have moved from
18% to 23%. Business has remained relatively stable with a 1% decrease to 21% this quarter.
Customers are feeling more comfortable to pay their bill in full by the due date with an increase from 64% to 73%
this quarter. In terms of receiving the bill, 77% of customers (residential and business alike) have a preference to
receive a hard copy in the mail. However, 20% would like to receive their bill by email. Whilst the majority of
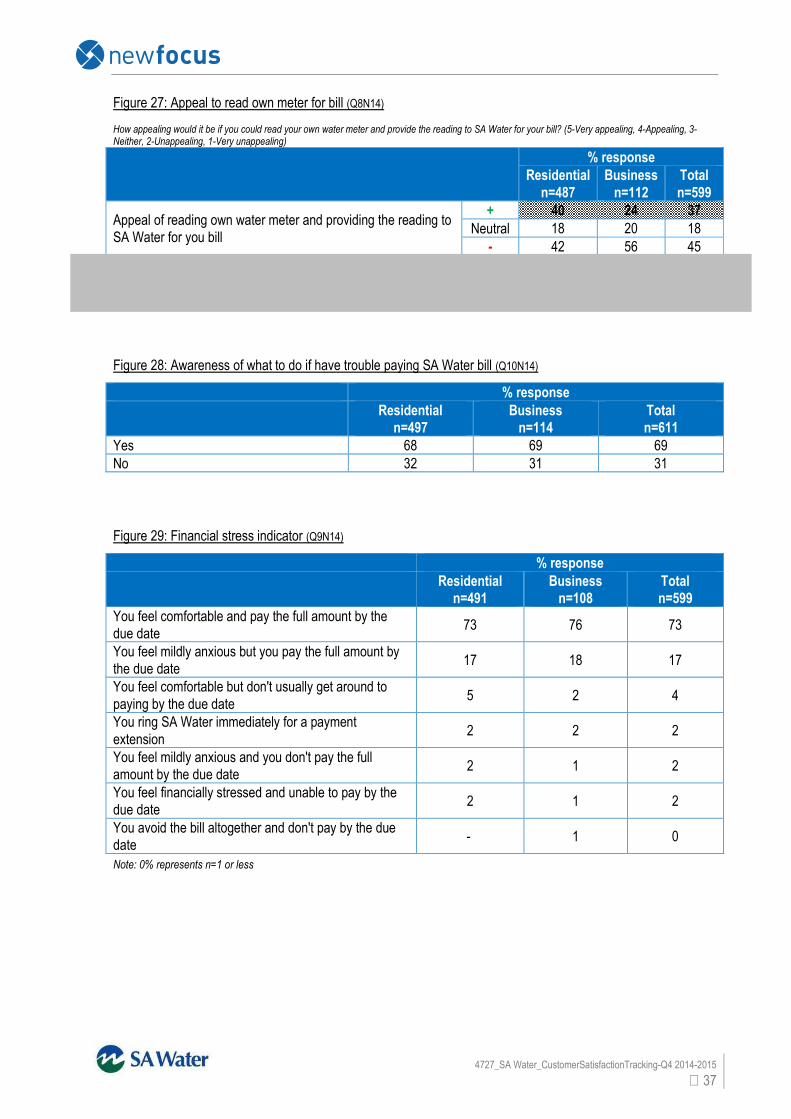
customers have a preference for quarterly meter reading (82%), 37% find the concept of reading their own meter
and providing the reading to SA Water appealing (more so residential than business customers). However, with
45% of customers finding this suggestion unappealing there is still a way to go before people are ready for
changes like this.
Figure 24: Affordability of SA Water bill (Q4N14)
How affordable do you think your SA Water bill is? (5-Very affordable, 1-Not at all affordable)
Figure 25: Preference to receive SA Water bill (Q5N14)
Figure 26: Choice of meter reading frequency (Q7N14)
% response
Residential
n=497
Business
n=114
Total
n=611
Quarterly 81 83 82
Once a month 10 12 10
Every two months 3 1 3
Every 6 months 5 2 4
Once a year 0 1 0
Note: 0% represents n=3 or less
% response
Residential
n=472
Business
n=111
Total
n=583
Affordability
+ 23 21 23
Neutral 38 36 38
- 38 43 39
% response
Residential
n=497
Business
n=114
Total
n=611
Hard copy in the mail 77 77 77
Email 20 22 20
Via an App on your smartphone 2 - 1
Through an individual login on the SA
Water website 1 1 1
4727_SA Water_CustomerSatisfactionTracking-Q4 2014-2015
37
Figure 27: Appeal to read own meter for bill (Q8N14) How appealing would it be if you could read your own water meter and provide the reading to SA Water for your bill? (5-Very appealing, 4-Appealing, 3-Neither, 2-Unappealing, 1-Very unappealing)
% response
Residential
n=487
Business
n=112
Total
n=599
Appeal of reading own water meter and providing the reading to
SA Water for you bill
+ 40 24 37
Neutral 18 20 18
- 42 56 45
Figure 28: Awareness of what to do if have trouble paying SA Water bill (Q10N14)
Figure 29: Financial stress indicator (Q9N14)
Note: 0% represents n=1 or less
% response
Residential
n=497
Business
n=114
Total
n=611
Yes 68 69 69
No 32 31 31
% response
Residential
n=491
Business
n=108
Total
n=599
You feel comfortable and pay the full amount by the
due date 73 76 73
You feel mildly anxious but you pay the full amount by
the due date 17 18 17
You feel comfortable but don't usually get around to
paying by the due date 5 2 4
You ring SA Water immediately for a payment
extension 2 2 2
You feel mildly anxious and you don't pay the full
amount by the due date 2 1 2
You feel financially stressed and unable to pay by the
due date 2 1 2
You avoid the bill altogether and don't pay by the due
date - 1 0
4727_SA Water_CustomerSatisfactionTracking-Q4 2014-2015
38
4.6 Written correspondence
Written correspondence key findings
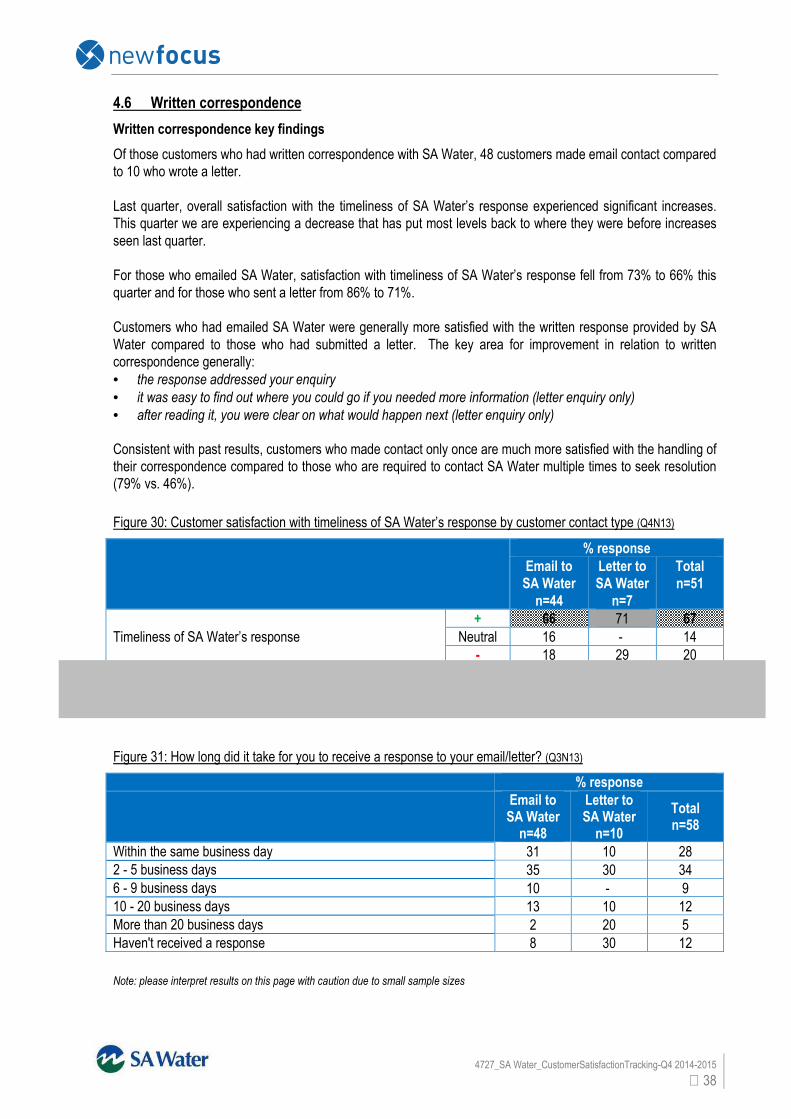
Of those customers who had written correspondence with SA Water, 48 customers made email contact compared
to 10 who wrote a letter.
Last quarter, overall satisfaction with the timeliness of SA Water’s response experienced significant increases.
This quarter we are experiencing a decrease that has put most levels back to where they were before increases
seen last quarter.
For those who emailed SA Water, satisfaction with timeliness of SA Water’s response fell from 73% to 66% this
quarter and for those who sent a letter from 86% to 71%.
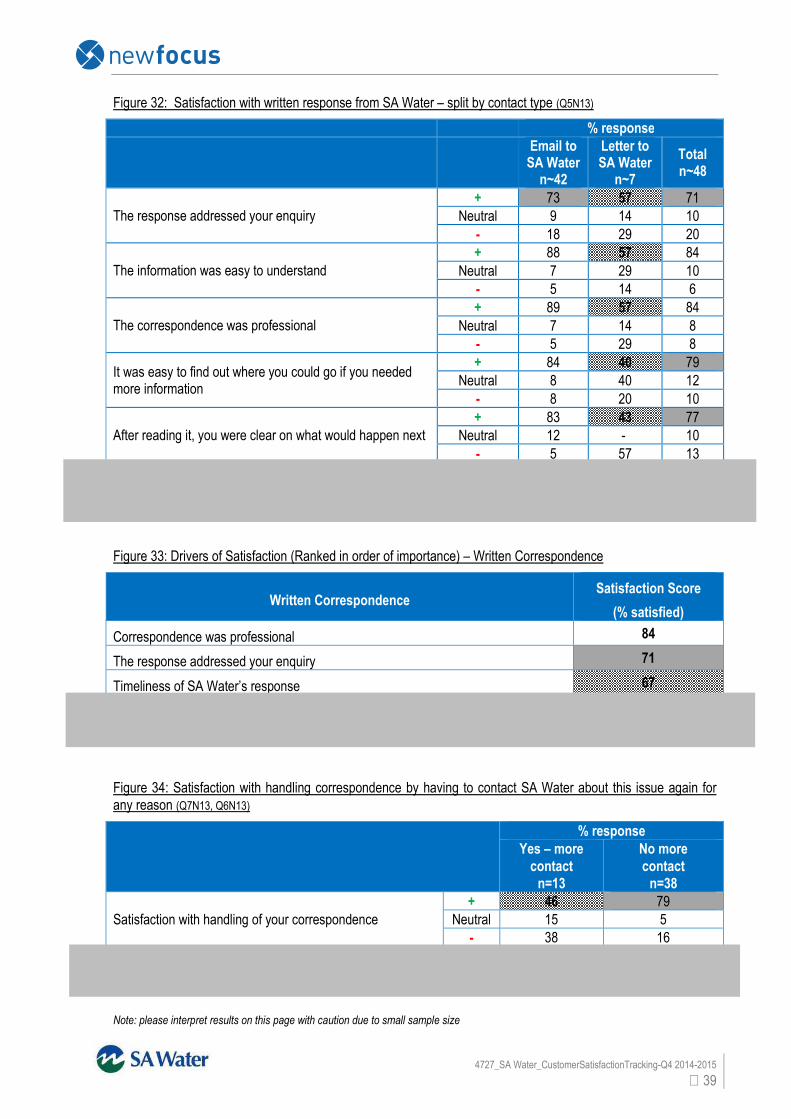
Customers who had emailed SA Water were generally more satisfied with the written response provided by SA
Water compared to those who had submitted a letter. The key area for improvement in relation to written
correspondence generally:
• the response addressed your enquiry
• it was easy to find out where you could go if you needed more information (letter enquiry only)
• after reading it, you were clear on what would happen next (letter enquiry only)
Consistent with past results, customers who made contact only once are much more satisfied with the handling of
their correspondence compared to those who are required to contact SA Water multiple times to seek resolution
(79% vs. 46%).
Figure 30: Customer satisfaction with timeliness of SA Water’s response by customer contact type (Q4N13)
% response
Email to
SA Water
n=44
Letter to
SA Water
n=7
Total
n=51
Timeliness of SA Water’s response
+ 66 71 67
Neutral 16 - 14
- 18 29 20
Figure 31: How long did it take for you to receive a response to your email/letter? (Q3N13)
% response
Email to SA Water n=48
Letter to SA Water n=10
Total n=58
Within the same business day 31 10 28
2 - 5 business days 35 30 34
6 - 9 business days 10 - 9
10 - 20 business days 13 10 12
More than 20 business days 2 20 5
Haven't received a response 8 30 12
Note: please interpret results on this page with caution due to small sample sizes
4727_SA Water_CustomerSatisfactionTracking-Q4 2014-2015
39
Figure 32: Satisfaction with written response from SA Water – split by contact type (Q5N13)
% response
Email to SA Water n~42
Letter to SA Water
n~7
Total n~48
The response addressed your enquiry
+ 73 57 71
Neutral 9 14 10
- 18 29 20
The information was easy to understand
+ 88 57 84
Neutral 7 29 10
- 5 14 6
The correspondence was professional
+ 89 57 84
Neutral 7 14 8
- 5 29 8
It was easy to find out where you could go if you needed more information
+ 84 40 79
Neutral 8 40 12
- 8 20 10
After reading it, you were clear on what would happen next
+ 83 43 77
Neutral 12 - 10
- 5 57 13
Figure 33: Drivers of Satisfaction (Ranked in order of importance) – Written Correspondence
Written Correspondence Satisfaction Score
(% satisfied)
Correspondence was professional 84
The response addressed your enquiry 71
Timeliness of SA Water’s response 67
Figure 34: Satisfaction with handling correspondence by having to contact SA Water about this issue again for
any reason (Q7N13, Q6N13)
% response
Yes – more
contact
n=13
No more
contact
n=38
Satisfaction with handling of your correspondence
+ 46 79
Neutral 15 5
- 38 16
Note: please interpret results on this page with caution due to small sample size

4727_SA Water_CustomerSatisfactionTracking-Q4 2014-2015
40
4.7 Connections
Connections key findings
This quarter, overall satisfaction with the office staff rose from 79% - 91%,
This is driven slightly more by regional customers (97%) compared with metropolitan customers (89%). Overall
satisfaction with field maintenance crew is also almost at best practice levels at 89% this quarter. Again, this is
driven by a more positive regional sector (100%) compared to metropolitan (83%).
Other measures sitting within the best practice range include:
• staff knowledge of products and services – 90%
• helpfulness of staff – 92%
• treating people’s property with care – 93%
Figure 35: Customer satisfaction with connection by location
% response
Metro n~64
Regional n~39
Total n~93
Time taken to acknowledge receipt of your application
+ 78 85 81
Neutral 8 6 7
- 14 9 12
Staff knowledge of products and services
+ 91 87 90
Neutral 9 13 10
- - - -
Helpfulness of staff
+ 89 100 92
Neutral 10 - 6
- 2 - 1
Clear explanation of the situation and any next steps
+ 88 88 88
Neutral 9 3 7
- 3 9 5
Estimated timeframe of overall time to complete
+ 75 84 78
Neutral 14 6 11
- 11 9 10
Overall satisfaction with the office staff
+ 89 97 91
Neutral 8 3 7
- 3 - 2
Leaving the worksite in a safe and neat condition after work/completing the connection
+ 84 97 88
Neutral 5 3 4
- 11 - 8
Treating people's property with care
+ 90 100 93
Neutral 7 - 4
- 3 - 2
The time taken to complete the connection
+ 76 91 81
Neutral 6 6 6
- 18 3 13
Overall satisfaction with field maintenance crew
+ 83 100 89
Neutral 8 - 6
- 8 - 6
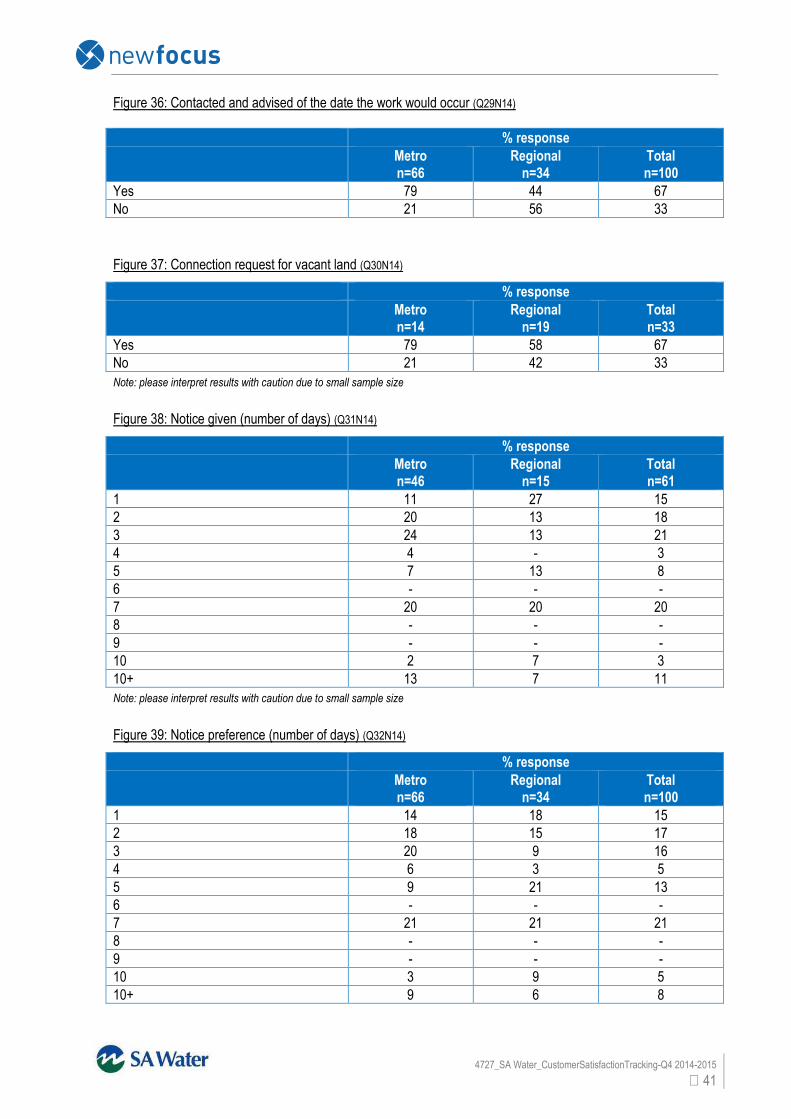
4727_SA Water_CustomerSatisfactionTracking-Q4 2014-2015
41
Figure 36: Contacted and advised of the date the work would occur (Q29N14)
Figure 37: Connection request for vacant land (Q30N14)
Note: please interpret results with caution due to small sample size
Figure 38: Notice given (number of days) (Q31N14)
Note: please interpret results with caution due to small sample size
Figure 39: Notice preference (number of days) (Q32N14)
% response
Metro
n=66
Regional
n=34
Total
n=100
Yes 79 44 67
No 21 56 33
% response
Metro
n=14
Regional
n=19
Total
n=33
Yes 79 58 67
No 21 42 33
% response
Metro
n=46
Regional
n=15
Total
n=61
1 11 27 15
2 20 13 18
3 24 13 21
4 4 - 3
5 7 13 8
6 - - -
7 20 20 20
8 - - -
9 - - -
10 2 7 3
10+ 13 7 11
% response
Metro
n=66
Regional
n=34
Total
n=100
1 14 18 15
2 18 15 17
3 20 9 16
4 6 3 5
5 9 21 13
6 - - -
7 21 21 21
8 - - -
9 - - -
10 3 9 5
10+ 9 6 8

4727_SA Water_CustomerSatisfactionTracking-Q4 2014-2015
42
Figure 40: Drivers of Satisfaction (Ranked in order of importance) – Land development/connections
Land development/connections – field crew Satisfaction Score
(% satisfied)
Treating people’s property with care 93
Leaving the worksite in a safe and neat condition after work/completing the connection
88
Land development/connections – office staff Satisfaction Score
(% satisfied)
Helpfulness of staff 92
Clear explanations of situation and next steps 88