Embed Size (px)
Citation preview

Customer Partnership MeetingCustomer Partnership Meeting
John Doll John Doll Commissioner for PatentsCommissioner for Patents

Notice of Proposed Rules ChangesNotice of Proposed Rules Changes
• Claims
• Continuing Applications
• Information Disclosure Statements

Markush/Restriction practiceMarkush/Restriction practice
• Markush Practice
• Restriction/Divisional practice

• Potential products for strategic plan include:
• Different Levels of Examination
• Deferred examination
• Accelerated examination
• Traditional examination
• Collaborative examination
Alternative Examination ProductsAlternative Examination Products
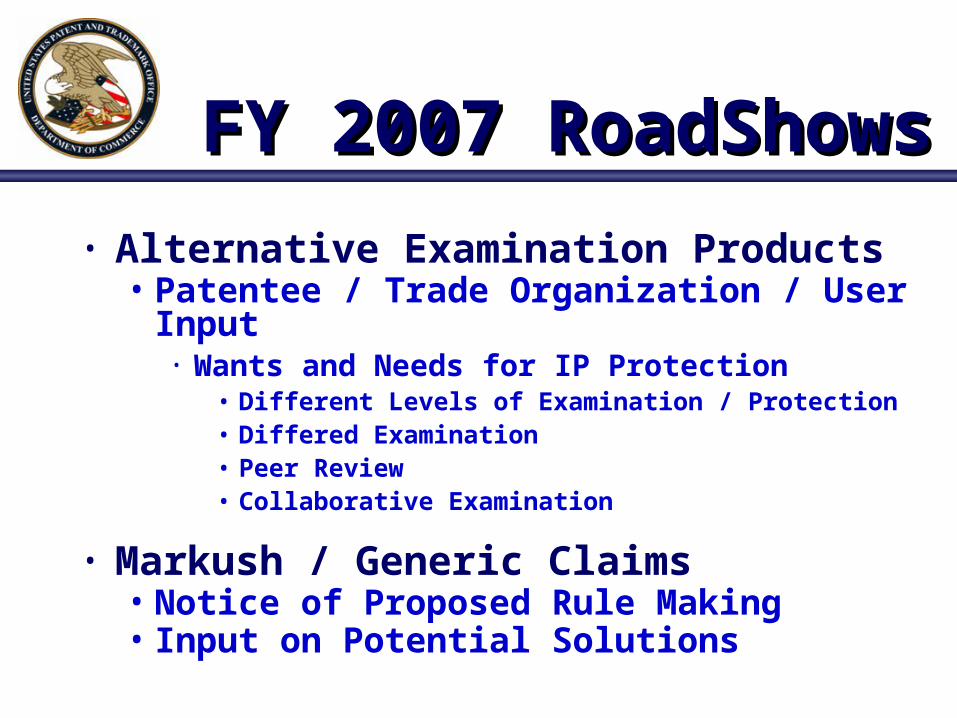
FY 2007 RoadShowsFY 2007 RoadShows
• Alternative Examination Products • Patentee / Trade Organization / User Input
• Wants and Needs for IP Protection• Different Levels of Examination / Protection• Differed Examination• Peer Review• Collaborative Examination
• Markush / Generic Claims• Notice of Proposed Rule Making• Input on Potential Solutions

FY 2006 ResultsFY 2006 Results• Improving Quality is our Highest Priority
2006 Goal 2006 Result4% allowance error 3.5% allowance error
86% in-process compliance
90% in-process compliance
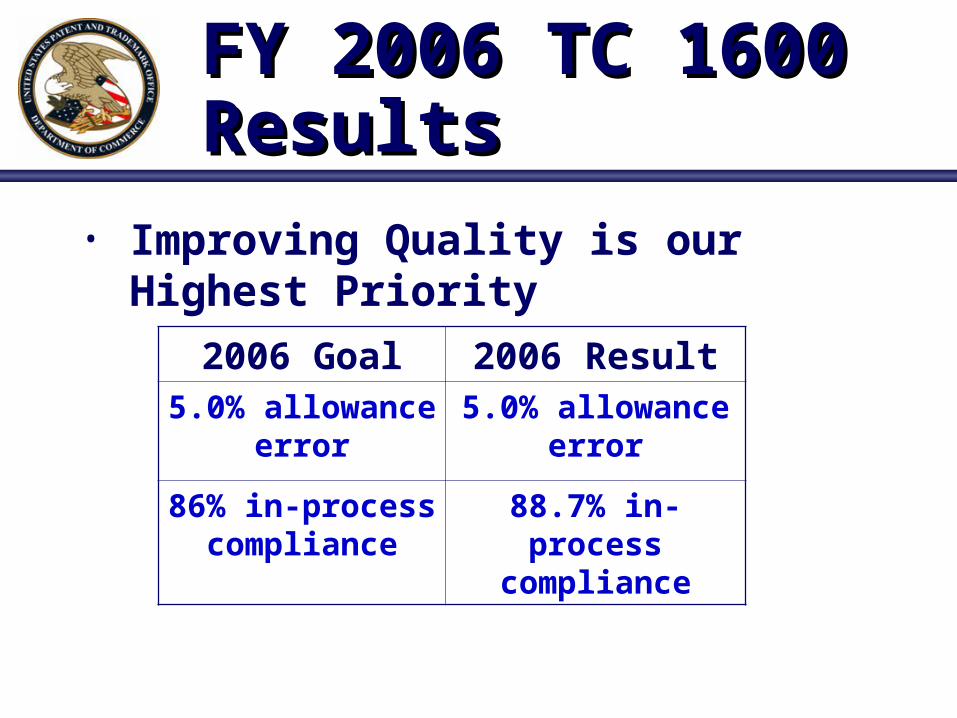
FY 2006 TC 1600 ResultsFY 2006 TC 1600 Results• Improving Quality is our Highest Priority
2006 Goal 2006 Result5.0% allowance error 5.0% allowance error
86% in-process compliance
88.7% in-process compliance

Current Quality InitiativesCurrent Quality Initiatives• Interviews before
First Action
• Second Pair of Eyes
• In Process Reviews
• Appeal Specialists
• Pre-Appeal
Brief Conferences
• Appeal Conferences
• GS-12 Certification Exam
• Primary Examiner
Recertification
• TC Targeted Areas
of Review
• New Patent Examiner
Training Academy
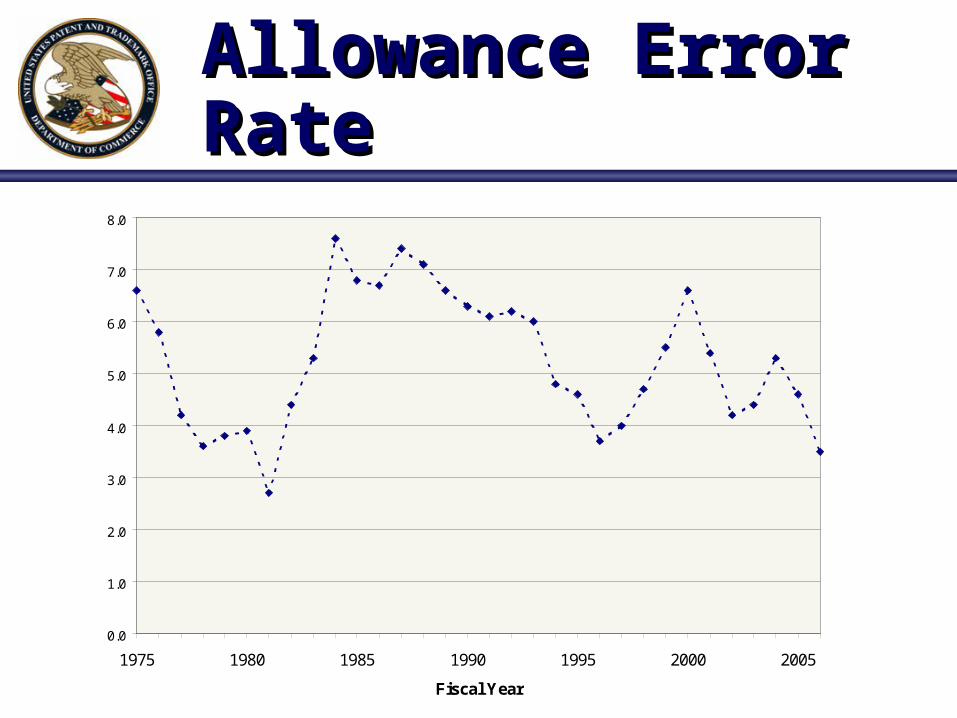
Allowance Error RateAllowance Error Rate
0.0
1.0
2.0
3.0
4.0
5.0
6.0
7.0
8.0
1975 1980 1985 1990 1995 2000 2005
Fiscal Year

Allowance RateAllowance Rate
50.0
55.0
60.0
65.0
70.0
75.0
1975 1980 1985 1990 1995 2000 2005
Fiscal Year

Error and Allowance RatesError and Allowance Rates
50.0
55.0
60.0
65.0
70.0
75.0
1975 1980 1985 1990 1995 2000 2005
Fiscal Year
% A
llow
ed o
f D
isp
osa
ls
0.0
1.0
2.0
3.0
4.0
5.0
6.0
7.0
8.0
% A
llow
ance
Err
or
% Allowed of Disposals % Allowance Error
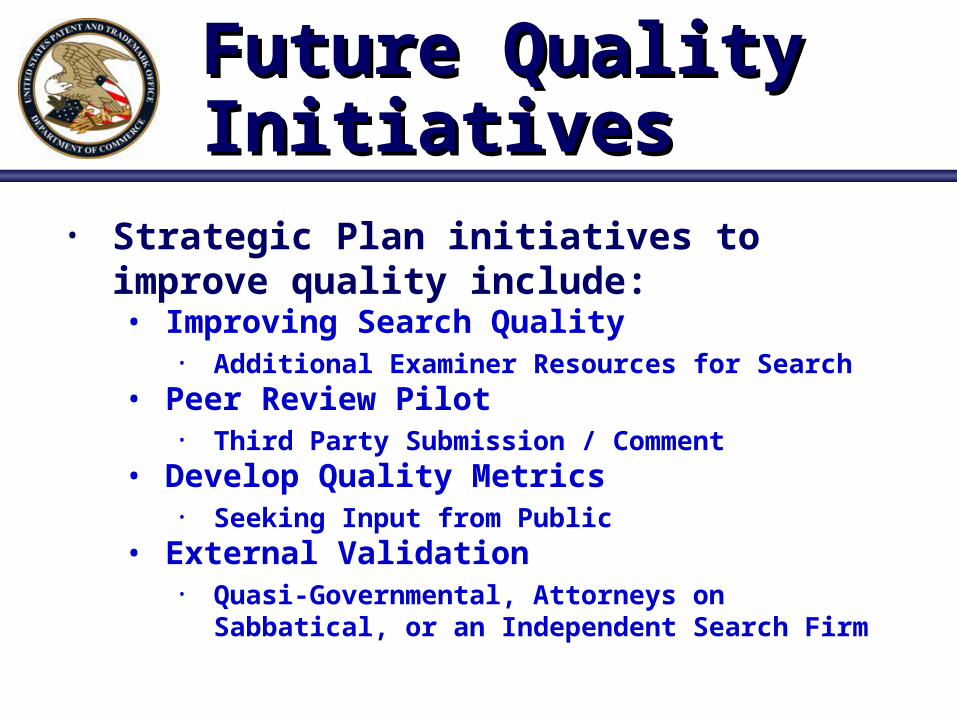
Future Quality Initiatives Future Quality Initiatives • Strategic Plan initiatives to improve quality include:
• Improving Search Quality• Additional Examiner Resources for Search
• Peer Review Pilot• Third Party Submission / Comment
• Develop Quality Metrics• Seeking Input from Public
• External Validation• Quasi-Governmental, Attorneys on Sabbatical, or an Independent
Search Firm

UPR Applications FiledUPR Applications Filed
FY 06 Goal 414,966
Actual 419,760
9.2% over 2005
1.2% over goal
050000
100000150000200000250000300000350000400000450000
1995
1996
1997
1998
1999
2000
2001
2002
2003
2004
2005
2006
UPR is Utility, Plant and Re-Issue ApplicationsUPR is Utility, Plant and Re-Issue Applications

TC 1600 FilingsTC 1600 Filings
FY06 40,687 (prelim)
7% over 2005
05000
1000015000200002500030000350004000045000

1600 1700 2100 2600 2800 3600 3700 Total* Design
New Applications1
9/30/200562,644 72,697 76,529 115,585 94,425 70,354 83,225 586,580 24,534
New Applications1
9/30/200662,663 88,362 84,139 131,675 107,195 82,324 96,963 674,233 25,817
Overall Pending Applications2
9/30/2005107,647 120,767 117,728 167,721 159,687 117,045 130,168 932,300 38,104
Overall Pending Applications2
9/30/2006114,112 137,866 129,573 181,489 174,758 129,260 147,651 1,036,875 39,430
TC Application InventoryTC Application Inventory
1 “New Application inventory” is the number of new applications designated or assigned to a technology center awaiting a first action.
2 “Overall Pending Application inventory” is the total number of applications designated or assigned to a technology center in an active status. Includes new applications; rejected awaiting response; amended; under appeal or interference; suspended; reexams and allowed applications awaiting grant publication.
*Total inventory includes applications not assigned to a particular TC, awaiting processing either pre- or post-examination.

1610 1620 1630 1640 1650 1660Total 1600
Total UPR
New Applications1
9/30/200562,644 586,580
New Applications1
9/30/200620,174 11,320 11,259 12,904 6,805 1,201 62,663 674,233
Overall Pending Applications2
9/30/2005107,647 932,300
Overall Pending Applications2
9/30/200629,365 19,159 23,944 24,523 15,186 1,935 114,112 1,036,875
TC Application InventoryTC Application Inventory
1 “New Application inventory” is the number of new applications designated or assigned to a technology center awaiting a first action.
2 “Overall Pending Application inventory” is the total number of applications designated or assigned to a technology center in an active status. Includes new applications; rejected awaiting response; amended; under appeal or interference; suspended; reexams and allowed applications awaiting grant publication.
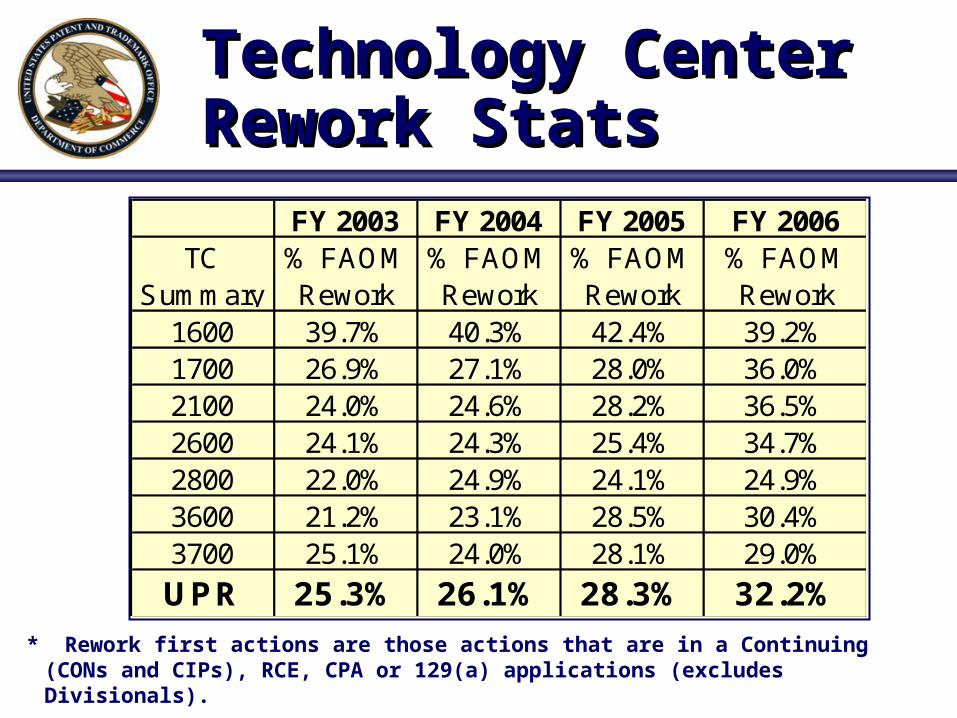
Technology Center Technology Center Rework StatsRework Stats
* Rework first actions are those actions that are in a Continuing (CONs and CIPs), RCE, CPA or 129(a) applications (excludes Divisionals).
FY 2003 FY 2004 FY 2005 FY 2006TC
Summary% FAOM Rework
% FAOM Rework
% FAOM Rework
% FAOM Rework
1600 39.7% 40.3% 42.4% 39.2%1700 26.9% 27.1% 28.0% 36.0%2100 24.0% 24.6% 28.2% 36.5%2600 24.1% 24.3% 25.4% 34.7%2800 22.0% 24.9% 24.1% 24.9%3600 21.2% 23.1% 28.5% 30.4%3700 25.1% 24.0% 28.1% 29.0%
UPR 25.3% 26.1% 28.3% 32.2%

TC 1600 Rework StatsTC 1600 Rework Stats
* Rework first actions are those actions that are in a Continuing (CONs and CIPs), RCE, CPA or 129(a) applications (excludes Divisionals).
FY 2003 FY 2004 FY 2005 FY 2006TC
Summary% FAOM Rework
% FAOM Rework
% FAOM Rework
% FAOM Rework
1610 47.0% 45.6% 48.2% 42.4%1620 28.8% 26.6% 30.4% 29.6%1630 46.9% 47.7% 44.3% 41.8%1640 48.6% 53.0% 53.7% 45.4%1650 38.3% 39.2% 33.4% 34.2%1660 4.1% 4.3% 12.3% 13.7%1600 39.7% 40.3% 42.4% 39.2%
UPR 25.3% 26.1% 28.3% 32.2%

Inventory by Art Inventory by Art Area in TC 1600Area in TC 1600
High Inventory Art Areas Months of Inventory*
1610 – Drugs, Bio-affecting and Body Treatment 42
1620 – Organic Chemistry and Heterocyclic Compounds 20
1631 - Bioinformatics 20
1630 – Nucleic Acids, Gene Expression, Animal Cloning 16
1640 – Antibodies and Immunology 17
1650 – Microbiology, Recombinant Enzymes & Proteins 13
1660 - Plants 17
*The number of months it would take to reach a first action on the merits (e.g., an action addressing patentability issues) on a new application filed October 2006 at today’s production rate. Today’s production rate means that there are no changes in production due to hiring, attrition, changes to examination processing or examination efficiencies, and that applications are taken up in the order of filing in the given art unit/area. Of course, USPTO is taking aggressive steps to ensure changes that will significantly lower the inventory rates in high-inventory art areas.

Hires and AttritionsHires and Attritions1600 1700 2100 2600 2800 3600 3700 Corps Design
FY 05 Hires 101 58 225 169 184 91 131 959 19
FY 05 Attritions 42 39 93 92 54 55 50 425 10
FY 06 BOY Examiner Staff
470 457 694 723 871 451 511 4177 81
FY 06 Hiring (10/1/06) 96 88 259 228 226 144 152 1193 25
FY 06 Attrits (10/1/06) 53 56 96 84 96 49 76 510 1
FY 07 Hiring Goal 64 160 208 304 112 176 176 1200 10
FY 06 New Hires as a Percent of Examiner Staffing in the TC
20% 19% 37% 32% 26% 32% 30% 29% 31%

TC 1600 Hires and AttritsTC 1600 Hires and Attrits1610 1620 1630 1640 1650 1660 1600 Corps
FY 05 Hires 16 6 33 30 16 0 101 959
FY 05 Attritions 5 10 12 10 4 1 42 425
FY 06 BOY Examiner Staff
67 65 124 127 81 6 470 4177
FY 06 Hiring (10/1/06) 22 19 20 20 15 0 96 1193
FY 06 Attrits (10/1/06) 11 8 13 12 9 0 53 510
FY 07 Hiring Goal 32 16 6 6 4 0 64 1200
FY 06 New Hires as a Percent of Examiner Staffing in the TC
33% 29% 16% 16% 19% 0% 20% 29%

Contact InformationContact Information
• John Doll
Commissioner for Patents
e-mail: [email protected]
Phone: 571-272-8800

Thank you.Thank you.


![WIPO - World Intellectual Property Organization · Web viewada (Commissioner of Patents) [2002] 4 SCR 45 (дело «Гарвард Колледж против Канады (Комиссар](https://img.dokumen.tips/doc/110x75/600e7ca87f2e5859cd6ee9fe/wipo-world-intellectual-property-organization-web-view-ada-commissioner-of-patents.jpg)