Embed Size (px)
Citation preview

1
Customer Brand Relationship - An empirical study of customers’ perception of brand experience, brand satisfaction, brand trust and how they affect brand loyalty. _________________________________________________________
Authors: Rima Ismail Marketing Program Caroline Langfeldt Boye Marketing Program Alexandra Muth Marketing Program
Tutor: Dr. Rana Mostaghel
Examiner: Dr. Pejvak Oghazi
Subject: Marketing
Level and semester: Bachelor thesis, Spring 2012

Abstract(
Background: During the last decade, retail businesses have realized the importance of creating
a strong brand to be able to differentiate in a fierce market. However, having a strong brand is
no longer enough to survive in the long run and gain a large customers base. Especially in the
retail and fashion industry where many products fulfill the same need for the customer, making
it important to adapt to changes on the market and stand out in the crowd. This has lead to the
wide variety of brands that can be found and an intensified competition. Therefore, the key
factor for building a long-term relationship is through customer brand relationship. A literature
review showed that the most important variables needed to build this relationship are brand
experience, brand satisfaction and brand trust.
Purpose: The purpose of this study is to investigate how brand experience, brand satisfaction
and brand trust effect brand loyalty in Växjö, Sweden.
Hypotheses:
H1: Brand experience has a positive effect on brand loyalty. H2: Brand satisfaction has a positive effect on brand loyalty. H3: Brand trust has a positive effect on brand loyalty.
Method: This study was based on a deductive and quantitative research approach with
empirical data conducted from 239 respondents to either accept or reject the stated hypotheses.
Result and conclusion: According to the empirical data, the stated hypotheses were accepted
and imply that 41.2 percent of brand loyalty can be explained by brand satisfaction, brand trust
and brand experience. However, for retail businesses within the fashion industry to ensure
brand loyalty from the customers, brand satisfaction is the main focus.
Keywords: Customer Brand Relationship, Brand experience, Brand satisfaction, Brand trust,
Brand loyalty.

Acknowledgement(
This Bachelor thesis was written in the spring of 2012, during our last semester at the
Marketing program at Linnaeus University. The process of writing this thesis has been a
valuable experience for us, where we have learned and expanded our knowledge about
marketing, branding and how to create a customer brand relationship.
First, we would like to thank our supervisor Dr. Rana Mostaghel who has given us her time and
support throughout the semester. We would also like to give a special thank to Dr. Magnus
Hultman for giving us an excellent course in methodology, helping us understand the
underlying meaning of using statistics and the different approaches connected to the data
collection.
We are also grateful to Dr. Vinit Paridaour and our fellow students, whom have provided us
with valuable feedback during the process of writing our thesis. Of course we would like to
thank all respondents for taking their time to answer our questionnaire and providing us with
valuable information for our research.
Linnaeus University
May 2012
Alexandra Muth Caroline Langfeldt Boye Rima Ismail
…………………………… ………………………………… …………………………..

Table(of(content(1.(Introduction!.....................................................................................................................................................!1 1.1!Background ....................................................................................................................... 1 1.2!Problem!discussion .......................................................................................................... 2 1.3!Delimitation ...................................................................................................................... 4 1.4!Outline!of!thesis ................................................................................................................ 4
2.(Literature(Review!..........................................................................................................................................!6 2.1!Framework!for!building!a!customer!brand!relationship .............................................. 6 2.1.1!Brand!experience ....................................................................................................... 7 2.1.2!Brand!satisfaction ...................................................................................................... 8 2.1.3!Brand!trust ................................................................................................................. 9 2.1.4!Brand!loyalty ............................................................................................................ 10
2.2!Research!gap ................................................................................................................... 11 3.(Hypotheses(&(Frame(of(Reference!...................................................................................................!14 3.1!Research!problem!and!discussion ................................................................................ 14 3.2!Hypotheses ...................................................................................................................... 15
4.(Methodology!..................................................................................................................................................!17 4.1!Research!Approach ........................................................................................................ 17 4.1.1!Deductive!versus!Inductive!Research .................................................................... 17 4.1.2!Quantitative!versus!Qualitative!Research ............................................................. 18
4.2!Research!Design ............................................................................................................. 19 4.3!Data!sources .................................................................................................................... 20 4.4!Research!strategy ........................................................................................................... 21 4.5!Data!collection!method .................................................................................................. 22 4.6!Data!Collection!Instrument ............................................................................................ 23 4.6.1!Operationalization ................................................................................................... 24 4.6.2!Questionnaire!design .............................................................................................. 27 4.6.3!PreM!testing ............................................................................................................... 28
4.7!Sampling .......................................................................................................................... 29 4.7.1!Sampling!Frame ....................................................................................................... 29 4.7.2!Sampling!Size ........................................................................................................... 29 4.7.3!Sample!selection ...................................................................................................... 30
4.8!Data!analysis!method ..................................................................................................... 31 4.8.1!Descriptive!statistics ............................................................................................... 31 4.8.2!Correlation!analysis ................................................................................................ 31 4.8.3!Regression!analysis ................................................................................................. 32
4.9!Quality!criteria ................................................................................................................ 32 4.9.1!Content!validity ....................................................................................................... 33 4.9.2!Construct!validity .................................................................................................... 33 4.9.3!Concurrent!validity ................................................................................................. 34 4.9.4!Reliability ................................................................................................................. 34
5.(Empirical(data(and(analysis!.................................................................................................................!36 5.1!Descriptive!statistics ...................................................................................................... 36 5.2!Reliability ........................................................................................................................ 37 5.3!Correlation!analysis ....................................................................................................... 37 5.4!Regression!analysis ........................................................................................................ 39
6.(Conclusions(&(implications!..................................................................................................................!41 6.1!Discussion ....................................................................................................................... 41 6.2!Conclusions ..................................................................................................................... 42 6.3!Theoretical!implications ................................................................................................ 43

6.4!Managerial!implications ................................................................................................. 44 6.5!Limitations ...................................................................................................................... 45 6.6!Future!research .............................................................................................................. 46
References(........................................................................................................................................(47 Appendix(1.(Questionnaire(..........................................................................................................(51
(
(List(of(tables(
Table 1. Outline of thesis ............................................................................................................. 4 Table 2. Relevant situations for different research strategies .................................................... 21 Table 3. Operationalization of Brand experience ...................................................................... 24 Table 4. Operationalization of Brand satisfaction ...................................................................... 25 Table 5. Operationalization of Brand trust ................................................................................. 25 Table 6. Operationalization of Brand loyalty. ............................................................................ 26 Table 7. Previous research sample size and calculated median ................................................. 30 Table 8. Methodology Overview ............................................................................................... 35 Table 9. Descriptive statistics .................................................................................................... 36 Table 10. Reliability analysis (α) for Brand experience, Brand satisfaction and Brand trust .... 37 Table 11. Mean, Standard Deviation, Cronbach’s (a) and Correlation Analysis (r) .................. 38 Table 12. Regression analyses ................................................................................................... 39 Table 13. Beta values ................................................................................................................. 40
(
List(of(figures(Figure 1. The research model ..................................................................................................... 16 Figure 2. Data collection instrument .......................................................................................... 23
(


1
1.(Introduction( The following chapter begins with a background discussion related to branding within the
retail and fashion industry. Thereafter, the chapter continues with a problem discussion
leading to a research problem, delimitation and the purpose of this thesis.
1.1(Background(
During the last decade, branding has become the main priority for businesses due to the
growing realization of brands being one the firms’ most valuable intangible assets (Keller &
Ailawadi, 2004; Horppu et al., 2008). Nowadays, building a strong brand is used as a
marketing tool for businesses to differentiate and to stay competitive on the market (Keller &
Ailawadi, 2004; Armstrong et al., 2009). The definition of branding is to create, maintain,
protect and enhance a product’s brand (Kotler et al., 2009). A brand can also be perceived as a
name, term, sign, symbol or a combination of these, that identifies the uniqueness of the maker
or seller (Kotler et al., 2009; Armstrong et al., 2009).
In today's society many products within the retail and specifically fashion industry fulfill the
same need for the customers which has emphasized the importance of adapting to the changes
of the market while being different from competitors (Ailawadi & Keller, 2004; Kotler et al.,
2009). This has resulted in a wide variety of brands that can be found nowadays, but also an
intensified competition amongst brands (Horppu et al., 2008). Furthermore, retail branding can
be explained as all activities involved in selling the products directly to the final customer for
personal use (Bowden, 2009). Oftentimes, retail companies incorporate giving customers a
multi-sensory experience in hope of influencing the customers, give them a rich customer
experience and strengthen the value of the brand. This can also be achieved by creating a brand
image by adapting unique associations to the service and assortment (Keller & Ailawadi,
2004).
However, a business cannot survive the competition by only having a strong brand, rather other
factors are important to manage in order to survive in the long run. Therefore, building a long-
term relationship with the customers is an essential aspect for retailers to consider, since it can
provide loyal customers as well as expanding the customer base. The long-term customer
relationship that businesses are aiming for is the customer brand relationship, which is defined
as the relationship between the brand and the customer. This is something that has become

2
more important during the last decade and is depended on tree factors such as, brand
experiences, brand satisfaction and brand trust (Bowden, 2009; Şahin et al., 2011).
1.2(Problem(discussion(
In the market place, brands are highly important since they are the interface between customers
and the company. It can lead to customers developing trust and loyalty towards a brand,
making brand loyalty to be considered as the heart of any marketing activity. Moreover, since
the competition in the fashion market has intensified, forcing retail stores to concentrate on
developing and maintaining a long-term relationship with the customers. This since it is
developed over a period of time due to customers’ experience with the company and the brand
(Zehir et al., 2011). By being successful in building a relationship with the customer a
company can succeed and stay competitive on the market (Ailawadi & Keller, 2004; Grewal et
al., 2004; Carpenter et al., 2005).
During the recent years, customers’ needs and wants have changed, as well as demographics,
lifestyles and shopping patterns (Kotler et al., 2009). This is forcing retailers to meet
customers’ demands in different places and by having the brand appeal to the customers in
several ways (Ailawadi & Keller, 2004; Kotler et al., 2009). This signifies that retailers are
constantly seeking to adopt relationship marketing in order to stand out (Zehir et al., 2011). A
retailer, who does not manage to adopt relationship marketing, will have a negative impact on
customer’s loyalty that can minimize their competitive advantage. Hence, to establish a long-
term relationship it is substantial to consider factors such as brand experience, brand
satisfaction and brand trust. These are factors that are important for retail stores that are aiming
at gaining brand loyalty from their customers (Şahin et al., 2011).
Today, customers are looking for brands that will provide them with unique and memorable
experiences (Hong-Youl & Perks, 2005). Hence, a good experience stay longer in the
customers mind while a negative experience will affect the brand negatively, which will also
impact the relationship (Westbrook & Oliver, 1999). A retail store that has a weak customer
relationship will often lead to less loyal customers. This will also influence the purchase
patterns and competitiveness (Kay, 2006); indicating that the total experience is closely
connected to brand loyalty (Şahin et al., 2011).

3
A positive experience on the other hand is influenced by satisfaction, which can be described
as an affective, emotional, response to a purchase situation (Anderson & Narus, 1990; Bennet
et al., 2005; White & Yu, 2005). It is the total outcome and fulfillment response from pleasure
related consumption leading to a long-term relationship (Oliver, 1999; Şahin et al., 2011).
Satisfied customers tend to develop more trust towards a brand, which is the promise that the
company has made to their customers. Which is a crucial factor since a brand that does not
deliver what it promised is not seemed trustworthy and therefore leading customers to turn to
other brands. As the relationship, trust is also developed over time due to the experiences and
satisfaction. A retail business that lacks the ability to satisfy their customers by providing what
they are seeking for is in the risk of falling out of business, due to customers turning to other
retailer. Hence, the importance of keeping the promise over a significant period of time will
leading to an emotional connection with the brand and customer brand loyalty (Iglesias et al.,
2011; Şahin et al., 2011).
This emphasizes that the factors brand experience; brand satisfaction and brand trust are acting
as a foundation for building a strong customer brand relationship as well as creating brand
loyalty (Hong- Youl & Perks, 2005; Horppu et al., 2008; Iglesias et al., 2011; Şahin et al.,
2011). In previous research, the relationship among the factors and their impact on brand
loyalty has been investigated which was identified to be a positive, however, in different
industries and countries. Due to the problem of a business not being able of managing these
factors in order to gain loyalty from their customers, which is essential within the retail and
fashion industry. This has lead to the interest of investigating how these variables further affect
brand loyalty within this industry of interest and in the Swedish market. This sort of
investigation has not been investigated earlier and therefore has lead to the purpose of this
thesis:
To(investigate(how(brand(experience,(brand(satisfaction(and(brand(trust!affect(
brand(loyalty(in(the(retail(and(fashion(industry.!
(
4
1.3(Delimitation(
Based on the literature review, it is made clear that brand experience; brand satisfaction and
brand trust has a positive influence on brand loyalty in different countries and industries.
Therefore, the focus of this study was to adapt similar research and statements as Şahin et al.,
(2011). However, since this study does not investigate if brand experience has a positive effect
on brand satisfaction as well as brand trust, only three hypotheses were used to investigate the
already existing hypotheses in a new industry and country. However, the hypotheses will be
amended to be a more general investigation regarding customer’s perception of branding in the
retail and fashion industry. This study is also delimited to investigate the Swedish market,
focusing on people settled in Växjö, in order to see if there is a positive relationship between
the variable within the region.
(
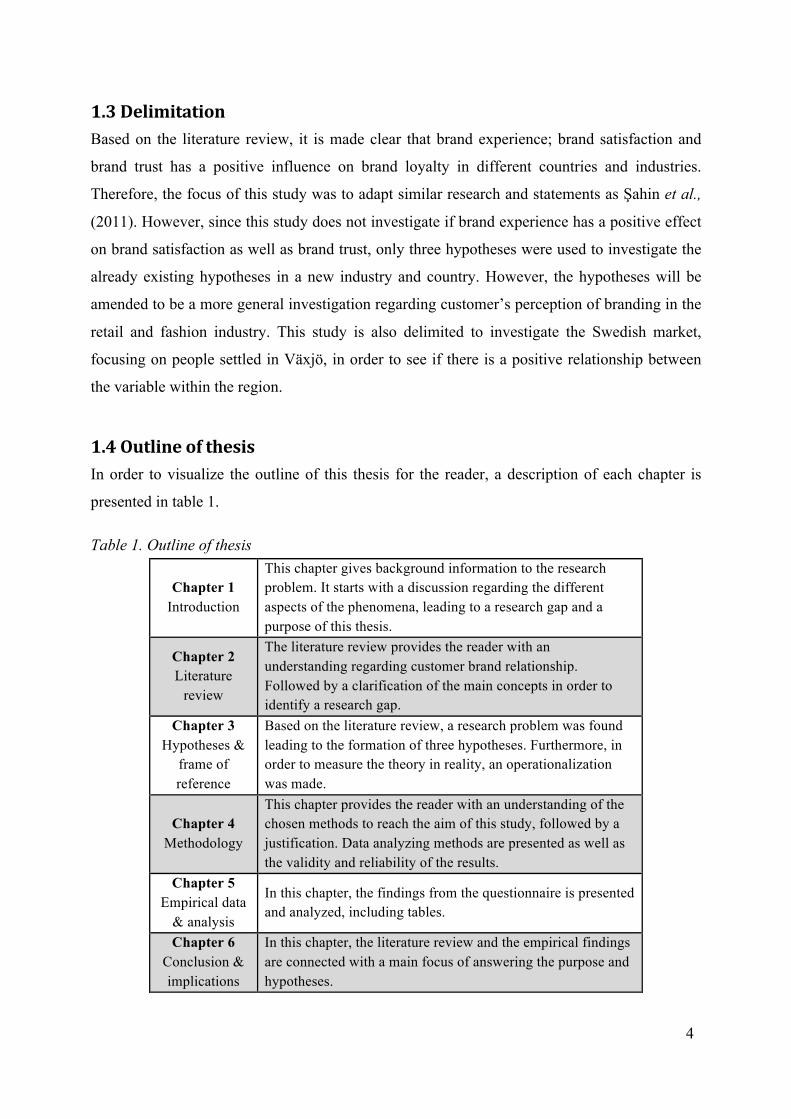
1.4(Outline(of(thesis((
In order to visualize the outline of this thesis for the reader, a description of each chapter is
presented in table 1.
Table 1. Outline of thesis
Chapter 1 Introduction
This chapter gives background information to the research problem. It starts with a discussion regarding the different aspects of the phenomena, leading to a research gap and a purpose of this thesis.
Chapter 2 Literature
review
The literature review provides the reader with an understanding regarding customer brand relationship. Followed by a clarification of the main concepts in order to identify a research gap.
Chapter 3 Hypotheses &
frame of reference
Based on the literature review, a research problem was found leading to the formation of three hypotheses. Furthermore, in order to measure the theory in reality, an operationalization was made.
Chapter 4 Methodology
This chapter provides the reader with an understanding of the chosen methods to reach the aim of this study, followed by a justification. Data analyzing methods are presented as well as the validity and reliability of the results.
Chapter 5 Empirical data
& analysis
In this chapter, the findings from the questionnaire is presented and analyzed, including tables.
Chapter 6 Conclusion & implications
In this chapter, the literature review and the empirical findings are connected with a main focus of answering the purpose and hypotheses.
5
Chapter(Summary(_______________________________________________________________________________________________________!In this chapter Customer brand relationship was presented as the subject of interest. It started
by discussing the important factors of branding for businesses to focus upon to create a long-
term relationship and survive in the long run. This, followed by a problem discussion that lead
to the purpose of the thesis study to investigate if the variable effect brand loyalty in the
Swedish retail industry.

6
2.(Literature(Review( In this chapter, a literature review regarding the chosen theories is presented, followed by a
discussion regarding customer brand relationship. It includes description and definitions of
each concept within the theory, in order to get a deeper understanding of the research area
and to identify a research gap. The aim of this chapter is to provide a base for the construction
of the frame of reference that will work as a guideline for the investigation and analysis.
2.1(Framework(for(building(a(customer(brand(relationship(
Customer brand relationship is developed over a period of time due to customers’ previous
experience with a brand (Bowden, 2009). The brand can be perceived as a mechanism that
engages the buyer and the seller with the intention of creating a long-term customer brand
relationship, which is called the relationship builder. The customer brand relationship is
derived from the brand experience, brand knowledge and/or brand meaning that the customer
associates with the brand. The relationship largely depended on the success of establishing a
brand meaning, which is a crucial mediator between brand experience and customer brand
relationship (Şahin et al., 2011). This is an important element since it is perceived to provide
businesses with competitive advantage by establishing a strong bond between the customer and
the brand (Bowden, 2009).
To create a customer brand relationship, a business has to be able to provide their customers
with a unique brand experience, which is created in the mind of the customer (Klaus &
Maklan, 2007). Yet, brand experience, brand satisfaction and brand trust are all directly
connected to the development of brand loyalty (Şahin et al., 2011). Also brand satisfaction is a
factor that has an effect on brand loyalty, meaning that the more satisfied a customer is, the
more positive the brand experience is. Leading to that the likeliness of customers returning to
brand increases as well as their loyalty (Bowden, 2009; Iglesias et al., 2011). The connection
between brand loyalty and brand trust is also a discussed subject by several researchers, stating
that it is essential for customers to feel confident that a brand will deliver what it promise. This
is something that is built up over a period time and closely connected to the familiarity of the
brand (Agustin & Singh, 2005; Hong-Youl & Perks, 2005; Bowden, 2009). This can be seen in
the relationship between brand experience and brand trust, meaning that the better the brand
experience is for a customer, the more trust will be gained (Agustin & Singh, 2005).
7
2.1.1(Brand(experience(
Customer experience arises from a set of interactions between the customer, product and/or the
company. Experience is something that is formed in the mind of the customer and therefore it
is personal and different for each individual. The way an experience is perceived is based on
customer’s own beliefs and perceptions (Klaus & Maklan, 2007; Gentile et al., 2007). Brand
experience is therefore conceptualized as sensations, feeling, cognition's and behavioral
responses that are evoked by brand related stimuli such as a brands design, identity, packaging,
communication, as well as the brand environment (Brakus et al., 2009).
This can be connected to sensory marketing, which has become important when it comes to the
total experience. Some authors argue that experience can be created through sensory
marketing, this since it is concerned with cooperating the senses to create an experience for the
customer. The senses included are sight, sound, smell, touch and taste (Hultén, 2011). Sight
however, is the most prominent of the senses since it is most likely to discover changes in the
environment and create value for the customer (Hultén, 2011; Parsons, 2011). The goal with
sensory marketing is to create a value-process for the customer as well as engaging them in the
brand. It is a tool used to differentiate a product from the competitors on the market (Hultén,
2011). Parsons (2011) agrees with Hultén (2011) stating that, sensory marketing is important
for retailers to consider for the reason that nowadays sensory stimuli is a way of differentiating
the retail environment from competitors and to create an experience.
Brand experience can be defined as customers perception of the interaction with the brand such
as the brand image shown in advertising, personal contact or the level of quality concerning the
personal treatment that the customers receive (Alloza, 2008). An experience is created when
customers use the brand such talking about the brand, seek for brand information, promotions
and events (Ambler et al., 2002). Furthermore, brand experience is a process that includes
several parts of the shopping experience, starting when the customer begin the search for
information about the product and then continues the shopping decision has been made and
finally consumed (Hong-Youl & Perks, 2005; Brakus et al., 2009).
Experience is also concerned with familiarity and knowledge within a certain area, which is
derived from brand exposure and previous encounters with the brand (Braunsberger & Munch,
1998). Therefore, brand experience can be looked upon as an encounter between the customer
and the brand (Şahin et al., 2011). In order to be able to provide customers with the best brand

8
experience as possible, it is importance to establish a close relationship with the customers.
This since, a strong relationship is built on customers positive experiences with the brand
(Hong-Youl & Perks, 2005). The brand must also deliver the brand promise and be consistent
in all actions (Dall'Olmo Riley & De Chernatony, 2000; Brodie et al., 2009) since, a positive
experience is more likely to drive customers to repeat that experience in the future (Şahin et al.,
2011).
Experiences have a tendency to influence memories, more than the actual features and benefits
of a product (Westbrook & Oliver 1991; Hong-Youl & Perks, 2005). Hence, a brand
experience has to be able to capture customers’ emotions during the consumption process. For
that reason, brand experience is perceived as a marketing tool in order to deepen the
relationship and connection to the brand, since experiences are memorized (Westbrook &
Oliver, 1991). Including attributes to the brand experience such as something vivid making the
brand differentiate in the market, it is more likely to be memorable than product itself as well
as gain competitive advantage (Hong-Youl & Perks, 2005; Iglesias et al., 2011). One-way of
making the brand more vivid and memorable is as stated earlier by sensory marketing (Hultén,
2011).
2.1.2(Brand(satisfaction(
Brand satisfaction can be described as an affective, emotional, response to a purchase situation
and the positive reaction from previous experience with a brand (Anderson & Narus, 1990;
Dick & Basu, 1994; Bennet et al., 2005; White & Yu, 2005). It can be perceived as the
outcome and fulfillment response from pleasure related to the consumption, which leads to a
long-term relationship (Oliver, 1999). This relationship is what Algesheimer et al., (2005)
claims to be the brand satisfaction with the degree to which the customer views the brand as
satisfactory partner in an ongoing relationship.
Customer satisfaction is closely related to expectation and the spreading of word-of-mouth. It
can be perceived as an ongoing cycle, since expectations are created before the actual purchase
and based on word-of-mouth, which impacts the experience either positively or negatively.
Expectations put a lot of pressure on the brand since, the more expectations customers may
have can affect the degree to which the customer is satisfied and therefore the customer loyalty.

9
For a company, having satisfied customers often means positive word-of-mouth and higher
expectations, however can also be the other way around (Dick & Basu, 1994; Athanassopoulos
et al., 2001; Wangenheim & Bayón, 2006). Satisfaction can be looked upon as a source of
brand loyalty (Bennett et al., 2005; Punniyamoorthy et al., 2007)
Customer loyalty is the outcome of having satisfied customers and perceived as cognitive and
emotional component (Mano & Oliver 1993; Hong-Youl & Perks 2005). It is an affective
reaction to the consumption experience (Mano & Oliver, 1993), while the cognitive component
consists of the standard expectations created in the mind of the customer (Hong-Youl & Perks
2005). These standards are based upon customers’ expectations, previous experiences and/or
word-of-mouth. This is met if the brand manages to deliver what the customer expect or even
exceed their expectations (Şahin et al., 2011). In order to increase customers’ brand
satisfaction, two factors needs to be considered, being emotional and functional (Liljander &
Strandvik, 1997; Mosley, 2007). Therefore, it is essential to investigate customer’s demands in
order to keep them satisfied in an ongoing relationship (Algesheimer et al., 2005).
2.1.3(Brand(trust(
Brand trust refers to the willingness of the average customer to rely on the ability of a brand to
deliver its stated function (Hong-Youl & Perks, 2005). A brand is perceived to be a trust mark
for all intangible trust-generating activities such as a symbol of quality (Keller, 2003; Bart et
al., 2005). This is important to create a sustainable customer brand relationship. Therefore,
trust itself can be defined as customers’ beliefs that they can rely that the seller to deliver what
they promised and connecting to rational values. These rational values are believed to be
customer perceptions of benefits gained versus the cost of having a relationship with the brand
(Agustin & Singh, 2005).
Brand trust can be divided into two dimensions. The first dimension is reliability, which is
referred to having the ability and willingness to keep promises and satisfying customers’ needs.
The second dimension is referred to the attribution of good intentions to the brand in relation to
the customers’ interest and welfare (Şahin et al., 2011). Having a trustworthy image will
provide a long-term relationship. However, it is a process that is built up over time, since
customers are more likely to trust what they are familiar with and can associate with (Agustin

10
& Singh, 2005; Hong-Youl & Perks, 2005; Bowden, 2009). Therefore, brand trust can also be
seen as a part of the customers’ evaluation test, which is based upon their own beliefs and
assumptions (Bowden, 2009). Since trust is essential in the building of customer brand
relationship and positively connected to brand loyalty adding familiarity will improve
customers’ trust (Bowden, 2009; Hong-Youl & Perks, 2005; Chiou & Chang, 2006; Şahin et
al., 2011). Moreover, customers build their trust for a brand based upon their expectations and
experience. If these are met it will be reflected in brand loyalty (Horppu et al., 2008).
2.1.4(Brand(loyalty(
Brand loyalty is defined as a deeply held commitment to a preferred product or service
consistently in the future, repeated purchase and commitment despite the situational influences
and marketing efforts which have the potential to cause switching behavior (Algesheimer et al.,
2005; Şahin et al., 2011). In the process of building brand loyalty, customer brand relationship
is a crucial factor (Chiou & Chang, 2006). This since, brand experience leads to brand loyalty
by creating emotional connections by engaging compelling and a consistent context, where the
context is the environment the encounter occurs (Şahin et al., 2011). Including emotional
aspect to the building of brand loyalty is also valuable since emotions are memorable
increasing loyalty (Mano & Oliver, 1993).
Some researchers argue that brand loyalty is the outcome of brand experience, brand
satisfaction and brand trust. Since a positive brand experience affects brand satisfaction from
customer trusting the brand, will provide a bigger loyalty (Şahin et al., 2011). Hong-Youl and
Perks (2005) claim that, a positive relationship between the variables exists and therefore
important to be able to provide customers a security with the brand. A security is based on the
beliefs that the brand is reliable and concerned with the welfare of the customer. This is a
factor that aids the building of brand trusts and brand loyalty (Delgado- Ballester & Munuera-
Alemán, 2001).
According to Dick and Basu (1994) there are four different types of loyalty. These are no
loyalty, spurious loyalty, latent loyalty and loyalty. No loyalty states that there is no existing
loyalty towards a specific brand. Spurious loyalty is characterized by non-attitudinal influences
on behavior, meaning that the customer sees a little difference between brands. Latent loyalty,
states that there is a high level of relative attitude and lastly loyalty in which a customer shows

11
preference towards a brand and communicates this attitude towards others. The goal is of
course to gain loyalty (Dick & Basu, 1994).
Moreover, brand loyalty is also a part of the communication and relationship building process
(Rowley, 2009; Şahin et al., 2011). This since having a well-established communication with
the customers is the main step in creating a strong customer relationship (Rowley, 2009).
Furthermore, the ability to create a strong brand loyalty is reflected in the company’s values
that might provide entry barriers for new competitors and increase the ability to respond to
emerging threats on the market, increase sales and revenues and a customer base that is less
sensitive to the marketing efforts by competing brands (Delgado- Ballester & Munuera-
Alemán, 2001). What needs to be noted is that customer loyalty is an important part of brand
loyalty, since it is the customers that are loyal to the brand. Customer loyalty has been
described as both attitudinal and behavioral. This indicates that it is not only how the
customers behave that determines their loyalty, but also how they portray the brand outwards
to others that determine their loyalty. Loyalty is multidimensional and includes both repeated
purchases as well as support for a provider and resistance towards price increases (Dick &
Basu, 1994). Punniyamoorthy et al., (2007) further states that loyalty is affected by perceived
value, trust, satisfaction and commitment.
2.2(Research(gap(
The literature review showed that customer brand relationship is a subject that has been studied
earlier, however with different directions. This has been shown in the research made by Hong-
Youl & Perks, (2005) Horppu et al., (2008), Iglesias et al., (2011) and Şahin et al., (2011). The
common denominator for the previous studies is the key factors that influence customer brand
relationship and the brand loyalty. These are factors such as brand experience, brand
satisfaction and brand trust. Brand loyalty, is a topic that has been previously studied in
comparison to brand experience which has been difficult for researchers to investigate and
describe its different content (Hong-Youl & Perks, 2005; Iglesias et al., 2011). All though the
difficulties, the different studies indicate that brand experience is one of the main factors and
focal point of increasing brand loyalty (Horppu et al., 2008; Iglesias et al., 2011; Şahin et al.,
2011).

12
The outcome of the literature review provided a positive relationship between the different
variables, brand experience, brand satisfaction, brand trust and brand loyalty. This relationship
is also known as customer brand relationship and been created through research during the past
decade. In order to create a customer brand relationship it is essential that customers are
satisfied with the brand and trust the brand to provide what they promise. This since the
satisfaction and trust of a brand will increase the likeliness for customers to return, increase
sale as well as the competitive advantage (Hong-Youl & Perks, 2005; Şahin et al., 2011).
Previous studies have also discussed the importance of brand loyalty since it is a deeply held
commitment to a preferred product by a customer (Şahin et al., 2011). Having loyal customer
implies that customers have an emotional connection to the brand, which increase the
relationship between them and creates a stronger customer brand relationship, a goal that all
businesses are striving for.
In order to see if theory matches reality, the previous researchers have investigated the
variables in different industries, countries but also if the theory is applicable on the Internet.
The outcome of the studies showed a positive relationship between the variables within the
different industries. It is clearly shown that having the positive relationship between brand
experiences, brand satisfaction, brand trust with brand loyalty is essential, for the reason that
these are factors that influence a customer perception and value of a brand. What should be
considered is that it is not only important to have a positive relationship between the variables
and brand loyalty, but also that all variables have a positive relationship to each other. This
since, brand experience can affect the brand satisfaction as well as brand trust. However, due to
the recent upcoming of the subject, research on customer brand relationship has not been
investigated enough. Especially in retail and fashion industry where having a customer brand
relationship is a crucial factor for competitive advantage. Therefore, a research concerning the
importance of creating a customer brand relationship is needed, by the means of brand
experience, brand satisfaction and brand trust. This indicates an existing gap within the
research field and aim of this study to investigate.
(
(
(
(
(

13
Chapter(Summary
In this chapter, a research gap was found based on the literature review regarding customer
brand relationship and the different variables related to it. The main gap that was identified
was the need for further investigation within the subject in order to see if the theory of
customer brand relationship is applicable within the retail industry. Furthermore, since this
study is based on previous research, it has not been investigated in Sweden, where the retail
business is a common practice and therefore the reason for investigating the gap in Sweden.

14
3.(Hypotheses(&(Frame(of(Reference(
In this chapter a research problem and discussion is presented, followed by a presentation of a
conceptual model of the hypotheses based on the literature review. This, in order to provide a
deeper understanding of the hypotheses related to the purpose of this study.
3.1(Research(problem(and(discussion(
Based on the literature review it is evident that brand experience, brand satisfaction, brand trust
all influence customers brand loyalty. In order to clearly define the research gap in this study, a
deeper discussion of the four main articles used as a basis in this thesis has been performed.
These articles were Hong-Youl & Perks (2005), Horppu et al., (2008), Iglesias et al., (2011)
and Şahin et al., (2011).
Hong-Youl & Perks (2005) studied the relationship between brand experience, brand
familiarity, brand satisfaction and brand trust within different industries, such as bookstores,
malls and web-travel agencies in South Korea. The objective of the study was to explore if
there is a direct relationship between brand experiences and brand trust or if there is an indirect
relationship with brand satisfaction or brand familiarity. The main finding of the study was
that, a variety of brand experiences increase the familiarity, but also showed that brand
experience affect customer satisfaction in a positive way. The authors however suggest that
further research could be necessary regarding brand experiences, when it comes to cognitive
and emotional behavior effects on brand experiences.
Horppu et al., (2008) investigated the relationship between brand satisfaction, brand trust and
brand loyalty in Finland, focusing on the magazines industry. The results from this study
showed a correlation between brand experience and the way that it affects brand satisfaction,
brand trust and brand loyalty. However, the main finding showed that brand experience, brand
satisfaction and brand trust contribute to brand loyalty, a research that provides a good basis
for online and offline brand relations.
The main findings of Iglesias et al., (2011) research, were that there is a clear relationship
between experience and loyalty that is derived from an effective commitment between the
customer and the brand. The study was performed within the car industry, computer and

15
footwear collected from 34 countries. For that reason, Iglesias et al., (2011) suggest to study
this relationship within another product category, but also with other determinants such as trust
and satisfaction.
Lastly, Şahin et al., (2011) researched the relationship between trust, satisfaction and how the
two variables affect brand experience and brand loyalty within the car industry. The study is
focusing on building customer brand relationships from a brand experiential perspective. The
results of this investigation showed a strong relationship between the variables, indicating that
a good brand experience influence brand satisfaction, brand trust and brand loyalty in a
positive way. Since, Şahin et al., (2011) study was made in Istanbul, Turkey, the authors
suggest that for future research within the area of customer brand relationship and stronger
proof of the positive relationship, the sample should include participants in other geographical
areas and another industry.
As a result of the literature review, it was confirmed that all variables are important in order to
gain loyal customers. Since previous research are based in different industries and countries,
the main gap of this study is to investigate brand experience, brand satisfaction and brand trust
in Växjö regarding customers’ perceptions about the retail industry in general. In order to
complete these investigation hypotheses were required.
(
3.2(Hypotheses(
In order to complete a hypothesis testing it is important that the researcher has sufficient
knowledge within the subject. Stating hypotheses is about expressing coincident between
different variables and it is important to make sure that risk of factors affecting the result are
minimized (Patel & Davidson, 2008). Three hypotheses (see figure 1) were conducted based on
the research gap found in the literature review, which are mainly based on Şahin et al., (2011)
investigation. This study mainly focuses on brand experience, brand satisfaction and brand
trust and if these independent variables have a positive effect on brand loyalty. In the literature
review it came apparent that there is a need for investigating already existing hypotheses in a
new industry and country. Therefore, when stating the hypotheses below it has already been
confirmed that brand experience, brand satisfaction and brand trust has a positive effect on
brand loyalty, however, not in Växjö and within the retail industry.

16
H1 (+): Brand experience has a positive effect on brand loyalty.
H2 (+): Brand satisfaction has a positive effect on brand loyalty.
H3 (+): Brand trust has a positive effect on brand loyalty.
!
Figure 1. The research model (((Chapter(Summary(! ! ! ! ! ! ! ! ! ! ! ! ! ! !In this chapter a research model was established based the research discussed in the beginning
of this chapter. This model consist of three hypotheses stating that Brand experience has a
positive effect on brand loyalty (H1), Brand satisfaction has a positive effect on brand loyalty
(H2) and lastly Brand trust has a positive effect on brand loyalty (H3). These conducted
hypotheses provide a base for this research and enabling the investigation to reach the
purpose of this study.

17
4.(Methodology( In this chapter, different research approaches and data collecting methods are presented
followed by a justification of each chosen method that is most suitable for this research.
Thereafter, the different data analyzing methods are presented and justified in order to analyze
the collected empirical data in the next chapter. This is then followed by a discussion
regarding quality criteria of validity and reliability.
4.1(Research(Approach(
In order to collect relevant empirical data for academic research, an appropriate approaches
needs to be considered (Bryman & Bell, 2005; Blumberg et al., 2008). First off, an inductive or
deductive research approach needs to be decided. Thereafter it must be decided to go along
with a qualitative or quantitative research, or a mixture of both.
4.1.1(Deductive(versus(Inductive(Research(
A deductive method is based on already existing theories or models, which is tested in reality
(Hyde, 2000). An inductive research on the other hand, is based on collected data that later on
establish new theories (Bryman & Bell, 2005). Therefore, this approach is not suitable for this
thesis. For a deductive research, the existing theories and models is the foundation for further
investigation and from that the researcher can state hypotheses and collect empirical data. After
collecting data, the result will reveal information that will decide if the hypotheses will be
rejected or not. Based on the result, the existing theory can be revised or not (Arbnor & Bjerke,
1994; Hyde, 2000; Bryman & Bell, 2005). Inductive research on the other hand is based on
empirical data from observations to be able to establish a new theory from that. The researcher
should be able to generalize the collected data and make inferences based on the information
(Bryman & Bell, 2005).
After a literature review was performed a research gap was established. Previous researchers
such as Hong-Youl & Perks, (2005), Horppu et al., (2008), Şahin et al., (2011) and Iglesias et
al., (2011) have investigated customer brand relationships in different industries and countries.
To be able to fulfill the research gap the stated hypotheses were made more general to fit the
purpose of the study. The main article used as a foundation was Şahin et al., (2011), made this
research deductive since the purpose is to use existing theories and investigate a research gap.

18
4.1.2(Quantitative(versus(Qualitative(Research(
There are two different ways of collecting empirical data, either through quantitative or
qualitative research. The most common way of collecting data is through one of the methods,
but could also be used as a complement to each other. The main difference between the
approaches is the perception of how to investigate theory and reality; there are also differences
in view of knowledge and point of view (Bryman & Bell, 2005). A qualitative study is
investigating few respondents, with many different variables. Therefore, this kind of research is
more focused on finding a more complex and in-depth picture of the investigation than what a
quantitative research is. The complex picture is regarding finding pattern in how individuals
interpret and perceive their social reality (Bryman & Bell, 2005). This is also about the
underlying reason behind a person’s perception, beliefs and attitudes. This is more of an
interpreting study of the result (Hyde, 2000).
Quantitative research is about collecting a large amount of data from many respondents, with
few variables. This kind of research emphasize on examination of existing models or theories.
Therefore, it is important that a quantitative research is reliability, replicable and valid
(Bryman & Bell, 2005). The quantitative research approach makes it possible to transform the
result into statistics, which is analyzed (Patel & Davidson, 2008). It is important because of the
fact that the research should generate inferences and conclusions (Hyde, 2000; Bryman & Bell,
2005).
This thesis is mainly based on Şahin et al., (2011) theories and hypotheses. The aim of this
study is also to gather data about the general public opinion and thoughts within the region
about the subject. Meaning that as many responses as possible are preferable and this is most
likely to be achieved by distributing questionnaires. This makes a quantitative research
approach most appropriate for this study. When an existing theory is used, a deductive
approach is used and therefore it has now been clarified that this research is based on a
deductive and quantitative approach. The following sections will present different types of
research design that can be used.
(
(
(
(

19
4.2(Research(Design((
A research design is a plan or process for the research (Kotler et al., 2009). It provides a
structure or framework in solving the purpose and objectives of a study (Yin, 2006), which is
based on the research problem (Kotler et al., 2009). Research designs consist of different
methods and procedure when conducting and analyzing the data. It is important to choose the
right research design because it will influence the research activities (Bryman & Bell, 2005).
There are three different types of research design available for researchers, 1) Exploratory
research 2) Descriptive research and 3) Causal research.
Exploratory research observes what is already exists (Phopalia, 2010) and is used when the
researcher lacks knowledge within a specific area, which makes it possible to collect a large
amount of data regarding the research problem (Bryman & Bell, 2005). The purpose of this
kind of research is to create a new hypothesis (Arbnor & Bjerke, 1994), however, it is a time
consuming design to be conducted successfully (Bryman & Bell, 2005).
Causal research design answers why questions (Blumberg et al., 2008) and examines whether
one variable causes or determines the value of another variable (Bryman & Bell, 2005;
Eliasson, 2010). The goal of this kind of research is to develop a theory. When selecting which
research design for a study, factors needs to be considers such as the research design must
relate to the objective and purpose of the study. Also what sources available, extent of previous
research and the amount of control the researcher (Bryman & Bell, 2005).
Descriptive research design aims at answering questions of who, what, when, where and how
(Yin, 2006). The objective is to describe something (Kotler et al., 2009). This kind of approach
is most appropriate when the research problem is clearly defined and the researcher has
knowledge within the area. The objective of this kind of study is to develop patterns stated in
hypotheses. A useful design when time and means are limited (Yin, 2006). Descriptive
research design also consists of two different approaches, longitudinal or cross-sectional
studies.

20
Longitudinal studies is used when the sample is fixed and when the aim is to measure the
elements in different points in time to see if any changes appear (Bryman & Bell, 2005;
Malhotra, 2010). Cross-sectional research measures one element, one time (Bryman & Bell,
2005). Multiple cross-sectional design use two or more samples at a specific point in time,
while a single- cross sectional design only use one sample at a specific point in time (Malhotra,
2010)
Since this thesis is based on previous studies regarding customer brand relationship a
descriptive research design was used. It was also used because of the suitability for quantitative
studies. There was also limited time for conducting this study, which prohibits longitudinal
research. Longitudinal research could be used but that kind of study would not contribute with
different information from one month to another regarding people’s perceptions about retail
brand in general and therefore it was chosen to a cross-sectional design. Since one sample is
investigated, one point in time a single cross-sectional design is used.
4.3(Data(sources(
There are two types of data sources for collecting empirical data such as primary and
secondary, but sometimes it is necessary to gather data from both (Bryman & Bell, 2005). The
criteria for data sources are that it needs to be current, relevant, reliable, and accurate and
conceptually correct (Rabianski, 2003).
Primary data is collected for a specific study (Eliasson, 2010; Christensen et al., 2010; Aaker et
al., 2011). It is the information that researcher gather first and is tailor-made to fit the purpose
of the study. Primary data can also be facts and information that is gathered for not only
immediate study but also for another purpose. As stated before primary data can be used as a
complement to secondary sources (Bryman & Bell, 2005; Rabianski, 2003). Therefore, one
researcher’s primary data can become another researcher’s secondary data (Rabianski, 2003).
There are three main advantages with using primary data such as the information is tailored-
made, up-to-date and provide the researcher with specific information. On the other hand, this
method can be time consuming and costly. There is also a chance of non-response, which is
referred as the fallen out rate (Bryman & Bell, 2005).

21
Secondary data is data collected by other researchers with another purpose than for the current
problem and purpose, which is good to use when the researcher want to gain deeper knowledge
about a subject (Bryman & Bell, 2005; Christensen et al., 2010). Secondary data is mostly used
when a researcher want to follow up previous studies and fill a research gap (Eliasson, 2010).
This thesis is based on primary data only, since the researchers collected the gathered data for
their own purpose and since the thesis is based on specific research hypotheses. This kind of
data can also be tailor-made to fit the hypothesis and purpose of this thesis. By using primary
data, it also provided specific and updated facts and information. This makes primary data
collection the most feasible for this study.
4.4(Research(strategy((
There are five different kinds of research strategies. These are experiments, surveys archival
analysis, history and case studies. When determining what strategy, which is most appropriate
for a study, the researcher must consider three conditions: what kind of research question is
stated, the extent of control the researcher has over behavioral events and if the focus is on
current or historical events (Yin, 2006). The table below explains the different conditions in
relation to the five different strategies (Table 2).
Table 2. Relevant situations for different research strategies
Research!Strategy!
Form!of!research!question!
Requires!control!over!behavioral!events!
Focuses!on!contemporary!events!
Experiment!! How,!Why! Yes! Yes!Survey! Who,!What,!where,!how!
many,!how!much! No! Yes!
Archival!analysis!
Who,!what,!where,!how!many,!how!much! No! Yes/No!
History! How,!Why! No! No!Case!Study! How,!Why! No! Yes!
Source: Yin (2006 pp. 22)

22
When considering these different strategies, the researcher must use the one, which fits to the
purpose of the research. Since the purpose of this thesis is to investigate how brand experience,
brand satisfaction, brand trust affect brand loyalty. One can see that all of the different research
strategies could be applicable. It was not possible to control behavioral events, which made it
possible to exclude experiment as an option. There was a focus of contemporary events, which
made it possible to exclude history. Now there are three options left, survey, archival analysis
and case study. Case study is not an option when an overall phenomenon is investigated,
because it would require many different cases and this is not possible because of the limited
time and because of the cross-sectional design, which were described earlier. Archival analysis
is not an option when working with primary data, because the aim is to fill a research gap and
this is not possible through an archival analysis. This leaves this thesis with surveys as the most
appropriate research strategy to be able to fill the research gap. In the next section there will be
a deeper presentation of different kinds of survey designs.
4.5(Data(collection(method(
Research strategy concerns different data collection and analyze methods. There are different
data collecting methods for each research strategy. The most common methods to for data
collection are archival analysis, case studies and surveys. As stated before, a survey is the
research strategy, which fits the purpose of this thesis the best. There are different ways of
constructing surveys, either through structured interviews or through questionnaires (Bryman
& Bell, 2005).
Structured interviews are one-to-one interviews, scheduled by the interviewer to give the
interviewees the same context of questions. By using structured interviews the aim is to give
the same interview stimulus and ensure that all the replies can be aggregated. On the other
hand, surveys can also establish as a questionnaire that is completed by the respondents
themselves. This type survey is perceived to be the main mean to gather data. Questionnaire,
which is the most common tool survey gathering method is similar to structured interviews,
however, the difference is that through a questionnaire, there is no interviewer asking questions
rather the respondents reads each question in order to answer them. Furthermore, the aim is to
investigate the opinions of the population (Bryman & Bell, 2005).

23
Surveys are mostly used when using quantitative research approach with a descriptive research
and with a cross - sectional design. This thesis is based on questionnaire, which is beneficial
since it is both time and money saving. According to Blumberg et al., (2008) a questionnaire is
appropriate when there are time and money restrictions. Using questionnaire will also provide
quantitative knowledge regarding the population of Sweden, more specifically in Växjö and if
there is a correlation between different variables that affect brand loyalty. Questionnaires can
be distributed either online or by physical paper. However using the web to distribute
questionnaires is a risky of a high fallen out rate. The reason being is that the researcher cannot
control the amount of respondents, since there is no actual physical interaction.
However, in this case it was determined that the questionnaire should be distributed over the
Internet, via the Linnaeus University email and more specifically to people based in Växjö. By
distributing the questionnaires online, there are a higher number of recipients of the
questionnaire. This can lead to a greater chance of getting many responses, even if there is a
chance of a high fallen out rate. By sending reminder emails about the questionnaire there is a
better chance of getting more people to respond to the questionnaire (Bryman & Bell, 2005).
4.6(Data(Collection(Instrument(
This chapter explains the development of the questionnaire and the process behind the final
version of the distributed questionnaire. The process started with an operationalization of the
questionnaire, which has its base in the theory chapter. The questionnaire was based on Şahin
et al., (2011) previous studies, and the questions used in that study which showed a Cronbach’s
alpha higher than 0.7 was used. This because Şahin et al., (2011) used a Cronbach’s alpha of
0.7 as the level of reliability. The questions and statements for this study were made general to
be able to reach the purpose of this research. Once the questions and statements were stated,
the process of designing the questionnaire starts. This stage focuses on the attributes and visual
design of the questionnaire. Once the questionnaire is designed it is pre-tested to make sure
that it can provide sufficient knowledge about the subject (see figure 2).
Figure 2. Data collection instrument

24
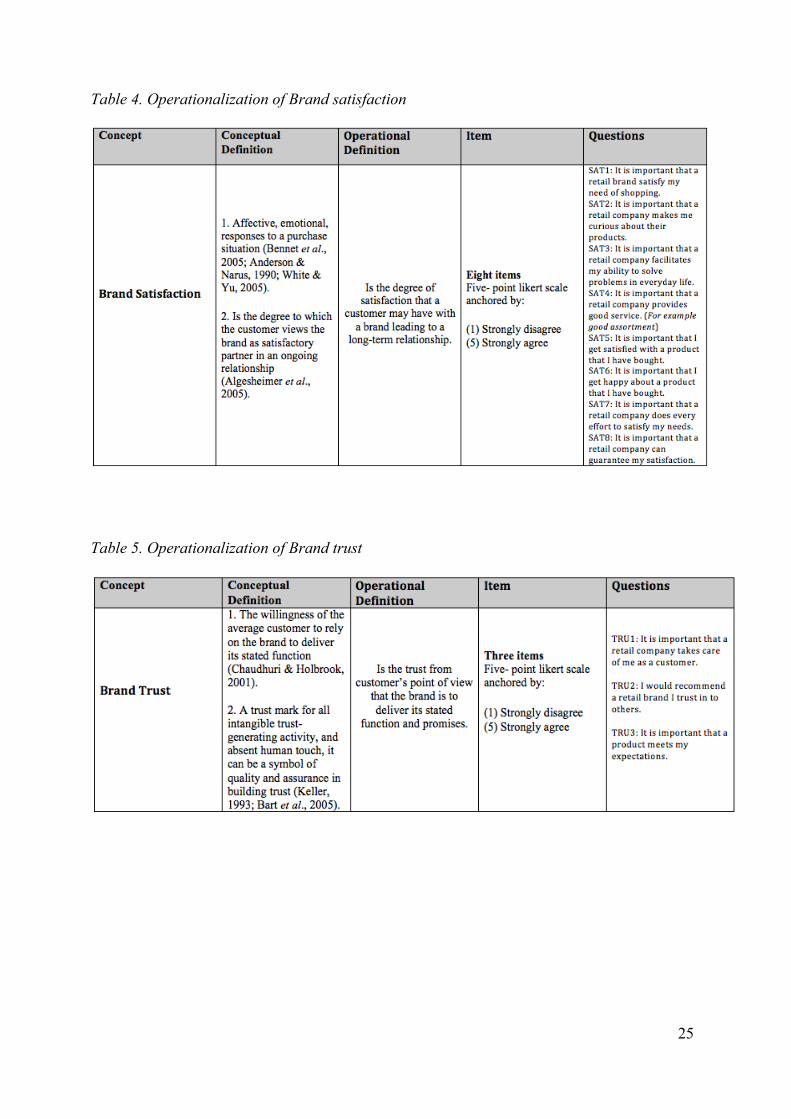
4.6.1(Operationalization(
Operationalization is the bridge between theory and reality making it possible to measure the
theory in reality. It can sometimes be necessary to use many indications, items, to describe a
concept. Operationalization is used in structured interviews and questionnaires. It is difficult to
use one indicator to measure the concept in reality. For the reason that one thing can mean
something else for another (Bryman & Bell, 2005). Therefore, the different concepts found in
the literature review has been broken down into different items which is adapted from different
authors to make the different variables, brand experience, brand satisfaction, brand trust and
brand loyalty easy to measure. According to Hair et al., (2003) there should be at least 3 items
measuring 1 variable, to make the test reliable.
The first column is the definition of the concept chosen for the investigation. Secondly there is
a column describing the number of items measuring the variable and also how it is measured.
Lastly there is a third column with the questions and statements connected to the variable that
is being investigated. It is important that these parts are well performed since it is necessary
that others can replicate a quantitative study and this is why it is important to do an
operationalization (Bryman & Bell, 2005). A table of the operationalization can be seen in
tables 3-6, which can be found below. It further explains the concepts found in the literature
review and how it will be used in the data collection process.
Table 3. Operationalization of Brand experience
25
Table 4. Operationalization of Brand satisfaction!
(((
Table 5. Operationalization of Brand trust
((

26
Table 6. Operationalization of Brand loyalty.
((

27
4.6.2(Questionnaire(design(
When constructing a questionnaire and distribute it on e-mail there are several things that must
be considered. Firstly, it is important to make the purpose and questions clear to the receiver of
the questionnaire. This can be achieved by having a letter of intent as an introduction to the
questionnaire. The questionnaire should also be efficient and effective in order to get a high
response rate and reduce the fallen out rate (Bryman & Bell, 2011). In this research, the letter
of intent introduces the purpose and concepts of the study in order for the participants to
understand the importance and reason of the questionnaire.
There are four different measurement scales that can be used when doing a questionnaire.
These are nominal, ordinal, interval and ratio scale (Bryman & Bell, 2011). Nominal and
ordinal gives non-metric/qualitative data while interval and ratio scale gives metric/quantitative
data. Nominal scale is used when it is possible to choose one or several options as an answer.
Ordinal scale is when different categories are ranked from for example one to five. Then there
is the interval scale that is used to measure whether there is a difference between two values,
and if it is valuable. The last possible scale to use is a ratio scale, which is used when the
answer can be categorized later on when compile and analyzing the result. When working with
empirical data and quantitative research approach there are two ways of creating
questionnaires, either by using discrete or continuous numbers. Discrete numbers are as such 4
and continuous could be 4.87 (Bryman & Bell, 2005). This study will only work with discrete
numbers to investigate if there is a positive relationship or not between different independent
variables in connection to the dependent variable of brand loyalty.
In this study a likert scale was used, this kind of scale is frequently used in survey research,
which gives the respondents the possibility to answer different scores on a long rate. This rate
could be explained with for example, (1) strongly disagree and (5) strongly agree. A likert
scale makes it easy to investigate a specific item but also to manage and analyze multiple of
items (Bryman & Bell, 2005). This kind of investigation makes it easier to notice patterns in
the investigation, it is also easy to capture means of variation that point out the underlying
phenomena which is the aim of the investigation (Roberts et al., 1999). Since the questionnaire
was based on previous studies and in order to measure to what extent the participants agrees
with the statements, a likert scale from one to five was used. The reason for having a scale
from one to five was to provide the participants the option of having no opinion.
28
When creating the questionnaire it is important that the different concepts are operationalized
to the extent that the respondents understand the questions and concepts presented in the
questionnaire. It is also important to convince the respondents that it is an anonymous research,
and that they do not take any risk by answering these questions. The visual layout and design
of the questionnaire must also be considered when sending questionnaires by email. The
questions must be interesting and engaging, however be relatively short in order to ease the
process of completing the questionnaire (Bryman & Bell, 2005). In the questionnaire all of the
questions were mandatory since we have used several days to pre-test the questions, and
therefore there would hopefully be no space for misunderstandings. Age and gender were also
mandatory since it would make it possible to make inferences. The questionnaire can be found
in appendix 1.
4.6.3(PreT(testing(
Pre-testing is used to test questions and statements before handing out a questionnaire. The aim
of pre-testing is because the authors want to make sure that the answers will provide the right
information that is relevant for the purpose. It is also important to make the questions and
statements easy to understand for the respondent who has no knowledge within the field. A
questionnaire, which is understandable, will make it easier to complete, and then it is more
likely that more answers will be received (Bryman & Bell, 2011). There are different ways of
making sure that the questionnaire is of high quality when doing pre-testing, the most effective
way is to send it to different persons with special knowledge within marketing and branding.
This is a good way of finding out if the questionnaire is of high quality when it comes to
marketing.
Another way of doing a pre-test is to send it to persons with no skills within the marketing and
branding field. This makes it possible to see if the respondents will understand the
questionnaire. If they understand the questions, the authors have probably managed to do a
good operationalization of the theoretical concepts in reality. Pre-testing is an important part of
handing out questionnaires, due to the fact that there is no possibility to re-do the
questionnaires afterwards or send them to the same respondents again, because then there will
be a risk that they will not answer again (Bryman & Bell, 2005). In this study, pre-testing was
done in two steps; first the questionnaire was tested on two persons with extensive knowledge
within the research field. After that the questionnaire was tested on a small group of people
with little or no special knowledge within the research field.
29
4.7(Sampling(
When investigating a phenomenon the most ideal would be to investigate the whole
population, but that would be very time consuming. Therefore, many researchers choose a
sample, which is representative for the population. One can turn to the process of sampling to
determine from where the data will be collected. The idea is to use a sample from the
population and draw conclusions from that. Due to time and monetary constraints this thesis
will use a sample survey. In order to make a sample survey it is of importance to define the
part of the population that is of interest for the research (Tull & Hawkins, 1993; Bryman &
Bell, 2005). In this thesis the population was defined as individuals who are living in Växjö.
The sample is determined by the sampling frame, sample size and sample selection.
4.7.1(Sampling(Frame(
Sampling frame is performed once the target population is defined (Tull & Hawkins, 1993). In
this study, the target population is the individuals living in Växjö. It is important that the
sample is drawn from the target population to get a representative sample of the population of
interest. It is important that the sampling frame is complete and correct since it will be used as
a tool for drawing conclusions about the population (Bryman & Bell, 2011). There are two
ways of targeting the population, either by census surveys or sample surveys.
Census surveys study every element of the population and sample surveys study a
representative proportion of the population. In order to complete this study, sample survey was
chosen due to the time and monetary restrictions. It is important to keep in mind when drawing
conclusions from a sample survey study that it is necessary to have a large amount of
respondents to be able to make generalizations from the result to finally contribute to research
(Bryman & Bell, 2005).
4.7.2(Sampling(Size((
There are several ways of determining the sample size. One way is by use the rule of thumb,
when one take the number of questions in a questionnaire and multiply each question with
three to come up with a sample size. However, this is not a reliable way of determining the
sample size due to the fact that it does not consider the size of the target population. Another
way for a researcher is by looking at previous researchers’ sample size and thereafter calculates
the median. One can also decide sample size based on the economical situation as well as

30
unaided judgment. Then there is the statistical method that one can use to determine the sample
size (Bryman & Bell, 2011).
For this thesis the sample size was determined by looking at previous investigations within the
field. This since using rules of thumb and unaided judgment did not qualified as good enough
reason for deciding on a sample size. Because of time and means limitations the statistical
method was also excluded. The previous investigations that were used to decide the sample
size can be found in table 7. Thereafter, the sample size of 231 was calculated, by calculating
the median of the all the sample sizes of the previous studies. When calculating the median, the
two middle articles Hong-Youl & Perks (2005) and Şahin et al., (2011) with the sample size of
203 and 258 where added together resulted in a total of 461. The number was thereafter
divided by 2 gave a result of 230.5, rounded up to 231. This way of calculating the sample size
was considered the most appropriate since it provides the most accurate number of respondents
in accordance to other researches. Furthermore, by having approximately the same number of
respondents this study can easily be compared to previous research.
Table 7. Previous research sample size and calculated median
Article Sample(size Iglesias!et!al.,!(2011)! 195
HongMYoul!&!Perks!(2005) 203 Şahin!et!al.,!(2011) 258 Horppu!et!al.,!(2008) 867 Calculated(Median 203(+(258(=(461(/(2(=(230.5!
(
4.7.3(Sample(selection(
A sample is taken from a population, which can be described as all entities that belong to the
same group or exist in the same geographical area. The sample should be representative for the
population, which is under investigation. There are different methods for determine a sample,
random and non-random sampling. Random sampling is a sample that has been chosen
randomly, meaning that the probability for being chosen in a population is already known.
Non-random sampling method is a sample that researchers obtain through other techniques,
which lead to some factors will have bigger chances of being chosen in a population.

31
There are different ways of using a non-random sample such as convenience sample, snowball
sample and quota sample. In this thesis a convenience sample is used. A convenience sample is
a sample, which happens to be available and easy to access for the researcher. There are
disadvantages with this sample method such as it can be hard to generalize the results even
though the information found can be interesting. One way to prevent non-usable data is to pre-
test the research instrument before doing the actual investigation to see if the questions are
understandable (Bryman & Bell, 2005). The questions used in the thesis were pre-tested to
prevent misunderstandings regarding the questions. Due to the fact that the questionnaire was
distributed through the Linnaeus University's school mail, which makes the convenience
sample the most feasible for this study. Therefore, the sample for this study are connected to
the school of economics and settled in Växjö.
4.8(Data(analysis(method(
Analyzing quantitative data can be done by several methods. The most common way of
analyzing data is through descriptive statistics, correlation analysis and regression analysis
(Bryman & Bell, 2011).
4.8.1(Descriptive(statistics(
Descriptive statistics is used to show a summary about a sample and the measures that have
been performed. To measure descriptive statistics one could look at the answers and draw
conclusion about the population. It could include variables such as age, gender, education and
geographic. The conclusions made from measuring the mean could provide useful information
for further investigations (Bryman & Bell, 2011).
4.8.2(Correlation(analysis(
Correlation coefficient is used when one want to investigate the strength in a relationship
between two or more variables, which can be measured by Pearson’s (r). This is a method used
for examine the relationships between different variables. The coefficient has a value between -
1 and 1. This indicates if there is either a positive or negative relationship. A coefficient value
of 0 indicates that there is no relationship between the variables. The closer the value is to 1 the
stronger the relationship is. The coefficient should be less than 0.9. This since if the value is
over 0.9 the variables is measuring almost the same variable and can therefore be merged into
one variable (Bryman & Bell, 2011).

32
4.8.3(Regression(analysis((
A Regression analysis provides information about the likelihood that the coefficient will be
found in the population from which the sample was taken. This kind of analysis is used to test
the hypotheses and to see if there is a relationship between different variables. R- Square is
measuring the amount of variance explained with the criterion variable. This explains how
many percent of the criterion variable, which can be explained by the predictor variable. If R-
Square is high, there is a strong relationship between the independent and the dependent
(Bryman & Bell, 2011). Statistical significance is also of crucial important when it comes to R-
square because of the fact that it shows how reliable the results are. If the significance level is
0.05, it means that the R- Square can be trusted to 95 percent. This means that there are fewer
than 5 chances in 100 that could have a sample that show that there is no relationship. If the
significance level is higher than 0.05, the hypotheses should be rejected.
Beta is another important number, Beta explain how much an increase of one unit in the
independent variable will affect the dependent variable. For example if the Beta value is 0,3,
this means that every unit increase in a independent variable, a 30 % unit increase in the
dependent variable is predicted. The higher the percentage is, the stronger the relationship is
between the variables. If the Beta value is negative, it means that there is a negative
relationship between the independent and the dependent. This means that if the Beta value is
negative, it means that the relationship between two variables is negative, this means that is the
Beta value is negative and the hypotheses are positive, the hypotheses are rejected. Through
statistical significance it can be shown how reliable the result is. The significance should be as
close to 0.00 as possible. The significant level shows how trust worthily the Beta value is
(Bryman & Bell, 2011).
4.9(Quality(criteria(
Quality can be measured by validity and reliability. Validity is described as the degree a
measurement instrument actually measures what it is aiming at measure. Validity is also the
most important evaluation criteria when it comes to research and comes in different forms that
need to be considered when evaluating the quality of a quantitative research. These are content
and construct validity. Reliability describes how stable the measurement instrument really is.
These criteria are used as a tool to make the measurement as good as possible and with a high
quality (Bryman & Bell, 2005; Yin, 2009). This means high validity and reliability for the
actual questionnaire in this case. The quality of the questionnaire also concerns to the quality

33
of the answers received from the participants.
4.9.1(Content(validity(
When discussing validity it is important to establish a content validity, also called face validity
(Bryman & Bell, 2005). It is a subjective and systematic view of how well a measurement
reflects the content of a construct (Bryman & Bell, 2005; Malhotra, 2010). Content validity
could be established by asking different people if they believe that the concept appear in the
measurement. The best way to achieve this is by asking people with knowledge within the
specific field to comment and judge if it is good or not and if the concept is clear. It is therefore
very important to make sure that the concept is clear and to take the advice from others. It
could be looked upon as a small pre-testing.
In this case since it is a quantitative research, it is the questionnaire that was pre-tested by some
people with knowledge within the studied field. It was also tested on a small group of people.
That has not studied within the field of marketing. This in order to see if the questionnaire was
clear and to make sure that the questionnaire is validated. It is good to pre- test the
questionnaire on both people with and without knowledge of the field (Bryman & Bell, 2005).
4.9.2(Construct(validity(
Construct validity are concerned with identifying the correct operational measures for the
concept being studied (Yin, 2009). Construct validity is used to encourage researchers to
deduce hypothesis from a theory that is relevant to the concept. The researchers could
investigate the relationship between different variables that is relevant to the theoretical
concept (Bryman & Bell, 2005). A way to make sure that the gathered information is correct is
by using many different sources as evidence to back up the given information. One could also
use a chain of events to make the information more valid (Yin, 2009). This could be achieved
by, correct referencing, recording interview guides and saving original transcripts. The best
way to make sure that the concept is clear and valid is by doing a proper operationalization,
describing the process (Bryman & Bell, 2005).
This thesis is testing different hypotheses and therefore an operationalization connected to the
theory was used as well as a correlation analysis to measure the connection between the
variables. The theory chapter also contributed to the construct validity since, there was an
extensive literature review performed to gather data for the thesis.

34
4.9.3(Concurrent(validity(When using concurrent validity the researcher employs a criterion that is known to differ and
that is relevant to the research. It could be a factor that could have a great impact on the result
(Bryman & Bell, 2005). By investigating the concurrent validity one could see if there is a
difference in for example women and men perception, which could have affected the result as
well as age. In this thesis hypothesis testing will be used to measure the concurrent validity.
These by letting the participants fill in their age and gender.
4.9.4(Reliability(
Reliability is concerned with measuring if a result of a study is repeatable. It is therefore
important to make sure that all information that is needed to be able to do to the same research
again is present within the research paper. The goal with reliability is to minimize the errors
and biases in a study (Yin, 2009). Reliability measures the consistency of a concept; most
commonly used in business, in terms of team working and employee motivations. Reliability
can be looked upon as a necessity for validity, for the reason that if one cannot rely on the
research to be consistent, it will most likely not be valid. Reliability can be measured in
different ways, either by repeating the study at another point in time or by the Cronbach’s
alpha (Bryman & Bell, 2005). In this study, reliability was measured by Cronbach’s alpha due
to the time constrains of this study.
Cronbach’s alpha is a commonly used test of internal reliability. Cronbach’s alpha should have
a value between 0 and 1. The value of 1 means that it is a perfect internal reliability and 0 that
there is no internal reliability. Therefore it is important to present the data correctly in the study
in order for other researchers to redo the test and to show that is reliable. The Cronbach’s alpha
state that in order for a test to be accepted it should have a coefficient of at least alpha ( ) = 0.6
Hair et al., (2003). Reliability is suitable to measure in this case since it will provide a tool
when it comes to show if the research is reliable or not.
(

35
Chapter(Summary(! ! ! ! ! ! ! ! ! ! ! ! ! ! !In this chapter the choices of methodology has been presented and justified. The choices of
each approach and method were chosen in order to increase the likeliness to reach the purpose
of this study and testing the three hypotheses. To summarize this chapter, a table with an
overview describing the methodology process has been conducted and can be seen in table 8.
Table 8. Methodology Overview
Research(Approach Deductive!Quantitative
Research(Design Descriptive
Data(sources Primary!Data
Research(Strategy Survey
Data(Collection(Method Questionnaire
Data(Collection(Instruments Operationalization!Questionnaire!PreMtesting
Sampling Convenience!sampling!231!respondents!People!living!in!Växjö!Handing!out!via!eMmail
Data(Analysis(Method Quantitative!data!analysis!Descriptive!statistics!Correlation!analysis!Regression!analysis
Quality(Criteria Validity!Reliability

36
5.(Empirical(data(and(analysis(! ! ! ! ! ! ! ! ! ! ! ! ! ! !Chapter five consists of the empirical findings from the questionnaire and an analysis of the
results. The first section presents an overview of the respondents and distribution using
descriptive statistics in order to visualize the result more clear. This is followed by testing the
reliability of each variable and thereafter continues on with testing the hypotheses in chapter
3, by analyzing the correlation and regression. The chapter combines empirical findings, in the
form of number and the analysis of the findings of the research. This to be able to discuss the
results in the next chapter and draw parallels with the theories regarding customer brand
relationship to see if the hypotheses are accepted.
5.1(Descriptive(statistics(
The collected data was collected from 239 respondents electronically during a two weeks
period. In the methodology chapter, the calculated aim of respondents was 231. However, 8
respondents exceeded this aim. Since the questionnaire was distributed to 2000 individuals at
the school of economics at Linnaeus University, provided the research with the total response
rate of 11.9 percent. An acceptable response rate for this study since; according to Bryman &
Bell (2011) it should be 10 percent. The descriptive statistics used for this research was age and
gender and from looking at the results, the largest age group of the respondents was 18-24,
with a total of 61.5 percent followed by the age group of 25-30, which represents 24.7 percent
of the total responses. This shows that the younger generation participated in the investigation
since only 4 respondents were 51 years old or over. Concerning the gender of the respondents,
154 of the respondents were female while 84 were male (see table 9).
Table 9. Descriptive statistics
(
Age Frequency Percent Gender Frequency
Percent
18M24 147 61.5 Male 84 35.3 25M30 59 24.7 Female 154 64.7 31M40 15 6.3 41M50 14 5,9 51+ 4 1,7 Total 239 100 239 100

37
(
5.2(Reliability(
In order to measure the reliability of the variables brand experience, brand satisfaction and
brand trust, all items for each variable had to be incorporated into one variable. Thereafter, a
reliability test was performed for each variable and the results are shown in table 10. According
to Hair et al., (2003) the Cronbach’s alpha should be (α) > 0.6 to be acceptable.
The Cronbach’s alpha value for brand experience was 0.573. In order to get this number one
statement was removed, which Hair et al., (2003) claims should be done to attempt to get a
higher value, hence making the result more reliable. In this case question 1 (see appendix 1)
was removed. However, since the value is below 0.6. It is not considered to be reliable in this
research. The Cronbach’s alpha for brand satisfaction was 0.709, an accepted value. Brand
trust alpha value was 0.586 based on all three statements, which is just below the acceptance
level. However, the value for brand experience due to the low value cannot be perceived as
reliable. The conclude, the only variable that was considered as reliable in this research was
brand satisfaction, which can be found in table 10 as well as the amended variables and the
final values of each variable.
Table 10. Reliability analysis (α) for Brand experience, Brand satisfaction and Brand trust
Variable Cronbach’s(Alpha((α) Number(of(items Brand!experience!excl.!Q.!1 0.573 2 Brand!satisfaction! 0.709 8 Brand!trust 0.586 3
(
5.3(Correlation(analysis(
In order to test the hypotheses, the first step was to analyze the correlations between the
different variables. In this case the number of Pearson’s r should be lower than 0.9 to be
accepted. All variables in this research had a positive and strong correlation with the dependent
variable of brand loyalty. The correlation between the independent variables and the dependent
variable of brand loyalty are shown in a table together with the significant level (see table 11).
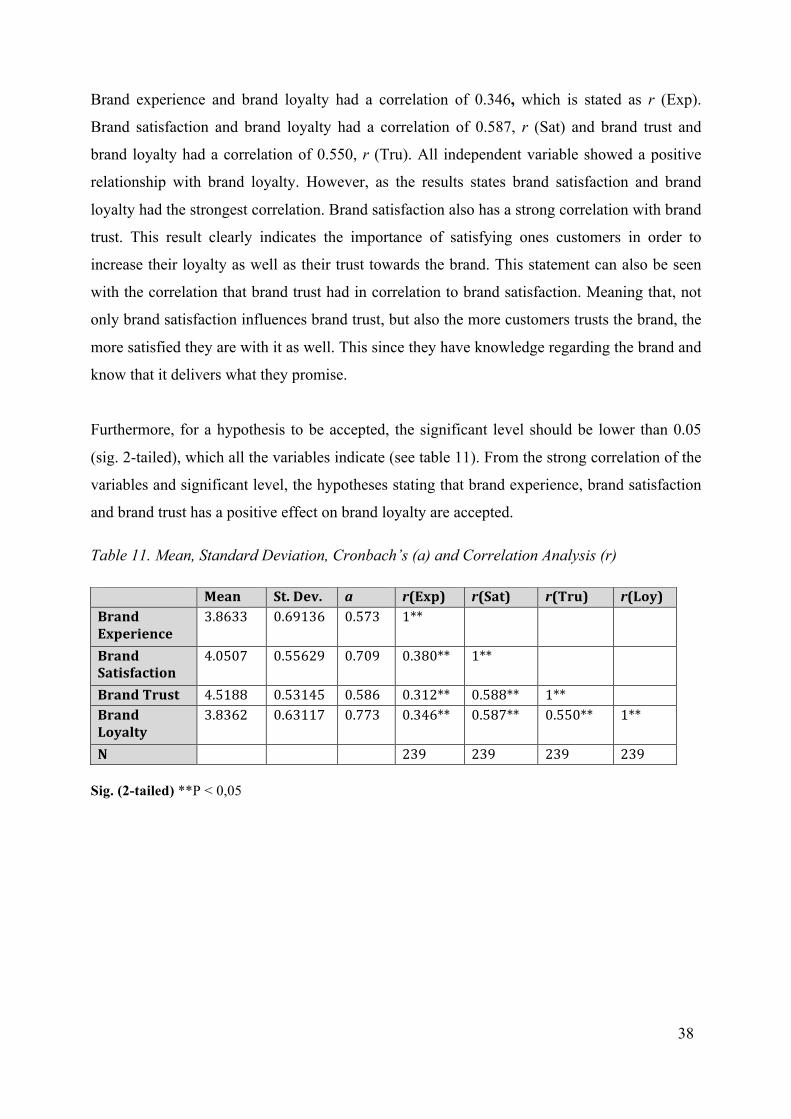
38
Brand experience and brand loyalty had a correlation of 0.346, which is stated as r (Exp).
Brand satisfaction and brand loyalty had a correlation of 0.587, r (Sat) and brand trust and
brand loyalty had a correlation of 0.550, r (Tru). All independent variable showed a positive
relationship with brand loyalty. However, as the results states brand satisfaction and brand
loyalty had the strongest correlation. Brand satisfaction also has a strong correlation with brand
trust. This result clearly indicates the importance of satisfying ones customers in order to
increase their loyalty as well as their trust towards the brand. This statement can also be seen
with the correlation that brand trust had in correlation to brand satisfaction. Meaning that, not
only brand satisfaction influences brand trust, but also the more customers trusts the brand, the
more satisfied they are with it as well. This since they have knowledge regarding the brand and
know that it delivers what they promise.
Furthermore, for a hypothesis to be accepted, the significant level should be lower than 0.05
(sig. 2-tailed), which all the variables indicate (see table 11). From the strong correlation of the
variables and significant level, the hypotheses stating that brand experience, brand satisfaction
and brand trust has a positive effect on brand loyalty are accepted.
Table 11. Mean, Standard Deviation, Cronbach’s (a) and Correlation Analysis (r)
Sig. (2-tailed) **P < 0,05 !
(
Mean St.(Dev. a r(Exp) r(Sat) r(Tru) r(Loy) Brand(Experience
3.8633 0.69136 0.573 1**
Brand(Satisfaction
4.0507 0.55629 0.709 0.380** 1**
Brand(Trust 4.5188 0.53145 0.586 0.312** 0.588** 1** Brand(Loyalty
3.8362 0.63117 0.773 0.346** 0.587** 0.550** 1**
N 239 239 239 239

39
5.4(Regression(analysis(
A multiple regression analysis was calculated by using the total brand experience, total brand
satisfaction, total brand trust and total brand loyalty. With the total it means that all items for
each variable are included in the calculation. The R-square was calculated in order to see how
brand experience, brand satisfaction and brand trust influence brand loyalty. The R-square
calculated shows 0.412 (see table 12).
According to Bryman & Bell (2011), the R-square measures the variance explained by the
independent variable. Since the value is perceived to be relatively high between the
independent and dependent variable meaning that there is a strong relationship which indicates
that the independent variables explains 41.2 percent of the brand loyalty. The result further
indicates that brand experience; brand satisfaction and brand trust are important factors for
creating brand loyalty. Furthermore, the significant level of the research should be lower than
0.05 to be accepted (see table 12). Although the high percentage of 41.2, there is still 58.8
percentages unsolved.
Table 12. Regression analyses Adjusted(R(Square 0.412
F 56,586
Sig. 0,000 Independent variables: Experience, Satisfaction and Trust Dependent Variable: Loyalty
Within the regression analysis, the beta-value is important to consider since it explains how
much one unit in brand loyalty will increase, if the independent variable increases with one
unit. As can be seen in table 13, all values are positive, which indicates a positive relationship
between the independent variables and the dependent. In this study the beta value for brand
experience show that if one unit increase in brand experience, a 0,113 unit in brand loyalty is
predicted. Beta value for brand satisfaction was 0.369, meaning that one unit of brand
satisfaction will increase 36,9 percent of one unit in brand loyalty. Lastly, brand trust had a

40
value of 0.298, indicating that brand loyalty will increase by 29.8 percent in one unit if brand
trust will increase by one unit.
The table 13 shows significant numbers below 0,05. From this, one can clearly see that the
variables that influences brand loyalty the most are brand satisfaction and brand trust since they
had the highest percentage. Moreover, by the positive beta value one can also draw the
conclusion that all three hypotheses are accepted. However, brand satisfaction and brand trust
are the strongest variable influencing brand loyalty.
Table 13. Beta values
Dependent Variable: Loyalty
(((Chapter(Summary(! ! ! ! ! ! ! ! ! ! ! ! ! ! !To summarize this chapter, the empirical data collected from the questionnaire was presented
and analyzed through the use of different methodology approaches. Thereafter, a reliability
test was done of each variable as well as testing the hypotheses though a correlation and
regression analysis. The outcome of the tests showed that all the independent variable had a
positive relationship with brand loyalty. By testing the hypotheses, the results also showed that
all three hypotheses were accepted and therefore have an impact on brand loyalty, which helps
building a customer brand relationship.
! Brand(Loyalty
Beta Sig.
H1:(Experience 0,113 0,039 H2:(Satisfaction 0,369 0,000 H3:(Trust 0,298 0,000

41
6.(Conclusions(&(implications( This chapter highlights the findings of this study. The purpose of this study was to investigate
how brand experience, brand satisfaction and brand trust effect brand loyalty in the retail
industry. In this chapter, from the empirical findings and analysis, a discussion regarding the
results is presented as well as conclusions. The chapter thereafter, presents theoretical and
managerial implications for businesses that have been drawn from the discussion. Ending with
limitations that the researchers of this study have come across is presented followed by
suggestions for future research
(
6.1(Discussion(
The study was performed based on existing theoretical framework from previous research
within the subject area. Based on the previous research, the base for building customer brand
relationship and brand loyalty is brand experience, brand satisfaction and brand trust. However,
what previous researchers have discovered is that brand experience is the foundation for
creating brand loyalty and the others variables use brand experience as a base. This is shown
by the positive relationship that the researchers have discovered. However, what is essential to
increase loyalty and the customer brand relationship is brand satisfaction and brand trust since
they are the basis for returning customer (Hong-Youl & Perks, 2005; Şahin et al., 2011). This
is something that the researches have investigated in different industries except in the retail
industry, which is the focus of this thesis.
During the investigation, the amount of responses received was greater than expected, which
provided a larger empirical data to study and analyze. As could be seen from the results, brand
satisfaction was the only variable that was reliable since the brand experience and brand trust
alpha value were below the acceptance level, even though a pre-testing was performed.
Another reason for the low reliability could also be due to the few items used to measure brand
experience and brand trust. Furthermore, the positive relationship derived from the correlation
analysis implies that the variables are essential for brand loyalty, which is supported by
previous research by Hong-Youl & Perks (2005), Horppu et al., (2008), Iglesias et al., (2011)
and Şahin et al., (2011). Since all statements had a significance level below 0.05, the
hypotheses were all accepted. This is also supported by the regression analysis that provided a
positive beta value for the variables. However, brand experience was the only variable that

42
received low beta value. Brand satisfaction received the highest beta value. All though the
research was performed in another industry and geographical area as well as being more
general towards brands, the hypotheses are all accepted supporting the findings by Hong-Youl
& Perks (2005), Horppu et al., (2008), Iglesias et al., (2011) and Şahin et al., (2011).
Moreover, this implies that the research performed contributes to the theory of brand
experience, brand satisfaction and brand trust have a positive effect on brand loyalty and
therefore important for retailers to consider. This research further contributed to information
regarding the younger generation settled in Växjö view of the retail industry and the different
aspects of brands. Since the subjected has not been in focus within Sweden earlier, this
research provides the ability for future research and gaining more knowledge within the area.
6.2(Conclusions(
As mentioned in the section above, from the survey investigation performed for this thesis, the
results showed that the variables of experience, satisfaction and brand trust all had a positive
relationship with brand loyalty as well as to each other. This clearly implies that variables are
connected to each other and therefore important for businesses within the retail and fashion
industry to consider. Furthermore, the regression analysis showed an R-square of 41.2 meaning
that the variables only influence brand loyalty 41.2 percent. Since the retail and fashion
industry is highly competitive, these results implies that there is a 58.8 percent of other factors
that influence brand loyalty and strengthen customer brand relationship, that needs to be
investigated.
Moreover, the results provided from testing the hypotheses showed a positive correlation
between the variables and significant level that was lower than 0.05. This implies that all
hypotheses, brand experience, brand satisfaction and brand trust effect brand loyalty are
accepted in this research. All though the relationship between brand experience and brand
loyalty was positive, the correlation could have been stronger. This can be due to the few
statements included for experience.

43
To conclude this research, brand satisfaction and brand loyalty had a high correlation value,
indicating that an important element for brand loyalty is satisfied customer. Brand trust and
brand loyalty also had a positive correlation, meaning that trust has a strong influence on
customer loyalty towards a brand. This leads to this study is supported by the research
performed by Hong-Youl & Perks (2005), Horppu et al., (2008), Iglesias et al., (2011) and
Şahin et al., (2011) whom also states a positive relationship between brand experience, brand
satisfaction and brand trust and its effect on brand loyalty. However, emphasis that satisfaction
and trust are essential factors for returning loyal customers and sustaining a customer brand
relationship, which are also the main findings of this thesis.
(
6.3(Theoretical(implications(
This research has focused on existing academic knowledge regarding establishing a customer
brand relationship with the use of brand experience, brand satisfaction and brand trust. The
research aimed at connecting these variables to the Swedish retail market in order to make a
comprehensive overview of the subject. The main contribution was to provide empirical
evidence that all the variables have an effect on brand loyalty. The research suggests a positive
relationship between the variables with brand loyalty. However, there were some differences
between this research and previous research within the field. Şahin et al., (2011) research
suggests a positive correlation between brand experience and brand loyalty. Meaning that, a
positive experience for the customer will lead to brand loyalty, which is also supported by the
findings in this research. The findings in this research showed a somewhat lower correlation
between brand experience and brand loyalty than the research made by Şahin et al., (2011).
The theory also suggested a positive relationship between brand satisfaction and brand loyalty.
This result is the most important and reliable variable to consider for creating customer brand
relationships. According to the findings, brand satisfaction can be achieved according to this
research by meeting or exceeding customers expectations and solve customers’ existing
problems and therefore it is important to know what the customer expects of the brand. The
theory states that it is the perception and attitude towards a brand that determines the
expectations of a brand by customers (Klaus & Maklan, 2007; Gentile et al., 2007).

44
Şahin et al., (2011) research addresses that, brand satisfaction has a high correlation with brand
loyalty. This is also supported by the findings of this research. Horppu et al., (2008) research
also showed a positive correlation between brand satisfaction and brand loyalty. Opposite to
Şahin et al., (2011) there was a higher correlation between brand trust and brand loyalty than
between brand satisfaction and brand loyalty in the research by Hong-Youl & Perks, (2005),
Horppu et al., (2008) and Iglesias et al., (2011).
Şahin et al., (2011) and Horppu et al., (2008) stress that, there is a correlation between brand
trust and brand loyalty, which is supported by the findings of this study. This study also
contributes to the theory by adding that there is a general connection between brand
satisfaction and brand trust towards creating brand loyalty. This because a repeated satisfied
customer will eventually trust the brand to deliver again and this will lead to brand loyalty.
Since the research suggested a positive relationship between brand trust and brand loyalty. For
that reason, retail companies are in need to gain trust from their customers in order to gain
brand loyalty.
!
6.4(Managerial(implications(
The results from the empirical investigation provide a few practical suggestions for retail
managers in Växjö. Important implications to consider are that retail businesses should focus
on providing brand satisfaction as well as giving the customers good brand experience to gain
loyal customers. This since the entire experience is perceived as an influencing element for
brand satisfaction, which also influence the total brand trust.
As the result from the empirical investigation suggest, managing these areas is highly
important due to the fact that they will determine the total amount of brand loyalty received
from customers. Furthermore, due to the fierce competition on the market managers are in need
to be able to stand out in the crowd. This can be achieved by focusing on creating a strategic
plan including these dimensions in order to create brand loyalty and most important customer
brand relationship. Establishing and maintaining a strong customer brand relationship is
difficult to achieve as well as manage if the dimensions of experience, satisfaction and trust are
not included. The retail business needs to know their customers in order to exceed their
expectations in the best possible way to create a strong bond between the brand and the
customer.

45
It is also evident from this research, that the younger generation is concerned with the
importance of being loyal towards a brand. Therefore, it is suggested that a retail business that
focuses on incorporating these three variables on the younger generation are more likely to
gain brand loyalty and build a long term customer brand relationship. Focusing on the younger
generation is therefore essential since the relationship is something that is build up over time.
This is also evident from this research since the correlation between each independent variables
and brand loyalty was high. However, brand satisfaction received the highest correlation
should be the focal point for creating a strong customer brand relationship, since it is the
foundation for trust. To conclude, from a managerial perspective taking care of one’s customer
and meeting their expectations, indicates that customers are more likely to revisit the brand as
well as recommend the brand to others, which makes them a part of a loyal customer base.
6.5(Limitations(
A few limitations concerning this study should be noted. First of all the limitation that we came
across was if this study is representative for all people living in Växjö. The response rate was
11.9 percent, which is acceptable, however the respond rate could have been higher but due to
the time restriction there was no time for waiting for more responses. A higher response rate
would have lead to a deeper investigation, which would have been more representative for the
population living in Växjö. This research did not consider changes over time in peoples
shopping behavior and income. It also did not consider how often people visited retail stores.
There were mostly female and young respondents that answer the questionnaire, which might
have impacted the result. Therefore, the sample size could have been higher and more equal
distributed between gender and age to get a more representative picture to make generalized
inferences from the result.
The study was based on Şahin et al., (2011) previous study. To be able to replicate the study,
similar questions and statements were used as in the study by Şahin et al., (2011). To reach the
purpose of the investigation the questions and statements were made general about brands to fit
the retail and fashion industry and customers’ overall perceptions of brands. The questions and
statements used showed a Cronbach’s alpha higher than 0.6 because, meaning the most reliable
when replicating a study. When Cronbach’s alpha was calculated, brand experience showed
0.573 and brand trust showed a number of 0.586. Numbers were below what is acceptable even
if the study was based on questions that were reliable according to Şahin et al., (2011).

46
6.6(Future(research(
The results of this study indicate different directions of future research. Due to the low alpha
value being below 0.6 for brand experience and brand trust, there is a need to focus further on
these elements. It is therefore suggested to investigate deeper by including more items when
measuring the variable, making them reliable and provide with more sufficient information.
This can be done by gaining more knowledge since regarding the theory, since it is suggested
that experience is perceived as the foundation for the other variables.
Secondly, since the survey was conducted through Linnaeus University's internal email, it
contributed to a large amount of respondents from the younger generation. This implies that it
does not represent the entire population of Växjö and therefore suggested to focus the study
based on a larger sample size with a larger variety of ages. The reason being is that, a larger
sample size will also provided a more detailed empirical analysis can be performed. This can
also provide a comparison of differences and similarities concerning age and genders regarding
the importance of brand experience, brand satisfaction, brand trust and brand loyalty.
Furthermore, in order to strengthen the hypotheses within the same industry, it is suggested to
investigate the variables within another geographical area. Since the adjusted R square shows
that only 41.2 percent of brand loyalty is explained by brand experience, brand satisfaction and
brand trust, implies that there is a remaining of 58.8 percent of other factors and variables that
should be focused on. To make strengthen the hypothesis even more, it is suggested that
researchers focus on a specific brand. This since, it ease the process for the respondents to
relate to the subject as well as gaining more reliable information if the variables are valuable
for creating a customer brand relationship, which might lead to higher results of correlation and
R square.
Chapter(Summary( This chapter has discussed the results and the conclusions of the research. It also
acknowledges the managerial and theoretical implications regarding the outcome of the study.
The chapter also gave suggestions for further research. This was based on the outcome of the
study and limitations that occurred during the process of writing the thesis.

47
References!Aaker, D. A., Kumar, V., Day, G. S. & Leone, R. P. (2011). Marketing Research- International Student Version. London: John Wiley & Sons. Agustin, C. & Singh, J. (2005). Curvilinear Effects of Consumer Loyalty Determinants in Relational Exchanges. Journal of Marketing Research, Vol. 42, Issue 1, pp. 96-108. Ailawadi, K.L. & Keller, K.L. (2004). Understanding retail branding: conceptual insights and research priorities. Journal of Retailing, Vol. 80, Issue 4, pp. 331-342. Algesheimer, R. Dholakia, M. U., & Herrmann, A. (2005). The Social Influence of Brand Community: Evidence From European Car Clubs. Journal of Marketing, Vol. 69, Issue 3, pp.19-34. Alloza, A. (2008). Brand Engagement and Brand Experience At BBVA: The Transformation of a 150 Years Old Company. Corporate Reputation Review, Vol. 11, Issue 4, pp. 371-381. Ambler, T., Bhattacharya B.C., Edell, J., Keller, L. K., Lemon N. K, & Mittal, V. (2002). Relating Brand And Customer Perspectives On Marketing Management. Journal of Service Research, Vol. 5, Issue 1, pp. 13. Anderson, C. J. & Narus A. J. (1990). A Model Of Distributor Firm and Manufacturer Firm Working Partnerships. Journal of Marketing, Vol. 54, Issue 1, pp. 42-58. Arbnor, I. & Bjerke, B. (1994). Företagsekonomisk metodlära. Lund: Studentlitteratur. Armstrong, G., Kotler P., Harker M. & Brennan R. (2009). Marketing an introduction. Edinburgh: Prentice Hall. Athanassopoulos, A., Gouiiaris, S. & Stathakopoulos, V. (2001). Behavioral responses to customer satisfaction: An empirical study. European Journal of Marketing, Vol. 35, Issue ⅚, pp. 687-707. Bennett, R. & Thiele R. S. (2005). The Brand Loyalty Life Cycle: Implications for Marketers. Brand Management, Vol. 12, Issue 4, pp. 250-163. Blumberg, B., Cooper, D. R. & Schindler, P.S. (2008). Business Research Methods. London: McGraw- Hill Higher Education. Bowden, J. (2009). Customer Engagement: A Framework for Assessing Customer-Brand Relationships: The Case of the Restaurant Industry. Journal of Hospitality Marketing & Management, Vol. 18, Issue 6, pp. 574-596. Brakus, J., Josko, Schmitt, B.H., & Zarantonello, L. (2009). Brand Experience: What is it? How is it measured? Does it affect loyalty?, Journal of marketing, Vol. 73, Issue 3, pp. 52-68. Bryman, A. & Bell, E. (2005). Företagsekonomiska metoder. Malmö: Liber. Bryman, A. & Bell, E. (2011). Business Research Methods. Oxford: University Press.

48
Braunsberger, K. & Munch, J. M. (1998). Source expertise versus experience effects in hospital advertising'. Journal of Services Marketing, Vol. 12, Issue 1, pp. 23-36. Brodie, R. J., Whittome, J. R. M. & Brush, G. J. (2009). Investigating the service brand: A customer value perspective. Journal of Business Research, Vol. 62, Issue 3, pp. 345–355. Carpenter, M.J., Moore, M. & Fairhurst, E.A. (2005). Consumer shopping value for retail brands. Journal of Fashion Marketing and Management, Vol. 9, Issue 3, pp. 43-53. Chiou, J-S & Chang, S, (2006), The Effects of satisfaction, Opportunism and Asset Specificity On Consumers Loyalty Intention Toward Internet Portal Sites. International Journal Service Industry Management, Vol. 17, Issue 1, pp. 7-22. Christensen, L., Engdahl, N., Grääs, K., & Haglund, L. (2010). Marknadsundersökning en handbok. Lund: Studentlitteratur AB. Dall’Olmo Riley, F. & de Chernatony, L. (2000). The service brand as a relationship builder. British Journal of Management, Vol. 11, Issue 2, pp. 137–150. Delgado- Ballester, E. & Munuera - Alemán, J. L. (2001). Brand trust in the context of consumer loyalty. European Journal of Marketing, Vol. 35, Issue 11/12, pp. 1238-1258. Dick, A. S. & Basu, K. (1994). Customer loyalty: Toward an integrated conceptual framework. Journal of the Academy of Marketing Science, Vol. 22, Issue 2, pp. 99–113. Eliasson, A. (2010). Kvantitativ metod från början. Lund: Studentlitteratur AB. Gentile, C., Spiller, N. & Giulano, N. (2007) How to Sustain the Customer Experience: An Overview of Experience Components that Co-create Value with the Customer. European Management Journal, Vol. 25, Issue 5, pp. 395-410. Grewal, D. Levy, M. & Lehmann, D.R. (2004). Retail Branding and Customer Loyalty: an overview. Journal of Retailing, Vol. 80, Issue 4, pp. 249-249. Hair, J., Money, A., Samouel, P. & Babin, B. (2003). Essentials of business research methods. USA: Wiley & Sons. Hong-Youl, H. & Perks, H. (2005). Effects of consumer perceptions of brand experience on the web: Brand familiarity, satisfaction and brand trust. Journal of Consumer Behaviour, Vol. 4, Issue 6, pp. 438-452. Horppu, M., Kulvalainen, O., Tarkiainen, A & Ellonen, H. K. (2008). Online satisfaction, trust and loyalty, and the impact of parent brand. Journal of product & Brand Management, Vol. 17, Issue 6, pp. 403-413. Hultén, B. (2011). Sensory marketing: the multi-sensory brand-experience concept. European Business Review, Vol. 23, Issue 3, pp. 256-273. Hyde, K. F. (2000). Qualitative Market Research. An International Journal, Vol. 3, Issue 2, pp. 82-89.

49
Iglesias, O., Singh, J. & Batista- Foguet, J.M. (2011). The role of brand experience and affective commitment in determining brand loyalty. Journal of Brand Management, Vol. 18, Issue 8, pp. 570-582. Kay, J.K. (2006). Strong brands and corporate brands. European Journal of Marketing, Vol. 40, Issue ⅞, pp. 742–760. Keller, K.L. (2003). Brand Synthesis: The multidimensional of brand knowledge. Journal of consumer research, Vol. 29, Issue 4, pp. 595-600. Klaus, P. & Maklan, S. (2007). The role of brands in a service-dominated world. Journal of Brand Management, Vol. 15, Issue 2, pp. 115–122. Kotler, P., Armstrong, G., Harker, M., & Brennan, R. (2009). Marketing an introduction. England: Pearson Education. Liljander, V. & Strandvik, T. (1997). Emotions in service satisfaction. International journal of Service industry Management, Vol. 8, Issue 2, pp. 148-169. Malhotra, N. K. (2010). Marketing Research: An Applied Orientation. London: Edition Pearson Education Mano, H. & Oliver, R.L. (1993). Assessing the dimensionality and structure of the consumption experience: Evaluation, feeling, and satisfaction. Journal of Consumer Research, Vol. 20, Issue 3, pp. 451–466. Mosley, R.W. (2007). Customer experience, organisational culture and the employer brand. Journal of Brand Management, Vol. 15, Issue 2, pp. 123–134. Nolan, S. A. & Heinzen, T. E. (2008) Statistics for the behavioural Sciences. New York: Worth Publishers. Oliver, L. R. (1999). Whence Consumer Loyalty. Journal of marketing, Vol. 63, Issue 4, pp. 33-34. Parsons, A. G. (2011). Atmosphere in fashion stores: do you need to change? Journal of Fashion Marketing and Management, Vol. 15, Issue 4, pp. 428-445 Patel, R. & Davidson B. (2008). Forskningsmetodikens grunder: Att planera, genomföra och rapportera en undersökning. Hungary: Elanders. Phopalia, A. K. (2010) Modern Research Methodology: New Trends and Techniques. India: Japiur. Punniyamoorthy, M., Raj, M. & Prasanna, Mohan. (2007). Measurement & Analysis for Marketing. Journal of Targeting, Vol. 15, Issue 4, pp. 222-233. Rabianski, J. S. (2003). Primary and secondary data: concepts, concerns, errors and Issues. Appraisal Journal. Vol. 71, Issue 1, pp. 43.

50
Roberts, J., Laughlin, J. & Wedell, D. (1999). Validity Issues in the Likert and Thurstone Approaches to Attitude Measurement. Educational and Psychological Measurement, Vol. 59, Issue 2, pp. 211-233. Rowley, J. (2009). Online branding strategies of UK fashion retailers. Internet research, Vol. 19, Issue 3, pp. 348-369. Şahin, A., Zehir, C., & Kitapçı, H. (2011) The Effects of Brand Experiences, Trust and Satisfaction on Building Brand Loyalty; An Empirical Research On Global Brands. In The Proceedings of 7th International Strategic Management Conference, Procedia - Social and Behavioral Sciences, Vol. 24, pp. 1288-1301. Tull, D. S & Hawkins. (1993). Marketing research: Measurement and method: a text with cases. New York: Maxwell Macmillan International. Wangenheim, F. & Bayón, T. (2006). Satisfaction, loyalty and word of mouse within the customer base of a utility provider: Differences between stayers, switchers and referral switchers. Journal of Consumer Behaviour, Vol. 3, Issue 3, pp. 211-220. Westbrook, R. A. & Oliver, R.L. (1991). The dimensionality of consumption emotion patterns and consumer satisfaction. Journal of Consumer Research, Vol. 18, Issue 1, pp. 84–91. White, C. & Yu, T. (2005). Satisfaction emotions and consumer behavioral intentions. Journal of Services Marketing, Vol. 19, Issue 6, pp. 411–420. Yin, K. R. (2006). Fallstudier: design och genomförande. Malmö: Liber. Yin, K. R. (2009). Case study research: Design and methods. SAGE publications Inc: London. Zehir, C., Şahin, A., Kitapçı., H & Özşahin, M. (2011). The Effects of Brand Communication and Service Quality In Building Brand Loyalty Through Brand Trust; The Empirical Research On Global Brands. In The Proceedings of 7th International Strategic Management Conference- Procedia-Social and Behavioral Sciences, Vol. 24, pp. 1218-1231.

51
Appendix(1.(Questionnaire(
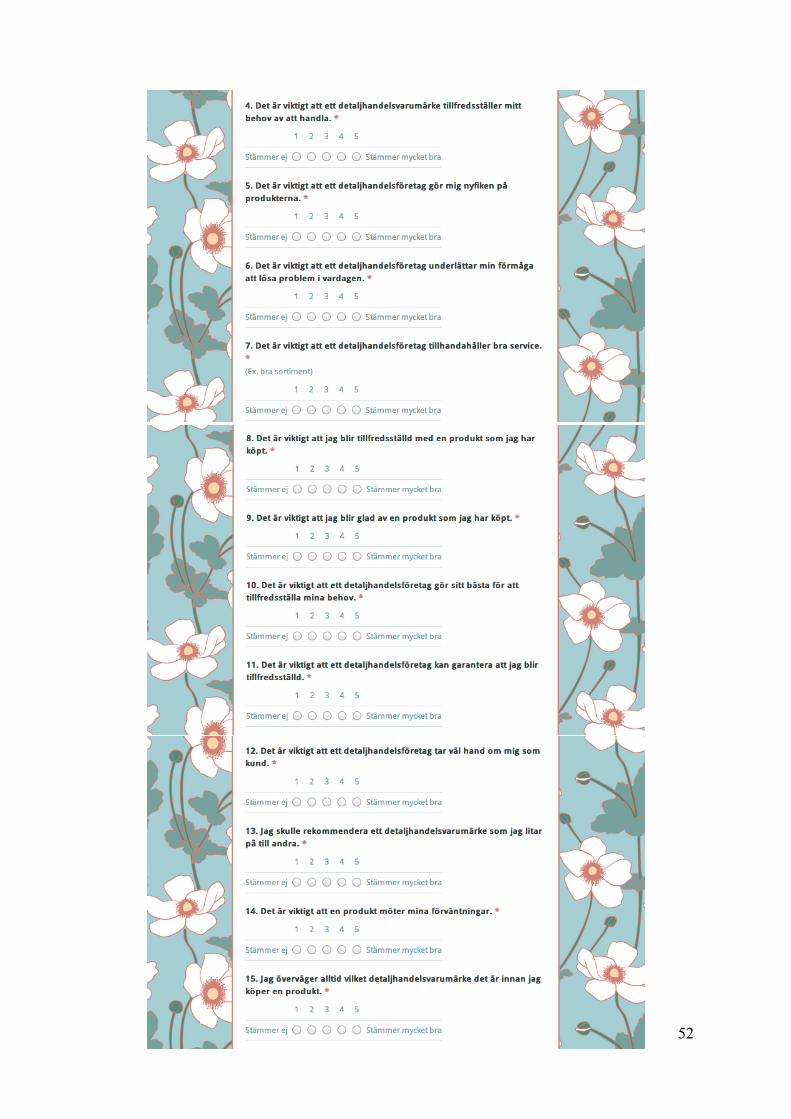
52

53

54
Linnaeus University – a firm focus on quality and competence On 1 January 2010 Växjö University and the University of Kalmar merged to form Linnaeus University. This new university is the product of a will to improve the quality, enhance the appeal and boost the development potential of teaching and research, at the same time as it plays a prominent role in working closely together with local society. Linnaeus University offers an attractive knowledge environment characterised by high quality and a competitive portfolio of skills. Linnaeus University is a modern, international university with the emphasis on the desire for knowledge, creative thinking and practical innovations. For us, the focus is on proximity to our students, but also on the world around us and the future ahead. Linnæus University SE-391 82 Kalmar/SE-351 95 Växjö Telephone +46 772-28 80 00