Embed Size (px)
Citation preview

CurrentAchie
.0
State of Chilean Dairy Exports: ving Successful Entry into the
U.S. Dairy Market
December 2005
Research Department AmCham Chile
By: Amanda Jefferson and Mathew Rice

U.S. Dairy Market
Table of Contents
Executive Summary 1
I. Current State of Chilean Dairy Exports 2
A. Global Exports 2
B. Exports to the United States 2
1. How quotas work 4
2. Quotas spark growth 4
3. Quota utilization 5
II. Understanding the U.S. Market 5
A. Market size and trends 5
B. Products 6
1. Cheese 6
2. Milk 8
3. Cultured 8
4. Butter 9
5. Organic 10
C. Local Production 10
D. Exports 11
E. Imports 12
F. Distribution Channels 13
G. Prices 14
H. Opportunities 15
I. Competitive Threats and Obstacles 16
III. Government Regulations 16
A. Register with the FDA 17
B. Know proper sanitary procedures 17
C. Be aware of labeling and packaging requirement 17
D. Give prior notice of shipment arrival 18
IV. Conclusion: Tips on Entering the Market 18
V. Additional Resources 20
AmCham Chile

U.S. Dairy Market Page 1 of 21
Executive Summary Equipped with a free trade agreement with the United States, Chile’s dairy industry is eyeing new opportunities in one of the world’s most important dairy markets. Entering into effect in January 2004, the U.S.-Chile FTA was welcomed by the Chilean dairy industry as a source of exciting new avenues for growth. Since then, Chilean dairy exports have exploded. Through the utilization of new duty-free quotas assigned to various categories of dairy products, dairy exports increased this year by 856% from January to August compared to the same period in 2003. Despite this exciting growth, Chile still claims a significantly low participation in the world dairy market, and many challenges lay ahead to penetrate the highly competitive U.S. market. Chile ranks 33rd, representing only 0.3% of the value imported. The U.S. is Chile’s second largest dairy market, accounting for 5.5% of its exports, after Mexico, which accounts for over 60%. This paper offers suggestions for entry and growth within the U.S. market by identifying niches, marketing strategies, and untapped opportunities.
AmCham Chile

Page 2 of 21 U.S. Dairy Market
I. Current State of Chilean Dairy Exports A. Global Exports The Chilean dairy industry has changed rapidly over the past few years through extensive modernization and innovation, allowing it to increase its productive capacity and diversify its portfolio of dairy products. In 2004, Chile produced 320 million liters of fluid milk, 150 million kilograms of yogurt and 58,849 tons of mature cheese, plus 8296 tons of fresh cheese, reaching a total of nearly 630 million liters of milk.1
Traditionally, Chile has been an importer of dairy products. However the past several years have brought increases in production that surpass internal consumption growth rates; per capita cheese consumption in Chile is only 4 kilos. Exciting new opportunities like the Free Trade Agreement with the United States also spurred export-minded activities in companies who had traditionally only looked internally for their markets. While Chile’s diary exports currently only account for roughly 1% of total world dairy exports, its low production costs poise it for growth. Mexico accounts for over 60% of total dairy exports, with the U.S. at a very distant second with 5.5% of the Chilean export share. Globally, Chile principal exports are of gouda cheese, condensed milk and whole powder milk. Other exports include dry whey, dulce de leche and butter. B. Exports to the United States
Despite the fact that 2004 was a year of learning for Chilean diary exporters to the U.S., exports still showed enormous increases. Dairy exports grew by 212% compared to 2003 and exports from January to August 2005 grew by 96% compared to the same period in 2004 and by a whopping 856% compared to the same period in 2003. Most Chilean dairy exports to the U.S. are of cheese, milk and cream, condensed milk, dulce de leche and butter. Currently fifteen Chilean companies export to the United States. Many of them are members of ExporLAC, the Chilean Dairy Product Exporters Association, who work together to position Chile’s dairy products in external markets.
Figure 2. Figure 1.
Dairy Exports from Chile to USJanuary - August 2005
Total Value US $4.108 million
Cheese33%
Milk and cream24%
Butter14%
Manjar10%
Condensed milk18%
Powdered milk1%
1 “Lácteos en Chile: Un Mercado en Crecimiento” InduAlimentos, vol. 8, no. 37 (October 2005):26.
AmCham Chile
U.S. Dairy Market Page 3 of 21
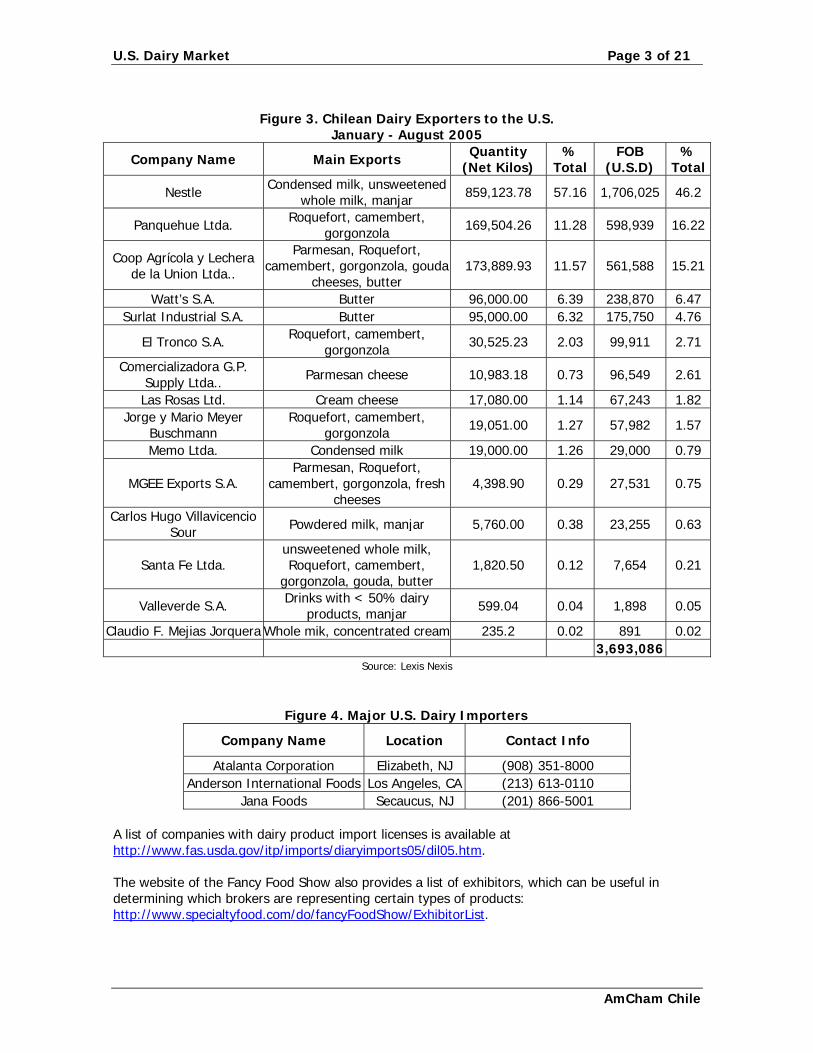
Figure 3. Chilean Dairy Exporters to the U.S.
January - August 2005
Company Name Main Exports Quantity (Net Kilos)
% Total
FOB (U.S.D)
% Total
Nestle Condensed milk, unsweetened whole milk, manjar 859,123.78 57.16 1,706,025 46.2
Panquehue Ltda. Roquefort, camembert, gorgonzola 169,504.26 11.28 598,939 16.22
Coop Agrícola y Lechera de la Union Ltda..
Parmesan, Roquefort, camembert, gorgonzola, gouda
cheeses, butter 173,889.93 11.57 561,588 15.21
Watt’s S.A. Butter 96,000.00 6.39 238,870 6.47 Surlat Industrial S.A. Butter 95,000.00 6.32 175,750 4.76
El Tronco S.A. Roquefort, camembert, gorgonzola 30,525.23 2.03 99,911 2.71
Comercializadora G.P. Supply Ltda.. Parmesan cheese 10,983.18 0.73 96,549 2.61
Las Rosas Ltd. Cream cheese 17,080.00 1.14 67,243 1.82 Jorge y Mario Meyer
Buschmann Roquefort, camembert,
gorgonzola 19,051.00 1.27 57,982 1.57
Memo Ltda. Condensed milk 19,000.00 1.26 29,000 0.79
MGEE Exports S.A. Parmesan, Roquefort,
camembert, gorgonzola, fresh cheeses
4,398.90 0.29 27,531 0.75
Carlos Hugo Villavicencio Sour Powdered milk, manjar 5,760.00 0.38 23,255 0.63
Santa Fe Ltda. unsweetened whole milk, Roquefort, camembert,
gorgonzola, gouda, butter 1,820.50 0.12 7,654 0.21
Valleverde S.A. Drinks with < 50% dairy products, manjar 599.04 0.04 1,898 0.05
Claudio F. Mejias Jorquera Whole mik, concentrated cream 235.2 0.02 891 0.02 3,693,086
Source: Lexis Nexis
Figure 4. Major U.S. Dairy Importers
Company Name Location Contact Info
Atalanta Corporation Elizabeth, NJ (908) 351-8000 Anderson International Foods Los Angeles, CA (213) 613-0110
Jana Foods Secaucus, NJ (201) 866-5001 A list of companies with dairy product import licenses is available at http://www.fas.usda.gov/itp/imports/diaryimports05/dil05.htm. The website of the Fancy Food Show also provides a list of exhibitors, which can be useful in determining which brokers are representing certain types of products: http://www.specialtyfood.com/do/fancyFoodShow/ExhibitorList.
AmCham Chile

Page 4 of 21 U.S. Dairy Market
The American Cheese Society maintains a database of cheese distributors, brokers, importers, and marketers who are members of the organization. This database can be accessed from their website: http://www.cheesesociety.org/associations/2382/membersearch.cfm. B1. Opening up the Market: How quotas work Historically, the United States has employed rigid dairy product import quotas to protect milk prices from international dairy markets. Prior to the FTA, tariffs for butter had soared to 1.996/kilo. In the case of the types of butter exported to the U.S. in 2004, their tariff without the FTA would have been 12.3 cents per kilo – equivalent to 5.2% – if they had entered below the global quota established by U.S. Customs, and U.S.D 1.541/kilo – equivalent to 65.5% – if they had entered over that quota.
As part of the Chile-U.S. Free Trade Agreement, the United States moved to tariff rate quotas for dairy products, which allow duty-free imports up to fixed amounts. Any additional imports are subject to very high tariffs. Under the FTA, initial duty-free quotas are established for dairy products, which are then increased 7-percent annually until all quotas are eliminated after 12 years.
Tariffs paid on goods entering the U.S. over the quota are U.S.D 1.531/kilo, U.S.D 1.996/kilo or U.S.D 1.865/kilo + 8.5% depending upon the specific product. These rates will be reduced gradually beginning in the 8th year of the agreement (2011). Figure 6 shows dairy quotas and the amount that they have been utilized since the FTA came into effect.2
Members of ExporLAC, the Chilean Dairy Product Exporters Association, currently work together to distribute quotas fairly among themselves, leaving about 10% of the quota, of which new members can take advantage. This is a difficult system to maintain, however. As demand and strategies change, it can be difficult to companies to adhere to previously agreed quota shares. B2. Quotas Spur Growth in Exports As expected, the dairy quotas established in the agreement have opened market niches in the U.S. The sector with the greatest growth during 2004 was dairy, especially exports of butter and cheese. Butter exports to the U.S. showed a strong increase, from U.S.D 329 and 215 kilos in 2003 to U.S.D 223,703 and 95,051 kilos in 2004, a growth of 67,895% in terms of value and 44,110% in terms of volume. Cream cheese jumped by nearly 6000% in terms of volume and over 7000% in terms of value. Another strong area of growth in 2004 was in the area of roquefort, camembert, gorgonzola cheeses, which jumped from U.S.D 222,678 and 18,212 kilos in 2003 to U.S.D 902,543 and 271,989 kilos in 2004, an increase of 305% in terms of value and 591% in terms of volume.
Figure 5. Export Growth in Selected Products FOB 2004 FOB 2003Tariff
Code Product In U.S.D
% change value
% change volume
04022118 Milk 1,383,690 30,306 4466% 5266% 04051000 Butter 223,703 329 67895% 44110% 04051020 Cream cheese 442,293 6,056 7203% 5982%
04069090 Roquefort, camembert, gorgonzola 902,543 222,678 305% 591%
Source: Lexis-Nexis
2 Melissa Rekas, “Evaluación de Comercio con Estados Unidos en el primer año de vigencia del Tratado de Libre Comercio Chile-EE.UU.,” AmCham Chile, March 2005.
AmCham Chile

U.S. Dairy Market Page 5 of 21
B3. Quota Utilization: Not Quite Meeting the Goal Dairy quotas in 2004 were 1432 tons for cheese, 828 tons for powdered milk, 489 tons for condensed milk, 300 tons for butters and 452 for other dairy products, which includes yogurts and chocolates. These quotas will increase by 7% percent each year until 2014. Beginning with the year 2015, these products will have tariff-free open access to the U.S. market. 3
In 2004, cheese, powdered milk and butter showed low usage of the quota while condensed milk and other dairy products met 84% and 93% of the quota, respectively.
Manuel Zamora of ExporLac predicts that dairy quotas will be substantially more utilized in the year 2005 with the exception of cheeses. It has been difficult for Chile’s cheeses to enter the us market, due to the fact that Chile’s main cheese export is gouda, while cheddar and mozzarella are the main cheese consumed in the U.S.
Figure 6.While it is difficult to pinpoint the causes of the underutilization of the dairy quotas, experts believe it is related to the lack of price competition in such products as milk and butter as well as a failure to produce products with high demand in the U.S., such as gouda cheese. Others speculate that it is related to a lack of understanding of the administration of the quota systems and the customs paperwork needed.
Quotas assigned to Chile under the FTA are administrated by the U.S. on a first-come, first-serve basis. That is, the respective quota is not distributed equally among Chilean exporters and U.S. importers, but instead assigned in the order that products arrive at U.S. Customs. Once the quota has been met, products enter under “outside of quota” status with tariffs specified for each product.
Receiving tariff-free treatment under the quota system is not automatic: exporters must be sure to complete the proper paperwork. Exporters who qualify should indicate the letters “CL” as a prefix to each HTS code for which they wish to receive preferential treatment.4
II. Understanding the U.S. Market A. Market Size and Trends The United States represents the world’s largest national dairy products market with value sales of over U.S.$50 billion a year.5 Although per capita dairy consumption in the U.S. is among the highest in the world, it has declined significantly from a peak of close to 390 kilos per capita in the early 1940s and, in 2003, was running at around 270 kilos per capita (as compared to 130 kilos in
3 Foreign Agricultural Service, USDA, “The United States and Chile Free Trade Agreement: Commodity Fact Sheet,” http://www.fas.usda.gov/info/factsheets/ChileFTA/dairy.htm 4 AgroEconómica, “Utilización de cuotas agrícolas TLC Chile-Estados Unidos,” http://www.agroeconomico.cl/frame_noticia.php?id=5851, September 2005. 5 EuroMonitor, “The World Market for Dairy Products.” Jun. 2005
AmCham Chile

Page 6 of 21 U.S. Dairy Market
Chile).6 Per capita consumption of fluid milk, historically the industries main component, has been one of the main factors for this decline. In 2004 milk consumption was down 49% from its 1945 peak. Although per-capita consumption of fluid milk has decreased, consumption of other dairy products has risen substantially. For example, over the last 30 years the market for cheese has exploded. Per capita consumption of cheese has more than doubled since 1975. In 2004 it reached a record high of 14.15 kilos per person, becoming the number one dairy consumer product in the nation.
U.S. Market at a Glance
Population:
• 295,734,134 (July 2005) Population growth:
• .92% (2005 est.) GDP per capita:
• $40.100 (PPP) Per capita dairy consumption:
• 270 Kg Main dairy imports:
• Cheese, Misc. Food Preparations, Concentrated Milk Proteins
Major import countries: • EU, New Zealand, Canada
Recent changes in consumer preferences that have affected the dairy industry include: a shift to a more health conscience diet, a greater demand for robust flavors, and a need for added convenience to supplement an increasingly on the go lifestyle. These shifts in consumer attitudes are seen as a positive for the dairy industry because they represent change and opportunity in this traditional marketplace. Across the board these changes have meant new and improved packaging, a wider product selection, and creative marketing. B. Products B1. Cheese
Figure 7
Increasing cheese demand has been one of the most significant forces shaping the dairy industry. According to a study by the California Milk Advisory Board Americans consumed 8.8 billion pounds of cheese in 2003 with a total market value of $39.9 billion.7 Per capita consumption has risen from
6.58 kilos in 1975 to 14.15 kilos in 2004.8 This 111% increase has been fueled by a string of positive news affecting this sector of the dairy industry. The primary catalysts that have contributed to cheese’s explosive growth include; the trend towards more robust and flavorful foods, more people eating away from the home, and the increasing popularity of cheese laden ethnic cuisine. A 2003 Cheese Omnibus Study conducted by Dairy Management Inc. concluded that 93% of all American consumers love the taste of cheese.9
6 USDA, Economic Research Service, “Food Availability” Dec. 2004 7 Silicon Valley Business Journal, “U.S. Cheese Consumption Up Sharply.” Sept. 2004 8 “Food Availablity” 9 Dairy Foods Magazine, “Cheese Trends 2004.” Mar. 2004
AmCham Chile

U.S. Dairy Market Page 7 of 21
Not surprisingly, taste is the most important attribute that Americans take into account when buying it. The increasingly sophisticated American palate is seeking quality cheese products across a wider array of tastes and textures. This trend has producers introducing bigger, bolder flavors, aged cheeses and uniquely flavored cheeses.10 American consumers have more access to a wider selection of cheeses in supermarkets and natural food stores than ever before. U.S. supermarkets, especially those located in middle to upper class neighborhoods, have begun to treat cheese like wine. They are educating consumers on its use and making them aware of new and popular flavors, countries and regions of origin, and brands.
Unlike fluid milk, increased away-from-home eating is actually benefiting cheese consumption. Restaurants, fast food, and sandwich shops have been capitalizing on the popularity of cheese by using a wide variety to enhance the flavor of their dishes. Surveys show that 83% of restaurants have cheese on the menu.11 The growing popularity of ethnic foods has also contributed to the growth in per capita cheese consumption. Italian and Mexican foods are rich in cheese ingredients and have altered the type of cheeses that Americans are consuming. For example, mozzarella has overtaken Cheddar as America’s most consumed type of cheese because of the popularity of pizza. Consumption of Mexican cheeses, which are found in tacos and other Mexican dishes, has more than tripled in the past 12 years. Cream cheese is the third most consumed cheese in the United States. This is mainly due to the increase consumption of bagels in the last decade. In 2003 per capita consumption of cream cheese reached 1.04 kilos, which is 4 times the 1970 level.12
Packaging and convenience are as important to this category as they are for the industry in general. Sliced, shredded, and cubed cheeses in user-friendly pre-packaged form have all seen significant growth. In fact, sliced cheese volume share is now the same as chunk/loaf, the historical leading form of packaged retail cheese. Both of these types commanded about 31% volume share in 2001.13
Specialty cheeses are perhaps the most dynamic part of the cheese industry and have contributed, in a large part, to the growth of cheese overall. In 2003 consumption of specialty cheese amounted to 385 million kilos worth an estimated $6.4 billion.14 This represents 9.2% of total cheese consumed and 16% of total sales. On a per-capita basis, specialty cheese consumption has grown five times faster than total cheese consumption during the past ten years.15 Farmstead cheese, a type of specialty cheese that is made exclusively from the farm’s herd of cows, has seen substantial growth in recent years as is being compared to the expansion of California
estate wines in the 1970´s.
" Specialty cheese is natural
cheese that commands a higher price than a commodity cheese
because of its high quality, limited production, value added production or packaging
techniques and/or value-added ingredients.”
Source: California Milk Advisory Board
Cheese has even been suggested by certain nutritionists and popular diets to be a source of weight loss. Cheese is one of the few dairy products that are naturally low in carbohydrates. This fact 10 Grocery Headquarters, “American consumers are flocking to the supermarket cheese . . .” Sept. 2003 11 Dairy Foods Magazine, “What’s New In Cheese Technology.” Aug. 2004 12 “Food Availability” 13 Dairy Foods, “Cheese – Packaging.” Aug. 2001 14 Silicon Valley Business Journal, “U.S. Cheese Consumption Up Sharply.” Sept. 2004 15 Dairy Foods Magazine, “Cheese Becoming a U.S. Specialty.” Jan. 2005
AmCham Chile

Page 8 of 21 U.S. Dairy Market
wasn’t too important until 2001 when two diets, Adkins and South Beach, exploded onto the American scene. These carbohydrate-counting programs have actively promoted cheese as part of a healthy and balanced diet. B2. Milk Milk sales have been declining for decades in the United States as a result of increased consumption of other beverages as well as more families eating out and preparing less food in the house. However, some analysts believe that fluid milk is poised to benefit from changes in consumer preferences, especially the trend towards healthier living. In an attempt to capitalize on the health trend McDonalds and Wendy’s fast food restaurants have inserted milk as a healthy substitute for soft drinks. This represents a part of the food service distribution channel that the milk industry has had a hard time breaking into. In 2004 McDonald's sales of milk beverages nationwide jumped from 625,000 units a week to more than 4.2 million units a week within less than two months after the new package and promotional efforts were introduced.16 Milk is also being touted in school districts in an attempt to curb soft drink consumption which studies have shown can lead to juvenile obesity. Lastly, an ad campaign that links drinking milk to losing weight is an attempt by the milk industry to have customers relate their product to a healthy and balanced diet.
Along with the emphasis on health and reaching more consumers, fluid milk is also introducing to the market new and more convenient packaging and a wider product selection. This new packaging is not only extending shelf life and opening up new avenues of distribution but it is also giving consumers more choices in sizes. Single serve flavored milk beverages have been a coup in the fluid milk industry and represents one of the many innovations that are changing this category.17 These smaller well-packaged units have allowed the industry to penetrate convenience stores and vending machines and compete more directly with other beverages. Although the fluid milk industry has had success advertising, including the popular “Got Milk” campaign, it is being significantly outspent by its competitors. In 2003 $120 million was spent of milk advertising compared to a combined total of $1,128.6 million by soft drinks, fruit beverages, sport drinks, and water.18
Use of most dry and condensed milks have declined as in-home food preparation has diminished and fresh milk has become cheaper and developed a longer shelf-life. In commercial food preparation, whey products have replaced some of the former uses of dry and condensed milk products.
U.S. Dairy Facts • Americans eat the equivalent of 10 acres
of pizza (and Mozzarella cheese) every day.
• Americans love Oreo cookies and milk. In fact, there are 2.8 million Oreo cookie and milk eating occasions every day. That includes 242 million litres of milk for dunking and drinking!
• Open the refrigerator in 96% of all households and you'll find a container of milk; 94% of all households have cheese.
• Total cheese per capita consumption was 13.83 kilos in 2003, which grew to 14.15 kilos in 2004.
• Forty percent of all cheese is served at food service places.
Source: Midwest Dairy Association
B3. Cultured Cultured dairy products have experienced strong growth in recent years. According to a new report from Packaged Facts, the 2004
16 Dairy Foods Magazine, “ . . . milk could be the bright spot in the beverage market this year.” Feb. 2005 17 Food and Drug Packaging, “Consumers demand convenience, choice in sizes and utility.” July 200418 Agricultural and Marketing Resource Center (AgMRC), Dairy Profile, May 2005
AmCham Chile

U.S. Dairy Market Page 9 of 21
$9.4 billion market was up 8.1% from $8.7 billion in 2003. Projected sales will grow to $15.5 billion by 2009.19
The main ingredient of this expansion has been drinkable yogurt. This product was introduced in 2001 and by 2004 garnered 10% of the yogurt market.20 Yogurt is perceived as a very healthy food item by most U.S. consumers, which have helped in its growth as the national trend towards healthy living continues. Also, increased interest about the positive health effects of probiotics on the human gastrointestinal system has solidified yogurts position as a health super food. The industry is continuing to innovate with different flavors and packaging options to sustain consumer’s interest. B4. Butter
Per capita butter consumption has remained remarkable steady over the last 30 years at around 2.04 kilos per person.21 Health concerns pertaining to the high content of animal fat and cholesterol in butter have had consumers reaching for substitutes such as margarine.
Figure 8. Chicago Mercantile Exchange Monthly Price Index – Dairy Commodities
Source: USDA/AMS
0.50
0.70
0.90
1.10
1.30
1.50
1.70
1.90
2.10
Jan Jul Dec Jan Jul Dec Jan Jul Dec Jan Jul Dec Jan Jul Dec Jan Jul Oct Nov Dec
2000 2001 2002 2003 2004 2005
$U
SD P
er L
bs.
0.50
0.70
0.90
1.10
1.30
1.50
1.70
1.90
2.10
Jan Jul Dec Jan Jul Dec Jan Jul Dec Jan Jul Dec Jan Jul Dec Jan Jul Oct Nov Dec
2000 2001 2002 2003 2004 2005
$USD
Per
Lb.
ButterBarrel CheeseWestern NFDM
19 Dairy Foods Magazine, “Cultured Dairy Foods: Demographically Desirable.” Apr. 2005 20 DSN Retailing Today, “Drinkable Yogurt.” Apr. 2005 21 “Food Availability”
AmCham Chile

Page 10 of 21 U.S. Dairy Market
B5. Organic Consumer demand for organic food has been strong across the food industry and dairy products are no exception. According to the Organic Trade Association’s 2004 Manufacturer Survey organic dairy has increased 22.5% each year between 1997 and 2003. The report also states that sales of organic dairy products reached $1.3 billion in 2003.22 Organic sales growth mirror consumer preferences relating to healthier and less processed food. American consumers are also demanding environmental friendly food products that are grown using sustainable farming practices. Organic dairy has come into the mainstream with more traditional supermarkets shelving organic dairy products.
“Certified organic are agricultural products that have
been grown and processed according to specific standards
of various state and private certification organizations."
Source: USDA
Organic milk only accounts for 3 percent of all milk sold in the United States however, while overall milk consumption is declining the annual growth rate for organic milk is predicted to be 34% in 2005.23 American farmers have been slow to increase production of organic milk because of high switching costs and certification requirements, which has lead to a situation where demand is outstripping supply. C. Local Production The United States is the second largest milk producer in the world behind India in terms of national production. The European Union has the largest regional production. Milk is produced in all 50 States; with total annual production around 77 billion kilos. Major milk-producing States are widely scattered across the West and North.
Figure 9. U.S. Milk Production – Top 8 States 2004
Source: USDA/NASS
Total Production = 77 Billion Kilos
Michigan3%
Minnesota5%
New Mexico4%
Idaho5%
Pennsylvania6%
New York7%
Wisconsin13%
California21%All Others
36%
22 Agricultural and Marketing Resource Center (AgMRC), Organic Dairy Profile, May 2005 23 Food & Drink Weekly, “Organic milk supply cannot cover demand.” June 2005
AmCham Chile

U.S. Dairy Market Page 11 of 21
Since 1993 California has been the nation’s leading milk producing state. California ranks first in the production of fluid milk, butter, ice cream, cottage cheese, whey protein concentrate, and second in cheese. In 2004, California produced 21 percent of the nation’s milk supply with an estimated 16.5 billion kilos. The state of Wisconsin is the number one cheese producer in the United States. A large percentage of the U.S. dairy industry consists of family operations that house a herd size of less than 100 cows. These producers often belong to cooperatives, which bring together the milk from its members for distribution to processors and manufactures. Although around 70% of dairy farms were family owned in 2002 there has been trend towards larger operations. In 2004, 77.7% of U.S. milk production came from operations of 100 cows or more, which represents a 25% increase since 1993. The number of milk cows on farms during 2004 was 9.01 million, most of which were Holsteins.24 Average production per cow in 2004 was 18,957 pounds, an increase of 197 pounds over 2003. Milk cow operations totaled 81,440 in 2004, with an average number of cows per operations of just over 110. In California, which houses the nation’s largest dairy industry, average size of a dairy herd in 2004 was 825 cows. Much of the milk produced in the United States meets fluid grade milk standards (Grade A in most States). Only about one-third of the milk is actually processed into fluid milk and cream products, while the other two-thirds is used to manufacture a variety of other dairy products. Almost half of the milk supply is used to supply about 9 billion pounds of cheese each year. Output of most varieties has grown steadily for many years, as cheese has become a staple in the American diet.25
D. Exports
Dairy exports reached $1.5 billion in 2004 and have increased further in 2005. The United States Department of Agriculture reports that dairy exports between January and September of this year have already reached $1.2 billion.26 This represents a 23% increase during the same time period in 2004. The U.S. exported dairy products to 145 countries in 2004. Mexico is the principle destination followed by Canada and Japan.
24 Agricultural and Marketing Resource Center (AgMRC), Commodity Dairy Profile, May 2005 25 USDA – Economic Research Service (ERS), Dairy Background, July 2004 26 USDA – Foreign Agriculture Service, U.S. Agriculture Exports, Oct. 2005
AmCham Chile

Page 12 of 21 U.S. Dairy Market
Figure 10. Destination of U.S. Dairy Exports, 2004
Source: USDA/FAS
Indonesia3%
Vietnam2%
Cuba2%
Malaysia2%
China4%
Korea3% Philippines
5%
Japan7%
Canada17%
All Other(135 Countries)
29%
Mexico26%
Leading dairy export products include nonfat dry milk, cheese, whey products, and miscellaneous food products. All of these products made gains in export value in the first 9 months of 2005 as compared with the first 9 months of 2004.
0
50
100
150
200
250
300
350
400
450
500
Non
fat D
ryM
ilk
Whe
yP
rodu
cts
Che
ese
Mis
c. F
ood
Pro
duct
s
Cas
ein
Dry
Who
leM
ilk
Con
d. &
Eva
p.
Yog
urt
$ M
illio
n
01/2005 - 09/200501/2004 - 09/2004
Figure 11. Value of U.S. Dairy Exports, 01 – 09/2005 vs. 01–09/2004
Source: USDA/FAS
E. Imports In 2004, the United States imported dairy products from 87 countries. The European Union was the leading source of dairy exports, accounting for 44% of the total value imported, followed by New Zealand with 19% and Canada with 15%. Significant amounts of dairy products are also brought in
AmCham Chile

U.S. Dairy Market Page 13 of 21
from Australia, Switzerland, and Mexico. Chile ranks 33rd in U.S. dairy imports, with only 0.2% of the value imported.27
Figure 12. U.S. Dairy Trade
Source: USDA/FAS
0
500
1,000
1,500
2,000
2,500
3,000
2000 2001 2002 2003 2004 2005 est.
$Mill
ion
ExportsImports
Cheese, dairy-based food preparations and concentrated milk proteins made up 89% of import value in 2004.28 Over the past 10 years, the value of U.S. dairy imports has increased from $1.1 billion to $2.4 billion. The value of cheese imports in 2004 was five times the value of exports. In terms of value, Italy leads U.S. imports for cheese out of 60 countries. New Zealand leads in volume imports. Cheeses imported from Europe tend to have high unit values than cheese exported from New Zealand and Australia. F. Distribution Channels Importers and brokers are an important first step for dairy product entry into the United States. They are often very knowledgeable about prices and quality and are able to evaluate a product in a relatively short period of time. Dairy trade shows bring together businesses from all levels of the distribution channel and provide important networking opportunities to locate these distributors, brokers, importers, and producers. While some exporters have had success in importing directly to retail businesses, primarily with Hispanic mini-markets, it is usually more difficult to accomplish a relationship with these companies.
27 Foreign Agricultural Service, USDA, “U.S. Trade Imports – FAS Commodity Aggregations” http://www.fas.usda.gov/ustrade/U.S.TImFAS.asp?QI= , November 2005. 28 Edward V. Jesse and William D. Dobson, “U.S. Dairy Trade Situation and Outlook,” Babcock Institute Discussion Paper No. 2005-1, http://babcock.cals.wisc.edu/downloads/dp/2005_01.en.pdf, 2005.
AmCham Chile

Page 14 of 21 U.S. Dairy Market
Figure 13. U.S. Distribution of Dairy Products
EXPORTER
IMPORTER/BROKER
SMALL RETAIL DISTRIBUTOR
HOTEL/RESTAURANT/ FAST FOOD
INSTITUTION SUPERMARKETS NATURAL FOOD STORES
CONSUMER CONSUMER CONSUMER CONSUMERCONSUMER
FOOD SERVICE RETAIL
OTHER
CONSUMER
G. Retail Prices
Figure 14. Retail Prices For Selected Dairy Products
Dairy Product Size Range of Prices* (U.S.$)
Milk
Milk Low Fat 1% 1/2 Gal (1.89 L) 2.29 - 2.79
Milk Organic 1% Low Fat 1/2 Gal (1.89 L) 3.50 - 4.59
Milk Whole 1/2 Gal (1.89 L) 2.29 - 3.50
Milk Condensed 14 oz (414 mL) 1.99 - 3.19 Cheese
Cheese Cream 8 oz (237 mL) 1.99 - 2.49
Cheese Parmesan 8 oz (237 mL) 4.39 - 5.39
Cheese Gouda 8 oz (237 mL) 3.49 - 6.74
Cheese Cheddar 8 oz (237 mL) 4.49 - 6.99 Yogurt
Yogurt Drinkable 10 oz (295.7 mL) 1.59 - 2.49 Butter
Butter 8 oz (237 mL) 2.59 - 3.49
*Prices Taken From San Francisco and Chicago Area Supermarkets
AmCham Chile

U.S. Dairy Market Page 15 of 21
F. Opportunities Tapping the growing Latino market As the largest ethic minority in the United States, Hispanics total 35.5. million, or 12.5 percent of the nation’s demographic population.29 With a buying power of an estimated $421 billion, this market presents a huge opportunity for dairy sales. Hispanic food sales are expected to grow 5.5% per year and the Hispanic segment is projected to grow 10 times the rate of non-Hispanics over the next fifty years. Hispanic culture, style and cuisine is also increasingly more integrated into the American lifestyle, causing the market for Hispanic foods to reach beyond the Hispanic population. Figure 15.Cities like New York, Chicago, Los Angeles, and Houston have large and often concentrated Hispanic populations, with population ranging from 25 to almost 50 percent of total city population. Hispanic consumers tend to have larger families and are rapidly advancing into the middle and upper-middle class. However, it is important to remember that not all Hispanic populations are alike. Communities in Miami are very different from those in New York and must be marketed to differently. Hispanics express stronger brand preference and loyalty than Anglos and also expect that products try to communicate to them in Spanish.30
Deborah Gonderil of Strategy Research Corp. suggests the following themes to achieve successful marketing efforts:
• Maintain advertising focus on the family and community, instead of individual themes that work with other American segments.
• Understand the importance of personal appearance and fashion. Ads should feature well-groomed men and women.
• Share their pride in heritage and family through community events sponsorship. Think exotic to add value Competing with Argentina and Uruguay in terms of price is a considerable challenge. How can Chile compete? In a highly informed market like the United States, producers and exporters should consider marketing more value-added products. Consumers in many markets are also willing to try new things. Products should offer something different than the average dairy “commodity”. For example, Jalepeño Jack cheese could be attractive in markets with high Mexican populations. Condensed milk could be packaged in single- and family-serving sizes to improve ease of use. Products that offer higher convenience are also highly popular, such as cheese that are shredded, cubed or come in resealable packaging. These products can have an impact in the high income, high sophistication segments.
29 U.S. Census Bureau, “The Hispanic Population: Census 2000 Brief,” May 2001. 30 Institute of Agriculture and Natural Resources, “The Specialty Cheese Market,” University of Nebraska – Lincoln, October 2001.
AmCham Chile

Page 16 of 21 U.S. Dairy Market
Going Kosher Being able to certify your products as Kosher opens up a new opportunity for your product. The word “kosher” means that According to Jewish law, certain foods have been deemed fit or correct to eat. These foods are considered kosher. Consumers often associate kosher foods with a promise that the product has gone through additional quality processes. In fact, most American consumers who buy kosher food are themselves not even Jewish. According to figures from Integrated Marketing Communications, a New York City-based marketing firm specializing in the kosher food sector, the total U.S. kosher market is about five million people, two-thirds of which are not Jewish. Some groups eat kosher for religious reasons. Others choose kosher due to a perception that it healthier.31 Companies like Dannon Yogurt, Korbel Champagne Cellars and Beech-Nut Baby Food witnessed significant increases in sales upon being certified as kosher. 32
Know what the market wants American consumers do not show a high demand for Chile’s primary cheese export, Gouda. Chile must expand its production and exports of cheeses like Parmesan in order to meet the needs of the market. This could be an asolution as it would not require significant additional capital investmentcase of most companies.
ttractive in the
Figure 16. Kosher-certified
symbols
G. Competitive Threats and Obstacles Finding a place in the market takes time Chile does not have a history of cheese. As Spain has proven with their recent success with cheeses to the U.S. market, it can take over five years for cheese to receive recognition and become popular. Chile must also be careful to differentiate itself from Argentina, whose cheese are primarily known as inexpensive. The walls are coming down Free trade agreements almost seem like an everyday occurrence in today’s world. Chile is positioned very well with its current free trade agreements with Mexico and the U.S., among others, that allow it to compete with dairy exporters Argentina and Uruguay. However, it may be only a matter of time before these countries too find tariffs eliminated between themselves and Chile’s biggest clients. Chile’s dairy industry must act now to find its niche in the market before the competition grows even more stiff, considering options like reduction in milk prices or penalties for summer milk surpluses so that it can be exported competitively. III. Government Regulations Under requirements of the U.S. Federal Food, Drug and Cosmetic Act, food importers importing food products into the United States are charged with the responsibilities of ensuring their products are safe, sanitary, and labeled according to U.S. regulatory requirements. FDA does not approve, certify or otherwise license individual products, importers, manufacturers, processors, labels, or distributors. Importers are free to import FDA-regulated food products into the United States without prior sanction from FDA, other than the facility-registration and prior-notice requirements noted in the next paragraph. However, in so doing, they assume the responsibility for assuring the product meets the requirements outlined above and detailed below. FDA can take various steps to remove unsafe, unsanitary, or mislabeled foods from the marketplace, and, imported food products are subject to FDA inspection at the time of import to ensure their compliance with U.S. requirements.
31 Lorne Opler, “Noshing Kosher,” Austin Chronicle, http://www.austinchronicle.com/issues/dispatch/2000-09-29/food_feature2.html, September 29, 2000. 32 “The Specialty Cheese Market”
AmCham Chile

U.S. Dairy Market Page 17 of 21
A. Register with the FDA Recent rules imposed by the U.S. Public Health Security and Bioterrorism Preparedness and Response Act of 2002 require all food facilities producing, processing or storing food products intended for sale in U.S. commerce to register with FDA. Registration can be performed on the internet, and is free of charge. For foreign facilities, a "U.S. agent" must be specified at the time of registration. The agent may be any adult who resides in the United States. For information and instructions on how to register a facility, please see FDA's web page on the subject at the following link: http://www.cfsan.fda.gov/~furls/ovffreg.html. The new Act also requires that importers provide prior notice to FDA for each import shipment of food products. For information about and instructions on how to provide prior notice, click on the following link: http://www.cfsan.fda.gov/~pn/pnoview.html. Help with the registration and prior-notice process is available from the FDA Help Desk at 1-800-216-7331 or 866-521-2297; via email from [email protected]. B. Know your sanitary procedures The FD&C Act requires that foods sold in U.S. commerce must not bear or contain any poisonous or deleterious substances which may render them injurious to health, nor consist in whole or in part of any filth, putrid, or decomposed substances, or otherwise be unfit for food. (Examples include evidence of rodent or insect infestation, or the presence of pesticides prohibited in foods or amounts of allowable pesticides in excess of established tolerances.) Foods must not be prepared, packed, or held under unsanitary condition whereby the products become contaminated with filth, or rendered injurious to health. A typical FDA inspection of an imported product would look for signs of filth, infestation or decomposition. [Guidelines with respect to this can be found at http://www.cfsan.fda.gov/~dms/dalbook.html.] In general, processors of food products sold in U.S. commerce should be familiar with the U.S. Current Good Manufacturing Practices for foods (CGMPs). This set of U.S. federal regulations sets forth basic considerations manufacturers and distributors should take into account to keep food clean and safe during manufacturing, packing and holding. The CGMP regulations can be accessed at the web link http://www.cfsan.fda.gov/~lrd/part110t.html. Scroll to the bottom of the page and click on "Full Text" to view the regulations on-screen. C. Be aware of labeling and packaging requirements Provisions of the Act, the U.S. Fair Labeling and Packaging Act, and the Nutrition Labeling and Education Act require that retail packages and containers of food products sold in U.S. interstate commerce bear labels in English (Spanish acceptable in Puerto Rico) that include specific information:
• the identity of the product, • the name and address or phone number of the responsible firm (may be the manufacturer
or distributor, foreign or domestic), • a list of ingredients in descending order or predominance in the product, • the net weight of contents in both English and metric terms, and • in most cases nutritional information, presented in specific format required by regulation
designed to ensure that the information is accessible to consumers under customary conditions of purchase and use.
Detailed information about U.S. labeling requirements can be obtained from FDA's web page on the subject at the web address http://www.cfsan.fda.gov/~dms/lab-ind.html. The first link on the main subject index of this page connects to the U.S. regulations on food labeling, which include several example labels. The second link is FDA's "Food Labeling Guide," which was prepared to assist manufacturers in preparing labels that meet the regulatory requirements. Please note that U.S. Customs Service regulations require that retail packages of imported food products include a statement specifying the country-of-origin of the product. A typical FDA inspection of an imported
AmCham Chile
Page 18 of 21 U.S. Dairy Market
food product would check retail product labels to ensure their compliance with these U.S. requirements. Bulk containers of food products offered for import into the United States should include the following information in English on the outside of the container:
• the identity of the product, • the name and address or phone number of the responsible firm (could be the distributor,
manufacturer, importer, import agent, or consignee), • the net weight of contents in English measurement (pounds/ounces), and • a list of ingredients contained in the product, and • a statement on the label specifying the country of origin of the product.
FDA has issued food-security guidance for importers designed to protect imported food shipments against the potential for bioterrorism. You can read this guidance at this link: http://www.cfsan.fda.gov/~dms/secguid7.html. D. Give prior notice of shipment arrival When a food shipment is imported into the United States, the shipment must be declared by the importer or import broker to the U.S. Customs Service at the port of entry by the filing of an "entry notice" and acquisition of a bond. The Customs Service then will notify FDA staff of the presence of the shipment. FDA may inspect and sample the shipment to ensure its compliance with U.S. requirements. More detailed information on FDA import procedures can be found on the agency's web page on Imports and Exports at the web link http://www.cfsan.fda.gov/~lrd/imports.html. The second item on this page, "FDA Import Procedures," contains a detailed flow-chart of the process. Additional information on the FDA Import and Import Inspection system is available from the link http://www.fda.gov/ora/import/default.html. Importers will need to know the FDA product code for your products in order to complete the on-line Import Prior Notice procedure. To determine the appropriate product code(s) for your products, please consult the FDA webpage on developing product codes at http://www.accessdata.fda.gov/SCRIPTS/ORA/PCB/PCB.HTM. Information on U.S. Customs forms, procedures, bond acquisition, duties, if any, and country-of-origin labeling requirements may be obtained from any Customs Service office or from that agency's web site at http://www.customs.treas.gov/. VI. Conclusion: Tips for Success in the U.S. Market
Develop a clear export strategy. The U.S. market is not one that you just dive into. Make important decisions from the beginning about geographic regions, production levels, packaging, etc.
Look to the future. Tonnage restrictions will be lifted as of 2015, so Chilean companies must be prepared with developed markets to take advantage of increased export possibilities. Developing an export market may mean losses in the short term but once the market and the critical mass has been developed, then profits should be assured. Specialty cheeses offered a profitable and ongoing future, as such companies should investigate investments in additional plants to be sure they are producing just the right product in just the right way.
Visit the customer. Haven’t been to the U.S.? Check out U.S. supermarkets. See how the products are presented. Familiarize yourself with competitors, supermarket layouts, and marketing strategies.
Have a presence at fairs and trade shows. Trade shows are filled with networking opportunities!
AmCham Chile

U.S. Dairy Market Page 19 of 21
Quality is the bare minimum. Quality alone will not set you apart in the U.S. market. Buyers expect that excellent quality is the bare minimum of your product. What else do you have to offer?
Tell your story. Chile as a country sounds exotic and intriguing, giving it good market recognition. Have your product tell a story. Maybe you are exporting a goat cheese that comes from a beautiful valley in northern Chile. Let that story come through in your marketing and in the taste. Let the image of Chile as a country work in your favor.
Professional marketing materials. Good product presentation shows client that you mean business. Marketing products should be extremely professional and highlight the special aspects that your product has to offer. ProChile’s recent market profile of cheese suggests educating customers on how to use the cheese, with recipes and preparation tips.33
Be consistent and reliable. A popular English phrase is “time is money.” Business meetings in the U.S. start on time and clients expect you to respect that. Also, when discussing shipment dates, invoicing, etc., make it a point to “under-promise and over-deliver”.
Produce efficiently. The cost structure in both Argentina and Uruguay is much lower than in Chile. Companies must produce efficiently and seek lower production costs to be competitive.
Know the rules. Images are fragile in the U.S. Be sure to follow all safety and sanitary regulations.
To read testimonials of Chilean companies currently exporting to the United States, visit the Spotlight of the December 2005 bUSiness Chile magazine at www.businesschile.cl. Contact Amanda Jefferson in the Research Department of AmCham Chile with any questions: [email protected].
33 ProChile New York, “Perfil de Mercado Producto: Queso en los Estados Unidos,” July 2005.
AmCham Chile

Page 20 of 21 U.S. Dairy Market
V. Useful Resources AmCham Resources Export Guide http://www.amchamchile.cl/pdf/guia_de_aduanas_oct_2001.pdf Anti-bioterrorism Information http://www.amchamchile.cl/pdf/FactSheet-BioterrorismoFDA_.pdf How to perform due diligence on a U.S. company http://www.amchamchile.cl/Materiales/biblioteca/Cómo%20obtener%20información.pdf Cheese Distributors/Brokers/Importer/Marketers The American Cheese Society database of cheese distributors, brokers, importers, and marketers. http://www.cheesesociety.org/memblists.htm. List of companies with dairy product import licenses http://www.fas.usda.gov/itp/imports/diaryimports05/dil05.htm. Government Organizations United States Department of Agriculture (USDA) http://www.usda.gov/ Food and Drug Administration (FDA)http://www.fda.gov/ Government Regulations Register with the FDA http://www.cfsan.fda.gov/~furls/ovffreg.html U.S. Current Good Manufacturing Practices for foods (CGMPs) http://www.cfsan.fda.gov/~lrd/part110t.html FDA sanitary requirements http://www.cfsan.fda.gov/~dms/dalbook.html U.S. labeling requirements http://www.cfsan.fda.gov/~dms/lab-ind.html FDA product code information http://www.accessdata.fda.gov/SCRIPTS/ORA/PCB/PCB.HTM U.S. Customs Service http://www.customs.treas.gov/ Information for Importers Information about FDA prior-notice requirements for importers http://www.cfsan.fda.gov/~pn/pnoview.html FDA food-security guidance for importers http://www.cfsan.fda.gov/~dms/secguid7.html FDA import procedures
AmCham Chile

U.S. Dairy Market Page 21 of 21
http://www.cfsan.fda.gov/~lrd/imports.html FDA Import Inspection system http://www.fda.gov/ora/import/default.html Associations Cheese Importers Association of America 488 Madison Ave., 16th Floor New York, NY 10022 Tel: 212/753-7500 American Butter Institute 2101 Wilson Blvd. Suite #400 Arlington, VA 22201 Tel: 703/243-5630 International Dairy Foods Association http://www.idfa.org National Dairy Council http://www.nationaldairycouncil.org American Dairy Science Associationhttp://www.adsa.org Diary Foods Magazine http://www.dairyfoods.com/CDA Foreign-Type Cheesemakers Association 1211 17th Ave. Monroe, WI 53566 Tel: 608/325-2507 Fairs and Trade Shows Fancy Food Show http://www.specialtyfood.com/do/fancyFoodShow/ExhibitorList International Dairy-Deli Bakery Trade Show http://www.iddba.org/
AmCham Chile