Embed Size (px)
Citation preview

Current Issues in Asia Pacific Foreign Direct Investment

All text © the Authors, 2015.Published by The Australian APEC Study Centre at RMIT.ISBN: 978-0-9944036-0-5 (Print)ISBN: 978-0-9944036-1-2 (Electronic)
Compiled by Proof Publishing www.proof-publishing.com.au
Current Issues in Asia Pacific Foreign Direct Investment
Chapter 1. Introduction and overview Errol Muir, Douglas Brooks, David Treisman
1
Chapter 2. Investment trends and policy issuesMasataka Fujita
10
Chapter 3. Foreign direct investment, supply chain creation, and structural transformation: lessons for APEC Theodore H. Moran
21
Chapter 4. Connecting the dots between international trade and investment regulation, investment climate reform and development: the World Bank’s investment reform map Roberto Echandi
32
Chapter 5. Asian noodle bowl of international investment agreements: how to mitigate the problems?Julien Chaisse and Shintaro Hamanaka
54
Chapter 6. Investor–state dispute settlement cases in APEC – the recordMartina Francesca Ferracane
61
Chapter 7. Survey of the impact of bilateral investment agreements on foreign direct investmentChristian Bellak
71
Chapter 8. Measuring improvements in the investment climate: the use and abuse of indicatorsJonathan Coppel
79
Chapter 9. Investment policy in APEC: developments and a look forwardBekzod Abdullaev, Douglas Brooks, Ken Waller
88

1
Errol Muir1
Douglas Brooks2
David Treisman3
I. PurposeThis book aims to stimulate thought and discussion on a number of important issues relating to foreign direct investment (FDI). Each chapter is written by an expert or experts in the field, and each can stand alone in the perspectives it offers on FDI issues. However, taken together, a number of key themes emerge, reflecting policy issues which impact busi-nesses in making FDI and which are being grappled with by government negotiators and regulators. The themes reflect many of the issues under constant consideration by APEC and raised by the APEC Business Advisory Council in its recommendations to APEC economy leaders. These issues – the need for continuing trade and investment liberalisation, the need for policy openness, the need to build effective global value chains and enhance supply chain connectivity, the need to integrate services through the region and to accelerate and facilitate infrastructure investment, and the need to support SMMEs in their development – are all touched on in this book. This introductory chapter aims to summarize the broad direction of the articles and to draw out the emerging themes.
A number of broad themes emerge from the articles. The importance of FDI to most APEC (and global) economies emerges in the statistical review (Chapter 2) and the discussion of the World Bank investment promotion map (Chapter 4). The importance of statistical information and research to facilitate effective analysis and policy-making is canvassed in Chapters 7, 8 and 9. A crucial message that emerges from Chapters 3, 4 and 8, is that while improvement in the “ease of doing business”, as reflected by indicators in recipient economies is very important, it is a necessary, though not a sufficient condition to encourage effective and increased FDI. Countries cannot simply improve their business environment and expect to see FDI increase with productive spillovers into the local economy. Chapters 3 and 4 canvas the important role of investment promotion. The importance of light-touch, rather than heavy touch, investment regulation is a common theme in many of the chapters in this book. Chapters 5, 6 and 7 underline the importance placed on investment treaties as a means of encouraging FDI and canvas the limitations of these tools and the complications that develop through their use.
Importantly, conventional wisdom abo ut the effectiveness of often used regulatory mechanisms to encourage in-vestment and spillovers into the host economy are questioned. Chapter 7 raises questions about the efficacy of bilateral investment treaties as a stand-alone means of encouraging investment, Chapters 3 and 4 suggest that techniques com-monly used to encourage spillovers, such as enforced joint venture arrangements, local content requirements et cetera, have been ineffective. Rather than these “heavy form” industrial policies, Chapters 3 and 4 suggest light form regulation and infrastructural support is more likely to be effective. And finally, the approach in some economies of supporting or requiring the engagement of small enterprises as beneficiaries of FDI is called into question in Chapter 3, with the evidence suggesting that medium and large enterprises are more likely to be in a position to benefit from participating in the FDI global value chain.
II. Statistical and policy issuesTo set the scene for discussion on policy, Chapter 2 by Masataka Fujita provides a statistical picture of global and APEC FDI flows in order to better understand the significance of policy issues in the APEC region and the need for change in FDI regimes. This Chapter is drawn in significant measure from the UNCTAD World Investment Report released in June 2015. The nature of FDI flows is of particular importance to APEC. Multinational enterprises’ (MNE) foreign af-filiates contribute approximately 10 percent of total government revenues, FDI narrows the investment gap and services contribute 63 percent of global FDI stocks. This has placed investment policy reform firmly on the regional policy agenda. However, many of the challenges faced by policy makers remain, principal of which is the safeguarding of a State’s right to regulate pursuant to its development objectives.
1 Editor, Publications, The Australian APEC Study Centre at RMIT University; Program Director, Bachelor of International Business, Monash University.2 Principal Research Fellow, The Australian APEC Study Centre at RMIT University.3 Lecturer, Bachelor of International Business, Monash University.
Chapter 1. Introduction and overview
2
Current Issues in Asia Pacific Foreign Direct Investment
Finding the balance between attracting FDI flows and meeting development objectives is central to Fujita’s presentation of the statistical picture of investment trends and policy issues in APEC. UNCTAD’s World Investment Report 2015 argues that international investment agreement (IIA) regimes are at a significant crossroad as the pressing need for reform is supported by all stakeholders. With such broad based support, the processes of reforming IIA regimes are at a moment in their history in which efforts can be directed to synchronization of actions at the national, bilateral and regional levels.
The statistical evidence presented by Fujita on FDI flows and the broader macroeconomic conditions support this ar-gument. Global FDI inflows are expected to grow by 11 percent in 2015 to $1.4 trillion. Barring any major economic or political event, similar FDI inflows are forecast for 2016 and 2017, $1.5 trillion and $1.7 trillion respectively. This upturn in global FDI flows has been largely buoyed by developments in the macroeconomic environment, most notably the strengthening economic growth in developed economies, lower oil prices, accommodating monetary policies and continued investment liberalisation and promotion. Parallel to these developments is the notable 33 percent rise in the share of MNEs intending to increase FDI expenditures in the next three years.
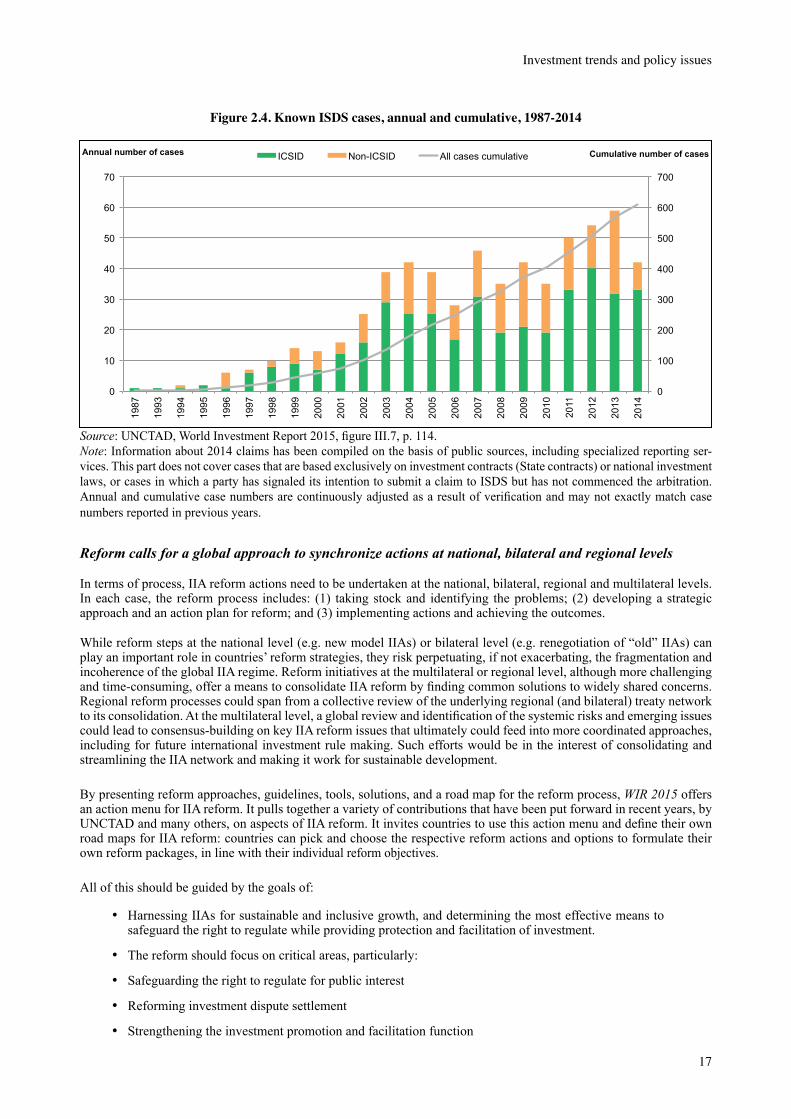
The message is of particular relevance to the APEC region which now accounts for more than half of the world’s FDI inflows. In accordance with global trends, APEC countries’ investment policy measures continue to be predominantly geared towards investment liberalisation, promotion and facilitation with significant expansion of IIA efforts at a regional level. However, as recent statistics indicate, APEC FDI flows and specific policy efforts vary between sub-regions and member countries.
East and South-East Asia experienced sizeable increases in FDI inflows and growth in 2014. Prominent host econo-mies following this trend were China (the world’s largest FDI host economy), Hong Kong, Singapore and Indonesia. Underpinning these flows have been policy efforts to deepen regional integration and connectivity in terms of regional infrastructure investment and transport industries. Many of these efforts have been undertaken with major equity partic-ipation by regional MNEs based in Hong Kong, China, Japan and Singapore. Indeed FDI by developing countries now accounts for more than one-third of global FDI outflows.
FDI flows to APEC’s Latin American members were mixed in 2014. Mexico’s FDI declined on the back of a 78 percent decline in cross-border merger and acquisition activity. However, Chile successfully avoided South America’s general downward trend in FDI flows.
Russia’s FDI flows fell by 70 percent in 2014 on the back of negative domestic growth prospects, international sanctions and the pressures from international financial markets and low commodity prices. Meanwhile, Canada and the United States experienced modest increases in FDI outflows.
The variation of FDI flows and specific policy efforts in the APEC region lends further weight to the argument that IIA reform that synchronises actions at the national, bilateral and regional levels could be of great benefit to member nations. The question that remains is how best can these reforms be supported through the APEC framework?
III. Investment policy issuesFDI can offer opportunities for the foreign investors, their home countries, and the host (recipient) countries. It can provide capital where there is a shortage, creating jobs, transferring technology, opening markets, linking to global value chains, and expanding the range of goods and services available for consumers. It can contribute to macroeconomic price, wage, and foreign exchange stability, contribute to government revenue, and improve the balance of trade through export enhancement. It can also do the opposite of all these things. For that reason there is a keen interest in understand-ing the interactions between FDI and the economic context in which it takes place, and the ways in which policies can strengthen the benefits and mitigate the costs of such transactions.
For many developing countries, which typically have relatively more labour than capital, FDI provides a source of additional capital that is generally less volatile than portfolio investment flows since it is less easily reversible. The additional capital can make labour more productive, allowing higher wages and incomes, which in turn allow greater consumption, creating a larger market, attracting more FDI, and so on in a virtuous cycle. In addition, the capital of FDI is often accompanied by managerial and technological innovations which may not be present in the host country, by marketing and distribution networks that can boost exports and foreign exchange earnings, and by expanding linkages to local suppliers, leading to multiplier effects on host country income and employment. As Theodore Moran points out in Chapter 3, in past decades, there has been a movement up the value chain, away from use of low-skilled labour in FDI operations in developing countries. The additional output and employment also affords the government a chance to increase its tax revenue and offer a greater range of public services such as health, education, and essential infrastruc-
3
Introduction and overview
ture. By 2014, developing Asia accounted for more than two-thirds of total FDI inflows to developing economies (see Chapter 2). However, as many of the Chapters in this book discuss, both the attraction of investment, and the spillover effects into the host economy, rarely occur as a matter of chance.
For developed countries, which typically have relatively more capital than labour, FDI offers a chance for their investors to deploy capital where the rate of return can be higher, to reach new markets (particularly where there are high tariffs on imports or other barriers to trade), to source production inputs efficiently from wherever they may be available at lowest cost, and to reach new sources of ideas and innovations for research and development.
The APEC region is composed of both developed and developing economies, with tremendous potential for benefit-ing from intraregional FDI. In recent decades this has become most evident in the growth of international production networks connecting some stages of production processes in East and South-East Asian economies with each other and with final markets, especially in North America and Europe. Early stages in the development of these internation-al production networks (or global value chains), particularly in the electronics and automotive industries, originated with FDI primarily from Japan and the United States to take advantage of lower cost labour in the region’s developing countries, often to produce for export markets. Participation in these networks helped the region’s rapid growth, leading to the present situation where an increasing share of FDI outflows now originate from economies that were formerly large beneficiaries of inflows (see Chapter 2). Thanks in part to their rapid export expansion, APEC economies are also well connected with other markets around the world.
If FDI began as a substitute for trade (manufacturing closer to customers and behind tariff walls), over time it has grown to support trade, often receiving preferential treatment when generating exports from the recipient economy. In this context, investment policy and trade policy frequently became linked, with investment chapters included in international trade agreements. In today’s global economy, capital flows exceed trade flows and international investment agreements are often considered valuable in their own right, though, as argued in Chapter 7, there remains doubt about how effective IIAs are, as a stand-alone mechanism, in increasing FDI (see below).
Any discussion of FDI would be incomplete without some discussion of comparative advantage. Comparative advan-tage has always been seen as an underlying driver of FDI. However, the composition of what constitutes the compar-ative advantage, most notably in terms of scope and quality, matters for economic growth and welfare (Hausmann et al. 2007). This has significant implications for development policies, for indigenous entrepreneurs and for foreign investors, as attracting foreign capital alone is not sufficient to maximize potential gains. For this, FDI must be directed toward novel and higher-skill-intensive sectors.
Theodore Moran (Chapter 3) takes this argument one step further. He demonstrates that directing FDI toward higher-skill -intensive sectors is an outcome of a successful interaction between investment and industrial policies, infrastructure and investment promotion that ultimately culminates in linking the host economy into FDI global supply chains. Moran refers to this result as dynamic comparative advantage: a process of structural transformation that creates industries that are viable and competitive when exposed to international competition.
Dynamic comparative advantage through FDI is of particular relevance to many APEC member countries who are actively seeking an alternate route to sustained development that reduces their reliance on export-led growth. However, the path to dynamic comparative advantage through FDI is complicated by market failures and other impediments. The most common underlying causes of these market failures are, first, information asymmetries whereby an investor does not fully understand the motives of host country governments and regulators and needs to make judgments based on experience and things as they are. The second form of market failure relates to appropriation problems where, once an investment is committed, host governments might be more tempted to change the rules of the game to appropriate more of the benefits from the investment. In this regard, Moran highlights that improving a nation’s doing-business indicators is a necessary but not a sufficient condition for attracting FDI in middle-skilled activities and that overcoming informa-tion asymmetries needs to be addressed in order to induce cost discovery of first-mover investors.
Through the use of three case studies, Moran demonstrates that investment promotion combined with ‘light-form’ industrial policies are key to increasing the productivity and reliability of (medium and larger) indigenous companies and in creating backward linkages (spillovers in the form of vertical local supplier networks to multinational investors). These light form policies are focused on improving infrastructure, providing increased information, promotion of opportunities and development of human capital, together with improved financial systems (access to credit) and vendor development. Combining infrastructure and investment policy in this light-form approach is more likely to provide an environment in which middle- and higher-skill foreign firms can set up affiliates that seamlessly integrate into the global supply chain of their parents. This, Moran concludes, is an effective and proven route to increasing economic growth
4
Current Issues in Asia Pacific Foreign Direct Investment
and expanding economic welfare and contrasts with demonstrated failure of the contrasting ‘heavy-form’ approaches of imposed joint venture requirements, local content policies and the like.
In Chapter 4, Roberto Echandi discusses a framework developed by the World Bank for developing and assessing investment policies and argues that for countries to gain maximum benefit from FDI, different policy approaches are required depending on the type of investment involved. This chapter mirrors many of the arguments made by Theodore Moran in the previous chapter in arguing that the benefits of FDI do not automatically flow to host economies. Echandi argues that effective policy development needs to stem from an effective investment vision and strategies that relate to investment attraction, establishment, retention and the development of linkages and facilitating spillovers into the domestic economy.
The World Bank framework addresses three key ideas for an investment policy framework. First investment policy is not about choosing between foreign and domestic investment; rather it involves connecting both these through spill-overs into global value chains. Second, foreign investment depends on the development of a relationship between the foreign investor and the host country encouraging retention and linkages with the domestic economy. And thirdly, the framework notes that not all types of investment are the same: different categories of investment have different effects and require different policies.
The types of investment discussed include natural resource seeking, market seeking, efficiency seeking, and strategic asset seeking investments. The chapter discusses the types of incentives that host countries frequently provide and considers the effectiveness of incentive types for encouraging investment and maximising benefits from each type of investment. For example, the analysis finds that natural resource and market seeking FDI often benefits from incentives provided by host governments, yet the evidence shows that they are of limited utility in attracting such investment. Indeed, as Echandi notes in Chapter 4 “the evidence is that investment incentives are most relevant at the margins of investor decision-making” but “many countries at all levels of development are relying heavily on incentives… and allocating scarce government resources to fund these instruments”, “often (not knowing) how much those incentives actually cost to maintain, or whether they are getting value for money”.
Many of the chapters in this book canvas investor concern about political risk and adverse regulatory changes once an investment is made. This is a concern constantly voiced by business (USC 2014). The World Bank framework described by Echandi suggests that regulatory transparency and consistency (i.e. stability and predictability) are key elements of investor confidence.
Addressing the question of linkages and spillovers into the domestic economy, Echandi provides support for the approach recommended by Moran (Chapter 3) for encouraging light-touch policies that support and encourage spillovers rather than mandating requirements for joint ventures, domestic content and the like (described by Moran as “heavy touch” policies).
IV. Investment agreementsAs trade tariffs declined in successive rounds of GATT and WTO negotiations, and the number of participating economies expanded steeply, trade negotiations became more and more difficult and covered a wider range of topics (with each round of negotiations treated as a “single undertaking”). The current round of multilateral trade negotiations, known as the Doha Development Agenda after the city where the negotiations began, appears to have stalled. Mean-while, smaller bilateral (two countries) or regional (a group of countries) trade agreements have proliferated, often with investment provisions. Bilateral and regional investment agreements have also become more common.
Despite efforts to create the basis for a global investment agreement by the OECD in its Multilateral Agreement on Investment, begun in 1995, reaching consensus even among the limited number of OECD members proved elusive and the negotiations were abandoned in 1998. In the Doha round of WTO negotiations, investment was introduced to the negotiating agenda as one of the four “Singapore issues” (so named for the 1996 Singapore WTO Ministerial meeting where they were discussed), but these negotiations also failed to reach consensus and investment was dropped from the agenda in 2004.
Difficulties in negotiations notwithstanding, interest remains strong in negotiating investment agreements to clarify the conditions under which FDI can and will take place. At present more than 3,000 international investment agreements are in effect worldwide.
Since 2001, a feature of the Asian region (often with the exception of China and India) has been to regulate/deregulate some economic activities through foreign trade agreements (FTAs) which include investment chapters and through

5
Introduction and overview
bilateral and regional investment agreements. This has resulted in overlapping and nested investment rules such that an international investment by one organisation in a particular country might be covered by a number of different sets of rules. This can give rise to conflicting approaches to dispute resolution, conflicts in the treatment expected by the inves-tor and in the host country and for the host government, unexpected applications of the IIA provisions.
This complex pattern of overlapping and nested agreements is particularly contentious in Asia. Approximately a third of all IIAs worldwide include at least one Asian entity. Together, the large number of these often overlapping agreements and the resultant increased complexity of FDI in the Asian region are colloquially referred to as the ‘Asian noodle bowl of IIAs’.
With such a large number of agreements, it is surprising that the Asian experience of evolving international investment regimes has not been extensively investigated. In Chapter 5, Julien Chaisse and Shintaro Hamanaka make a significant contribution in this regard by investigating the development of rules and investor protection in IIAs in Asia. The major advantage of Chaisse and Hamanaka’s approach is that the analysis of IIAs can become forward looking. This is of great utility in an era when APEC countries’ investment policy measures are predominantly geared towards investment liberalisation, promotion and facilitation with significant expansions of IIA efforts at a regional level.
Chaisse and Hamanaka’s analysis identifies the complexities of the ‘Asian noodle bowl of IIAs’ and the issues that follow from this complexity such as treaty shopping by companies and uncertainty as to rules that will apply in disputes, and unanticipated consequences where governments find themselves defending decisions taken in areas not directly related to investment. They argue that the current rounds of regional negotiations, which include discussions on invest-ment agreements/provisions provide the opportunity to move forward on international investment governance. In partic-ular, they single out the potential of the Trans Pacific Partnership (TPP) to reshape the IIA landscape in Asia. However, as Chaisse and Hamanaka point out, unless investment agreements with more limited country and/or content coverage are suspended following the negotiation of a high-quality broad agreement, the TPP might well increase the complexity of Asia’s noodle bowl of IIAs. They also suggest that to avoid increasing complexity of investment agreement coverage, those countries who are unable to accept the full disciplines of a new TPP, might still be permitted to sign up just to the investment provisions.
One of the issues giving rise to the complexity as discussed by Chaisse and Hamanaka is the inclusion of investor state dispute settlement (ISDS) provisions in agreements. These provisions enable investors to seek third-party arbitration where they believe their investments have been disadvantaged by government decisions in contravention of provisions of the agreement. Frequently, signature of agreements containing ISDS provisions are greeted with considerable contro-versy in the affected countries. Concern is often expressed at having foreign corporations able to use international arbi-tral bodies to challenge the capacity of governments to legislate for legitimate domestic purposes together with concerns at the potential liability that such arbitration imposes and the favouring of foreign investors over domestic investors who do not have the right to challenge government actions in international tribunals.
This controversy rarely takes account of the record of outcomes from ISDS settlements. Martina Francesca Ferracane in Chapter 6 reviews this record.
Originally envisaged as a mechanism for protection of developed country investors against adverse action by develop-ing country governments, the ISDS mechanism has increasingly been used to file claims against developed countries (40% of the cases initiated in 2014). Some of these cases confront the intent of governments to legislate on health, environmental and other domestic policy grounds and as a consequence the provision has become highly contentious. Ferracane’s analysis shows that the number of cases has closely followed the level of FDI and overall is very small, amounting to around 608 claims up to 2014 (UNCTAD 2015). Of the 356 cases that have been concluded up to 2014, 37% were decided in favour of the state, 25% in favour of the investor and 28% of the cases were settled without a finding being recorded; 8% of the cases were discontinued for reasons other than settlement and, in 2% of the cases, a treaty breach was found but no monetary compensation was awarded to the investor.
While details of awards are not always public, Ferracane’s review of the literature on awards shows that they are gen-erally significantly lower than the amount claimed – in only 11% of cases did the award amount to the entire amount claimed. Although there have been a few instances of awards exceeding $US 1 billion, recent analysis (Franck 2014) indicates that the inflation adjusted damage claimed was around US$ 622 million with average awards around US $16.6 million. Popular perception is that challenges to state actions in the ISDS arena originate principally from huge multi-national corporations. Ferracane’s literature review shows that around 1/5 of the cases originate via individuals or small corporations while only 8% of the cases are lodged by large multinationals (note that in some cases it is difficult to get information about the kind of organisation lodging the claim).
6
Current Issues in Asia Pacific Foreign Direct Investment
The focus in Chapter 7 is on bilateral investment treaties (BITs) which make up a significant proportion of IIAs and (in part) preferential trade agreements. The flow of FDI between countries without bilateral investment treaties makes clear that a treaty is not a necessary condition for investment. But given the large number of BITs, it is clearly an important question whether bilateral investment treaties lead to an increase in the amount or quality of FDI. There is a significant body of literature which examines this question. Unfortunately the literature suggests a wide range of results. Christian Bellak, in Chapter 7, discusses the problems of analysis and the potential for bilateral investment treaties to overcome two major issues that are not effectively dealt with by the market: information asymmetry by which investors are not clear on the intent of governments and need to make judgements based on past performance of governments and expe-rience, and second, time inconsistency, which reflects the incentive for governments to change policies once an invest-ment has been made. These were also discussed earlier in Chapter 3 in the context of ‘light form’ investment policies. Theoretically at least, bilateral investment treaties have the potential to help overcome these market failure conditions by signalling the intention of governments to welcome and protect investment, and by providing protection for invest-ments through potential penalties that discourage governments from changing policies in a way adverse to investors after the investment has been made. Professor Bellak notes however, that while BITs have the potential to address these issues they introduce a form of discrimination against domestic investors, favouring the foreign investors and that this can have a resource allocation affect (and contribute to the controversy that is often generated on signature of an agree-ment including ISDS as discussed in Chapter 6).
The question considered in Chapter 7 is whether the theoretical support for BITs is supported by the literature. As noted above, the analyses that have been done suggest that there is a positive impact on FDI following the implementation of a BIT. However, a meta-analysis taking into account publication selection bias that excludes publication of material that does not conform to the conventional view or where the results show only small or statistically insignificant results, has an important impact on the conclusions drawn. The analysis summarised in Chapter 7 indicates that when this bias is taken into account, the effect on FDI of a BIT is close to zero. As Professor Bellak notes, “we have to accept that the literature has failed to provide evidence with respect to an effect of BITs on bilateral inward FDI flows and stock.” While this may well be the case, the chapter discusses the potential for BITs to provide support to and enhance the effects of other types of investment policies, particularly incentives, by providing protection for investment after the decision has been made based on other factors. It is recognised that there may be political and foreign relations arguments for ne-gotiation of an investment agreement and the chapter discusses the potential cost involved in governments “tying their hands” in respect of future policies, given the very limited impact on FDI, the analysis in this chapter, and in other liter-ature, calls for policy makers “to be very cautious in signing BITs and in considering into which commitments to enter.”
The issues with investment agreements, particularly relating to ISDS provisions and the ‘noodle bowl’ complexity, have serious ramifications. For example a number of countries have cancelled or are reviewing their approach to ISDS in international agreements and there is now greater interest in developing modern agreements that attempt to address these issues. As noted in Chapter 2, regional agreements currently under negotiation aim to address these issues and some of the more recent bilateral agreements signed (for example the China Australia Free Trade Agreement signed in 2015) have taken steps in this direction. UNCTAD’s World Investment Report 2015 has made some concrete suggestions to this end.
V. Measuring improvement in the investment climateIn Chapter 8 Jonathan Coppel looks at how to measure improvements in the investment climate and in so doing, draws together a number of the threads woven though earlier chapters. Chapter 9 provides illustrations of the use of perfor-mance indicators and further discusses some of their limitations.
Traditionally, policies towards FDI have been defensive – aimed at preventing or mitigating negative impacts of foreign influence in the host (or occasionally, source) economy. As the benefits of FDI have become more apparent over time, there has been a move to ease restrictions on FDI, whether these are in the form of ownership restrictions, taxation on the location, size or composition of foreign investments or production, or other forms.
Border or ownership barriers may be keeping FDI stocks anywhere from 10 to 80 percent lower than they might otherwise be (Coppel, Chapter 8 this volume). While taxation influences foreign investors’ decision making, it typically matters less than other factors, such as access to markets or suppliers, or natural resource endowments. Studies have found that a one percentage point increase in corporate taxes may lead to a drop of over 4 percent in FDI inflows.
Using quantitative indicators to benchmark locations for FDI can improve accountability, encourage policy discus-sions, and provoke implementation of measures to improve the economic environment and assist companies in making investment decisions. It can also emphasize the ‘whole of government’ approach needed to develop effective policies
7
Introduction and overview
to encourage FDI. However, using benchmarks to compare performance across different locations and policy settings faces several significant challenges. Policy objectives and preferences may differ between locations, making direct comparison difficult, the choice of indicators used for the benchmarking exercise and how they are used may influence the results, and subjective factors may influence how those results are interpreted. There may also be large differences between the intention of policies in theory and their enforcement in practice. Data availability may also contribute to a biased view of the situation facing foreign investors.
There are now a large number of investment climate indicators available to support analysis and decision making by international investors. Some come from private firms, some from government agencies, and some from international organizations. Some are based on the perceptions of survey respondents and others on more objective criteria. Some are compiled in the host countries and some are based on responses from business managers in source locations. The most commonly used are composite indicators that aggregate multiple measured dimensions into a single result. While composite indicators simplify comparisons at a more macro level, they can obscure important differences among their individual components.
Foreign ownership restrictions are studied by the OECD, UNCTAD and World Bank, among other organisations. In the OECD, foreign equity restrictions constitute one of the four components of its FDI Restrictiveness Index, which covers nine sectors (including seven service sectors) for 48 countries (including 12 APEC members). UNCTAD uses a similar approach in its FDI Restrictiveness Index in Services for 11 industries in each of 50 developing or emerging market economies. In the World Bank, the Investing Across Borders database tracks restrictions on foreign equity ownership in 11 sector groups (comprising 33 sectors) for 87 countries (including 16 APEC members). It suggests there is greater dis-persion of ownership restrictions among industries in APEC than non-APEC economies, with relatively high restrictions in APEC in electricity, media, real estate, and telecommunications industries. Nonetheless, the larger APEC economies in particular have had a good record of attracting FDI in recent decades.
There are several ways to assess the corporate tax burden for potential investors. The ratio of a country’s tax revenue to GDP may be the simplest, but also is of limited use for an individual investor. The ratio of corporate taxes paid to corporate profits may give a clearer picture and incorporate special exemptions or results of tax planning, but also miss useful information and incorporate possibly extraneous factors. Where accounting definitions and standards differ, the average corporate tax rate may result in misleading comparisons. What economists refer to as effective tax rates take account of the domestic corporate tax systems of both source and destination countries, the interaction between them, and taxation of cross-border income flows, but have other shortcomings.
Coppel, in Chapter 8, argues that the purpose of the analysis or comparison will help to determine the indicator(s) on which to focus. Indicators of the tax incidence would still need to be complemented by incorporating the costs of com-pliance with the tax system. Positive incentives by host countries to attract FDI may also have important influences on investment decision making.
Quantitative indicators are also useful for assessing performance of investment promotion agencies (IPAs), which are present in every APEC member country but whose performance is poorly measured or understood in most cases. IPAs generally have limited budgets but can use them to leverage the development benefits of FDI. The most commonly used metrics for measuring or comparing IPA performance are to be found in the OECD’s PFI Toolkit on Investment Promotion and Facilitation, UNCTAD’s Evaluating Investment Promotion Agencies, the US Government’s Country Commercial Guides, and the World Bank’s Global Investment Promotion Best Practice (GIPB).
Better IPA indicators for benchmarking would help to understand the strengths and weaknesses of different IPA policy practices, provide an evidence base for policy design, and facilitate exchange of experiences, policy discussions, and resulting actions. Challenges to developing better IPA indicators relate to the diversity of IPA functions and how the indicators can be applied for policy benchmarking.
VI. Investment policy developments and the opportunities for business sector recommendationsIn recent decades, international connectivity has increased sharply. Trade between emerging markets has doubled its share of global trade over the past decade. Global capital flows expanded 25 times between 1980 and 2007 (Dobbs et al. 2015) and developing economies have become important sources of outward FDI, accounting for about 30% of the total. Investment policy making has struggled to keep pace. By 2013, APEC members’ share of total world (inward) FDI stock reached 46.5% and of outward stock, 47.4% (UNCTAD database), but was still lower than its 57% share of world GDP and about the same as its 47% of world trade.
8
Current Issues in Asia Pacific Foreign Direct Investment
Countries have liberalized their policies for both domestic and foreign investment as their appreciation for the value of international investment has grown. This has taken place unilaterally, bilaterally, regionally, and multilaterally. At the 1996 WTO Ministerial conference in Singapore, investment became one of the Doha Development Round’s is-sues under negotiation for behind-the-border action, along with trade facilitation, competition policy, and government procurement. This reflected recognition that trying to protect some domestic firms from foreign competition frequently penalized consumers and other firms.
Along with changing investment patterns, the policy environment for international investment continues to change. According to UNCTAD, national governments have adopted investment policy measures at a rate of about 150 annually over the past decade, and other measures that influence the business environment for investors. At the international level, new investment agreements have also proliferated. At the level of institutional architecture, the codes and stan-dards that govern the behaviour of private investors also keeps expanding (UNCTAD 2012).
Industrial policies and industrial development strategies have been proliferating in both developed and developing countries. These strategies often contain elements of targeted investment promotion or restriction. Frequently the de-sired forms of investment are those that will increase participation in global value chains, following the appearance of dynamic benefits from these production networks, particularly in East Asia. This participation frequently involves only niche roles in the value chains, and may prove temporary as technology and consumer preferences keep changing. Con-sequently, expectations of governments’ supporting measures have risen as those efforts have become more focused on the sector, motivation, and quality as well as quantity of foreign investment.
In response to the evolving production and investment environment, an increasing share of total investment policy mea-sures have taken the form of regulatory policies. Policies have also become more nuanced as they attempt to simulta-neously become more liberalised and more targeted in pursuit of specific public policy objectives. Of particular note for the influence on economic growth and regional integration, developing countries have been seeking foreign investment to meet their growing demand for infrastructure services.
The diversity of APEC economies, combined with lower trade costs from infrastructure and technological development, has helped the region to capitalize on production fragmentation and expanding intraregional trade, with concomitant development opportunities. The impacts of new investments in trade-related infrastructure are now being leveraged by coordination across borders in a wide array of trade facilitating institutional and trade architectures, with best practices being compiled and shared among trading partners. In this continually changing economic context, the soft infrastruc-ture increasingly stands out as an essential complement to expansion of physical infrastructure. Meanwhile, the growth of trade in services out-paces that in manufacturing and emphasises different physical attributes of products and modes of delivery.
Opening the opportunities for increased domestic and foreign investment flows in APEC was established as a major objective in the Bogor goals of 1994. The broader dynamics of global and major regional economic and financial devel-opments, as well as measures impacting on trade and investment globally and regionally, have helped to shape APEC’s approaches to investment ever since the Bogor Declaration.
Slower economic growth, financial crises, and the stagnation of the WTO Doha Round may have constrained investment flows in the last few decades, but such factors are likely to have been partially offset by implementation of unilateral measures to enhance investment flows, supported to some degree by the proliferation of bilateral agreements. Advocacy for the use of quantitative indicators is becoming particularly important in highlighting restrictive aspects of investment policy regimes in the region and in providing insights into the cost of restrictions and pathways to reduce or remove them.
Most recent APEC actions include focusing on investment regimes which impede regional economic growth objectives. Specifically, they include a focus on wide ranging restrictions impacting on services, on infrastructure financing, on the development of small and medium enterprises and measures which constrain investment in sectors relevant to connec-tivity between regional markets and the integration of regional sector markets.
However, assessment undertaken by the APEC Policy Support Unit of economies’ actions to improve the transmission of net benefits from FDI concludes that APEC should further deepen and expand implementation of its Investment Facilitation Action Plan by taking into account stakeholders’ inputs and using available quantitative and qualitative evidence. It has also found that economies should be more active in facilitating the process of technology transfer and strengthening the linkages to domestic enterprises from both existing and expected FDI. Thus, even greater commitment to implement APEC’s investment principles is needed.

9
Introduction and overview
Quantitative indicators are widely agreed to be useful in measuring the performance of investment policies in attracting FDI, but they remain controversial due to lack of ownership amongst regional economies. To improve members’ under-standing of this widespread and important phenomenon and its nuances, at the initiative of the APEC Business Advisory Council a Regional Investment Analytical Group was formed. Its aim is to encourage the use and advance the value, integrity, and development of relevant indicators and quantitative analysis to assess investment policy frameworks, best practices and performance in the Asia-Pacific region.
Successful FDI practices require a stable and fundamentally sound macroeconomic environment with real growth, low inflation and best trade practices locally and globally, strong legal and regulatory regimes to protect property rights, transparent rules of law, good transportation and communication infrastructure, and well-trained labour allocated through efficient markets. In addition, governments need to coordinate activities aimed at improving the business environment in host countries and monitor investment promotion agencies as they communicate and disseminate information. In this regard, country performance evaluation is paramount for accountability, policy debate and continued success in attracting FDI.
As authors from the Australian APEC Study Centre note in Chapter 9, the remaining big challenges for investment policy in the APEC region are: (1) to keep attracting private sector investment where the social benefits exceed private benefits; (2) maintaining and extending clear and harmonised standards and regulations for the provision of services; (3) cooperating internationally where investments take place across borders either in their origin and financing, or in their resulting output of services; (4) increasing the transparency of dispute resolution mechanisms; and (5) enabling greater efficiency and participation in global value chains.
Twenty-first century investment policies place inclusive growth or sustainable development at the heart of efforts to attract and benefit from investment, typically through inclusion of labour or environmental standards and protection of intellectual property rights, or through improved dispute resolution mechanisms. At the international level, cooperation through preferential trade and investment agreements that strengthen structural reforms and increase the attractiveness of a location for FDI can leverage domestic policy actions and their impacts on growth, equity, and efficiency. Such cooperative efforts may also help to reduce corruption.
APEC efforts will continue to address these challenges. As one example, looking into the future, the Regional Invest-ment Analytical Group is planning to develop a more nuanced approach with performance ratings for sectoral FDI sub-ject to the availability of data. Case studies of investments in individual APEC members may also be undertaken to help derive favourable policy practices and compilation of best practices for Investment Promotion Agencies. Investment in APEC will continue to evolve, and the region’s policy analysis and insights must continue to grow commensurately.
ReferencesAPEC Business Advisory Council. (2014). Report to APEC Economic Leaders. Available at: https://www.abaconline.org/v4/download.php?ContentID=2609958 , accessed 19 July 2015
Dobbs R., Manyika J. and Woetzel J. (2015). No Ordinary Disruption, McKinsey Global Institute.
Franck S.D. (2014). Using Investor–State Mediation Rules to Promote Conflict Management: An Introductory Guide. Washington & Lee Legal Studies Paper No. 2014-13. Washington and Lee University – School of Law. Available at http://papers.ssrn.com/sol3/papers.cfm?abstract_id=2389763
Hausmann R., Hwang J. and Rodrik D. 2007. What You Export Matters. Journal of Economic Growth. 1-25.December
UNCTAD. (2012). World Investment Report, UNCTAD, Geneva.
UNCTAD. (2015). World Investment Report, UNCTAD, Geneva.
UNCTAD. (2015). Recent Trends in IIAs and ISDS. No. 1.February 2015. Available at http://unctad.org/en/Publication-sLibrary/webdiaepcb2015d1_en.pdf
USC Marshall School of Business. (2014). Foreign Direct Investment across APEC: impediments and opportunities for improvement. http://classic.marshall.usc.edu/assets/159/25803.pdf [accessed 19 July 2015].

10
This chapter discusses recent trends in foreign direct investment (FDI) at the global and regional levels as well as related policy trends, with a particular focus on APEC.1
I. Global and regional trendsFDI plays an important role in bridging the international investment gap, especially in developing countries. FDI also plays an important role in contributing to host governments’ revenue-raising. UNCTAD estimates the contribution of multinational enterprises’ (MNEs) foreign affiliates to government budgets in developing countries at about $730 billion annually. This represents, on average, some 23 percent of total corporate contributions and 10 percent of total government revenues. The relative size (and composition) of this contribution varies by country and region. It is higher in developing countries than in developed countries, underlining the exposure and dependence of developing countries on corporate contributions.
To enable FDI to play its role, strengthening the global investment policy environment is necessary. The chapters in this book address many important aspects of the investment environment that interact and need to be the focus of continuing reform efforts. The UNCTAD World Investment Report 2015 identifies a number of areas for reform (see below). The Report also canvasses a number of tax policy issues which are not discussed in this volume, but are nonetheless of in-creasing concern to governments and the focus of increased government attention.
To understand the significance of the policy issues, an understanding of the extent of, and changes in, FDI flows is nec-essary. This chapter reviews the current statistical picture and provides a context for considering the need for change in FDI regimes.
Statistical picture
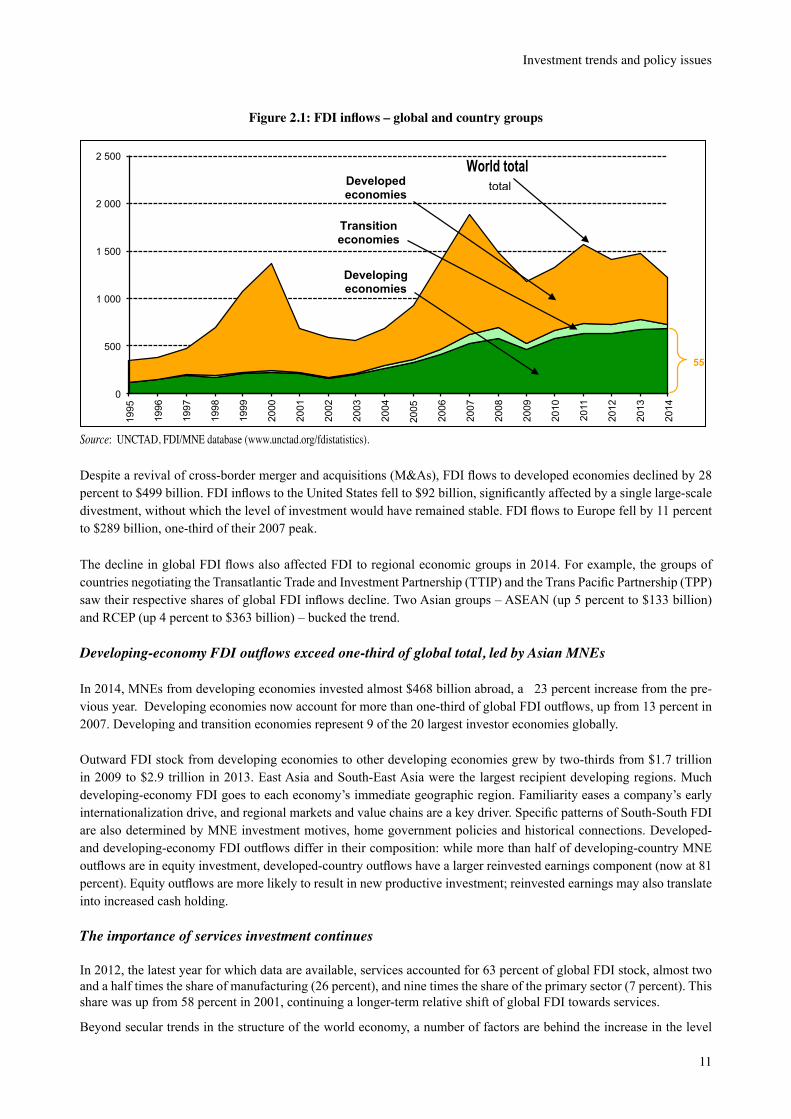
Global FDI inflows fell by 16 percent in 2014 to $1.23 trillion, down from $1.47 trillion in 2013 (Figure 2.1). This is mostly explained by the fragility of the global economy, policy uncertainty for investors and elevated geopolitical risks. New investments were also offset by some large divestments. The decline in FDI flows was in contrast to macroeconom-ic variables such as GDP, trade, gross fixed capital formation and employment, which all grew.
Although the outlook for FDI remains uncertain, an upturn in FDI flows is anticipated by UNCTAD in 2015. Strength-ening economic growth in developed economies, the demand-stimulating effects of lower oil prices and accommodating monetary policy, and continued investment liberalization and promotion measures could favourably affect FDI flows. Both UNCTAD’s FDI forecast model and its business survey of large MNEs show a rise of FDI flows in and after 2015.
Global FDI inflows are therefore expected to grow by 11 percent to $1.4 trillion in 2015. Flows could increase further to $1.5 trillion and $1.7 trillion in 2016 and 2017, respectively. The share of MNEs intending to increase FDI expenditures over the years 2015 to 2017 rose from 24 to 32 percent, according to UNCTAD’s business survey. Data for the first few months of 2015 are consistent with this forecast. However, a number of economic and political risks, including ongo-ing uncertainties in the Eurozone, potential spillovers from geopolitical tensions and persistent vulnerabilities in emerging economies, may disrupt the projected recovery.
Developing-economy inflows reached $681 billion. This group now accounts for 55 percent of global FDI inflows. Five of the top 10 FDI hosts are now developing economies, principally in Asia where FDI inflows grew by 9 percent to almost $465 billion, more than two-thirds of the total for developing economies. 1 ThefirstthreesectionsofthisChapterlargelydrawfromUNCTAD’sWorldInvestmentReport2015(WIR15),releasedon24June2015.ThefullreportisavailablefromUNCTADviathefollowinglink:<http://unctad.org/en/PublicationsLibrary/wir2015_en.pdf.>
Chapter 2. Investment trends and policy issues
Masataka Fujita,Secretary-General,ASEAN-JapanCentre;FormerHead,InvestmentTrendsandIssuesBranchUnitedNationsConferenceonTradeandDevelopment
11
Investment trends and policy issues
Figure 2.1: FDI inflows – global and country groups
0
500
1 000
1 500
2 000
2 500
1995
1996
1997
1998
1999
2000
2001
2002
2003
2004
2005
2006
2007
2008
2009
2010
2011
2012
2013
2014
55%
World total total
Developing economies
Transition economies
Developed economies
Source:UNCTAD,FDI/MNEdatabase(www.unctad.org/fdistatistics).
Despite a revival of cross-border merger and acquisitions (M&As), FDI flows to developed economies declined by 28 percent to $499 billion. FDI inflows to the United States fell to $92 billion, significantly affected by a single large-scale divestment, without which the level of investment would have remained stable. FDI flows to Europe fell by 11 percent to $289 billion, one-third of their 2007 peak.
The decline in global FDI flows also affected FDI to regional economic groups in 2014. For example, the groups of countries negotiating the Transatlantic Trade and Investment Partnership (TTIP) and the Trans Pacific Partnership (TPP) saw their respective shares of global FDI inflows decline. Two Asian groups – ASEAN (up 5 percent to $133 billion) and RCEP (up 4 percent to $363 billion) – bucked the trend.
Developing-economy FDI outflows exceed one-third of global total, led by Asian MNEs In 2014, MNEs from developing economies invested almost $468 billion abroad, a 23 percent increase from the pre-vious year. Developing economies now account for more than one-third of global FDI outflows, up from 13 percent in 2007. Developing and transition economies represent 9 of the 20 largest investor economies globally.
Outward FDI stock from developing economies to other developing economies grew by two-thirds from $1.7 trillion in 2009 to $2.9 trillion in 2013. East Asia and South-East Asia were the largest recipient developing regions. Much developing-economy FDI goes to each economy’s immediate geographic region. Familiarity eases a company’s early internationalization drive, and regional markets and value chains are a key driver. Specific patterns of South-South FDI are also determined by MNE investment motives, home government policies and historical connections. Developed- and developing-economy FDI outflows differ in their composition: while more than half of developing-country MNE outflows are in equity investment, developed-country outflows have a larger reinvested earnings component (now at 81 percent). Equity outflows are more likely to result in new productive investment; reinvested earnings may also translate into increased cash holding.
The importance of services investment continues
In 2012, the latest year for which data are available, services accounted for 63 percent of global FDI stock, almost two and a half times the share of manufacturing (26 percent), and nine times the share of the primary sector (7 percent). This share was up from 58 percent in 2001, continuing a longer-term relative shift of global FDI towards services.
Beyond secular trends in the structure of the world economy, a number of factors are behind the increase in the level
12
Current Issues in Asia Pacific Foreign Direct Investment
and share of services FDI. These include increasing liberalization in the services sector in host economies; technological developments in information and communication technology that make services more tradable; and the rise of global value chains, which has given an impulse to the internationalization of services related to manufacturing.
International production continues to expand: foreign sales and assets of MNEs grew faster than those of domestic firms
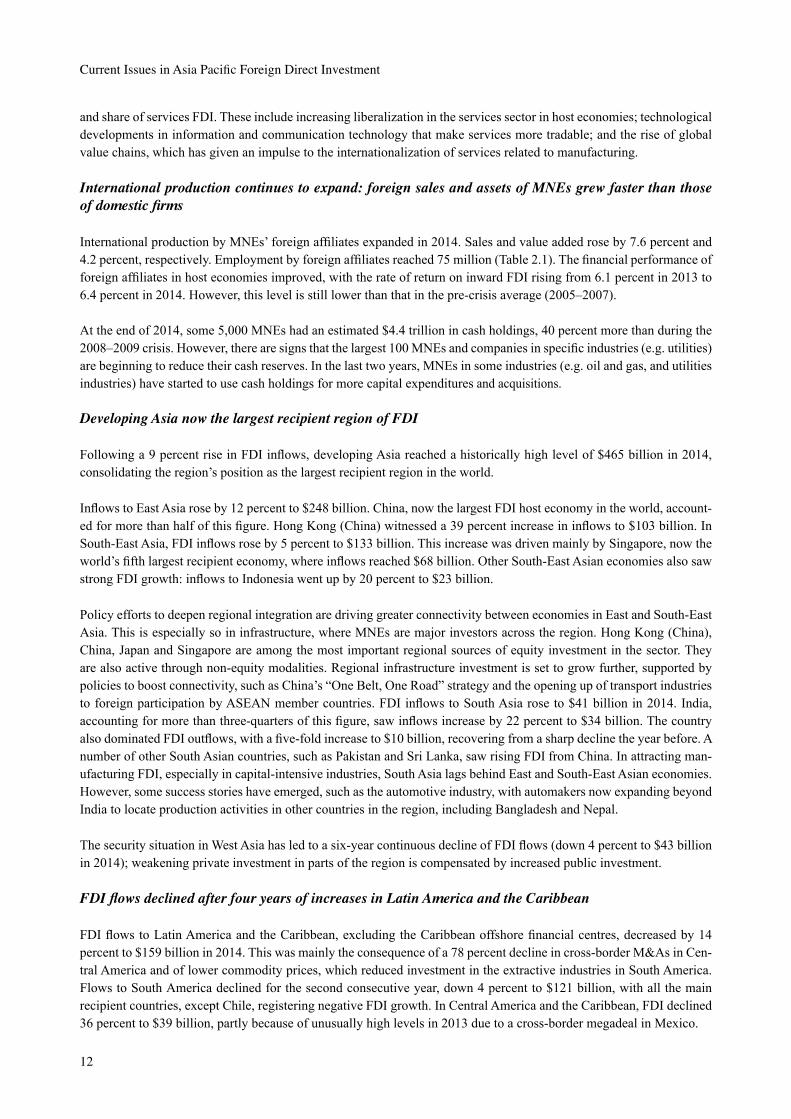
International production by MNEs’ foreign affiliates expanded in 2014. Sales and value added rose by 7.6 percent and 4.2 percent, respectively. Employment by foreign affiliates reached 75 million (Table 2.1). The financial performance of foreign affiliates in host economies improved, with the rate of return on inward FDI rising from 6.1 percent in 2013 to 6.4 percent in 2014. However, this level is still lower than that in the pre-crisis average (2005–2007).
At the end of 2014, some 5,000 MNEs had an estimated $4.4 trillion in cash holdings, 40 percent more than during the 2008–2009 crisis. However, there are signs that the largest 100 MNEs and companies in specific industries (e.g. utilities) are beginning to reduce their cash reserves. In the last two years, MNEs in some industries (e.g. oil and gas, and utilities industries) have started to use cash holdings for more capital expenditures and acquisitions.
Developing Asia now the largest recipient region of FDI
Following a 9 percent rise in FDI inflows, developing Asia reached a historically high level of $465 billion in 2014, consolidating the region’s position as the largest recipient region in the world.
Inflows to East Asia rose by 12 percent to $248 billion. China, now the largest FDI host economy in the world, account-ed for more than half of this figure. Hong Kong (China) witnessed a 39 percent increase in inflows to $103 billion. In South-East Asia, FDI inflows rose by 5 percent to $133 billion. This increase was driven mainly by Singapore, now the world’s fifth largest recipient economy, where inflows reached $68 billion. Other South-East Asian economies also saw strong FDI growth: inflows to Indonesia went up by 20 percent to $23 billion.
Policy efforts to deepen regional integration are driving greater connectivity between economies in East and South-East Asia. This is especially so in infrastructure, where MNEs are major investors across the region. Hong Kong (China), China, Japan and Singapore are among the most important regional sources of equity investment in the sector. They are also active through non-equity modalities. Regional infrastructure investment is set to grow further, supported by policies to boost connectivity, such as China’s “One Belt, One Road” strategy and the opening up of transport industries to foreign participation by ASEAN member countries. FDI inflows to South Asia rose to $41 billion in 2014. India, accounting for more than three-quarters of this figure, saw inflows increase by 22 percent to $34 billion. The country also dominated FDI outflows, with a five-fold increase to $10 billion, recovering from a sharp decline the year before. A number of other South Asian countries, such as Pakistan and Sri Lanka, saw rising FDI from China. In attracting man-ufacturing FDI, especially in capital-intensive industries, South Asia lags behind East and South-East Asian economies. However, some success stories have emerged, such as the automotive industry, with automakers now expanding beyond India to locate production activities in other countries in the region, including Bangladesh and Nepal.
The security situation in West Asia has led to a six-year continuous decline of FDI flows (down 4 percent to $43 billion in 2014); weakening private investment in parts of the region is compensated by increased public investment.
FDI flows declined after four years of increases in Latin America and the Caribbean
FDI flows to Latin America and the Caribbean, excluding the Caribbean offshore financial centres, decreased by 14 percent to $159 billion in 2014. This was mainly the consequence of a 78 percent decline in cross-border M&As in Cen-tral America and of lower commodity prices, which reduced investment in the extractive industries in South America. Flows to South America declined for the second consecutive year, down 4 percent to $121 billion, with all the main recipient countries, except Chile, registering negative FDI growth. In Central America and the Caribbean, FDI declined 36 percent to $39 billion, partly because of unusually high levels in 2013 due to a cross-border megadeal in Mexico.
13
Investment trends and policy issues
Table 2.1. Selected indicators of FDI and international production 2014 and selected years
Item
Value at current prices (billionsofdollars)
1990 2005–2007 (pre-crisisaverage)
2012 2013 2014
FDIinflows 205 1 397 1 403 1 467 1 228FDIoutflows 244 1 423 1 284 1 306 1 354FDIinwardstock 2 198 13 894 22 073 26 035 26 039FDIoutwardstock 2 254 14 883 22 527 25 975 25 875Income on inward FDI a 82 1 024 1 467 1 517 1 575 Rate of return on inward FDI b 4.4 7.6 7.0 6.1 6.4Income on outward FDI a 128 1 105 1 445 1 453 1 486 Rate of return on outward FDI b 5.9 7.6 6.6 5.8 5.9Cross-border M&As 98 729 328 313 399Salesofforeignaffiliatesc 4 723 21 469 31 687 33 775 36 356Value-added(product)offoreignaffiliatesc 881 4 878 7 105 7 562 7 882
Totalassetsofforeignaffiliatesc 3 893 42 179 88 536 95 230 102 040Exportsofforeignaffiliates d 1 444 4 976 7 469 7 688 7 803Employmentbyforeignaffiliates(thousands)c 20 625 53 306 69 359 71 297 75 075
Memorandum:GDP 22 327 51 799 73 457 75 453 77 283Grossfixedcapitalformatione 5 592 12 219 17 650 18 279 18 784Royalties and licence fee receipts 31 172 277 298 310
Exports of goods and servicese 4 332 14 927 22 407 23 063 23 409
Source: UNCTAD,WorldInvestmentReport2015,tableI.5,p.18(www.unctad.org/wir).aBased on data from 174 countries for income on inward FDI and 143 countries for income on outward FDI in2014,inbothcasesrepresentingmorethan90percentofglobalinwardandoutwardstocks.bCalculatedonlyforcountrieswithbothFDIincomeandstockdata.cDatafor2013and2014areestimatedbasedonafixedeffectspanelregressionofeachvariableagainstoutwardstockandalaggeddependentvariablefortheperiod1980–2012.dFor1998–2013,theshareofexportsofforeignaffiliatesinworldexportsin1998(33.3%)wasappliedtoobtainvalues.Datafor1995–1997arebasedonalinearregressionofexportsofforeignaffiliatesagainstinwardFDIstockfortheperiod1982–1994.eDatafromIMF,WorldEconomicOutlook,April2015.Note: Notincludedinthistableisthevalueofworldwidesalesbyforeignaffiliatesassociatedwiththeirparentfirmsthroughnon-equityrelationshipsandofthesalesoftheparentfirmsthemselves.Worldwidesales,grossproduct,totalassets,exportsandemploymentofforeignaffiliatesareestimatedbyextrapo-latingtheworldwidedataofforeignaffiliatesofTNCsfromAustralia,Austria,Belgium,Canada,CzechRepublic, Finland, France, Germany, Greece, Israel, Italy, Japan, Latvia, Lithuania, Luxembourg, Por-tugal,Slovenia,Sweden,andtheUnitedStatesforsales;thosefromtheCzechRepublic,France,Israel,Japan,Portugal,Slovenia,Sweden,andtheUnitedStatesforvalue-added(product);thosefromAustria,Germany,JapanandtheUnitedStatesforassets;thosefromCzechRepublic,Japan,Portugal,Slovenia,Sweden,andtheUnitedStatesforexports;andthosefromAustralia,Austria,Belgium,Canada,CzechRe-public,Finland,France,Germany,Italy,Japan,Latvia,Lithuania,Luxembourg,Macao(China),Portugal,Slovenia,Sweden,Switzerland,andtheUnitedStatesforemployment,onthebasisofthreeyearsaveragesharesofthosecountriesinworldwideoutwardFDIstock.
14
Current Issues in Asia Pacific Foreign Direct Investment
FDI flows in transition economies more than halved in 2014
FDIinflowstothetransitioneconomiesfellby52percenttoreach$48billion in2014−avaluelastseenin2005.IntheCommonwealth of Independent States(CIS),regionalconflictcoupledwithfallingoilpricesandinternational sanctions reduced foreign investors’confidence in thestrengthof local economies.TheRussianFederation− the largesthostcountry in the region−sawitsFDIflowsfallby70percentduetothecountry’snegative growth prospects, and as an adjustmentafterthelevelreachedin2013duetotheexceptionalRosneft−BPtransaction.InSouth-EastEurope,FDIflowsremainedstableat$4.7billion.Foreigninvestorsmostlytargeted manufacturing because of competitive produc-tion costs and access to EU markets.
FDIoutflowsfromthetransitioneconomiesfellby31percentto$63billionas natural-resource-basedMNEs,mainlyfrom the Russian Federation, reduced their investment abroad, particularly due to constraints in international financialmarketsandlowcommodityprices.
IntheRussianFederation,sanctions,coupledwithaweakeconomyand other factors, began affecting inward FDI in the second half of 2014, and thisisexpectedtocontinuein2015andbeyond.Market-seekingforeign investors–forexam-ple,intheautomotiveandconsumerindustries–aregraduallycuttingproductioninthecountry.Volkswagen(Germany)will reduceitsproductioninKaluga,andPepsiCo(UnitedStates)hasannounced it will halt production at some plants. Thegeographicalprofileofinvestorsin thecountryischanging.Asnewinvestmentfromdeveloped-countryMNEs is slowing down, some of the losses are being offset by other countries. In2014,Chinabecamethefifthlargestinvestorin the Russian Federation.
Inflows to developed economies down for the third successive year
FDI inflows to developed countries lost ground for the third successive year, falling by 28 percent to $499 billion, the lowest level since 2004. Inflows to Europe continued the downward trend since 2012 to $289 billion. Inflows to North America halved to $146 billion, mainly due to Vodafone’s $130 billion divestment of Verizon, without which they would have remained stable.
FDI outflows from developed countries held steady at $823 billion. Outflows from Europe were virtually unchanged at $316 billion. Outflows from Germany almost trebled, making it the largest European direct investor. France also saw its outflows increase sharply. In contrast, FDI from other major investor countries plummeted. In North America, both Canada and the United States saw a modest increase of outflows. Outflows from Japan declined by 16 percent, ending a three-year run of expansion.
The impact of MNE operations on the balance of payments has increased, not only through FDI, but also through in-tra-firm trade and FDI income. The recent experience of the United States and Japan shows that growing investment income from outward FDI provides a counterbalance to the trade deficit. Furthermore, outward FDI has helped create avenues for exports of knowledge-intensive goods and services.
II. Investment policy trendsCountries’ investment policy measures continue to be predominantly geared towards investment liberalization, promotion and facilitation
UNCTAD data show that, in 2014, 37 countries and economies adopted at least 63 policy measures affecting foreign investment. Of these measures, 47 related to liberalization, promotion and facilitation of investment, while nine intro-duced new restrictions or regulations on investment (the remaining seven measures are of a neutral nature). The share of liberalization and promotion increased significantly, from 73 percent in 2013 to 84 percent in 2014 (Figure 2.2).A number of countries introduced or amended their investment laws or guidelines to grant new investment incentives or to facilitate investment procedures. Several countries relaxed restrictions on foreign ownership limitations or opened up new business activities to foreign investment (e.g. in infrastructure and services). Newly introduced investment re-strictions or regulations related mainly to national security considerations and strategic sectors (such as transport, energy and defense).
The expansion of the IIA universe continues, with intensified efforts at the regional level
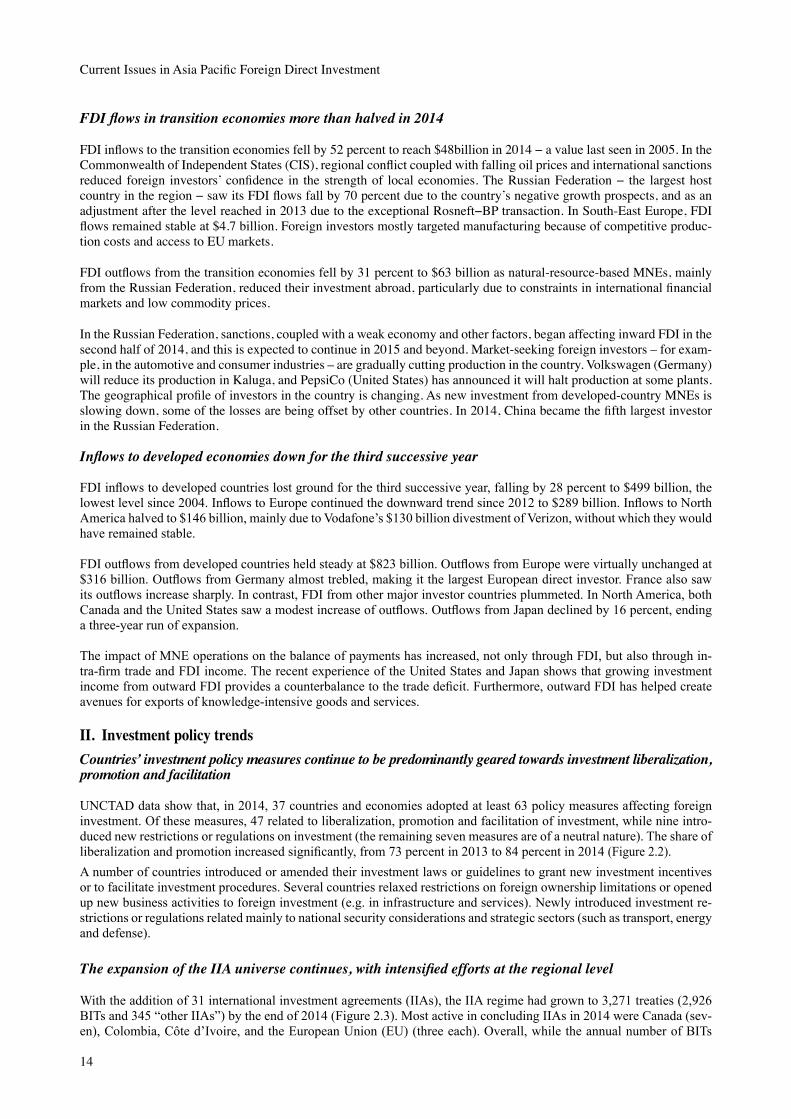
With the addition of 31 international investment agreements (IIAs), the IIA regime had grown to 3,271 treaties (2,926 BITs and 345 “other IIAs”) by the end of 2014 (Figure 2.3). Most active in concluding IIAs in 2014 were Canada (sev-en), Colombia, Côte d’Ivoire, and the European Union (EU) (three each). Overall, while the annual number of BITs

15
Investment trends and policy issues
continues to decline, more and more countries are engaged in IIA negotiations at regional and sub-regional levels. For example, the five ongoing efforts in the TPP, TTIP, RCEP, Tripartite and PACER Plus negotiations involve close to 90 countries.
2014 also saw the conclusion of 84 double taxation treaties (DTTs). These treaties govern the fiscal treatment of cross-border investment operations between host and home states. The network of DTTs and BITs grew together, and there are now over 3,000 DTTs in force worldwide. BIT and DTT networks largely overlap; two thirds of BIT relation-ships are also covered by a DTT.
Figure 2.2. Changes in national investment policies (percent), 2000−2014
Source:UNCTAD,InvestmentPolicyMonitor.
Countries and regions are searching for IIA reform
An increasing number of countries and regions are reviewing their model IIAs in line with recent developments in in-ternational investment law. This trend is not limited to a specific group of countries or region but involves countries in Africa (where 12 countries are reviewing their models), Europe and North America (10), Latin America (8), and Asia (7), and 6 economies in transition, as well as at least 4 regional organizations. South Africa and Indonesia continued their treaty terminations, while formulating new IIA strategies. Brazil, India and Indonesia revealed their novel approaches at the UNCTAD Expert Meeting on the Transformation of the IIA Regime, held in February 2015. This was followed by the EU (with a concept paper) and Norway (with a new model BIT) in May 2015. In 2014 and 2015 Australia also signed new bilateral trade agreements with China, Japan and Korea, including new investment policy approaches. These new approaches converge in their attempt to modernize IIAs and further improve their sustainable development dimension. UNCTAD’s Investment Policy Framework, which represents a new generation of investment policies, has been widely used as a reference in many of the above processes.
New IIAs factor in safeguards for the right to regulate in the public interest
Most of the agreements reviewed include at least one provision geared towards safeguarding the right to regulate for the public interest, including sustainable development objectives, as contained in UNCTAD’s Investment Policy Frame-work. This includes general exceptions, clarifications to key protection standards, clauses that explicitly recognize that the parties should not relax health, safety or environmental standards in order to attract investment, limits on treaty scope, and more detailed ISDS provisions.
IIAs with pre-establishment commitments are on the rise
Although relatively few in number (228), IIAs with “pre-establishment” commitments, extending the national treatment and MFN obligations to the “establishment, acquisition and expansion” of investments, are on the rise. When including pre-establishment commitments in IIAs, safeguarding the right to regulate calls for the use of reservations and safety valves. Most of these involve a developed economy: the United States, Canada, Finland, Japan, and the EU. Also, a few developing countries in Asia and Latin America have been concluding pre-establishment IIAs, including Chile, Costa Rica, the Republic of Korea, Peru and Singapore.
94 84
6 16
0
25
50
75
100
2000 2001 2002 2003 2004 2005 2006 2007 2008 2009 2010 2011 2012 2013 2014
Liberalization/Promotion Restriction/Regulation
16
Current Issues in Asia Pacific Foreign Direct Investment
Figure 2.3. Trends in IIAs signed, 1980-2014
Source:UNCTAD,IIAdatabase.
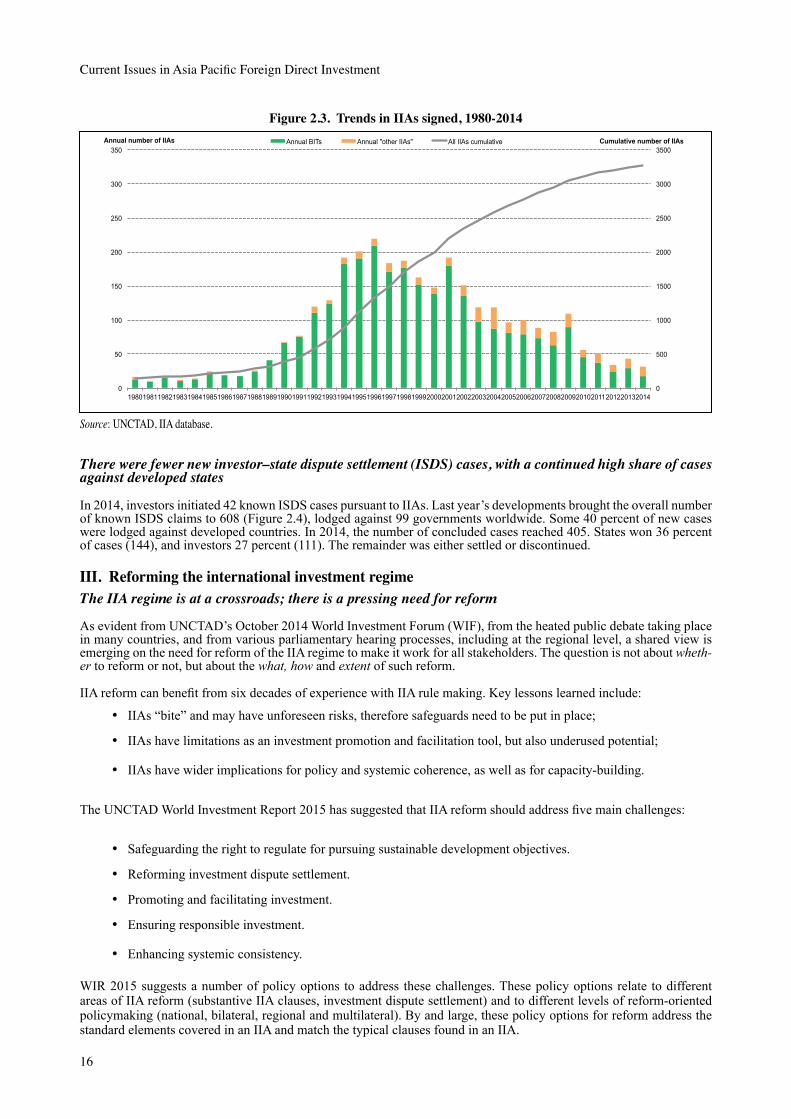
There were fewer new investor–state dispute settlement (ISDS) cases, with a continued high share of cases against developed states
In 2014, investors initiated 42 known ISDS cases pursuant to IIAs. Last year’s developments brought the overall number of known ISDS claims to 608 (Figure 2.4), lodged against 99 governments worldwide. Some 40 percent of new cases were lodged against developed countries. In 2014, the number of concluded cases reached 405. States won 36 percent of cases (144), and investors 27 percent (111). The remainder was either settled or discontinued.
III. Reforming the international investment regimeThe IIA regime is at a crossroads; there is a pressing need for reform
As evident from UNCTAD’s October 2014 World Investment Forum (WIF), from the heated public debate taking place in many countries, and from various parliamentary hearing processes, including at the regional level, a shared view is emerging on the need for reform of the IIA regime to make it work for all stakeholders. The question is not about wheth-er to reform or not, but about the what, how and extent of such reform.
IIA reform can benefit from six decades of experience with IIA rule making. Key lessons learned include:
• IIAs “bite” and may have unforeseen risks, therefore safeguards need to be put in place;
• IIAs have limitations as an investment promotion and facilitation tool, but also underused potential;
• IIAs have wider implications for policy and systemic coherence, as well as for capacity-building.
The UNCTAD World Investment Report 2015 has suggested that IIA reform should address five main challenges:
• Safeguarding the right to regulate for pursuing sustainable development objectives.
• Reforming investment dispute settlement.
• Promoting and facilitating investment.
• Ensuring responsible investment.
• Enhancing systemic consistency.
WIR 2015 suggests a number of policy options to address these challenges. These policy options relate to different areas of IIA reform (substantive IIA clauses, investment dispute settlement) and to different levels of reform-oriented policymaking (national, bilateral, regional and multilateral). By and large, these policy options for reform address the standard elements covered in an IIA and match the typical clauses found in an IIA.
0
500
1000
1500
2000
2500
3000
3500
0
50
100
150
200
250
300
350
1980 1981 1982 1983 1984 1985 1986 1987 1988 1989 1990 1991 1992 1993 1994 1995 1996 1997 1998 1999 2000 2001 2002 2003 2004 2005 2006 2007 2008 2009 2010 2011 2012 2013 2014
Cumulative number of IIAs Annual number of IIAs Annual BITs Annual "other IIAs" All IIAs cumulative
17
Investment trends and policy issues
Figure 2.4. Known ISDS cases, annual and cumulative, 1987-2014
Source: UNCTAD, World Investment Report 2015, figure III.7, p. 114.Note: Information about 2014 claims has been compiled on the basis of public sources, including specialized reporting ser-vices. This part does not cover cases that are based exclusively on investment contracts (State contracts) or national investment laws, or cases in which a party has signaled its intention to submit a claim to ISDS but has not commenced the arbitration. Annual and cumulative case numbers are continuously adjusted as a result of verification and may not exactly match case numbers reported in previous years.
Reform calls for a global approach to synchronize actions at national, bilateral and regional levels
In terms of process, IIA reform actions need to be undertaken at the national, bilateral, regional and multilateral levels. In each case, the reform process includes: (1) taking stock and identifying the problems; (2) developing a strategic approach and an action plan for reform; and (3) implementing actions and achieving the outcomes.
While reform steps at the national level (e.g. new model IIAs) or bilateral level (e.g. renegotiation of “old” IIAs) can play an important role in countries’ reform strategies, they risk perpetuating, if not exacerbating, the fragmentation and incoherence of the global IIA regime. Reform initiatives at the multilateral or regional level, although more challenging and time-consuming, offer a means to consolidate IIA reform by finding common solutions to widely shared concerns. Regional reform processes could span from a collective review of the underlying regional (and bilateral) treaty network to its consolidation. At the multilateral level, a global review and identification of the systemic risks and emerging issues could lead to consensus-building on key IIA reform issues that ultimately could feed into more coordinated approaches, including for future international investment rule making. Such efforts would be in the interest of consolidating and streamlining the IIA network and making it work for sustainable development.
By presenting reform approaches, guidelines, tools, solutions, and a road map for the reform process, WIR 2015 offers an action menu for IIA reform. It pulls together a variety of contributions that have been put forward in recent years, by UNCTAD and many others, on aspects of IIA reform. It invites countries to use this action menu and define their own road maps for IIA reform: countries can pick and choose the respective reform actions and options to formulate their own reform packages, in line with their individual reform objectives.
All of this should be guided by the goals of:
• Harnessing IIAs for sustainable and inclusive growth, and determining the most effective means to safeguard the right to regulate while providing protection and facilitation of investment.
• The reform should focus on critical areas, particularly:
• Safeguarding the right to regulate for public interest
• Reforming investment dispute settlement
• Strengthening the investment promotion and facilitation function
0
100
200
300
400
500
600
700
0
10
20
30
40
50
60
70
1987
1993
1994
1995
1996
1997
1998
1999
2000
2001
2002
2003
2004
2005
2006
2007
2008
2009
2010
2011
2012
2013
2014
Cumulative number of cases Annual number of cases ICSID Non-ICSID All cases cumulative
18
Current Issues in Asia Pacific Foreign Direct Investment
• Ensuring investor responsibility
• Enhancing systemic coherence
• Take a systematic and sequential approach
• Ensure inclusiveness and transparency and
• Make use of multilateral support structures
In the absence of a multilateral system and given the huge number of existing IIAs, the best way to make the IIA regime work for sustainable development is to collectively reform it with a global support structure. Such a global support struc-ture can provide the necessary backstopping for IIA reform, through policy analysis, coordination, management of the interaction with other bodies of law, technical assistance and consensus-building. Only a common approach will deliver an IIA regime in which stability, clarity and predictability help achieve the objectives of all stakeholders: effectively harnessing international investment relations for the pursuit of sustainable development
IV. APEC’s importance in global FDIAPEC is a major and competitive global production centre and at the same time has large intermediate and final demand for a wider range of products and services. It also contains large regional groups such as (part of) ASEAN2 and NAFTA, and has a number of bilateral and regional agreements including BITs, FTAs and EPAs.
In 2014, APEC absorbed more than half of global flows with $652 billion – on par with the G-20. The group saw a dramatic increase in their share of global FDI inflows from the pre-crisis level of 39 percent during 2005–2007 (Table 2.2).
Table 2.2. FDI inflows (US$ billion) to APEC and other selected regional and inter-regional groups, average 2005–2007, and 2008–2014
Regional/inter-regional groups
2005–2007 average
2008 2009 2010 2011 2012 2013 2014
APEC 552 800 491 651 751 686 837 652ASEAN 65 50 46 105 93 108 126 133EU 594 308 391 359 445 365 333 258G20 825 970 656 746 882 717 894 635MERCOSUR 32 60 31 65 87 91 83 73NAFTA 280 397 184 253 293 228 346 169RCEP 191 291 230 293 323 324 349 363TPP 359 523 280 387 445 401 517 345TTIP 780 614 535 557 675 534 564 350
Memorandum: percentage share in world FDI flowsAPEC 39 54 41 49 48 49 57 53ASEAN 5 3 4 8 6 8 9 11EU 43 21 33 27 28 26 23 21G20 59 65 55 56 56 51 61 52MERCOSUR 2 4 3 5 6 6 6 6NAFTA 20 27 16 19 19 16 24 14RCEP 14 20 19 22 21 23 24 30TPP 26 35 24 29 28 29 35 28TTIP 56 41 45 42 43 38 38 28
Source: UNCTAD, FDI/MNE database (www.unctad.org/fdistatistics).Note: G20, 19 individual members economies of the G20, excluding the European Union (EU), which is the 20th member; APEC, Asia-Pacific Economic Cooperation; TTIP, Transatlantic Trade and Investment Partnership; TPP, = Transpacific Partnership; RCEP, Regional Comprehensive Economic Partnership; BRICS, Brazil, Russian Fed-eration, India, China and South Africa; NAFTA, North American Free Trade Agreement; ASEAN, Association of South-East Asian Nations; MERCOSUR, Common Market of the South.
2 Sevenoutof10ASEANmemberstatesbelongtoAPEC.
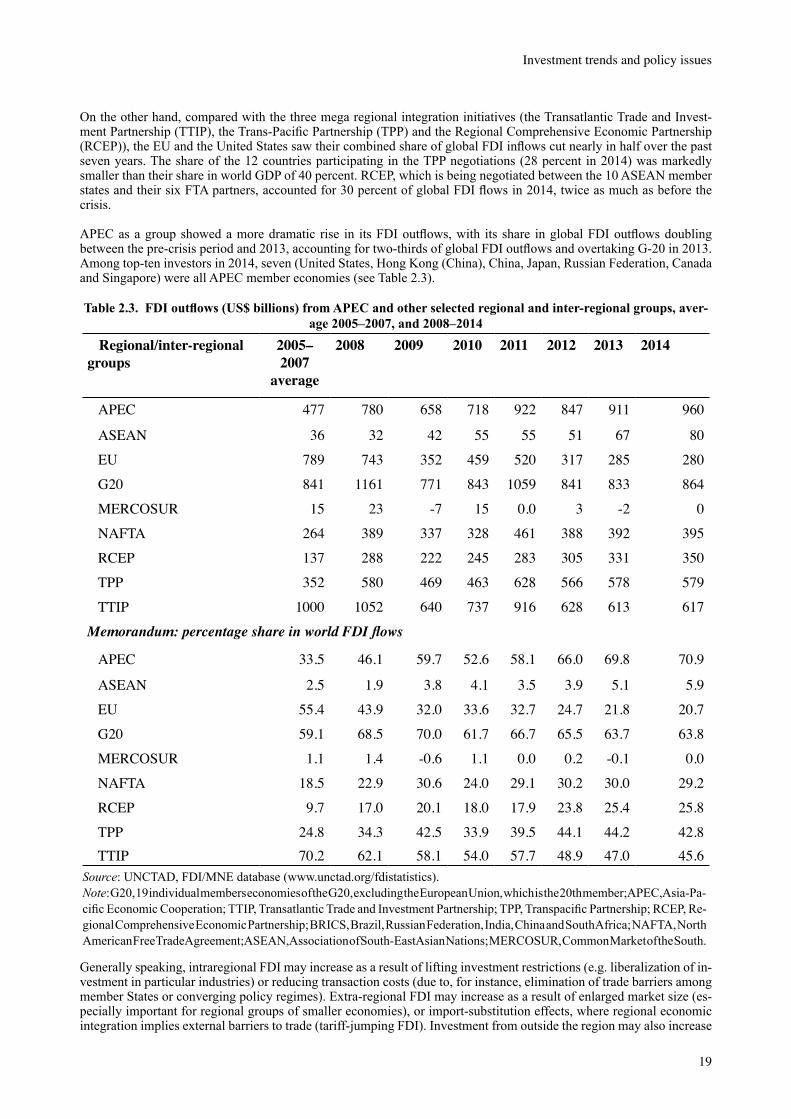
19
Investment trends and policy issues
On the other hand, compared with the three mega regional integration initiatives (the Transatlantic Trade and Invest-ment Partnership (TTIP), the Trans-Pacific Partnership (TPP) and the Regional Comprehensive Economic Partnership (RCEP)), the EU and the United States saw their combined share of global FDI inflows cut nearly in half over the past seven years. The share of the 12 countries participating in the TPP negotiations (28 percent in 2014) was markedly smaller than their share in world GDP of 40 percent. RCEP, which is being negotiated between the 10 ASEAN member states and their six FTA partners, accounted for 30 percent of global FDI flows in 2014, twice as much as before the crisis.
APEC as a group showed a more dramatic rise in its FDI outflows, with its share in global FDI outflows doubling between the pre-crisis period and 2013, accounting for two-thirds of global FDI outflows and overtaking G-20 in 2013. Among top-ten investors in 2014, seven (United States, Hong Kong (China), China, Japan, Russian Federation, Canada and Singapore) were all APEC member economies (see Table 2.3).
Table 2.3. FDI outflows (US$ billions) from APEC and other selected regional and inter-regional groups, aver-age 2005–2007, and 2008–2014
Regional/inter-regional groups
2005–2007
average
2008 2009 2010 2011 2012 2013 2014
APEC 477 780 658 718 922 847 911 960
ASEAN 36 32 42 55 55 51 67 80
EU 789 743 352 459 520 317 285 280
G20 841 1161 771 843 1059 841 833 864
MERCOSUR 15 23 -7 15 0.0 3 -2 0
NAFTA 264 389 337 328 461 388 392 395
RCEP 137 288 222 245 283 305 331 350
TPP 352 580 469 463 628 566 578 579
TTIP 1000 1052 640 737 916 628 613 617
Memorandum: percentage share in world FDI flows
APEC 33.5 46.1 59.7 52.6 58.1 66.0 69.8 70.9
ASEAN 2.5 1.9 3.8 4.1 3.5 3.9 5.1 5.9
EU 55.4 43.9 32.0 33.6 32.7 24.7 21.8 20.7
G20 59.1 68.5 70.0 61.7 66.7 65.5 63.7 63.8
MERCOSUR 1.1 1.4 -0.6 1.1 0.0 0.2 -0.1 0.0
NAFTA 18.5 22.9 30.6 24.0 29.1 30.2 30.0 29.2
RCEP 9.7 17.0 20.1 18.0 17.9 23.8 25.4 25.8
TPP 24.8 34.3 42.5 33.9 39.5 44.1 44.2 42.8TTIP 70.2 62.1 58.1 54.0 57.7 48.9 47.0 45.6
Source: UNCTAD, FDI/MNE database (www.unctad.org/fdistatistics).Note: G20, 19 individual members economies of the G20, excluding the European Union, which is the 20th member; APEC, Asia-Pa-cific Economic Cooperation; TTIP, Transatlantic Trade and Investment Partnership; TPP, Transpacific Partnership; RCEP, Re-gional Comprehensive Economic Partnership; BRICS, Brazil, Russian Federation, India, China and South Africa; NAFTA, North American Free Trade Agreement; ASEAN, Association of South-East Asian Nations; MERCOSUR, Common Market of the South.
Generally speaking, intraregional FDI may increase as a result of lifting investment restrictions (e.g. liberalization of in-vestment in particular industries) or reducing transaction costs (due to, for instance, elimination of trade barriers among member States or converging policy regimes). Extra-regional FDI may increase as a result of enlarged market size (es-pecially important for regional groups of smaller economies), or import-substitution effects, where regional economic integration implies external barriers to trade (tariff-jumping FDI). Investment from outside the region may also increase
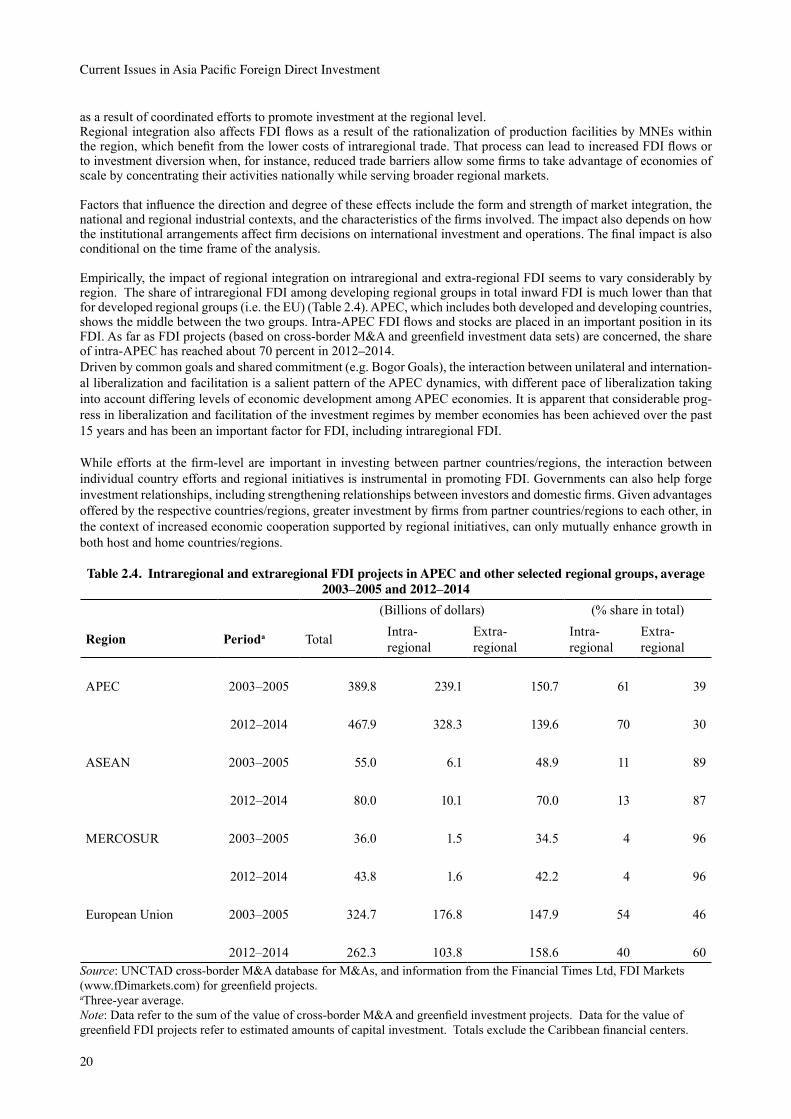
20
Current Issues in Asia Pacific Foreign Direct Investment
as a result of coordinated efforts to promote investment at the regional level. Regional integration also affects FDI flows as a result of the rationalization of production facilities by MNEs within the region, which benefit from the lower costs of intraregional trade. That process can lead to increased FDI flows or to investment diversion when, for instance, reduced trade barriers allow some firms to take advantage of economies of scale by concentrating their activities nationally while serving broader regional markets.
Factors that influence the direction and degree of these effects include the form and strength of market integration, the national and regional industrial contexts, and the characteristics of the firms involved. The impact also depends on how the institutional arrangements affect firm decisions on international investment and operations. The final impact is also conditional on the time frame of the analysis.
Empirically, the impact of regional integration on intraregional and extra-regional FDI seems to vary considerably by region. The share of intraregional FDI among developing regional groups in total inward FDI is much lower than that for developed regional groups (i.e. the EU) (Table 2.4). APEC, which includes both developed and developing countries, shows the middle between the two groups. Intra-APEC FDI flows and stocks are placed in an important position in its FDI. As far as FDI projects (based on cross-border M&A and greenfield investment data sets) are concerned, the share of intra-APEC has reached about 70 percent in 2012–2014. Driven by common goals and shared commitment (e.g. Bogor Goals), the interaction between unilateral and internation-al liberalization and facilitation is a salient pattern of the APEC dynamics, with different pace of liberalization taking into account differing levels of economic development among APEC economies. It is apparent that considerable prog-ress in liberalization and facilitation of the investment regimes by member economies has been achieved over the past 15 years and has been an important factor for FDI, including intraregional FDI. While efforts at the firm-level are important in investing between partner countries/regions, the interaction between individual country efforts and regional initiatives is instrumental in promoting FDI. Governments can also help forge investment relationships, including strengthening relationships between investors and domestic firms. Given advantages offered by the respective countries/regions, greater investment by firms from partner countries/regions to each other, in the context of increased economic cooperation supported by regional initiatives, can only mutually enhance growth in both host and home countries/regions.
Table 2.4. Intraregional and extraregional FDI projects in APEC and other selected regional groups, average 2003–2005 and 2012–2014
(Billions of dollars) (% share in total)
Region Perioda Total Intra-regional
Extra-regional
Intra-regional
Extra-regional
APEC 2003–2005 389.8 239.1 150.7 61 39
2012–2014 467.9 328.3 139.6 70 30
ASEAN 2003–2005 55.0 6.1 48.9 11 89
2012–2014 80.0 10.1 70.0 13 87
MERCOSUR 2003–2005 36.0 1.5 34.5 4 96
2012–2014 43.8 1.6 42.2 4 96
European Union 2003–2005 324.7 176.8 147.9 54 46
2012–2014 262.3 103.8 158.6 40 60Source: UNCTAD cross-border M&A database for M&As, and information from the Financial Times Ltd, FDI Markets (www.fDimarkets.com) for greenfield projects.aThree-year average.Note: Data refer to the sum of the value of cross-border M&A and greenfield investment projects. Data for the value of greenfield FDI projects refer to estimated amounts of capital investment. Totals exclude the Caribbean financial centers.

21
I. IntroductionContemporary development theory has moved beyond a simple focus on export-led growth toward a greater preoccu-pation with the composition of exports. Emerging economies benefit not only from exporting ever-larger amounts of what they have always produced but profit even more from upgrading and diversifying their export base. Developing countries that manage to export a wider set of higher-quality (higher unit value) goods and services grow more rapidly and enjoy greater welfare gains than countries that do not (Hausmann et al. 2007). New exports to regional markets can make a valuable contribution. Penetrating developed country markets is particularly important (Mattoo and Subrama-nian 2010).
So the key challenge for development strategy has become how to move the domestic economy beyond traditional notions of “static” comparative advantage toward new dimensions of “dynamic” comparative advantage – a process of structural transformation that creates industries that are viable and competitive when exposed to international compe-tition.
Some countries have been able to rely on their own indigenous entrepreneurs to diversify and upgrade their economies. But most countries – from Malaysia and Indonesia to China and India – have looked to foreign direct investment (FDI) to try to propel the process of structural transformation. After all, in the contemporary era multinational corporations ac-count for 80 percent of all transfers of goods and services across borders, either within their own affiliate transactions or through networks constructed with independent providers. Thus the task for emerging market governments is to design trade-and-investment strategies to attract foreign investors into novel and higher-skill-intensive sectors, and link the host economy into FDI global supply chains.
This short paper will present models of market imperfections that hinder the use of FDI for structural transformation, investigate prominent case studies of countries that have been successful in overcoming such market imperfections, and draw policy conclusions for host governments in ASEAN and beyond. This paper draws directly on the evidence and analysis presented in Moran 2014. The paper concludes with some observations for the debate about whether emerging market authorities need to rely on “industrial policy” for development in today’s world, and delineates what the key ingredients of such an “industrial policy” might be.
II. FDI, supply chains, and structural transformation: a model of market failures For developing countries that want to attempt to use FDI to help with structural transformation, there is uncontested but perhaps surprising good news.
Popular discussion often portrays FDI in manufacturing and assembly as flowing primarily to lowest-skill, lowest-wage activities in the developing world, such as garments and footwear. But a closer look at the data paints quite a different picture – by far the majority of manufacturing FDI in developing countries flows to more advanced industrial sectors, and the weighting toward more skill-intensive investor operations is speeding up over time.
As Table 3.1 shows, the flow of manufacturing FDI to medium-skilled activities – such as transportation equipment, industrial machinery, electronics and electrical products, scientific instruments, medical devices, chemicals, rubber, and plastic products – is nearly ten times larger per year in the most recent period for which data are available than the flow to low-skilled, labor-intensive operations, and has been speeding up over time. The ratio between higher and lower skill-intensive activities was roughly five times larger in the period 1990–1992, and approximately 14 times larger in the period 2005–2007.
Chapter 3. Foreign direct investment, supply chain creation, and structural transformation: lessons for APECTheodore H. Moran,MarcusWallenbergProfessorofInternationalBusinessandFinance,GeorgetownUniversity;NonresidentSeniorFellow,PetersonInstituteforInternationalEconomics;NonresidentSeniorFellow,CentreforGlobal Development
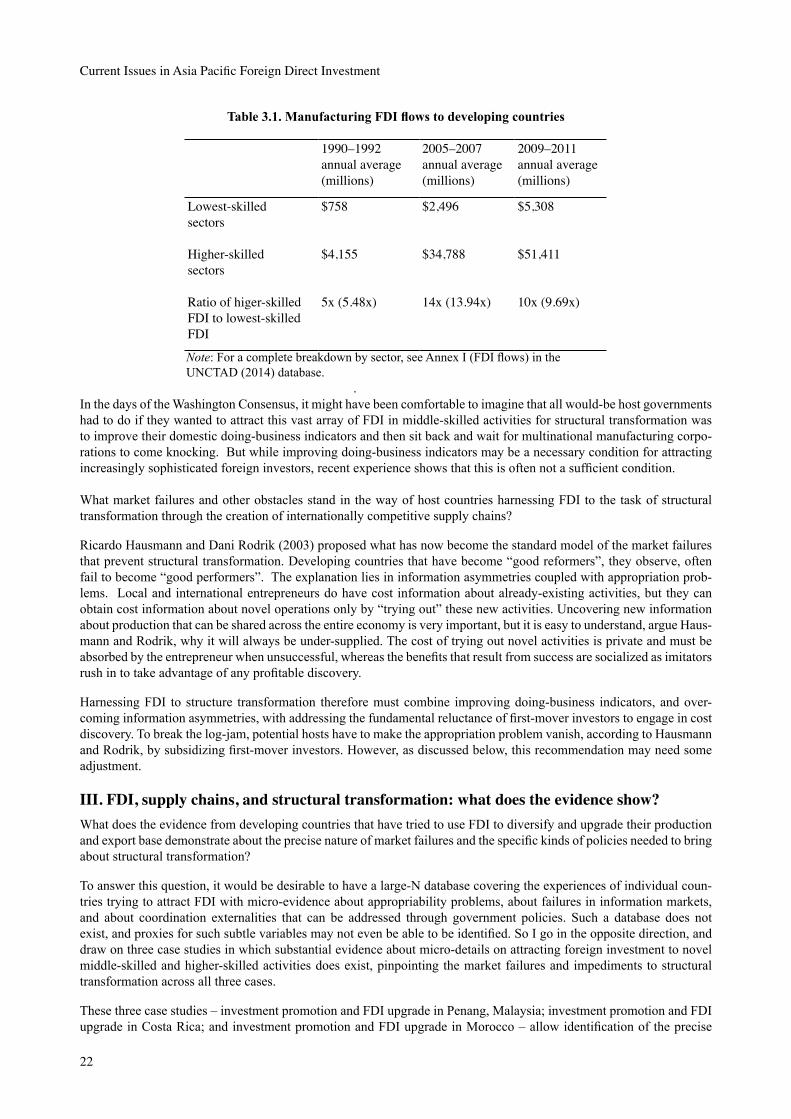
22
Current Issues in Asia Pacific Foreign Direct Investment
Table 3.1. Manufacturing FDI flows to developing countries
1990–1992 annual average (millions)
2005–2007 annual average (millions)
2009–2011 annual average (millions)
Lowest-skilled sectors
$758 $2,496 $5,308
Higher-skilled sectors
$4,155 $34,788 $51,411
Ratioofhiger-skilledFDItolowest-skilledFDI
5x(5.48x) 14x(13.94x) 10x(9.69x)
Note: For a complete breakdown by sector, see Annex I (FDI flows) in the UNCTAD (2014) database.
. In the days of the Washington Consensus, it might have been comfortable to imagine that all would-be host governments had to do if they wanted to attract this vast array of FDI in middle-skilled activities for structural transformation was to improve their domestic doing-business indicators and then sit back and wait for multinational manufacturing corpo-rations to come knocking. But while improving doing-business indicators may be a necessary condition for attracting increasingly sophisticated foreign investors, recent experience shows that this is often not a sufficient condition.
What market failures and other obstacles stand in the way of host countries harnessing FDI to the task of structural transformation through the creation of internationally competitive supply chains?
Ricardo Hausmann and Dani Rodrik (2003) proposed what has now become the standard model of the market failures that prevent structural transformation. Developing countries that have become “good reformers”, they observe, often fail to become “good performers”. The explanation lies in information asymmetries coupled with appropriation prob-lems. Local and international entrepreneurs do have cost information about already-existing activities, but they can obtain cost information about novel operations only by “trying out” these new activities. Uncovering new information about production that can be shared across the entire economy is very important, but it is easy to understand, argue Haus-mann and Rodrik, why it will always be under-supplied. The cost of trying out novel activities is private and must be absorbed by the entrepreneur when unsuccessful, whereas the benefits that result from success are socialized as imitators rush in to take advantage of any profitable discovery.
Harnessing FDI to structure transformation therefore must combine improving doing-business indicators, and over-coming information asymmetries, with addressing the fundamental reluctance of first-mover investors to engage in cost discovery. To break the log-jam, potential hosts have to make the appropriation problem vanish, according to Hausmann and Rodrik, by subsidizing first-mover investors. However, as discussed below, this recommendation may need some adjustment.
III. FDI, supply chains, and structural transformation: what does the evidence show?What does the evidence from developing countries that have tried to use FDI to diversify and upgrade their production and export base demonstrate about the precise nature of market failures and the specific kinds of policies needed to bring about structural transformation?
To answer this question, it would be desirable to have a large-N database covering the experiences of individual coun-tries trying to attract FDI with micro-evidence about appropriability problems, about failures in information markets, and about coordination externalities that can be addressed through government policies. Such a database does not exist, and proxies for such subtle variables may not even be able to be identified. So I go in the opposite direction, and draw on three case studies in which substantial evidence about micro-details on attracting foreign investment to novel middle-skilled and higher-skilled activities does exist, pinpointing the market failures and impediments to structural transformation across all three cases.
These three case studies – investment promotion and FDI upgrade in Penang, Malaysia; investment promotion and FDI upgrade in Costa Rica; and investment promotion and FDI upgrade in Morocco – allow identification of the precise

23
FDI, supply chain creation, structural transformation
nature of market failures and the specific kinds of industrial policies able to bring about structural transformation.
All three cases reinforce the well-established observation that even after developing countries undertake macro-, micro-, and institutional reforms they must take proactive steps to attract FDI, using effective and energetic Investment Promo-tion Agencies (IPAs) (Morriset et al. 2003, Wells Jr. and Wint 2000). The Penang Development Corporation in Malaysia, CINDE in Costa Rica, and the newly-renovated AMDI (Agence Morocaine de development des investissement) in Mo-rocco had to launch vigorous “campaigns” to place themselves on the informational horizon of multinational investors, especially multinational investors in non-traditional sectors.
But such evidence is not limited to case study materials. Torfinn Harding and Beata Javorcik provide rigorous econo-metric backing for this kind of investment promotion intervention (Harding and Javorcik 2012). Comparing data from 109 countries with an IPA and 31 without, they find that the presence of an IPA is correlated with higher FDI inflows, in particular higher FDI inflows into sectors targeted by the IPA, but only if the host has previously improved its local business climate. They compare FDI inflows into targeted sectors, before and after targeting, to FDI inflows into non-targeted sectors during the same time period, and find that active IPA targeting doubles FDI inflows. In checking for reverse causality, they find no evidence that targeting took place in sectors with relatively high or low inflows in the years preceding targeting.
Reinforcing the observations from Costa Rica, Morocco, and Malaysia, Harding and Javorcik discover – in a separate study – that FDI targeting by IPAs can be used to raise the quality of exports from the host economy (Harding and Javor-cik 2013). Examining evidence from 105 countries from 1984 to 2000, they show that the sectors given priority by the host IPA have higher unit values of exports. The authors’ data suggest that hosts can use foreign investment to increase the quality of exports both in absolute terms and in terms of bridging the distance to the quality frontier.
What is the imperfection in information markets that has to be overcome by host country policy? Here is where the micro-data from the case studies of Malaysia, Costa Rica and Morocco provide an important policy insight. The Haus-mann–Rodrik method to characterize the imperfection in information markets is to consider it as a problem of informa-tion asymmetries. But the case study evidence shows that this is an incorrect assessment.
Information asymmetry implies that one side (the host) has more and better information than the other side (the potential investor), which may well be true. But the core problem is that neither side knows whether a new and untried site will be an effective production location for investment in a novel economic activity. The key is for the would-be host to provide substantive assurance to the new investor in the novel sector that the investor can integrate local production seamlessly into the investor’s global supplier network; this requires more than a financial subsidy.
Evidence from Penang, Malaysia
Led by the regional government of Penang, Malaysia provides perhaps the largest pre-China illustration of using FDI for structural transformation of the local economy (for more detailed presentation of the evidence from Malaysia see Moran 2014). Over a mere four decades, beginning in the early 1970s, Malaysia shifted from being a resource-based economy, known throughout the world for rubber and tin, to a manufacturing powerhouse centered on large-scale electronics ex-ports. Manufacturing’s share of total exports rose from 6 percent in 1970 to over 70 percent by 2014. Along with several other states, the regional authorities in Penang played a pivotal role in this transformation.
When the Penang Development Corporation (PDC) launched the initial investment-promotion-cum-infrastruc-ture-build-out around Penang International Airport – consisting of phase one and phase two of construction of Bayan Lepas Free Industrial Zones from 1972 into the early 1980s – internationalization of the global electronics industry was driven by a search for low-wage labor-intensive production of printed circuit boards or assembling low-end products. As PDC tried to transform itself into an investment promotion agency with the same energy and effectiveness of the nearby Singapore Economic Development Board (EDB), the test for Malaysia was to induce international electronics in-vestors to upgrade their operations to more complex sub-assemblies and final products, complete with design functions and design teams, and high-performance quality-control procedures. The case study of Penang offers a key insight that will be reinforced in the two other case studies that follow. The principal challenge was to reassure foreign investors in middle-skilled activities that they would be able to link their plants in untried sites smoothly into the global production complex upon which the parent MNC’s competitive position in international markets depended.
What are the key ingredients that offer such reassurance? The most important are efficient infrastructure, and access to appropriately trained workers, supervisors, technicians, and managers. In Malaysia, the building of the electronics complex in Penang began with infrastructure construction adjacent to the state’s international airport on three sides.

24
Current Issues in Asia Pacific Foreign Direct Investment
To induce multinational investors to upgrade their operations to include more complex tasks, the PDC broadened its investment promotion functions to include the Penang Skills Development Corporation (PSDC) in 1989. With a steer-ing committee headed by Motorola, Hewlett-Packard, and Intel, the PSDC induced 24 “founder” firms to contribute equipment and assign executives to teach at the new campus financed by the state of Penang. Within seven years – in 1996 – a United States Agency for International Development (USAID) study ranked the PDSC as one of the ten lead-ing workforce development institutions in the world. In terms of infrastructure upgrades, the PDC meanwhile added IT improvements to transportation improvements. With intensive lobbying from the PDC, the Malaysian central govern-ment began plans for the Multimedia Super IT Corridor, and in 2005 chose Penang to be the first in the country to be awarded cyber-city status. Changing its name to InvestPenang in 2004, the former PDC began to target FDI in advanced electronics, with FDI in biotechnology, including, for example, electrical and electronic-based medical devices, auto-mation-based medical devices, and diagnostic tools. To make sure that vocational training programs keep pace with the novel FDI promotion efforts, the PSDC founded a Micro-Electronics Center of Excellence located at Universiti Sains Malaysia, which houses a world-recognized school of pharmacology.
Once anchor investors like Motorola, HP, Philips, and Texas Instrument became confident that they had mastered the task of seamless integration of the new sites, they moved rapidly ahead without pause. What is notable is that there are no indications of appropriability problems as first-mover electronics firms in Malaysia moved from low-wage assembly into higher-skill production and design activities. The US and European firms that led the upgrading of electronics operations – notably Motorola, Texas Instruments, Hewett-Packard, and Philips – steadily added more complex operations and design functions. Firm-level microdata document Motorola’s affiliate moving from rudimentary printed circuit board assembly for pagers and private radio systems to worldwide responsibility for design, development, and automated manufacture of double-sided six-layer printed circuit boards and for design and development of integrated circuits for disk drives and other peripherals (Rasiah 1995). Hewlett Packard progressed from assembly of calculators to manufacture, tooling development, process design, and even chip design for portable printers, desktop computers, and servers. Reflecting on the evolution of Texas Instruments, an executive observed, “We came for the cheap labour and the tax advantages, but we are staying because of the expertise we have built up here. As far as assembly and testing are concerned we have more expertise here than we have in the US. We sometimes have to send our Malaysian engineers to the States to solve their problems.” (Lim and Pang 1995, p111).
By the late 1980s Japanese overseas investment assumed the famous flying-geese pattern with great electronics firms following each other in formation to Malaysia as well as other locations in South-East Asia.
Before the worldwide recession of 2008, the electronics industry had become Malaysia’s leading manufacturing sector, accounting for 29 percent of gross domestic output, 56 percent of exports ($75 billion), and 29 percent of total em-ployment in the manufacturing sector (some 299,000 workers, supervisors, engineers, and managers). The economic downturn hit the Malaysian export sector particularly hard, but by 2014, Malaysian electronics exports had climbed back to $66 billion.
Evidence from Costa Rica
Costa Rica’s campaign to attract Intel offers a second slightly-later chronological case study with enough microdata to identify the market failures and other impediments to using FDI for structural transformation (for more detailed presen-tation of the evidence from Costa Rica, see Moran 2014). For Costa Rican authorities, the challenge was not to move from lower to higher skill operations within a single industry as in Penang but rather to shift export sectors completely.
By the time President Jose Figueres took office in 1994, the country had already undertaken a series of reforms that today would be called improving doing-business indicators in the domestic economy. The president himself directed the Costa Rican investment promotion agency, CINDE, to study the needs of the IT industry and target the semiconductor producer Intel as the principal company for FDI attraction (Spar 1998, Nelson 2009).
As in Penang, Costa Rica’s IPA CINDE did indeed provide detailed information about economic conditions, investment laws, and regulatory regimes to Intel negotiators. But the central preoccupation of Intel HQ was – as in Malaysia – reassurance that a semiconductor fabrication plant in Costa Rica could be smoothly bound into the parent’s worldwide supply chains. CINDE had to figure out ways to provide such reassurance, not simply offer more or better information, nor merely provide a financial subsidy.
Two issues dominated the 19 negotiating sessions between Costa Rica and Intel. First, CINDE, backed by personal involvement of President Figueres, had to offer infrastructure enhancements that included a speeded-up renovation of the national airport with special facilities for Intel freight, plus building a new power substation on the electrical grid dedicated to the prospective Intel semiconductor plant. Second, the Figueres administration had to form a public-private

25
FDI, supply chain creation, structural transformation
partnership for vocational training in which the national technological institute (Instituto Technological de Costa Rica) would co-design with Intel a training program for IT workers, supervisors, engineers, and managers. So, as in Penang, once Costa Rica provided reassurances about seamless integration, final negotiations about how to structure the final deal with Intel were able to proceed.
As in Malaysia, there has been no evidence of appropriation problems whatsoever in the Costa Rica case. First-mover Intel’s behavior since its original investment of $115 million in 1997 does not appear to have been slowed by an inability to earn sufficient returns; if anything, Intel has benefitted from cluster effects as other investors moved in. Intel followed its first plant with a second, and then added a global distribution center. In the decade and a half since 1997, Intel has invested an additional $900 million in Costa Rica, while increasing the number of local employees from 500 to 2,800, before a worldwide retrenchment strategy in 2014 led the company to shift from semiconductor assembly to software development in Costa Rica.
Evidence from Morocco
In Morocco, inward flows of FDI rose from less than one percent of GDP in the 1990s to an average around four percent of GDP during 2003–2007, before the international financial crisis caused such flows to plummet around the globe (for more detailed presentation of the evidence from Morocco see Moran 2014). But the largest volume of pre-crisis flows into Morocco remained largely centered in low-skill, low-value activities, and Morocco’s export profile has remained less sophisticated than the Philippines and El Salvador, along with China, India, Indonesia, and Thailand (IBRD and IFC 2012).
As countries on the periphery of the European Union prepare for renewed growth and recovery, the fundamentals in Morocco to attract higher-skill-intensive MNCs are favorable. Through the upheavals of the Arab Spring, the country has enjoyed relative political and economic stability, with widely noted progress in deepening Moroccan democratic in-stitutions. The economic fundamentals are strong: the macroeconomic environment is stable, with low rates of inflation, a modest buildup of international reserves, and a moderate public-debt-to-GDP ratio (especially external debt). Besides enjoying a beneficial market access agreement with the EU, the country completed a bilateral free trade agreement with the United States in 2006.
In recent years, Morocco has taken two major steps to prepare to attract more sophisticated FDI. First, it has renovated and energized the country’s investment promotion agency. As late as 2009, Morocco’s Investir au Maroc scored in the lowest, or “very weak,” ranking of the World Bank Group global investment promotion benchmarking, well below Jordan for example. In 2010, the central government set up a new IPA (Agence Morocaine de development des inves-tissement, AMDI) under capable and experienced leadership, with the mandate to go after sophisticated investors. This freshly designed agency provides a promising vehicle to move Morocco from the lower ranks in investment promotion toward the frontier of best practices around the world. AMDI is housed under the authority of the Ministry of Industry, Trade, and New Technologies, while enjoying considerable autonomy including the right to appeal decisions regarding FDI projects to the prime minister. With salaries higher than civil service, AMDI has enjoyed success in recruiting pro-fessional staff with private sector experience (at Procter and Gamble, for example, and at Price Waterhouse), organized into special industry teams.
Second, Morocco has undertaken a major effort to upgrade its infrastructure. While favorably located right on the periphery of the EU, the country nonetheless ranks in the Global Competitiveness Index at 69 of 142 countries. In mid-2009 the Kingdom launched Tangier Med II, a large expansion and renovation of the Tangier port facilities on the south coast of Gibraltar. Port construction is expected to reach full capacity by 2015 with the ability to move eight million containers, two million vehicles, and seven million passengers. The deep-water port facilities are surrounded by indus-trial parks and integrated with modernized rail lines into the interior of the country.
The initial investment promotion priority is to try to turn Tangiers into an automotive hub with the potential to reach a market of eight million owners in Spain, Portugal, France and Italy within three days of loading vehicles right off the production line onto ships. Inaugurated with Renault as an anchor investor, auto production in Tangiers is expected to reach 340,000 vehicles when phase II of Renault’s investment program is completed in 2015 (depending upon the extent of economic recovery in the EU). The French auto giant aims to bring in Nissan as an investor and hopes to induce a broad array of international parts suppliers to co-locate in the Tangier complex. Working together, Renault and Moroc-can authorities are establishing a center for vocational training in the automotive sector, with a curriculum to be designed by the private sector participants.
Success in attracting greater amounts of middle-skill FDI should not be beyond Morocco’s grasp, as the creation of the
26
Current Issues in Asia Pacific Foreign Direct Investment
aerospace cluster around Casablanca shows. This initiative was launched by a Moroccan national named Seddik Bel-yamani, who was Boeing’s Executive President for Worldwide Sales in Seattle. Beginning in 1997, Belyamani led an internal search within Boeing for more than a year to identify what aerospace components might be reliably be produced in Casablanca. Working with his counterpart senior executive in Royal Air Moroc, Hamid Benbrahim El-Andaloussi, the Boeing study led to creation of a joint venture between Boeing, Royal Air Moroc, and a Moroccan firm Labinal – the JV took the name Matis – to outsource creation of wire harnesses in Morocco. Boeing managers in Seattle initially ex-pected to achieve efficiency of only 30% of industry norms, but Matis efficiency hit 70% of industry standard efficiency within two years. The partnership between the two men made up for an otherwise ineffectual investment promotion structure in Morocco at the time. In 2002, Belyamani left Boeing and returned to Casablanca to become Chairman of Matis. Matis now builds wire bundles for the Boeing 737, 747, 757, 767 and 777 airplanes.
To ensure that current companies – and new investors – have access to an adequate supply of well-trained employees, the Organization of Moroccan Aeronautics Companies (Groupement des Industriels Marocain Aeronautique et Spatial, or GIMAS), the Union of Metallurgical Workers, and the Ministries of Labor, Industry, and Finance signed a convention in February 2009 – in the presence of King Mohamed VI – to set up an Institute for Aeronautical Training. With com-binations of classroom and on-the-job training lasting between 23 and 42 weeks, the Institute aims to train technicians in capacities such as engine overhaul, metallurgy, electrical systems, and numerical systems and controls, as well as mid-management professional development. The Organization of Moroccan Aeronautics Companies (GIMAS) plays a central role in the design of the curriculum, with continuous course renovation to meet the needs of current and potential employers. In 2013 aerospace exports climbed above $900 million.
As in Penang/Malaysia and Costa Rica, first-mover Boeing shows no evidence of being slowed by appropriabilty prob-lems. Boeing has expanded operations even as Airbus, SNECMA, Bombardier, and Embraer have set up export facili-ties in the same industrial parks.
IV. Backward linkagesThe analysis so far has focused on attracting FDI to diversify and upgrade the host economy. The next logical task is to investigate policies to promote spillovers from foreign investors to other firms in host country markets, especially spillovers in the form of vertical local supplier networks to multinational investors. Such spread of backward linkages has varied greatly across countries, and is by no means assured. What policies to promote backward linkages are more successful, and what policies are not?
The evidence repeatedly shows that the creation of local supplier networks in emerging markets depends on how wide the gap is between the capabilities of the local business providers and the sophistication demanded by the foreign pur-chaser. Kokko finds that spillovers between foreign affiliates and local firms in Mexico vary as a function of the produc-tivity difference between the two (Kokko 1994). Kokko et al. (1996) observe the same phenomenon in the Uruguayan manufacturing sector, as do Lui et al. (2009) in China. Blalock and Simon discover a more nuanced outcome—local firms with larger size and greater absorptive capacity gain more from downstream FDI, but local firms with weaker productive abilities show stronger motivation to adopt new technologies provided by downstream foreigners (Blalock and Simon 2009).
A first order of business for developing country authorities therefore is to adopt policies that increase the productivity and reliability of indigenous companies. Indigenous firms, no less than the foreigners they hope to serve, need open, transparent, dependable conditions in which to expand and become competitive, including access to low-cost imports, relatively flexible labor markets, and protection of intellectual property rights.
Of particular importance is the finding that access to credit constitutes an important constraint to the development of indigenous supplier networks. Around the world, domestic firms with greater access to credit show themselves to be able to self-select into supplier status (Alfaro et al. 2009). Using data from 72 countries for the period 1975–1995, Alfaro et al. show that countries with better functioning financial systems enjoy higher total factor productivity among suppliers. So reform of the financial sector is an important ingredient for providing a business-friendly setting for indigenous com-panies to grow and prosper. (The design of specific programs whereby potential suppliers finance equipment purchases on the basis of purchase contracts from foreign buyers is discussed next.)
Finally, a host may want to copy emerging market authorities in the ASEAN region that have set up explicit “vendor development” programs with the goal of promoting backward linkages from foreign investors. The first step is to work with foreign investor business associations to set up programs that prepare local firms to acquire certification within appropriate parameters, including ISO 9000 (quality control). Beyond this, many countries have followed the Singa-
27
FDI, supply chain creation, structural transformation
pore’s Economic Development Board (EDB) model for supplier development. Singapore’s EDB reimburses the salary of an engineer or a manager in each foreign plant who is assigned to act as a “talent scout” to select and assist local firms to become suppliers. As part of its Local Industry Upgrading Program (LIUP), the EDB provides capital for indigenous firms to buy equipment recommended by foreign investors, to be paid back from purchase contracts awarded by the foreigners. Originally dedicated to building supplier relationships in the electronics sector, the LIUP now covers med-ical products, petroleum and petrochemical, marine, transportation and logistics, and information technology clusters. Looking beyond Singapore, Malaysia has secondary industrial zones alongside the major EPZs, with data banks and “marriage counselors” to assist in supplier selection. Penang’s Skills Development Center has opened its doors to indig-enous Malaysian firms to partake of a curriculum organized around specific needs and skill gaps identified by foreign multinationals as important for their suppliers to master and overcome.
The analysis of how to design policies to promote backward linkages would not be complete, however, without intro-ducing one more controversial discovery into the debate. That is, contrary to popular rhetoric, there is no empirical basis for giving preferential attention to small and medium-sized enterprises (SMEs) if the goal is to strengthen the supplier base. The evidence shows that medium-sized and larger indigenous firms are usually better candidates to qualify as suppliers as the gap between their capabilities and the capabilities of those who wish to purchase their inputs is smaller than in the case of small firms (Freund 2011).
Developing country authorities frequently confound supply chain creation with support for SMEs. So do corporate social responsibility (CSR) advocates, including officers within the multinationals themselves. A close look at case stud-ies of supplier-development programs and vendor-development programs, however, does not support the proposition that small firms should be preferred targets for host country matchmakers or multinational corporation talent scouts. Despite its title, the evidence in the United Nations Conference on Trade and Development’s (UNCTAD) How to Create and Benefit from FDI-SME Linkages: Lessons from Malaysia and Singapore, for example, shows that medium-sized and larger indigenous companies “are more likely than their smaller counterparts to possess capabilities needed for linkages that result in ‘win-win’ scenarios.” (UNCTAD 2011). Host countries will be most successful in generating backward linkages from foreign investors to indigenous firms if they do not let supplier-support programs be captured by small-business lobbies.
V. The debate about “industrial policy” in harnessing FDI for supply chain creationThe evidence presented here shows that developing countries that want to use FDI to diversify and upgrade the pro-duction and export base of the host economy cannot simply sit back and wait to see what international market forces bring to them. They need interventionist policies to overcome imperfections in information markets, assure potential investors that they will be able to integrate plants in untried sectors smoothly into their worldwide production networks, and overcome coordination externalities to make such assurances credible.
Investment promotion target selection can take place within a common sense framework of comparative advantage, and IPA-sponsored feasibility studies will help confirm or cast doubt on the plausibility of success. Public sector “support” takes the form of creating industrial parks, reliable infrastructure, and vocational training with curricula designed by companies who wish to employ the graduates. These interventions surely qualify as a kind of industrial policy, and definitely cost public money. Multinational companies in some new sectors may thrive, while multinational companies in other new sectors may not prosper, or may never show up in the first place. These interventions need not include arti-ficial subsidies for specific companies or protection for infant industries that cannot be withdrawn later. Public programs for supplier identification, vendor development, and certification can be conducted in a transparent, competitive fashion, again with selection criteria laid out by firms who will provide purchase contracts to those that qualify.
With regard to subsidizing first movers, host country measures to ensure smooth integration and reduce the likelihood of disruptions – such as infrastructure improvements and public-private partnerships in vocational education – may or may not have a subsidy component. What is clear, however, is that the timing of host country expenditures to reassure first investors about smooth integration into global supply networks must be undertaken long before the calculation of economic and social externalities is anything but a gleam in the eye of the investment promotion agency (IPA) chairman, or minister, or president of the would-be host. The oft-cited economists’ formula to first calculate the value of social and economic externalities and then subsidize investors up to the level of that value is, alas, simply backwards.
To be sure, from the perspective of cost accounting, an electric power outage, a delay at a port or airport, or a shortage of technical workers can be entered into a spreadsheet that shows added costs of doing business. But reassuring the investor about quality control in production, and the speed and reliability of incorporating it into a firm’s global network, can-not be addressed by simply providing a larger financial subsidy, lowering tax rates, or offering sub-market input costs.
28
Current Issues in Asia Pacific Foreign Direct Investment
Rather the would-be host needs to address the seamless integration concerns of the investor head-on. This has direct implications for the powers entrusted to the IPA or the inter-ministerial investment promotion committee.
These policy recommendations might be called “light-form” industrial policy to hitch FDI to development goals and generate backward linkages as deep as possible into the host economy.
This light-form industrial policy might be contrasted with policies that target specific domestic industries for spe-cial government support and protection, while excluding foreign investment altogether from the targeted industries or subjecting foreign firms therein to performance requirements in the form of domestic content mandates, joint venture mandates, and/or other technology-sharing pressures. This alternative approach might be called “heavy-form” industrial policy.
The counterproductive results from trying to create internationally competitive local industries by simply imposing domestic content requirements on foreign investors, and from trying to induce multinationals to deploy their most ad-vanced technologies when they are required to form joint ventures with local firms, or share technology according to host mandates are well documented (for a comprehensive review of the effects of performance requirements see Moran 2011). Arbitrary domestic content mandates typically reduce the competitiveness of local goods and services (Hufbauer et al. 2013). Unless the domestic component requirements can be produced in an efficient manner, they run directly against international comparative advantage.
Joint venture requirements or other technology-sharing requirements induce foreign investors to withhold their cutting-edge techniques and processes. Mansfield and Romeo found that parent firms supplied technology to joint ven-tures in developing countries that was on average one-third older (three to four years older) than technology introduced into wholly-owned subsidiaries (Mansfield and Romeo 1980). Their samples included 65 observations spread across foreign investors in chemicals, drugs, electrical equipment and electronics, machinery, instruments, glass, food, and rubber.
Like joint venture mandates, host country requirements to share technology with local firms actually hindered technol-ogy transfer to the host economy. Blomstrom et al. (1992) found a negative correction between host policies that stip-ulate foreign investors must provide access to the parents’ patents, perform R&D in-country, or use the most advanced production processes available, and actual technology inflows into the host country. When host authorities impose technology-sharing requirements on Japanese firms as a condition of entry, Urata and Kawai observed a negative coefficient for intra-firm technology transfer (Urata and Kawai 2000).
Contemporary evidence from Eastern Europe and the successor states of the Soviet Union show that only less efficient foreign investors (relative to other firms in their industry) are likely to choose a joint venture mode of entry into a coun-try. Foreign investors with more sophisticated technologies and marketing skills prefer entry via wholly-owned affiliates rather than joint ventures (Javorcik and Saggi 2010).
Looking at skill transfer within multinational corporation networks more broadly, Ramachandran finds that the number of parent company employees sent to a host country to bring a given technology on line and the number of host country employees sent to the parent country for training is significantly higher when the parent has 100 percent ownership than for joint ventures or licensees across 14 sectors as diverse as chemicals, medical products, metal products, rubber, food, transportation equipment, and electronics (Ramachandran 1993).
The Korean experience is sometimes invoked as offering a path to the frontier of world industry that excludes contact with and reliance on multinational corporations. Some developing country authorities – including contemporary Chi-nese government officials – argue that Korea represents an “alternative model” that demonstrates infant industries can grow up to become world class competitors independent of and parallel to the foreigners.
In industries where technology was stable and could be replicated via licenses and for-hire foreign engineers – namely, shipbuilding and steel – Korea followed a model of excluding FDI, requiring domestic production of inputs, and cre-ating national champion companies via public support. But in industries where the international technological frontier was continuously pushed outward – especially computers, semiconductors, telecommunications, and high performance consumer electronics – Korea followed a different script (Moran 2011). All three of the companies that became Korean “national champions” – Samsung, Lucky Goldstar, and Huyndai – grew up as contract manufacturers for multina-tionals (for Sony, Panasonic, Mitsubishi, Zenith, Toshiba, Philips, Zenith, RCA, and Hitachi). After three decades of experience all three still relied on OEM contracts for 60 percent of their electronics exports. They expanded their own design expertise via learning-by-doing from foreign purchasers, not via forced technology-transfer or mandatory joint

29
FDI, supply chain creation, structural transformation
venture partnerships. They depended upon duty free imports of inputs for their own assembly, not domestic content requirements.
The Taiwan experience exhibits a similar pattern. Indigenous electronics firms began by selling components for calcu-lators, clocks, and VCRs to the local affiliates of IBM, Hitachi, and Philips; the more successful graduated to contract manufacturing of printed circuit boards, monitors, and power supplies. All the major Taiwanese computer makers – including ACER, Tatung, and Mitac – entered export markets as OEM suppliers to foreign multinationals, learning advanced design and own-brand marketing as they went. Not one became successful via forced joint-ownership with a multinational, or via mandatory domestic content requirements.
The Korean and Taiwanese experiences led Michael Hobday (1995), among others, to conclude that the route these countries followed – from contract manufacturers learning to meet the specifications of outsiders, to original component designers, to own brand producers in international markets – has more in common with OEM suppliers in Singapore, Malaysia, and Thailand than to the forced-technology-transfer national-champion-creation model as romanticized, or demonized, in China.
Despite the unpromising legacy of imposing explicit performance requirements on foreign investors, China is often viewed as the new testing ground.
Given the size and dynamism of the Chinese market, foreign investors can sometimes achieve the economies of scale that render domestic-oriented-industries elsewhere uncompetitive. In a handful of high profile industries, moreover, multinational corporations can be enticed into a “Faustian bargain” of deploying cutting-edge or near-cutting-edge technology in return for market access. High speed rail, wind technology and other green technologies, and perhaps aerospace and automotive investments are examples (US Congress 2012, Lewis 2013).
But a look at data from behind-the-headline investments in China reveal many of the same drawbacks of hard-form performance requirements deployed elsewhere. Long Guoqiang found that wholly-owned or majority-owned affiliates in China are much more likely to receive the most advanced technology available to the parent than 50-50 or domestic majority-owned joint ventures (Long 2005). Thirty-two percent of the wholly-owned foreign affiliates and 40 percent of the majority foreign-owned affiliates employed technology as advanced as used by the parent firm, whereas only 23 percent of the 50-50 share ownership affiliates and 6 percent of the majority Chinese-owned affiliates employed technol-ogy as advanced as the parent firm. The imposition of joint ownership requirements, in short, hinders foreign affiliates from reaching the technological frontier in China, as in other emerging markets.
This observation is reinforced by Bruce Blonigan and Alyson Ma (2010) who investigated whether Chinese domestic firms are “keeping up” or even “catching up” with foreign multinational investors in the volume, composition, and quality of their exports. Blonigan and Ma show that foreign investors’ share of exports by product category and foreign unit values relative to Chinese unit values are increasing over time, not decreasing. Of particular note for the debate about forced technology transfer here, their data show that joint venture partnerships with foreign firms do not lead to greater catching up in sophistication of output. Across the broad expanse of the domestic economy, heavy-form Chinese industrial policies to induce greater value-added within China and greater spillovers to Chinese firms are not showing notable success.
Recent research by Aghion et al. (2014) shows that Chinese use of tariffs which generally served to stifle competition have been systematically associated with worse firm performance than policies that worked to increase competition. More specifically, Du et al. (2014) found that the increased competition that accompanied China’s tariff reductions and entry into the WTO induced both backward linkages from foreign buyers to domestic suppliers and forward linkages from foreign suppliers to domestic buyers. They suggest that the elimination of domestic content requirements spurred technology transfer and other spillovers from foreign to domestic firms.
At the end of the day, the evidence reviewed here shows the clear need for a few specific public sector interventions to best harness FDI for development, but suggests that developing country authorities confine their efforts to “light-form” industrial policy, and eschew more heavy-form strategies that rely on domestic content mandates and requirements to participate via joint ventures or engage in other dictated technology-transfer practices.
The lessons for APEC countries seeking to increase FDI are clear. FDI offers a target-rich array of opportunities for host countries to upgrade and diversify their domestic economies. But host authorities have to move beyond improving doing-business indicators to launch a selective portfolio of public sector interventions. These public sector interventions include efficient proactive investment promotion efforts that are backed by packages of infrastructure improvements
30
Current Issues in Asia Pacific Foreign Direct Investment
and public–private partnerships for vocational training. These public sector interventions should eschew heavy-handed domestic content requirements, joint venture mandates, and technology-sharing regulations. The goal is to attract middle-skill and higher-skill foreign companies to set up affiliates that link the host to the global supply chains of the parents. Host authorities can then turn their attention to vendor-development programs that create backward linkages deep into the local economy. This is not a panacea for emerging market development, but comparative evidence from around the globe demonstrates that this is an effective route to increasing economic growth and expanding economic welfare for countries that are successful in the endeavor.
ReferencesAlfaro L., Kalemli-Ozcan S. and Sayek S. (2009). “FDI, Productivity and Financial Development”. World Economy 32, no. 1. 111–136. January.
Aghion P., Cai J., Du L., Harrison A. and Legros P. (2014) “Industrial Policy and Competition”, April 25.
Blalock G. and Simon D.H. (2009). “Do all firms benefit equally from downstream FDI? The moderating effect of local suppliers; capabilities on productivity gains.” Journal of International Business Studies. Volume 40 no. 7, 1075–1095. September.
Blomström M., Kokko A, and Zejan M. (1992). Host Country Competition and Technology Transfer by Multinationals. NBER Working Paper 4131. Cambridge, MA: National Bureau of Economic Research.
Blonigen B.A. and Ma A.C. (2010). “Please Pass the Catch-Up: The Relative Performance of Chinese and Foreign Firms in Chinese Exports” in Robert C. Feenstra and Shang-Jin Wei, eds., China’s Growing Role in World Trade. Chi-cago: University of Chicago Press for the NBER.
Capanelli G. (1997). “Buyer-Supplier Relations and Technology Transfer: Japanese Consumer Electronics”. Interna-tional Review of Economics and Business 44, no. 3 (September): 633–62.
Du L., Harrison A. and Jefferson G. (2014). “FDI Spillovers and Industrial Policy: The Role of Tariffs and Tax Holi-days”. World Development. Vol. 64, pp. 366–383.
Freund C. (2011). “Small & medium-sized enterprises: not a silver bullet for growth and job creation”. Voices and Views: Middle East and North Africa blog. The World Bank.
Harding T. and Javorcik B. (2012). “Foreign Direct Investment and Export Upgrading”. The Review of Economics and Statistics. 94 (4): 964–80.
Harding T. and Javorcik B. (2013). “Investment Promotion and FDI Inflows: Quality Matters”, CESifo Economic Stud-ies, 59(2).
Hausmann R, Hwang J, and Rodrik D. (2007). What You Export Matters. Journal of Economic Growth.
Hausmann R and Rodrik D. (2003). “Economic Development as Self-Discovery” Journal of Development Economics, vol. 72, December.
Hobday M. (1995). Innovation in East Asia: The Challenge to Japan. London: Aldershot. 2000. East versus Southeast Asian Innovation Systems: Comparing OEM- and TNC-led Growth in Electronics. In Linsu Kim & Richard Nelson, eds., Technology, Learning, & Innovation, New York: Cambridge University Press, 2000.
Hufbauer G.C., Schott J.J., Cimino C., Vieiro M. and Wada E. (2013). Local Content Requirements: A Global Problem. Policy Analyses in International Economics 102. Washington: The Peterson Institute for International Economics.
International Bank of Reconstruction and Development (IBRD) and International Finance Corporation (IFC). (2012). Country Partnership Strategy Progress Report for the Kingdom of Morocco for the period FY10–13. May 15.
Javorcik B.S. and Saggi K. (2010). Technological asymmetry among foreign investors and mode of entry. Economic Inquiry 48, no. 2 (April): 415–433.
Kokko A., Tansini R., and Lejan M.C. (1996). “Local Technological Capability and Productivity Spillovers from FDI in the Uruguayan Manufacturing Sector. Journal of Development Studies 32 (April): 602–11.
Kokko A. (1994). “Technology, Market Characteristics, and Spillovers.” Journal of Development Economics 43, no. 4

31
FDI, supply chain creation, structural transformation
(April): 279–93.
Lewis J.I. (2013). Green Innovation in China: China’s Wind Power Industry and the Global Transition to a Low-Carbon Economy, Columbia University Press. New York.
Lim L. and Pang E.F. (1995). Foreign Direct Investment and Industrialisation: in Malaysia, Singapore, Taiwan and Thailand, Paris: OECD.
Liu X, Wang C., and Wei Y. (2009). “Do Local Manufacturing Firms Benefit from Transactional Linkages with Mul-tinational Enterprises in China?” Journal of International Business Studies. Volume 40 no. 7, September. 1113–1131.
Long G. (2005). “China’s Policies on FDI: Review and Evaluation”. In Theodore H. Moran, Edward M. Graham, and Magnus Blomström. 2005. Does Foreign Direct Investment Promote Development? Washington: Institute for Interna-tional Economics
Mansfield E. and Romeo A. (1980). Technology Transfer to Overseas Subsidiaries by US-based Firms. Quarterly Jour-nal of Economics. 95 no. 4.
Mattoo A. and Subramanian A. (2010). ”Crisscrossing Globalization: The Phenomenon of Uphill Skill Flows,” in An-nual World Bank Conference on Development Economics 2009, Global: People, Politics, and Globalization, The World Bank, June. 115–140.
Moran T.H. (2011). Foreign Direct Investment and Development: Launching a Second Generation of Policy Research: Avoiding the Mistakes of the First, Reevaluating Policies for Developed and Developing Countries. Washington DC: Peterson Institute for International Economics.
Moran T.H. (2014). Foreign Investment and Supply Chains in Emerging Markets: Recurring Problems and Demon-strated Solutions. Working Paper 14-12. Peterson Institute for International Economics. Available at: http://piie.com/publications/interstitial.cfm?ResearchID=2722.
Morriset J. and Andrews-Johnson K. (2003). “The Effectiveness of Promotion Agencies at Attracting Foreign Direct Investment.” Washington DC: Foreign Investment Advisory Service Occasional Paper 16.
Nelson R.C. (2009). Harnessing Globalization: The Promotion of Nontraditional Foreign Direct Investment in Latin America. University Park, Pennsylvania: The Pennsylvania State University Press.
Ramachandran V. (1993). Technology Transfer, Firm Ownership, and Investment in Human Capital. Review of Econom-ics and Statistics. 75 no. 4: pp.664–70.
Rasiah R. (1995). Foreign Capital and Industrialization in Malaysia. New York: St. Martin’s Press.
Spar D. (1998). Attracting High Technology Investment: Intel’s Costa Rican Plant (Washington: World Bank Group, Foreign Investment Advisory Service Occasional Paper 11.
U.S. Congress. One Hundred Twelfth Congress, Second Session. (2012). Report to Congress of the U.S.–China Eco-nomic and Security Review Commission, November;
U.S. Congress. One Hundred Thirteenth Congress, First Session. (2013). Report to Congress of the U.S.–China Eco-nomic and Security Review Commission, November;
UNCTAD. (2007). Elimination of TRIMs: The Experience of Selected Developing Countries.
UNCTAD. (2011). How To Create and Benefit from FDI-SME Linkages: Lessons from Malaysia and Singapore. Best Practices in Investment for Development series, Geneva.
Urata S. and Kawai H. (2000). Intrafirm Technology Transfer by Japanese Manufacturing Firms in Asia. in, The Role of Foreign Direct Investment in East Asian Economic Development Takatoshi Ito and Anne O. Krueger, eds. Chicago: The University of Chicago Press for the National Bureau of Economic Research.
Wells Jr., L.T. and. Wint, A.G. (2000). Marketing a Country: Promotion as a Tool for Attracting Foreign Investment, Revised Edition, Washington DC: The International Finance Corporation, the Multilateral Investment Guarantee Agency, and the World Bank.
32
I. Introduction1
Why are some countries rich and others poor? Finding an answer to this question has been attempted in many different historical periods by numerous academics, politicians, social scientists and economists. Today we face a very interesting paradox. On the one hand, according to World Bank Statistics, the number of people in the world living in extreme pov-erty – that is, on less than $1.25 per day – has decreased dramatically in the past three decades. While in 1981 on average half of the citizens in the developing world used to live in extreme poverty, in 2010 that figure had decreased to 21 per-cent – despite a 59 percent increase in the developing world population. On the other hand, the gap between the richest and poorest countries in the world is increasing. Indeed, in 1776, when Adam Smith wrote “The Wealth of Nations”, the richest country in the world was approximately four times wealthier than the poorest country. The richest country in the world is now more than 400 times richer than the poorest country. What separates them? Knowledge, diversification and the composition of exports are part of the answer, all areas in which foreign investment has an important role to play.
History shows that at the end of the day, countries grow because they produce new and better goods and services, or find better ways to produce those goods and services, and retain more of the value added from their exports. Throughout this process, the key is how to connect the domestic economy with the international private sector. Foreign investment is an important vehicle to promote this connection.
International investment has the potential to be an important driver of economic growth and diversification. Shifting a country’s work force from lower into higher value added jobs will depend on fostering a wider range of opportunities for private economic activity, and on the ability of local companies to integrate into global production value chains. Foreign investment is the pathway to those global value chains, allowing developing countries the opportunity to engage with and benefit from the world economy. Foreign investors can create jobs, bring capital and new technologies, and create knowledge spillovers. But these benefits are not automatic. Some countries attract large quantities of foreign investment and never move up the value chain. In order to maximize the development impacts of foreign investment, a suitable investment policy framework is needed.
The difficulty starts when decision-makers try to identify what “investment policy” is, or should be. A huge range of stakeholders, problems, institutions, legal instruments, and administrative tools are captured in that concept. Countries get lost. Even if policy-makers can identify a destination, it can be difficult to know where to start, to know which con-crete actions will have the most impact.
A common mistake is that countries create investment policies to react to the challenges posed by the type of investment they are already receiving. Instead, a state needs to identify the opportunities to receive greater benefits from existing investments, and consider what other types of investment the country needs in order to develop. Many developing coun-try governments face difficulties in investment policy formulation, coordination and implementation, thus undermining their competitiveness and compromising the ability to attract investment. Governments may lack the information and capacity to understand the quantity, quality and type of investment a country is receiving. Data on the quantity of foreign direct investment (FDI) is often collected through multiple agencies using different sources and leading to data gaps and
1 ThispaperisbasedonaseriesofdocumentspreparedbytheInvestmentPolicyandPromotionTeamoftheWorldBankGroup(WBG).AllopinionsandpotentialerrorsexpressedinthisnotedonotrepresenttheviewsoftheWBGandarethefullresponsibility of the author. For a full explanation on the investment reform map process please visit Investment Policy and Promo-tionsiteat:https://www.wbginvestmentclimate.org/advisory-services/international-trade/investment-policy/
Chapter 4. Connecting the dots between international trade and investment regulation, investment climate reform and development: the World Bank’s investment reform mapRoberto Echandi, Global Lead, Investment Policy and Promotion, Trade and CompetitivenessGlobalPractice,WorldBankGroup
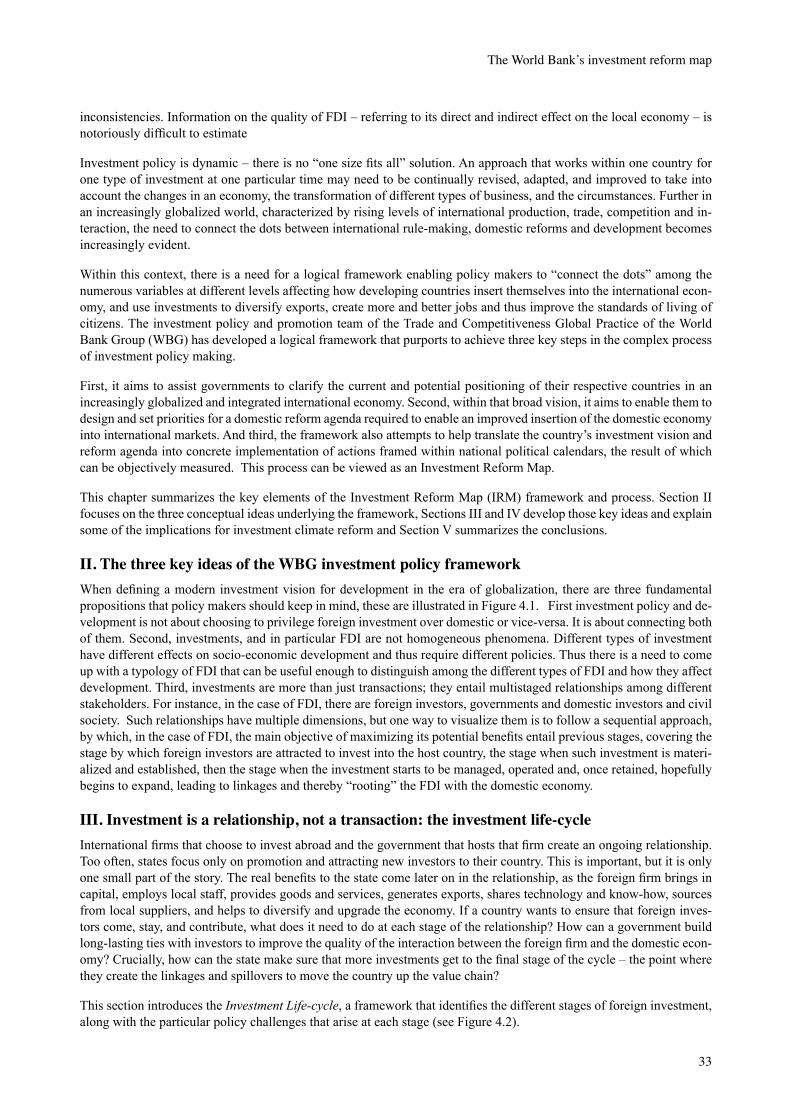
33
The World Bank’s investment reform map
inconsistencies. Information on the quality of FDI – referring to its direct and indirect effect on the local economy – is notoriously difficult to estimate
Investment policy is dynamic – there is no “one size fits all” solution. An approach that works within one country for one type of investment at one particular time may need to be continually revised, adapted, and improved to take into account the changes in an economy, the transformation of different types of business, and the circumstances. Further in an increasingly globalized world, characterized by rising levels of international production, trade, competition and in-teraction, the need to connect the dots between international rule-making, domestic reforms and development becomes increasingly evident.
Within this context, there is a need for a logical framework enabling policy makers to “connect the dots” among the numerous variables at different levels affecting how developing countries insert themselves into the international econ-omy, and use investments to diversify exports, create more and better jobs and thus improve the standards of living of citizens. The investment policy and promotion team of the Trade and Competitiveness Global Practice of the World Bank Group (WBG) has developed a logical framework that purports to achieve three key steps in the complex process of investment policy making.
First, it aims to assist governments to clarify the current and potential positioning of their respective countries in an increasingly globalized and integrated international economy. Second, within that broad vision, it aims to enable them to design and set priorities for a domestic reform agenda required to enable an improved insertion of the domestic economy into international markets. And third, the framework also attempts to help translate the country’s investment vision and reform agenda into concrete implementation of actions framed within national political calendars, the result of which can be objectively measured. This process can be viewed as an Investment Reform Map.
This chapter summarizes the key elements of the Investment Reform Map (IRM) framework and process. Section II focuses on the three conceptual ideas underlying the framework, Sections III and IV develop those key ideas and explain some of the implications for investment climate reform and Section V summarizes the conclusions.
II. The three key ideas of the WBG investment policy framework When defining a modern investment vision for development in the era of globalization, there are three fundamental propositions that policy makers should keep in mind, these are illustrated in Figure 4.1. First investment policy and de-velopment is not about choosing to privilege foreign investment over domestic or vice-versa. It is about connecting both of them. Second, investments, and in particular FDI are not homogeneous phenomena. Different types of investment have different effects on socio-economic development and thus require different policies. Thus there is a need to come up with a typology of FDI that can be useful enough to distinguish among the different types of FDI and how they affect development. Third, investments are more than just transactions; they entail multistaged relationships among different stakeholders. For instance, in the case of FDI, there are foreign investors, governments and domestic investors and civil society. Such relationships have multiple dimensions, but one way to visualize them is to follow a sequential approach, by which, in the case of FDI, the main objective of maximizing its potential benefits entail previous stages, covering the stage by which foreign investors are attracted to invest into the host country, the stage when such investment is materi-alized and established, then the stage when the investment starts to be managed, operated and, once retained, hopefully begins to expand, leading to linkages and thereby “rooting” the FDI with the domestic economy.
III. Investment is a relationship, not a transaction: the investment life-cycleInternational firms that choose to invest abroad and the government that hosts that firm create an ongoing relationship. Too often, states focus only on promotion and attracting new investors to their country. This is important, but it is only one small part of the story. The real benefits to the state come later on in the relationship, as the foreign firm brings in capital, employs local staff, provides goods and services, generates exports, shares technology and know-how, sources from local suppliers, and helps to diversify and upgrade the economy. If a country wants to ensure that foreign inves-tors come, stay, and contribute, what does it need to do at each stage of the relationship? How can a government build long-lasting ties with investors to improve the quality of the interaction between the foreign firm and the domestic econ-omy? Crucially, how can the state make sure that more investments get to the final stage of the cycle – the point where they create the linkages and spillovers to move the country up the value chain?
This section introduces the Investment Life-cycle, a framework that identifies the different stages of foreign investment, along with the particular policy challenges that arise at each stage (see Figure 4.2).
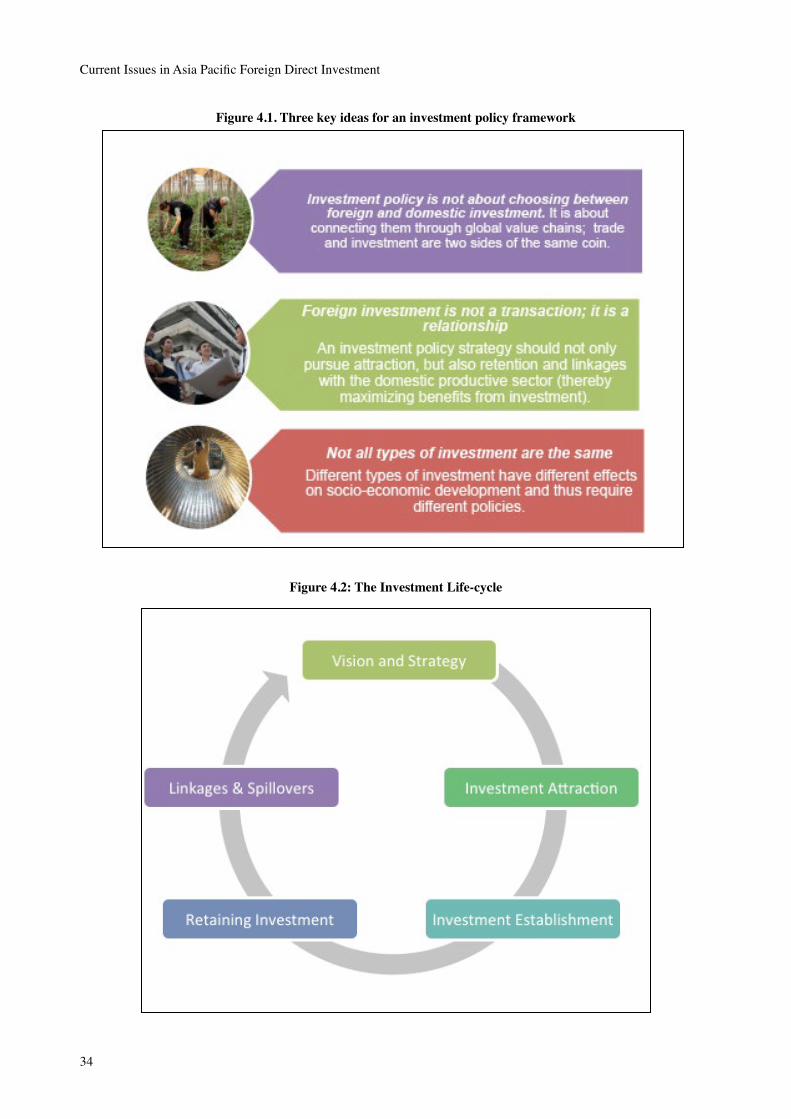
34
Current Issues in Asia Pacific Foreign Direct Investment
Figure 4.1. Three key ideas for an investment policy framework
Figure 4.2: The Investment Life-cycle
35
The World Bank’s investment reform map
Investment vision and strategy
As a foundation for any foreign investment activity to occur, the state must have an Investment Vision, a position about foreign investment and how it sees the role it can play in its overall development strategy. This position informs the types of investment the state will allow or not allow, under what conditions, and for what purposes. This position may be a result of active, engaged policy making, with clear decisions, or it may have evolved over time without a focused effort or decision from the government. Every country in the world already has some form of position on foreign invest-ment – expressed through international commitments, laws and regulations, procedures and through the informal ways that the state engages with foreign firms.
However, what works for one type of investment may not work for another. In some cases, the very policies used to mitigate harm may discourage or undermine the positive impacts of other types of investment. For example, incentives that promote export-oriented production may make it more difficult for market-seeking investors to access inputs. Local content policies aimed at improving the connectedness of foreign extractives firms within the community may make it impossible for exporting firms to remain competitive.
The Investment Vision, put simply, is an ongoing process that helps to ensure that the country’s position on foreign investment – the foreign investment policies themselves – meet the broader development needs of its people.
As an example, a primary objective of an Investment Vision is to increase the integration of the private sector in devel-oping countries into global value chains. The Investment Vision does this by setting the following priorities:
(i) removing legal, regulatory, and administrative impediments to attracting and retaining FDI in intermediate goods and services;
(ii) ensuring compatible and supporting trade and investment regimes; and
(iii) maximizing the integration and spillovers from FDI into the domestic economy.
To devise and agree on a Vision, the WBG works alongside governments to engage in “Investment Reform Mapping” (IRM). The details of this process may vary depending on the circumstances and needs of each country, but its purpose is to help the government set priorities, to assign responsibilities, to identify opportunities for collaboration, and to define the intended impacts of investment policy reform. This guide may be seen as the first step in an IRM process. As a coun-try’s Investment Vision and strategy are refined over time, the IRM will also be adjusted to the changing circumstances.
Investment attraction
The first stage of the Investment Life-cycle, investment attraction, is the point when a foreign investor begins to consider a jurisdiction as a potential investment location. Every country in the world competes to attract foreign investors. Given this competition, two common elements are used by countries to attract investors – by undertaking investment promo-tion, and by offering incentives to investors.
Investment promotion
The current highly competitive environment for FDI requires both a favorable investment climate and investment pro-motion efforts. Investors look for political, social and economic stability, a welcoming legal/regulatory/operating envi-ronment and a helping hand to speed up their exploration of opportunities, establishment and operation. Governments are becoming increasingly aware of the role that Investment Promotion Institutions (IPIs) play as implementers of investment policies and strategies to attract those investors to their locations, particularly with respect to:
• Strengthening a location’s image
• Servicing investors’ information needs
• Targeting and generating investment
• Advocating for policy reform for a better business enabling environment
Several studies have shown that there is, indeed, a positive correlation between investment promotion activities and investment (Wells and Wint 1990; Morisset and Andrews-Johnson 2004; Harding and Beata 2007). Most developing or emerging countries face an uphill battle when trying to attract foreign investment. Aside from the BRICS, that boast large internal markets, most countries find that foreign firms know little about them, or about investment opportunities

36
Current Issues in Asia Pacific Foreign Direct Investment
that may exist. In its most basic form, investment promotion is about making the country visible to foreign investors, and raising awareness of investment opportunities found in the host state. More advanced, and successful, approaches to investment promotion are tailored to highlight the strengths of a country’s existing investment climate, and target international investors who have the potential to contribute in strategic sectors and activities. An investment promotion strategy is an important component of broader reforms to improve a country’s investment climate, and should be aligned with the legal and procedural reforms recommended in relation to different aspects of the investment life-cycle.
Investment incentives
Over the past two decades, incentives have become an increasingly pervasive feature of global competition for FDI. However, despite the growing popularity of incentives in developed and developing countries alike, there is still confu-sion on the role incentives play in generating investment and fostering different policy objectives. Investment incentive is indeed a complex topic, with many different variables and issues at play, which does not allow for “one size fits all” solutions. For this reason, the discussion on the role of investment incentives should differentiate between locational incentives and behavioral incentives. The former influence investors’ decisions on where to locate and, using the In-vestment Typology, are especially relevant for efficiency-seeking investment. The latter induce investors to engage in particular behaviors in light of desired policy objectives.
The topic of incentives needs to take into consideration what is happening on the global stage, rather than being based entirely on the domestic reality of a particular country. Although incentives need to be fiscally sustainable, policy advice has to bear in mind benefits, spillovers and generally other positive aspects beyond fiscal sustainability when assessing their overall effectiveness. Incentives also need to be examined using a sector-specific lens, differentiating between different types of services and manufacturing. Not only fiscal, but also non-tax or “financial” incentives (such as grants, loans and reduced prices on land) need to be assessed with equal emphasis. Table 4.1 sets out some of the most common modes of tax and financial incentives that are used today.
Table 4.1. Modalities of tax and financial incentives
Fiscal incentives Financial incentives
Income tax Tax holiday or lower tax rate Direct grants & cost-sharing schemes
Cash grants on proof of start-up or after X years of opera-tion
Investment allowance Matching grants
Accelerated depreciation Public sector equityparticipation
Special deductions Reduced market values/ direct provision of land
Public land or buildings sold to investors at below market values
Exempted income Low input prices from para -statal companies
Reduced rates on public utilities (e.g. electricity, water) and transportation
Exemption from withholding Lending instruments and guarantees
Soft loans
Tax rebate/credit Interest subsidies
Value added tax (VAT)
VAT zero rated goods Loan guarantees
Exemption from import VAT
VAT exemption (domestic sales)
Remission from VAT
Customs duty Duty exemption
Duty remission
37
The World Bank’s investment reform map
Evidence from both surveys and econometric studies indicate that the key determinants affecting an investor’s decision on where to locate are often based on broad economic and investment climate factors, such as market size, regulatory policies, natural resource endowments, infrastructure, and human capital availability. Investment incentives, therefore, tend to be most relevant at the margins of investor decision-making; they are likely to be most influential when investors are wavering between like options, and when a country already has a favorable investment climate.
Despite this caveat, many countries at all levels of development are relying heavily on incentives as part of their suite of investment policies and allocating scarce government resources to fund these instruments. Moreover, since incentives have implications relating to political economy, competition policy (potentially spurring a “race to the bottom” at the re-gional, national and subnational levels) and sustainability (often representing significant burden on budgets), it becomes especially critical for policymakers and practitioners to adopt a holistic approach to rationalize a country’s incentives regime based on good practices.
However, states often do not know how much those incentives actually cost to maintain, or whether they are getting value for money. Incentives are only one small part of the landscape that investors consider when undertaking a foreign venture – and some investors will be more motivated than others by their presence. These issues, and the policy tools used to resolve them, are discussed in more detail below under Investment Incentives.
Investment establishment
The second stage addressed in the investment life-cycle is investment establishment. Once an investor has made the decision to begin business in the host country, the investor will likely have to comply with certain legal or procedural requirements to enter the country, create a legal entity, secure premises or other assets, hire or transfer staff, bring in capital and other funding, and access business services, such as bank accounts.
Although every country in the world seeks foreign investment, very few maintain an entirely open investment regime. Some limitations may intentionally discriminate against foreign firms, for example, when a country closes a sector for security or cultural reasons, or to protect domestic industries. Other limitations may arise as a substitute for regulation, or because of institutional dynamics and inefficiencies. Investment establishment considers all of the “barriers to entry” that a foreign investor faces at the entry stage. Investment entry barriers can include both rule-based, legal barriers (re-ferred to as de jure barriers) and factual barriers that arise on the ground (referred to as de facto barriers).
In addition, de jure barriers may be further distinguished as legal and regulatory barriers, restricting the investment on its merit (e.g. on the basis of the particular sector, the mode of investment, the amount of investment, or the identity of the investor) or procedural, imposing lengthy or complicated entry procedures on the investor (e.g. registration, notification, obtaining work permits/visas, recognition of foreign documents, and opening an account in foreign currency). Table 4.2 sets out a typology of entry barriers, with examples of the types of rules and practices that fall within each category.
Retaining investment
Once a firm is established, the third stage of the life-cycle relates to investment retention. At this stage, political risks such as expropriation, instability and uncertainty might discourage investors from expanding their existing businesses in the host country, or even cause them to relocate or close their businesses.
While some types of investment tend to be more mobile than other (e.g. as is the case for efficiency-seekers, discussed below), many foreign investors enter a new market with the intention to stay. Established investors play an increasingly important role in FDI flows, with UNCTAD reporting that reinvested earnings by existing investors made up more than 60% of the world’s foreign investment outflows in 2012. The World Bank’s FDI figures show that over the past decade, reinvested earnings account for between a quarter and a third of all FDI flows received by developing countries. Yet states often approach foreign investment as a one-time transaction – once the investor agrees to come, the investment promotion agency has achieved its task and largely disengages. In failing to recognize foreign investment as a relation-ship, countries undermine their ability to reap the benefits of subsequent expansion, technology transfer, job creation, and domestic competition.
A key concern for foreign investors in any country is the extent to which they are exposed to “political risk” – the probability of disruption of business operations by political forces or events. As shown in Figure 4.3, political risk has emerged as a significant constraint for foreign investment in developing countries – challenging their ability to attract and retain investment. Around 30% of foreign investors surveyed by MIGA in 2013 either stopped expanding their in-vestments or withdrew their businesses from host countries due to problems arising from government conduct, such as expropriation, breach of contract, restrictions on transfer of payments and adverse regulatory changes.
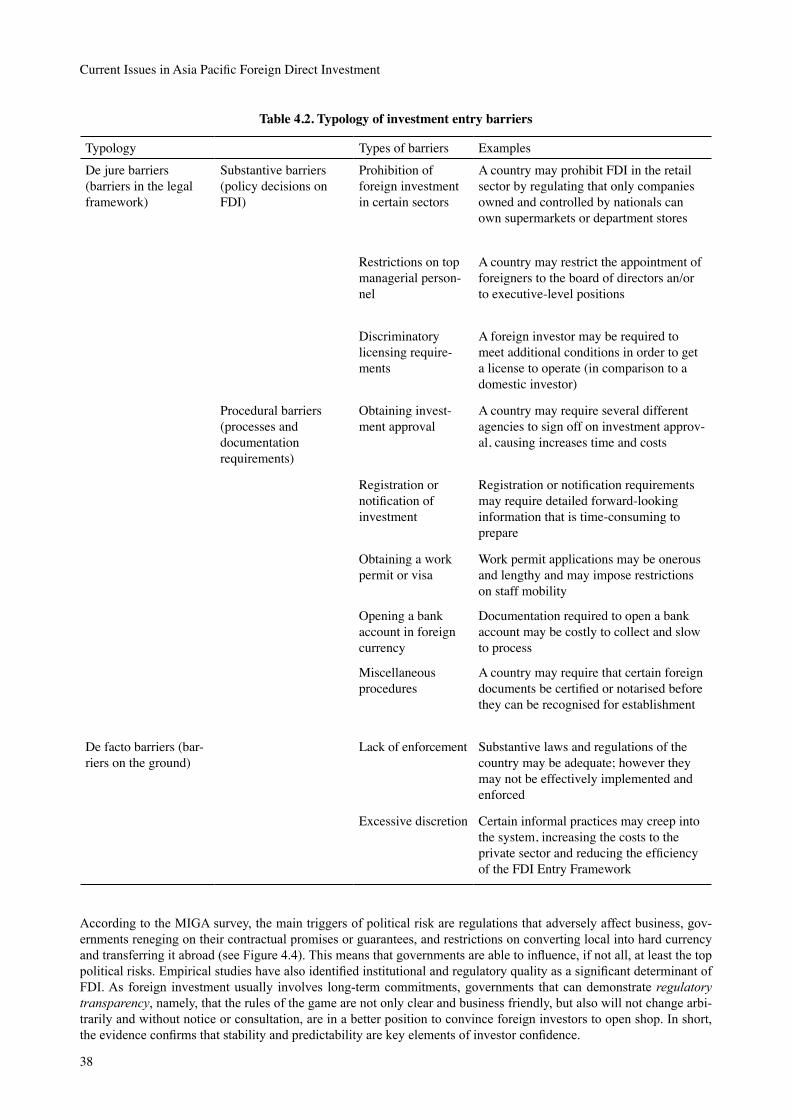
38
Current Issues in Asia Pacific Foreign Direct Investment
Table 4.2. Typology of investment entry barriers
Typology Types of barriers Examples
De jure barriers (barriersinthelegalframework)
Substantive barriers(policydecisionsonFDI)
Prohibition of foreign investment in certain sectors
A country may prohibit FDI in the retail sector by regulating that only companies owned and controlled by nationals can ownsupermarketsordepartmentstores
Restrictions on top managerial person-nel
A country may restrict the appointment of foreignerstotheboardofdirectorsan/orto executive-level positions
Discriminatory licensingrequire-ments
Aforeigninvestormayberequiredtomeet additional conditions in order to get alicensetooperate(incomparisontoadomesticinvestor)
Procedural barriers (processesand documentation requirements)
Obtaininginvest-ment approval
Acountrymayrequireseveraldifferentagencies to sign off on investment approv-al, causing increases time and costs
Registration or notificationofinvestment
Registrationornotificationrequirementsmayrequiredetailedforward-lookinginformation that is time-consuming to prepare
Obtainingaworkpermit or visa
Workpermitapplicationsmaybeonerousand lengthy and may impose restrictions on staff mobility
Openingabankaccount in foreign currency
Documentationrequiredtoopenabankaccount may be costly to collect and slow to process
Miscellaneous procedures
Acountrymayrequirethatcertainforeigndocumentsbecertifiedornotarisedbeforethey can be recognised for establishment
Defactobarriers(bar-riersontheground)
Lackofenforcement Substantive laws and regulations of the countrymaybeadequate;howevertheymay not be effectively implemented and enforced
Excessive discretion Certain informal practices may creep into the system, increasing the costs to the privatesectorandreducingtheefficiencyoftheFDIEntryFramework
According to the MIGA survey, the main triggers of political risk are regulations that adversely affect business, gov-ernments reneging on their contractual promises or guarantees, and restrictions on converting local into hard currency and transferring it abroad (see Figure 4.4). This means that governments are able to influence, if not all, at least the top political risks. Empirical studies have also identified institutional and regulatory quality as a significant determinant of FDI. As foreign investment usually involves long-term commitments, governments that can demonstrate regulatory transparency, namely, that the rules of the game are not only clear and business friendly, but also will not change arbi-trarily and without notice or consultation, are in a better position to convince foreign investors to open shop. In short, the evidence confirms that stability and predictability are key elements of investor confidence.

39
The World Bank’s investment reform map
Once an investment has been made – and investors have “sunk” costs and can therefore withdraw less easily – the bar-gaining position of the host government tends to increase, and so may the temptation to change the rules of the game. But preserving relationships with foreign businesses already in the country is equally, if not more, important than attract-ing new investors. The ability of governments to protect investors already in the country and address issues they may face can go a long way to instill confidence with positive effects on expansion plans and retained investment.
Figure 4.3. Greatest constraints on investment in developing countries from 2012 to 2015
Source:MIGA(2013)WorldInvestmentandPoliticalRiskReport,IBRD/WorldBank.
Figure 4.4: Top Political Risks from 2012 to 2015
Source:MIGA(2013)WorldInvestmentandPoliticalRiskReport,IBRD/WorldBank.
Linkages and spillovers
The final stage of the investment life-cycle focuses on the way that a mature foreign investment can contribute more broadly to the domestic economy, through technology transfer, employment, and skills transfer and spillovers, links with local suppliers and GVCs, and more broadly, diversifying and upgrading the local economy. Although some countries may seek foreign investment solely for the inflow of capital it brings, many more recognize that foreign firms can con-
40
Current Issues in Asia Pacific Foreign Direct Investment
tribute in other essential ways to the development of the domestic economy. But many policy-makers struggle with how to secure those benefits. Attempts to “force” transfers of technology, local sourcing or local employment may backfire if firms are unwilling or unable to comply with the regulations, or if local staff and firms do not yet produce the quality and quantity on inputs or skills needed.
The evidence for positive innovation-related spillovers from FDI varies significantly by country, sector and enterprise. Essentially, technology and know-how can be diffused from foreign investors through various mechanisms including:
• Content of goods and services;
• Supplier development and sourcing specification manuals;
• Assistance enhancing quality accreditation;
• Accessing international marketing networks;
• Mobility of workers / managers;
• Cluster initiatives; and
• Informal linkages. However, innovation and technology-related benefits from FDI will not flow automatically. Thus, positive spillover effects cannot be taken for granted. Much depends on:
• The investment policy framework;
• The investment climate;
• Motivation and capacity of local firms to harness the innovation and capitalize on the new technologies;
• Characteristics and behavior of the foreign investors, which underscores the importance of under-standing the different types of FDI;
• Intermediary agencies such as the investment promotion institutions (IPIs). Two areas of investment policy deserve closer attention when discussing linkages and spillovers. These are local content and non-equity modes of investment (NEMs).
Domestic value addition
Many developing and transition economies introduce local content policies in order to foster spillovers to the local economy from foreign investments and to help integrate local industries into global supply chains. However, different types of policies attempting to foster domestic value addition can have vastly different impacts on both domestic and foreign trade and investment. Table 4.3 offers a general typology of those policies in the form of a “traffic-light”. Some of these policies (shaded in red) are competition and highly trade-distortive and can deter FDI inflows. Others (amber) may work provided that the host country market has certain characteristics, and (green) are suggested to be less trade-, and competition-, distortive.
There are a number of misconceptions about how to design and implement policies fostering domestic value addition, examples of which are set out in Table 4.4. Many issues arise because policies that are designed with one type of in-vestment in mind (e.g. investment in extractive industries) can have adverse impacts on other types of investment (e.g. export manufacturing investments).
Non-equity modes of investment
While local content requirements pressure investors to engage with local suppliers, there are alternative ways to en-courage and support linkages through legal frameworks for business. “Non-equity modes of investment” each involve a business relationship where a foreign firm invests through an intangible asset, such as product design, know-how, a business model, or a brand. Foreign investors partner with a local firm by contract, and capital ownership remains with the domestic partner. Because they can provide access to knowledge, technology, capacity, and international distribution networks, NEMs can be a powerful vehicle to quickly upgrade the capacity of the domestic private sector with compa-rably low risk for foreign investors.
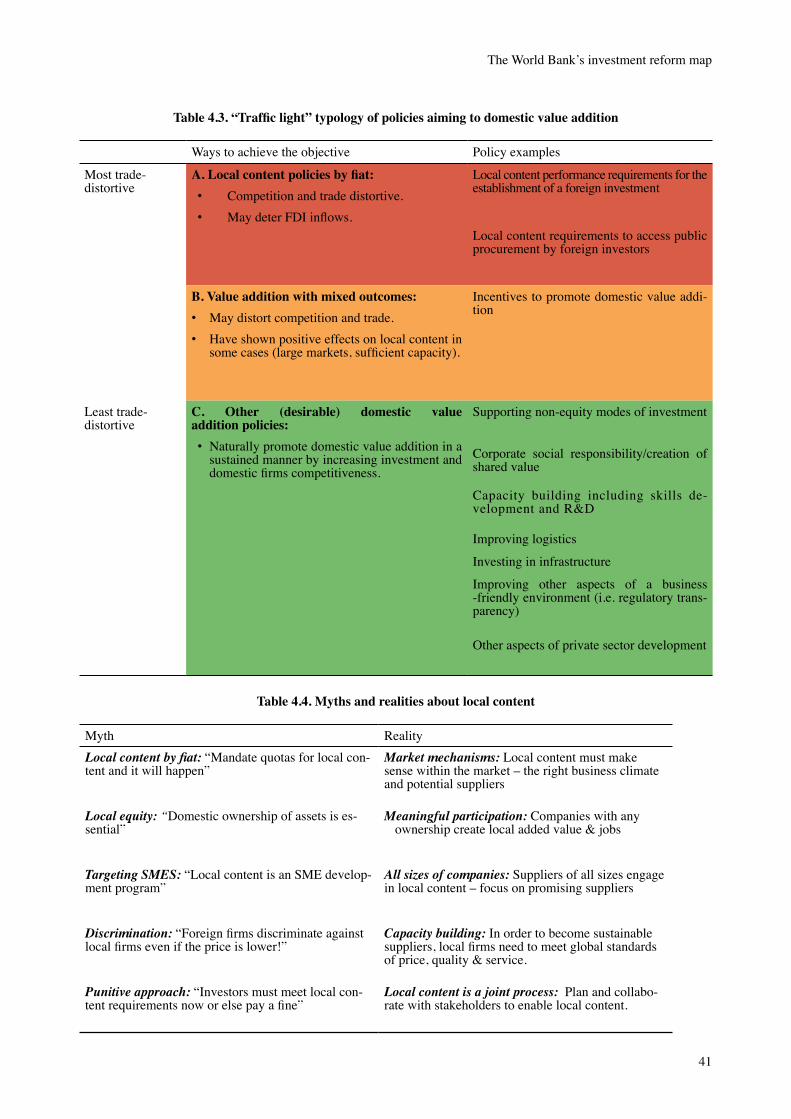
41
The World Bank’s investment reform map
Table 4.3. “Traffic light” typology of policies aiming to domestic value addition
Waystoachievetheobjective Policy examples
Most trade- distortive
A. Local content policies by fiat: • Competition and trade distortive.• MaydeterFDIinflows.
Localcontentperformancerequirementsfortheestablishment of a foreign investment
Localcontentrequirementstoaccesspublicprocurement by foreign investors
B. Value addition with mixed outcomes:• May distort competition and trade.• Haveshownpositiveeffectsonlocalcontentin
somecases(largemarkets,sufficientcapacity).
Incentives to promote domestic value addi-tion
Least trade- distortive
C. Other (desirable) domestic value addition policies:• Naturallypromotedomesticvalueadditionina
sustained manner by increasing investment and domesticfirmscompetitiveness.
Supportingnon-equitymodesofinvestment
Corporate social responsibility/creation ofshared value
Capacity building including skills de-velopment and R&D
Improving logistics
Investing in infrastructure
Improving other aspects of a business -friendlyenvironment(i.e.regulatorytrans-parency)
Otheraspectsofprivatesectordevelopment
Table 4.4. Myths and realities about local content
Myth RealityLocal content by fiat: “Mandatequotasforlocalcon-tent and it will happen”
Market mechanisms: Localcontentmustmakesensewithinthemarket–therightbusinessclimateand potential suppliers
Local equity: “Domestic ownership of assets is es-sential”
Meaningful participation: Companies with any ownership create local added value & jobs
Targeting SMES: “Local content is an SME develop-ment program”
All sizes of companies: Suppliersofallsizesengageinlocalcontent–focusonpromisingsuppliers
Discrimination:“Foreignfirmsdiscriminateagainstlocalfirmsevenifthepriceislower!”
Capacity building: In order to become sustainable suppliers,localfirmsneedtomeetglobalstandardsofprice,quality&service.
Punitive approach: “Investors must meet local con-tentrequirementsnoworelsepayafine”
Local content is a joint process: Plan and collabo-ratewithstakeholderstoenablelocalcontent.
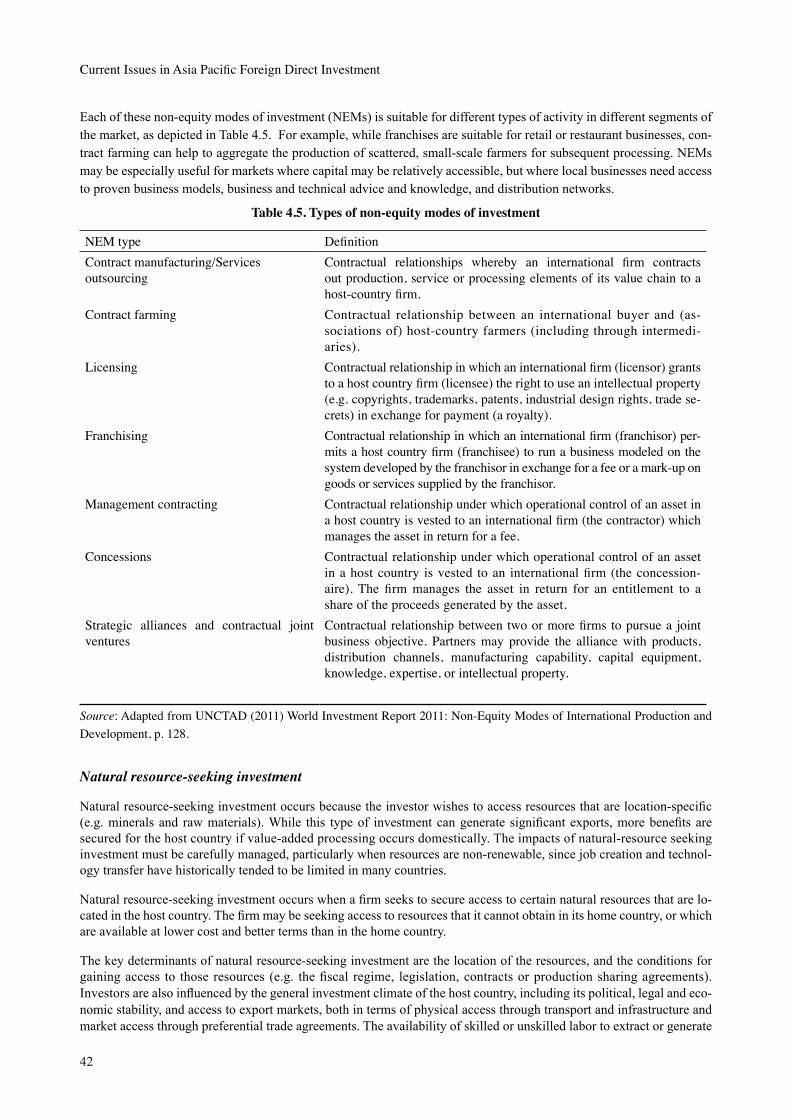
42
Current Issues in Asia Pacific Foreign Direct Investment
Each of these non-equity modes of investment (NEMs) is suitable for different types of activity in different segments of the market, as depicted in Table 4.5. For example, while franchises are suitable for retail or restaurant businesses, con-tract farming can help to aggregate the production of scattered, small-scale farmers for subsequent processing. NEMs may be especially useful for markets where capital may be relatively accessible, but where local businesses need access to proven business models, business and technical advice and knowledge, and distribution networks.
Table 4.5. Types of non-equity modes of investment
NEMtype DefinitionContractmanufacturing/Services outsourcing
Contractual relationships whereby an international firm contractsout production, service or processing elements of its value chain to a host-countryfirm.
Contract farming Contractual relationship between an international buyer and (as-sociationsof)host-countryfarmers(includingthroughintermedi-aries).
Licensing Contractualrelationshipinwhichaninternationalfirm(licensor)grantstoahostcountryfirm(licensee)therighttouseanintellectualproperty(e.g.copyrights,trademarks,patents,industrialdesignrights,tradese-crets)inexchangeforpayment(aroyalty).
Franchising Contractualrelationshipinwhichaninternationalfirm(franchisor)per-mitsahostcountryfirm(franchisee)torunabusinessmodeledonthesystemdevelopedbythefranchisorinexchangeforafeeoramark-upongoods or services supplied by the franchisor.
Management contracting Contractual relationship under which operational control of an asset in ahostcountryisvestedtoaninternationalfirm(thecontractor)whichmanages the asset in return for a fee.
Concessions Contractual relationship under which operational control of an asset inahostcountry isvested toan internationalfirm(theconcession-aire). The firmmanages the asset in return for an entitlement to ashare of the proceeds generated by the asset.
Strategic alliances and contractual joint ventures
Contractualrelationshipbetweentwoormorefirmstopursuea jointbusiness objective. Partners may provide the alliance with products, distribution channels, manufacturing capability, capital equipment,knowledge,expertise,orintellectualproperty.
Source:AdaptedfromUNCTAD(2011)WorldInvestmentReport2011:Non-EquityModesofInternationalProductionandDevelopment, p. 128.
Natural resource-seeking investment
Natural resource-seeking investment occurs because the investor wishes to access resources that are location-specific (e.g. minerals and raw materials). While this type of investment can generate significant exports, more benefits are secured for the host country if value-added processing occurs domestically. The impacts of natural-resource seeking investment must be carefully managed, particularly when resources are non-renewable, since job creation and technol-ogy transfer have historically tended to be limited in many countries.
Natural resource-seeking investment occurs when a firm seeks to secure access to certain natural resources that are lo-cated in the host country. The firm may be seeking access to resources that it cannot obtain in its home country, or which are available at lower cost and better terms than in the home country.
The key determinants of natural resource-seeking investment are the location of the resources, and the conditions for gaining access to those resources (e.g. the fiscal regime, legislation, contracts or production sharing agreements). Investors are also influenced by the general investment climate of the host country, including its political, legal and eco-nomic stability, and access to export markets, both in terms of physical access through transport and infrastructure and market access through preferential trade agreements. The availability of skilled or unskilled labor to extract or generate
43
The World Bank’s investment reform map
the resource may also be a key determinant, although both renewable and non-renewable forms of investment tend to attract migrant or ex-pat workers. Thus, mobility of personnel is important.
While the investment climate may still be relevant to investment decisions, natural-resource seekers (particularly those engaged in sectors with large profit margins) seem more resilient to a poor business climate than other types of investors.
Natural resource-seeking investment may impact trade patterns. Generally, natural resource-seeking investment gener-ates large quantities of commodity products for export. While extraction and processing may require imports of machin-ery, equipment, and supplies, the net effect on trade flows is usually positive for the host country. According to a 2010 report, the WTO estimates that natural resource commodities (forestry, fish, fuels and mining products) comprise 24% of total exports worldwide, and that figure is growing (table 2 in World Trade Report 2010). In addition, natural resources are the dominant export products for many countries, including Saudi Arabia (with fuels as 90% of total merchandise ex-ports), Kuwait, the Bolivarian Republic of Venezuela, Algeria, Nigeria, and Angola (each in excess of 90%; World Trade Report 2010). As discussed further below, this concentration can create problems for a country, especially given that international prices for natural resource commodities tend to be more volatile than for other types of goods and services.
The challenges surrounding natural resource-seeking investment have at their core the combination of adverse social, environmental, and economic impacts that often arise from this type of investment, commonly referred to as the “re-source curse”. However, an abundance of natural resources need not be a “curse”. For many countries, natural resource investment represents a key point of entry to the international economy.
In many jurisdictions, hydrocarbon and mineral deposits are vested in state ownership, and there is an expectation – often set out in the country’s constitution – that the resources sought by the investor are to be held and managed for the benefit of the whole country. This benefit is sometimes realized through active participation by the state, its ministries or state-owned enterprises (whether independently or in joint ventures with private investors). More commonly, however, the key “benefit” which a country receives from natural resource-seeking investment is the tax or other payments made by the investor. At each stage of the process – prospecting, exploration, and exploitation, a hydrocarbon or mineral inves-tor will often engage and bargain with the government. The fiscal regimes used to ensure fair benefit-sharing are often complex and may be difficult to administer.
The cycle of hydrocarbon and mineral projects requires a large up-front capital investment, which, many years later once production begins and products begin to be exported, may lead to a sudden increase in foreign exchange inflow. This influx can, in turn, cause significant appreciation of the real exchange rate, through appreciation of the nominal exchange rate and/or a rise in the domestic price level (Dutch Disease). As a result, other goods and services produced in the country become less competitive internationally. A sudden revenue spike from commodity exports for the gov-ernment can also be difficult to manage and spend effectively from an administrative point of view. Where resource rents comprise a significant portion of the country’s revenue, this can be especially disruptive as fluctuations in global commodity prices can cause significant volatility in the national budget from one year to the next.
As the investment activity is dependent on products of nature, environmental impacts are inevitable. Risks include destruction of habitats, air pollution, and exhaustion or contamination of water sources. In turn, the livelihoods of local communities may be threatened, their homes and businesses relocated, local infrastructure may become overburdened, and the cost of living for those not engaged in the industry may rise dramatically. Because of these potentially grave environmental and social impacts, natural resource-seeking investment is among the most difficult to regulate.
Among the most serious consequences of natural resource-seeking investment if it is not properly managed is its potential to exacerbate or fuel civil conflict (see, for example, Bannon and Collier 2003). While social unrest can relate to resource devel-opment undertaken by foreign or domestic firms, or by the state itself, foreign investors in particular may be targeted for extortion by threats to expensive equipment and infrastructure, or for kidnapping for ransom.
Non-renewable resources represent a particular challenge for governments and policy-makers because each unit of the resource can only by extracted, processed, taxed and sold once. Revenue management becomes crucial to guard against Dutch Disease, to support other sectors of the economy, and to ensure intergenerational equity. The boundaries between “renewables” and “non-renewables” blur when resources are over-exploited, for example as fish stocks are depleted, as fertile land is exhausted, and as new applications for commodities (such as palm oil or maize) are found.
When managed carefully, the revenue generated by natural resource-seeking investment can be saved, invested, and used to improve the long-term competitiveness of the country through funding for education, infrastructure, and provid-
44
Current Issues in Asia Pacific Foreign Direct Investment
ing essential social services.
Many states have developed policy approaches and strategies to try and create linkages between foreign extractives firms and local communities or firms as suppliers or downstream users of the resources. These strategies include lo-cal content performance requirements or incentives, the creation of supplier development programs, and quotas for local employment and training. Other states have imposed a domestic demand-driven structure, whereby permits for exploration and exploitation are granted in accordance with domestic commercial or industrial demands rather than to supply the international market. One example of a state that has managed the challenges and opportunities of natural resource-seeking investment is Chile, see case study 1 (Box 4.1).
How can countries maximize the benefits of natural resource-seeking investment?
Because the key determinant of natural resource-seeking investment is the location of the asset itself, countries need to do less to attract this type of investment than for any other. However, that is not to say that the state can take a passive role in foreign investment in natural resources. To the contrary, states often play a very important role in identifying potential resources, promoting opportunities, and selecting which firms are best-placed to realize those resources. Accessing, extracting, processing and exporting natural resources is often a capital-intensive, long-term investment. Physical access to resources and markets (through transport and infrastructure) as well as legal and political access (social license to operate, stable trade regimes, preferential trade access) each play an important part in the attractive-ness of a location. A stable regulatory framework, with clear environmental and social standards, a straightforward and transparent fiscal regime, and rules to counteract political risk all reduce the investor’s cost of doing business. Thus, if the investor has an option to extract and export coal of equivalent value from two different states, the broader investment climate and risk profile of the country will become an important consideration.
Countries with a volatile political or legal framework may still attract investment provided that the door remains open – foreign investment in natural resources continues in Afghanistan, Nigeria, Iran, Democratic Republic of Congo, Republic of Congo, Sudan, Pakistan and Iraq. However, the added “cost” of doing business will usually fall back on the country itself, either because investors will tend to be insiders who are politically connected and thus insulated from political risk, or because investors will simply price the political risk into the amount of taxes or other profit sharing they are prepared to agree to.
Because there are significant economic, social and environmental risks associated with natural resource-seeking invest-ment, the government may grant very selective access to private investors, whether domestic or foreign. Careful screen-ing and assessments of environmental and social performance may be justified. The extent to which the door is open will also depend on the broader regulatory regime for exploration, exploitation, and processing of the natural resource, as well as the fiscal regime that applies. For example, in a state where a single license is granted for exploration and ex-ploitation of petroleum, the government will rightly want to be assured that every applicant has the capacity to develop whatever resources are found in a responsible and cost-effective manner. Issues such as royalty payments and windfall taxes need to be set in law or agreed at the outset. However, in a state where separate exploration and exploitation li-censes may be granted, and where license-holders can trade their rights to explore or exploit (subject to a capital gains tax), there are good reasons to have a more “open door” policy for the more uncertain exercise of exploration. Once a resource is known, or reserves are proven, the state is in a better position to demand a greater share of the revenues from that resource.
Maximizing revenues is not the only consideration that will shape the state’s access regime for natural resources. Al-ternatively, the state may decide that access to natural resources should be limited to or prioritized for firms that will also develop some downstream processing capacity within the state where this is economically rational. The state may decide to ration access to resources in a way that supports a broader development plan, for example, by opening strategic locations for development along important transport routes to subsidize infrastructure improvements.
Just as a stable and predictable regulatory regime can help to attract investors, it is also essential to ensure that inves-tors remain present and active in the state. Most types of natural resource seeking investment will be rooted in the host country for as long as they have access to the resource, and as long as that resource is profitable. External shocks outside the control of the host state, such as price volatility, the discovery of other resources, or the development of new tech-nologies can all undermine natural resource-seeking investment.

45
The World Bank’s investment reform map
Box 4.1. Case study 1: capturing natural resource benefits in Chile
Chileisasmallcountry,butitsshareofworldGDP(0.33%)and,especially,globaltrade(0.46%).in2012wasthe highest among major Latin American economies. The country has used policy instruments that assure foreign investors of regime stability, including constitutional guarantees of property rights and security of tenure, tax and regulatory stability contracts with the state, and international investment agreements.
PartofChile’sstrongeconomicperformancecanbeattributedtothecountry’smineralresourcessector,asectorthat has witnessed major reform efforts that proved to be effective and attractive for foreign investment. Mining continuestobeChile’sforemostrecipientofforeigndirectinvestmentreceiving38.3%ofthetotalamountinvestedin2010(USD883million).
Trade Policy
Chile has not resorted to trade instruments such as export restrictions to manage its minerals sector. It has done so through a combination of balanced taxation, stable investment measures, good management of tax revenue, ex-change rate policy and initiatives aimed at producing a multiplier effect of economy-wide development.
Success Factors
Withlonginvestmenttimelines,largeup-frontcapitalrequirements,andexposuretovolatilemineralprices,miningprojectsrequireahighdegreeofpolicystabilitytoallowforlongtermplanning.Theyrequireprotectionfromex-propriation, secure rights over mineral concessions or titles, and assurances against arbitrary or unforeseen changes in regulations and taxation.
Chile’s experience ishighly relevant formining-richcountries seeking toconvince foreign investors that thesefactors are in place.
Key policy tools used by Chile to achieve this goal
• Foreigninvestmentlegislationguaranteeingnationaltreatmentandprofitrepatriation;
• Optionformininginvestorstoenterintospecialagreementswiththegovernmenttoensurethestability of the tax and regulatory regime for a period of up to 20 years;
• Guarantee of property rights of foreign investors in the Constitution, with the right to compensa-tion in cases of expropriation;
• Mining laws treating concessions as property rights protected under the Constitution.
• International agreements guaranteeing the rights of investors from major sources of mining in-vestment, including the United States, the United Kingdom, Canada and Australia.
Theselawsoutlinestrongprotectionforforeignmininginvestors,enforceableinthecountry’scourts.
Yet,itisimportanttocarefullycrafttheseprovisionssothatanappropriatebalanceisstruckbetweentheinterestsof investors and those of the host country.
However, political risk issues are also a major factor in a firm’s ability and decision to continue operating a natural resource-seeking investment. The need for a state to manage and exploit its natural resources for the benefit of its peo-ple has manifested in different ways in different parts of the world at different times. Following independence, several post-colonial states undertook policy changes that expropriated private natural resource firms, and converted them into state-owned assets. This trend has continued in recent decades. Governments have sought to increase the share of rev-enues that they receive from natural resources, by raising taxes or implementing capital gains or windfall tax regimes. This dynamic has been referred to as “resource nationalism”, and is still cited by Ernst & Young as one of the top three “business risks” facing the mining industry worldwide (EY 2013).
Many states that are rich in natural resources have created dedicated funds (often “sovereign wealth funds”) to manage
46
Current Issues in Asia Pacific Foreign Direct Investment
and track the country’s revenues from lucrative commodities. These resource funds can serve a variety of purposes, including saving a portion of income for future generations, to invest in strategic development projects, and to insulate the domestic economy from price shocks and volatility. They also vary considerably in their effectiveness. These funds do not retain the foreign investment as such, but they can give the income from foreign investments a “second life”, by converting tax and other resource income into financial assets and other long-term investments, that generate revenue in their own right and support the national budget on an ongoing basis.
The mechanisms needed to root natural resource-seeking investment in the local economy vary considerably depending on the particular sector and activity. The key differences arise between extractive resources (which tend to employ few local people) and agricultural projects (which can create or support employment for a large number of low-skilled work-ers). However, a general trend is consistent across most types of natural resource industries, as technology improves and the quest to cut costs continues, firms tend to mechanize and automate more parts of the process. Thus, extractive industries tend to demand fewer, more highly skilled workers. In host countries with limited human capacity, and a low level of education, these types of investment can be difficult to “root”.
Further, if a country’s export earnings from natural resources contribute to an increase in the real exchange rate, the possibility of Dutch Disease will render local goods uncompetitive and require that even basic supplies for the extractive sector (such as food) be imported.
A two-pronged approach is helpful here. First, the country may consider how best to insulate the domestic economy from the distorting effects of natural resource revenues (for example, through a dedicated and separate resource fund). Second, the government may take an active role in developing local capacity and “matching” domestic and small-scale producers to supply the needs of foreign firms.
Are incentives useful in relation to natural resource-seeking investment? Firms engaging in foreign investment to acquire natural resources appear less motivated by incentives than some other types of investment (such as efficiency-seeking investors, discussed below; Vale Columbia Center 2013). Although incentives are of limited utility for attracting natural resource-seeking investment, they are common.
Market-seeking investment
Market-seeking investment is motivated by the potential to deliver goods and services to individuals, businesses and other entities within the host state. Also known as “demand oriented”, this kind of investment arises both in goods and services. Market-seeking investment is motivated by the size and characteristics of the domestic market of the host country. This form of investment may substitute imports, or it may expand into sectors that are entirely new to the economy. It can be a useful instrument to foster industrialization and economic diversification. However, relatively to natural resource seeking investment, market-seeking investment tends to be more sensitive to investment policy in the host country.
In relation to goods, market-seeking investment often occurs in sectors where the product must be fresh (e.g. foodstuffs) or is too difficult, heavy or expensive to transport cost-effectively (e.g. beverages). If the product can be produced cost-effectively in smaller quantities, it is more likely to be a target for market-seeking investment than a product that can be transported easily and yields substantial economies of scale in production. It may also be necessary where direct customer relationships are important (e.g. in construction, petrochemicals and forestry products), or where the product must be adapted to local tastes or needs, cultural preferences, and to local resources and capabilities. A large proportion of investment in the services sector is market-seeking, since the business often requires a physical presence in the coun-try in order to deliver services.
These range from “public good” services or utilities such as electricity, water, waste management, and telecommuni-cations, to infrastructure and construction, to professional or corporate business services such as banking, legal, con-sulting, accounting, auditing, and advertising, to retail services such as supermarkets, car rentals and hotels. Even as physical presence becomes less essential, with more services being provided online and by telephone, locally based providers retain an advantage because of the social, cultural and language preferences of the market. This is particularly evident in those sectors where it is very difficult or impossible to separate the production and consumption such as health services, hotel accommodation, consulting and advertising (Nicholas and Maitland 2002, p.10).
The most important driver of market-seeking investment is the population and economic size of the market, along with its potential for growth. The creation of regional communities or a common market may serve to effectively increase the market size. However, there may be some cases where market-seeking investment in more “niche” areas will occur, led
47
The World Bank’s investment reform map
by small and medium-sized enterprises from neighboring states. Common characteristics between the home country and the host country such as language and consumer preferences may also be important.
Market-seeking investment does not, as a rule, generate goods or services for export, although this may arise where the investor seeks to serve a regional market. Market-seeking investment may be import substituting – thereby improving the country’s ratio of exports and imports. However, in some cases the production of goods or provision of services domestically will require imported inputs.
Market-seeking investment can be an important source of jobs, and particularly of the higher-skilled, better-paid jobs associated with the services sector. Thus, it represents a potentially more inclusive form of economic activity than nat-ural resource-seeking investment.
This form of investment can bring international business practices, standards, know-how and technology to a country. Thus, market-seeking investors can help to create competition within the domestic economy – increasing productivity and lowering prices to consumers. Improvements in local goods and services generated by market-seeking investment can have a cumulative effect to improve the general business climate, render the country more competitive, and provide a platform for other kinds of investors. However, in smaller countries, market-seeking investment may only be feasible if the government grants a monopoly. In particular, investments in utilities require careful regulation and pricing to en-sure that essential services remain affordable.
The success of a market-seeking investment is closely related to its local distribution network and customer base. This means that, over time, market-seeking investors tend to become more and more engaged in the local community – nat-urally generating the linkages and spillovers that can be so hard to establish with natural resource-seeking investment.
Like natural resource-seeking investment, market-seeking investment is largely drawn by existing factors of the country itself – the number of people and firms that the investor could provide goods or services to, and whether that population is growing (in terms of both physical and economic size). However, countries with a smaller market can increase their market “size”, and consequently their attractiveness to a market-seeking investor through preferential trade agreements.
The most important factor in retaining market-seeking investment, from the state’s perspective, is to avoid unnecessary interference. Market-seeking investors will tend to become more entrenched in a country over time, with a relatively smaller risk chance that they will move operations offshore. Broader economic factors, such as a financial crisis or a decline in the country’s economy may impact the ability of a firm to continue doing business. In some cases, the govern-ment’s regulatory response may exacerbate these difficulties. For example, following Argentina’s financial crisis, many utility firms were unable to continue operating once regulated prices (attached to the local currency) were devalued. Transparency and predictability in regulation are extremely important.
As discussed above, market-seeking investment by its very nature needs to become embedded in the domestic economy through employment, creating distribution networks, marketing and customer relationships. This is particularly the case in relation to investment in services. Specific initiatives might involve supporting access to information about local firms or opportunities to become suppliers.
Like natural resource-seeking investment, market-seeking investors tend to be less influenced by incentives offered by the host state. If a market does not have the fundamental factors necessary to support the investment, a government incentive will unlikely persuade a “marginal” investor. Factors such as stability, transparency, and protection from po-litical risk are more important.
Efficiency-seeking investment
Efficiency-seeking investment is export-oriented, and occurs where the investor seeks to increase cost efficiency of pro-duction by taking advantage of factors of production located in the host country whose utilization improves the compet-itiveness of the enterprise. Greater productivity of labor, preferential market access to export markets and rationalization of international production patterns are some of the factors motivating this type of FDI. Efficiency-seeking FDI has the potential to transfer technology and skills, and to diversify an economy rapidly. Efficiency-seeking FDI can be more sensitive to investment policy and to trade barriers, and many countries compete to attract it.
Efficiency-seeking investment occurs when a firm wishes to promote a more efficient division of labor or specialization of an existing portfolio of foreign and domestic assets. Efficiency-seeking investment has occurred, for the most part, in relation to production of goods. However, with the rise of outsourcing and telework, a greater proportion of
48
Current Issues in Asia Pacific Foreign Direct Investment
efficiency-seeking investment is occurring in services.
In relation to goods, we can distinguish between efficiency-seeking investment in different levels of manufacturing, and in agribusiness, each with different determinants and impacts. Low value-added manufacturing, such as textiles, cloth-ing and footwear, have low barriers to entry and tend to create more jobs. However, the quality of those jobs tends to be lower – with lower wages reflecting the lower skill level. In 2002, UNCTAD’s World Investment Report (UNCTAD 2002) gave a detailed account of the export patterns and trends in different levels of manufacturing, and noted that the United States and China dominated in these low technology products, with Mexico and Indonesia making significant gains from 1985. By 2000, several of the Asian “tiger” economies – Singapore, Republic of Korea and Taiwan Province of China had already graduated to higher value-added production.
Medium technology manufacturing benefits from economies of scale. Production is usually partly automated, but is not as capital or knowledge-intensive as high-technology manufacturing. Trade in medium-technology products was, until 2000, dominated by the United States, with East Asian economies, China, Mexico, Republic of Korea and Taiwan Province of China each holding a significant share of international exports.
High technology manufacturing tends to be more knowledge-, capital- and (as the name suggests) technology-intensive, creates fewer jobs, and has been concentrated in developed countries. However, increasing levels of education and ac-tive promotion by some developing countries and emerging markets has helped to disrupt this pattern. Since 1985, East Asian economies and Mexico, China and Taiwan Province of China have all gained significant market share in exports of high technology manufacturing.
Agribusiness or food processing often becomes a strategic focus for developing countries as they seek to diversify away from trade in basic commodities. Whereas raw products suffer from volatile pricing and seasonal availability, processed foods enjoy a more stable price structure over time. However, this type of efficiency-seeking investment is less common than manufacturing, in part due to the concentration of the international market, as consumer tastes shift towards fresh foods, and due to tariff barriers for processed goods (discussed further below). More commonly, firms will invest in agricultural land and farms to ensure continuity of supply.
In relation to services, remote work such as telework (call centers) and outsourcing (e.g. consulting/legal/software ser-vices) are now fairly common, and can create large numbers of jobs. Countries also compete to attract higher value-add-ed or specialized services such as R&D.
The key determinant for all types of efficiency-seeking investment is “competitiveness” – a concept the OECD defines as “the ability of companies, industries, regions, nations and supranational regions to generate, while being and remaining exposed to international competition, relatively high factor income and factor employment levels on a sustainable ba-sis”. General aspects of competitiveness might include factor endowments, culture, institutional arrangements, demand patterns, economic policies and market structures. First, a firm will likely look at the traditional factor endowments of the host country – cost and reliability of raw products or inputs, of energy, transport and infrastructure. In addition, greater productivity and cost-effectiveness of labor, preferential market access to export markets, and rationalization of international production patterns each contribute to motivate this type of FDI. In low-value added manufacturing, the relative cost of labor is especially important. In medium and high-value added manufacturing, the availability of tech-nology, of respectively higher skilled labor, education and training pipelines, and supporting infrastructure and services become more important.
For services, the skill level of the labor supply, languages spoken, time zones, and quality of communications infrastruc-ture are crucial. R&D initiatives are often supported through close connections and coordination with higher education institutions and national research centers.
Aside from the fundamental country conditions that are important for all efficiency-seeking investment (the “facilitating environment”), a huge range of factors comes into play depending on sector and type of investment. An illustrative list of determinants is set out below for discussion.
Creating a facilitating environment
• Openness to foreigners: liberalized investment entry, mobility of people, goods and capital;
• Non-economic factors: weather or climate, natural disasters, size of population, population growth rate, age and gender structure of the population, language and cultural factors, political system and
49
The World Bank’s investment reform map
openness, physical security, level of English;
• Competitive factors of production: labor, cost and reliability of energy, availably of raw materials and/or imported inputs, access to industrial land, building permits, security of tenure, technical capacity, synchronization of vocational training and investor demands;
• Legal stability: regulatory transparency and predictability, reliable enforcement, availability of inves-tor-state dispute resolution, access to commercial arbitration;
• Technical standards: standards-setting bodies, regulatory and inspection institutions;
• Logistics and infrastructure: transport, electricity, water, customs, trade logistics, ports and export hubs.
Specific competitive conditions
• Low technology manufacturing2 (including most textiles, basic consumer goods): Competitive ad-vantages in low technology manufacturing lie in cost-cutting and marketing. Thus, the availability of cheap inputs, a low cost labor force, and favorable tax regime are especially important.
• Medium technology manufacturing3 (including synthetic textiles, chemical-based consumer products, basic machinery and vehicles): Competitive advantages in medium technology manufacturing lie in efficiency through economies of scale. Clustering and logistics are crucial.
• High technology manufacturing4 (including aircraft, radioactive and pharmaceutical products, electric plants, computers, and telecommunications): Competitive advantages in high tech-nology manufacturing lie mainly in technological capacity and the speed of innovation. Access to highly-skilled personnel, Intellectual Property Rights Protection, and a competitive cluster are each helpful.
• Services (Telework, outsourced services): Competitive advantages in services derive from accessi-bility of a labor force with language skills, a time zone that can service major markets, and adequate telecommunications infrastructure.
• Agribusiness and Food Processing5 (prepared and preserved meats, fish, vegetables and fruit, beverages):
Competitive conditions derive from a range of inputs and market access conditions. Investors need a reliable and abundant supply of low cost, high quality raw products, warehousing and storage facil-ities, cold chain transport infrastructure, and skilled workers such as veterinarians, food technicians. Ready access to consumer markets (through ease of transport and preferential trade conditions) is essential.
Efficiency-seekers are, by nature, oriented to export the goods and services they produce. As efficiency-seeking investment often represents one part of a global value chain by producing intermediate goods and services, inputs may be imported into the host country. Because of this, efficiency-seeking investors prefer a location with low tariffs and liberalized im-port and export rules. Overall, this type of investment tends to be a net generator of foreign exchange.
2 Low technology manufacturing includes goods produced from leather, paper, textiles, glass, pottery, iron and steel, as wellasfurniture,travelgoods,apparel,footwear,toys,gamesandsportinggoods,officeandstationerysupplies,andmusicalinstru-ments,seeUNIDOIndustrialDevelopmentReport2013,“SustainingEmploymentGrowth:theRoleofManufacturingandStructuralChange”(2013).3 Mediumtechnologymanufacturingincludessyntheticandman-madefibresandtextiles,hydrocarbonsandalcohols,pig-mentsandpaints,perfumes,cosmetics,soaps,fertilizers,primaryplastics,insecticidesandstarches,ironandsteelproductsandwire,roadvehicles,railwayvehicles,shipsandboats,prefabricatedbuildings,sanitary,plumbing,lightingfixturesandfittings,metersandcounters,opticalgoods,watchesandclocks,televisionandradioreceivers,soundrecorders,aswellasvarioustypesofmachinery,includingindustrial,specialized,andmetalworking,seeUNIDO,IndustrialDevelopmentReport2013.4 High-technologymanufacturingincludesradioactivematerials,medicinalandpharmaceuticalproducts,rotatingelectricplants andpower-generatingmachinery, officemachines anddata-processingmachines, telecommunications equipment, electro-diagnosticapparatus,aircraft,opticalinstruments,measurementinstruments,photographicequipment,andarmsandammunition,seeUNIDO,IndustrialDevelopmentReport2013.5 Agribusinessandfoodprocessing includespreparedandprocessedmeatsandfish,butterandcheese,floursandcerealpreparations, prepared and preserved vegetables and fruit and juices, sugars, confectionery and honey, chocolate, beverages, manu-factured tobacco.
50
Current Issues in Asia Pacific Foreign Direct Investment
This type of FDI may be a formidable vehicle for transforming the export supply of a country, opening it up to new for-eign export markets, and allowing its citizens to move up the value chain. Efficiency-seeking FDI can be more sensitive to investment policy and to trade barriers, and many countries compete to attract it. Efficiency-seeking investment is among the most difficult to attract and retain, precisely because so many factors must align to make the host state an appropriate venue for a particular production process at a particular time. However, efficiency-seeking investment has the most transformative potential of all types of foreign investment. For this reason, states should have their door open to efficiency-seeking investments. However, the state may want to target and support higher-value added activities to a greater extent, since these types of activities tend to contribute more to the domestic economy.
Because so many different factors must align to make production efficient in a particular country, there is a much higher likelihood of change and transition with efficiency-seeking investment. These types of investors are still sensitive to political risk, but they are also especially vulnerable to shifts in currency, in changes in the global market for goods and services, and in the changing costs or availability of inputs. Rather than seeking to retain production of a particular type of good or service within the country, or trying to retain an individual firm’s investments, countries that receive efficien-cy-seeking FDI must be willing and able to support firms and their employees through frequent transitions. In relation to firms, this might mean providing fast and efficient procedures for a firm to commence a new activity, or to open a new facility. For employees, it might mean providing social support and security if a firm closes its operations, and providing bridging training to move the labor force into another activity. Over time, the country will want to support entrance of higher-technology manufactures and move up the value chain.
Relative to other types of investors, efficiency-seeking investors tend to be more sensitive to slight shifts in the tax regime of a particular country. Thus, a carefully designed incentives regime can be a useful short-term strategy for countries hoping to attract efficiency-seeking investment.
Box 4.2. Case study 2: Mexico’s aerospace industry – linking foreign firms with local talent
Starting from virtually nil at the turn of the century, aerospace is now a $5 billion export industry in Mexico that employs some 31,000 people. The Ministry of Economy is coordinating a national plan based on the strengths of six regions. Chihuahua is to build on its vocation for precision-machined products, while Baja California looks to attract knowledge-process outsourcing. Attracting foreign aerospace companies has been key to this process. Cessna, for example, produces electrical components for its Citation business jets in Chihuahua, and Honeywell makes jet engine components in Mexicali. Mexican companies such as Volare Engineering and Soisa, which make airplane interiors and seats, are growing alongside these international firms.
Various regional centers vie to attract foreign aviation firms and to develop domestic suppliers. Local authorities proudly promote the triple helix concept, whereby governments and universities promote industrial development. Plantronics, a Santa Cruz, California, firm, is just one example of this concept in action. The company moved product design operations to Tijuana and now coordinates its R&D with engineering students from nearby univer-sities. Many of these students are hired by the company and with research funding from Mexico’s National Science and Technology council have brought several Plantronics products to market.
State technical universities are ramping up their aerospace design and engineering resources. Universidad Tech-nologico de Tijuana’s recent half-million-dollar investment in the French company Dassault trains students to produce and use Dassault’s 3D aircraft design software.
With Mexico graduating 100,000 engineers annually, three times as many per capita as the U.S., the capacity for design in Mexico is promising. Honeywell has a design center in Mexicali, and General Electric employs 1,300 engineers in Querétaro to design commercial airliner turbines.
With the US capturing 59 percent of the world’s aerospace and defense market, Mexico’s access to U.S. markets is essential for future success. In addition to its NAFTA advantages, Mexico holds a privileged position in the highly regulated U.S. market through its Bilateral Air Safety Arrangement, and its membership in the 41-nation Wassenaar Arrangement for regulation of defense industry products. With 20 percent annual growth in the sector since 2004, hopes are high that Mexico will reach its goal of exporting $12 billion in aerospace products by the end of the decade.
Strategic asset-seeking investment
Strategic asset-seeking investment is the least common, and the most recent type of FDI of the four. It occurs when a multinational enterprise enters a market to acquire assets, usually of a foreign corporation, but also potentially of the
51
The World Bank’s investment reform map
country itself, that will promote the firm’s long-term strategic objectives. Strategic asset-seeking investment often takes the form of mergers & acquisitions (M&A). The targeted strategic asset may be tangible or intangible. For example, a foreign investor may acquire a share in an established domestic company that has particularly skillful human capital or know how, access rights, or an established technology or brand.
We distinguish between two types of strategic asset-seeking investment. First, there is investment motivated by the need to acquire or control an asset of another firm – which generally results in a merger or acquisition. These assets are “unique, intangible, and organizationally-embedded”, such as brands, managerial know-how, or advanced technology. Second, there are also examples of investment where the firm is motivated by a strategic asset in the host country or “locational advantage”. This might be a key feature of the country (whether physical, cultural, or historical) that creates opportunities for tourism, or that is strategically important for international economic activity – such as the Suez Canal.
While there is little statistical information about strategic asset-seeking FDI, a large proportion of cross-border M&As are directed at knowledge- and information-intensive sectors such as telecommunications, electronics and business sectors, which are characterized by ‘strategic’ assets. Other deals aim at exploiting rationalizing and cost-cutting advan-tages and economies of scale that come with acquisition of another firm operating in the same value chain. Rather than establishing a greenfield investment and developing the advantages presented by a host country, strategic asset-seeking investors choose to “buy some kind of competitive strength in an unfamiliar market”, e.g. by acquiring a firm with an existing distribution network. In this way, strategic asset-seeking investment may be “aggressive” – aimed at acquiring some advantage that will strengthen the investor’s own competitive position in a global market – or it may be “defen-sive” – aimed at weakening or removing a competitor’s advantage.
In recent years, strategic asset-seeking investment has been a way for MNEs from developing countries to catch-up by acquiring strategic assets abroad, typically in developed economies. Traditionally undertaken by MNEs from developed countries, it is increasingly undertaken by firms from developing economies. According to UNCTAD, the FDI outward stock of developing and transition economies was around US$5 trillion as of 2013, compared with US$26 trillion for developed countries. While not all of this stock is accounted by strategic asset-seeking investment, certainly the portion of that stock in developed countries is likely to involve the acquisition of strategic assets through FDI. Indeed, over-seas acquisitions by developing country MNEs have increased rapidly in terms of both volume and number, reaching US$129 billion in 2013. M&A purchases by MNEs in emerging economies stood at $120 billion in 2008, about 37 percent of global M&A purchases, compared with 14 percent in 2007 (UNCTAD 2014). These figures attest to the growing importance of strategic asset-seeking investment by developing country MNEs as a means of accelerating their internationalization. As a result of these overseas forays, growing attention is being paid to outward Investment Policy. The rationale is that outward strategic asset-seeking FDI strengthens the competitive position of the parent firms based in developing countries vis-à-vis international competitors. In turn, this can be viewed as a vehicle for enhancing home country competitiveness.
Strategic-asset seeking is most commonly restrained by regulation or screening of investments – whether by foreign investment authorities, regulatory bodies, or by competition authorities in the host country. By their nature, access to some “strategic assets” can trigger concerns around economic independence and security. For example, while the US generally operates an open and encouraging policy framework for foreign investment, the Committee on Foreign Invest-ment in the United States is authorized solely to review transactions that could result in the control of a U.S. business by a foreign person on national security grounds. A review process might be triggered when the target firm holds certain “classified contracts”, has operations relevant to US security, or deals in advanced technologies or goods and services that are controlled for export. For example, a review may consider the potential effects of the transaction on sources of energy or critical infrastructure. A review might also be triggered because of the identity of the foreign investor or the existence of foreign government control over the investor.
Because target firms tend to be established, mature businesses themselves, strategic asset-seeking investment tends to occur in more developed economies. However, while in the past most investors were from developed countries, some developing country and emerging-market firms have pursued important strategic asset-seeking transactions over the past two decades. A well-known example is that of Tata Steel and Tata Motors, the Indian firms that made strategic ac-quisitions of UK firms, respectively, Corus in 2007, and Jaguar Land Rover in 2008. The acquisition of two established global auto brands has helped Tata to expand into luxury car sales in Western markets, as well as in China, and has become the driving force of the company’s growth.
Strategic asset-seeking investment has significant potential to connect domestic firms with international production

52
Current Issues in Asia Pacific Foreign Direct Investment
chains and markets, and to realize the value of under-utilized assets within the host country. However, M&A transactions may in certain cases raise concerns from host country governments. First, there is a typical pattern of transformation following an acquisition, whereby the new foreign parent company will “rationalize” the human capital assets of the acquired firm, reducing the number of jobs supported by the business. This potential cost can generate concentrated op-position to a transaction, demanding a political or regulatory response. Second, M&A transactions may reduce the num-ber of firms competing within the market, particularly where the investor was already present in the market or provided goods or services by trade. In the first scenario, it is important to keep in mind that rather than simply cannibalizing an existing business, a strategic acquisition may allow a business that would have otherwise failed or stagnated to continue to operate or even grow.
Further, firms are often seen as a “target” for acquisition if they have unrealized assets, or if they lack some advantage that the investor has. For example, the investor may have access to financing or a large distribution network, creating opportunities for the acquired firm to expand production and export. Alternatively, the investor may have a proven or-ganizational system and management style, which it imposes on the target firm. As Dunning and Lundan explain, “Like the efficiency-seeking MNE, the strategic asset acquirer aims to capitalize on the benefits of the common ownership of diversified activities and capabilities, or of similar activities and capabilities in diverse economic and potential environ-ments.” Such benefits might result in opening up new markets, creating R&D synergies or production economies, buy-ing market power, lowering transaction costs, accessing new organizational skills, spreading administrative overheads, advancing strategic flexibility and spreading or mitigating risks.
IV. ConclusionEvidenceshowsthecompellingcaseforhostcountryeffortsaimedatattracting,enablingtheentry,retainingandlinkingFDI with the domestic economy. The benefits of FDI go well beyond providing additional capital, and include potential productivity improvements, export upgrading, knowledge generation, and wage increases. However, such potential benefits are not automatic. Policy interventions responding to the specific country and investment contexts may be required. There is also a strong case for building an investment climate to maximize these potential spillovers and for increasing countries’ competitiveness for FDI, while bearing in mind that different types of FDI can generate different economic, social and other benefits in the short and long-term. But these benefits are not automatic. Investment policies are required to maximize potential FDI gains. One challenge, however, is that there are different kinds of FDI, and each one may have different economic, social, and environmental impacts.
This Chapter has provided examples of the multidimensional complexity of investment policy. Not only there are nu-merous variables that may affect the attraction, retention, linkages and other spillovers of FDI, but also there are differ-ent types of FDI requiring differentiated policy mixes in order to maximize its potential benefits. Within this context, investment policy formulation requires on the one hand, a framework sophisticated enough to differentiate between the various kinds of FDI and their potential challenges and benefits for development, and on the other be simple enough to enable governments to clearly start organizing and prioritizing the multiple and complex variables affecting the maxi-mization of benefits of investment. This paper has presented a bird’s eye overview of investment policy and promotion logical framework developed by the trade and competitiveness global practice of the WBG to address the challenge for more comprehensive yet targeted investment policy-making. On the basis of three key propositions (i.e. (i) that invest-ment policy should aim not to choose between but connect domestic and foreign investors, (ii) that investment policy making should be based on the whole investment cycle going beyond promotion and (iii) that not all FDI is the same nor it has the same development impacts) this note has attempted to summarize the logical backbone on the basis of which a concrete investment policy and promotion intervention in a time of globalization could be implemented and lead to measurable results6.
ReferencesBannon I. and Collier P. (2003). Natural resources and conflict: What we can do. In Natural Resources and Violent Con-flict: Options and Actions, eds. I. Bannon and P. Collier. Washington, D.C.: World Bank, pp. 1-16.
EY. (2013). “Business Risks in Mining and Metals 2013–2014”.
Harding, T. and Beata J.S. (2007). “Developing economies and international investors: do investment promotion agen-cies bring them together?” Policy Research Working Paper Series 4339, The World Bank.
6 ForafullexplanationontheinvestmentreformmapprocesspleasevisitInvestmentPolicyandPromotionsiteat:https://www.wbginvestmentclimate.org/advisory-services/international-trade/investment-policy/
53
The World Bank’s investment reform map
Morisset J. and Andrews-Johnson K. (2004). The Effectiveness of Promotion Agencies at Attracting Foreign Direct Investment, FIAS, Occasional Paper 16, 2004.
Nicholas S. and Maitland E. (2002). “International Business Research: Steady-states, dynamics and globalization” in Bijit Bora (ed.) Foreign Direct Investment: Research Issues (London and New York: Routledge).
UNCTAD, World Investment Report 2002: Transnational Corporations and Export Competitiveness (Geneva: UNCT-AD).
UNCTAD, World Investment Report 2014.
Vale Columbia Center, Investment Climate Advisory Services of the World Bank Group, “Background Paper for the Eighth Columbia International Investment Conference on Investment Incentives: the good, the bad and the ugly”. No-vember 13-14, 2013, Columbia University. http://www.vcc.columbia.edu/files/vale/content/VCC_conference_paper_-_Draft_Nov_12.pdf
Wells L.T. Jr. and Wint A.G. (1990). Marketing a Country Promotion as a Tool for Attracting Foreign Investment Re-vised Edition, FIAS, Occasional Paper 13.
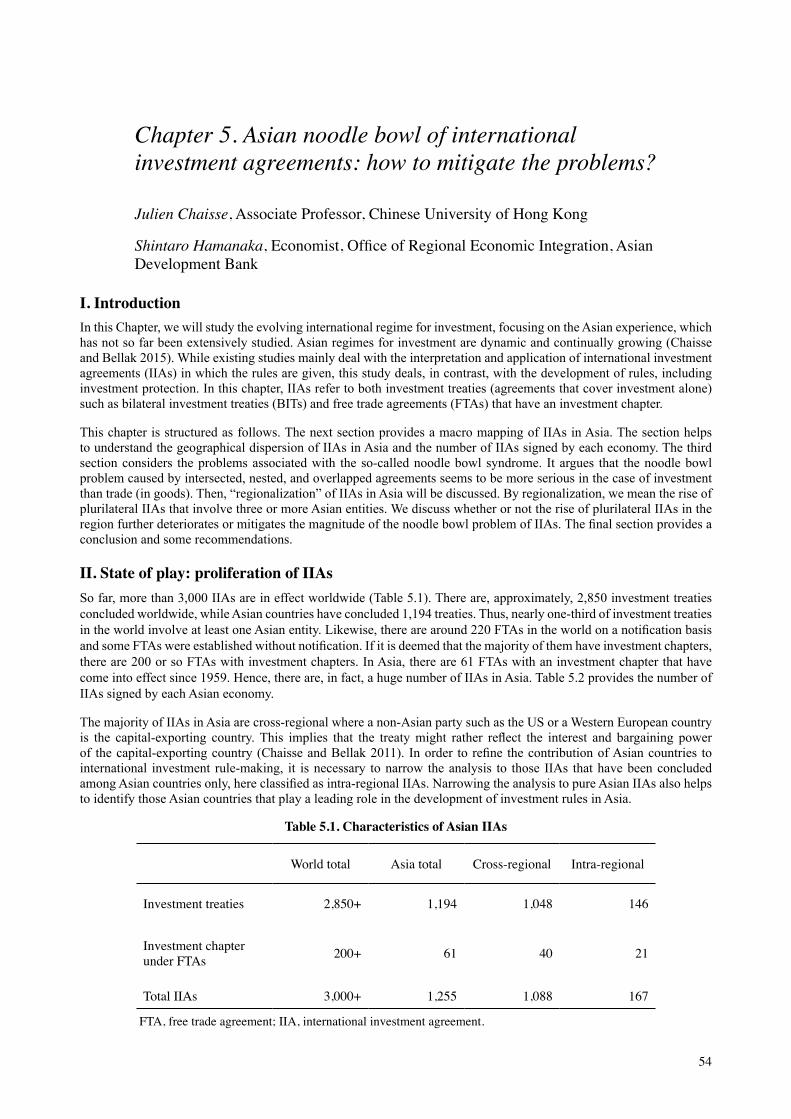
54
I. Introduction In this Chapter, we will study the evolving international regime for investment, focusing on the Asian experience, which has not so far been extensively studied. Asian regimes for investment are dynamic and continually growing (Chaisse and Bellak 2015). While existing studies mainly deal with the interpretation and application of international investment agreements (IIAs) in which the rules are given, this study deals, in contrast, with the development of rules, including investment protection. In this chapter, IIAs refer to both investment treaties (agreements that cover investment alone) such as bilateral investment treaties (BITs) and free trade agreements (FTAs) that have an investment chapter.
This chapter is structured as follows. The next section provides a macro mapping of IIAs in Asia. The section helps to understand the geographical dispersion of IIAs in Asia and the number of IIAs signed by each economy. The third section considers the problems associated with the so-called noodle bowl syndrome. It argues that the noodle bowl problem caused by intersected, nested, and overlapped agreements seems to be more serious in the case of investment than trade (in goods). Then, “regionalization” of IIAs in Asia will be discussed. By regionalization, we mean the rise of plurilateral IIAs that involve three or more Asian entities. We discuss whether or not the rise of plurilateral IIAs in the region further deteriorates or mitigates the magnitude of the noodle bowl problem of IIAs. The final section provides a conclusion and some recommendations.
II. State of play: proliferation of IIAs So far, more than 3,000 IIAs are in effect worldwide (Table 5.1). There are, approximately, 2,850 investment treaties concluded worldwide, while Asian countries have concluded 1,194 treaties. Thus, nearly one-third of investment treaties in the world involve at least one Asian entity. Likewise, there are around 220 FTAs in the world on a notification basis and some FTAs were established without notification. If it is deemed that the majority of them have investment chapters, there are 200 or so FTAs with investment chapters. In Asia, there are 61 FTAs with an investment chapter that have come into effect since 1959. Hence, there are, in fact, a huge number of IIAs in Asia. Table 5.2 provides the number of IIAs signed by each Asian economy.
The majority of IIAs in Asia are cross-regional where a non-Asian party such as the US or a Western European country is the capital-exporting country. This implies that the treaty might rather reflect the interest and bargaining power of the capital-exporting country (Chaisse and Bellak 2011). In order to refine the contribution of Asian countries to international investment rule-making, it is necessary to narrow the analysis to those IIAs that have been concluded among Asian countries only, here classified as intra-regional IIAs. Narrowing the analysis to pure Asian IIAs also helps to identify those Asian countries that play a leading role in the development of investment rules in Asia.
Table 5.1. Characteristics of Asian IIAs
Worldtotal Asia total Cross-regional Intra-regional
Investment treaties 2,850+ 1,194 1,048 146
Investment chapter under FTAs 200+ 61 40 21
Total IIAs 3,000+ 1,255 1,088 167
FTA, free trade agreement; IIA, international investment agreement.
Chapter 5. Asian noodle bowl of international investment agreements: how to mitigate the problems?
Julien Chaisse,AssociateProfessor,ChineseUniversityofHongKong
Shintaro Hamanaka,Economist,OfficeofRegionalEconomicIntegration,AsianDevelopmentBank
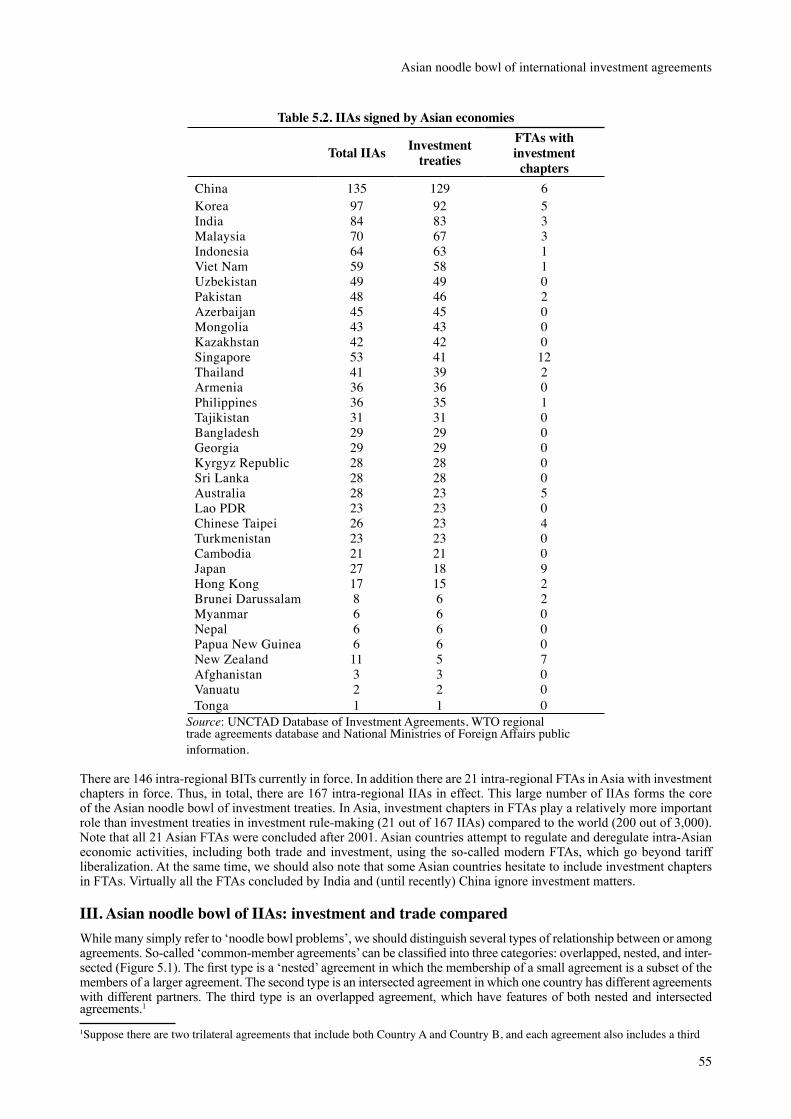
55
Asian noodle bowl of international investment agreements
Table 5.2. IIAs signed by Asian economies
Total IIAs Investment treaties
FTAs with investment chapters
China 135 129 6Korea 97 92 5India 84 83 3Malaysia 70 67 3Indonesia 64 63 1VietNam 59 58 1Uzbekistan 49 49 0Pakistan 48 46 2Azerbaijan 45 45 0Mongolia 43 43 0Kazakhstan 42 42 0Singapore 53 41 12Thailand 41 39 2Armenia 36 36 0Philippines 36 35 1Tajikistan 31 31 0Bangladesh 29 29 0Georgia 29 29 0KyrgyzRepublic 28 28 0SriLanka 28 28 0Australia 28 23 5Lao PDR 23 23 0Chinese Taipei 26 23 4Turkmenistan 23 23 0Cambodia 21 21 0Japan 27 18 9HongKong 17 15 2Brunei Darussalam 8 6 2Myanmar 6 6 0Nepal 6 6 0PapuaNewGuinea 6 6 0NewZealand 11 5 7Afghanistan 3 3 0Vanuatu 2 2 0Tonga 1 1 0
Source:UNCTADDatabaseofInvestmentAgreements,WTOregionaltradeagreementsdatabaseandNationalMinistriesofForeignAffairspublicinformation.
There are 146 intra-regional BITs currently in force. In addition there are 21 intra-regional FTAs in Asia with investment chapters in force. Thus, in total, there are 167 intra-regional IIAs in effect. This large number of IIAs forms the core of the Asian noodle bowl of investment treaties. In Asia, investment chapters in FTAs play a relatively more important role than investment treaties in investment rule-making (21 out of 167 IIAs) compared to the world (200 out of 3,000). Note that all 21 Asian FTAs were concluded after 2001. Asian countries attempt to regulate and deregulate intra-Asian economic activities, including both trade and investment, using the so-called modern FTAs, which go beyond tariff liberalization. At the same time, we should also note that some Asian countries hesitate to include investment chapters in FTAs. Virtually all the FTAs concluded by India and (until recently) China ignore investment matters.
III. Asian noodle bowl of IIAs: investment and trade compared While many simply refer to ‘noodle bowl problems’, we should distinguish several types of relationship between or among agreements. So-called ‘common-member agreements’ can be classified into three categories: overlapped, nested, and inter-sected (Figure 5.1). The first type is a ‘nested’ agreement in which the membership of a small agreement is a subset of the members of a larger agreement. The second type is an intersected agreement in which one country has different agreements with different partners. The third type is an overlapped agreement, which have features of both nested and intersected agreements.1 1Suppose there are two trilateral agreements that include both Country A and Country B, and each agreement also includes a third

56
Current Issues in Asia Pacific Foreign Direct Investment
Figure 5.1. Three types of common-member agreement
Source:Authors’illustrationbasedonHamanaka(2012). Note:A,B,CandDrepresentcountries.Bilateralagreementsarerepresentedasalineandplurilateralagreementsarerepresented as a circle.
Nested IIAs: the inconsistency problem
There are some overlapped and nested IIAs in Asia. This is especially true for the relationship between plurilateral IIAs (plurilateral FTAs with an investment chapter) and bilateral agreements. While the there are some concerns with regard to nested and overlapped agreements in the case of trade, little attention has been paid to a similar problem with regard to investment. (For the details on the rise of plurilateral IIAs in Asia, see Section IV.)
In the case of trade, the negative impacts of nested and overlapped agreements seem to be marginal, especially for problems associated with rules of origin (ROO). While the concerns are sometimes exaggerated, nested or overlapped agreements usually give traders more options: traders can have preferential access if their goods satisfy the ROO set by either of the nested agreements (Hamanaka 2013). It is wrong to assume that proliferation of FTAs confuses business, because FTAs are widely used by traders when there is a meaningful margin of preference. The traders can choose the most beneficial agreement to get maximum benefits. Moreover, the use of the second best FTA still brings benefit to traders. Furthermore, the use of FTAs is not compulsory for traders. In fact, in many circumstances, there is no need for traders to use FTAs, as the majority of Asian trade is already conducted under zero-MFN tariff status.
However, in the case of investment, nested agreements may cause uncertainties. This is especially true for procedural issues of investor–state disputes (Chaisse 2012). While overlapped or nested IIAs may give investors more options on dispute settlements, confusion may occur if the necessary procedures stipulated in the overlapped or nested IIAs are inconsistent with each other. On the one hand, if the IIAs stipulate that a domestic court or international arbitration can be used, such would lead to multiple options, which is not necessarily a good thing; on the other hand, if they stipulate that a domestic court or international arbitration shall be used, there would be a conflict between the two, which is, again, not a good thing.
Consider a situation wherein a plurilateral IIA requests investors to first use a domestic court to settle the issues, while a nested or overlapped bilateral IIA would allow investors to directly submit the issue to international arbitration. A concrete scenario of this kind is emerging with the Trans-Pacific Partnership (TPP) negotiations, which involves, so far, four Association of South-East Asian Nations (ASEAN) countries: Viet Nam, Singapore, Malaysia, and Brunei Darussalam. Investors from one of these countries may lodge a claim against another under proposed TPP ISDS rules and also under the ASEAN Comprehensive Investment Agreement (ACIA), which incorporates different rules of procedure. One can add another layer to this scenario since Malaysia and Viet Nam concluded a bilateral investment treaty in 1992, which offers a third instrument enabling Vietnamese and Malaysian investors to bring a claim against the host state. When thinking of the key objective of IIAs, which is to promote and protect investment, one might wonder what this complex multilayered regulation of FDI between two countries can add. Some may argue that it is good investors are given choices among, at least, three fora. Some may rather look at the risks taken by the host state, which through inconsistent treaty practices over time, may have to face various claims under different rules.
Another possible inconsistency between overlapped and nested IIAs relates to the substance of rules (not procedures).
country—CountryCforthefirstagreementandCountryDforthesecondagreement(Figure5.1).Inthiscase,tradebetweenCountries A and B faces the problem similar to nested agreements, while trade between A and B and C and trade between A and B and D is faced with the problem similar to intersected problems.
Note: A, B, C and D represent countries. Bilateral agreements are represented as a line and plurilateral agreements are represented as a circle. Source: Authors’ illustration based on Hamanaka (2012).
Overlapped Agreements Nested Agreements Intersected Agreements
C D A
B
B–C bilateral A–B–C trilateral
A–B–C trilateral A–B–D trilateral
A–B bilateral A–C bilateral
B C
A
B C
A
57
Asian noodle bowl of international investment agreements
Here, again, the investor is likely to simply opt for MFN, but at an earlier stage the host country administration may have difficulties in determining the substantive requirements in its treatment of foreign investors. Suppose a situation wherein a plurilateral IIA lists several prohibited performance requirement measures and provides no limitation on the introduction of other performance requirement measures, while a (nested) bilateral IIA includes a longer list of prohibited performance requirement measures. In such a case, it is not easy to foresee which set of rules prevails. One can, however, assume that the host country always treats foreign investors in the best way it can. In short, while nested agreements give traders more options, the effective rules that restrict states’ behavior and policies become unclear if two or more IIAs are nested.
Intersected IIAs: treaty shopping problems and unexpected use of agreements
Since a large number of agreements have been signed, intersected agreements are a common phenomenon. The issue of intersected agreements occurs if one country signs an agreement with two different partners separately. It is very unrealistic to assume that those agreements have a similar legal regime on FDI. Thus, the issue of intersected agreements is aggravated by the indefinite number of agreements involved. If one country signs 10 different agreements with 10 different partners, all those agreements constitute an intersected agreement problem. In the case of nested agreements, the number of the concerned agreements is relatively limited.
What is the problem with intersected agreements? Why is a certain country signing different types of agreements with different partners so problematic? What is the point of differentiating partners and having different types of agreement with different partners? In order to tackle these questions, there are two inter-related issues to be considered: (i) treaty shopping and (ii) unexpected use of the agreement. Given the number of agreements involved, the problem of treaty shopping becomes serious in the case of intersected agreements. While the problem of nested agreements is limited to the choice among a limited number of agreements that include the same parties (trilateral A–B–C agreement versus bilateral B–C agreement), there are many more options in the case of intersected agreements if treaty shopping becomes an issue.
Treaty shopping is relatively less serious in the field of trade (in goods). This is mainly because there is an established concept of Rules of Origin (ROO) for goods trade. It is natural that an export from Country B to Country A uses an A–B agreement to secure preferential access. There is still a possibility that an A–C agreement could be used for export from Country B to Country A, depending on the ROO stipulated in the A–C agreement (to be precise, in such a case goods from Country B to Country A is regarded as A-C trade). However, this certainly leads to more options for traders: a trader in Country B can use both an A–B agreement and an A–C agreement. Some may argue that the unexpected use of agreement (use of an A–C agreement by a trader in Country B exporting to Country A) could be problematic. Such an unexpected use of agreement by traders leads to uncertainty from a policy perspective, but this essentially increases business opportunity. Moreover, an agreement’s “leaky” ROO that leads to an unexpected way of using the agreement simply reduces the discriminatory effects of FTAs.
In the case of investment, treaty shopping problems seems to be more serious than in the case of goods because the origin of investor and investment is more ambiguous. IIAs usually employ a very broad definition of investment and qualification for investor is usually not demanding. Moreover, one should note that investors are mobile. This is especially true for multinational corporations (MNCs). MNCs have a temptation to partially (re)locate its base, so that their investment assets are best protected, by selecting the economy that has a favorable IIA with the country in which its investment is hosted. In short, treaty shopping leads to more legal options for investors. Why is this a problem? This is because IIAs usually involve investor-state dispute mechanisms under which a state could be sued by an investor. The uncertainly with regard to the origin determination (of firms) and the mobility of firms may lead to an unexpected investor-state dispute, which is not favorable for governments. Interestingly, even a firm in the third country without an IIA with the concerned country may file a claim against it.
In 2010, Australia introduced plain packaging for all tobacco products (drab dark brown with no trademarks) (Table 5.3). The purpose of the new bill was to discourage smoking and implement the Framework Convention on Tobacco Control (FCTC) as imposed by the World Health Organization (WHO). However, this regulation, which aims at protecting consumer health, is being challenged by Philip Morris before an international tribunal for an alleged breach of the Hong Kong–Australia BIT. How did we get to where there is a question whether Australia’s plain packaging legislation violates a Hong Kong–Australia BIT? Philip Morris launched proceedings via an Asian subsidiary although it is an American company based in Virginia. Indeed, the US–Australia FTA does not have ISDS and would not allow Philip Morris to sue Australia for a breach of US–Australia FTA. As one can imagine, Australia never intended to give up its regulatory power to address health issues in the 1996 BIT concluded with Hong Kong. Equally unanticipated was the idea of a claim brought by an investor formally registered in Hong Kong but which is known as a powerful American MNC (Chaisse 2013). Of course, one might expect a sovereign state such as Australia to anticipate such developments.
58
Current Issues in Asia Pacific Foreign Direct Investment
However, one can also perceive the considerable challenges raised by MNCs and their capacity to opportunely relocate to new jurisdictions to benefit from more favorable rights and access to arbitration.
Table 5.3. Australian tobacco regulation timeline April 2010 Australia announces plans for plain packaging; consultation papers, draft legislation
22 June 2011 Philip Morris serves Notice of Claim to Australia to initiate negotiations before arbitration
21 November 2011
Tobacco Plain Packaging Act 2011 and Trademarks Amendment (Tobacco Plain Packaging) bill receive final legislative approval; Philip Morris announces it will pursue remedies via the Hong Kong–Australia BIT and domestically in Australian courts
20 December 2011 Philip Morris files writ against Australia government
March 2012 Ukraine complains to WTO
1 July 2012 Tobacco legislation in force
October 2012 Australia High Court rejects tobacco companies’ claim
February 2013, July 2013, October 2013, February 2015
On-going arbitration hearings
IV. The way forward: regionalization of international investment governanceA major recent trend in international investment rule-making is the increasing regionalization of negotiations. This will have an impact on Asian regulations. If the core of international investment regulations remains based on BITs and bilateral FTAs, it is important to underscore the importance of ongoing negotiations of broader pacts, which involve more than two countries and cover a number of economic areas. The rise of plurilateral agreements with a wider scope is likely to produce greater economic effects while spreading the basic principles of foreign investment protection to most Asian economies.
ASEAN Comprehensive Investment Agreement (ACIA)
ACIA was signed in February 2009. It consolidated two existing agreements: the ASEAN Investment Area (AIA) of 1998 and the ASEAN Agreement on the Promotion and Protection of Investments of 1987, also known as ASEAN Investment Guarantee Agreement (IGA). ACIA has an expanded scope as it covers both FDI and Portfolio investment (compared with AIA [FDI only]). Also, the benefits of ACIA apply to both ASEAN investors and foreign-owned ASEAN-based investors. In terms of liberalization, ACIA allows for the expansion of the Agreement to cover other sectors in the future, such as services incidental to manufacturing, agriculture, fishery, forestry, mining and quarrying (Article 3(3) (f)) and any other sectors, as may be agreed upon by all Member States (Article 3(3) (g)). ACIA also has more comprehensive and clear provisions relating to investment protection. ACIA Annex 1 formalizes requirements for governments providing “approval in writing” for investments to be covered, while Annex 2 clarifies the key concepts of expropriation and compensation, including fair and equitable treatment (Article 11.2 on inclusion of “for greater certainty provision). ACIA provides a more comprehensive dispute settlement mechanism. First, in order to ensure genuine claims (and avoid treaty shopping), the scope of coverage has been clarified (Article 29). The incurred loss or damage is regulated (Article 29.1). No claim against state-owned enterprises can be made under ACIA (Article 29.2). A second change is the promotion of alternative dispute settlement mechanisms, particularly conciliation (Article 30), consultations, and negotiation (Article 31). Third, there is greater transparency and detailed procedures for ISDS (Article 32 and Article 41). And fourth, a mechanism for state-to-state dispute settlement (Article 27), the ASEAN Protocol on Enhanced Dispute Settlement Mechanism, was included in 2004.
Regional Comprehensive Economic Partnership (RCEP)
In 2011, ASEAN proposed the development of RCEP, under which the modality of economic interaction in East

59
Asian noodle bowl of international investment agreements
Asia could be discussed by going beyond current ASEAN membership. All countries that have FTAs or Economic Partnership Agreements (EPAs) with ASEAN members – including the PRC, Japan, and the Republic of Korea, as well as Australia, New Zealand, and India – are involved in RCEP. Officially, the RCEP will aim at creating a liberal, facilitative, and competitive investment environment in the region. Negotiations will cover the four pillars of promotion, protection, facilitation, and liberalization. However, only limited progress has been made. It is difficult to foresee at this stage the modality of the investment chapter of RCEP, mainly because of the disagreement between Japan and the PRC with regard to the level of ambition. First, the investment chapter in Japan and China’s FTA with ASEAN are very different. The ASEAN-PRC FTA came into force in 2005, while its investment chapter became effective in 2010. However, this is not an ambitious agreement, covering only the protection of investment. Meanwhile Japan’s EPAs with individual ASEAN members include relatively sophisticated investment chapters that cover both the protection and liberalization of investment. Second, the PRC–Japan–Korea (CJK) trilateral investment treaty recently signed after 9 years of negotiations suggest the investment chapter in RCEP will be a very difficult negotiation. The CJK trilateral investment treaty is not very ambitious because it covers the protection of investment only (liberalization is not covered) and its list of prohibited performance requirement measures is limited. The dominant argument in Japan is that if a trilateral FTA among the PRC, Japan, and the Republic of Korea is to be pursued, its investment chapters should be more ambitious. A similar position is likely for negotiations on RCEP. From the Chinese perspective, the trilateral investment treaty is a done deal, upon which the investment chapter of a trilateral FTA and RCEP should be based.
Trans-Pacific Partnership (TPP)
TPP is proposed as a 21st century FTA designed to change the nature of FTAs addressing the problems associated with them and making them more useful in spreading liberalization globally by “multilateralizing regionalism” (Baldwin 2006). The level of US leadership is obvious in both the form and substance of the TPP. While exerting this leadership in a group of 11 countries, half of which are emerging economies, the negotiations have isolated the largest emerging economies: the PRC, India, and Brazil (Chaisse 2014). In fact, the June 2012 leaked draft of the TPP investment chapter, which was largely unchanged as of April 2013, resembled in large measure the more recent US IIAs rather than the 1995 text of NAFTA Chapter 11. In a nutshell, the TPP investment chapter does not provide major innovations in terms of treaty drafting. However, the TPP crystallizes innovations since 2001 in terms of NAFTA interpreting notes and NAFTA case law. The normative quality of the TPP, however, places the agreement among the most detailed and important investment treaties.
The question is whether or not those regional IIAs increase or mitigate the noodle bowl problems. The TPP seems to be a best case to examine this issue because it entails many of the common-member agreements discussed above. First, many agreements will be overlapped and nested with TPP once it is signed. TPP will presumably supersede NAFTA and other existing IIAs where there is overlap, as it is negotiated in the context of an agreement of great economic significance, including a broad MFN provision. Interestingly, the TPP may be read as a de facto renegotiation of NAFTA and many other agreements such as the ASEAN–Australia–New Zealand FTA. The TPP is even more clearly a strengthening of investment disciplines for some developing countries such as Viet Nam and Malaysia, which have not previously been bound to the US. If TPP investment chapter becomes high quality, it will be the agreement to govern regional investment. However, problems associated with nested agreements, namely possible inconsistency across agreements, may continue to exist, even if TPP becomes high quality. One way to eradicate the problem is to suspend any smaller nested IIAs. The suspension of investment treaties is relatively easy because the World Trade Organization (WTO) consistency problem does not seem to be serious. Letting smaller nested IIAs expire would be a more moderate method than suspension. In the case of FTAs with an investment chapter, the termination of all provisions of an FTA when TPP is signed (replacing old FTAs with TPP) would be likely to violate WTO rules, if non-members’ trade is worse-off The suspension of the FTA investment chapter alone would be an option, though it is unclear at this stage if such is WTO consistent.
Second, the problems associated with intersected agreements especially the treaty shopping problem would be more serious after the TPP conclusion. This is because firms in the non-TPP party (say, Chinese companies) may try to get benefit from the more powerful provisions of the TPP. How to overcome this problem? “Open accession” seems to be an answer. For insiders, there is an incentive to include new members, say, China, because Chinese firms may treaty shop to take advantage of TPP provisions even if the country is outside TPP. Outsiders may also have an incentive to join. The absence of geographic or economic conditions gives the TPP a significant attractiveness. Should other countries join the TPP and ratify, among other provisions, the investment chapter, this would no doubt signify an embryonic version of a long-awaited multilateral agreement on investment.
The argument above (the suspension of investment chapter under FTAs and open accession to an investment chapter under FTAs) lead to one fundamental question: whether investment should be covered along with trade and other issues under the single umbrella of an FTA (including the TPP). As discussed, on the one hand, Asian countries seems to consider trade and investment inseparable, and governing a wide range of economic matters, including both trade and investment under an FTA, is necessary. On the other hand, the noodle bowl problem of trade and investment are
60
Current Issues in Asia Pacific Foreign Direct Investment
different – the latter seems to be more serious because it involves disputes between states and private sectors, unlike trade disputes which are state-state issues. One possible solution is to adopt open accession policy for an investment chapter under an FTA, while it continues to stay under an FTA. More specifically, if outsiders are allowed to accede to only the investment chapter under TPP, as an exception to the single undertaking concept, the noodle bowl problem of investment can be significantly mitigated. In fact, some countries involved in the TPP negotiations are unlikely to accede to the investment chapter. Given this, letting non-members accede to the TPP investment chapter alone seems to be an option worth consideration.
V. ConclusionThis chapter provides a framework of analysis to understand investment rule-making in Asia. Several important issues can be summarized. First, as in the rest of the world, in Asia the regulation of international investment is a field of law, which has experienced major developments especially in the last decade. Second, there are currently 146 intra-regional BITs in force. In addition, there are 21 intra-regional FTAs in Asia that have investment chapters. This large number of IIAs forms the core of the Asian noodle bowl of investment treaties and associated problems. Third, among Asian economies, 13 comprise a group of front-runners that have concluded more than 40 IIAs. This group consists of Thailand, Kazakhstan, Mongolia, Azerbaijan, Pakistan, Uzbekistan, Singapore, Viet Nam, Indonesia, Malaysia, India, the Republic of Korea, and the PRC. Last but not least, although investment rule-making has undergone profound changes in recent years (e.g. “treatification”, proliferation and regionalization), it is very likely to continue to evolve just as quickly.
It seems that the noodle bowl problem has been exaggerated in the field of trade. Nested and overlapped FTAs give traders more options, which is beneficial. The use of the second best FTA still benefits the traders and the use of FTA is not compulsory. Unexpected use of intersected FTAs seldom happens because of ROOs. Even if it happens, this is not a serious problem, because discriminatory effects of FTAs are reduced by it. In contrast, the noodle bowl problem of investment is serious mainly because it entails investor-state disputes. Rules under nested and overlapped IIAs may not be consistent with each other, which lead to the confusion of interpretation. Moreover, the treaty shopping problem is serious, as illustrated by the example of the use of the Hong Kong-Australia BIT by Philip Morris.
Regional agreements such as TPP may increase or mitigate the investment noodle bowl problems in Asia. It is suggested that, first, the TPP will need to be of high quality so that it can virtually supersede existing IIAs. Second, an open accession policy for the investment chapter alone, abandoning the single undertaking concept, may be helpful to address the treaty shopping problem. Permitting countries that are reluctant to accede to the package of all provisions of the TPP to accede to the investment chapter alone would be an option worth consideration.
References Baldwin R. (2006). Multilateralising Regionalism: Spaghetti Bowls as Building Blocs on the Path to Global Free Trade. The World Economy. 29 (11). Pp. 1451–1518.
Chaisse J. and Bellak C. (2011). Do Bilateral Investment Treaties Promote Foreign Direct Investment? Preliminary Reflections on a New Methodology. Transnational Corporations Review. 3 (4). Pp. 3–11.
Chaisse J. (2014). The Evolving and Multilayered Investment Regulatory Framework between the European Union and India. European Law Journal. 20. Pp. 385–422.
Chaisse J. and Bellak C. (2015). Navigating the Expanding Universe of International Treaties on Foreign Investment – Creation and Use of a Critical Index. Journal of International Economic Law 18. Pp. 79–115.
Hamanaka S. (2012). Evolutionary Paths to a Region-Wide Economic Agreement in Asia. Journal of Asian Economics. 23 (4).
Hamanaka S. (2013). A Note on Detecting Biases in Assessing the Use of FTAs. Journal of Asian Economics.
61
I. Introduction The inclusion of investor–state dispute settlement (ISDS) clauses in past bilateral trade and investment agreements, and in multilateral free trade agreements currently under negotiation has been a matter of serious debate, which today remains open.
The ISDS mechanism is an international arbitration procedure, which is already contained in more than 3000 agree-ments worldwide. These include more than 90% of the bilateral investment treaties in force today, but also free trade agreements, such as the North American Free Trade Agreement, and other international investment agreements, such as the ASEAN Comprehensive Investment Agreement. Such a provision enables investors to bring a case before an inter-national arbitration tribunal if they believe that a country has violated the rights granted them by the investment agree-ments. These rights include protection against discrimination, direct and indirect expropriation, unfair and inequitable treatment and restrictions on movement of capital.
Established in the 1960s, the ISDS mechanism was a response to calls by international investors for stronger protection of their investments in countries whose judiciary was deemed not fully independent from the government. An interna-tional arbitration was considered a more neutral framework than national courts to ensure enforcement of the host state’s obligations towards investors. Moreover, it was also seen as a more flexible instrument than state-to-state disputes.
Today, however, this mechanism has been increasingly used to file claims against developed countries (40% of the cases initiated in 2014). Beyond the potential for bias of domestic courts, the preference for international arbitration can be related to the fact that they are specialized in ISDS cases and therefore considered more competent in addressing those cases and to the fact that the arbitration process is often more flexible and rapid than the alternative of a national court procedure.
II. The recordThe first multilateral instrument for resolving investment disputes between investor and state – the International Centre for Settlement of Investment Disputes (ICSID) Convention – was established by the members of the World Bank in 1965. However, there is no record available covering disputes in the first two decades after the establishment of the ISDS mechanism. The earliest attempt to compile statistics on investor–state cases was an initiative of the United Nations Conference on Trade and Development (UNCTAD) and covers cases initiated from 1987. Today, there is still no official public registry of ISDS cases and most arbitration forums do not maintain a register of the claims. Therefore, any analysis of this instrument relies only on the limited set of publicly available information.
According to the latest data released by UNCTAD, the overall number of known ISDS claims up to the year 2014 is 608 (UNCTAD 2015). The number of cases has been growing firmly since 1987, reflecting the likewise steady growth of the amount of investment stock in the world (Figure 6.1). While less than 100 cases were started in the period 1987–2002, the accumulated number of cases had tripled by 2007 and more than doubled again by end-2014. Similarly, the stock of global FDI has increased tenfold since 1990.
That is also the case when the analysis is restricted to the APEC economies, where growth of the ISDS cases and the growth of outward FDI stock largely follow the same trend (Figure 6.2).
Overall, investors from APEC members have started around a third of all ISDS cases. More specifically, they initiated 203 cases out of the 608 ISDS recorded by the end of 2014.
Chapter 6. Investor–state dispute settlement cases in APEC – the recordMartina Francesca Ferracane, Policy Analyst, European Centre for International Political Economy
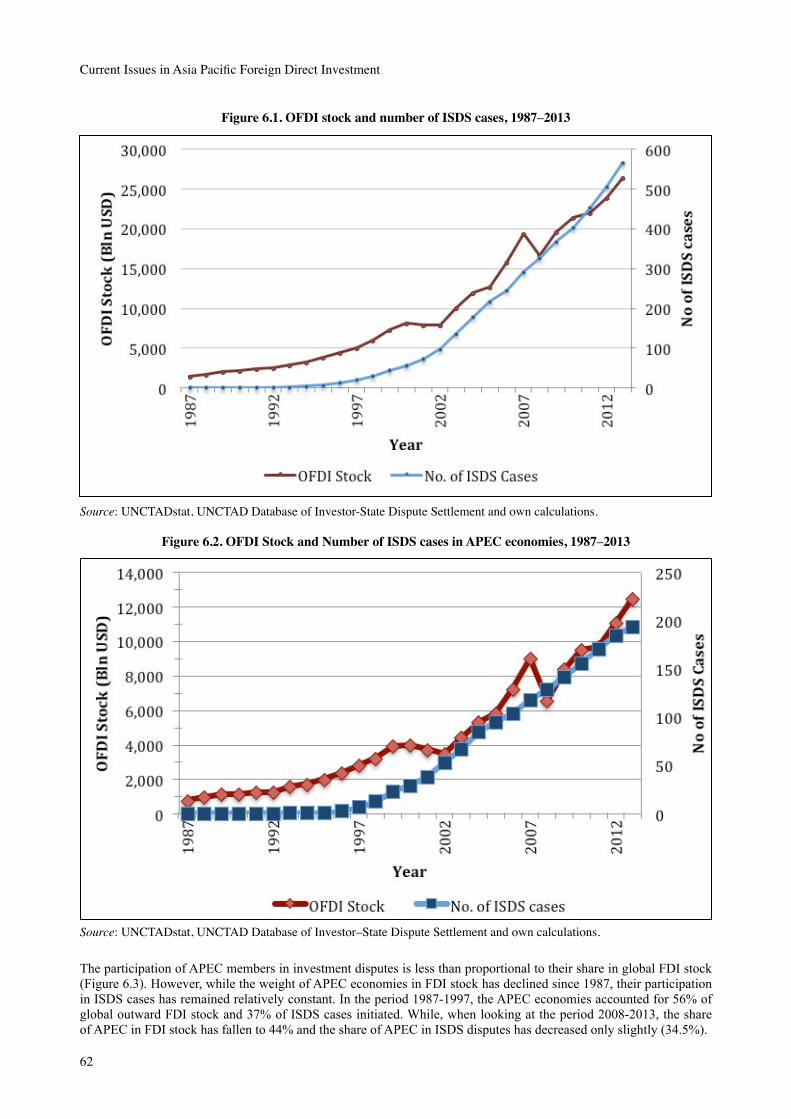
62
Current Issues in Asia Pacific Foreign Direct Investment
Figure 6.1. OFDI stock and number of ISDS cases, 1987–2013
Source:UNCTADstat,UNCTADDatabaseofInvestor-StateDisputeSettlementandowncalculations.
Figure 6.2. OFDI Stock and Number of ISDS cases in APEC economies, 1987–2013
Source:UNCTADstat,UNCTADDatabaseofInvestor–StateDisputeSettlementandowncalculations.
The participation of APEC members in investment disputes is less than proportional to their share in global FDI stock (Figure 6.3). However, while the weight of APEC economies in FDI stock has declined since 1987, their participation in ISDS cases has remained relatively constant. In the period 1987-1997, the APEC economies accounted for 56% of global outward FDI stock and 37% of ISDS cases initiated. While, when looking at the period 2008-2013, the share of APEC in FDI stock has fallen to 44% and the share of APEC in ISDS disputes has decreased only slightly (34.5%).
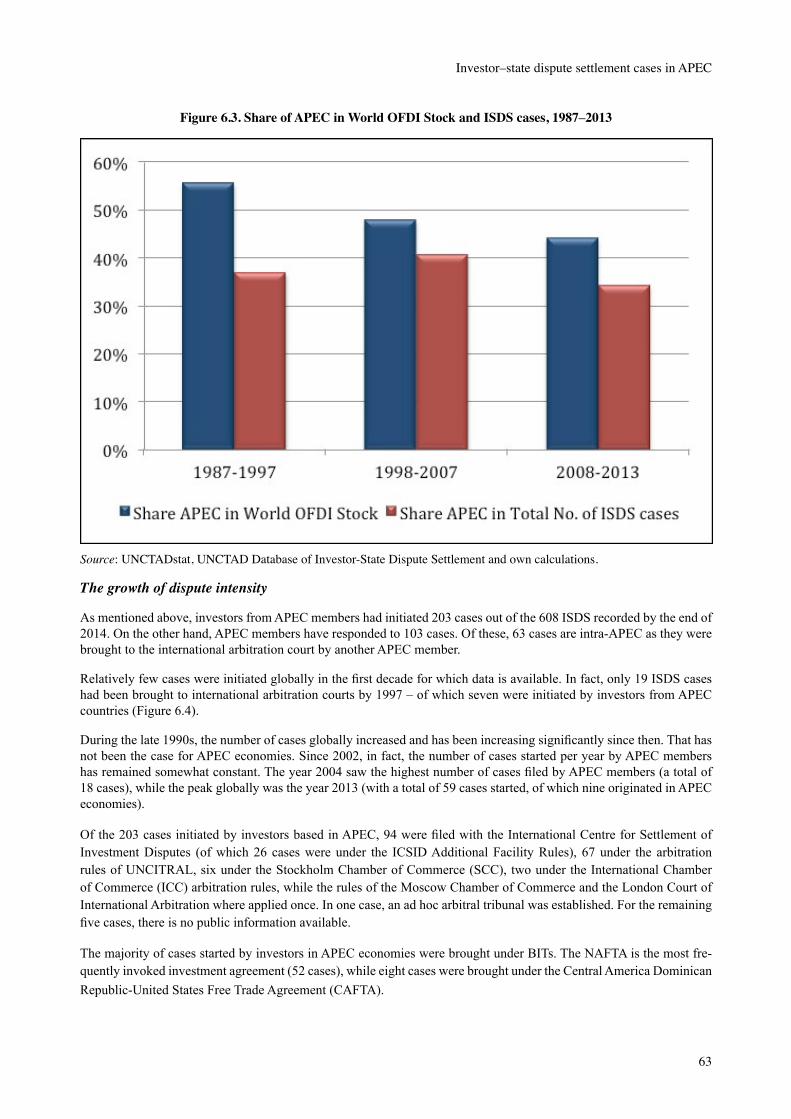
63
Investor–state dispute settlement cases in APEC
Figure 6.3. Share of APEC in World OFDI Stock and ISDS cases, 1987–2013
Source:UNCTADstat,UNCTADDatabaseofInvestor-StateDisputeSettlementandowncalculations.
The growth of dispute intensity
As mentioned above, investors from APEC members had initiated 203 cases out of the 608 ISDS recorded by the end of 2014. On the other hand, APEC members have responded to 103 cases. Of these, 63 cases are intra-APEC as they were brought to the international arbitration court by another APEC member.
Relatively few cases were initiated globally in the first decade for which data is available. In fact, only 19 ISDS cases had been brought to international arbitration courts by 1997 – of which seven were initiated by investors from APEC countries (Figure 6.4).
During the late 1990s, the number of cases globally increased and has been increasing significantly since then. That has not been the case for APEC economies. Since 2002, in fact, the number of cases started per year by APEC members has remained somewhat constant. The year 2004 saw the highest number of cases filed by APEC members (a total of 18 cases), while the peak globally was the year 2013 (with a total of 59 cases started, of which nine originated in APEC economies).
Of the 203 cases initiated by investors based in APEC, 94 were filed with the International Centre for Settlement of Investment Disputes (of which 26 cases were under the ICSID Additional Facility Rules), 67 under the arbitration rules of UNCITRAL, six under the Stockholm Chamber of Commerce (SCC), two under the International Chamber of Commerce (ICC) arbitration rules, while the rules of the Moscow Chamber of Commerce and the London Court of International Arbitration where applied once. In one case, an ad hoc arbitral tribunal was established. For the remaining five cases, there is no public information available.
The majority of cases started by investors in APEC economies were brought under BITs. The NAFTA is the most fre-quently invoked investment agreement (52 cases), while eight cases were brought under the Central America Dominican Republic-United States Free Trade Agreement (CAFTA).
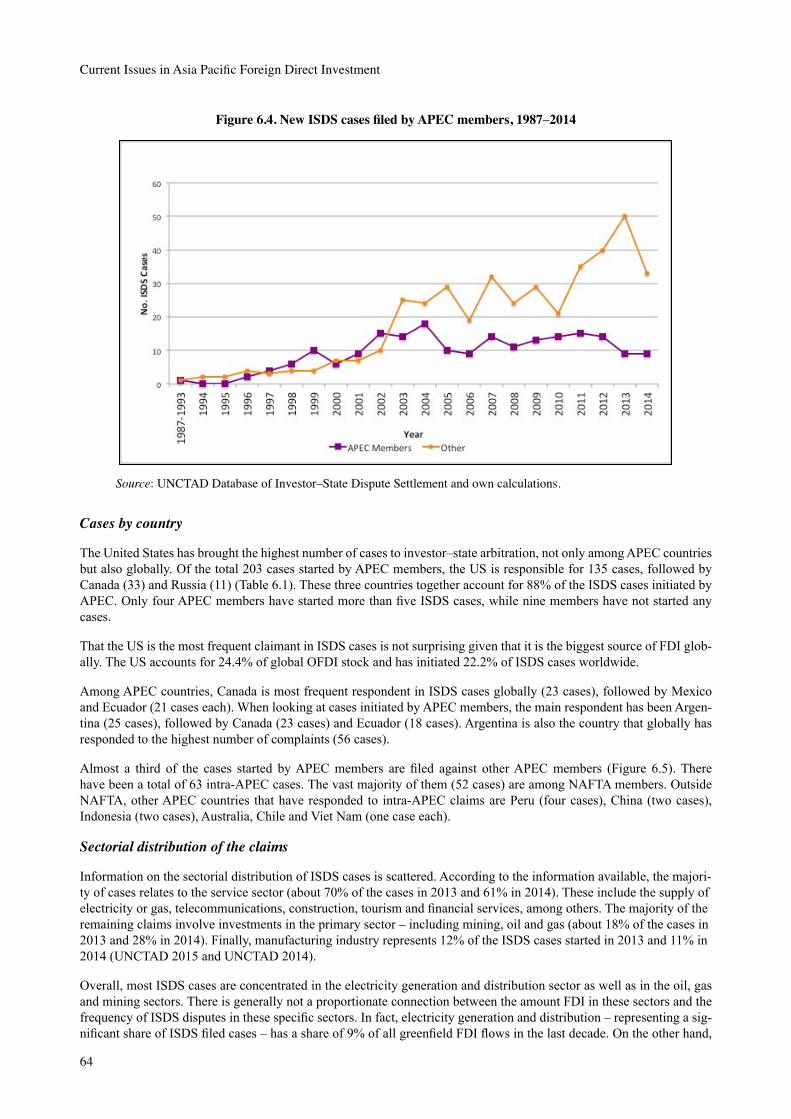
64
Current Issues in Asia Pacific Foreign Direct Investment
Figure 6.4. New ISDS cases filed by APEC members, 1987–2014
Source:UNCTADDatabaseofInvestor–StateDisputeSettlementandowncalculations.
Cases by country
The United States has brought the highest number of cases to investor–state arbitration, not only among APEC countries but also globally. Of the total 203 cases started by APEC members, the US is responsible for 135 cases, followed by Canada (33) and Russia (11) (Table 6.1). These three countries together account for 88% of the ISDS cases initiated by APEC. Only four APEC members have started more than five ISDS cases, while nine members have not started any cases.
That the US is the most frequent claimant in ISDS cases is not surprising given that it is the biggest source of FDI glob-ally. The US accounts for 24.4% of global OFDI stock and has initiated 22.2% of ISDS cases worldwide.
Among APEC countries, Canada is most frequent respondent in ISDS cases globally (23 cases), followed by Mexico and Ecuador (21 cases each). When looking at cases initiated by APEC members, the main respondent has been Argen-tina (25 cases), followed by Canada (23 cases) and Ecuador (18 cases). Argentina is also the country that globally has responded to the highest number of complaints (56 cases).
Almost a third of the cases started by APEC members are filed against other APEC members (Figure 6.5). There have been a total of 63 intra-APEC cases. The vast majority of them (52 cases) are among NAFTA members. Outside NAFTA, other APEC countries that have responded to intra-APEC claims are Peru (four cases), China (two cases), Indonesia (two cases), Australia, Chile and Viet Nam (one case each).
Sectorial distribution of the claims
Information on the sectorial distribution of ISDS cases is scattered. According to the information available, the majori-ty of cases relates to the service sector (about 70% of the cases in 2013 and 61% in 2014). These include the supply of electricity or gas, telecommunications, construction, tourism and financial services, among others. The majority of the remaining claims involve investments in the primary sector – including mining, oil and gas (about 18% of the cases in 2013 and 28% in 2014). Finally, manufacturing industry represents 12% of the ISDS cases started in 2013 and 11% in 2014 (UNCTAD 2015 and UNCTAD 2014).
Overall, most ISDS cases are concentrated in the electricity generation and distribution sector as well as in the oil, gas and mining sectors. There is generally not a proportionate connection between the amount FDI in these sectors and the frequency of ISDS disputes in these specific sectors. In fact, electricity generation and distribution – representing a sig-nificant share of ISDS filed cases – has a share of 9% of all greenfield FDI flows in the last decade. On the other hand,

65
Investor–state dispute settlement cases in APEC
manufacturing represents around 46% of greenfield investments in last decades, but covers a small share of ISDS cases.
For APEC economies as respondents, the majority of cases fall in the oil and gas sector. The share of cases in electricity generation and distribution is significantly lower than in the global average, while a considerable number of cases relate to the financial and insurance activities sector as well as the manufacturing sector.
Table 6.1. Most frequent APEC respondents and claimants in all ISDS cases, 1987–2014 Respondents (number cases) Claimants (number cases)
1 Canada(23) UnitedStates(135)2 Mexico(21) Canada(33)3 Ecuador(21) Russia(11)4 UnitedStates(15) Chile(7)5 Peru(10) China(5)
Source:UNCTADDatabaseofInvestor-StateDisputeSettlementandowncalculations.
Figure 6.5. Intra-APEC ISDS cases, 1987–2014
Source:UNCTADDatabaseofInvestor–StateDisputeSettlementandowncalculations.
Legal principles of ISDS cases
ISDS provisions contained in bilateral investment treaties, free trade agreements and other international agreements covering investment enable investors to bring a case before an international arbitration tribunal if they believe that a country has violated the rights granted them by those agreements. Such rights include protection from expropriation without adequate compensation (both in case of direct and indirect expropriation) and from unfair and inequitable treatment. Such agreements often also contain provisions on protection from discrimination: national treatment and Most-Favoured Nations (MFN) treatment clauses–meaning that a protection granted to a third country also should be
66
Current Issues in Asia Pacific Foreign Direct Investment
unconditionally granted to other third countries. Finally, the agreements protect the investors’ right to freely transfer capital.
In practice, claimants have challenged a broad range of government measures, including cancellations or alleged viola-tions of contracts, revocation or denial of licenses and permits, changes related to investment incentive schemes, alleged breaches of contracts, alleged direct or de facto expropriation, regulation of energy tariffs, allegedly wrongful criminal prosecution, land zoning decisions, invalidation of patents, and others (UNCTAD 2014; UNCTAD 2015).
It is difficult to identify the specific violations an investor has argued that a state has made. From a closer analysis, it emerges that generally investors complain about the breach of several of the legal principles presented above.
The outcome of arbitrations
According to the latest statistics available, the total number of concluded cases reached 356 in 2014. Of these, 37% were decided in favor of the State, 25% in favor of the investor and 28% of the cases settled. The remaining 10% of the cases were either discontinued for reasons other than settlement (8% of the cases) or a treaty breach was found but no monetary compensation was awarded to the investor (2% of the cases).
When investors from APEC countries have started an ISDS case, it has been more likely that the case is awarded to the respondent State (43% of the cases, as shown in Figure 6.6). In 25% of the cases, the two parties settled in advance of an arbitration ruling, while the arbitration panel has sided with the investor in 24% of the cases. The remaining 8% of the cases were discontinued.
The same applies when APEC members are respondents to ISDS claims. The respondent states have won a higher share of cases (43%) than on average globally. The arbitration panel has ruled in favor of the investor in 30% of the cases, while only 20% of the cases have been settled before an arbitration ruling. The remaining 7% of the cases were discon-tinued.
If we consider intra-APEC cases, the State is significantly more likely to win the case (51%) than the investor who has brought the case to the court (21% of the cases). Of the 43 concluded cases, 9% have been discontinued and 19% have been settled before the arbitration ruling.
Awards
Information relating to the amounts claimed and awarded is not often disclosed. In particular, for those cases that do not go through the entire process of dispute proceedings because they are settled in advance of an arbitrational ruling, the specific terms of settlement usually remain confidential.
When information on the outcome of the case is available, it emerges that the amount claimed by the complainant is not fully awarded, usually only a small part of the original claim is awarded. According to an analysis by the Arbitration Institute of the Stockholm Chamber of Commerce (SCC), 61% of the investment awards rendered by the institute were substantially less than the amount claimed, while 28% of the claimants were awarded about half of the claims and the remaining 11% obtained almost the entire amount claimed.
A study of 82 concluded cases published in the North Carolina Law Review, shows that the average amount claimed for these cases was $US 343.5 million, with an average amount awarded by tribunals of $US 10.4 million (Franck 2007). While a more recent study on an enlarged dataset confirms that the inflation-adjusted damage claimed was around $US622 million, while the average amount awarded was around $US16.6 million (Franck 2014).
According to a study by the OECD on 95 concluded cases, claimants seeking international investment arbitration range from individuals with limited international experience (such as an association of retirees) to multi-national companies (Gaukrodger and Gordon 2012). More specifically, 22% of the claimants in the sample are either individuals or small corporations, while 48% of the cases in the sample were brought by medium and large enterprises. Of these, 8% are large multinationals. For the rest of the cases in the sample, little or no public information about the claimant was avail-able.
In the case of APEC claimants, investors from the United States (the APEC Member with the most significant involve-

67
Investor–state dispute settlement cases in APEC
ment in ISDS cases) claimed compensation amounts from $US400,000 to $US6 billion – when the request was dis-closed. However, the amount awarded by tribunals ranged from $460,000 to $US1.8 billion (UNCTAD 2014b)
There have been a total of 21 cases against APEC countries that have been won by the investor. Even though information about the amount sought by the investor is not always clear, it is nevertheless possible to get an overall understanding of the ratio of the amount initially sought that the investor has actually been awarded. A general overview of the results of the analysis is presented in Table 6.2. Overall, the ratio between the amount sought and the amount awarded by the investor is 37%.
There are four cases in which the investor has been awarded less than 10% of the amount sought, while more than 90% of the amount requested by the investor was actually awarded only in two cases.
In 2014, ISDS tribunals rendered the highest known award by far in the history of investment arbitration – $US50 bil-lion. The sum is a combined award in three closely related cases by the three claimants constituting the majority share-holders of former Yukos Oil Company in ISDS proceedings against the Russian Federation (UNCITRAL 2014a,b,c).
Figure 6.6. Outcome of arbitration cases involving by investors from APEC countries
Source:UNCTADDatabaseofInvestor–StateDisputeSettlementandowncalculations.
The debate
Recently, the ISDS mechanism has come under the spotlight during the negotiations of important agreements such as the Comprehensive Trade and Economic Agreement (CETA) between Canada and the EU, the Trans-Pacific Partnership (TPP) between 12 APEC members and the Transatlantic Trade and Investment Partnership (TTIP) between the United States and the EU.
In a number of countries, there has been opposition to the inclusion of the mechanism in international agreements as it is argued that the system contains flaws that allow investors to challenge health, environmental and social regulation. In particular, the lack of transparency around the mechanism, the inconsistency of certain decisions and the high cost of the procedures are criticized as serious obstacles to ensure the legitimacy of the process. An often cited example is the case brought against an APEC Member, Australia, by the tobacco multinational Philip Morris which is challenging the Government’s regulation on plain-packaging of tobacco products.
The financial burden of arbitration proceedings and the sovereignty costs associated with the implementation of these treaties have been recently considered by some countries to outweigh the benefits of bilateral investment treaties (BITs). Bolivia, Ecuador and Venezuela have terminated several BITs and have withdrawn from ICSID, while the Australian government announced, in spring 2011, that it would no longer include investor–state dispute settlement provisions in its trade agreements – a new government subsequently weakened this policy, and inclusion in each new agreement is considered on a case by case basis. ISDS provisions have in fact been included in recent agreements (e.g. with China).
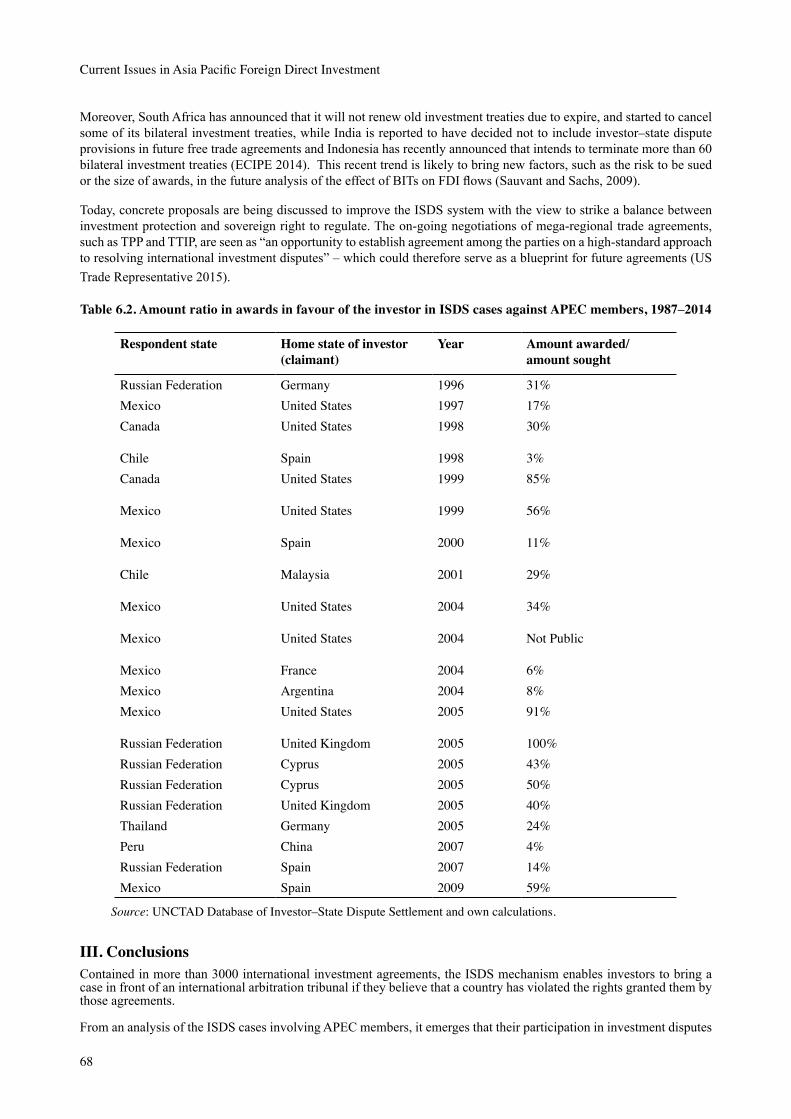
68
Current Issues in Asia Pacific Foreign Direct Investment
Moreover, South Africa has announced that it will not renew old investment treaties due to expire, and started to cancel some of its bilateral investment treaties, while India is reported to have decided not to include investor–state dispute provisions in future free trade agreements and Indonesia has recently announced that intends to terminate more than 60 bilateral investment treaties (ECIPE 2014). This recent trend is likely to bring new factors, such as the risk to be sued or the size of awards, in the future analysis of the effect of BITs on FDI flows (Sauvant and Sachs, 2009).
Today, concrete proposals are being discussed to improve the ISDS system with the view to strike a balance between investment protection and sovereign right to regulate. The on-going negotiations of mega-regional trade agreements, such as TPP and TTIP, are seen as “an opportunity to establish agreement among the parties on a high-standard approach to resolving international investment disputes” – which could therefore serve as a blueprint for future agreements (US Trade Representative 2015).
Table 6.2. Amount ratio in awards in favour of the investor in ISDS cases against APEC members, 1987–2014
Respondent state Home state of investor (claimant)
Year Amount awarded/amount sought
Russian Federation Germany 1996 31%Mexico United States 1997 17%Canada United States 1998 30%
Chile Spain 1998 3%Canada United States 1999 85%
Mexico United States 1999 56%
Mexico Spain 2000 11%
Chile Malaysia 2001 29%
Mexico United States 2004 34%
Mexico United States 2004 NotPublic
Mexico France 2004 6%Mexico Argentina 2004 8%Mexico United States 2005 91%
Russian Federation United Kingdom 2005 100%Russian Federation Cyprus 2005 43%Russian Federation Cyprus 2005 50%Russian Federation United Kingdom 2005 40%Thailand Germany 2005 24%Peru China 2007 4%Russian Federation Spain 2007 14%Mexico Spain 2009 59%
Source:UNCTADDatabaseofInvestor–StateDisputeSettlementandowncalculations.
III. ConclusionsContained in more than 3000 international investment agreements, the ISDS mechanism enables investors to bring a case in front of an international arbitration tribunal if they believe that a country has violated the rights granted them by those agreements.
From an analysis of the ISDS cases involving APEC members, it emerges that their participation in investment disputes

69
Investor–state dispute settlement cases in APEC
is less than proportional to their share in global FDI stock. They have initiated a total of 203 cases since 1987 (33.4% of the 608 cases recorded globally by 2014), while their share in the global outward FDI stock in 2014 was 44%.
Only four APEC members have started more than five ISDS cases, while nine members have not started any cases. The Unites States has started the highest number of claims (135) and, together with Canada and Russia, they account for 88% of claims from APEC.
On the other hand, APEC members have responded to 103 cases. More than half of these cases are intra-APEC cases (63 cases); NAFTA members account for the vast majority of them (52 cases). The main respondent to claims by investors from APEC countries is Argentina (25 cases), followed by Canada (23 cases) and Ecuador (18 cases).
The ISDS cases are generally concentrated in specific sectors such as electricity generation and distribution as primary sector. Where APEC economies are respondents, the majority of cases fall in the oil and gas sector. While a considerable number of cases relate to the financial and insurance activities sector as well as the manufacturing sector.
Following the general pattern that can be identified globally, the cases involving APEC countries show a higher prob-ability to be awarded to the state than to the investor. If we consider intra-APEC cases, the state is significantly more likely to win the case (51%) than the investor who has brought the case to the court (21% of the cases).
When information on the outcome of the case is available, where the claimant is successful, the amount claimed is usually not fully awarded and only a small part of the original claim is awarded. In APEC economies, on average, the investor has been awarded 37% of the amount sought.
In 2014, ISDS tribunals rendered the highest known award by far in the history of investment arbitration. An APEC Member – the Russian Federation – has lost a case by the three claimants constituting the majority shareholders of for-mer Yukos Oil and has been requested to pay a sum of $US 50 billion.
The ISDS mechanism has been at the core of a vigorous debate in the last years, especially since Philip Morris chal-lenged the decision by the Australian Government to impose plain tobacco packaging. The inclusion of ISDS clause in several agreements has been on the spotlight and a potential obstacle to the conclusion of these FTAs. However, the increasing number of investment agreements being signed and the raising recourse to ISDS claims illustrate the impor-tance and attractiveness of the ISDS instruments for investors.
Current discussions on concrete proposals to improve the ISDS system are therefore welcome and should adapt to a new reality of increasingly growing investment steaming from developing countries. In particular, on-going negotiations of mega-regional trade agreements could serve as a blueprint for future agreements with the view to strike a balance be-tween investment protection and sovereign right to regulate.
ReferencesECIPE (2014). Demystifying Investor-State Dispute Settlement (ISDS). ECIPE Occasional Paper No. 5/2014. By Rod-erick Abbott, Fredrik Erixon, and Martina Francesca Ferracane. Available at http://www.ecipe.org/app/uploads/2014/12/OCC52014__1.pdf
Franck S.D. (2007). Empirically evaluating claims about investment treaty arbitration, North Carolina Law Review, December 2007. Available at http://papers.ssrn.com/sol3/papers.cfm?abstract_id=969257
Franck S.D. (2014), Using Investor–State Mediation Rules to Promote Conflict Management: An Introducto-ry Guide. Washington & Lee Legal Studies Paper No. 2014-13. Washington and Lee University - School of Law - February 2, 2014. Available at http://papers.ssrn.com/sol3/papers.cfm?abstract_id=2389763
Gaukrodger D. and Gordon K. (2012). “Investor-State Dispute Settlement: A Scoping Paper for the Investment Policy Community”, OECD Working Papers on International Investment, 2012/03, OECD Publishing (see P17– 19). Available at http://dx.doi.org/10.1787/5k46b1r85j6f-en
Sauvant K.P. and Sachs L.E. (2009). The Effect of Treaties on Foreign Direct Investment: Bilateral Investment Treaties, Double Taxation Treaties, and Investment Flows, pp. 171-224, Oxford University Press, Oxford and New York, ISBN 9780195388534.
UNCITRAL (2014a). Hulley Enterprises Limited (Cyprus) v. The Russian Federation, UNCITRAL, PCA Case No. AA 226, Award, 18 July 2014
70
Current Issues in Asia Pacific Foreign Direct Investment
UNCITRAL (2014b). Yukos Universal Limited (Isle of Man) v. The Russian Federation, UNCITRAL, PCA Case No. AA 227, Award, 18 July 2014;
UNCITRAL (2014c). Veteran Petroleum Limited (Cyprus) v. The Russian Federation, UNCITRAL, PCA Case No. AA 228, Award, 18 July 2014.
UNCTAD (2014). Recent Developments in Investor-State Dispute Settlement (ISDS). No. 1 – April 2014. Available at http://unctad.org/en/PublicationsLibrary/webdiaepcb2014d3_en.pdf
UNCTAD (2014b), Investor-State Dispute Settlement: An Information Note on the United States and the European Union. No. 2 – June 2014. Available at http://unctad.org/en/PublicationsLibrary/webdiaepcb2014d4_en.pdf
UCNTAD (2015). Recent Trends in IIAs and ISDS. No. 1 – February 2015. Available at http://unctad.org/en/Publica-tionsLibrary/webdiaepcb2015d1_en.pdf
UNCTADstat: http://unctadstat.unctad.org/wds/
UNCTAD Database of Investor-State Dispute Settlement (ISDS): http://unctad.org/en/Pages/DIAE/ISDS.aspx
United States Trade Representative (2015), Fact Sheet: Investor State Dispute Settlement. Available at https://ustr.gov/about-us/policy-offices/press-office/fact-sheets/2015/march/investor-state-dispute-settlement-isds
71
I. IntroductionA notable feature of the on-going globalization process of production and services via foreign direct investment (FDI) has been the proliferation of international investment agreements (IIAs) and bilateral investment treaties (BITs) as well as preferential trade agreements (PTAs) with investment provisions. The “purpose of investment treaties is closely tied … to the removal of obstacles that may stand in the way of allowing and channeling more foreign investment into the host states” (Dolzer and Schreuer 2012, p. 22). Whether the signing and/or ratification of BITs actually lead to an in-creased FDI inflow from the partner economy/economies is therefore a fundamental question for policy makers.
This study looks to answer this fundamental question by two routes in order to provide the ground for evidence-based policy. First, we develop an investment literature overview by discussing the main theoretical arguments to justify pol-icy intervention in the form of the conclusion of IIAs and as to the expected impact on FDI. Second, we describe the actual impact of investment agreements on FDI based on a recent objective review (meta-analysis) of empirical results published at Bellak (2015).
II. Definition of FDI and BITsDefinition of FDI
In brief, FDI reflects the objective of establishing a lasting interest by a resident enterprise in one economy (direct in-vestor) in an enterprise (direct investment enterprise) that is resident in an economy other than that of the direct investor (OECD 2008, p. 48).
There are a number of data issues with FDI statistics, two of which are particularly relevant when assessing the impact of BITs on FDI.
First, the empirical literature is divided concerning the use of flow or stock values of investment. Studies on the effects of BITs on FDI have used both measures. Both measures have virtues and drawbacks. The main virtue in using FDI flows is the availability of large samples, particularly at the bilateral country level; the main drawback refers to the overlap with portfolio investments. Concerning FDI stocks, their main virtue is they represent the cumulative assets covered by BITs, but the main drawback refers to their valuation at historical costs. For example, Bellak and Cantwell (1998) demonstrate the difference in the valuation of FDI stocks at historical values, current values (market values) and constant values.
Second, the majority of studies on the effects of BITs on FDI use bilateral FDI flows as the dependent variable. The reported bilateral FDI flow may, however, be considered problematic when FDI is conducted via a third country (e.g., Hong Kong is a gateway for FDI into/from PRC). In short, this results in imprecise measurement, which has to be taken into account when interpreting empirical results.
Definition of BITs
There are three types of IIAs. The first of these is the investment protection treaty, the second is the investment liberal-ization plus protection treaty. These two are usually called investment treaties. The third type is an investment chapter contained in an (Economic Partnership Agreement/Free Trade Agreement). The distinction between these three types is important for analysis because it is necessary to separate the changes in investment levels due to the investment clauses in an agreement from those changes in investment levels that relate to the interaction between trade and investment (arising from EPA/FTA arrangements).
Chapter 7. Survey of the impact of bilateral investment agreements on foreign direct investment
Christian Bellak,AssociateProfessor,WU,UniversityofEconomics and Business, Department of Economics, Vienna, Austria
72
Current Issues in Asia Pacific Foreign Direct Investment
The bilateral investment treaty (BIT), which is the focus of this analysis, is one important category of IIAs and can fall into any one of these categories. “BITs are agreements between two countries for the reciprocal encouragement, promo-tion and protection of investments in each other’s territories by companies based in either country.” (UNCTAD 2004). For analysis, BITs are usually measured by their number (i.e. whether a BIT exists between a specific country pair or the cumulated number of BITs of a country vis-à-vis the rest of the world (stock of BITs)). However, numbers of BITs do not provide information about differences in the provisions between BITs.
III. Theoretical backgroundIt will be argued that two types of market imperfections arise in the investment decisions of foreign investors. These are related to the fact that once a foreign investment is completed (sunk), this may create a short-run incentive for gov-ernments to change their policies towards foreign investors. Thus, a credibility problem may arise for the host-country government, which ultimately leads to an inefficiently low level of foreign investments. Are BITs (or investment agree-ments in general) a remedy to this problem?
Market imperfections
There are two main factors that lead to market imperfections in investment decisions: information asymmetry and time inconsistency. Both types deal with the impact of the past on future investment decisions.
Information asymmetry refers to the fact that information about the true intentions of a government may be private, that is “when observers lack information about the beliefs and values that are motivating a government to pursue” a certain policy (Tomz 1997, p. 2; see also Kerner 2009, p. 74). When observers are domestic investors, this asymmetry may have a serious impact on their domestic investment decisions. The information asymmetry will be larger, if the government in question is a foreign government where it is more costly for the foreign investor to obtain information, especially when dealing with countries that lack credible institutions (e.g. some developing countries). Due to information asymmetry, investors’ expectations will be based on their experience with past policies and this will inter alia determine their future investment decisions. This argument holds independently of the motivation of the policy change. For example, a host country government may have lowered its taxes in the past to attract FDI or in order to maximize the probability of re-election; or a host country government may have raised its taxes in the past due to external pressures for budget con-solidation. If the rationale for the past policy change is not understood by investors, each investor will make their own interpretation. This may or not be correct, and may result in a different level of investment than would have otherwise have been made.
The time inconsistency argument was originally developed with regard to macroeconomic policies (Kydland and Prescott 1977) but can be applied to micro-based policies as well. It refers to the capacity of governments to change policies over time. For example a government may announce one policy towards foreign investment aiming to influence investors and later, after the investment has been made, change that policy or implement a different policy. In the context of foreign investment, if the short-term incentives for host country governments to change policies, (for example, public pressure before an election), are more important than the long-term incentives (for example, continuing to attract FDI), this can lead to changes in their behavior (policies) towards foreign investors.
Incentives for governments to change investment policies
The market imperfections described in section above provide incentives for governments to change their policies to-wards investors. Because FDI is to a large extent sunk, “once a firm undertakes a FDI, some bargaining power shifts to the host country government, which has an incentive to change the terms of the investment to reap a greater share of the benefits” (Büthe and Milner 2008, p. 743). While at first glance strengthened bargaining power sounds positive from a host country government’s view, it bears potentially unpleasant implications.
The incentive to change an investment policy depends on the extent to which past information asymmetry on part of the actual investors (i.e. the experience of investors with past policies of the host country) impacts on current investment decisions. Countries with a shorter history of FDI (some developing countries, transformation countries) will thus have more room to change investment policies than countries that have hosted FDI for a long time.
In addition, the incentive to change an investment policy depends on the conduct of democratic governments who need to face elections from time to time. They have a tendency to discount the long-term too much in favor of the short-term. This may be aggravated in developing countries, as Büthe and Milner (2009, p. 743) argue, “resource-strapped devel-oping country governments may have an even greater incentive than governments in advanced industrialized countries to discount the long term.”

73
Survey of the impact of bilateral investment agreements on FDI
The aim of such policy changes is to shift the division of surplus from the foreign investor in favor of the government, for example by raising tax levels, raising tariff levels, changes in regulation, fees, selective law enforcement or imposing new labor requirements. The most extreme form is expropriation (Guzman 1998).
Against this view, one may hold that governments will have enough incentives not to exploit their increased bargaining power, once the investment is made (sunk). The argument usually put forward is that governments may resist the temp-tation to seize assets today in order to create or maintain a reputation that will attract future investment (Guzman 1998).
The credibility problem
Viewed from the foreign investor’s perspective, no conduct of government can be truly credible, once the incentives described above exist. As a consequence of the potential lack of credibility, an efficient investment, which would oth-erwise have taken place, may not be carried out at all or be carried out in a non-optimal way (too small or too large).
BITs as remedy to the credibility problem?
Among the policy options to remedy the credibility problem in foreign investment policies, governments have chosen BITs in the overwhelming majority of cases, and more recently regional agreements have included investment provisions. Kerner (2009) argues that there are two economic functions of BITs. First, BITs create signals (prior to investment) and second, BITs create investment protection commitments (applying post investment). BITs address the information asymmetry problem via their signaling function and the time-inconsistency problem via their protection function.
The signaling function of BITs
Signaling in the case of BITs and FDI may be defined as “sending a broadly received “signal” that a country is trust-worthy”. (Kerner 2009, p. 74) In other words, doubts about the true intentions of the host country government – stem-ming from the information asymmetry – can be reduced at the side of the investors, as they “update” their beliefs when the host country signs/ratifies a BIT. Signing/ratifying a BIT creates serious post investment costs on the part of the government as “the host state deliberately renounces an element of its sovereignty” (Dolzer and Schreuer 2012).
As Kerner (2009, p.79) points out, BITs can “present enough ex ante costs, or, … sunk costs, that ratifying a BIT cred-ibly signals that a state is predisposed against expropriating from foreign investors. Any investor can observe the signal sent by a ratified BIT, regardless of whether they are protected. To the extent that ex ante costs effectively convey cred-ibility, any investor should be more willing to invest in a state that signs and ratifies BITs.”
The protection function of BITs
BITs protect investors against some types of political risk through the inclusion of various substantive clauses (e.g. ex-propriation, unfair treatment) and procedural standards (e.g. investor-state dispute settlement provisions). These clauses “present significant ex-post costs to signatory states that violate the agreement” (Kerner 2009, p. 74). How do commit-ments raise ex-post costs? According to Büthe and Milner (2009) formal agreements, such as treaties, make them more visible. However, by far the most important reason why BITs make commitments more credible is the investor-state dispute settlement mechanism included in the majority of BITs which exposes governments to potential liability should they violate a provision of the BIT.
Summarizing, BITs may indeed remedy the credibility problem from a theoretical perspective. Yet, two caveats need to be made, as BITs may not be the optimal policy intervention.
First, it should be noted that BITs favor foreign over domestic investors by treating them differently. In preference, wel-fare maximizing investment policies should avoid any discrimination between domestic and foreign investors. Measures treating all investors alike are a preferable type of investment promotion policy with fewer side effects on the allocation of resources (e.g. subsidies or tax breaks, provision of infrastructure).
Second, in order to turn the theoretical conclusion into a practical one, we need to assess, whether the hypothesized investment promotion effect (above) has any empirical support. It is this latter problem to which we turn now.
IV. Testing these propositionsSurvey methodology: accounting for publication selection bias
Research into the effect of BITs on FDI is plagued by the wide range of differing and contradictory results in the lit-
74
Current Issues in Asia Pacific Foreign Direct Investment
erature. For example, one study may report a positive effect, while another study may report a negative effect; or one study may report a statistically non-significant effect, while the other study may report a statistically significant effect. However, this mixed evidence is found in most areas of economics. BITs and FDI are no exception: even though there are only around 40 empirical studies with about 1,000 single empirical effects of BITs on FDI, the reported results differ significantly.
A survey of empirical results, as the title of this chapter suggests, can take basically two forms. First, a subjective and descriptive review of studies and their results. Second, an objective or quantitative literature review, also called meta-analysis.
It is this latter strand we follow in our analysis, not only because it remedies some of the problems of subjective reviews, but mainly because it allows, inter alia, to correct for biases of reported results in empirical studies.
Biases matter because they affect the size of coefficients measuring effects and/or their statistical significance. As a con-sequence, measures of the impact of BITs on FDI may be under- or overstated. Other meta-analyses have revealed that the size of this over- or understatement may be large (i.e. by a factor of 5 or more). Likewise, the statistical significance may be over- or understated, depending on factors like the sample size, which would lead policy makers erroneously to put too much (or too little) weight on certain determinants of the phenomenon studied. This in turn would lead to a waste of public resources and inefficient resource allocations.
While more than 200 biases have been defined (such as language bias, institution bias), the most serious bias is the publication selection bias. Publication selection bias means that the research that is published may well not reflect all the research on the topic, and may exclude material that does not conform to the conventional view or where the results show only small or statistically insignificant results and are therefore thought to say little about the phenomenon under study (see for example https://www.hendrix.edu/maer-network/default.aspx?id=15088). This effect is so strong that for meta-analysis, we are likely to be better off discarding 90% of the research results in certain cases. (Stanley et al.2010)
Our analysis, reported here, aims to estimate the impact of BITs on both investment flows and investment stocks, based on a meta-analysis of published material. In our analysis, described in detail in Bellak (2015), we have corrected for publication bias and use precision effect testing (a standard statistical test frequently used in meta-analyses) to determine whether there is a genuine effect.
Descriptive results
This subsection presents a brief non-technical overview of the results of the study. For a full description, including a description of the meta-analysis approach, please refer to Bellak (2015).
The mean effect of implementation of a BIT on FDI, in the literature surveyed, ranged from 4 percent to 13 percent and the median values range between 1.9 percent and 19 percent, which is quite plausible from an economic point of view. An effect of, say, 4 percent implies that FDI will increase by 4 percent on average upon the conclusion of a new BIT.
However, these effects may overstate the actual effect size due to the publication selection biases alluded to above and discussed in Bellak (2015). After correction for publication bias and excluding investment effects that arise from trade as opposed to investment promotion, our results indicate that the most precise estimates of the effect of BITs on FDI flows are close to zero where the effect size measures the marginal impact on FDI of a country-pair, which had no BIT, upon the conclusion of a BIT.
Table 7.1 provides an illustration of the results of the analysis and illustrates the need for caution in interpreting mea-sures of the impact of BITs on FDI. With regard to FDI flows, Table 7.1 shows that the estimate, accommodated for publication selection bias, is in the order of 8.2% (standard deviation of 5.2).
Yet, this is likely to overstate the true effect and hence these effects need to be qualified: first, they do not pass the Pre-cision Effect Testing (PET)1, which means that there is no genuine effect of BITs on FDI; and second, according to the funnel plot shown in Figure 7.1, the most precise estimates of effect are close to zero. Funnel plots are used in meta- analyses to estimate the extent of unpublished data and to obtain a better estimate of the true effect size – this is found in the ‘stem’ of the inverted funnel (which shows an effect close to zero).
This kind of evidence clearly shows that using just single studies or relying on an average effect can be very misleading.
1 The Precision Effect Test is a statistical test used in meta-analyses to examine whether there is a genuine effect rather than an effect that results from the publication bias.
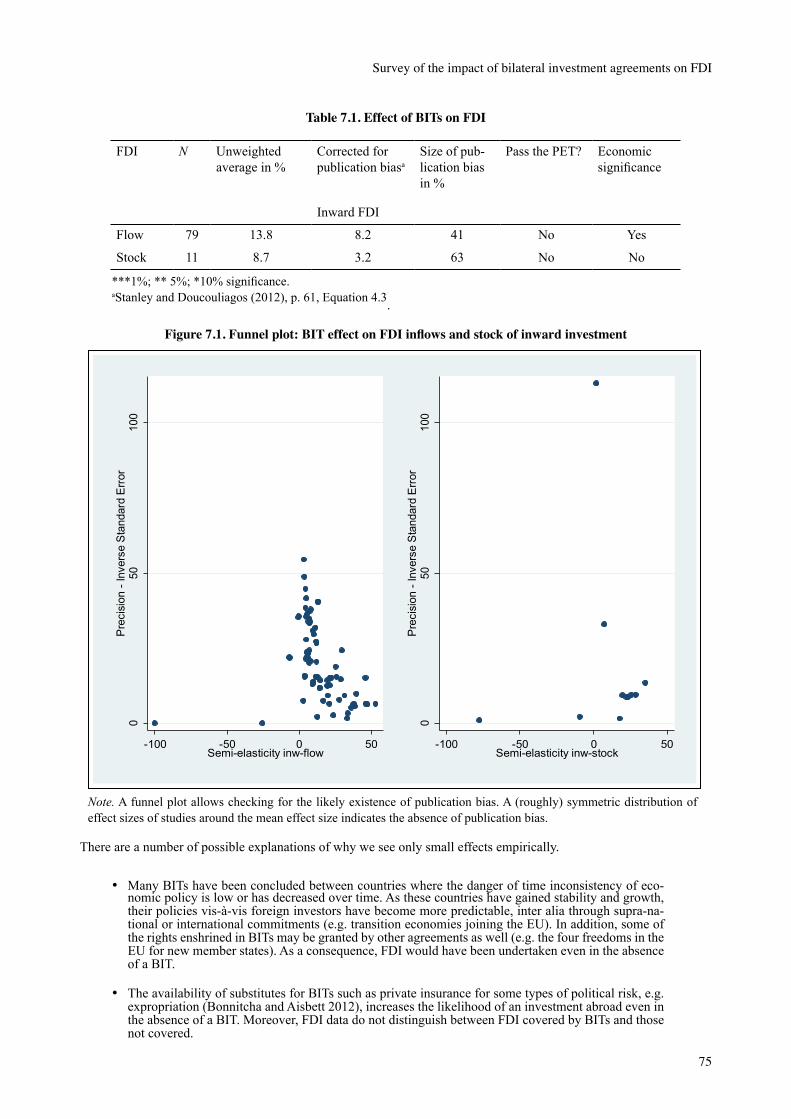
75
Survey of the impact of bilateral investment agreements on FDI
Table 7.1. Effect of BITs on FDI
FDI N Unweighted average in %
Corrected for publication biasa
Size of pub-lication bias in %
Pass the PET? Economic significance
Inward FDI
Flow 79 13.8 8.2 41 No Yes
Stock 11 8.7 3.2 63 No No
***1%; ** 5%; *10% significance. aStanley and Doucouliagos (2012), p. 61, Equation 4.3.
Figure 7.1. Funnel plot: BIT effect on FDI inflows and stock of inward investment
Note. A funnel plot allows checking for the likely existence of publication bias. A (roughly) symmetric distribution of effect sizes of studies around the mean effect size indicates the absence of publication bias.
There are a number of possible explanations of why we see only small effects empirically.
• Many BITs have been concluded between countries where the danger of time inconsistency of eco-nomic policy is low or has decreased over time. As these countries have gained stability and growth, their policies vis-à-vis foreign investors have become more predictable, inter alia through supra-na-tional or international commitments (e.g. transition economies joining the EU). In addition, some of the rights enshrined in BITs may be granted by other agreements as well (e.g. the four freedoms in the EU for new member states). As a consequence, FDI would have been undertaken even in the absence of a BIT.
• The availability of substitutes for BITs such as private insurance for some types of political risk, e.g. expropriation (Bonnitcha and Aisbett 2012), increases the likelihood of an investment abroad even in the absence of a BIT. Moreover, FDI data do not distinguish between FDI covered by BITs and those not covered.
050
100
Prec
isio
n - I
nver
se S
tand
ard
Erro
r
-100 -50 0 50Semi-elasticity inw-flow
050
100
Prec
isio
n - I
nver
se S
tand
ard
Erro
r
-100 -50 0 50Semi-elasticity inw-stock

76
Current Issues in Asia Pacific Foreign Direct Investment
• A related issue is “treaty shopping”, which is a common practice of multinational firms: Studies us-ing aggregate FDI data and aggregate number of BITs face the problem that FDI data do not reveal, whether the actual FDI has been made from a different country than the country whose BIT is invoked in case of conflict, and hence the measured correlation may be spurious.
• Because much FDI was made before BITs were concluded between certain country pairs, an import-ant causality issue is present and regression analysis results, however small they are, may therefore overstate the actual effect.
• A serious shortcoming of existing studies, namely the fact that most studies have used only the quan-tity of BITs, but not the quality of BITs, has to be mentioned in this context. Recently, a few studies have been published (Berger et al. 2013) which revealed the extent to which treaty content matters. In particular, they have shown that the effect of BITs on FDI depends on whether a certain provision has been included into the treaty or not. Liberal admission rules generally promote FDI, but dispute set-tlement provisions play a minor role (Berger et al. 2013). This poor measurement of BITs in empirical studies is a strong determinant of their findings.
• On the basis of applied methodologies, results of empirical studies must be interpreted mostly as short-run effects. Yet, trust is not built overnight but long-run effects are difficult to derive.
• With regard to the FDI promotion effect of BITs, our reading of the results of empirical studies is that BITs do not function “stand-alone”. Rather, BITs indirectly exert an effect on FDI in the context of other determinants of FDI, institutional determinants in particular. (See Leibrecht and Bellak 2015 for a discussion of BITs as FDI incentives.) Thus, we do not share the view as expressed by Busse et al. (2010), for example, who conclude that “BITs may even substitute for domestic institutions.”
• From a conceptual point of view, BITs are part of a system of almost 3000 agreements and in turn are part of a system of international investment law. Once a systemic view is taken (see Poulsen 2011 2013), a lack of coherence in BIT standards as well as in the application of BITs (by arbitration tribunals) is revealed. For example, based on a large number of interviews, Poulsen (2011) reports a severe lack of knowledge on the side of host country authorities about the actual application of trea-ties. For instance, it is often uncertain and can require lengthy and costly litigation to determine if a government’s decision to alter the tax policy or incentive regime actually does constitute a breach of the BIT. And different tribunals may come up with different answers based on the same set of facts. Such evidence shows clearly that BITs may not be able to automatically solve both types of market failures and exert a significant positive effect on FDI.
V. SummaryThis study set out to discuss the fundamental question whether BITs increase FDI from a theoretical and empirical per-spective. In the light of the very heterogeneous empirical evidence put forward so far, the innovation compared to earlier studies has been to employ a meta-analysis technique to address the latter question.
Taken together, the empirical evidence on the basis of a meta-analysis suggests that the FDI promotion effect of BITs seems to be economically and statistically negligible.
However, our results should not be read as implying that BITs are useless, as investor protection may enhance the effects of other types of investment policies and location factors, not least incentives, on FDI (see Leibrecht and Bellak 2015). Thus, the BITs’ promotion effect may work mainly indirectly, i.e. via other location determinants, which impact more strongly on FDI, when a BIT is in place. In other words, BITs may be very helpful for the individual investor in case of problems that arise in the host country, yet BITs do not deliver when considered as a policy to increase aggregate FDI directly.
While we have to conclude that BITs are not an important means to attract FDI through their FDI protection function, BITs may contribute substantially to the sustainability of FDI, as they allow taking legal action against the host country government in certain cases. This is not only possible during the existence of the BIT, but also after the BIT has expired (by termination, by elapse of time etc.) as the rights enshrined in BITs are usually guaranteed for a substantial period after expiration.
Apart from these economic considerations, political motives may be strong explanatory factors behind the dramatic growth of BITs (see Jandhyala et al. 2011).
77
Survey of the impact of bilateral investment agreements on FDI
The relevant policy decision rests on the extent to which governments are prepared to tie their hands via BITs, as commitments enshrined in BITs imply a reduced policy space in other policy areas. On the one hand, this may imply inefficient policy conduct in various areas, e.g. domestic regulation. On the other hand, this may take the form of “reg-ulatory chill”, i.e. that otherwise welfare enhancing policies are not introduced at all; or the need to pay compensation to a foreign investor for the introduction of regulations in the common interest.
The econometric evidence presented here is well complemented by evidence. Poulsen provides feedback from develop-ing country officials (Poulsen 2014) that reflects the ex-post unjustified hopes of negotiators. Poulsen (2014) concludes that national economic benefits have been overestimated and national costs have been ignored in many cases (see also Poulsen et al. 2013). Therefore, the key decision parameter in signing new BITs or regional agreements should be the net welfare effect between welfare gains from FDI (which are by no means automatic) and welfare losses from the lim-itation of the de facto right to regulate in other areas (see Poulsen 2011; Poulsen and Aisbett 2013). This study suggests that policy makers should be very cautious in signing BITs and in considering the commitments made.
ReferencesBellak C. and Cantwell J. (1998). “How important is foreign direct investment?” Oxford Bulletin of Economics and Statistics, Vol. 60, pp. 99-106.
Bellak. C. (2015). “Economic Impact of Investment Agreements”, Department of Economics Working Paper Series, WU Vienna University of Economics and Business, Vienna. Working paper available at : http://www.wu.ac.at/econom-ics/forschung/wp/
Berger A., Busse M., Nunnenkamp P., Roy M. (2010). “Do Trade and Investment Agreements Lead to More FDI? Ac-counting for Key Provisions Inside the Black Box”, Kiel Institute, Working Papers, Issue 1647, 1-28.
Berger A., Busse M., Nunnenkamp P. and Roy M. (2013). “Do trade and investment agreements lead to more FDI? Accounting for key provisions inside the black box.” International Economics and Economic Policy 10, no.2 (June): 247-275.
Bonnitcha J. and Aisbett E. (2012). “An Economic Analysis of the substantive protections provided by investment trea-ties”, Chapter 16 in: Sauvant, K. (ed.) Yearbook on International Investment Law and Policy 2011-2012, Oxford UP: Oxford, pp. 681-704.
Busse M., Königer J. and Nunnenkamp P. (2010). “FDI promotion through bilateral investment treaties: More than a bit?” Review of World Economics, Vol. 146, Issue 1, 147–177.
Büthe T, Milner H.V. (2008). “The Politics of Foreign Direct Investment into Developing Countries: Increasing FDI through International Trade Agreements?” American Journal of Political Science, Vol. 52, No. 4, October 2008, 741–762
Büthe T., Milner H.V. (2009). “Bilateral Investment Treaties and Foreign Direct Investment: A Political Analysis” in Karl P. Sauvant, Lisa E. Sachs (eds.) “The Effect of Treaties on Foreign Direct Investment” (Oxford University Press) 171–224.
Dolzer R. and Schreuer C. (2012). Principles of International Investment Law, 2nd Ed., Oxford UP: Oxford.
Guzman A.T. (1998). “Why LDCs Sign Treaties That Hurt Them: Explaining the Popularity of Bilateral Investment Treaties” Virginia Journal of International Law 38, pp. 639-688.
Hedges L.V. (1992.) “Modeling Publication Selection Effects in Meta-Analysis”, Statistical Science, Vol. 7, No. 2 (May), pp. 246-255.
Inman R. P. (1987). “Markets, governments, and the “new” political economy”, in: A. J. Auerbach and M. Feldstein (eds.), “Handbook of Public Economics”, (Elsevier: Amsterdam et al.). edition 1, volume 2, chapter 12, 647-777.
Jandhyala S., Henisz W.J. and Mansfield E.D. (2011). “Three Waves of BITs: The Global Diffusion of Foreign Invest-ment Policy”, Journal of Conflict Resolution, 55(6), pp. 1047-1073.
Kerner A. (2009). “Why should I believe you? The costs and consequences of Bilateral Investment treaties”, International Studies Quarterly, Volume 53, Issue 1, 73-102.

78
Current Issues in Asia Pacific Foreign Direct Investment
Kydland F. and Prescott E. (1977). “Rules rather than discretion: The inconsistency of optimal plans”, Journal of Polit-ical Economy, 85, pp. 473-490.
Leibrecht M. and Bellak C. (2015). The generalized use of investment incentives, in: Tavares-Lehmann, A. et al. (eds.) Investment incentives, Columbia University Press (forthcoming).
Lejour A. and Salfi M. (2015). The Regional Impact of Bilateral Investment Treaties on Foreign Direct Investment, CPB Discussion paper, Nr. 298, Netherlands.
OECD (2008). OECD Benchmark Definition of Foreign Direct Investment, Fourth ed., Paris: OECD.
Poulsen L.N.S. (2011). “Sacrificing Sovereignty by Chance: Investment Treaties, Developing Countries, and Bounded Rationality, thesis submitted to the Department of International Relations of the London School of Economics and Po-litical Science.” (The London School of Economics and Political Science: London).
Poulsen L.N.S. and Aisbett E. (2013). “When the Claim Hits: Bilateral Investment Treaties and Bounded Rational Learning.” World Politics 65, no. 2: 273—313.
Poulsen L.N.S., Bonnitcha J and Yackee J.W. (2013). “Costs And Benefits Of An EU-USA Investment Protection Trea-ty”, LSE Enterprise: London.
Poulsen L.N.S. (2014). Bounded Rationality and the Diffusion of Modern Investment Treaties. International Studies Quarterly 58, no. 1: 1–14.
Sasse J.P. (2010). An Economic Analysis of Bilateral Investment Treaties, Gabler.
Stanley T.D. and Doucouliagos H. (2012). Meta-Regression Analysis in Economics and Business, Routledge: London and New York.
Stanley T. D., Jarrell S.B. and Doucouliagos H. (2010). “Could It Be Better to Discard 90% of the Data? A Statistical Paradox,” The American Statistician, vol. 64(1), pp 70-77.
Tomz M. (1997). “Do International Agreements Make Reforms more Credible? The Impact of NAFTA on Mexican Stock Prices”, Harvard University, mimeo. http://www.stanford.edu/~tomz/working/credible.pdf
UNCTAD (2004) “ Investment instruments: What are BITs?”, Investment Instruments Online, <(http://www.unctadxi.org/templates/Page____1006.aspx)>
Urata S.(2015). Impacts of FTAs and BITs on the Locational Choice of Foreign Direct Investment: The case of Japanese firms, RIETI Discussion paper Series, 15-E-066, Japan.
79
Jonathan Coppel, Commissioner, Australian Productivity Commission
Chapter 8. Measuring improvements in the investment climate: the use and abuse of indicators
I. Introduction and summaryPolicies towards foreign direct investment (FDI) have traditionally been restrictive, reflecting concerns that FDI erodes tax bases, intensifies pressure to weaken labour and environmental standard and more generally over a loss of economic sovereignty.
In recent decades, however, the benefits of FDI for economic development have been well documented. Studies have demonstrated how open FDI and well-designed supporting policies have helped to create jobs, transferred technology, spurred productivity gains through better organisational arrangements, upgraded skills and strengthened competition (see, for example, OECD 2002). Nonetheless, FDI barriers remain significant in some countries and industries, espe-cially in the form of ownership restrictions.
This chapter evaluates how the use of investment climate indicators and good benchmarking practices can help to im-prove investment policy and strengthen the attractiveness of a country to both domestic and foreign investment. How-ever, there are challenges measuring the investment climate. The chapter takes stock of these challenges and provides policy makers and businesses with guidance on how best to develop and use investment climate indicators. It then con-siders foreign ownership restrictions to illustrate how the appropriate use of indicators can identify good policy practices and their potential benefit in terms of increased investment.
The main findings and implications for investment policy can be summarised as follows:
• Improving the investment climate is not a one-off exercise where problems are identified and reme-died once and for all; it is an iterative process. Policy benchmarking is a powerful tool for monitoring and comparing performance, identifying weaknesses and evaluating possible solutions.
• Improving the investment climate requires a “whole of government” approach to identify priorities and to ensure that the focus is on those areas promising the largest gains. Given the interconnectedness of the investment climate, the system is only as good as its weakest link.
• Comparing countries’ investment climate is limited by the “benchmarking conundrum”: what is dif-ferent cannot be compared, but only what is different is worth comparing. However, it is feasible to benchmark aspects of the investment climate and to identify leading practices as well as practices that do not work.
• Good policy benchmarking practices of the investment climate recognise (but do not use exceptional-ism as an excuse) that: each country is unique; compare like with like; fully understand the strengths and weaknesses of the indicators used; focus on the big picture, not just one benchmark; and seek to understand why a country is at the level or rank portrayed by an indicator.
• A significant and growing number of international investor and policy maker decisions rely on indi-cators of the investment climate for analytical and decision-making purposes. There is a vast array of international indicators and resources for assessing many dimensions of the investment climate that are compiled by international organisations, government agencies, private firms and NGOs.
• Developing new indicators is not cheap. Given the already extensive set of investment climate indi-cators we should concentrate on how to get the most out of existing indicators. This is likely to be achieved by focussing on those indicators that can be influenced by policy and provide a diagnosis on a country’s strengths and weaknesses. It is also critical to understand the reasons for weaknesses or strengths and to strive for transparency and accountability.
• Border barriers have a strong downward influence on FDI. Elasticity estimates imply that ownership barriers could be depressing FDI stocks by between 10 and 80 percent, depending on the restriction considered.

80
Current Issues in Asia Pacific Foreign Direct Investment
• Most economies have become more open to foreign investment over the past two decades. Within the APEC area, the fall in foreign ownership restrictions has been particularly noticeable in the telecom-munications and transport sectors, which were almost completely closed in the early 1980s. Howev-er, cross-country differences remain significant, especially in service industries. There is also more dispersion in ownership restrictions among industries in APEC compared to non-APEC economies.
• An open and receptive business climate signals to investors that foreign (and domestic) investment is welcome. But they are not a panacea for weakness in other areas. Other requirements include strong and predictable regulatory frameworks, well-functioning institutions, economic and political stability and respect for the rule of law. A lower tax rate is unable to cost effectively compensate for weak host country fundamentals.
II. Managing the “benchmarking conundrum”Benchmarking based on quantitative indicators improves accountability and stimulates policy debate and action. It allows policy makers to assess the extent to which policy objectives have been fulfilled and provides a basis for iden-tifying strengths and weaknesses and prioritising reforms. When carried out on a comparative basis with peers, it can provide further impetus for reform by identifying leading practices and lessons. Or, as Lord Kelvin put it, if you can-not measure it, you cannot improve it.
However, policy benchmarking is open to abuse and when applied to assessing the investment climate faces serious challenges posed by the benchmarking conundrum: what is different cannot be compared, but only what is different is worth comparing. This section examines the use and abuse of benchmarking techniques and offers guidance on how to get the most value from the tool.
There are three types of benchmarking in the public sector: benchmarking of public sector organisations; policy processes and public policies. This chapter focusses on the third, where the practical challenges are significant. These challenges relate to controlling for differences in policy objectives and preferences between jurisdictions; the choice and use of quantitative indicators; and the interpretation of results for policy purposes. Each of these challenges is examined below.
Differences in policy objectives and preferences
Many factors influence the location and level of foreign investment. Some cannot be easily influenced by policy (e.g. market size, natural resource endowment, geographic position), others depend on institutional arrangements (e.g. rule of law, political stability and strong stable, predictable regulatory frameworks) and there are factors that can only be influenced in the medium term (e.g. infrastructure quality and education). Then there is a plethora of policy drivers, such as ownership restrictions, taxation, competition, and trade, each with several policy objectives.
Each of these factors plays a role, but benchmarking cannot easily put in perspective the contextual factors, control for the differences in goals and the simultaneous pursuit of multiple policy objectives. Benchmarking against international best practice is even more demanding. Other countries may have similar policy objectives, but societal preferences may be apart and thus governments put different weights and priorities on achieving policy objectives.
Such differences mean that there is not a perfect international comparator and it is not strictly feasible to label jurisdic-tions’ investment policies as international best practice. That said, international experience is a rich source of insights. The issue is how to harvest these insights while excluding practices and policies that cannot be transposed to another context (discussed below).
The choice and use of quantitative indicators
The key strength of quantitative indicators of the investment climate is that they allow, in principle, comparisons and rankings of jurisdictions. Composite indicators are particularly attractive, since they reduce multiple dimensions of the investment climate to a single number for each country in a given year. They thus offer a diagnostic tool and a score of the quality of a country’s investment policy practices and outcomes and make it easy for users to compare scores among countries and or over time.
However, there is no set of indicators that can fully capture policy performance, because indicators by their nature only capture a partial picture of the investment climate. For example, the OECD’s FDI restrictiveness index (discussed be-low) focusses on ownership restrictions based on a country’s legal and regulatory framework, but it does not measure whether or how they are enforced. A strictly quantitative approach to benchmarking is often impractical.
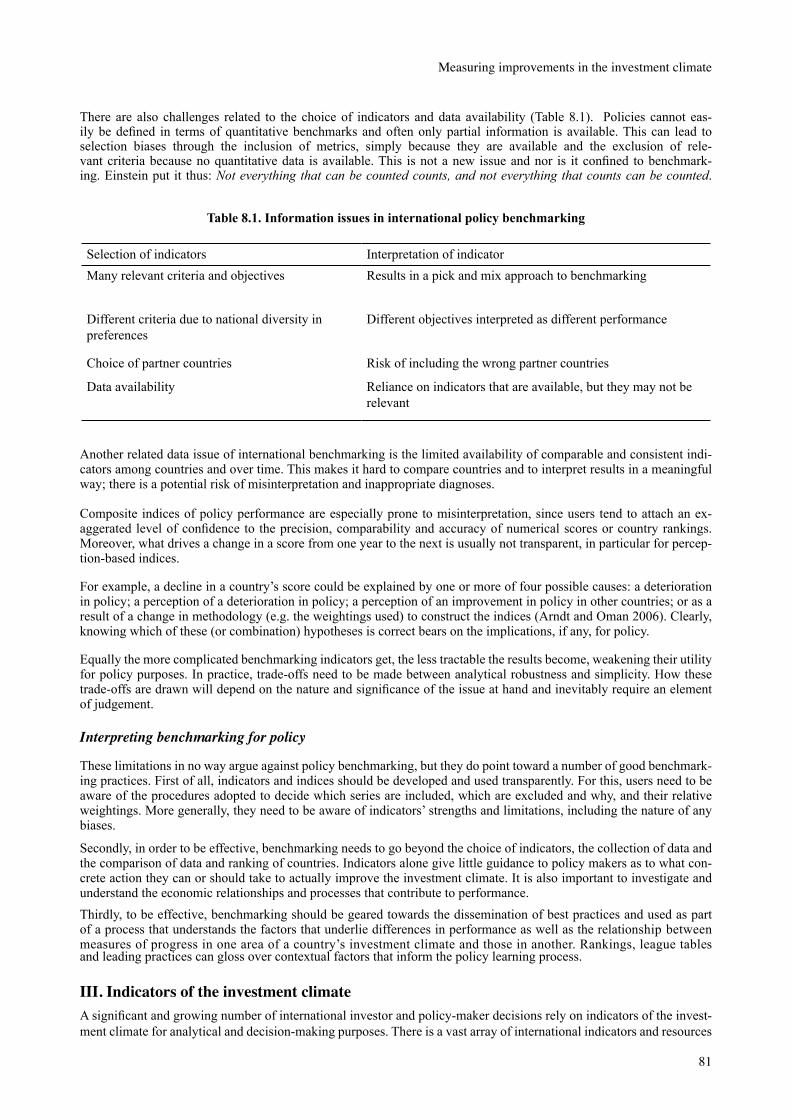
81
Measuring improvements in the investment climate
There are also challenges related to the choice of indicators and data availability (Table 8.1). Policies cannot eas-ily be defined in terms of quantitative benchmarks and often only partial information is available. This can lead to selection biases through the inclusion of metrics, simply because they are available and the exclusion of rele-vant criteria because no quantitative data is available. This is not a new issue and nor is it confined to benchmark-ing. Einstein put it thus: Not everything that can be counted counts, and not everything that counts can be counted.
Table 8.1. Information issues in international policy benchmarking
Selection of indicators Interpretation of indicatorMany relevant criteria and objectives Results in a pick and mix approach to benchmarking
Different criteria due to national diversity in preferences
Different objectives interpreted as different performance
Choice of partner countries Risk of including the wrong partner countries
Data availability Reliance on indicators that are available, but they may not be relevant
Another related data issue of international benchmarking is the limited availability of comparable and consistent indi-cators among countries and over time. This makes it hard to compare countries and to interpret results in a meaningful way; there is a potential risk of misinterpretation and inappropriate diagnoses.
Composite indices of policy performance are especially prone to misinterpretation, since users tend to attach an ex-aggerated level of confidence to the precision, comparability and accuracy of numerical scores or country rankings. Moreover, what drives a change in a score from one year to the next is usually not transparent, in particular for percep-tion-based indices.
For example, a decline in a country’s score could be explained by one or more of four possible causes: a deterioration in policy; a perception of a deterioration in policy; a perception of an improvement in policy in other countries; or as a result of a change in methodology (e.g. the weightings used) to construct the indices (Arndt and Oman 2006). Clearly, knowing which of these (or combination) hypotheses is correct bears on the implications, if any, for policy.
Equally the more complicated benchmarking indicators get, the less tractable the results become, weakening their utility for policy purposes. In practice, trade-offs need to be made between analytical robustness and simplicity. How these trade-offs are drawn will depend on the nature and significance of the issue at hand and inevitably require an element of judgement.
Interpreting benchmarking for policy
These limitations in no way argue against policy benchmarking, but they do point toward a number of good benchmark-ing practices. First of all, indicators and indices should be developed and used transparently. For this, users need to be aware of the procedures adopted to decide which series are included, which are excluded and why, and their relative weightings. More generally, they need to be aware of indicators’ strengths and limitations, including the nature of any biases.
Secondly, in order to be effective, benchmarking needs to go beyond the choice of indicators, the collection of data and the comparison of data and ranking of countries. Indicators alone give little guidance to policy makers as to what con-crete action they can or should take to actually improve the investment climate. It is also important to investigate and understand the economic relationships and processes that contribute to performance.Thirdly, to be effective, benchmarking should be geared towards the dissemination of best practices and used as part of a process that understands the factors that underlie differences in performance as well as the relationship between measures of progress in one area of a country’s investment climate and those in another. Rankings, league tables and leading practices can gloss over contextual factors that inform the policy learning process.
III. Indicators of the investment climateA significant and growing number of international investor and policy-maker decisions rely on indicators of the invest-ment climate for analytical and decision-making purposes. There is a vast array of international indicators and resources

82
Current Issues in Asia Pacific Foreign Direct Investment
for assessing the investment climate compiled by international organisations, government agencies, private firms and NGOs. Some sources focus on specific policy areas or topics and others on institutional aspects. Some metrics are perception based and others are criteria based. The World Bank’s Investing Across Borders report compiled a list of available indicators, which is reproduced in Box 8.1.
The most widely used indicators are composite (or “aggregate”) perceptions-based indicators. Such indicators aggregate often large amounts of information from diverse sources and reduce it to a single number score – per country, per year – to facilitate comparisons. The aggregated information consists of people’s perceptions of FDI attractiveness, or some aspect of it (e.g. the rule of law, control of corruption), in different countries.
Some of these indicators capture the views of firms, individuals and public officials in the countries being assessed. Others sometimes reflect the views of NGOs with considerable experience in the countries being assessed. Still others are based on the assessments of business managers, many of whom live outside the countries they are rating.
There are also private firms that add value to a set of indicators by offering benchmarking tools. For instance, fdibench-mark.com provides corporate location assessment tools that compare the competitiveness of countries and cities. The tool has multiple dimensions: operating costs; general business environment; labour availability and quality; presence of industry cluster; infrastructure and accessibility; living environment. Taxation and restrictiveness of foreign ownership are a part of the general environment dimension.
Box 8.1. Indicators and assessments of the investment climate
Country Commercial Guides (http://www.buyusainfo.net )Country Risk Reports (http://www.ihsglobalinsight.com )Doing Business (http://www.doingbusiness.org )Economic Freedom of the World (http://www.freetheworld.com/reports.html )EIU assessments and other products (http://www.eiu.com )Enterprise Surveys (http://www.enterprisesurveys.org )Euromonitor International (http://www.euromonitor.com )FDI Confidence Index (http://www.atkearney.com )FDI Profiles (http://www.vcc.columbia.edu )FDI Intelligence (http://www.fdiintelligence.com )Fitch Ratings (http://www.fitchratings.com )Global Competitiveness Report (http://www.weforum.org/en/initiatives/gcp )Global Location Trends (http://www.ibm.com/bcs/pli )Global Production Location Scoreboard (http://www.global-production.com/scoreboard )Index of Economic Freedom (http://www.heritage.org/index )International Country Risk Guide (http://www.prsgroup.com/icrg.aspx )Investment Policy Reviews (http://www.unctad.org/ipr )Market Potential Index for Emerging Markets (http://globaledge.msu.edu/re-sourcedesk/mpi )Measures of Restrictions on Inward Foreign Direct Investment in Developing Countries paper(http://www.swarthmore.edu/SocSci/sgolub1 )Moody’s Investor Service (http://www.moodys.com )OCO Insight (http://www.ocoglobal.com/index.cfm?page_name=insight )Policy Framework for Investment (http://www.oecd.org/daf/investment/pfi )Standard and Poor’s (http://www.standardandpoors.com )World Competitiveness Yearbook (http://www.imd.ch/research/publications/wcy/index.cfm )World Investment Report (http://www.unctad.org/wir )
Source: Reproduced from World Bank (2010).
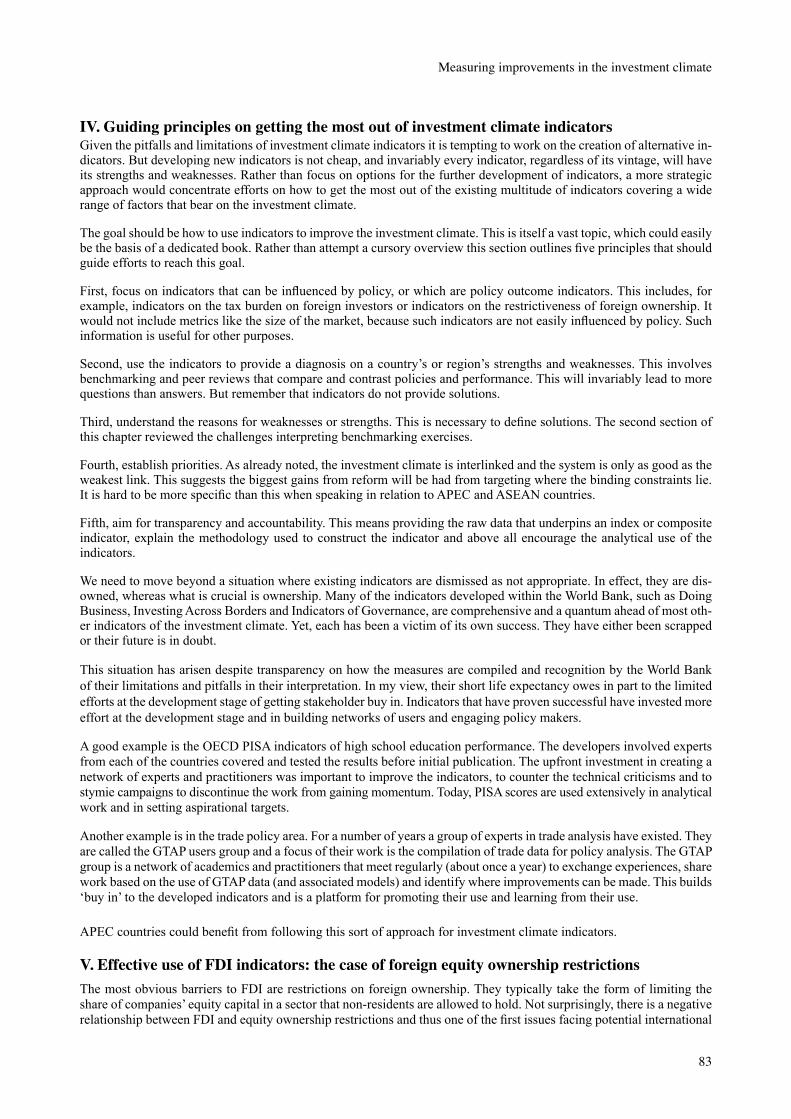
83
Measuring improvements in the investment climate
IV. Guiding principles on getting the most out of investment climate indicatorsGiven the pitfalls and limitations of investment climate indicators it is tempting to work on the creation of alternative in-dicators. But developing new indicators is not cheap, and invariably every indicator, regardless of its vintage, will have its strengths and weaknesses. Rather than focus on options for the further development of indicators, a more strategic approach would concentrate efforts on how to get the most out of the existing multitude of indicators covering a wide range of factors that bear on the investment climate.
The goal should be how to use indicators to improve the investment climate. This is itself a vast topic, which could easily be the basis of a dedicated book. Rather than attempt a cursory overview this section outlines five principles that should guide efforts to reach this goal.
First, focus on indicators that can be influenced by policy, or which are policy outcome indicators. This includes, for example, indicators on the tax burden on foreign investors or indicators on the restrictiveness of foreign ownership. It would not include metrics like the size of the market, because such indicators are not easily influenced by policy. Such information is useful for other purposes.
Second, use the indicators to provide a diagnosis on a country’s or region’s strengths and weaknesses. This involves benchmarking and peer reviews that compare and contrast policies and performance. This will invariably lead to more questions than answers. But remember that indicators do not provide solutions.
Third, understand the reasons for weaknesses or strengths. This is necessary to define solutions. The second section of this chapter reviewed the challenges interpreting benchmarking exercises.
Fourth, establish priorities. As already noted, the investment climate is interlinked and the system is only as good as the weakest link. This suggests the biggest gains from reform will be had from targeting where the binding constraints lie. It is hard to be more specific than this when speaking in relation to APEC and ASEAN countries.
Fifth, aim for transparency and accountability. This means providing the raw data that underpins an index or composite indicator, explain the methodology used to construct the indicator and above all encourage the analytical use of the indicators.
We need to move beyond a situation where existing indicators are dismissed as not appropriate. In effect, they are dis-owned, whereas what is crucial is ownership. Many of the indicators developed within the World Bank, such as Doing Business, Investing Across Borders and Indicators of Governance, are comprehensive and a quantum ahead of most oth-er indicators of the investment climate. Yet, each has been a victim of its own success. They have either been scrapped or their future is in doubt.
This situation has arisen despite transparency on how the measures are compiled and recognition by the World Bank of their limitations and pitfalls in their interpretation. In my view, their short life expectancy owes in part to the limited efforts at the development stage of getting stakeholder buy in. Indicators that have proven successful have invested more effort at the development stage and in building networks of users and engaging policy makers.
A good example is the OECD PISA indicators of high school education performance. The developers involved experts from each of the countries covered and tested the results before initial publication. The upfront investment in creating a network of experts and practitioners was important to improve the indicators, to counter the technical criticisms and to stymie campaigns to discontinue the work from gaining momentum. Today, PISA scores are used extensively in analytical work and in setting aspirational targets.
Another example is in the trade policy area. For a number of years a group of experts in trade analysis have existed. They are called the GTAP users group and a focus of their work is the compilation of trade data for policy analysis. The GTAP group is a network of academics and practitioners that meet regularly (about once a year) to exchange experiences, share work based on the use of GTAP data (and associated models) and identify where improvements can be made. This builds ‘buy in’ to the developed indicators and is a platform for promoting their use and learning from their use.
APEC countries could benefit from following this sort of approach for investment climate indicators.
V. Effective use of FDI indicators: the case of foreign equity ownership restrictionsThe most obvious barriers to FDI are restrictions on foreign ownership. They typically take the form of limiting the share of companies’ equity capital in a sector that non-residents are allowed to hold. Not surprisingly, there is a negative relationship between FDI and equity ownership restrictions and thus one of the first issues facing potential international
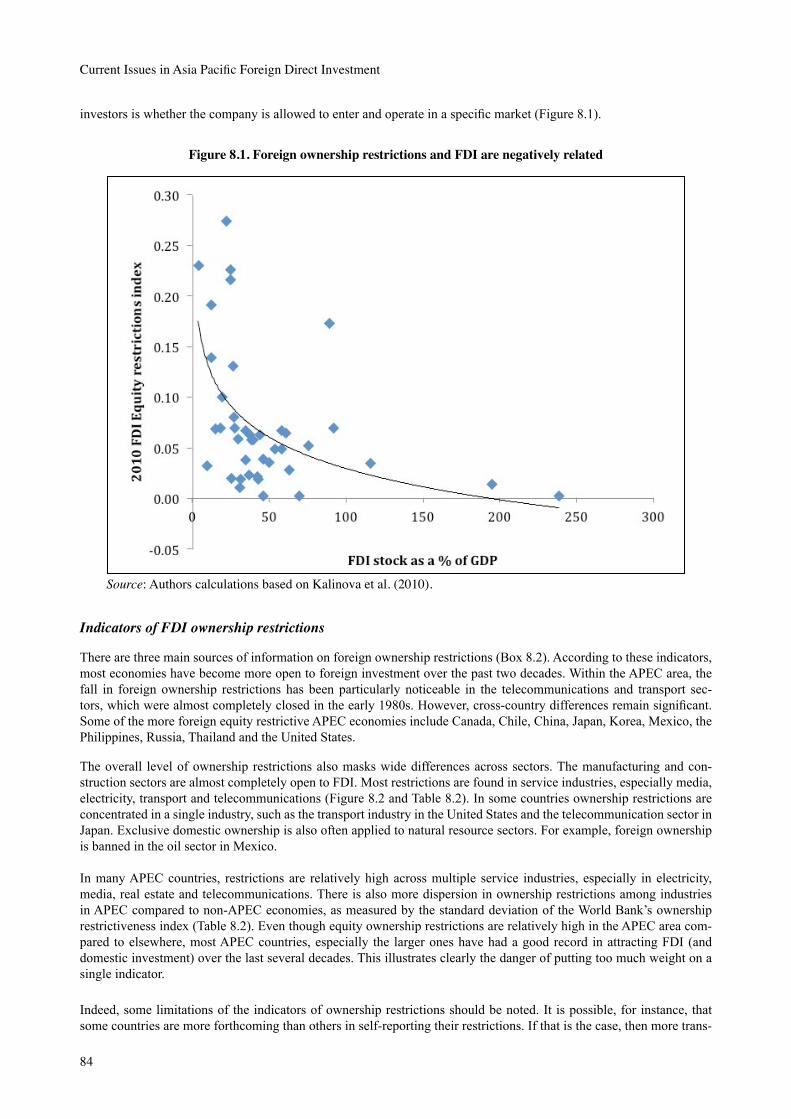
84
Current Issues in Asia Pacific Foreign Direct Investment
investors is whether the company is allowed to enter and operate in a specific market (Figure 8.1).
Figure 8.1. Foreign ownership restrictions and FDI are negatively related
Source:AuthorscalculationsbasedonKalinovaetal.(2010).
Indicators of FDI ownership restrictions
There are three main sources of information on foreign ownership restrictions (Box 8.2). According to these indicators, most economies have become more open to foreign investment over the past two decades. Within the APEC area, the fall in foreign ownership restrictions has been particularly noticeable in the telecommunications and transport sec-tors, which were almost completely closed in the early 1980s. However, cross-country differences remain significant. Some of the more foreign equity restrictive APEC economies include Canada, Chile, China, Japan, Korea, Mexico, the Philippines, Russia, Thailand and the United States.
The overall level of ownership restrictions also masks wide differences across sectors. The manufacturing and con-struction sectors are almost completely open to FDI. Most restrictions are found in service industries, especially media, electricity, transport and telecommunications (Figure 8.2 and Table 8.2). In some countries ownership restrictions are concentrated in a single industry, such as the transport industry in the United States and the telecommunication sector in Japan. Exclusive domestic ownership is also often applied to natural resource sectors. For example, foreign ownership is banned in the oil sector in Mexico.
In many APEC countries, restrictions are relatively high across multiple service industries, especially in electricity, media, real estate and telecommunications. There is also more dispersion in ownership restrictions among industries in APEC compared to non-APEC economies, as measured by the standard deviation of the World Bank’s ownership restrictiveness index (Table 8.2). Even though equity ownership restrictions are relatively high in the APEC area com-pared to elsewhere, most APEC countries, especially the larger ones have had a good record in attracting FDI (and domestic investment) over the last several decades. This illustrates clearly the danger of putting too much weight on a single indicator.
Indeed, some limitations of the indicators of ownership restrictions should be noted. It is possible, for instance, that some countries are more forthcoming than others in self-reporting their restrictions. If that is the case, then more trans-
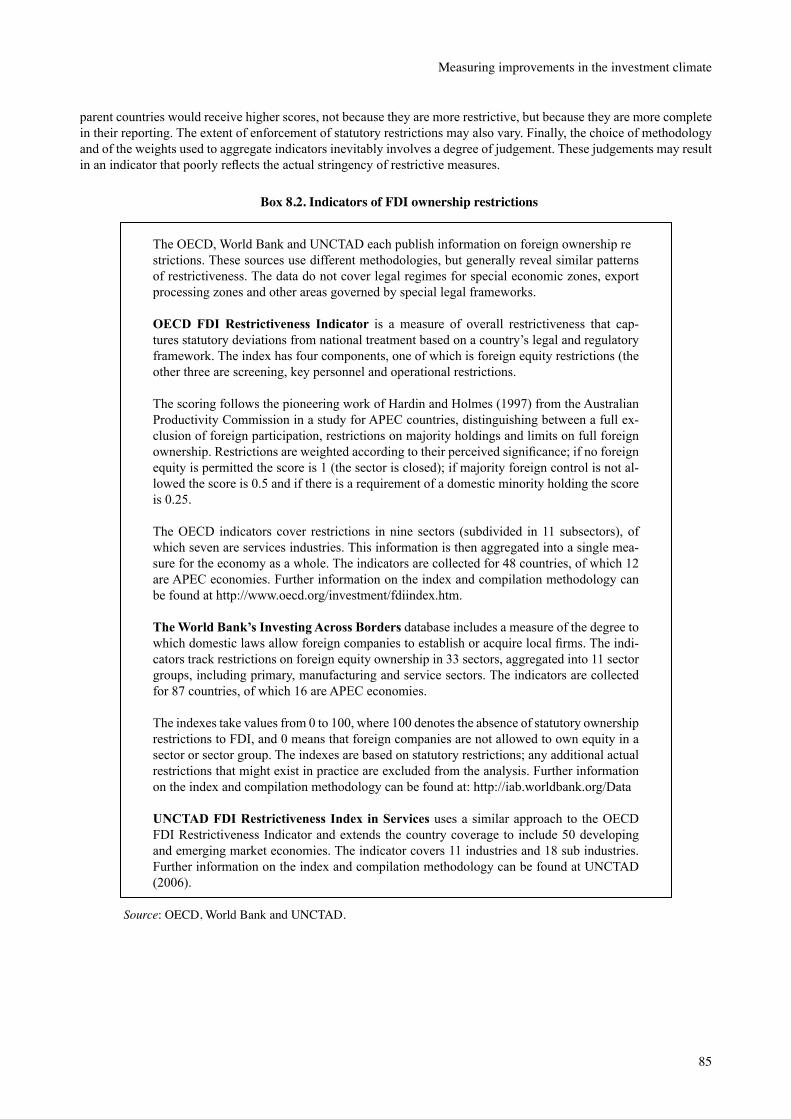
85
Measuring improvements in the investment climate
parent countries would receive higher scores, not because they are more restrictive, but because they are more complete in their reporting. The extent of enforcement of statutory restrictions may also vary. Finally, the choice of methodology and of the weights used to aggregate indicators inevitably involves a degree of judgement. These judgements may result in an indicator that poorly reflects the actual stringency of restrictive measures.
Box 8.2. Indicators of FDI ownership restrictions
The OECD, World Bank and UNCTAD each publish information on foreign ownership restrictions. These sources use different methodologies, but generally reveal similar patterns of restrictiveness. The data do not cover legal regimes for special economic zones, export processing zones and other areas governed by special legal frameworks. OECD FDI Restrictiveness Indicator is a measure of overall restrictiveness that cap-tures statutory deviations from national treatment based on a country’s legal and regulatory framework. The index has four components, one of which is foreign equity restrictions (the other three are screening, key personnel and operational restrictions.
The scoring follows the pioneering work of Hardin and Holmes (1997) from the Australian Productivity Commission in a study for APEC countries, distinguishing between a full ex-clusion of foreign participation, restrictions on majority holdings and limits on full foreign ownership. Restrictions are weighted according to their perceived significance; if no foreign equity is permitted the score is 1 (the sector is closed); if majority foreign control is not al-lowed the score is 0.5 and if there is a requirement of a domestic minority holding the score is 0.25.
The OECD indicators cover restrictions in nine sectors (subdivided in 11 subsectors), of which seven are services industries. This information is then aggregated into a single mea-sure for the economy as a whole. The indicators are collected for 48 countries, of which 12 are APEC economies. Further information on the index and compilation methodology can be found at http://www.oecd.org/investment/fdiindex.htm.
The World Bank’s Investing Across Borders database includes a measure of the degree to which domestic laws allow foreign companies to establish or acquire local firms. The indi-cators track restrictions on foreign equity ownership in 33 sectors, aggregated into 11 sector groups, including primary, manufacturing and service sectors. The indicators are collected for 87 countries, of which 16 are APEC economies.
The indexes take values from 0 to 100, where 100 denotes the absence of statutory ownership restrictions to FDI, and 0 means that foreign companies are not allowed to own equity in a sector or sector group. The indexes are based on statutory restrictions; any additional actual restrictions that might exist in practice are excluded from the analysis. Further information on the index and compilation methodology can be found at: http://iab.worldbank.org/Data
UNCTAD FDI Restrictiveness Index in Services uses a similar approach to the OECD FDI Restrictiveness Indicator and extends the country coverage to include 50 developing and emerging market economies. The indicator covers 11 industries and 18 sub industries. Further information on the index and compilation methodology can be found at UNCTAD (2006).
Source:OECD,WorldBankandUNCTAD.
86
Current Issues in Asia Pacific Foreign Direct Investment
Figure 8.2. FDI restrictiveness by sector and type of measure
Source: Reproduced with permission from Kalinova et al. (2010). Current data available at: www.oecd.org/investment/fdiindex.htm
Table 8.2. Summary indicators of FDI ownership restrictiveness by industry
APEC countries
All countries
APEC countries
All countries
APEC countries
All countries
APEC coun-tries
All coun-tries
Average Standard deviation Maximum Minimum
Mining, oil and gas 83.7 92.5 24.1 18.6 100 100 40 0Agriculture and forestry
86.3 96.1 22.4 13.0 100 100 40 40
Light manufactures 90.8 96.7 12.3 8.3 100 100 69 65Telecom 69.2 88.5 25.3 21.1 100 100 40 0Electricity 78.8 88.7 30.7 23.3 100 100 0 0Banking 83.3 92.0 21.5 20.2 100 100 49 0Insurance 81.7 91.7 24.4 20.2 100 100 49 0Transport 68.8 79.6 20.9 20.4 100 100 40 20Media 44.0 67.9 35.3 35.2 100 100 0 0Construction, tourism and retail
96.1 98.8 9.5 4.9 100 100 66 66
Health care and waste management
83.8 96.0 20.7 12.6 100 100 49 49
Note. The indexes take values from 0 to 100, where 100 denotes the absence of statutory ownership restrictions to FDI, and 0 means that foreign companies are not allowed to own equity in a sector or sector group. Author calculations from World Bank (2010).
87
Measuring improvements in the investment climate
How important are ownership restrictions for FDI decisions?
Policies that favour some firms over others involve a cost. They may result in less competition, distort resource allo-cation, impede linkages between MNEs and local suppliers and slow the diffusion of technological innovations. These effects discourage all investors and give a negative perception about a country’s receptiveness towards investment.
In terms of resource allocation efficiency, a wide dispersion around a low average level of ownership restrictions can be more costly to an economy than low dispersion around a higher average level of restrictiveness. This is why exceptions to non-discrimination, especially in sectors that play a central role in the development of an economy (e.g. financial and telecommunication sectors), need to be periodically re-evaluated to determine whether the original motivation and national benefits behind an exception remain valid and outweigh the costs borne by consumers, suppliers and investors.
No country unequivocally applies national treatment. Laws and regulations and international agreements allow a coun-try to make qualifications. However, it is good practice where exceptions exist and when the scope of national treatment is limited, that any exception be transparent and clearly defined in law. This requires identifying general exceptions (e.g. to maintain public health, the protection of national security); subject specific exceptions (e.g. intellectual property, taxation provisions in bilateral tax treaties); and country-specific exceptions (e.g. specific industries, such as financial services and transport). It is also important to understand the key features of their design (e.g. indefinite duration or for a defined time period).
The openness of sectors to foreign equity ownership is a necessary but not sufficient condition for attracting FDI. Econo-metric analysis that controls for these other influences finds that FDI restrictions have a large negative impact on FDI. Semi-elasticity estimates from Nicoletti et al. (2003) imply that ownership barriers could be depressing FDI stocks by between 10 (easing of nationality requirements on management) and 80 percent (removal of foreign equity restrictions), depending on the restriction considered. They calculate that aligning FDI restrictions on those of the most open OECD country (the United Kingdom according to the indicators presented in the study) would increase the OECD-wide inward FDI position by almost 20 percent relative to baseline. The effects of such reforms on inward FDI stocks for individual countries depend on how restrictive each country was before the policy move. Relatively restrictive countries could in-crease their total inward FDI stock by between 40 and 80 percent, but even in countries that are already relatively open, the gains could amount to around 20 percent of their position.
References Arndt C. and Oman C. (2006). Uses and Abuses of Governance Indicators, OECD Development Centre Studies, Paris.
Devereux M.P. and Griffith R. (2002). “The Impact of Corporate Taxation on the Location of Capital: A Review”, Swedish Economic Policy Review, 9, pp. 79-102.
Groenendijk N. (2009). “EU and OECD benchmarking and peer review compared”, presented at the third EUCE Con-ference The EU in a Comparative Perspective, Halifax, Canada.
Hardin A. and Holmes L. (1997). Service Trade and Foreign Direct Investment, Australian Productivity Commission.
Kalinova B., Palerm A. and Thomsen S. (2010) “OECD’s FDI Restrictiveness Index: 2010 Update”, OECD Working Papers on International Investment, No. 2010/3, OECD Investment Division.
Nicoletti G. et al. (2003). “Policies and International Integration: Influences on Trade and Foreign Direct Investment”, OECD Economics Department Working Papers, No. 359, OECD Publishing.
OECD (1991). Taxing Profits in a Global Economy, Paris.
OECD (2002). Foreign Direct Investment for Development. Maximising Benefits, Minimising Costs, Paris.
UNCTAD (2006). Measuring Restrictions on FDI in Services in Developing Countries and Transition Economies, Geneva.
World Bank (2010). Investing across borders: indicators of foreign direct investment regulation in 87 economies, Washington D.C.
88
I. IntroductionIn recent decades, international connectivity has increased markedly. Meanwhile, the structure of the global economy has shifted, with developing economies now playing a much larger role, global value chains proliferating, particularly in East and South-East Asia, services increasing their shares of output and employment, and international capital flows growing markedly faster than trade, which is itself expanding rapidly. As connectivity expands, and as a contributor to that expansion, foreign direct investment (FDI) is growing and evolving.1 Trade between emerging markets has doubled its share of global trade over the past decade. Global capital flows expanded 25 times between 1980 and 2007 (Dobbs et al. 2015) and developing economies have become important sources of outward foreign direct investment, accounting for about 30% of the total. Investment policy-making has struggled to keep pace.
This economic expansion combined with globalization has not been smooth. In the last two decades, APEC economies have faced the challenges of, among others, the 1995 Mexican peso crisis, the 1997–98 Asian economic crisis, the 1998 Russian financial crisis, the 1999–2001 bursting of the dotcom bubble, the 2008–09 global financial crisis (with still lingering effects), and persistent lethargy in Japan’s economy. Despite these obstacles, to advance development and to strengthen the region’s resilience against future shocks, international investment has continued to grow. By 2013, APEC members’ share of total world (inward) FDI stock 2013 reached 46.5% and of outward stock, 47.4% (UNCTAD database), but was still lower than its 57% share of world GDP and about the same as its 47% of world trade.
In terms of FDI flows the APEC region has also been active. In 2014, among the world’s 20 largest foreign investors were 11 APEC members: Canada; Chile; People’s Republic of China; Hong Kong, China; Japan; Republic of Korea; Malaysia; Russia; Singapore; Chinese Taipei; and the United States. FDI outflows from developing Asia increased by a third over the previous year to roughly US$440 billion. In Latin America, Chilean multinationals alone increased their outward FDI flows by 51% to US$13 billion (UNCTAD 2015).
FDI has expanded to ensure supplies of raw materials, to take advantage of low cost labour for labour intensive man-ufacturing activities, and to access markets otherwise sheltered behind barriers to trade. Of particular note, foreign in-vestment in service sectors has expanded. A study of developing Asia (Kirkegaard 2012, p.20) found that service sectors “receive considerably larger amounts of foreign investment, when compared with Asia’s manufacturing and raw mate-rials meta sectors … Given the traditional prominence of and policymaker interest in FDI into the Asian manufacturing sectors, this is a surprising result.” In part this reflects better recognition of the role of services in global value chains, and growing possibilities for niche, and occasionally major, roles in contributing to the value added in those chains. It also reflects the rebalancing of growing economies as part of the normal structural transformation process in which the bulk of employment and economic output transitions from agriculture through industry (and especially manufacturing) to services.
Recognizing the importance of international investment, nations have liberalized their policies for both domestic and foreign investment. This has occurred in unilateral contexts, bilaterally, regionally, and multilaterally. At the 1996 WTO Ministerial conference in Singapore, investment became one of the Doha Development Round’s “Singapore issues” under negotiation for behind-the-border action, along with trade facilitation, competition policy, and government
1 InthecontextofAPEC’sregionaleconomiccooperation,thischapterfocusesonFDI(internationalportfolioinvestmentisgenerallyperceivedasmorevolatile),whichhasadvantagessuchastransferoftechnology,improvementofmanagerialtech-niques,marketaccess,andconnectionstoglobalvaluechains,andinfrastructureinvestment,includingfinancingaspects(PPPsinparticular),becauseofinfrastructure’simportanceforgrowthanddevelopment.
Chapter 9. Investment policy in APEC: developments and a look forwardBekzod Abdullaev, Research Fellow, The Australian APEC Study Centre at RMIT University
Douglas Brooks, Principal Research Fellow, The Australian APEC Study Centre at RMIT University
Ken Waller, Director, The Australian APEC Study Centre at RMIT University
89
Investment policy in APEC: developments and a look forward
procurement.2 This reflected recognition that economies often penalized themselves by denying their citizens and firms the potential benefits of FDI.
The policy environment for international investment continues to experience change. According to UNCTAD’s moni-toring, at the national level governments have adopted investment policy measures at a rate of about 150 annually over the past decade, plus numerous other measures influencing the business environment for investors. At the international level, new investment agreements have been concluded at a rate of more than one per week for the past few years. At the level of institutional architecture, the set of codes and standards that govern the behaviour of private investors also continues to expand (UNCTAD 2012).
Policy changes have reacted to, and led to, changes in the patterns and players in FDI. Although emerging economies might previously have been more concerned with the ability of domestic firms to survive competition from investments made by foreigners, as their own outward FDI grows they now also consider the security and treatment of their inves-tors’ interests abroad. And although state-owned enterprises account for only about 1 percent of the total number of mul-tinational enterprises, their overseas investments now amount to more than 10 percent of global FDI flows (UNCTAD 2012). Sovereign wealth funds, similarly, have been gaining importance as sources of FDI financing. The patterns and types of investment of these new players (in terms of home and host countries and in terms of investors) are different, and consequently so are their policy priorities.
Industrial policies and industrial development strategies are proliferating in both developed and developing countries.3 These strategies often contain elements of targeted investment promotion or restriction. In the last two decades, great efforts have been made to increase participation in global value chains, as the benefits of such participation have become more apparent, particularly in East Asia. This participation frequently involves only small parts of a production network at a time and the life-cycle of such networks appears to be shortening. Consequently, expectations of governments’ promotion efforts have become higher as those efforts increasingly focus on the sector, motivation, and quality as well as quantity of foreign investment.
In response to the changing production and investment environment, there has been an increasing share of regulatory policies in total investment policy measures. Policies have also become more nuanced as they attempt to simultaneously further liberalise investment regimes and promote foreign investment on the one hand, and to regulate investment for quality control in pursuit of public policy objectives on the other. Increasingly, developing countries have been seeking foreign investment to meet their growing demand for infrastructure services.
Infrastructure investment and its financing
Fostering a business friendly environment for infrastructure investment (and financing) through a regulatory framework both benefits from, and assists with, international connectivity when it minimizes uncertainty while maximizing trans-parency and predictability. Infrastructure, including transportation, water and sanitation, power, telecommunications and irrigation, accounts for one-third to one-half of public investment (3–6 percent of GDP). Not surprisingly, infra-structure capital has a positive and significant effect on economic output and growth.
Developing countries in particular face a current imbalance between supply and demand for infrastructure, with con-tinued rapid growth in demand expected in the future. Yet, by altering the productivity of initial resource endowments, physical infrastructure can change a nation’s comparative advantage in international trade, thereby converting con-straints into opportunities. At the same time, the relative advantages of different types of infrastructure investment change as infrastructure alters relative productivity of factor endowments and hence comparative advantage, and as demand changes in different stages of development (Brooks and Go 2013).
An especially important role for infrastructure investment is in lowering an economy’s trade costs to reap the gains from trade and facilitate greater participation in international production networks (Brooks and Hummels 2010). Computable general equilibrium analysis indicates that even a modest reduction in APEC trade costs through investment in trade related infrastructure such as transport, power, or communications can yield significant gains (Brooks and Stone 2010). Gross domestic product in the region grows and countries’ trading patterns diversify. The PRC was found to gain the most in absolute terms, given the initial size of trade activity. However, as a percentage of GDP, Viet Nam (where trade time costs were among the highest) was the biggest winner. Of particular policy relevance is that the results vary considerably across bilateral trade routes and commodity categories, suggesting the need for carefully considered, and
2 AstheDoharoundofnegotiationsranintoprotracteddifficulties,ofthefourSingaporeissuesonlytradefacilitationsuc-ceeded in reaching consensus, culminating in the Trade Facilitation Agreement at the December 2013 Bali Ministerial Conference. 3 Modernindustrialpolicieshavelittletodowiththepastpracticeof“pickingwinners”todevelop“nationalchampions”.See,forexample,Rodrik(2004).
90
Current Issues in Asia Pacific Foreign Direct Investment
nuanced, policy analyses. More complete data on sectoral FDI allocations could also help raise policy relevance and impact.
The diversity of APEC economies, combined with lowering of trade costs, has helped the region to capitalize on global patterns of production fragmentation and expanding intraregional trade and development opportunities. The impacts of new investments in trade-related infrastructure are now being leveraged by coordination across borders in a wide array of trade facilitating institutional and trade architectures, such as one-stop customs clearance with computerized filing. In this continually evolving international context, the role of harmonising and strengthening soft infrastructure stands out as an essential complement to enhanced physical infrastructure. ICT is an increasingly productive aspect of infrastructure in raising competitiveness and efficiency. As smaller shipments of a wider variety of higher-value-added products proliferate (Hummels 2007), the demand for ICT services rises. The same is true as the growth of trade in services outpaces that in manufactures and emphasises different modes of delivery.
One of the biggest challenges in infrastructure investment is managing its financing, given the typically large amounts, long time horizons, lumpy nature, and public goods aspects involved. While it is often viewed as a job for the public sector, the vast sums involved are beyond the reach of all but the wealthiest governments. Consequently, opportunities for, and examples of, public–private and foreign–domestic partnerships have been increasing throughout the region.
The public sector in countries receiving infrastructure investment can encourage private sector participation (including foreign investment) by clarifying and enforcing rules and regulations, participating in the development of local capital and local currency markets, simplifying approval procedures, allocating risk where it has a comparative advantage, and ensuring that tariffs are reasonable. In addition, governments must address cross-border issues. They can, for example, facilitate customs clearance and use of foreign experts and workers.
Successful private financing depends on government flexibility and understanding of the requirements of business (need for return on investment and other relevant financial ratios). It also depends on the creativity of private investors in assessing and ensuring the bankability of proposed projects and accessing alternative sources of financing. Over the longer term, technological developments influence the provision of privately financed infrastructure. While technolog-ical advances and policy reforms increase the potential for privatisation of previously public infrastructure to improve efficiency, the process requires a supportive legal, policy, and regulatory environment.
Emerging opportunities for private investment in Asian infrastructure can be fostered by both the public and private sectors. Private foreign investors can bring financing and technical know-how to help develop local capital markets. This is one area where APEC can demonstrate its strength through diversity. Private foreign investors can also find do-mestic partners to help in understanding and navigating local regulations and procedures, accessing local financing, and raising local public support. Domestic private investors can look beyond their borders to foreign financial institutions and international infrastructure funds for new sources and mechanisms of financing, and for information on what might make a proposed project more attractive to foreign (and domestic) investors.
A key element in financing infrastructure is risk, both commercial and sovereign. Risk allocation and mitigation then becomes an important aspect of negotiations between governments and private investors, especially foreign private in-vestors. Large foreign investors may have advantages in pooling risk across a diversified portfolio in different countries, access to export credits, and access to non-recourse loans in developed country markets. The underdeveloped financial markets in most developing countries, and especially the limited availability of debt instruments with a term structure sufficiently long to match the extended payback period of most infrastructure projects, is one of the main constraints to infrastructure development in most recipient economies.
In recent years, a number of Asian investment funds have been created to mobilise international capital, particularly from institutional investors in industrialised countries, to help finance Asia’s infrastructure needs. The Asian Infrastruc-ture Fund was the first infrastructure investment fund in the region. Since then, infrastructure investment funds have been growing more rapidly than proposed projects found to be worthy of their investments.
II. APEC investment policy developmentsOpening the opportunities for increased investment flows, domestic and foreign, in APEC was a major objective established in the Bogor goals of 1994. The broader dynamics of global and major regional economic and financial developments and measures impacting on trade and investment globally and regionally have been influential in shaping APEC’s approaches to investment since the Bogor Declaration.
91
Investment policy in APEC: developments and a look forward
As a non-negotiating group, APEC’s work is primarily focused on defining policies, processes and best practices, which member economies may adapt in pursuit of the Bogor objectives, individually through domestic structural reforms and collectively through voluntary and non-binding arrangements. Such approaches constitute a main body of the work of relevant forums within APEC and may be adopted by member economies on a voluntary basis or through engagement in regional and global multilateral negotiations.
The constraining influence on investment flows of slowing economic growth, financial crises, and the stagnation of the WTO Doha Round is likely to have been partially offset by the emergence of many bilateral trade and investment agreements. The completion of the “ASEAN plus” agreements and negotiations on major regional agreements, such as the TPP, RCEP, and FTAAP, should impact favourably in the sense of giving impetus to more open investment flows.
Importantly, some members of APEC have implemented unilateral measures to enhance investment flows, and togeth-er with the proliferation of bilateral agreements this is almost certain to have increased investment opportunities for businesses in the economies party to those agreements, but not necessarily to other members of APEC. Whether any favourable terms of bilateral agreements can be transposed to broader regional agreements and provide consequential benefits to more members of those agreements (and other APEC members) will be relevant when assessing the eco-nomic benefits of any successfully concluded regional trade and investment agreements. Certainly, there is a sense in the APEC community that in negotiating broader regional (and bilateral) agreements, participating parties should seek measures that will encourage cross-border investment flows.
So, noting the opportunities and constraints just mentioned, member economies within APEC continue to review ways to maintain the momentum toward achieving the investment goals of Bogor. The results of various efforts have been useful in highlighting policy changes that economies could take to encourage investment flows. They have not resulted in major unilateral actions in recent years although partial progress on removing some barriers to investment has been noted. Nor have they contributed to concerted multilateral action by APEC member economies acting as a bloc in the negotiation of regional agreements or the WTO Doha Round. But they nonetheless contribute to thoughtful and con-structive pathways that economies can take should they choose to further liberalise investment flows.
Measures so considered by APEC, because of the nature of investment regimes, are often both general (broad princi-ples such as MFN and national treatment) and sector specific in nature. The momentum to the reform of regimes is supported by the activities of international bodies such as the World Bank, the OECD, the ADB, UNCTAD and by the APEC and ASEAN Secretariats. The advocacy for use of quantitative indicators by some of these organisations is par-ticularly important in highlighting restrictive elements of regimes in the region and in providing insights into the cost of restrictions and especially to pathways to remove them.
Most recent APEC actions include focusing on investment regimes that impede regional economic growth objectives. Specifically, they include a focus on wide ranging restrictions impacting on services, on infrastructure financing, on the development of small and medium enterprises and measures which constrain investment in sectors relevant to connec-tivity between regional markets and the integration of regional sector markets. Some of the work under these headings is discussed below. Some is by the APEC Investment Experts’ Group (IEG) and its reporting body, the Committee for Trade and Investment. It is strongly supported by the APEC Business Advisory Council (ABAC) and by various capacity-building initiatives undertaken by bodies in the APEC family, such as the Australian APEC Study Centre at RMIT University.
A key part of the work of IEG is advocacy of the eight major principles of the APEC Investment Facilitation Action Plan (IFAP, now in its second iteration and currently under consideration for a third iteration). The principles have general application in what constitutes a welcoming investment environment for foreign investors. They include transparency in the formulation of investment policy and decision-making, security and protection of investment, consistency in the application of rules and processes, efficiency and effectiveness of investment procedures, and inclusiveness and cooper-ation with industry in consultative mechanisms to support a vibrant investment climate. Some of these principles are at the heart of work on investment in the OECD and World Bank, and the WTO General Agreement on Services (GATS).
However, assessment of economies’ actions to implement the principles (through reviews of individual APEC econ-omies’ Action Plans) undertaken by the APEC Policy Support Unit4 concludes that APEC should further deepen and expand implementation of IFAP by taking into account stakeholders’ inputs and using available quantitative and quali-tative evidence, and that economies should be more active in facilitating the process of technology transfer and strength-ening the linkages to domestic enterprises of existing and potential FDI. In short, greater commitment to implement APEC’s investment principles is needed.
4 ReportofMarch2015offiveeconomies–BruneiDarussalem,Canada,Mexico,NewZealandandPapuaNewGuinea.

92
Current Issues in Asia Pacific Foreign Direct Investment
Perhaps the value of APEC’s work in promoting investment is best reflected in bilateral agreements (on trade and investment) between member economies, particularly where those agreements reflect the key principles of the WTO and the GATS. As suggested earlier, if major regional agreements are successfully negotiated, the real value of the work undertaken by various APEC forums will bear rich fruit. That is the promise and the value of comprehensive and meaningful regional agreements. Similar but more limited benefits would occur through bilateral agreements which are comprehensive and which give effect to positive regulatory and structural reforms. The apparent reality is that economies will make commitments to undertake reforms when other parties indicate a preparedness to do the same in a negotiated agreement.
The IEG and other APEC groupings are focusing not just on general approaches to investment policy but also on ways to enhance investment performance in specific sectors and through sector-tailored approaches. These include, for ex-ample, proposals to promote the role of specialist public–private partnership (PPP) agencies to increase investment and to mobilise private sector expertise, technology and finance into physical and social infrastructure. Significant changes are occurring, partly at least, as a consequence of these measures. Specialist agencies to undertake this work have been created in the Philippines, Indonesia, China, Viet Nam, Malaysia, Mexico, Thailand and other member economies. Some are particularly effective in generating a list of bankable projects and are attracting foreign and domestic private investment. Similar specialist agencies have been formed in developed economies of the region, including Australia and Canada.
APEC forums, including the APEC Business Advisory Council (ABAC) and the Asia Pacific Financial Forum (APFF) promote ideas on critical issues relating to PPPs. These include, for example, financial risk sharing between private in-vestors and public agencies, documentation and procedures to enhance partnerships between public and private entities, the management of assets over the life-cycle of projects, mobilising finance through capital markets, including bond markets, investments by pension and sovereign wealth funds, through the various mechanisms needed in the provision of viability gap funding, and through the possible roles of multilateral development banks. In addressing these topics, APEC forums contribute in significant measure to creating an environment conducive to infrastructure investment in the region.
The APFF is developing views and recommendations to address restrictive policies and processes inhibiting the de-velopment of capital markets and regulatory coordination in the region as well as policies aimed at promoting market integration. The adoption of recommendations arising from the APFF will inevitably relate to cross-border investment in financial services.
ABAC has established the Asia Pacific Infrastructure Partnership (APIP), comprising over 90 experts from private sector groups involved in all aspects of infrastructure, representatives of multilateral development banks and academia who meet with ministers and senior advisors responsible for infrastructure programing and financing in individual econ-omies. These meetings, serving as dialogues, provide a frank and open exchange of views between APIP panel members and ministers on the planning, implementation and financing of infrastructure investment.
With funding support from the Australian government, APEC is implementing a number of capacity building initia-tives aimed at promoting trade and investment in specific service sectors. Regional symposia have been convened for financial services, education, transport and logistics, telecommunications and IT. Others are planned for mining and energy services. The programs are designed to identify how market access and investment are regulated, the impact of regulations on the development of relevant sectors, and reform priorities. In addition, APEC has established the Ser-vices Trade Access Requirements (STAR) Database, which is a business-friendly website covering eight service sectors across all 21 APEC economies.
III. The Regional Investment Analytical Group and its objectivesA September 2013 dialogue in Beijing on the regional investment environment affirmed that regional economies need increased investment flows to sustain higher rates of economic growth, and that APEC economies do not at present attract more FDI than non-APEC economies. While APEC economies have become more open over the last two decades, policy differences remain across countries and no economy unequivocally applies national treatment to foreign investment.
Quantitative indicators are widely agreed to be useful in measuring the performance of investment policies in attracting FDI, but they remain controversial due to lack of ownership amongst regional economies. To improve members’ under-standing of this widespread and important phenomenon and its nuances, at the initiative of the APEC Business Advisory Council a Regional Investment Analytical Group (RIAG) was formed. Its aim is to encourage the use and advance
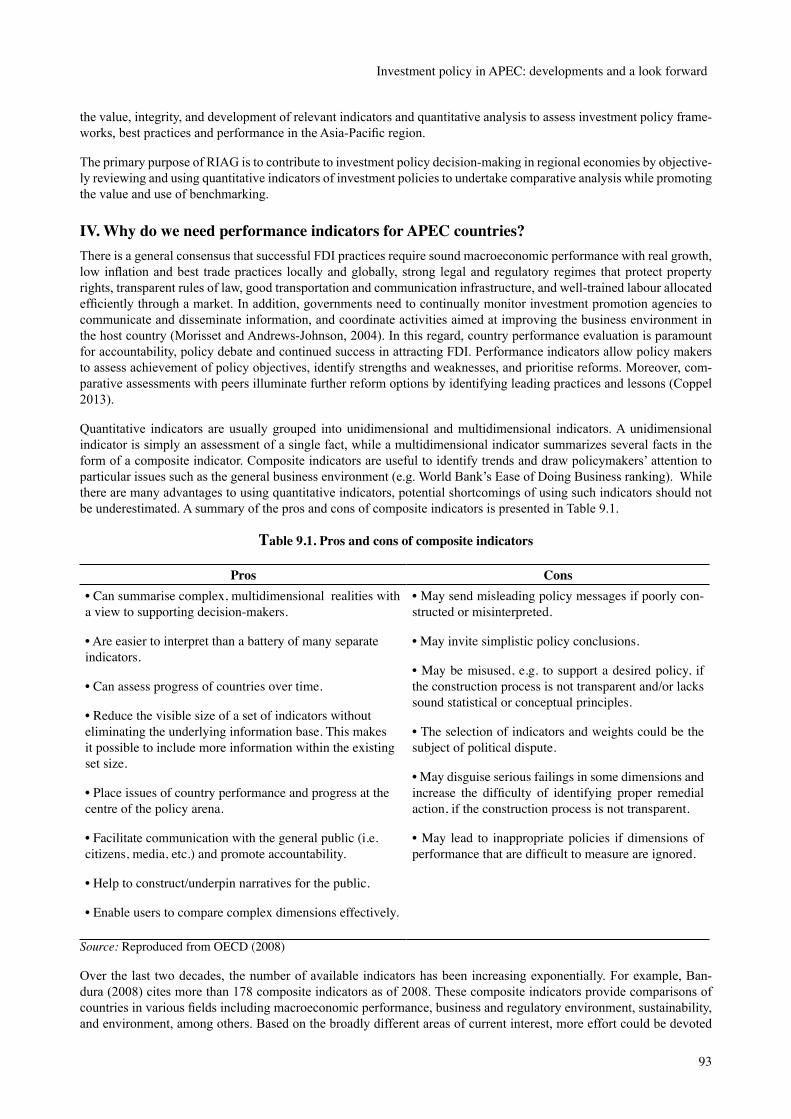
93
Investment policy in APEC: developments and a look forward
the value, integrity, and development of relevant indicators and quantitative analysis to assess investment policy frame-works, best practices and performance in the Asia-Pacific region.
The primary purpose of RIAG is to contribute to investment policy decision-making in regional economies by objective-ly reviewing and using quantitative indicators of investment policies to undertake comparative analysis while promoting the value and use of benchmarking.
IV. Why do we need performance indicators for APEC countries?There is a general consensus that successful FDI practices require sound macroeconomic performance with real growth, low inflation and best trade practices locally and globally, strong legal and regulatory regimes that protect property rights, transparent rules of law, good transportation and communication infrastructure, and well-trained labour allocated efficiently through a market. In addition, governments need to continually monitor investment promotion agencies to communicate and disseminate information, and coordinate activities aimed at improving the business environment in the host country (Morisset and Andrews-Johnson, 2004). In this regard, country performance evaluation is paramount for accountability, policy debate and continued success in attracting FDI. Performance indicators allow policy makers to assess achievement of policy objectives, identify strengths and weaknesses, and prioritise reforms. Moreover, com-parative assessments with peers illuminate further reform options by identifying leading practices and lessons (Coppel 2013).
Quantitative indicators are usually grouped into unidimensional and multidimensional indicators. A unidimensional indicator is simply an assessment of a single fact, while a multidimensional indicator summarizes several facts in the form of a composite indicator. Composite indicators are useful to identify trends and draw policymakers’ attention to particular issues such as the general business environment (e.g. World Bank’s Ease of Doing Business ranking). While there are many advantages to using quantitative indicators, potential shortcomings of using such indicators should not be underestimated. A summary of the pros and cons of composite indicators is presented in Table 9.1.
Table 9.1. Pros and cons of composite indicators
Pros Cons• Can summarise complex, multidimensional realities with aviewtosupportingdecision-makers.
• Are easier to interpret than a battery of many separate indicators.
• Can assess progress of countries over time.
•Reducethevisiblesizeofasetofindicatorswithouteliminatingtheunderlyinginformationbase.Thismakesit possible to include more information within the existing setsize.
• Place issues of country performance and progress at the centre of the policy arena.
•Facilitatecommunicationwiththegeneralpublic(i.e.citizens,media,etc.)andpromoteaccountability.
•Helptoconstruct/underpinnarrativesforthepublic.
• Enable users to compare complex dimensions effectively.
• May send misleading policy messages if poorly con-structed or misinterpreted.
• May invite simplistic policy conclusions.
• May be misused, e.g. to support a desired policy, if theconstructionprocessisnottransparentand/orlackssound statistical or conceptual principles.
• The selection of indicators and weights could be the subject of political dispute.
• May disguise serious failings in some dimensions and increase the difficulty of identifying proper remedialaction, if the construction process is not transparent.
• May lead to inappropriate policies if dimensions of performancethataredifficulttomeasureareignored.
Source:ReproducedfromOECD(2008)
Over the last two decades, the number of available indicators has been increasing exponentially. For example, Ban-dura (2008) cites more than 178 composite indicators as of 2008. These composite indicators provide comparisons of countries in various fields including macroeconomic performance, business and regulatory environment, sustainability, and environment, among others. Based on the broadly different areas of current interest, more effort could be devoted

94
Current Issues in Asia Pacific Foreign Direct Investment
to evaluation of the available indicators and assessing their contributions to prescription of best policy practices. This approach has been adopted here as a contribution to the work of RIAG, which will also refrain from ranking economies and be transparent and policy relevant. Following is an outline of one approach for evaluating a quantitative dimension of FDI performance in APEC countries.
V. Rating countries’ FDI performanceThe FDI inflow performance indicator follows UNCTAD’s Inward and Outward FDI Performance Index. Firstly, each APEC economy’s share of global FDI inflow and relative share in global GDP is calculated. If the country’s FDI share matches its GDP share then the flow value is equal to one. A value greater than one indicates a larger share of FDI rel-ative to GDP, a value less than one indicates a smaller share of FDI relative to GDP. A negative value means foreign investors disinvested in that period. The values have no upper or lower limits. A similar approach has been used by The Conference Board of Canada (2015) to rate 16 developed countries including Canada.
The FDI performance for 2013 is presented in Figure 9.1. The economies with higher proportional FDI inflows at that time were Chile, Brunei, Viet Nam, and Peru, followed by Malaysia. Japan, PNG, New Zealand, Chinese Taipei and Korea showed significantly less proportionate FDI inflows.
The values are then normalised to render them comparable. Hong Kong and Singapore were excluded as their shares of FDI (and trade) are much higher than other APEC economies and their extreme values may influence subsequent steps in the process of rating countries. Accordingly, the highest ratings are assigned for Hong Kong and Singapore without including them in the calculations.
Figure 9.1. 2013 FDI inflow performance in APEC economies
Source:Author’scalculationsbasedonWDIdatabase.
Normalisation follows the OECD Handbook on Constructing Composite Indicators (2008)5 according to the formula
(1)
Each FDI inflow indicator for a generic country c and time t is transformed according to formula (1), where minc
5 Normalisationcanalsobeperformedusingstandardisation(z-scores),distancetoreference,aboveorbelowmeantechniques.

95
Investment policy in APEC: developments and a look forward
(xt ) and maxc (xt) are the minimum and the maximum values of FDI ( ) across all countries c at time t. In this way,
the normalised indicators have values lying between 0 and 100. Using this formula results in a data series where the best-performing country has a score of 100 and the worst performing country has a score of zero.
Each economy is then allocated to one of four quartiles, based on its score. An economy receives a rating of “A” on a given indicator if its score is in the top quartile, a “B” if its score is in the second quartile, a “C” if its score is in the third quartile, and a “D” if its score is in the bottom quartile. An example of the resulting ratings is given in Figure 9.26.
Figure 9.2. Rating example by quartiles
The results of normalisation and rating of economies by FDI performance7 is given in Table 9.2. Since 1989, Australia’s rating ranged from level ‘B’ to ‘C’, and then scored ‘A’ from 2006 until 2012 followed by ‘B’ level in 2013. Japan and Chinese Taipei are consistently rated ‘D’. New Zealand’s performance has been falling, scoring ‘D’ in 2013. Improve-ments in inward FDI were observed in Malaysia, Mexico and Philippines.
Table 9.2. Rating of FDI inflow in APEC economies during 1989–2013 1989–1995 1996–2000 2001–2005 2006–2010 2011 2012 2013AUSTRALIA B C B A A A BBRUNEIDARUSSALAM C A A B A A ACANADA C B B A B B BCHILE B A A A A A ACHINA A A A C C C CINDONESIA C D D C B B CJAPAN D D D D D D DKOREA D D C D D D DMALAYSIA A A B B B B AMEXICO C C B B C C BNEWZEALAND A B C C B C DPAPUANEWGUINEA A B C C D D DPERU B B B A A A APHILIPPINES B C D D D C CRUSSIA D D C B B B BCHINESETAIPEI D D D D D D DTHAILAND B B A B C B BUNITEDSTATES D C D D C D CVIETNAM A A A A A A AHONGKONG A A A A A A ASINGAPORE A A A A A A A
Source:Author’scalculationsbasedonWDIdatabase.
6 Quartiles in Figure 9.2 are for expositional purposes only and do not represent real data values.7 For policy evaluations, evaluating the trend rather than single year performance may be preferable.
96
Current Issues in Asia Pacific Foreign Direct Investment
There are likely to be a range of policies that economies should consider as consequence of these indicators, assuming higher levels of investment policy are seen as generally favourable.
A brief summary for consideration by economies falling within the indicator categories is:
A) Consider measures leading to a more open investment strategy
B) Consider measures to remove existing restrictions to investment and promote more open investment policies
C ) Re-evaluate key investment strategies and aim to remove restrictions to investment; and
D) Consider existing policy framework as inadequate, review with a view to implementing best practices and align with IFAP principles.
More detailed country case studies should be undertaken to incorporate other dimensions of FDI performance before enacting policy changes.
VI. Remaining challenges and future needsThe remaining big challenges for investment policy in the APEC region are (1) to keep attracting private sector invest-ment where the social benefits such as, for example, jobs creation, economic linkages, growth of the SME sector, etc., exceed private benefits; (2) maintaining and extending clear and harmonised standards and regulations for the provi-sion of services; (3) cooperating internationally where investments take place across borders either in their origin and financing, or in their resulting output of services; (4) increasing the transparency of dispute resolution mechanisms; and (5) enabling greater efficiency and participation in global value chains, including in niches appropriate for developing APEC economies. Once physical infrastructure has been built, developing complementary soft or ICT infrastructure and enhancing trade facilitation at the border may be more important for trade than further investments in physical infra-structure. For example, once a two-lane highway has been built, streamlining customs procedures may boost trade more that widening the highway to four lanes. Cross-border cooperation in building and maintaining soft infrastructure can therefore lead to a reduction in trade costs and stimulate further investment in physical infrastructure, trade, production, and employment, and growth, facilitating further trade expansion, in a virtuous cycle.
Twenty-first century or “new generation” investment policies place inclusive growth or sustainable development at the heart of efforts to attract and benefit from investment, typically through inclusion of labour or environmental standards, and protection of intellectual property rights, or through improved dispute resolution mechanisms. At the international level, cooperation through preferential trade and investment agreements that strengthen structural reforms and increase the attractiveness of a location for foreign direct investment can leverage domestic policy actions and their impacts on growth, equity, and efficiency, and may help to reduce corruption.
APEC efforts will continue to address these challenges. As one example, looking into the future, RIAG is considering developing a more nuanced approach with performance ratings for sectoral FDI and best practices of Investment Promotion Agencies for all APEC economies subject to availability of the data. Case studies of investments in indi-vidual APEC members may also be undertaken to help derive favourable policy practices. Investment in APEC will continue to evolve, and the region’s policy analysis and insights will continue to grow commensurately.
ReferencesBandura R. (2008). “A Survey of Composite Indices Measuring Country Performance: 2008 Update”, United Nations Development Programme – Office of Development Studies, available at http://web.undp.org/developmentstudies/docs/indices_2008_bandura.pdf.
Brooks, D.H. and Go E.C. (2013). “Infrastructure’s Role in Sustaining Asia’s Growth,” in Asia Rising: Growth and Resilience in an Uncertain Global Economy, H. Hill and M.S. Gochoco-Bautista (eds), Cheltenham UK: Edward Elgar Publishing, pp. 108-156.
Brooks D.H. and Hummels D. (eds.) (2009). Infrastructure’s Role in Lowering Asia’s Trade Costs: Building for Trade. Cheltenham, UK: Edward Elgar Publishing.
Brooks, D.H. and Stone S.F. (2010). “Infrastructure and Trade Facilitation in Asian APEC”, Asian Development Review 27(1):135-159.
Conference Board of Canada (2015). “How Canada performs”, http://www.conferenceboard.ca/hcp/details/economy/outward-fdi-performance.aspx, accessed on 4 May, 2015.
97
Investment policy in APEC: developments and a look forward
Coppel J. (2013) “The use and abuse of indicators on foreign ownership restrictions and taxation to assess the invest-ment climate” Seminar and Policy Dialogue on Enhancing the Investment Environment in APEC and ASEAN econo-mies, 16-18 September 2013.
Dobbs R., Manyika J. and Woetzel J. (2015). No Ordinary Disruption, McKinsey Global Institute.
Fortanier F. (2007). Foreign direct investment and host country economic growth: Does the investor’s country of origin play a role?. Transnational Corporations, 16(2), 41-76.
Hummels D. (2007). “Transportation costs and international trade in the second era of globalization,” Journal of Eco-nomic Perspectives, 21, 131-54.
Kirkegaard, J.F. (2012). “Transactions: A New Look at Service Sector Foreign Direct Investment in Asia,” ADB Eco-nomics Working Paper No. 318, Manila: Asian Development Bank.
Mencinger J. (2003). “Does foreign direct investment always enhance economic growth?”, Kyklos, 56(4), 491-508
Morisset J. and Andrews-Johnson K. (2004). The Effectiveness of Promotion Agencies at Attracting Foreign Direct Investment. Washington: The International Bank for Reconstruction and Development/The World Bank.
OECD (2008). Handbook on Constructing Composite Indicators: Methodology and User Guide, OECD Publications, France Rodrik, Dani, Industrial Policy for the Twenty-First Century (November 2004). CEPR Discussion Paper No. 4767. Available at SSRN: http://ssrn.com/abstract=666808.
United Nations Conference on Trade and Development (UNCTAD) (2015). Global Investment Trends Monitor No. 19, UNCTAD: Geneva.
United Nations Conference on Trade and Development (UNCTAD) (2012). World Investment Report 2012, UNCTAD: Geneva.