Embed Size (px)
Citation preview

Pacific Disaster CenterArea Brief: GeneralExecutive Summary
HONOLULU
14:46:5901 May 2017
WASH.D.C.
20:46:5901 May 2017
ZULU
00:46:5902 May 2017
NAIROBI
03:46:5902 May 2017
BANGKOK
07:46:5902 May 2017
SYDNEY
10:46:5902 May 2017
Region Selected » Lower Left Latitude/Longitude: 39.5903 N˚ , -78.2377 E˚Upper Right Latitude/Longitude: 45.5903 N˚ , -72.2377 E˚
Current Hazards:
Active Tornado
Event Severity Date (UTC) Name Lat/Long
02-May-2017 00:21:35 Tornado - Binghamton, NY WFO Region, US 42.59° N / 75.24° W
01-May-2017 18:19:45 Tornado - Binghamton, NY WFO Region, US 42.26° N / 75.91° W
01-May-2017 18:16:45 Tornado - Buffalo, NY WFO Region, US 43.63° N / 75.93° W
01-May-2017 18:16:40 Tornado - State College, PA WFO Region, US 40.89° N / 77.5° W
Source: PDC
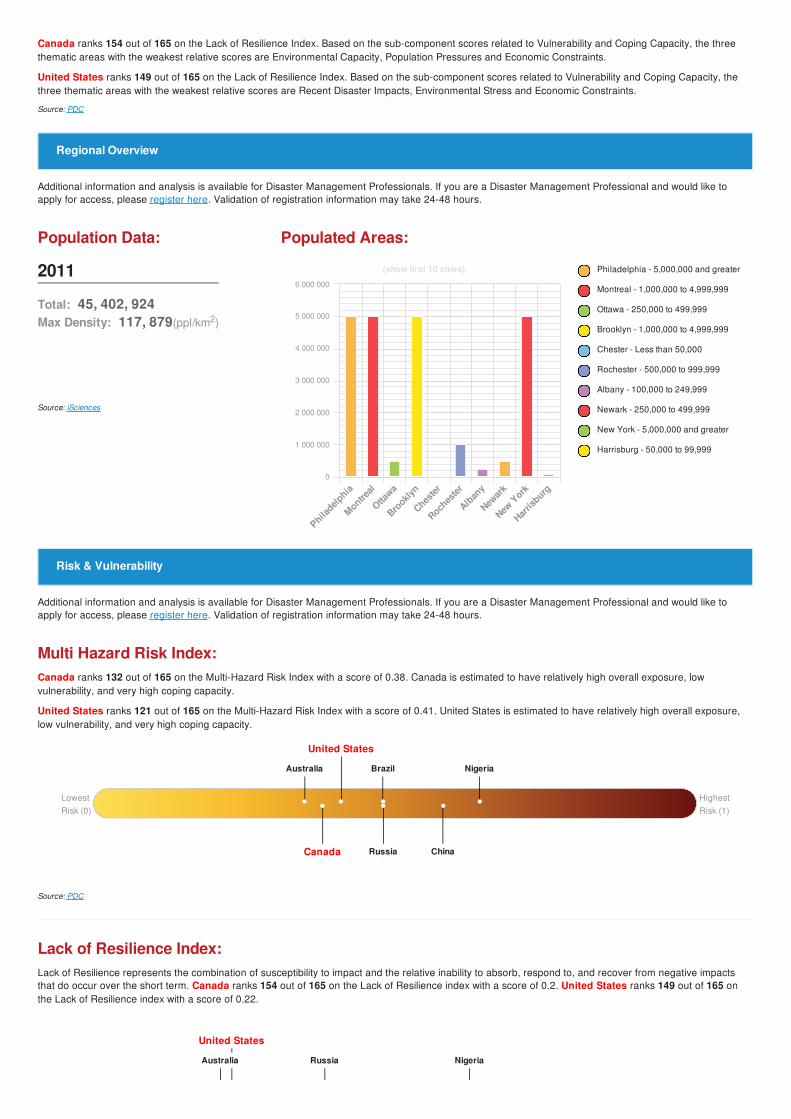
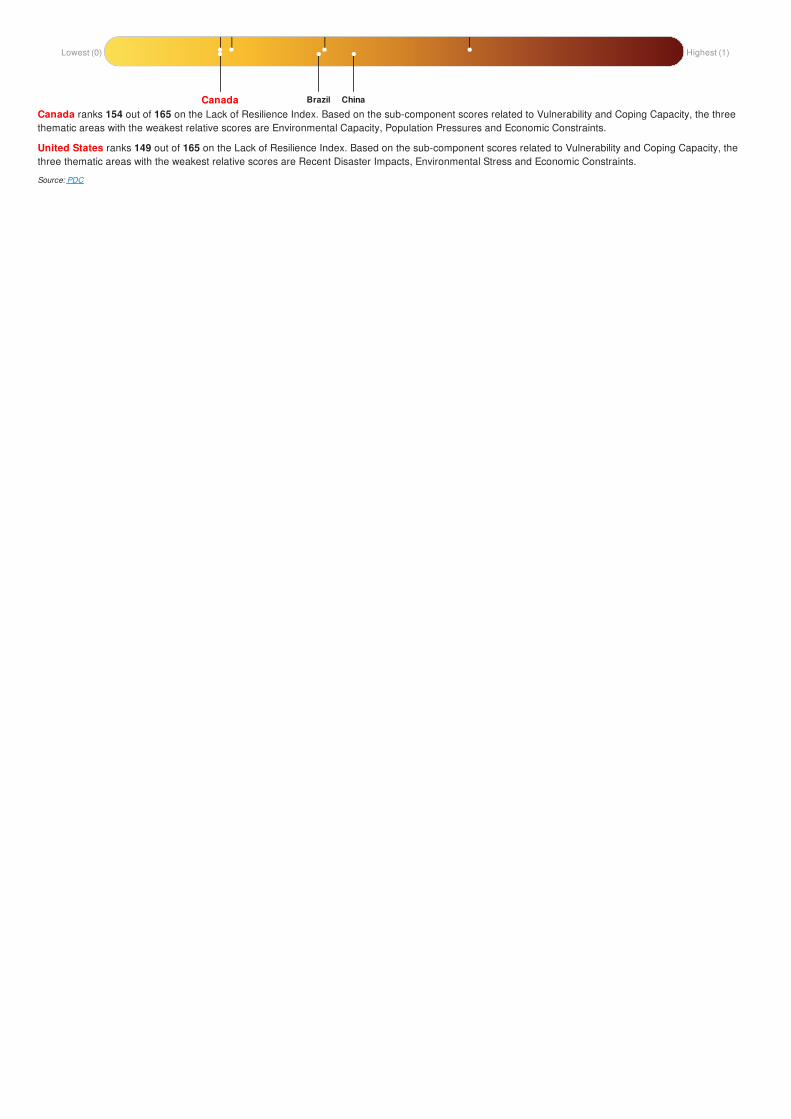
Lack of Resilience Index:Lack of Resilience represents the combination of susceptibility to impact and the relative inability to absorb, respond to, and recover from negative impactsthat do occur over the short term. Canada ranks 154 out of 165 on the Lack of Resilience index with a score of 0.2. United States ranks 149 out of 165 onthe Lack of Resilience index with a score of 0.22.
170,000
Legend
Population Density (person/sqkm)
0
Additional information and analysis is available for Disaster Management Professionals. If you are a Disaster Management Professional and would like toapply for access, please register here. Validation of registration information may take 24-48 hours.
Tornado - State College, PA...Location: Pennsylvania, United StatesSeverity Level: Watch
Tornado - Buffalo, NY WFO...Location: New York, United StatesSeverity Level: Watch
Situational Awareness
Lowest (0) Highest (1)
Canada Brazil China
United States
Australia Russia Nigeria
Canada ranks 154 out of 165 on the Lack of Resilience Index. Based on the sub-component scores related to Vulnerability and Coping Capacity, the threethematic areas with the weakest relative scores are Environmental Capacity, Population Pressures and Economic Constraints.
United States ranks 149 out of 165 on the Lack of Resilience Index. Based on the sub-component scores related to Vulnerability and Coping Capacity, thethree thematic areas with the weakest relative scores are Recent Disaster Impacts, Environmental Stress and Economic Constraints.
Source: PDC
Population Data:
2011
Total: 45, 402, 924Max Density: 117, 879(ppl/km2)
Source: iSciences
Philadelphia - 5,000,000 and greater
Montreal - 1,000,000 to 4,999,999
Ottawa - 250,000 to 499,999
Brooklyn - 1,000,000 to 4,999,999
Chester - Less than 50,000
Rochester - 500,000 to 999,999
Albany - 100,000 to 249,999
Newark - 250,000 to 499,999
New York - 5,000,000 and greater
Harrisburg - 50,000 to 99,999
Populated Areas:
Multi Hazard Risk Index:Canada ranks 132 out of 165 on the Multi-Hazard Risk Index with a score of 0.38. Canada is estimated to have relatively high overall exposure, lowvulnerability, and very high coping capacity.
United States ranks 121 out of 165 on the Multi-Hazard Risk Index with a score of 0.41. United States is estimated to have relatively high overall exposure,low vulnerability, and very high coping capacity.
Source: PDC
Lack of Resilience Index:Lack of Resilience represents the combination of susceptibility to impact and the relative inability to absorb, respond to, and recover from negative impactsthat do occur over the short term. Canada ranks 154 out of 165 on the Lack of Resilience index with a score of 0.2. United States ranks 149 out of 165 onthe Lack of Resilience index with a score of 0.22.
Additional information and analysis is available for Disaster Management Professionals. If you are a Disaster Management Professional and would like toapply for access, please register here. Validation of registration information may take 24-48 hours.
Additional information and analysis is available for Disaster Management Professionals. If you are a Disaster Management Professional and would like toapply for access, please register here. Validation of registration information may take 24-48 hours.
Regional Overview
(show first 10 cities)
Philadelp
hia
Montreal
Ottawa
Brookly
n
Chester
Roches
ter
Alban
y
Newar
k
New Y
ork
Harris
burg0
1 000 000
2 000 000
3 000 000
4 000 000
5 000 000
6 000 000
Risk & Vulnerability
LowestRisk (0)
HighestRisk (1)
Canada ChinaRussia
United States
United States
Australia Brazil Nigeria
Australia Russia Nigeria
Canada ranks 154 out of 165 on the Lack of Resilience Index. Based on the sub-component scores related to Vulnerability and Coping Capacity, the threethematic areas with the weakest relative scores are Environmental Capacity, Population Pressures and Economic Constraints.
United States ranks 149 out of 165 on the Lack of Resilience Index. Based on the sub-component scores related to Vulnerability and Coping Capacity, thethree thematic areas with the weakest relative scores are Recent Disaster Impacts, Environmental Stress and Economic Constraints.
Source: PDC
Lowest (0) Highest (1)
Canada Brazil China

Historical Hazards:
Earthquakes:
5 Largest Earthquakes (Resulting in significant damage or deaths)
Event Date (UTC) Magnitude Depth (Km) Location Lat/Long
05-Sep-1944 00:04:00 5.60 12 NEW YORK: MASSENA 44.96° N / 74.72° W
10-Aug-1884 00:19:00 5.50 -NEW YORK: ROCKAWAY BEACH,
NEAR NEW YORK CITY40.6° N / 73.75° W
20-Apr-2002 00:10:00 5.20 11NEW YORK: CLINTON, ESSEX, AU
SABLE FORKS44.51° N / 73.7° W
11-Nov-1840 00:00:00 5.20 - PENNSYLVANIA: PHILADELPHIA 39.8° N / 75.2° W
16-Jan-1994 00:01:00 4.60 5PENNSYLVANIA: READING, FELT TO
CANADA40.33° N / 76.04° W
Source: Earthquakes
Tsunami Runups:
5 Largest Tsunami Runups
Event Date (UTC) Country Runup (m) Deaths Location Lat/Long
10-Nov-1932 00:00:00 USA 5.4 - WILLETTS POINT, NEW YORK 40.68° N / 73.28° W
08-Aug-1924 00:00:00 USA 4.6 - CONEY ISLAND, NY 40.57° N / 73.98° W
Additional information and analysis is available for Disaster Management Professionals. If you are a Disaster Management Professional and would like toapply for access, please register here. Validation of registration information may take 24-48 hours.
Historical Hazards
Dec 19 1998Tropical Cyclone
Atlantic
Nov 30 1978Tropical CycloneAtlantic
Dec 25 1988Tropical CycloneAtlantic
Jan 16 1994EarthquakesPENNSYLVANIA:READING,FELT TOCANADA
Oct 06 1995Tropical CycloneAtlantic
Apr 20 2002EarthquakesNEW YORK:CLINTON,ESSEX,AUSABLE FORKS
1965 1970 1975 1980 1985 1990 1995 2000 2005 2010 2015 2020

21-Dec-1884 00:00:00 USA 2.4 - NEW HAVEN HARBOR, CT 41.27° N / 72.92° W
10-Aug-1884 00:00:00 USA 1.8 - GLOUCESTER CITY, NJ 39.88° N / 75.12° W
04-Oct-1755 00:00:00 USA 1.52 - LAKE ONTARIO, NY 43.5° N / 78° W
Event Date (UTC) Country Runup (m) Deaths Location Lat/Long
Source: Tsunamis
Tropical Cyclones:
5 Largest Tropical Cyclones
Event Name Start/End Date(UTC) Max Wind Speed(mph)
Min Pressure(mb)
Location Lat/Long
DAVID25-Aug-1979 18:00:00 - 08-Sep-1979
00:00:00173 924 Atlantic 31.61° N / 58.65° W
DONNA30-Aug-1960 00:00:00 - 14-Sep-1960
00:00:00161 No Data Atlantic 32.63° N / 51.7° W
HUGO10-Sep-1989 18:00:00 - 25-Sep-1989
12:00:00161 918 Atlantic 34.83° N / 50.9° W
FLOYD08-Sep-1999 00:00:00 - 19-Sep-1999
12:00:00155 921 Atlantic 31.6° N / 62.35° W
OPAL28-Sep-1995 00:00:00 - 06-Oct-1995
18:00:00150 919 Atlantic 31.32° N / 84.4° W
Source: Tropical Cyclones
* As defined by the source (Dartmouth Flood Observatory, University of Colorado), Flood Magnitude = LOG(Duration x Severity x Affected Area). Severityclasses are based on estimated recurrence intervals and other criteria.
The information and data contained in this product are for reference only. Pacific Disaster Center (PDC) does not guarantee the accuracy of this data. Refer tooriginal sources for any legal restrictions. Please refer to PDC Terms of Use for PDC generated information and products. The names, boundaries, colors,denominations and any other information shown on the associated maps do not imply, on the part of PDC, any judgment on the legal status of any territory, orany endorsement or acceptance of such boundaries.
Disclosures


![l l W ] u Ç ^ Z } } o t o µ o ] } v W } o ] Ç ] l l o µ o ...fluencycontent2-schoolwebsite.netdna-ssl.com/File... · ] l l W ] u Ç ^ Z } } o t o µ o ] } v W } o ] Ç ] l l W](https://img.dokumen.tips/doc/110x75/5f63a2a9d36a897e7265a9cc/l-l-w-u-z-o-t-o-o-v-w-o-l-l-o-o-fluencycontent2-.jpg)
![D ^ } ] o ^ À ] o v l } } W } µ } Á o l h ð l î ô l î ì í ......D ^ } ] o ^ À ] o v l } } W } µ } Á o l h ð l î ô l î ì í ó. D ^ } ] o ^ À ] o v l } } W } µ }](https://img.dokumen.tips/doc/110x75/5f6387d75bae1175ac762f5c/d-o-o-v-l-w-o-l-h-l-l-d-.jpg)

![& µ u v l t v À ] o o l } ( l ] À o } u P o o l µ v ] ^ À ... · í l õ & µ u v l t v À ] o o l } ( l ] À o } u P o o l µ v ] ^ À ] P o o ] l v ~ P](https://img.dokumen.tips/doc/110x75/5f585fe1f22a543ddb08638e/-u-v-l-t-v-o-o-l-l-o-u-p-o-o-l-v-l-.jpg)


![NLR - Ledige regmerker 19-09-02...2019/09/02 · , o ] l } >E rKDE, o ] l } >E rKDK, o ] l } >E rKDW, o ] l } >E rKD^, o ] l } >E rKDd, o ] l } >E rKD , o ] l } >E rKdE, o ] l } >E](https://img.dokumen.tips/doc/110x75/60f8f03ece455d69470eab0c/nlr-ledige-regmerker-19-09-02-20190902-o-l-e-rkde-o-l-.jpg)
![> ' E ] ( µ u î Ì ] u o ] Ì Ì l o o l > ' E ] ( µ u î Ì ] u o ] Ì Ì l o o …...> ' E ] ( µ u î Ì ] u o ] Ì Ì l o o l > ' E ] ( µ u î Ì ] u o ] Ì Ì l o o l](https://img.dokumen.tips/doc/110x75/5e79aedc3a8aaf7a1b325cb8/-e-u-oe-u-o-oe-oe-l-o-o-l-e-u-oe-u-o-oe.jpg)


![^ o W ' l' o } l Z l D ] o Á µ l s o À } u v Ç t } Ç l } v](https://img.dokumen.tips/doc/110x75/620b63818f249216b211758a/-o-w-l-o-l-z-l-d-o-l-s-o-u-v-.jpg)


![XñîìîrXïíìî uiµ}vo ]i }] À}v cPo µ Zd ^Ì d ^Ì : ^Ì î îZ í îZ](https://img.dokumen.tips/doc/110x75/603950eea73b96122f03366a/xrx-uivo-i-v-cpo-zd-oe-d-oe-oe-z-z-.jpg)