Embed Size (px)
Citation preview

Benchmark Article
BLS Establishment Estimates Revised to Incorporate March 2011 Benchmarks
Introduction Summary of the benchmark revisions Revisions in the post-benchmark period Changes to the CES published series Why benchmarks differ from estimates Benchmark revision effects for other data types Methods Conversion to the 2012 North American Industry Classification System Changes to noncovered employment Technical changes to historical data Availability of revised data Small domain model Seasonal adjustment procedure Special model adjustments Seasonal adjustment of all employee hours and earning series
Introduction
Nathan Clausen
Nathan Clausen is an economist in the Division of Current Employment Statistics, Office of Employment and Unemployment Statistics, Bureau of Labor Statistics. Telephone: (202) 691-6555; e-mail: [email protected]
With the release of data for January 2012, the Bureau of Labor Statistics (BLS) introduced its annual revision of National estimates of
employment, hours, and earnings from the Current Employment Statistics (CES) monthly survey of nonfarm establishments. Each
year, the CES survey realigns its sample-based estimates to incorporate universe counts of employment—a process known as

benchmarking. Comprehensive counts of employment, or benchmarks, are derived primarily from unemployment insurance (UI) tax
reports that nearly all employers are required to file with State Workforce Agencies.
Summary of the benchmark revisions
The March 2011 benchmark level for Total nonfarm employment is 130,061,000; this figure is 162,000 above the sample-based
estimate for March 2011, an adjustment of 0.1 percent. Table 1 shows the total nonfarm percentage benchmark revisions for the past
ten years.
Table 1. Percent differences between nonfarm employment benchmarks and estimates by industry supersector, March 2002-
2011 (1)
Industry 2002 2003 2004 2005 2006 2007 2008 2009 2010 2011
Total nonfarm - 0.2 - 0.1 0.2 - 0.1 0.6 -0.2 -0.1 -0.7 -0.3 0.1 (Level difference in thousands) (-313) (-122) (203) (-158) (752) (-293) (-89) (-902) (-378) (162) Total private - .4 - .2 .2 - .2 .7 -.2 -.1 -.9 -.4 0.1 Mining and logging .9 .7 -.3 1.2 (2) .4 -3.5 -3.0 -.4 Construction -.8 .6 .5 2.6 .1 .7 -2.9 -1.3 -.5 Manufacturing -1.1 -.4 -.3 -.1 -1.0 -.1 -.7 -1.0 .1 Trade, transportation, and utilities (2) .2 .3 .6 .5 .2 -1.2 -.6 .4 Information -2.6 -1.0 -2.1 -.5 -1.8 .3 -1.5 -.4 -.4 Financial activities .2 .1 -.8 .4 -1.3 -.3 -.1 .4 .9 Professional and business services -.7 -.2 -.4 1.3 .2 -.4 -.8 (2) .7 Education and health services .3 .2 (2) .5 -.2 -.1 -.3 (2) -.5 Leisure and hospitality .5 1.2 .4 .3 -.8 -1.1 -.6 -.6 .7 Other services 1.4 .5 -1.3 .5 .3 .2 -.8 .2 -2.0 Government 1.0 .3 .1 (2) (2) -.2 .2 .1 .1 .1 (1) Differences are based on comparisons of final published March estimates and benchmark levels, as originally published. (2) Less than 0.05 percent.

Table 2 shows the nonfarm employment benchmarks for March 2011, not seasonally adjusted, by industry. The majority of super
sectors had upward revisions, with the exception of Mining and logging, Construction, Information, Education and health services,
and Other services. The largest upward revision occurred in Professional and business services, 125,000, or 0.7 percent. Within this
sector, the revision was concentrated in Temporary help services, which revised by 47,400 or 2.1 percent. Trade, transportation, and
utilities had an upward revision of 95,000 or 0.4 percent, driven mostly by Retail trade, which revised upward 83,800 or 0.6 percent.
Within Retail trade, there were a series of large offsetting revisions; Warehouse clubs and supercenters revised up 45,200 or 3.9
percent and Discount department stores revised up 39,300 or 4.1 percent, while Family clothing stores revised down -64,200 or -15.3
percent. Leisure and hospitality revised upward by 93,000 or 0.7 percent, with the largest upward revision of 76,000 or 0.8 percent in
Food services and drinking places. Financial activities revised upward by 69,000 or 0.9 percent. Government and manufacturing each
had upward revisions of 0.1 percent or 28,000 and 9,000 respectively.
Table 2. Nonfarm employment benchmarks by industry, March 2011 (in thousands)
Industry Benchmark Estimate
Differences
Amount Percent
Total nonfarm 130,061 129,899 162 0.1 Total private 107,466 107,332 134 0.1 Goods-producing 17,487 17,507 -20 -0.1 Service-providing 112,574 112,392 182 0.2 Private service-providing 89,979 89,825 154 0.2 Mining and logging 741 744 -3 -0.4 Logging 48 47 1 2.1 Mining 693 696 -3 -0.4 Oil and gas extraction 166 166 0 (1) Mining, except oil and gas 204 200 4 2.0

Coal mining 84 84 0 (1) Support activities for mining 323 331 -8 -2.5 Construction 5,158 5,184 -26 -0.5 Construction of buildings 1,162 1,168 -6 -0.5 Heavy and civil engineering construction 745 757 -12 -1.6 Specialty trade contractors 3,251 3,259 -8 -0.2 Manufacturing 11,588 11,579 9 0.1 Durable goods 7,176 7,187 -11 -0.2 Wood products 334 335 -1 -0.3 Nonmetallic mineral products 355 358 -3 -0.8 Primary metals 380 375 5 1.3 Fabricated metal products 1,321 1,331 -10 -0.8 Machinery 1,037 1,027 10 1.0 Computer and electronic products 1,101 1,118 -17 -1.5 Computer and peripheral equipment 157 170 -13 -8.3 Communications equipment 115 117 -2 -1.7 Semiconductors and electronic components 381 382 -1 -0.3 Electronic instruments 404 403 1 0.2 Electrical equipment and appliances 362 366 -4 -1.1 Transportation equipment 1,368 1,358 10 0.7 Furniture and related products 350 346 4 1.1 Miscellaneous manufacturing 570 572 -2 -0.4 Nondurable goods 4,412 4,392 20 0.5 Food manufacturing 1,432 1,420 12 0.8 Beverages and tobacco products 177 174 3 1.7 Textile mills 120 121 -1 -0.8 Textile product mills 117 116 1 0.9 Apparel 151 155 -4 -2.6 Leather and allied products 29 29 0 (1) Paper and paper products 388 395 -7 -1.8 Printing and related support activities 474 472 2 0.4 Petroleum and coal products 109 109 0 (1) Chemicals 782 774 8 1.0 Plastics and rubber products 632 627 5 0.8

Trade, transportation, and utilities 24,600 24,505 95 0.4 Wholesale trade 5,479 5,492 -13 -0.2 Electronic markets and agents and brokers 827 810 17 2.1 Retail trade 14,343 14,260 83 0.6 Motor vehicle and parts dealers 1,659 1,644 15 0.9 Automobile dealers 1,040 1,024 16 1.5 Furniture and home furnishings stores 433 429 4 0.9 Electronics and appliance stores 525 513 12 2.3 Building material and garden supply stores 1,133 1,114 19 1.7 Food and beverage stores 2,783 2,790 -7 -0.3 Health and personal care stores 968 963 5 0.5 Gasoline stations 813 804 9 1.1 Clothing and clothing accessories stores 1,295 1,372 -77 -5.9 Sporting goods, hobby, book, and music stores 563 564 -1 -0.2 General merchandise stores 3,005 2,918 87 2.9 Department stores 1,500 1,455 45 3.0 Miscellaneous store retailers 749 746 3 0.4 Nonstore retailers 419 405 14 3.3 Transportation and warehousing 4,227 4,204 23 0.5 Air transportation 453 472 -19 -4.2 Rail transportation 226 221 5 2.2 Water transportation 61 62 -1 -1.6 Truck transportation 1,265 1,245 20 1.6 Transit and ground passenger transportation 447 455 -8 -1.8 Pipeline transportation 43 43 0 (1) Scenic and sightseeing transportation 22 22 0 (1) Support activities for transportation 555 547 8 1.4 Couriers and messengers 517 514 3 0.6 Warehousing and storage 639 623 16 2.5 Utilities 552 549 3 0.5 Information 2,667 2,679 -12 -0.4 Publishing industries, except Internet 748 755 -7 -0.9 Motion picture and sound recording industries 360 366 -6 -1.7 Broadcasting, except Internet 282 296 -14 -5.0

Telecommunications 883 873 10 1.1 Data processing, hosting, and related services 244 241 3 1.2 Other information services 150 149 1 0.7 Financial activities 7,641 7,572 69 0.9 Finance and insurance 5,750 5,664 86 1.5 Monetary authorities - central bank 19 21 -2 -10.5 Credit intermediation and related activities 2,551 2,535 16 0.6 Depository credit intermediation 1,727 1,742 -15 -0.9 Commercial banking 1,307 1,315 -8 -0.6 Securities, commodity contracts, investments 806 808 -2 -0.2 Insurance carriers and related activities 2,287 2,213 74 3.2 Funds, trusts, and other financial vehicles 86 87 -1 -1.2 Real estate and rental and leasing 1,891 1,908 -17 -0.9 Real estate 1,375 1,375 0 (1) Rental and leasing services 493 508 -15 -3.0 Lessors of nonfinancial intangible assets 24 26 -2 -8.3 Professional and business services 16,994 16,869 125 0.7 Professional and technical services 7,669 7,614 55 0.7 Legal services 1,110 1,108 2 0.2 Accounting and bookkeeping services 1,014 1,020 -6 -0.6 Architectural and engineering services 1,269 1,273 -4 -0.3 Computer systems design and related services 1,502 1,478 24 1.6 Management and technical consulting services 1,039 1,014 25 2.4 Management of companies and enterprises 1,899 1,869 30 1.6 Administrative and waste services 7,426 7,386 40 0.5 Administrative and support services 7,071 7,032 39 0.6 Employment services 2,821 2,802 19 0.7 Temporary help services 2,205 2,158 47 2.1 Business support services 813 806 7 0.9 Services to buildings and dwellings 1,641 1,634 7 0.4 Waste management and remediation services 355 353 2 0.6 Education and health services 19,891 19,999 -108 -0.5 Educational services 3,368 3,351 17 0.5 Health care and social assistance 16,523 16,648 -125 -0.8

Ambulatory health care services 6,072 6,076 -4 -0.1 Offices of physicians 2,329 2,339 -10 -0.4 Outpatient care centers 616 615 1 0.2 Home health care services 1,124 1,111 13 1.2 Hospitals 4,699 4,721 -22 -0.5 Nursing and residential care facilities 3,151 3,168 -17 -0.5 Nursing care facilities 1,664 1,676 -12 -0.7 Social assistance 2,601 2,684 -83 -3.2 Child day care services 867 879 -12 -1.4 Leisure and hospitality 12,881 12,788 93 0.7 Arts, entertainment, and recreation 1,763 1,749 14 0.8 Performing arts and spectator sports 378 391 -13 -3.4 Museums, historical sites, zoos, and parks 123 122 1 0.8 Amusements, gambling, and recreation 1,262 1,237 25 2.0 Accommodation and food services 11,118 11,039 79 0.7 Accommodation 1,721 1,720 1 0.1 Food services and drinking places 9,396 9,320 76 0.8 Other services 5,305 5,413 -108 -2.0 Repair and maintenance 1,156 1,150 6 0.5 Personal and laundry services 1,273 1,272 1 0.1 Membership associations and organizations 2,876 2,991 -115 -4.0 Government 22,595 22,567 28 0.1 Federal 2,861 2,834 27 0.9 Federal, except U.S. Postal Service 2,225 2,204 21 0.9 U.S. Postal Service 637 630 7 1.1 State government 5,239 5,253 -14 -0.3 State government education 2,528 2,541 -13 -0.5 State government, excluding education 2,712 2,713 -1 (1) Local government 14,495 14,480 15 0.1 Local government education 8,300 8,291 9 0.1 Local government, excluding education 6,194 6,189 5 0.1 (1)Less than 0.05 percent.
Five sectors saw negative revisions. The largest downward revision occurred in Other services,-108,000, or -2.0 percent. Within
Other services, large percentage downward revisions were seen in Miscellaneous professional and similar organizations, down 42,200
or 28.8 percent, and Grantmaking foundations, down 35,100 or 38.3 percent revision. Education and health services also had a
-108,000 or -0.5 percent downward revision, concentrated mostly in Vocational rehabilitation services which had a -81,700 or -24.1
percent revision. Construction revised down 26,000 or 0.5 percent. Smaller revisions were in Information, revising down 12,000 or 0.4
percent, and Mining and logging, revising down 3,000 or 0.4 percent.
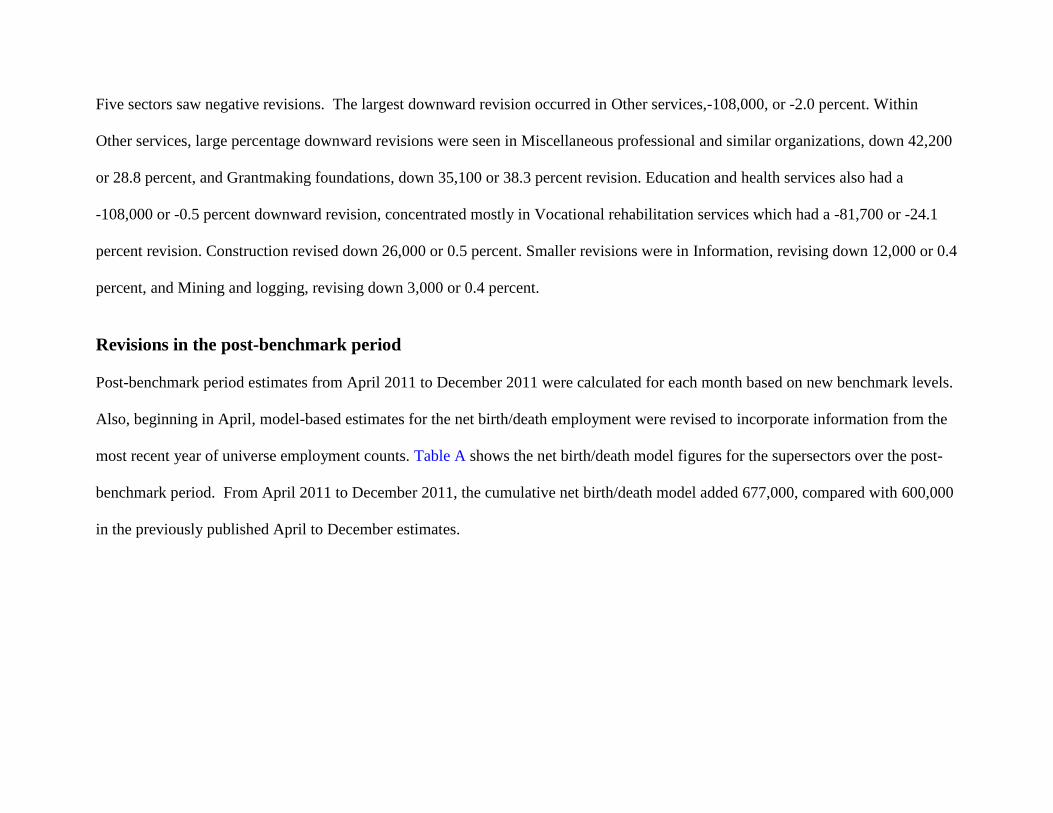
Revisions in the post-benchmark period
Post-benchmark period estimates from April 2011 to December 2011 were calculated for each month based on new benchmark levels.
Also, beginning in April, model-based estimates for the net birth/death employment were revised to incorporate information from the
most recent year of universe employment counts. Table A shows the net birth/death model figures for the supersectors over the post-
benchmark period. From April 2011 to December 2011, the cumulative net birth/death model added 677,000, compared with 600,000
in the previously published April to December estimates.

Text Table A. Net Birth/Death Estimates, Post-Benchmark 2011 (in thousands)
2011
Min
ing &
Loggin
g
Con
stru
ctio
n
Man
ufa
ctu
rin
g
Tra
de,
Tra
nsp
ort
ati
o
n, &
Uti
liti
es
Info
rmati
on
Fin
an
cial
Act
ivit
ies
Pro
fess
ion
al
&
Bu
sin
ess
Ser
vic
es
Ed
uca
tion
&
Hea
lth
Ser
vic
es
Lei
sure
&
Hosp
itali
ty
Oth
er S
ervic
es
Mon
thly
Am
ou
nt
Con
trib
ute
d
April 1 24 -6 5 2 -7 58 16 72 7 172 May 2 37 7 25 4 8 26 18 76 8 211 June 2 22 4 12 1 5 20 -7 77 5 141 July 2 -6 -8 -12 -2 -6 2 4 38 -7 5 August 2 7 4 13 4 2 20 15 19 3 89 September 1 3 0 8 1 -3 -8 12 -38 -2 -26 October 2 2 -2 27 3 14 52 49 -35 4 116 November 0 -16 0 1 2 1 0 4 -21 -1 -30 December 0 -22 0 4 2 9 -1 0 6 1 -1
Cumulative
Total 12 51 -1 83 17 23 169 111 194 18 677
Table 3 presents revised total nonfarm employment data on a seasonally adjusted basis for January through December 2011. The
revised data for April 2011 forward incorporate the effect of applying the rate of change measured by the sample to the new
benchmark level, as well as updated net birth/death model adjustments and new seasonal adjustment factors. Revisions to November
and December also reflect incorporation of the annual CES sample update.

Table 3. Differences in seasonally adjusted levels and over-the-month changes, Total nonfarm
employment, January 2011-December 2011 (in thousands)
2011
Levels Over-the-month changes
As previously
published
As
revised Difference
As previously
published
As
revised Difference
January 130,328 130,456 128 68 110 42 February 130,563 130,676 113 235 220 -15 March 130,757 130,922 165 194 246 52 April 130,974 131,173 199 217 251 34 May 131,027 131,227 200 53 54 1 June 131,047 131,311 264 20 84 64 July 131,174 131,407 233 127 96 -31 August 131,278 131,492 214 104 85 -19 September 131,488 131,694 206 210 202 -8 October 131,600 131,806 206 112 112 0 November 131,700 131,963 263 100 157 57 December
(p) 131,900 132,166 266 200 203 3
(p)Preliminary
Changes to the CES published series
All CES series are evaluated annually for sample size, coverage, and response rates. The following series changes result from a re-
evaluation of the sample and universe coverage for NAICS industries. Some small industries no longer have sufficient sample to be
estimated and published separately and have been combined with other similar industries for estimation and publication purposes, as
shown below. Most of the collapsed and deleted series are in the Manufacturing sector where employment has been declining over a
number of years. Historical data for the series with changed scope were reconstructed to provide consistent time series.

All Employee (AE) series are published at a more detailed level than All Employee Hours and Earnings, Production Employee,
Women Employee, or Production Employee Hours and Earnings series, collectively called Non-AE series. The Non-AE series will be
sometimes unaffected or affected at a less-detailed level than the AE series. Consequently, tables are provided below for both the AE
and Non-AE series.
Exhibit 1. Discontinued Employment Series
NAICS
2007
CES NAICS 2007
Tabcode CES NAICS 2007 Industry Next Highest Published Level
333611 31-333611 Turbine and turbine generator set units Turbine and power transmission equipment (31-333600)
333618 31-333618 Power transmission and miscellaneous engine equipment
Turbine and power transmission equipment (31-333600)
311422 32-311422 Fruit, vegetable, and specialty canning Fruit and vegetable canning and drying (32-311420)
311423 32-311423 Dried and dehydrated food Fruit and vegetable canning and drying (32-311420)
3162 32-316200 Footwear Leather and allied products (32-316000) 325613 32-325613 Polishes and other sanitation goods and other
surface active agents Soaps and cleaning compounds (32-325610)
Exhibit 2. Collapsed Employment Series
NAICS
2007
CES NAICS 2007
Tabcode CES NAICS 2007 Industry Collapsed into CES NAICS 2012 Industry
322212 32-322212 Folding paperboard boxes Folding boxes and miscellaneous paperboard containers (32-322219)
322215 32-322215 Miscellaneous paperboard containers
Folding boxes and miscellaneous paperboard containers (32-322219)

Exhibit 3. Discontinued Non-AE Employment, Hours, and Earnings Series
NAICS
2007
CES NAICS 2007
Tabcode CES NAICS 2007 Industry Next Highest Published Level
3311 31-331100 Iron and steel mills and ferroalloy production Primary metals (31-331000) 3312 31-331200 Steel products from purchased steel Primary metals (31-331000) 332721 31-332721 Precision turned products Turned products and screws, nuts, and bolts
(31-332720) 332722 31-332722 Bolts, nuts, screws, rivets, and washers Turned products and screws, nuts, and bolts
(31-332720) 33391 31-333910 Pumps and compressors Other general purpose machinery (31-333900) 33392 31-333920 Material handling equipment Other general purpose machinery (31-333900) 33399 31-333990 All other general purpose machinery Other general purpose machinery (31-333900) 334515 31-334515 Electricity and signal testing instruments Electromedical apparatus (31-334510) 3366 31-336600 Ship and boat building Transportation equipment (31-336000) 3369 31-336900 Railroad rolling stock and other transportation
equipment Transportation equipment (31-336000)
3152 32-315200 Cut and sew apparel Apparel (32-315000) 31521 32-315210 Cut and sew apparel contractors Apparel (32-315000) 3159 32-315900 All other apparel manufacturing Apparel (32-315000) 3253 32-325300 Agricultural chemicals Chemicals (32-325000) 3259 32-325900 Other chemical products and preparations Chemicals (32-325000) 221121 44-221121 Electric bulk power transmission and control Electric power transmission and distribution
(44-221120)
Exhibit 4. Discontinued Women Employment, Hours, and Earnings Series
NAICS 2007 CES NAICS 2007 Tabcode CES NAICS 2007 Industry Next Highest Published Level
33611 31-336110 Automobiles and light trucks Motor vehicles (31-336100) 336111 31-336111 Automobiles Motor vehicles (31-336100) 336112 31-336112 Light trucks and utility vehicles Motor vehicles (31-336100) 33612 31-336120 Heavy duty trucks Motor vehicles (31-336100)

Exhibit 5. Discontinued All Employee and Production Employee Overtime Hours Series
NAICS
2007
CES NAICS 2007
Tabcode
CES NAICS 2007 Industry Next Highest Published Level
3343 31-334300 Audio and video equipment Computer and electronic products (31-334000) 3346 31-334600 Magnetic media manufacturing and
reproduction Computer and electronic products (31-334000)
334515 31-334515 Electricity and signal testing instruments Electromedical apparatus (31-334510) 336411 31-336411 Aircraft Aerospace products and parts (31-336400) 3369 31-336900 Railroad rolling stock and other transportation
equipment Transportation equipment (31-336000)
312 32-312000 Beverages and tobacco products Nondurable goods (32-000000) 31321 32-313210 Broadwoven fabric mills Fabric mills (32-313200) 316 32-316000 Leather and allied products Nondurable goods (32-000000)
Why benchmarks differ from estimates
A benchmark revision is the difference between the benchmark employment level for a given March and its corresponding sample-
based estimate. The overall accuracy of the establishment survey is usually gauged by the size of this difference. The benchmark
revision often is regarded as a proxy for total survey error, but this does not take into account error in the universe data. The
employment counts obtained from quarterly unemployment insurance tax forms are administrative data that reflect employer record-
keeping practices and differing State laws and procedures. The benchmark revision can be more precisely interpreted as the difference
between two independently derived employment counts, each subject to its own error sources.
Like all sample surveys, the establishment survey is susceptible to two sources of error: sampling error and nonsampling error.
Sampling error is present any time a sample is used to make inferences about a population. The magnitude of the sampling error, or

variance, relates directly to sample size and the percentage of the universe covered by that sample. The CES monthly survey captures
slightly under one-third of the universe, exceptionally high by usual sampling standards. This coverage ensures a small sampling error
at the total nonfarm employment level.
Both the universe counts and the establishment survey estimates are subject to nonsampling errors common to all surveys—coverage,
response, and processing errors. The error structures for both the CES monthly survey and the UI universe are complex. Still, the two
programs generally produce consistent total employment figures, each validating the other. Over the last decade, annual benchmark
revisions at the Total nonfarm level have averaged 0.3 percent (in absolute terms), with an absolute range of 0.1 percent to 0.7 percent.
Benchmark revision effects for other data types
The routine benchmarking process results in revisions to the series for production and nonsupervisory workers. There are no
benchmark employment levels for these series; they are revised by preserving ratios of employment for the particular data type to all
employee employment prior to benchmarking, and then applying these ratios to the revised all employee figures. These figures are
calculated at the basic cell level and then aggregated to produce the summary estimates. Average weekly hours and average hourly
earnings are not benchmarked; they are estimated solely from reports supplied by survey respondents at the basic estimating cell level.
The aggregate industry level of the hours and earnings series is derived as a weighted average. The production or nonsupervisory
employee employment estimates for the basic cells are used as weights for the hours and earnings estimates for broader industry

groupings. Adjustments of the all employee estimates to new benchmarks may alter the weights, which, in turn, may change the
estimates for hours and earnings of production or nonsupervisory employees at higher levels of aggregation.
Generally, new employment benchmarks have little effect on hours and earnings estimates for major groupings. To influence the
hours and earnings estimates of a broader group, employment revisions have to be relatively large and must affect industries that have
hours or earnings averages that are substantially different from those of other industries in their group. Table 4A and Table 4B give
information on the levels of specific hours and earnings series resulting from the March 2011 benchmark. At the total private level,
there was no change in average weekly hours for all employees and production and nonsupervisory employees from the previously
published level. Average hourly earnings increased by 1 cent for all employees and 3 cents for production and nonsupervisory
employees from the previously published level.
Table 4a. Effect of March 2011 benchmark revisions to all employee hours and earnings estimates, selected industries
Industry Average weekly hours Average hourly earnings
As previously
published As revised Difference
As previously
published
As
revised Difference
Total private 34.1 34.1 0.0 $ 22.92 $ 22.93 $ 0.01 Goods-producing 39.6 39.7 .1 24.32 24.31 -.01 Private service-providing 33.0 33.0 .0 22.59 22.61 .02 Mining and logging 43.8 43.8 .0 28.38 28.36 -.02 Construction 37.5 37.5 .0 25.40 25.40 .00 Manufacturing 40.4 40.4 .0 23.59 23.58 -.01 Durable goods 40.8 40.8 .0 25.11 25.10 -.01 Wood products 39.6 39.6 .0 17.34 17.34 .00 Nonmetallic mineral products 39.7 39.7 .0 20.97 20.95 -.02 Primary metals 44.0 44.0 .0 23.18 23.25 .07

Fabricated metal products 40.4 40.4 .0 21.29 21.27 -.02 Machinery 41.7 41.7 .0 24.52 24.51 -.01 Computer and electronic products 39.9 39.9 .0 32.97 32.93 -.04 Electrical equipment and appliances 40.3 40.3 .0 22.68 22.68 .00 Transportation equipment 42.6 42.6 .0 29.13 29.12 -.01 Furniture and related products 39.1 39.1 .0 18.43 18.47 .04 Miscellaneous manufacturing 38.6 38.6 .0 23.61 23.66 .05 Nondurable goods 39.6 39.6 .0 21.03 21.05 .02 Food manufacturing 38.9 38.9 .0 17.50 17.57 .07 Beverages and tobacco products 37.0 37.0 .0 22.80 22.80 .00 Textile mills 40.3 40.3 .0 17.16 17.17 .01 Textile product mills 37.1 37.1 .0 15.27 15.28 .01 Apparel 37.1 37.1 .0 16.27 16.27 .00 Leather and allied products 37.8 37.8 .0 16.87 16.87 .00 Paper and paper products 42.1 42.1 .0 23.12 23.13 .01 Printing and related support activities 36.8 36.8 .0 20.87 20.85 -.02 Petroleum and coal products 42.1 42.0 -.1 33.40 33.31 -.09 Chemicals 41.2 41.2 .0 27.49 27.46 -.03 Plastics and rubber products 41.2 41.2 .0 19.67 19.67 .00 Trade, transportation, and utilities 34.2 34.2 .0 19.90 19.89 -.01 Wholesale trade 38.3 38.3 .0 26.00 26.03 .03 Retail trade 31.1 31.1 .0 15.74 15.75 .01 Transportation and warehousing 38.5 38.6 .1 21.40 21.38 -.02 Utilities 41.8 41.8 .0 33.52 33.52 .00 Information 36.2 36.3 .1 31.71 31.77 .06 Financial activities 36.7 36.8 .1 27.56 27.59 .03 Professional and business services 35.4 35.4 .0 27.54 27.55 .01 Education and health services 32.6 32.6 .0 23.32 23.40 .08 Leisure and hospitality 25.7 25.7 .0 13.25 13.24 -.01 Other services 31.5 31.6 .1 20.44 20.46 .02

Table 4b. Effect of March 2011 benchmark revisions to production employee hours and earnings estimates, selected
industries
Industry Average weekly hours Average hourly earnings
As previously
published
As
revised Difference
As previously
published
As
revised Difference
Total private 33.3 33.3 0.0 $ 19.32 $ 19.35 $ .03 Goods-producing 40.5 40.5 .0 20.48 20.48 .00 Private service-providing 32.1 32.2 .1 19.08 19.12 .04 Mining and logging 45.4 45.3 -.1 24.69 24.68 -.01 Construction 38.1 38.1 .0 23.37 23.38 .01 Manufacturing 41.3 41.3 .0 18.89 18.90 .01 Durable goods 41.8 41.9 .1 20.11 20.12 .01 Wood products 39.7 39.8 .1 14.82 14.82 .00 Nonmetallic mineral products 41.4 41.4 .0 17.84 17.81 -.03 Primary metals 45.1 45.1 .0 19.95 19.99 .04 Fabricated metal products 41.8 41.8 .0 18.08 18.07 -.01 Machinery 43.1 43.1 .0 19.38 19.38 .00 Computer and electronic products 40.3 40.4 .1 23.23 23.23 .00 Electrical equipment and appliances 41.0 41.0 .0 17.99 17.99 .00 Transportation equipment 43.5 43.6 .1 25.48 25.49 .01 Furniture and related products 40.4 40.3 -.1 15.22 15.24 .02 Miscellaneous manufacturing 38.9 38.9 .0 16.91 16.93 .02 Nondurable goods 40.5 40.5 .0 16.97 16.97 .00 Food manufacturing 39.4 39.4 .0 14.52 14.57 .05 Beverages and tobacco products 38.8 38.8 .0 20.58 20.58 .00 Textile mills 40.8 40.7 -.1 13.94 14.00 .06 Textile product mills 39.4 39.4 .0 12.20 12.19 -.01 Apparel 38.6 38.6 .0 11.72 11.71 -.01 Leather and allied products 39.3 39.3 .0 13.35 13.35 .00 Paper and paper products 43.3 43.3 .0 19.95 19.96 .01 Printing and related support activities 37.8 37.8 .0 17.25 17.24 -.01 Petroleum and coal products 41.8 41.8 .0 31.88 31.79 -.09 Chemicals 42.6 42.6 .0 21.38 21.34 -.04 Plastics and rubber products 41.9 41.9 .0 15.85 15.84 -.01

Trade, transportation, and utilities 33.4 33.4 .0 17.05 17.05 .00 Wholesale trade 38.2 38.2 .0 21.67 21.70 .03 Retail trade 30.0 30.1 .1 13.42 13.43 .01 Transportation and warehousing 37.6 37.8 .2 19.28 19.30 .02 Utilities 42.4 42.4 .0 30.83 30.84 .01 Information 36.0 36.0 .0 26.37 26.42 .05 Financial activities 35.8 35.9 .1 21.72 21.79 .07 Professional and business services 34.9 34.9 .0 23.00 23.00 .00 Education and health services 32.0 32.0 .0 20.46 20.55 .09 Leisure and hospitality 24.7 24.7 .0 11.42 11.42 .00 Other services 30.6 30.6 .0 17.22 17.34 .12
Methods
Benchmark adjustment procedure. Establishment survey benchmarking is done on an annual basis to a population derived primarily
from the administrative file of employees covered by unemployment insurance (UI). The time required to complete the revision
process—from the full collection of the UI population data to publication of the revised industry estimates—is about ten months. The
benchmark adjustment procedure replaces the March sample-based employment estimates with UI-based population counts for March.
The benchmark therefore determines the final employment levels, while sample movements capture month-to-month trends.
Benchmarks are established for each basic estimating cell and are aggregated to develop published levels. On a not-seasonally
adjusted basis, the sample-based estimates for the year preceding and the year following the benchmark also are then subject to
revision. Employment estimates for the months between the most recent March benchmark and the previous year's benchmark are
adjusted using a "wedge-back" procedure. In this process, the difference between the benchmark level and the previously published

March estimate for each estimating cell is computed. This difference, or error, is linearly distributed across the 11 months of estimates
subsequent to the previous benchmark; eleven-twelfths of the March difference is added to February estimates, ten-twelfths to January
estimates, and so on, ending with the previous April estimates, which receive one-twelfth of the March difference. The wedge
procedure assumes that the total estimation error accumulated at a steady rate since the last benchmark. Applying previously derived
over-the-month sample changes to the revised March level yields revised estimates for the months following the March benchmark.
New net birth/death model estimates also are calculated and applied during post-benchmark estimation, and new sample is introduced
from the annual update.
Benchmark source material. The principal source of benchmark data for private industries is the Quarterly Census of Employment
and Wages (QCEW). These employment data are provided to State Employment Security Agencies by employers covered by State UI
laws. BLS uses several other sources to establish benchmarks for the remaining industries partially covered or exempt from
mandatory UI coverage, accounting for nearly 3 percent of the nonfarm employment total.
Data on employees covered under Social Security laws, published by the U.S. Census Bureau in County Business Patterns, are used to
augment UI data for industries not fully covered by the UI scope, such as Nonoffice insurance sales workers, child daycare workers,
Religious organizations, and Private schools and hospitals. Benchmarks for State and Local government hospitals and Educational
institutions are based on the Annual Census of Governments conducted by the Census Bureau. Benchmark data from these sources
are available only on a lagged basis. Extrapolation to a current level is accomplished by applying the employment trends from the UI-

covered part of the population in these industries to the noncovered part. Universe data for interstate railroads are obtained from the
Railroad Retirement Board.
Business birth and death estimation. Regular updating of the CES sample frame with information from the UI universe files helps to
keep the CES survey current with respect to employment from business births and business deaths. The timeliest UI universe files
available, however, always will be a minimum of nine months out of date. The CES survey thus cannot rely on regular frame
maintenance alone to provide estimates for business birth and death employment contributions. BLS has researched both sample-
based and model-based approaches to measuring birth units that have not yet appeared on the UI universe frame. Since the research
demonstrated that sampling for births was not feasible in the very short CES production timeframes, the Bureau is utilizing a model-
based approach for this component.
Earlier research indicated that while both the business birth and death portions of total employment are generally significant, the net
contribution is relatively small and stable. To account for this net birth/death portion of total employment, BLS is utilizing an
estimation procedure with two components. The first component excludes employment losses from business deaths from sample-
based estimation in order to offset the missing employment gains from business births. This is incorporated into the sample-based link
relative estimate procedure by simply not reflecting sample units going out of business, but imputing to them the same trend as the
other firms in the sample. The second component is an ARIMA time series model designed to estimate the residual net birth/death
employment not accounted for by the imputation. The historical time series used to create and test the ARIMA model was derived
from the UI universe micro level database, and reflects the actual residual net of births and deaths over the past five years. The net
birth/death model component figures are unique to each month and include negative adjustments in some months. Furthermore, these
figures exhibit a seasonal pattern similar to the seasonal patterns of the continuing businesses.
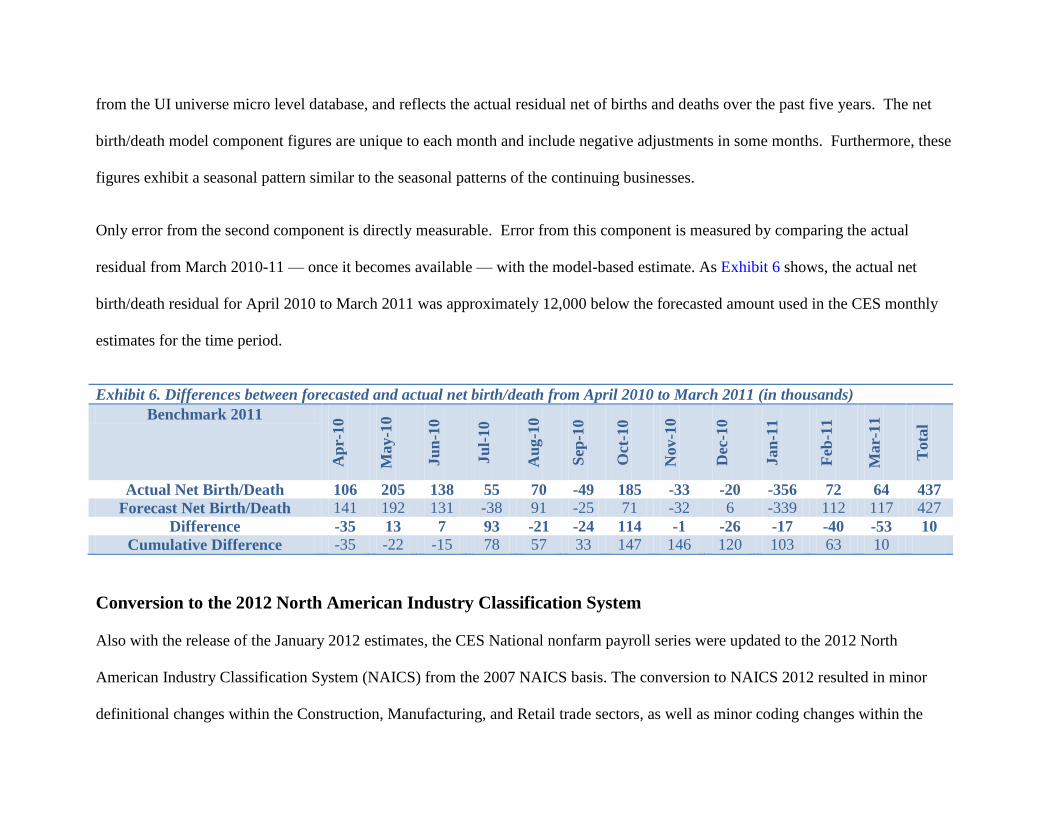
Only error from the second component is directly measurable. Error from this component is measured by comparing the actual
residual from March 2010-11 — once it becomes available — with the model-based estimate. As Exhibit 6 shows, the actual net
birth/death residual for April 2010 to March 2011 was approximately 12,000 below the forecasted amount used in the CES monthly
estimates for the time period.
Exhibit 6. Differences between forecasted and actual net birth/death from April 2010 to March 2011 (in thousands)
Benchmark 2011
Ap
r-10
May
-10
Ju
n-1
0
Ju
l-10
Au
g-1
0
Sep
-10
Oct
-10
Nov-1
0
Dec
-10
Jan
-11
Feb
-11
Mar-
11
Tota
l
Actual Net Birth/Death 106 205 138 55 70 -49 185 -33 -20 -356 72 64 437
Forecast Net Birth/Death 141 192 131 -38 91 -25 71 -32 6 -339 112 117 427 Difference -35 13 7 93 -21 -24 114 -1 -26 -17 -40 -53 10
Cumulative Difference -35 -22 -15 78 57 33 147 146 120 103 63 10
Conversion to the 2012 North American Industry Classification System
Also with the release of the January 2012 estimates, the CES National nonfarm payroll series were updated to the 2012 North
American Industry Classification System (NAICS) from the 2007 NAICS basis. The conversion to NAICS 2012 resulted in minor
definitional changes within the Construction, Manufacturing, and Retail trade sectors, as well as minor coding changes within the

Utilities and the Leisure and hospitality sectors. Several industry titles and descriptions were also updated. None of the revisions
crossed supersector boundaries.
All series were converted to the 2012 NAICS basis prior to annual benchmark processing. In order to avoid time series breaks, all
impacted series were reconstructed back to at least 1990. The reconstruction methodology is based on the first quarter 2011 UI
microdata, which were coded on both a 2007 NAICS and a 2012 NAICS basis. Ratios were established from this dual coded file; the
ratios were used to map employment from the 2007 NAICS series to the 2012 NAICS series. For example, the March 2011
employment ratios for 2007 CES NAICS industry 31-337129 (Miscellaneous household and institutional furniture) indicate that 96.1
percent of the employment will go to 2012 CES NAICS series 31-337127 (Miscellaneous household and institutional furniture) and
3.9 percent to 31-321990 (All other wood products). The 2007 NAICS to 2012 NAICS employment ratios, or distribution of
employment from 2007 NAICS to 2012 NAICS, can be seen in Exhibit 7. The 2012 NAICS to 2007 NAICS employment ratios, or the
composition of the 2012 NAICS series from 2007 NAICS, can be seen in Exhibit 8.
Exhibit 7. NAICS 2007 to NAICS 2012 All Employee Employment Ratios
CES NAICS
2007 Tabcode NAICS 2007 Industry
CES NAICS 2012
Tabcode NAICS 2012 Industry Ratio
31-321990 All other wood products 31-321990 All other wood products 100.0 31-337129 Miscellaneous household and
institutional furniture 31-321990 All other wood products 3.9
31-332995 Small arms, ammunition, and other ordnance and accessories
31-332994 Small arms, ammunition, and other ordnance and accessories
100.0
31-333513 Metal cutting and forming machine tools
31-333517 Machine tool manufacturing 100.0

31-333518 Miscellaneous metalworking machinery
31-333519 Miscellaneous metalworking machinery 100.0
31-334119 Computer terminals and other computer peripheral equipment
31-334118 Computer terminals and other computer peripheral equipment
100.0
31-336321 Vehicular lighting equipment 31-336320 Motor vehicle electric equipment 100.0 31-336322 Other motor vehicle electric
equipment 31-336320 Motor vehicle electric equipment 100.0
31-337129 Miscellaneous household and institutional furniture
31-337127 Miscellaneous household and institutional furniture
96.1
32-311330 Chocolate confectioneries 32-311350 Chocolate and confectionery manufacturing 100.0 32-315290 Women's and all other cut and
sew apparel 32-315280 Women's and all other cut and sew apparel 100.0
32-322215 Miscellaneous paperboard containers
32-322219 Folding boxes and miscellaneous paperboard containers
100.0
32-323110 Commercial lithograph printing 32-323117 Commercial printing, except screen 100.0 32-323112 Commercial flexographic
printing 32-323117 Commercial printing, except screen 100.0
32-323114 Quick printing 32-323117 Commercial printing, except screen 100.0 32-323119 Miscellaneous commercial
printing 32-323117 Commercial printing, except screen 100.0
42-443111 Household appliance stores 42-443141 Household appliance stores 100.0 42-443112 Radio, TV, and other electronics
stores 42-443142 Electronics stores 100.0
42-443130 Computer, software, camera, and photography supply stores
42-443142 Electronics stores 100.0
42-451220 Prerecorded tape, CD, and record stores
42-443142 Electronics stores 100.0
42-454311 Healing oil dealers 42-454310 Fuel dealers 100.0 42-454319 Liquefied petroleum gas, bottled
gas, and other fuel dealers 42-454310 Fuel dealers 100.0
44-221119 Nuclear and other electric power generation
44-221118 Nuclear and other electric power generation 100.0
70-722100 Full-service restaurants 70-722511 Full-service restaurants 100.0 70-722211 Limited-service restaurants 70-722513 Limited-service restaurants 100.0

70-722212 Cafeterias, grill buffets, and buffets
70-722514 Cafeterias, grill buffets, and buffets 100.0
70-722213 Snack and nonalcoholic beverage bars
70-722515 Snack and nonalcoholic beverage bars 100.0
Exhibit 8. NAICS 2012 to NAICS 2007 All Employee Employment Ratios
CES NAICS 2012
Tabcode NAICS 2012 Industry
CES NAICS 2007
Tabcode NAICS 2007 Industry Ratio
31-321990 All other wood products 31-321990 All other wood products 97.3 31-321990 All other wood products 31-337129 Miscellaneous household and
institutional furniture 2.7
31-332994 Small arms, ammunition, and other ordnance and accessories
31-332995 Small arms, ammunition, and other ordnance accessories
100.0
31-333517 Machine tools 31-333513 Metal cutting and forming machine tools
100.0
31-333519 Miscellaneous metalworking machinery 31-333518 Miscellaneous metalworking machinery 100.0 31-334118 Computer terminals and other computer
peripheral equipment 31-334119 Computer terminals and other computer
peripheral equipment 100.0
31-336320 Motor vehicle electric equipment 31-336321 Vehicular lighting equipment 22.3 31-336320 Motor vehicle electric equipment 31-336322 Other motor vehicle electric equipment 77.7 31-337127 Miscellaneous household and
institutional furniture 31-337129 Miscellaneous household and
institutional furniture 100.0
32-311350 Chocolate and confectionery manufacturing
32-311330 Chocolate confectioneries 100.0
32-315280 Women's and all other cut and sew apparel
32-315290 Women's and all other cut and sew apparel
100.0
32-322219 Folding boxes and miscellaneous paperboard containers
32-322215 Miscellaneous paperboard containers 100.0
32-323117 Commercial printing, except screen 32-323110 Commercial lithograph printing 46.2 32-323117 Commercial printing, except screen 32-323112 Commercial flexographic printing 8.4 32-323117 Commercial printing, except screen 32-323114 Quick printing 11.5 32-323117 Commercial printing, except screen 32-323119 Miscellaneous commercial printing 34.0 42-443141 Household appliance stores 42-443111 Household appliance stores 100.0

42-443142 Electronics stores 42-443112 Radio, TV, and other electronics stores 70.8 42-443142 Electronics stores 42-443130 Computer, software, camera, and
photography supply stores 25.0
42-443142 Electronics stores 42-451220 Prerecorded tape, CD, and record stores 4.2 42-451200 Book stores and news dealers 42-451210 Book stores and news dealers 100.0 42-454310 Fuel dealers 42-454311 Healing oil dealers 50.2 42-454310 Fuel dealers 42-454319 Liquefied petroleum gas, bottled gas,
and other fuel dealers 49.8
44-221118 Nuclear and other electric power generation
44-221119 Nuclear and other electric power generation
100.0
70-722511 Full-service restaurants 70-722100 Full-service restaurants 100.0 70-722513 Limited-service restaurants 70-722211 Limited-service restaurants 100.0 70-722514 Cafeterias, grill buffets, and buffets 70-722212 Cafeterias, grill buffets, and buffets 100.0 70-722515 Snack and nonalcoholic beverage bars 70-722213 Snack and nonalcoholic beverage bars 100.0
The conversion to 2012 NAICS caused several changes to CES published series. Exhibit 9 shows new all employee series as a result
of 2012 NAICS. Exhibit 10 shows changes in scope to published all employee series due to the 2012 NAICS reclassification. Exhibit
11 shows discontinued NAICS 2007 series that have been reclassified into 2012 NAICS.
Exhibit 9. New All Employee series as a result of reclassification of 2007 NAICS to 2012 NAICS
NAICS
2007
CES NAICS 2007
Tabcode CES NAICS 2007 Industry
Reclassification into CES NAICS 2012
Industries
332995 31-332995 Small arms, ammunition, and other ordinance and accessories
Moved into new NAICS 2012 industry Small arms, ammunition, and other ordinance and accessories (31-332994)
333513 31-333513 Metal cutting and forming machine tools Moved into new NAICS 2012 industry Machine tools (31-333517)

333518 31-333518 Miscellaneous metalworking machinery Moved into new NAICS 2012 industry Miscellaneous metalworking machinery (31-333519)
334119 31-334119 Computer terminals and other computer peripheral equipment
Moved into new NAICS 2012 industry Computer terminals and other computer peripheral equipment (31-334118)
31133 32-311330 Chocolate confectioneries Moved into new NAICS 2012 industry Chocolate and confectionery manufacturing (32-311350)
31529 32-315290 Women's and all other cut and sew apparel Moved into new NAICS 2012 industry Women's and all other cut and sew apparel (32-315280)
322215 32-322215 Miscellaneous paperboard containers Moved into new NAICS 2012 industry Folding boxes and miscellaneous paperboard containers (32-322219)
323110 32-323110 Commercial lithograph printing Combined into new NAICS 2012 Commercial printing (except screen) (32-323117)
323112 32-323112 Commercial flexographic printing Combined into new NAICS 2012 Commercial printing (except screen) (32-323117)
323114 32-323114 Quick printing Combined into new NAICS 2012 Commercial printing (except screen) (32-323117)
323119 32-323119 Miscellaneous commercial printing Combined into new NAICS 2012 Commercial printing (except screen) (32-323117)
443111 42-443111 Household appliance stores Moved into new NAICS 2012 industry Household appliance stores (42-443141)
443112 42-443112 Radio, TV, and other electronics stores Combined into new NAICS 2012 industry Electronics stores (42-443142)
44313 42-443130 Computer, software, camera, and photography supply stores
Combined into new NAICS 2012 industry Electronics stores (42-443142)
45122 42-451220 Prerecorded tape, CD, and record stores Combined into new NAICS 2012 industry Electronics stores (42-443142)
221119 44-221119 Nuclear and other electric power generation
Moved into new NAICS 2012 industry Nuclear and other electric power generation (44-221118)
7221 70-722100 Full-service restaurants Moved into new NAICS 2012 industry Full-service restaurants (70-722511)

722211 70-722211 Limited-service restaurants Moved into new NAICS 2012 industry Limited-service restaurants (70-722513)
722212 70-722212 Cafeterias, grill buffets, and buffets Moved into new NAICS 2012 industry Cafeterias, grill buffets, and buffets (70-722514)
722213 70-722213 Snack and nonalcoholic beverage bars Moved into new NAICS 2012 industry Snack and nonalcoholic beverage bars (70-722515)
7225 70-722500 Restaurants and other eating places The new NAICS 2012 series Restaurants and other eating places (70-722500) combines Full-service restaurants (70-722100) with Limited-service eating places (70-722200).
Exhibit 10. Change in Scope of All Employee Series Due to 2012 NAICS
NAICS
2012
CES NAICS 2012
Tabcode
CES NAICS 2012
Industry Reclassified CES NAICS 2007 Industry
32199 31-321990 All other wood products All other wood products (31-321990) gains a portion of Miscellaneous household and institutional furniture (31-337129)
337127 31-337127 Miscellaneous household and institutional furniture
A portion of Miscellaneous household and institutional furniture (31-337129) was moved to All other wood products (31-321990). The rest is reclassified into new NAICS 2012 industry Miscellaneous household and institutional furniture (31-337127).
323110 32-323110 Printing The new NAICS 2012 series Printing (32-323110) was originally only Commercial lithograph printing, but now is an aggregate level containing Commercial screen printing (32-323113) and Commercial printing, except screen (32-323117).
4512 42-451200 Book stores and news dealers
A portion of Book, periodical, and music stores (42-451200) that is associated with Prerecorded tape, CD, and record stores (42-451220) is moved to Electronics stores (42-443142). Book, periodical, and music stores (42-451200) is renamed Book stores and news dealers.

Exhibit 11. Discontinued 2007 NAICS All Employee series
NAICS
2007
CES NAICS 2007
Tabcode CES NAICS 2007 Industry Next Highest Published Level
332116 31-332116 Metal Stamping Forging and stamping (31-332100) 336321 31-336321 Vehicular lighting equipment Motor vehicle electric equipment (31-336320) 336322 31-336322 Other motor vehicle electric equipment Motor vehicle electric equipment (31-336320) 323112 32-323112 Commercial flexographic printing Commercial printing (except screen) (32-
323117) 323114 32-323114 Quick printing Commercial printing (except screen) (32-
323117) 323119 32-323119 Miscellaneous commercial printing Commercial printing (except screen) (32-
323117) 443112 42-443112 Radio, TV, and other electronics stores Electronics stores (42-443142) 44313 42-443130 Computer, software, camera, and photography
supply stores Electronics stores (42-443142)
45121 42-451210 Book stores and news dealers Book stores and news dealers (42-451200) 454311 42-454311 Heating oil dealers Fuel dealers (42-454310) 454319 42-454319 Liquefied petroleum gas, bottled gas, and other
fuel dealers Fuel dealers (42-454310)
The CES survey also updated industry titles to reflect similar changes in the 2012 NAICS industry definitions, shown in Exhibit 12. In
most cases the scope of each industry is not affected by the title changes, except where the industries are also listed in the "Change in
Scope" tables above.
Exhibit 12. Changes to Industry Titles
NAICS
2007
CES NAICS 2007
Tabcode CES NAICS 2007 Industry CES NAICS 2012 Industry
333517 31-333517 Metal cutting and forming machine tools
Machine tools
31522 32-315220 Men's cut and sew apparel Men's and boys' cut and sew apparel 322219 32-322219 Miscellaneous paperboard containers Folding boxes and miscellaneous paperboard containers

4512 42-451200 Book, periodical, and music stores Book stores and news dealers 561422 60-561422 Telemarketing bureaus and other
contact centers Telemarketing bureaus
62321 65-623210 Residential mental retardation facilities
Residential intellectual and developmental disability facilities
623312 65-623312 Homes for the elderly Assisted living facilities for the elderly 71219 70-712190 Historical sites, zoos, botanical
gardens, nature parks and similar institution
Historical sites, zoos, botanical gardens, nature parks, and similar institution
7211 70-721100 Traveler accommodation and other longer-term accommodation
Traveler accommodation
72119 70-721190 Miscellaneous traveler accommodation
Other traveler accommodation
8123 80-812300 Dry-cleaning and laundry services Drycleaning and laundry services 81231 80-812310 Coin-operated laundries and dry
cleaners Coin-operated laundries and drycleaners
81232 80-812320 Dry-cleaning and laundry services, except coin-operated
Drycleaning and laundry services, except coin-operated
Changes to noncovered employment
As part of a review of unemployment insurance tax laws BLS has identified several industries that have noncovered employment that
have not been included previously. As such, BLS will now be calculating employment for those industries as well as collecting
supplemental information on them from the States. The addition of these industries will add 95,000 jobs to the cumulative noncovered
employment level. In order to avoid introducing series breaks, employment level shifts, and extensive historical revisions in the
affected industries, the additional jobs were incorporated in the Match 2011 benchmark levels and wedged back using standard
benchmark methodology.

Exhibit 13. Industries with Noncovered Employment Introduced with the 2011 Benchmark (in thousands)
NAICS Industry Code Industry Title
Noncovered
Employment
524126 Direct property and casualty insurance carriers 72 524127 Direct title insurance carriers 0 524128 Other direct insurance carriers 5 524130 Reinsurance carriers 0 524210 Insurance agencies and brokerages 11 611410 Business and secretarial schools 0 611420 Computer training 0 611430 Professional and management development training 0 611511 Cosmetology and barber schools 0 611512 Flight training 0 611513 Apprenticeship training 2 611519 Other technical and trade schools 1 611610 Fine arts schools 4
Technical changes to historical data
In addition to the normal benchmark process and revisions due to the conversion to NAICS 2012, the CES survey recalculated
historical data for some aggregate series and annual averages for hours and earnings data prior to April 2010.
Aggregate series. In previous years, changes in the industry aggregation structure that resulted from the annual sample adequacy
review had not included a reaggregation of the series using consistent aggregation rules. Aggregation procedures are described in
the CES technical notes. This year, all aggregate data series were recalculated using standard formulas. This resulted in minor
differences to not seasonally adjusted data – no more than 2,000 for employment series, 0.1 for hours series, and $0.01 for earnings
series – primarily related to rounding.

Data for these series prior to 2007 were re-seasonally adjusted. While the re-adjusted series contained considerably more historical
data than when originally adjusted, the resulting revisions affected fewer than 2% of employment, 5% of hours, and 8% of earnings
data points.
Annual averages. Annual average calculations for hours and earnings data prior to 1990 were calculated using a different formula than
has been used for the post 1990 period. The differences in formula resulted in minor differences in the calculated value. With this
change, all annual average data will use standardized calculations for the series.
Availability of revised data
LABSTAT, the BLS public database on the Internet, contains all historical employment, hours, and earnings data revised as a result of
this benchmark, including both unadjusted and seasonally adjusted data. The data can be accessed at http://www.bls.gov/ces/, the
Current Employment Statistics homepage.
Small domain model
The CES Small Domain Model (SDM) is used for industries where the sample alone is insufficient for reliable estimates. The CES
SDM is a Weighted Least Squares model with two employment inputs: (1) an estimate based on available CES sample for that series,
and (2) an ARIMA projection based on 10 years of historical QCEW data. Further background on the SDM is provided in the CES
technical notes.

There are six industries estimated by using the SDM. These industries are Lessors of nonfinancial intangible assets, Direct health and
medical insurance carriers, Tax preparation services, Other technical consulting services, Remediation services, and Recreational and
vacation camps.
Seasonal adjustment procedure
BLS uses X-12 ARIMA software developed by the U.S. Census Bureau to seasonally adjust National employment, hours, and
earnings series derived from the CES program. Individual series are seasonally adjusted using either a multiplicative or an additive
model (Exhibit 14), and seasonal adjustment factors are directly applied to the component levels. For employment, individual 3-digit
NAICS levels are seasonally adjusted, and higher level aggregates are formed by summing these components. Seasonally adjusted
totals for hours and earnings are obtained by taking weighted averages of the seasonally adjusted data for the component series.
Special model adjustments
Variable survey intervals. Beginning with the release of the 1995 benchmark, BLS refined the seasonal adjustment procedures to
control for survey interval variations, sometimes referred to as the 4- versus 5-week effect. Although the CES survey is referenced to
a consistent concept— the pay period including the 12th of each month— inconsistencies arise because there are sometimes four and
sometimes five weeks between the week including the 12th in a given pair of months. In highly seasonal industries, these variations
can be an important determinant of the magnitude of seasonal hires or layoffs that have occurred at the time the survey is taken,
thereby complicating seasonal adjustment.

Standard seasonal adjustment methodology relies heavily on the experience of the most recent three years to determine the expected
seasonal change in employment for each month of the current year. Prior to the implementation of the adjustment, the procedure did
not distinguish between 4- and 5-week survey intervals, and the accuracy of the seasonal expectation depended in large measure on
how well the current year’s survey interval corresponded with those of the previous three years. All else the same, the greatest
potential for distortion occurred when the current month being estimated had a 5-week interval but the three years preceding it were
all 4-week intervals, or conversely when the current month had a 4-week interval but the three years preceding it were all 5-week
intervals.
BLS adopted REGARIMA (regression with auto-correlated errors) modeling to identify the estimated size and significance of the
calendar effect for each published series. REGARIMA combines standard regression analysis, which measures correlation among two
or more variables, with ARIMA modeling, which describes and predicts the behavior of data series based on its own past history. For
many economic time series, including nonfarm payroll employment, observations are auto-correlated over time; that is, each month’s
value is significantly dependent on the observations that precede it. These series, therefore, usually can be successfully fit using
ARIMA models. If auto-correlated time series are modeled through regression analysis alone, the measured relationships among other
variables of interest may be distorted due to the influence of the auto-correlation. Thus, the REGARIMA technique is appropriate for
measuring relationships among variables of interest in series that exhibit auto-correlation, such as Nonfarm payroll employment.

In this application, the correlations of interest are those between employment levels in individual calendar months and the lengths of
the survey intervals for those months. The REGARIMA models evaluate the variation in employment levels attributable to eleven
separate survey interval variables, one specified for each month, except March. March is excluded because there are almost always
four weeks between the February and March surveys. Models for individual basic series are fit with the most recent ten years of data
available, the standard time span used for CES seasonal adjustment.
The REGARIMA procedure yields regression coefficients for each of the eleven months specified in the model. These coefficients
provide estimates of the strength of the relationship between employment levels and the number of weeks between surveys for the
eleven modeled months. The X-12 ARIMA software also produces diagnostic statistics that permit the assessment of the statistical
significance of the regression coefficients, and all series are reviewed for model adequacy.
Because the eleven coefficients derived from the REGARIMA models provide an estimate of the magnitude of variation in
employment levels associated with the length of the survey interval, these coefficients are used to adjust the CES data to remove the
calendar effect. These "filtered" series then are seasonally adjusted using the standard X-12 ARIMA software.
For a few series, REGARIMA models do not fit well; these series are seasonally adjusted with the X-12 software but without the
interval effect adjustment. There are several additional special effects modeled through the REGARIMA process; they are described
below.

Construction series. Beginning with the 1996 benchmark revision, BLS utilized special treatment to adjust construction industry
series. In the application of the interval effect modeling process to the construction series, there initially was difficulty in accurately
identifying and measuring the effect because of the strong influence of variable weather patterns on employment movements in the
industry. Further research allowed BLS to incorporate interval effect modeling for the construction industry by disaggregating the
construction series into its finer industry and geographic estimating cells and tightening outlier designation parameters. This allowed
a more precise identification of weather-related outliers that had masked the interval effect and clouded the seasonal adjustment
patterns in general. With these outliers removed, interval effect modeling became feasible. The result is a seasonally adjusted series
for construction that is improved because it is controlled for two potential distortions: unusual weather events and the 4- versus 5-
week effect.
Floating holidays. BLS is continuing the practice of making special adjustments for average weekly hours and average weekly
overtime series to account for the presence or absence of religious holidays in the April survey reference period and the occurrence of
Labor Day in the September reference period, back to the start date of each series.
Local government series. A special adjustment also is made in November each year to account for variations in employment due to
the presence or absence of poll workers in Local government, excluding educational services.
Refinements in hours and earnings seasonal adjustment. With the release of the 1997 benchmark, BLS implemented refinements to
the seasonal adjustment process for the hours and earnings series to correct for distortions related to the method of accounting for the

varying length of payroll periods across months. There is a significant correlation between over-the-month changes in both the
average weekly hour (AWH) and the average hourly earnings (AHE) series and the number of weekdays in a month, resulting in
noneconomic fluctuations in these two series. Both AWH and AHE show more growth in "short" months (20 or 21 weekdays) than in
"long" months (22 or 23 weekdays). The effect is stronger for the AWH than for the AHE series.
The calendar effect is traceable to response and processing errors associated with converting payroll and hours information from
sample respondents with semi-monthly or monthly pay periods to a weekly equivalent. The response error comes from sample
respondents reporting a fixed number of total hours for workers regardless of the length of the reference month, while the CES
conversion process assumes that the hours reporting will be variable. A constant level of hours reporting most likely occurs when
employees are salaried rather than paid by the hour, as employers are less likely to keep actual detailed hours records for such
employees. This causes artificial peaks in the AWH series in shorter months that are reversed in longer months.
The processing error occurs when respondents with salaried workers report hours correctly (vary them according to the length of the
month), which dictates that different conversion factors be applied to payroll and hours. The CES processing system uses the hours
conversion factor for both fields, resulting in peaks in the AHE series in short months and reversals in long months.
REGARIMA modeling is used to identify, measure, and remove the length-of-pay-period effect for seasonally adjusted average
weekly hours and average hourly earnings series. The length-of-pay-period variable proves significant for explaining AWH
movements in all the service-providing industries except Utilities. For AHE, the length-of-pay-period variable is significant for

Wholesale trade, Retail trade, Information, Financial activities, Professional and business services, and Other services. All AWH
series in the service-providing industries except Utilities have been adjusted from January 1990 forward. The AHE series for
Wholesale trade, Retail trade, Information, Financial activities, Professional and business services, and Other services have been
adjusted from January 1990 forward as well. For this reason, calculations of over-the-year change in the establishment hours and
earnings series should use seasonally adjusted data.
The series to which the length-of-pay-period adjustment is applied are not subject to the 4- versus 5-week adjustment, as the modeling
cannot support the number of variables that would be required in the regression equation to make both adjustments.
Seasonal adjustment of all employee hours and earning series
The X-12 ARIMA software requires at least five years of data to adjust for variation due to the calendar effects (4- vs. 5-week, 10- vs.
11-day). Previously, CES had used a special procedure (https://www.bls.gov/ces/ces_aeppsa.pdf) to seasonally adjust these short series
with less than five years of history. Now, CES has five full years of history for the new all employee hours and earnings series,
allowing it to begin seasonal adjustment of the all employee hours and earnings series to incorporate the special model adjustments
described above. This year, CES will replace the entire 70 months of seasonally adjusted all employee hours and earnings data,
ensuring all data is adjusted using the same methodology.

Exhibit 14. Model specifications
Seasonal Adjustment – AE NAICS Tabcode Tabcode title Mode 4/5 week
adj
Other adj
1011330000 Logging MULT X 1021100000 Oil and gas extraction MULT X 1021200000 Mining, except oil and gas - X Indirect1 1021210000 Coal mining MULT X 1021300000 Support activities for mining MULT X 2023610000 Residential building - X Indirect 2023620000 Nonresidential building - X Indirect 2023700000 Heavy and civil engineering construction ADD X 2023800000 Specialty trade contractors - X Indirect 2023800100 Residential specialty trade contractors MULT X Raked2 2023800200 Nonresidential specialty trade contractors ADD X Raked 3132100000 Wood products ADD X 3132700000 Nonmetallic mineral products ADD X 3133100000 Primary metals ADD X 3133200000 Fabricated metal products ADD X 3133300000 Machinery MULT X 3133400000 Computer and electronic products - X Indirect 3133410000 Computer and peripheral equipment MULT X 3133420000 Communications equipment MULT X 3133440000 Semiconductors and electronic components MULT X 3133450000 Electronic instruments MULT X 3133500000 Electrical equipment and appliances MULT X 3133600000 Transportation equipment ADD
3133600100 Motor vehicles and parts ADD
3133700000 Furniture and related products ADD X 3133900000 Miscellaneous manufacturing MULT X 3231100000 Food manufacturing MULT X 3231200000 Beverages and tobacco products MULT X 3231300000 Textile mills MULT X 3231400000 Textile product mills MULT X

3231500000 Apparel MULT X 3231600000 Leather and allied products ADD X 3232200000 Paper and paper products MULT X 3232300000 Printing and related support activities MULT X 3232400000 Petroleum and coal products ADD X 3232500000 Chemicals MULT X 3232600000 Plastics and rubber products ADD X 4142300000 Durable goods MULT X 4142400000 Nondurable goods MULT X 4142500000 Electronic markets and agents and brokers MULT X 4244100000 Motor vehicle and parts dealers - X Indirect 4244110000 Automobile dealers ADD X 4244200000 Furniture and home furnishings stores MULT X 4244300000 Electronics and appliance stores MULT X 4244400000 Building material and garden supply stores MULT X 4244500000 Food and beverage stores MULT X 4244600000 Health and personal care stores MULT X 4244700000 Gasoline stations MULT X 4244800000 Clothing and clothing accessories stores MULT X 4245100000 Sporting goods, hobby, book, and music stores MULT X 4245200000 General merchandise stores - X Indirect 4245210000 Department stores MULT X 4245300000 Miscellaneous store retailers MULT X 4245400000 Nonstore retailers MULT X 4348100000 Air transportation MULT X 4348200000 Rail transportation MULT X 4348300000 Water transportation ADD X 4348400000 Truck transportation ADD X 4348500000 Transit and ground passenger transportation ADD
4348600000 Pipeline transportation MULT X 4348700000 Scenic and sightseeing transportation MULT X 4348800000 Support activities for transportation MULT X 4349200000 Couriers and messengers MULT X 4349300000 Warehousing and storage ADD X

4422000000 Utilities MULT X 5051100000 Publishing industries, except Internet MULT X 5051200000 Motion picture and sound recording industries MULT X 5051500000 Broadcasting, except Internet MULT X 5051700000 Telecommunications MULT X 5051800000 Data processing, hosting and related services MULT X 5051900000 Other information services MULT X 5552100000 Monetary authorities - central bank MULT X 5552200000 Credit intermediation and related activities - X Indirect 5552210000 Depository credit intermediation MULT X 5552211000 Commercial banking MULT X 5552300000 Securities, commodity contracts, investments MULT X 5552400000 Insurance carriers and related activities MULT X 5552500000 Funds, trusts, and other financial vehicles ADD X 5553100000 Real estate MULT X 5553200000 Rental and leasing services ADD X 5553300000 Lessors of nonfinancial intangible assets MULT X 6054000000 Professional and technical services - X Indirect 6054110000 Legal services MULT X 6054120000 Accounting and bookkeeping services ADD X 6054130000 Architectural and engineering services MULT X 6054150000 Computer systems design and related services ADD X 6054160000 Management and technical consulting services MULT X 6055000000 Management of companies and enterprises ADD X 6056100000 Administrative and support services - X Indirect 6056130000 Employment services ADD X 6056132000 Temporary help services ADD X 6056140000 Business support services ADD X 6056170000 Services to buildings and dwellings MULT X 6056200000 Waste management and remediation services ADD X 6561000000 Educational services ADD X 6562100000 Ambulatory health care services - X Indirect 6562110000 Offices of physicians MULT X 6562140000 Outpatient care centers MULT X

6562160000 Home health care services ADD X 6562200000 Hospitals ADD X 6562300000 Nursing and residential care facilities - X Indirect 6562310000 Nursing care facilities MULT X 6562400000 Social assistance - X Indirect 6562440000 Child day care services MULT X 7071100000 Performing arts and spectator sports MULT X 7071200000 Museums, historical sites, zoos, and parks MULT X 7071300000 Amusements, gambling, and recreation MULT X 7072100000 Accommodation MULT X 7072200000 Food services and drinking places MULT X 8081100000 Repair and maintenance MULT X 8081200000 Personal and laundry services MULT X 8081300000 Membership associations and organizations MULT
9091100000 Federal, except U.S. Postal Service MULT X 9091912000 U.S. Postal Service MULT X 9092161100 State government education ADD X 9092200000 State government, excluding education MULT X 9093161100 Local government education ADD X
9093200000 Local government, excluding education MULT X Election
adjustment3
Seasonal Adjustment – AE AWH NAICS Tabcode Tabcode title Mode 4/5 week
adj
10/11 day
adj
Easter/Labor
Day adj
1000000000 Mining and logging MULT X
X 2000000000 Construction MULT X
X
3132100000 Wood products MULT X
X 3132700000 Nonmetallic mineral products ADD X
X
3133100000 Primary metals MULT X
X 3133200000 Fabricated metal products MULT X
X
3133300000 Machinery MULT X
X 3133400000 Computer and electronic products MULT
X X
3133500000 Electrical equipment and appliances MULT X
X

3133600000 Transportation equipment MULT X
X 3133600100 Motor vehicles and parts ADD X
X
3133700000 Furniture and related products MULT X
X 3133900000 Miscellaneous manufacturing MULT X
X
3231100000 Food manufacturing MULT X
X 3231200000 Beverages and tobacco products MULT X
X
3231300000 Textile mills MULT X
X 3231400000 Textile product mills MULT X
X
3231500000 Apparel MULT X
X 3231600000 Leather and allied products MULT X
X
3232200000 Paper and paper products MULT X
X 3232300000 Printing and related support activities MULT X
X
3232400000 Petroleum and coal products ADD X
X 3232500000 Chemicals MULT X
3232600000 Plastics and rubber products MULT X
X 4142000000 Wholesale trade MULT
X X
4200000000 Retail trade MULT
X 4300000000 Transportation and warehousing MULT
X X
4422000000 Utilities MULT X 5000000000 Information MULT
X
5500000000 Financial activities MULT
X 6000000000 Professional and business services MULT
X X
6500000000 Education and health services MULT
X 7000000000 Leisure and hospitality MULT
X
8000000000 Other services MULT
X X
Seasonal Adjustment – AE AHE NAICS Tabcode Tabcode title Mode 4/5 week adj 10/11 day adj
1000000000 Mining and logging ADD X 2000000000 Construction ADD X 3100000000 Durable goods ADD X 3200000000 Nondurable goods ADD X 4142000000 Wholesale trade MULT
X
4200000000 Retail trade MULT
X

4300000000 Transportation and warehousing MULT
X 4422000000 Utilities ADD X
5000000000 Information MULT
X 5500000000 Financial activities ADD
X
6000000000 Professional and business services ADD
X 6500000000 Education and health services ADD X
7000000000 Leisure and hospitality MULT X 8000000000 Other services MULT
X
Seasonal Adjustment – AE AOH
NAICS Tabcode Tabcode title Mode 4/5 week adj 10/11 day adj Easter/Labor Day adj
3100000000 Durable goods ADD X X 3200000000 Nondurable goods MULT X X
Seasonal Adjustment – PE NAICS Tabcode Tabcode title Mode 4/5 week adj Other adj
1000000000 Mining and logging MULT X 2000000000 Construction ADD X 3132100000 Wood products ADD X 3132700000 Nonmetallic mineral products ADD X 3133100000 Primary metals ADD X 3133200000 Fabricated metal products ADD X 3133300000 Machinery MULT X 3133400000 Computer and electronic products MULT X 3133500000 Electrical equipment and appliances MULT X 3133600000 Transportation equipment ADD
3133600100 Motor vehicles and parts ADD
3133700000 Furniture and related products ADD X 3133900000 Miscellaneous manufacturing MULT X 3231100000 Food manufacturing MULT X 3231200000 Beverages and tobacco products MULT X 3231300000 Textile mills MULT X 3231400000 Textile product mills MULT X

3231500000 Apparel MULT X 3231600000 Leather and allied products MULT X 3232200000 Paper and paper products MULT X 3232300000 Printing and related support activities MULT X 3232400000 Petroleum and coal products ADD X 3232500000 Chemicals MULT X 3232600000 Plastics and rubber products ADD X 4142000000 Wholesale trade MULT X 4200000000 Retail trade MULT X 4300000000 Transportation and warehousing ADD X 4422000000 Utilities MULT X 5000000000 Information MULT X 5500000000 Financial activities MULT X 6000000000 Professional and business services MULT X 6500000000 Education and health services ADD X 7000000000 Leisure and hospitality MULT X 8000000000 Other services MULT X
Seasonal Adjustment – PE AWH
NAICS Tabcode Tabcode title Mode 4/5 week
adj
10/11 day
adj
Easter/Labor
Day adj
1000000000 Mining and logging MULT X
X 2000000000 Construction ADD X
X
3132100000 Wood products MULT X
X 3132700000 Nonmetallic mineral products ADD X
X
3133100000 Primary metals MULT X
X 3133200000 Fabricated metal products MULT X
X
3133300000 Machinery ADD X
X 3133400000 Computer and electronic products MULT X
X
3133500000 Electrical equipment and appliances MULT X
X 3133600000 Transportation equipment MULT X
X
3133600100 Motor vehicles and parts ADD X
X 3133700000 Furniture and related products MULT X
X
3133900000 Miscellaneous manufacturing MULT X
X

3231100000 Food manufacturing MULT X
X 3231200000 Beverages and tobacco products ADD X
X
3231300000 Textile mills ADD X
X 3231400000 Textile product mills MULT X
X
3231500000 Apparel MULT X
X 3231600000 Leather and allied products ADD X
X
3232200000 Paper and paper products MULT X
X 3232300000 Printing and related support activities MULT X
X
3232400000 Petroleum and coal products MULT X
X 3232500000 Chemicals MULT X
3232600000 Plastics and rubber products MULT X
X 4142000000 Wholesale trade MULT
X X
4200000000 Retail trade MULT
X 4300000000 Transportation and warehousing MULT
X X
4422000000 Utilities MULT X 5000000000 Information MULT
X
5500000000 Financial activities MULT
X 6000000000 Professional and business services MULT
X X
6500000000 Education and health services MULT
X 7000000000 Leisure and hospitality MULT
X
8000000000 Other services MULT
X X
Seasonal Adjustment – PE AHE NAICS Tabcode Tabcode title Mode 4/5 week adj 10/11 day adj
1000000000 Mining and logging MULT X 2000000000 Construction MULT X 3100000000 Durable goods MULT X 3200000000 Nondurable goods MULT X 4142000000 Wholesale trade MULT
X
4200000000 Retail trade MULT
X 4300000000 Transportation and warehousing MULT
X
4422000000 Utilities MULT X 5000000000 Information MULT
X
5500000000 Financial activities MULT
X

6000000000 Professional and business services MULT
X 6500000000 Education and health services ADD X
7000000000 Leisure and hospitality ADD X 8000000000 Other services MULT
X
Seasonal Adjustment – PE AOH
NAICS Tabcode Tabcode title Mode 4/5 week
adj
10/11 day
adj
Easter/Labor
Day adj
3100000000 Durable goods MULT X X 3200000000 Nondurable goods ADD X X
Seasonal Adjustment – WE NAICS Tabcode Tabcode Title Mode 4/5 week adj Other adj
1000000000 Mining and logging MULT X 1021000000 Mining MULT X 2000000000 Construction ADD X 3100000000 Durable goods MULT X 3200000000 Nondurable goods MULT X 4142000000 Wholesale trade MULT X 4200000000 Retail trade MULT X 4300000000 Transportation and warehousing ADD X 4422000000 Utilities MULT X 5000000000 Information MULT X 5552000000 Finance and insurance MULT X 5553000000 Real estate and rental and leasing MULT X 6054000000 Professional and technical services ADD X 6055000000 Management of companies and enterprises ADD X 6056000000 Administrative and waste services ADD X 6561000000 Educational services ADD X 6562000000 Health care and social assistance ADD X 7071000000 Arts, entertainment, and recreation MULT X

7072000000 Accommodation and food services MULT X 8000000000 Other services MULT X 9091000000 Federal MULT X 9092000000 State government ADD X 9093000000 Local government ADD X Election adjustment3 1 Seasonal adjustment occurs at the lowest available industry level. 2 Residential and nonresidential specialty trade estimates are raked to the specialty trade estimates to ensure consistency. 3 Special adjustment for the presence/absence of poll workers in local government.
Last Modified Date: February 3, 2012