Embed Size (px)
Citation preview

Report No. 332-KO
Current Economic Position FILE L CPYand Prospects of theRepublic of Korea(In Two Volumes)Vofume 11Statistical AppendixFebruary 20, 1974East Asia and Pacific DepartmentAsia RegionNot for Public Use
Document of the International Bank f6r Reconstruction and DevelopmentInternational Development Associationi
This report was prepared for official use only by the Bank Group. It may nolbe published, quoted or cited without Bank Group authorization. The Bank Group doesnot accept responsibility for the accuracy or ccimpleteness of the report,
Pub
lic D
iscl
osur
e A
utho
rized
Pub
lic D
iscl
osur
e A
utho
rized
Pub
lic D
iscl
osur
e A
utho
rized
Pub
lic D
iscl
osur
e A
utho
rized

CURRENCY EQUIVALENTS
US$1.00 = Won 400.00
Won 1.00 = US$0.0025
Won 1 million = US$2,500
FISCAL YEAR
The Fiscal Year is the Calendar Year,
January to December.
This report is based on the findings of anEconomic Mission which visited the Republ:Lcof Korea from September 3 to October 3, 1973.The Mi.ssion was composed of:
Parvrez Hasan Chief of MissionBahinan Abadian General EconomistGeorge Kalu General EconomistRaymond Christensen Agricultural EconomistGuenter Reif General EconomistJames Langley Industrial Economist (Consultant)Nestor Santiago Young ProfessionalAzueena Zorrilla Secretary


STATISTICAL APPENDIX
TABLE OF CONTENTS
TableNumber Title
Selected Econc,mic Indicators
I. POPULATION AND EMPLOYMENT
1.1 Population Trends, 1960-721.2 Population and Age Distribution, 1955-811.3 Labor Force and Employment, 1963-721.4 Trends in Population and Employment, 1960-811.5 Growth of Population and Employment by Industry, 1963-811.6 Employment-Income Elasticity By Industry, 1963-72, 1972-811.7 InternationasL Comparison of Labor Force.Participation Rates1.8 Productivity by Industry, Current Market Prices, 1963-721.9 Productivity Increases, Constant Factor Cost, 1964-72l.1O Aggregate Trends in Sectoral Output and Employment, 1963-72
II, NATIONAL INCOME ACCOUNTS
2.1 Expenditure on GNP, Current and Constant Market Prices, 1965-732.2 Expenditure on Gross National Product, Current and Constant Market
Prices, 1965-73 (Percentages)2.3 Industrial Origin of GNP, Current and Constant Market Prices, 1965-732.4 Industrial Origin of Gross National Product, Current and Constant
Market Prices, 1965-73 (Percentages)2.5 Distribution of the National Income, 1965-722.6 Distribution of the National Income, 1965-722.7 Gross Domestic Capital Formation - By Sectors, 1965-732.8 Gross Domestic Fixed Capital Formation by Sectors, 1965-73 (Percentages)2.9 Gross Domestic Capital Formation and Its Finance, 1965-732.10. Gross Domestic Capital Formation and Its Finance (as percent of GNP),
1965-732.11 Total Available Resources and Disposition, 1970-732.12 Gross National Savings at Current Market Prices, 1953-722.13 The Rate of Gross Domestic Savings as Percent of GDP, 1953-722.14 Saving Ratios at Current and Constant Prices, 1954-722.15 Savings of Households and Private Non-Profit Institutions, 1960-722.16 Savings Plan, 1973-812.17 Sectoral Marginal Capital-Output Ratio, By Sectors and by Plan PeriodS
2
Tab eNumber Title
COUNTRY DATA
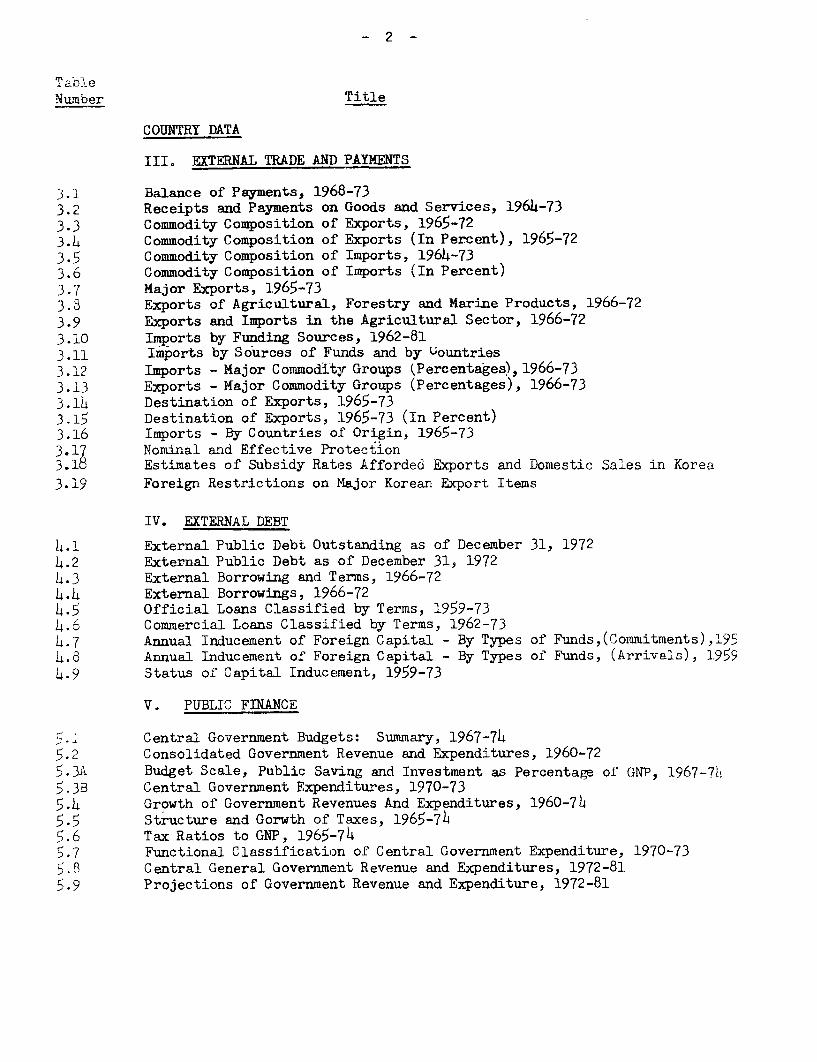
III. EXTERNAL TRADE AND PAYMENTS
3.1 Balance of Payments, 1968-733.2 Receipts and Payments on Goods and Services, 1964-733.3 Commodity Composition of Exports, 1965-723.X Commodity Composition of Exports (In Percent), 1965-723.5 Commodity Composition of Imports, 1964-733.6 Commodity Composition of Imports (In Percent)3.7 Major Exports, 1965-733.8 Exports of Agricultural, Forestry and Marine Products, 1966-723.9 Exports and Imports in the Agricultural Sector, 1966-723.10 Imports by Funding Sources, 1962-813.11 Imports by Sources of Funds and by Uountries3.12 Imports - Major Commodity Groups (Percentages), 1966-733.13 Exports - Major Commodity Groups (Percentages), 1966-733.14 Destination of Exports, 1965-733.15 Destination of Exports, 1965-73 (In Percent)3.16 Imports - By Countries of Origin, 1965-733.17 Nominal and Effective Protection3.18 Estimates of Subsidy Rates Afforded Exports and Domestic Sales in Korea
3.19 Foreign Restrictions on Major Korean Export Items
IV. EXTERNAL DEBT
4.1 External Public Debt Outstanding as of December 31, 19724.2 External Public Debt as of December 31, 19724.3 External Borrowing and Terms, 1966-724.4 External Borrowings, 1966-724.5 Official Loans Classified by Terms, 1959-734.6 Commercial Loans Classified by Terms, 1962-734.7 Annual Inducement of Foreign Capital - By Types of Funds,(Commitments),1954.8 Annual Inducement of Foreign Capital - By Types of Funds, (Arrivals), 195S4.9 Status of Capital Inducement, 1959-73
V. PUBLIC FINANCE
Central Government Budgets: Summary, 1967-745.2 Consolidated Government Revenue and Expenditures, 1960-725.3A Budget Scale, Public Saving and Investment as Percentage of GNP, 1967-715.3B Central Government Expenditures, 1970-735.4 Growth of Government Revenues And Expenditures, 1960-745.5 Structure and Gorwth of Taxes, 1965-7b5.6 Tax Ratios to GNP, 1965-745.7 Functional Classification of Central Government Expenditure, 1970-735.R3 Central General Government Revenue and Expenditures, 1972-815.9 Projections of Government Revenue and Expenditure, 1972-81

-3-
TableNumber Title
COUNTRY DATA
VI. MONEY AND CREDIT
6.1 Money Supply and Principal Factors Affecting It, 1965-736.2 Deposits and Credits of Banking [nstitutions, 1965-736.3 Outstanding Loans and Discounts of Banking Institutions by
Industry, 1965-726.4 Selected Interest Rates on Loans and Discounts of the Bank of
Korea, 19655-736.5 Interest Rates - Deposit Interest Rates of Banking Institutions,
1965-726.6 Selected Interest Rates on Loans and Discounts of Special
Institutions, 1965-736.7 Interest Ra-t-.es on Loans and Discounts of the Korean Development
Bank, 196!5-726.8 Consolidated Position of Banks, 1958-73
VII. AGRICULTURE AND FISHERIES
7.1 Production of Agricultural Crops, 1965-737.2 Yield Per Heectare by Major Crops, 1965-737.3 Utilization of Cultivated Land, 1965-737.4 Paddy Area Classified by Irrigation Facilities, 1965-727.5 Number of Livestock and Output of Livestock Products, 1965-737.6 Number ani Tonnage of Fishing Vessels, 1965-727.7 Financial Status of National Agricultural Cooperatives Federation and
Its Network, 1966-727.8 Loans Extended by National Agriculture Cooperative Federation, 1967-727.9 Total Chemical Supply And Use, 1967-72
VIII. INDUSTRY
8.1 Growth of Industrial Production in Korea, 1967-738.2 Composition and Growth of the Manufacturing Sector, 1953-728.3 Capacity Utilization in Major Industry Groups, 1970-723.h Industrial Finance - Sources and Applications of Funds, 1966-728.5 Industrial Finance - Balance Sheets Structure, 1965-728.6 The Structure of Korea Manufacturing Enterprises, 1970-738.7 Investment by Industry - Actual and Long-term Projection8.8 Foreign Inve.stment (1962 - June 30, 1973)8.9 Imports of Raw Materials for Manufactures, 1966-738.10 Imports of Raw Materials for Manufactures, 1966-73 (Percentages)8.11 Structure of Mining and Manufacturing, 19718.12 The Growth of' the Manufacturing Sector, 1960-818.13 Index of Industrial Production8.14 Output of Iron and Steel, 1968-728.15 Korean Petroleum Refinery Products8.16 Pattern of Consumption of Electric Power in Korea
TableNumber Title
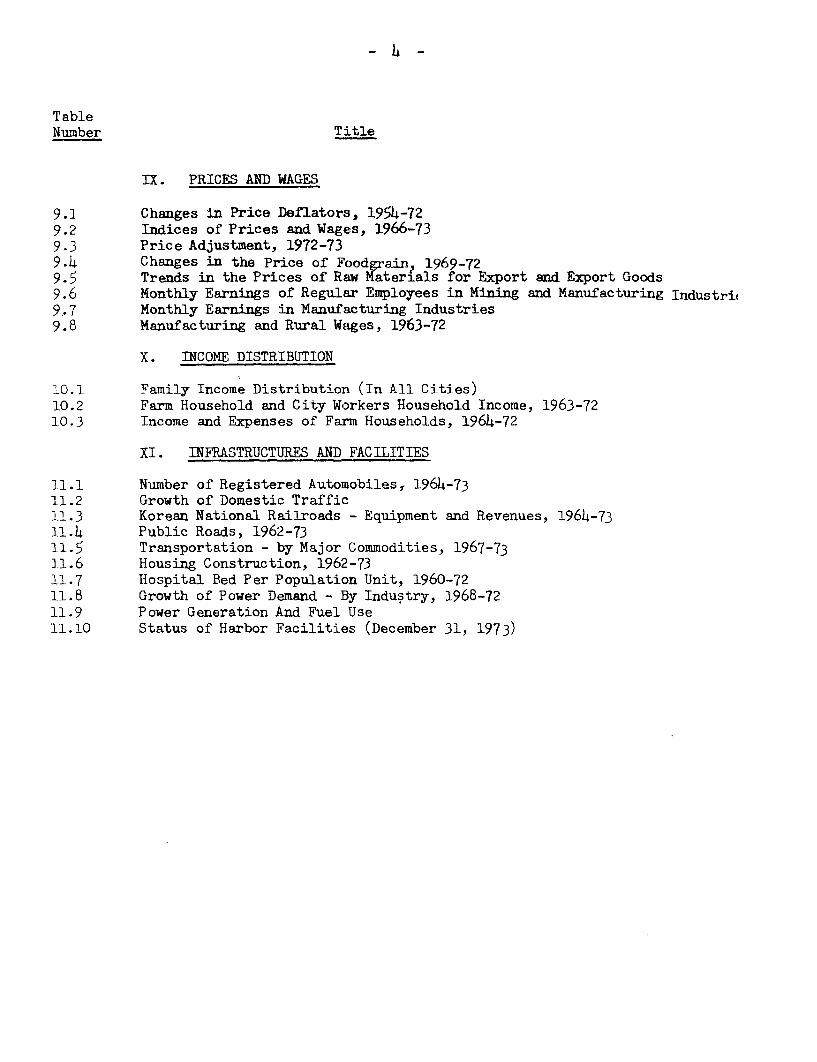
IX. PRICES AND WAGES
9.1 Changes in Price Deflators, 1954-729.2 Indices of Prices and Wages, 1966-739.3 Price Adjustment, 1972-739.4 Changes in the Price of Foodgrain, 1969-72
Trends in the Prices of Raw laterials for Export and Export Goods9.6 Monthly Earnings of Regular Employees in Mining and Manufacturing Industrio9.7 Monthly Earnings in Manufacturing Industries9.8 Manufacturing and Rural Wages, 1963-72
X. INCOME DISTRIBUTION
10.1 Family Income Distribution (In All Cities)10.2 Farm Household and City Workers Household Income, 1963-7210.3 Income and Expenses of Farm Households, 1964-72
XI. INFRASTRUCTURES AND FACILITIES
11.1 Number of Registered Automobiles, 1964-7311.2 Growth of Domestic Traffic11.3 Korean National Railroads - Equipment and Revenues, 196h-73i1.4 Public Roads, 1962-7311.5 Transportation - by Major Commodities, 1967-7311.6 Housing Construction, 1962-7311.7 Hospital Bed Per Population Unit, 1960-7211.8 Growth of Power Demand - By Industry, 1968-7211.9 Power Generation And Fuel Use11.10 Status of Harbor Facilities (December 31, 1973)
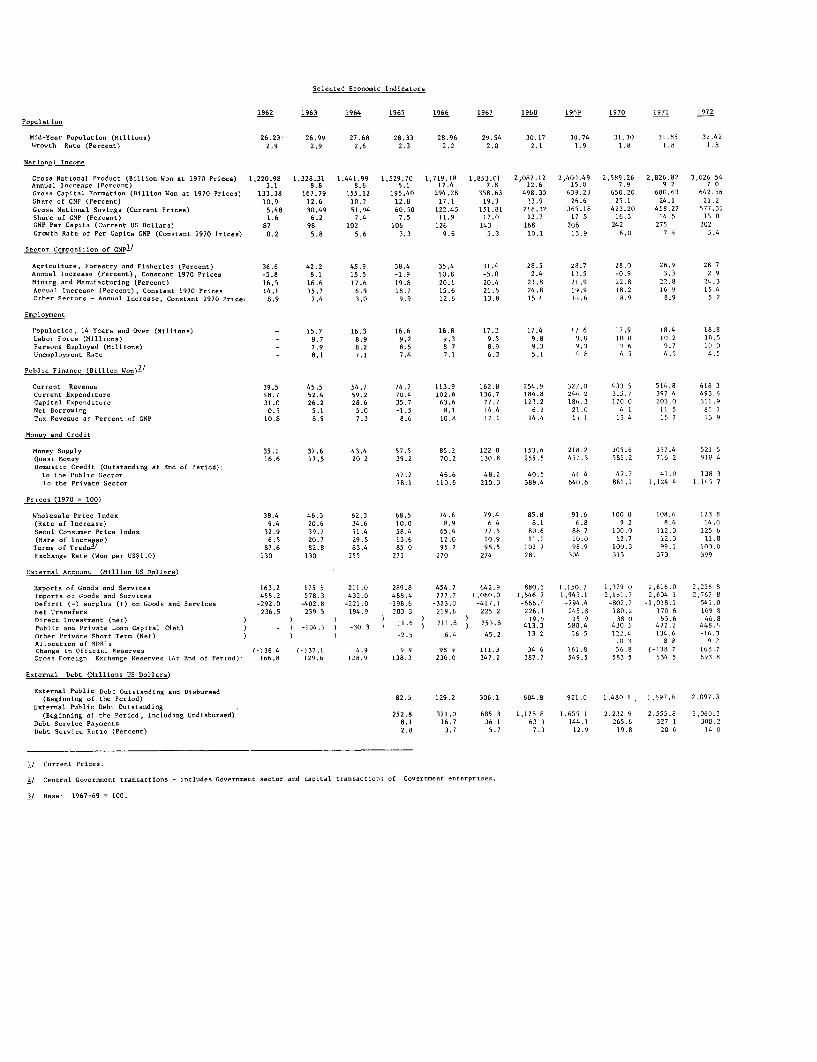
Selected Economic Indirat-r
1962 1963 1964 1965 1966 1967 1969 196-9 1970 1971 1972
Mid-Year Pepolasine (mi111..,) 26.23 ~ 26.99 27.68 28.33 29.96 29.54 30.17 301.74 31.30 31.85 32,42Groth Rate (Percet) 2.9 2.9 2.6 2.3 2.2 2.0 2.1 1.9 1.8 1.8 1.8
Nati-lai Incen
Cress Nati ecal Pr-dect (Billiten Wee at 1970 Prince) 1,220.98 1,328.31 1,441.99 1,529.20 1,719.69 1,953.01 2,087.12 2,400.49 2,589.26 2,926.82 3,026 54Anneal Incras (Percen t) 3.1 8.8 8.6 6.1 12.4 7.8 12.6 15.0 2.9 9 2 7 7Gross Capital PFrintins (Billies Wne at 1970 Price) 132.38 167.79 155.12 195.40 294.28 358.63 498.32 629.23 650.20 680.63 642.56Share of GNP (Percent) 10.9 12.6 10.2 12.8 12.1 19.3 23.9 265.6 25.1 24.1 21.2GenesNotional~ ~ Sotoge (Cerrent Price) 5.48 30.49 21.94 60.50 122.45 151.81 218.32 365.18 423.20 458.22 577.21Share of GP (Percet) 1.6 6.2 7.4 7.5 11.9 12.0 13.7 17 5 16.5 14.5 150GNP PerCapita (torrent US Dollars) 87 98 102 156 126 143 168 208 242 275 302Ir_tth Rate of Per Capita IMP (Constant 1970 Prices) 0.2 1.8 5.6 3.3 9.6 5.3 10. 13.9 6.0 7 4 5.4
Sector Conpesiti-n of GNP1'
Agriceltane, Prestry and Plhberies (Peec-t). 36.6 42.2 45.9 28.4 35.4 21.4 29.5 23.7 28.0 28.9 28 7Annea"I roae ..(P _eret) Constat 19 75 Pice -5.8 8.1 15.5 -1.9 10.8 -5.0 2.4 8' 5 -S 9 3.3 2 9Mi_cg end Ma..afactring (Percet) 16.5 16.6 17.6 19.8 201i 20.4 21.8 21.9 22.9 22.8 74.5.nnea lonre-e (Percet), Constat 1970 Pric 14.1 15.7 6.9 18.7 15.6 21.6 24.8 19. 9 18.2 16 9 15.4
Other Snot-n- An...l Iocras- C terst 1978 Pr-e, 8.9 7.4 3.0 9.9 12.6 13.8 15 4 I.,..6 8.9 8.9 5 2
PopeSatIns, 14 Years and Ove (Million) - 15.7 16.3 16.6 16.8 17.7 17.4 17 6 17.9 18.4 18.8LAbor Perce (MIli.oos) - 8.7 8.9 9.2 9.3 9.5 9.8 1.8 18 0 10.2 10.5Porsano Replynd (Millions) - 7.9 8.2 8.5 8 7 8.9 9.2 3.3 9 6 9. 11 11UoespleynntRae - 8.1 7.1 7.4 7.1 6.7 5.1 -.8 4.5 4.5 4.7
Poblec Pleaser (Billion Won521
Cerr-t Reve.. 59.5 45.5 54.7 74.2 113.9 162.8 254.9 32/1.0 433 5 514.8 418 3Cornne Eopendstser 48.7 52.4 59.2 70.4 102.8 136.7 184..8 74' .2 3712.7 397.4 492.46Capitol Enp-edit-ro 31.0 26.2 28.6 35.7 63.6 77.7 173.2 184.3 170 0 203.0 311.9
Net B."rootoR 8.5 5.1 5.0 -1.5 8.1 14.4 6.2 20.0 4 1 11 5 81 1Tc. R-even -c P- e...t f GOP 10.8 8.9 7.3 8.6 10.8 17.1 14.4 15 1 15 4 15 7 13 9
Mony and CredIt
Mcney Sepply 35.1 22.6 43.4 52.5 85.2 122 5 153.6 2111.2 305.6 352.4 521 5QeesstP_ony 16.6 12.5 20 2 29.2 70.2 130.8 255.5 4534.5 385.2 716 2 918 4D -ost- Credit (Oct.tandig at End of Pnriod):To the Pehbs- Sector 47.2 46.6 48.2 40.5 4fi 4 47.7 41.0 138 3To the PrivateSector 78.1 118.6 210.3 589.4 6410.6 861.1 1,174 4 1,145 7
Prscr (1970 = 100)
Wholesal Prino Ioden 38.4 46.3 62.3 68.5 24.6 79.6 85.8 91.6 150 0 108.4 123 8(SRet of Ices)9.4 20.6 34.6 10.0 8.9 6 4 8.1 (.8 9 7 0.4 14.0Senol Ce-ene Price lodno 32.9 39.7 51.4 58.4 65.4 77.5 80.6 81, 7 111.0 112.2 125 6(aR.e of 1...cre~y) 6.5 20.7 29.5 13.6 12.0 10.9 11.2 10.0 12.7 62.3 01.8Tressof Trade- 87.6 82.8 82.4 85 0 95.2 98.5 102 7 90.9 100.3 99.1 100.0Po-hange Rate (Wc- per US$1.0) 130 130 255 271 270 274 281 300 313 372 399
Enterna Arceent (Mitlli.. US Dollars)
IEop-rt of Geeds cnd Serice 162.2 175 5 211.0 289.8 454.7 642.8 880.2 1,150.7 1,379 0 1,616.0 2.226 8Sep_rts of Goods and Servce 455.2 578.2 432.0 488.4 777.7 1,060.0 1,546 7 1,945.1 2,181.7 2,634 8 2,747 0De ficit (-7 s-rpl-n G+o oeds and Service -292.0 -402.8 -721.0 -198.6 -323.0 -417.1 -666.4 -794.4 -887.7 -1,018.1 -541.0NeIt.. Trnsers_ 236.5 259 5 194.9 703 3 719.6 223 2 226.1 245.8 101.-, 174 8 166 1Dir,ctI netnt nc) 5 7 71196 15 9 38 0 55.6 44.8
Pob lie and Prie-te Lea Cepital (Not) ) - 1-104.1 I) -38 3 116 218 738 4139.3 5.4 43 5 472.7 448.6Other Private Ph-rt Ter (Not) ) 12.5 6.4 45.2 13 2 56 5 122.4 134.6 -16.3All ecatcon of 'DRe' 1 3 0 8 5 7Chance in Of.icia IR-eseve 1-38 4 1-)37.1 4.9 9 9 90 9 111.3 34 4 161 .8 56.0 (-138 7 168.7Gros Fori gn Eochaie Re-ev- (At isd ot Ported) 166.8 129.6 178.9 138.3 236.0 347.7 387.7 549.5 203 5 534 5 49 3 0
Roter-a Dnbt fMitli-os 21 Dollar)
Enter-a Psbllc Debo Octteosditg and Disber-d(Degientog of ter P-riad) 82.5 129.2 356.1 684.8 821.4 1,480 1 , 1,697.6 7,097.3
Ecte---oI Pebll SDeht Gotetending(Degi-rleg of thr Perind, Inrlodiog Ordishb-ed) 252.8 371.0 685 3 1,178 8 1,655 1 7,232 9 2,555.0 3,260.3
Debt Service Payments 8.1 16.7 36 1 63 3 144.1 265.6 327 1 308.2Debt Sorvion Ratio (Percent) 2.8 3.7 5.7 7.3 17.9 19.8 20 6 14 0
1/ torren t Price.
2/ Central leverreet transac.tions - s-oldes Gno-e-et sette cod capital tra...act--ne of G-v -et nent-p-sse.
3/ Bose' 1967-69 = 150.

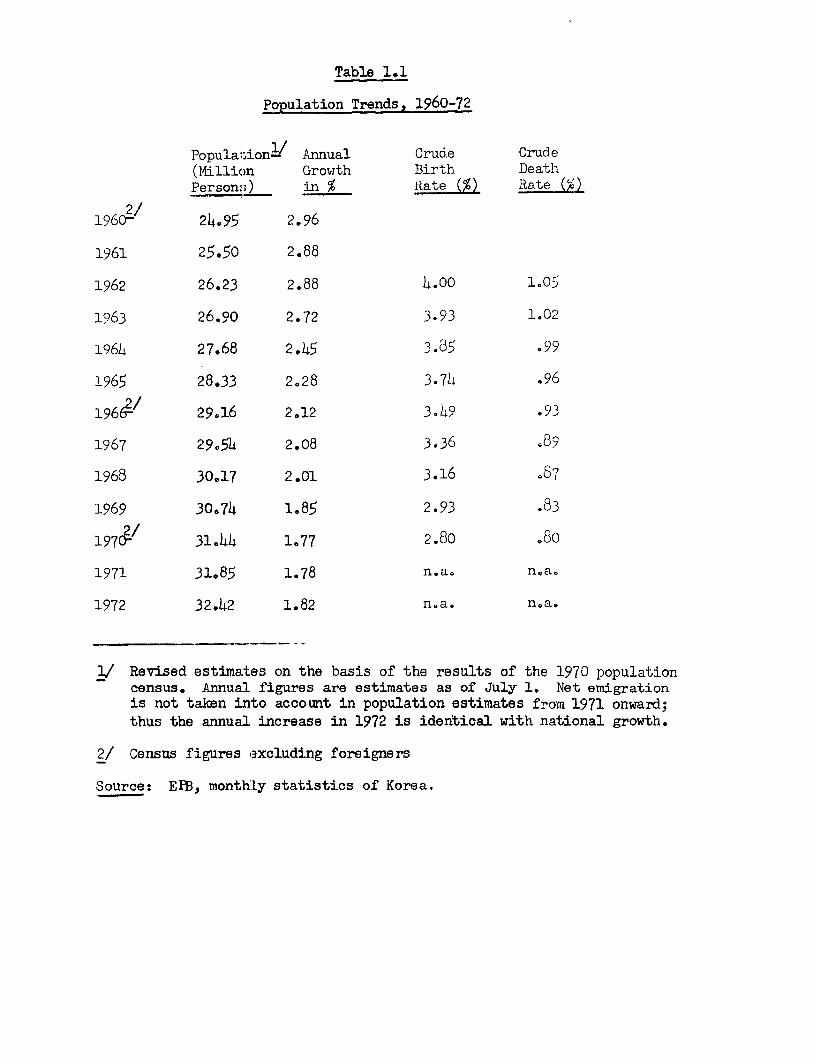
Table 1.1
Population Trends, 1960-72
Popula1;ionhl Annual Crude Crude(Million Growth Birth DeathPerson<;) in % Rate M Rate (a
162/ 24.95 2.96
1961 25.50 2.88
1962 26.23 2.88 4.00 1.05
1963 26.9o 2.72 3.93 1.02
1964 27.68 2.45 3.85 .99
1965 28.33 2.28 3.74 .96
196'/ 29.16 2,12 3.49 .93
1967 29-54 2.08 3.36 .89
1968 30017 2.01 3,16 ,8 7
1969 30e74 1.85 2.93 .83
197CP 31.44 1.77 2.80 .80
1971 31,85 1.78 n.a. n.a.
1972 32.42 1.82 n.a. nea.
1/ Revised estimates on the basis of the results of the 1970 populationcensus. Annual figures are estimates as of July 1. Net emigrationis not taken into account in population estimates from 1971 onward;thus the annual increase in 1972 is identical with national growth.
2/ Census figures excluding foreigners
Source: EPB, month:Ly statistics of Korea.
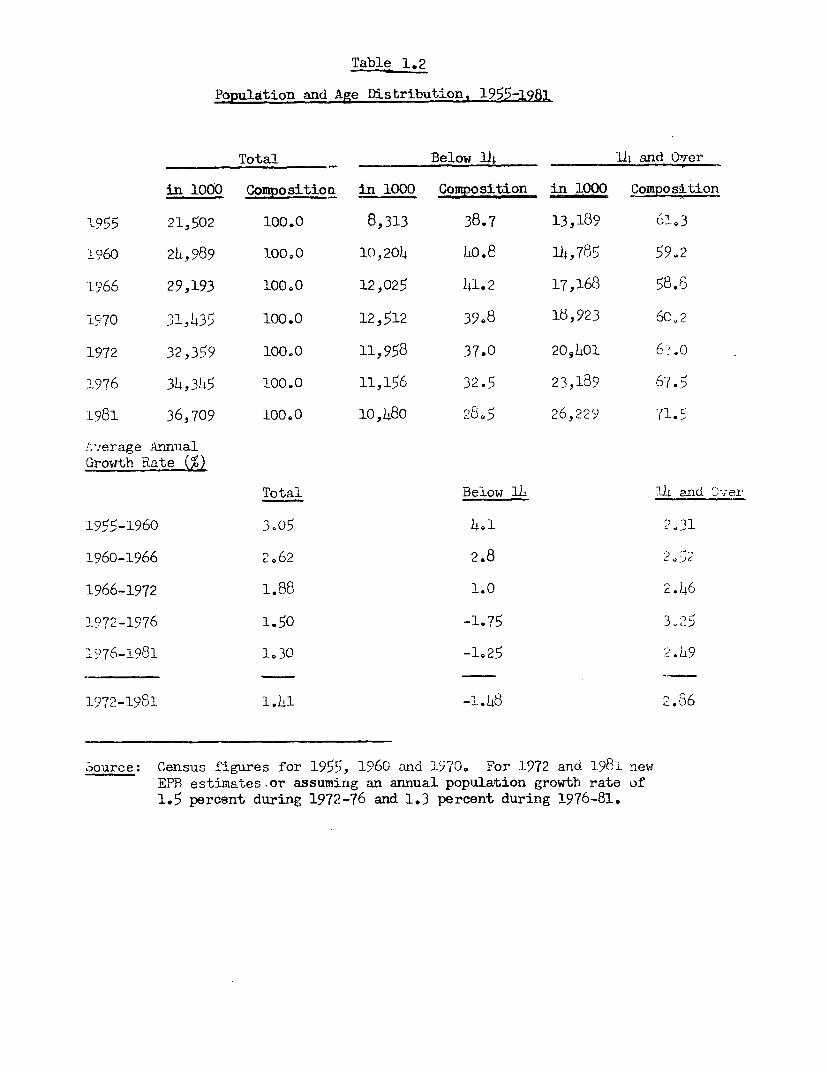
Table 1.2
Population and Age Distribution, 1955-1981
Total Below 14 14 and Over
in 1000 Composition in 1000 Composition in 1000 Composition
l955 21,502 100.0 8,313 38.7 13,189 Q0- 3
1960 2h,989 100O0 10,204 10.8 14,785 59.2
1966 29,193 100.0 12,025 41.2 17,168 58.6
1970 31,435 100.0 12,512 39.8 15,923 6Co2
1972 32,359 100.0 11,958 37.0 209401 6 .o
1976 34,316 100.0 1I,I56 32.5 23,189 67.5
1981 36,709 100.0 10,480 28.5 26,229 71.5
A'zerage AnnmalGrowth Rate (%)
Total Below 14 1t and C-er
1955-1960 3-05 4.1 31
1960-1966 2.62 2.8 2
1966-1972 1.88 1.0 2.46
1972-1976 1.50 -1.75 3<25
1976-1981 1.30 -1.25 2.il9
1972-1981 1.41 -1.48 2.36
Source: Census figures for 1955, 1960 and '17') For 1972 and 1981 newEPB estimates or assuming an annual population growth rate of1.5 percent during 1972-76 and 1.3 percent during 1976-81.
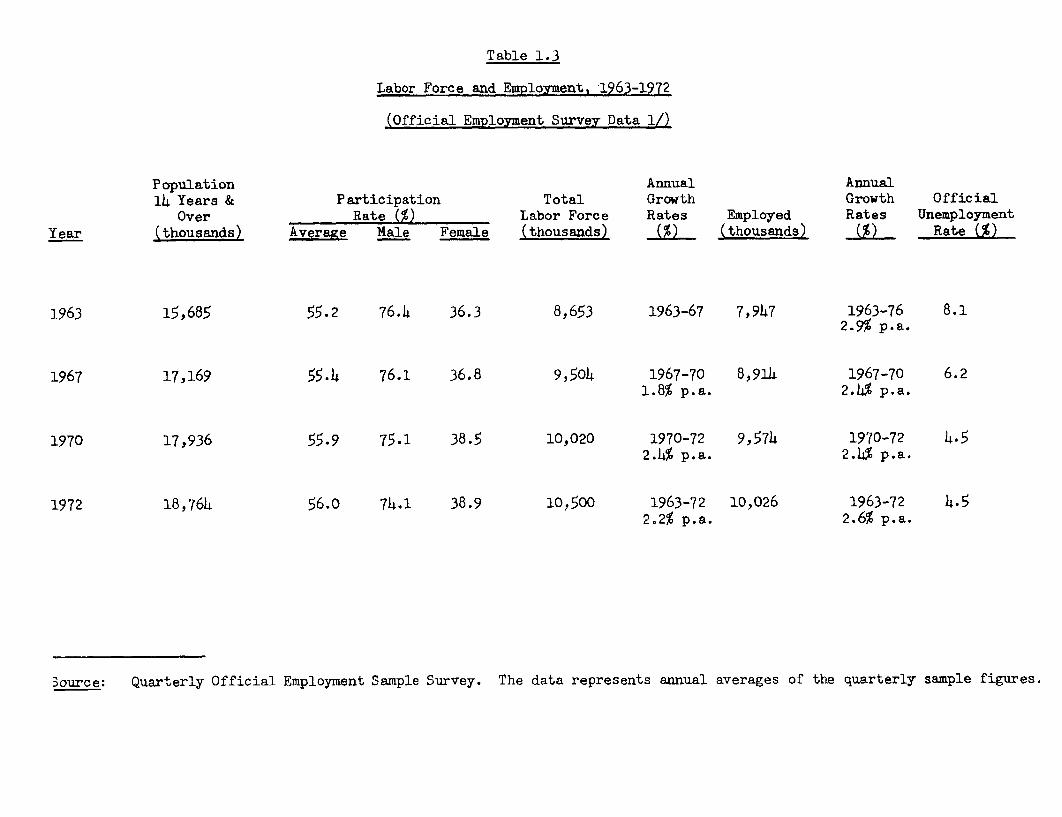
Table 1.3
Labor Force and Employments 1263-1972
(Official Employment Survey Data 1/)
Population Annual Annual14 Years & Participation Total Growth Growth Official
Over Rate (%) Labor Force Rates Employed Rates UnemploymentYear (thousands) Averae Male Female (thousands) (%) (thousands) (%) Rate C%)
1963 15,685 55.2 76.h 36.3 8,653 1963-67 7,947 1963-76 8.12.9% p.a.
1967 17,169 55.4 76.1 36.8 9,5o4 1967-70 8,914 1967-70 6.21.8% p.a. 2.4% p.a.
1970 17,936 55.9 75.1 38.5 10,020 1970-72 9,574 1970-72 4.52.4% p.a. 2.4% p.a.
1972 18,764 56.0 74.1 38.9 10,500 1963-72 10,026 1963-72 4.52.2% p.a. 2.6% p.a.
Source: Quarterly Official Employment Sample Survey. The data represents annual averages of the quarterly sample figures.
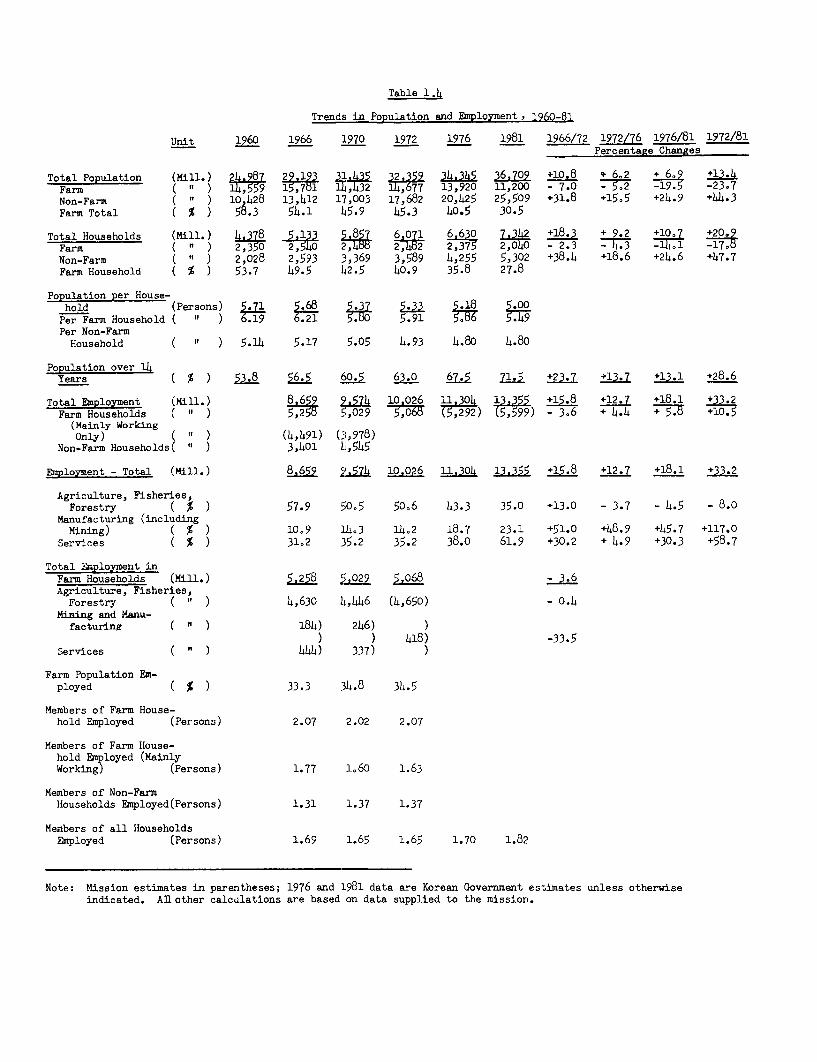
Table 1.4
Trends in Population and Employment 1960-81
Unit 1960 1966 1970 1972 1976 1981 1966/72 1972/76 1976/81 1972/81Percentage Changes
Total Population (Mill.) 298 22.19 31_435 19 341345 36,709 +10.8 + 6.2 + +13.4Farm ( n ) 1559 .71 X43_2 177 13,920 11,200 - 7.0 - 5.2 -9. -23.7Non-Farm ( " ) 10 428 13,412 17,003 17,682 20,425 25,509 +31.8 +15.5 +24.9 +44.3Farm Total ( % ) 58.3 54.1 Lt5.9 45.3 40.5 30.5
Total Households (Mill.) 4.378 -5133 5.857 6.071 6.630 7.342 +18.3 + 9.2 +10.7 2Farm ( ) 350 25 2T5 2482 2,375 2,040 - 2.3 - 4.3 -11,1 -17-Non-Farm C n ) 2,028 2,593 3,369 3,589 4,255 5,302 +38.4 +18.6 +24.6 +47.7Farm Household ( % ) 53.7 49.5 12.5 40.9 35.8 27.8
Population per House-hold (Persons) 5.71 i 6 5.37 5.33 5.18 5.ooPer Farm Household ( n ) 6.19 6.21 150 5.91 5.5 5.1Per Non-FarmHousehold ( n ) 5.14 5.17 5.05 1.93 4.80 4.80
Population over 14Years C % ) 5.8 56.5 60. 63.0 67.5 7 +23.7 +13.7 +13.1 +28.6
Total Employment (Mill.) 8.1659 90 026 1.3o4 13.5 +15.8 +12.7 +18.1 +33.2Farm Households ( " ) 5,255 ,.029 ,292 (5,99 - + 5. 4 +10.
(Mainly WorkingOnly) C ) (41491) (3,978)
Non-Farm Households( ) 3,401 L,545
Employment - Total (Mill.) 8.659 2,7jj 10.026 11.304 13 355 +15.8 +12.7 +18.1 +33.2
Agriculture, Fisheries,Forestry ( % ) 57.9 50.5 50.6 43.3 35.0 +13.0 - 3.7 - 4.5 - 8.0
Manufacturing (includingMining) ( % ) 10.9 1143 14.2 18.7 23.1 +51.0 +48.9 +45.7 +117.0
Services ( % ) 31,2 35.2 35.2 38.o 61.9 +30.2 + 4.9 +30.3 +58.7
Total Employment inFarm Households (Mill.) 5.258 5.029 5,068 - .6Agriculture, Fisheries,
Forestry ( " ) 4,630 1,446 (4,650) - 0.4Mining and Manu-
facturing ( n ) 184) 246)418) -33.5
Services ( n ) 444) 337)
Farm Population Em-ployed ( % ) 33.3 :34.8 34.5
Members of Farm House-hold Employed (Persons) 2.07 2.02 2.07
Members of Farm House-hold Employed (MainlyWorking) (Persons) 1.77 1,60 1.63
Members of Non-FarmHouseholds Employed(Persons) 1.31 1.37 1.37
Members of all HouseholdsEmployed (Persons) 1.69 1,65 1.65 1.70 1.82
Note: Mission estimates in parentheses; 1976 and 1981 data are Korean Government estimates unless otherwiseindicated. AI other calcalations are based on data supplied to the mission.

Table 1.5
Growth of Population and Employment by Industry, 1963-81
1963- 1967- 1972- 1976-1963 1967 1970 1972 1976 1981 1972 1972 1976 1981
Population 26,987 29,541 31,435 32,359 34,345 36,709 2.1 1.8 1.5 1.3
Population (14 & over) 15,685 17,169 17,936 18,764 21.126 24,402 2.0 1.8 2.8 2.9
Economically Active 8,653 9,504 10.020 10,500 11,761 13,763 2.2 2.0 2.9 3.2
Economicallv Inactive 7 032 7j665 7j916 8,26k 9,'65 0, 6'3 1.° 1.5 3.2 -2.
School Attendance 1,134 1,454 1,888 2,593 3,559a/ 4,362!' 9.6 12.3 8.2 4.2
Male 749 882 1,116 1,485 1,9571/ 2,399e 7.9 11.0 7.1 4.2
Female 385 572 772 1,108 1,602.t/ 1,963P/ 12.5 14.1 9.7 4.2
Participation Rates 55.2 55.4 55.9 56.0 55.7 56.4
Male 76.4 76.0 75.1 74.7 74.0 73.0
Female 36.-3 36.8 38.4 38.9 40.0 42.o
Employed 7,947 8,914 9,574 10,026 11,304 13,355 2.62 2.38 3.1 3.2
Agriculture, Forestryand Fisheries 5,022, 4,924 4,834 5,078 4,892 4,674 0.12 0.62 -0.08 -0.1
(Composition) (63.2) (55.2) (50.5) (50.6) (43.3) (35.0)
Mining & Manufacturing 689 1,138 1,369 1,423 2,119 3,088 8.39 4.58 9.1 7.9
(Composition) (8.7) (12.8) (11.3) (14.2) (18.7) (23.1)
Services 2,236 2,852 3,371 3,525 4,293 5,593 5.10 4.32 3.5 5.5
(Composition) (28.1) (32.0) (35.2) (35.2) (38.0) (41-9)
Unemployed 706 590 446 474 452 408
(Registered Unemployment Rate)(8.1) (6.2) (4.5) (4.5) (4.0) (3.0)
e/ Estimate; Source: EPB and Mission Estimates.
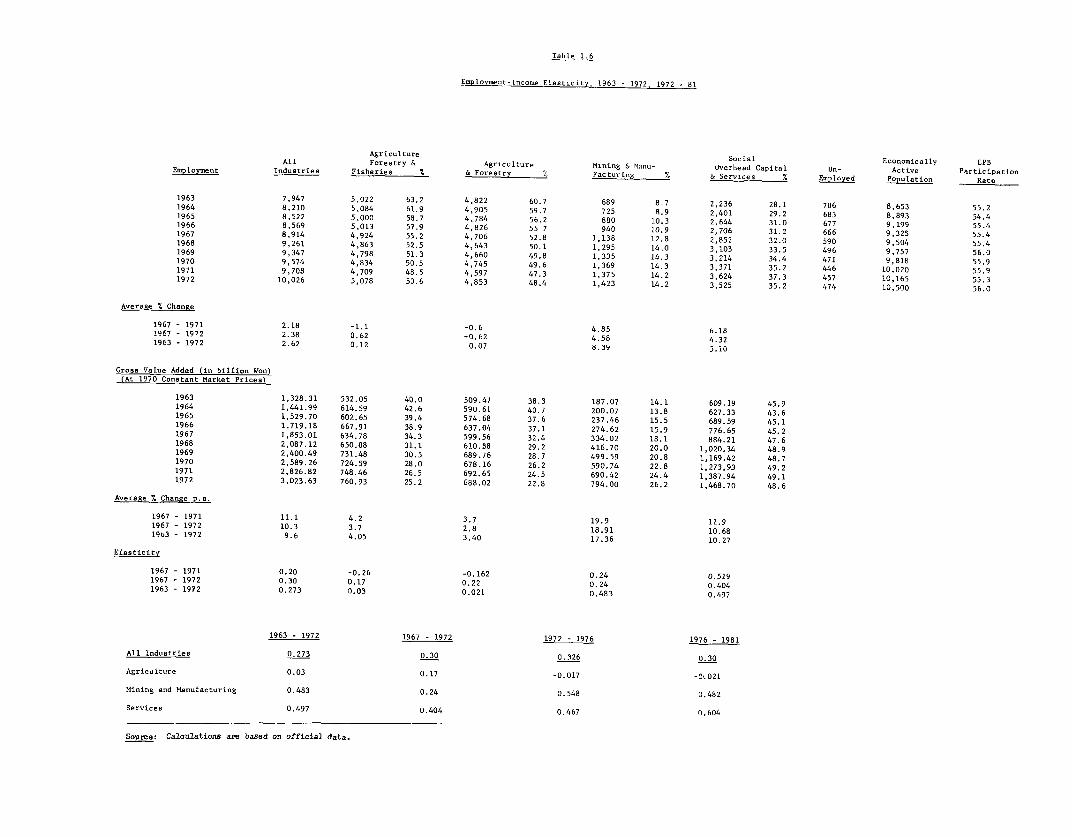
Table 1.6
Emnloysmnt-Inlcon,. Elasticity, 1963 - 1972, 1972 - 81
Agriclt.re Social Economically EPB
All Forestry & Agriclt.re Mining & Manu- Overhead Capital Un- Active Participation
Employ,ent Industries Fisheries % & Forestry % Facturing % & Services 7. Employed Population Rate
1963 7,947 5,022 63.2 4,822 60.7 689 8.7 2,236 28.1 706 8,653 55.2
1964 8,210 5,084 61.9 4,905 59.7 725 8.9 2,401 29.2 683 8,893 54.4
1965 8.522 5,000 58.7 4,784 56.2 880 10.3 2,644 31.0 677 9,199 55.4
1966 8,569 5,013 57.9 4,826 55 7 940 10.9 2,706 31.2 666 9,325 55.4
1967 8,914 4,924 55.2 4,706 52.8 1,138 12.8 2,852 32.0 590 9,504 55.4
1968 9,261 4,863 52.5 4,643 50.1 1,295 14.0 3,103 33.5 496 9,757 56.0
1969 9,347 4,798 51.3 4,660 49.8 1,335 14.3 3,214 34.4 471 9,818 55.9
1970 9,574 4,834 50.5 4,745 49.6 1,369 14.3 3,371 35.2 446 10,020 55.9
1971 9,708 4,709 48.5 4,597 47.3 1,375 14.2 3,624 37.3 457 10,165 55.3
1972 10,026 5,078 50.6 4,853 48.4 1,423 14.2 3,525 35.2 474 10,500 56.0
Average % Change
1967 - 1971 2.18 -1.1 -0.6 4.85 6.181967 - 1972 2.38 0.62 +0.62 4.58 4.32
1963.- 1972 2.62 0.12 0.07 8.39 5.10
Gross Value Added (in billion Won)(At 1970 Constant Market Prices)
1963 1,328.31 532.05 40.0 509.47 38.3 187.07 14.1 609.19 45.9
1964 1,441.99 614.59 42.6 590.61 40.7 200.07 13.8 627.33 43.6
1965 1,529.70 60?.65 39.4 574.68 37.6 237.46 15.5 689.59 45.1
1966 1,719.18 667.91 38.9 637.04 37.1 274.62 15.9 776.65 45.2
1967 1,853.01 634.78 34.3 599.56 32.4 334.02 18.1 884.21 47.6
1968 2,087.12 650.08 31.1 610.38 29.2 416.70 20.0 1,020.34 48.9
1969 2,400.49 731.48 30.5 689.76 28.7 499.59 20.8 1,169.42 48.7
1970 2,589.26 724.59 28.0 678.16 26.2 590.74 22.8 1,273,93 49.2
1971 2,826.82 748.46 26.5 692.65 24.5 690.42 24.4 1,387.94 49.1
1972 3,023.63 760.93 25.2 688.02 22.8 794.00 26.2 1,468.70 48.6
Average % Change p.a.
1967 - 1971 11.1 4.2 3.7 19.9 11.9
1967 - 1972 10.3 3.7 2.8 18.91 10.68
19b3 - 1972 9.6 4.05 3.40 17.36 10.27
ElasticitY
1967 - 1971 0.20 -0.26 -0.162 0.24 0.519
1967 - 1972 0.30 0.17 0.22 0.24 0.404
1963 - 1972 0.273 0.03 0.021 0.483 0.497
1963 - 1972 1967 - 1972 1972 - 1976 1976 - 1981
All Industries 0.273 0.30 0.326 0.30
Agriculture 0.03 0.17 -0.017 -0x021
Mining and Manufacturing 0.483 0.24 0.548 0.482
Services 0.497 0.404 0.467 0.604
Sourme: Calculations are based on official data.
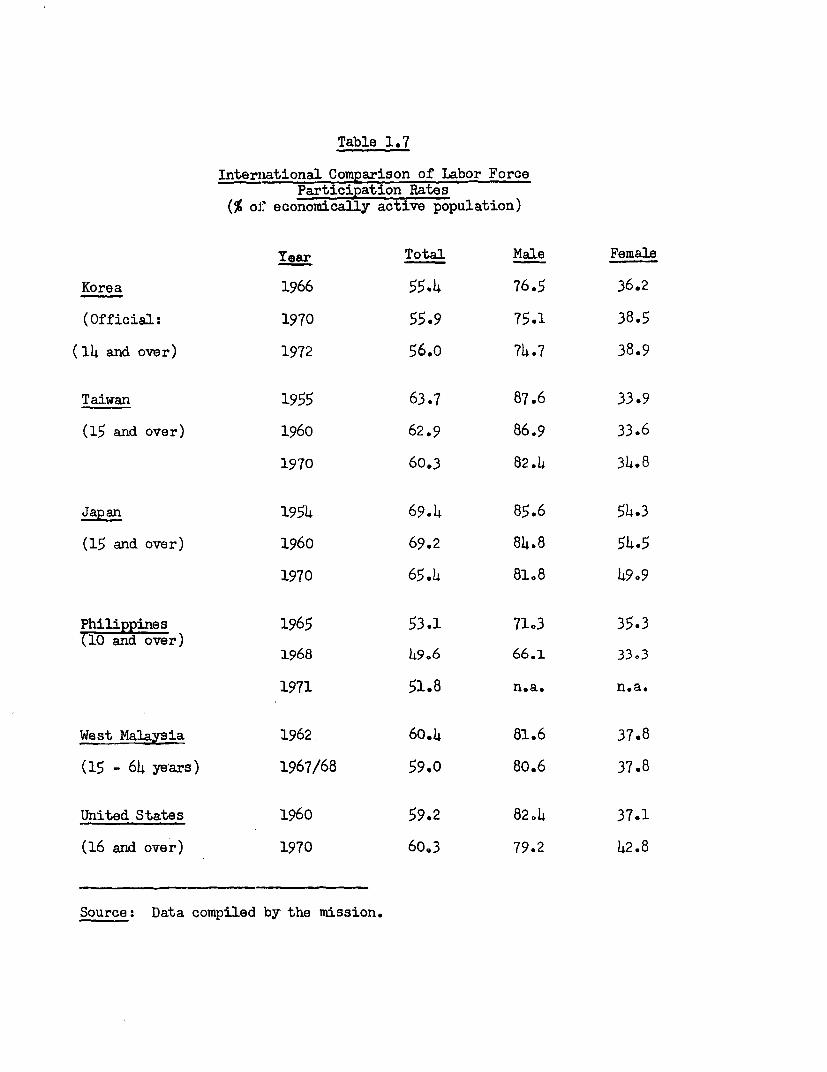
Table 1.7
International Comparison of Labor ForceParticipation Rates
(% of economically active population)
Year Total Male Female
Korea 1966 55.4 76.5 36.2
(Official: 1970 55.9 75.1 38.5
(14 and over) 1972 56.o 74.7 38.9
Taiwan 1955 63.7 87.6 33.9
(15 and over) 1960 62.9 86.9 33.6
1970 60.3 82.4 34.8
Japan 1954 69.4 85.6 54.3
(15 and over) 1960 69.2 84.8 54.5
1970 65.4 81.8 4909
Philippines 1965 53.1 71.3 35.3(10 and over)
1968 49.6 66.1 33.3
1971 51.8 n.a. n.a.
West Malaysia 1962, 6o.4 81.6 37.8
(15 - 64 years) 1967/68 59.0 80.6 37.8
United States 1960 59.2 8204 37.1
(16 and over) 1970 60,3 79.2 42.8
Source: Data compiled by the mission.

Table 1.8
Productivity by Industry, Current Market Prices, 1963-72
Unit 1963 1964 1965 1966 1967 1968 1969 1970 1971 1972
G N P (Current Prices) Bill. Won 489 700 805 1,032 1,270 1,598 2,082 2,589 3,152 3,860
Agriculture, Forestryand Fisheries Mil-l Won 206 321 309 365 399 L•5 598 725 911 1,095
Other Sectors 283 379 496 667 871 1,143 1,484 1,864 2,241 2,765
Persons Employed Thousand 7,947 8,210 8,522 8,659 8,914 9,261 9,347 9,574 9,908 10,026Persons
Agriculture, Forestryand Fisheries 5,021 5,48 5,000 5,013 4,92h 4,863 4,798 4,834 ,709 5,078
Other Sectors " 2,926 3,126 3,522 3,646 3,990 4,398 4,549 4,740 4,999 4,948
Per Capita Employed ThousandPersons W4on 62 85 94 119 142 173 223 270 318 385
Agriculture, Forestryand Fisheries (A) 41 63 62 73 81 94 125 150 193 216
Other Sectors (B) 97 121 141 183 218 260 326 393 448 559
A/B % 42.3 52.1 4400 40o0 37.2 36.2 38.3 38.2 43.1 3806
Source: EPB.
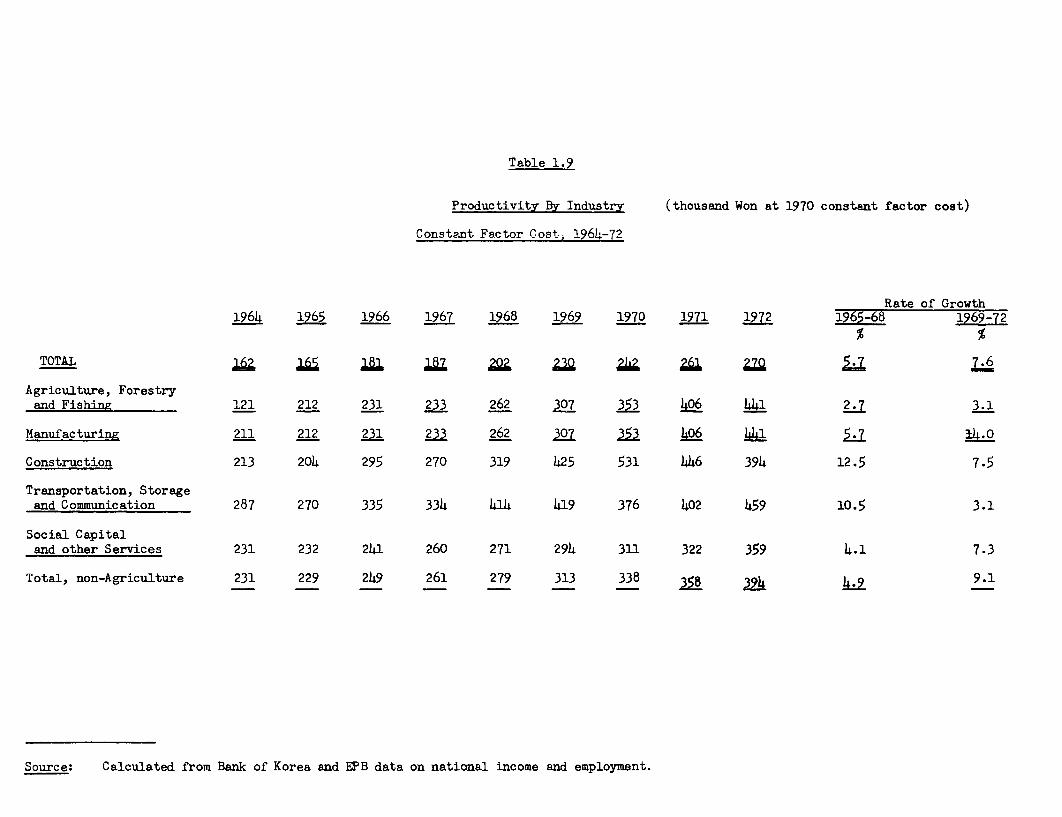
Table 1.9
Productivity By Industry (thousand Won at 1970 constant factor cost)
Constant Factor Cost, 1964-72
Rate of Growth1964 1965 1966 1967 1968 1969 1970 1971 1972 1965-68 1969-72
TOTAL a.6
Agriculture, Forestryand Fishing 121 212 231 233 262 307 353 406 441 2-7 3.1
Manufacturing 211 212 231 233 262 307 3f3 406 441 5 14.0
Construction 213 204 295 270 319 425 531 446 394 12.5 7.5
Transportation, Storageand Communication 287 270 335 334 414 419 376 402 459 10.5 3.1
Social Capitaland other Services 231 232 241 260 271 294 311 322 359 4.1 7.3
Total, non-Agriculture 231 229 249 261 279 313 338 358 394 9.1
Source: Calculated from Bank of Korea and EPB data on national income and employment.
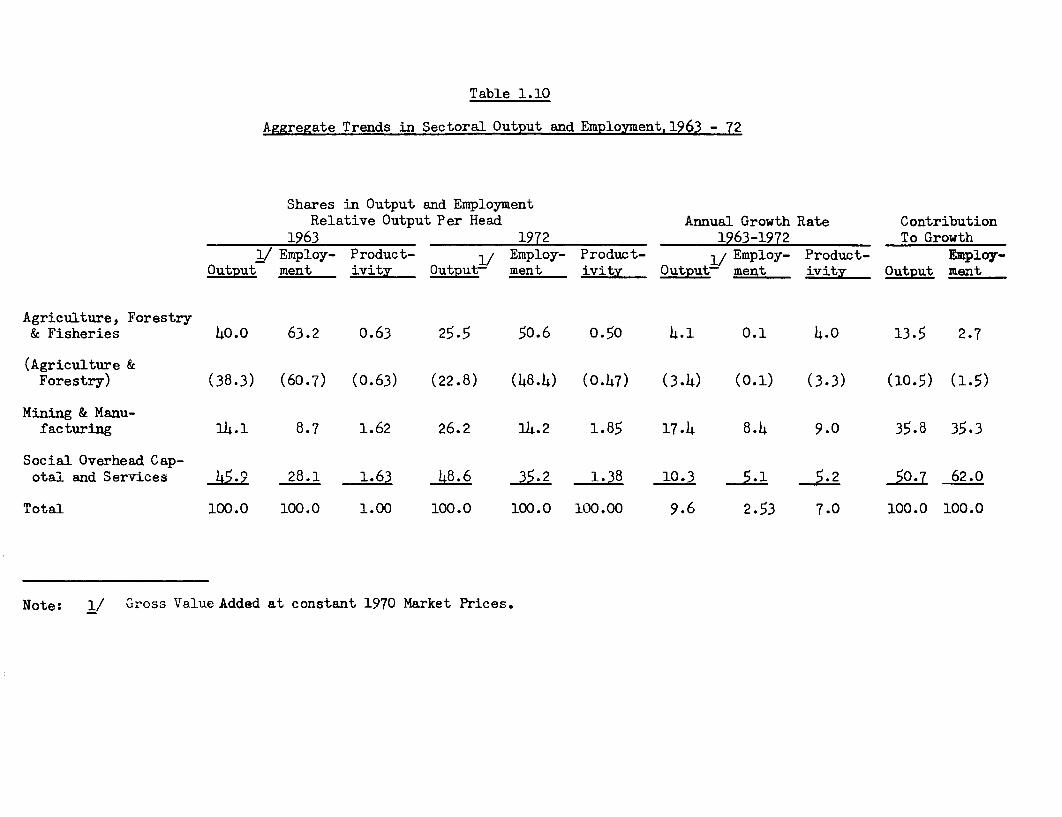
Table 1.10
Aggregate Trends in Sectoral Output and Employment, 1963 - 72
Shares in Output and EmploymentRelative Output Per Head Annual Growth Rate Contribution
1963 1972 1963-1972 To Growth1/ Employ- Product- 1/ Employ- Product- 1/ Employ- Product- Employ-
Output ment ivity Output- ment ivitv Outputp ' ment ivity Output ment
Agriculture, Forestry& Fisheries 40.0 63.2 0.63 25.5 50.6 0.50 4.1 0.1 4.0 13.5 2.7
(Agriculture &Forestry) (38.3) (60.7) (0.63) (22.8) (48.4) (0.47) (3.4) (0.1) (3.3) (10.5) (1.5)
Mining & Manu-facturing 14.1 8.7 1.62 26.2 14.2 1.85 17.4 8.4 9.0 35.8 35.3
Social Overhead Cap-otal and Services 45.9 28.1 1.63 48.6 35.2 1.38 10.3 5.1 5.2 5 62.0
Total 100.0 100.0 1.00 100.0 100.0 100.00 9.6 2.53 7.0 100.0 100.0
Note: 1/ Gross Value Added at constant 1970 Market Prices.
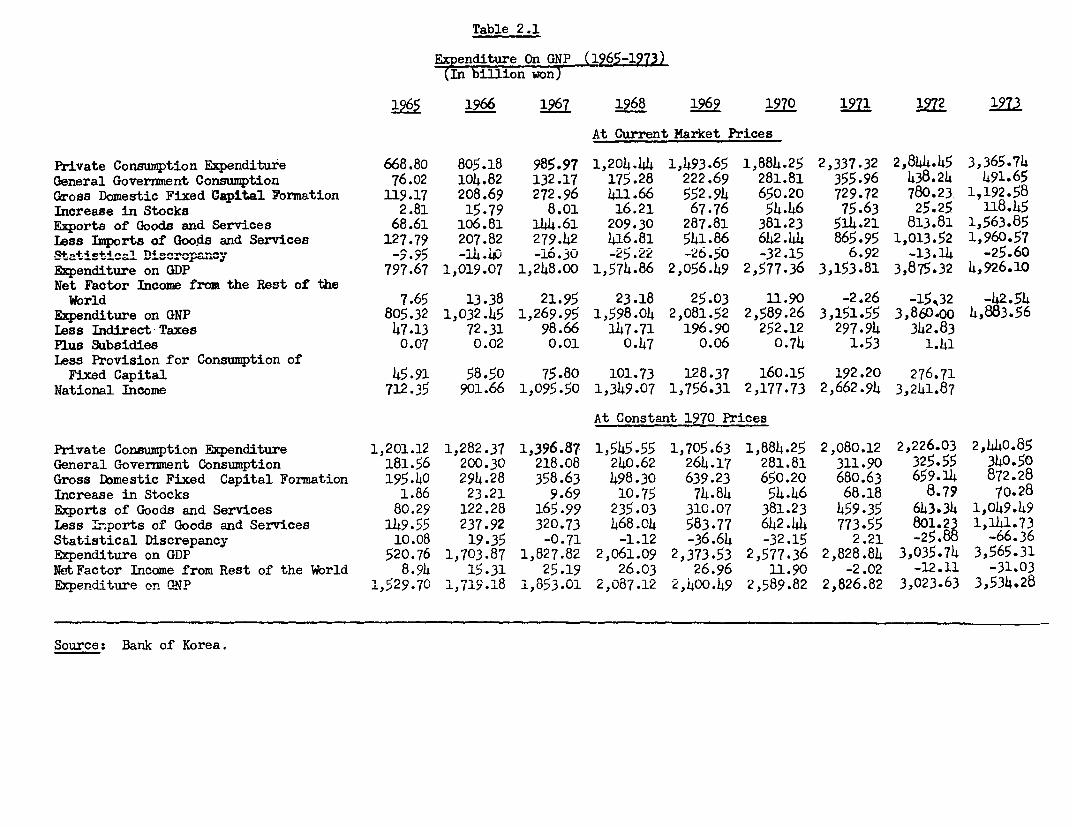
Table 2.1
Expenditure On GNP (1965-1973)(In billion won)
1965 1966 1967 1968 1969 1970 197 1972 1973
At Current Market Prices
Private Consumption Expenditurie 668.80 805.18 985.97 1,204.44 1,493.65 1,884.25 2,337.32 2,844.45 3,365.74General Government Consumption 76.02 104.82 132.17 175.28 222.69 281.81 355.96 438.24 491.65Gross Domestic Fixed Capital Formation 119.17 208.69 272.96 411.66 552.94 650.20 729.72 780.23. 1,192.58Increase in Stocks 2.81 15.79 8.01 16.21 67.76 54146 75.63 25.25 118.45Exports of Goods and Services 68.61 106.81 144.61 209.30 287.81 381.23 514.21 813.81 1,563.85Less Imports of Goods and Services 127.79 207.82 279.42 416.81 541.86 642.44 865.95 1,013.52 1,960.57Statist±cal D4csr-p-n- y -9.95 -14 -16.30 -25.22 -26.50 -32.15 6.92 -13.14 -25.60Expenditure on GDP 797.67 1,019.07 1,248.00 1,574.86 2,056.49 2,577.36 3,153.81 3,875.32 4,926.10Net Factor Income from the Rest of the
World 7.65 13.38 21.95 23.18 25.03 11.90 -2.26 -15,32 -42.54Expenditure on GNP 805.32 1,032.45 1,269.95 1,598.04 2,081.52 2,589.26 3,151.55 3,860.00 4,883.56Less Indirect-Taxes 47.13 72.31 98.66 147.71 196.90 252.12 297.94 342.83Plus S&bsidies 0.07 0.02 0.01 0.47 0.06 0.74 1.53 1.41Less Provision for Consumption ofFixed Capital 45.91 58.50 75.80 101.73 128.37 160.15 192.20 276.71
National Income 712.35 901.66 1,095.50 1,349.07 1,756.31 2,177.73 2,662.94 3,241.87
At Constant 1970 Prices
Private Confumption Expenditure 1,201.12 1,282.37 1,396.87 1,545.55 1,705.63 1,884.25 2,080.12 2,226.03 2,440.85General Government Consumption 181.56 200.30 218.08 240.62 264.17 281.81 311.90 325.55 340.50Gross Domestic Fixed Capital Formation 195.40 294.28 358.63 498.30 639.23 650.20 680.63 659.14 872.28Increase in Stocks 1.86 23.21 9.69 10.75 74.84 54.46 68.18 8.79 70.28Exports of Goods and Services 80.29 122.28 165.99 235.03 310.07 381.23 459-35 643.34 1,049.49Less Inports of Goods and Services 149.55 237.92 320.73 468.04 583.77 642.44 773.55 801.23 1,141.73Statistical Discrepancy 10.08 19.35 -0.71 -1.12 -36.64 -32.15 2.21 -25.55 -66.36Expenditure on GDP 520.76 1,703.87 1,827.82 2,061.09 2,373.53 2,577.36 2,828.84 3,035.74 3,565-31Net Factor Income from Rest of the World 8.94 15.31 25.19 26.03 26.96 11.90 -2.02 -12.11 -31.03Expenditure on GNP 1,529.70 1,719.18 1,853.01 2,087.12 2,400.49 2,589.82 2,826.82 3,023.63 3,534.28
Source: Bank of Korea.

Table 2.2
Expenditure on Gross National Product (1965-1973)(percentages)
1965 1966 1967 1968 1969 1970 1971 1972 1973
At Current Market Prices
Private consumption expenditure 83.0 78.o 77.6 75.4 71.8 72.8 74.2 73.7 68.9General Government consumption expenditure 9.4 10.2 10.4 11.0 10.7 10.9 11.3 11.3 10.1Gross domestic fixed capital formation 14.8 20.2 21.5 25.8 26.6 25.1 23.2 20.2 24.0Increase in stocks 0.3 1.5 0.6 1.0 3.3 2.1 2.4 0.7 2.4Export of goods and services 8.5 10.3 11.4 13.1 13.8 14.7 16.3 21.1 32.0Less: Imports of goods and services -15.9 20.1 22.0 26.1 26.0 24.8 27.5 26.3 36.0Statistical discrepancy 1.2 -1.4 -1.3 -1.6 -1.3 -1.2 0.2 -0.3 -0.5Expenditure on gross domestic product 99.1 98.7 98.3 98.5 98.8 99.5 100.1 100.4 100.9Net factor income from the rest of the world 0.9 1.3 1.7 1.5 1.2 0.5 -0.1 -0.4 -0.9Expenditure on gross national product 100.0 100.0 100.0 100.0 100.0 100.0 100.0 100.0 100.0Less indirect taxes 5.9 7.0 7.8 9.2 9.5 9.7 9.5 8.9Plus subsidies - - - - - - - -Less provisions for the consumption of fixed
capital 5.7 5.7 6.o 6.4 6.2 6.2 6.1 7.1National income = NNP at factor cost 1.5 87.3 86.3 84.4 84.4 84.1 84.5 84.0
At 1970 Constant Market Prices
Private consumption expenditure 78.5 74.6 75.4 74.1 71.1 72.8 73.6 73.6 69.1General Government consumption expenditure 11.9 11.7 11.8 11.5 11.0 10.9 11.0 10.8 9.6Gross domestic fixed capital formation 12.8 17.1 19.4 23.4 26.6 25.1 24.1 21.8 24.7Increase in stocks 0.1 1.4- 0.5 0.5 3.1 2.1 2.4 0.3 2.0Export of goods and services 5.2 7.1 9.0 11.3 12.9 14.7 16.2 21.3 29.7Less imports of goods and services 9.8 13.8 17.3 22.4 24.3 24.8 27.4 26.5 32.3Statistical discrepancy 0.7 1.1 - -0.1 -1.5 -1.2 0.1 -0.9 -1.9Expenditure on gross domestic product 99.4 99.1 98.6 98.8 98.9 99.5 100.1 100.4 100.9Net factor income from the rest of the world 0.6 0.9 1.4 1.3 1.1 0.5 -0.1 -0.4 -0.9Expenditure on gross national product 100.0 100.0 100.0 100.0 100.0 100.0 100.0 100l0 100.0
Source: Based on Table 2.1.
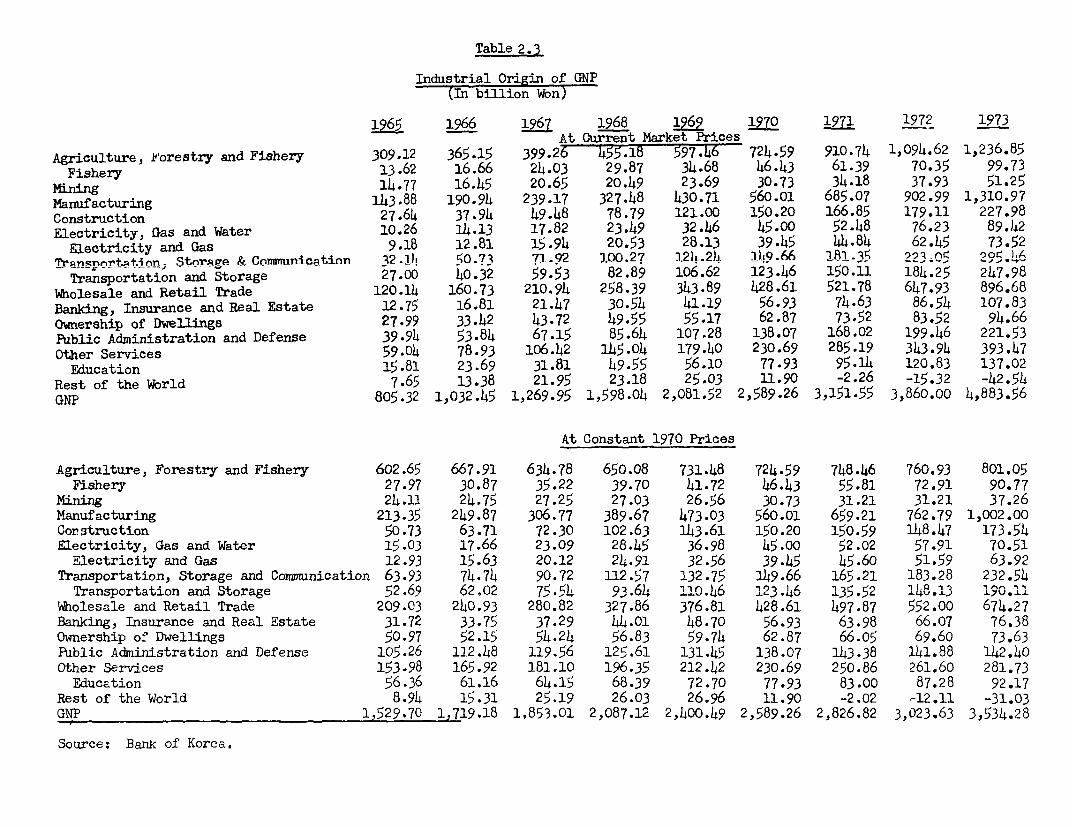
Table 2.3
Industrial Origin of GNP(In billion Won)
1965 1966 1967 1968 1969 1970 1971 1972 1973At Current Market Prices
Agriculture, Forestry and Fishery 309.12 365.15 399.26 455.18 597.46 724.59 910.74 1,094.62 1,236.85Fishery 13.62 16.66 24.03 29.87 34.68 46.43 61.39 70.35 99.73
Mining 14.77 16.45 20.65 20.49 23.69 30.73 34.18 37.93 51.25Manufacturing 143.88 190.94 239.17 327.48 430.71 560.01 685.07 902.99 1,310.97Construction 27.64 37.94 49.48 78.79 121.00 150.20 166.85 179.11 227.98Electricity, Gas and Water 10.26 14.13 17.82 23.49 32.46 45.00 52.48 76.23 89.42
Electricity and Gas 9.18 12.81 15.94 20.53 28.13 39-45 44.84 62.45 73.52Trqneportt.AMn- Storage & Communicetion t2. . 50.73 71.92 1-00.27 124.24 1-49.66 1-81-35 92305 295.46Transportation and Storage 27.00 40.32 59.53 82.89 106.62 123.46 150.11 184.25 247.98
Wholesale and Retail Trade 120.14 160.73 210.94 258.39 343.89 428.61 521.78 647.93 896.68Banking, Insurance and Real Estate 12.75 16.81 21.47 30.54 41.19 56.93 74.63 86.54 107.83Ownership of Dwellings 27.99 33.42 43.72 49.55 55.17 62.87 73.52 83.52 94.66Public Administration and Defense 39.94 53.84 67.15 85.64 107.28 138.07 168.02 199.46 221.53Other Services 59.04 78-93 106.42 145.04 179.40 230.69 285.19 343.94 393.47
Education 15.81 23.69 31.81 49.55 56.10 77.93 95.14 120.83 137.02Rest of the World 7.65 13.38 21.95 23.18 25.03 11.90 -2.26 -15.32 -42.54GNP 805.32 1,032.45 1,269.95 1,598.04 2,081.52 2,589.26 3,151.55 3,860.00 4,883.56
At Constant 1970 Prices
Agriculture, Forestry and Fishery 602.65 667.91 634.?8 650.08 731.48 724.59 748.46 760.93 801.05Fishery 27.97 30.87 35.22 39.70 41.72 46.43 55.81 72.91 90.77
Mining 24.11 24.75 27.25 27.03 26.56 30.73 31.21 31.21 37.26Manufacturing 213.35 249.87 306.77 389.67 473.03 560.01 659.21 762.79 1,002.00Construction 50-73 63.71 72.30 102.63 143.61 150.20 150.59 148.47 173.54Electricity, Gas and Water 15.03 17.66 23.09 28.45 36.98 45.00 52.02 57.91 70.51
Electricity and Gas 12.93 15.63 20.12 24.91 32.56 39.45 45.60 51.59 63.92Transportation, Storage and Communication 63.93 74.74 90.72 112.57 132-75 149.66 165.21 183.28 232.54
Transportation and Storage 52.69 62.02 75.54 93.64 110.46 123.46 135-52 148.13 190.11Wholesale and Retail Trade 209.03 240.93 280.82 327.86 376.81 428.61 497.87 552.oo 674.27Banking, Insurance and Real Estate 31.72 33.75 37.29 44.01 48.70 56.93 63.98 66.07 76.38Ownership of Dwellings 50.97 52.15 54.24 56.83 59.74 62.87 66.05 69.60 73.63Public Administration and Defense 105.26 112.48 119.56 125.61 131.45 138.07 143.38 141.88 142.40Other Services 153.98 165.92 181.10 196.35 212.42 230.69 250.86 261.60 281.73Education 56.36 61.16 64.15 68.39 72.70 77.93 83.00 87.28 92.17
Rest of the World 8.94 15.31 25.19 26.03 26.96 11.90 -2.02 -12.11 -31.03GNP 1,529.70 1,719.18 1,853.01 2,087.12 2,400.49 2,589.26 2,826.82 3,023.63 3,534.28
Source: Bank of Korea.
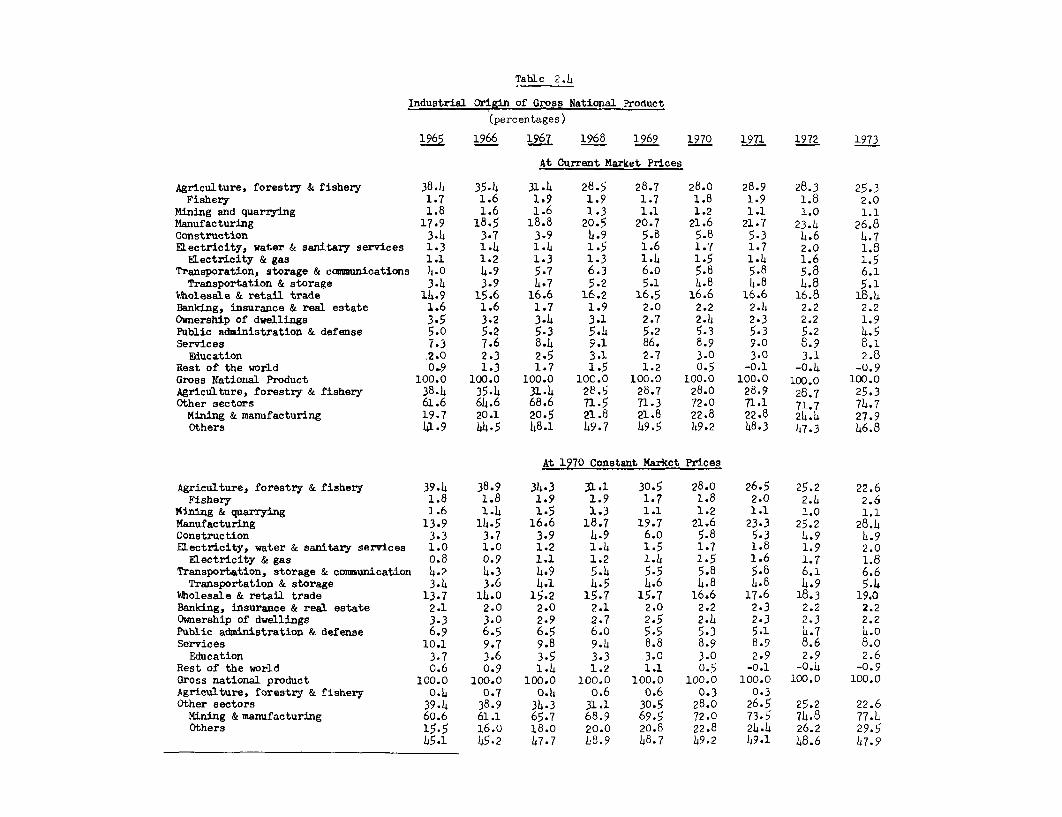
Table 2.4
Industrial Origin of Gross National Product
(percentages)
1965 1966 1967 1968 1969 1970 1971 1972 1973
At Current Market Prices
Agriculture, forestry & fishery 38.4 35.4 31.4 28.5 28.7 28.0 28.9 28.3 25.3Fishery 1.7 1.6 1.9 1.9 1.7 1.8 1.9 1.8 2.0
Mining and quarrying 1.8 1.6 1.6 1.3 1.1 1.2 1.1 1.0 1.1Manufacturing 17.9 18.5 18.8 20.5 20.7 21.6 21.7 23.4 26.8Construction 3.4 3.7 3.9 4.9 5.8 5.8 5.3 4.6 4.7Electricity, water & sanitary services 1.3 1.4 1.4 1.5 1.6 1.7 1.7 2.0 1.8
ELectricity & gas 1.1 1.2 1.3 1.3 1.4 1.5 1.4 1.6 1.5Transporation, storage & communications 4.0 4.9 5.7 6.3 6.o 5.8 5.8 5.8 6.1Transportation & storage 3.4 3.9 4.7 5.2 5.1 4.8 4.8 4.8 5.1
'Wholesale & retail trade 14.9 15.6 16.6 16.2 16.5 16.6 16.6 16.8 18.4Banking, insurance & real estate 1.6 1.6 1.7 1.9 2.0 2.2 2.4 2.2 2.2Ownership of dwellings 3.5 3.2 3.4 3.1 2.7 2.4 2.3 2.2 1.9Public administration & defense 5.0 5.2 5.3 5.4 5.2 5.3 5.3 5.2 4.5Services 7.3 7.6 8.4 9.1 86. 8.9 9.0 8.9 8.1
Eiducation 2.0 2.3 2.5 3.1 2.7 3.0 3.0 3.1 2.8Rest of the world 0°.9 1.3 1.7 1.5 1.2 0.5 -0.1 -0.4 -0.9Gross National Product 100.0 100.0 100.0 100.0 100.0 100.0 100.0 100.0 100.0Agriculture, forestry & fishery 38.4 35.4 31.4 28.5 28.7 28.0 28.9 28.7 25.3Other sectors 61.6 64.6 68.6 71.5 71.3 72.0 71.1 71.7 74.7Mining & manufacturing 19.7 20.1 20.5 21.8 21.8 22.8 22.8 24.4 27.9Others 41.9 44.5 48.1 49.7 49.5 49.2 48-3 47.3 46.8
At 1970 Constant Market Prices
Agriculture, forestry & fishery 39.4 38.9 34.3 31.1 30.5 28.0 26.5 25.2 22.6Fishery 1.8 1.8 1.9 1.9 1.7 1.8 2.0 2.4 2.6
MSining & quarrying 1.6 1.4 1.5 1.3 1.1 1.2 1.1 1.0 1.1Manufacturing 13.9 14.5 16.6 18.7 19.7 21.6 23.3 25.2 28.4Construction 3.3 3.7 3.9 4.9 6.o 5.8 5.3 4.9 4.9Electricity, water & sanitary services 1.0 1.0 1.2 1.4 1.5 1.7 1.8 1.9 2.0
Electricity & gas 0.8 0.9 1.1 1.2 1.4 1.5 1.6 1.7 1.8Transportation, storage & comnunication 4.2 4.3 4.9 5.4 5.5 5.8 5.8 6.1 6.6Transportation & storage 3.4 3.6 4-1 4.5 4.6 4.8 4.8 4.9 5.4
Itolesale & retail trade 13.7 14.0 15.2 15.7 15.7 16.6 17.6 18.3 19.0Banking, insurance & real estate 2.1 2.0 2.0 2.1 2.0 2.2 2.3 2.2 2.2Ownership of dwellings 3.3 3.0 2.9 2.7 2.5 2.4 2.3 2.3 2.2Public administration & defense 6.9 6.5 6.5 6.0 5.5 5.3 5.1 4.7 4.oServices 10.1 9.7 9.8 9.4 8.8 8.9 8.9 8.6 8.0
Education 3.7 3.6 3.5 3.3 3.0 3.0 2.9 2.9 2.6Rest of the world 0.6 0.9 1.4 1.2 1.1 0.5 -0.1 -0.4 -0.9Gross national product 100.0 100.0 100.0 100.0 100.0 100.0 100.0 100.0 100.0Agriculture, forestry & fishery 0.4 0.7 0.4 o.6 0.6 0.3 0.3Other sectors 39.4 38-9 34.3 31.1 30.5 28.0 26.5 25.2 22.6Mining & manufacturing 60.6 61.1 65.7 68.9 69.5 72.0 73.5 74.8 77.4Others 15.5 16.0 18.0 20.0 20.8 22.8 24.4 26.2 29.5
45.1 45.2 47.7 L8.9 48.7 49.2 49.1 48.6 47.9
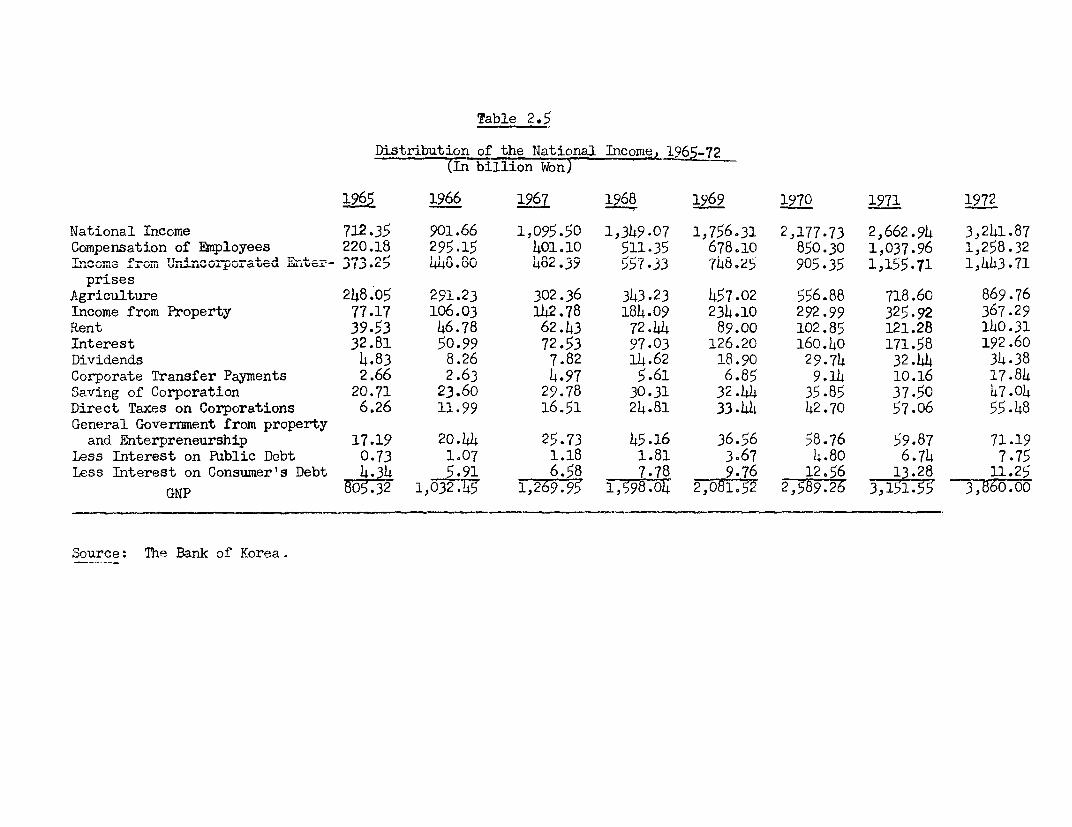
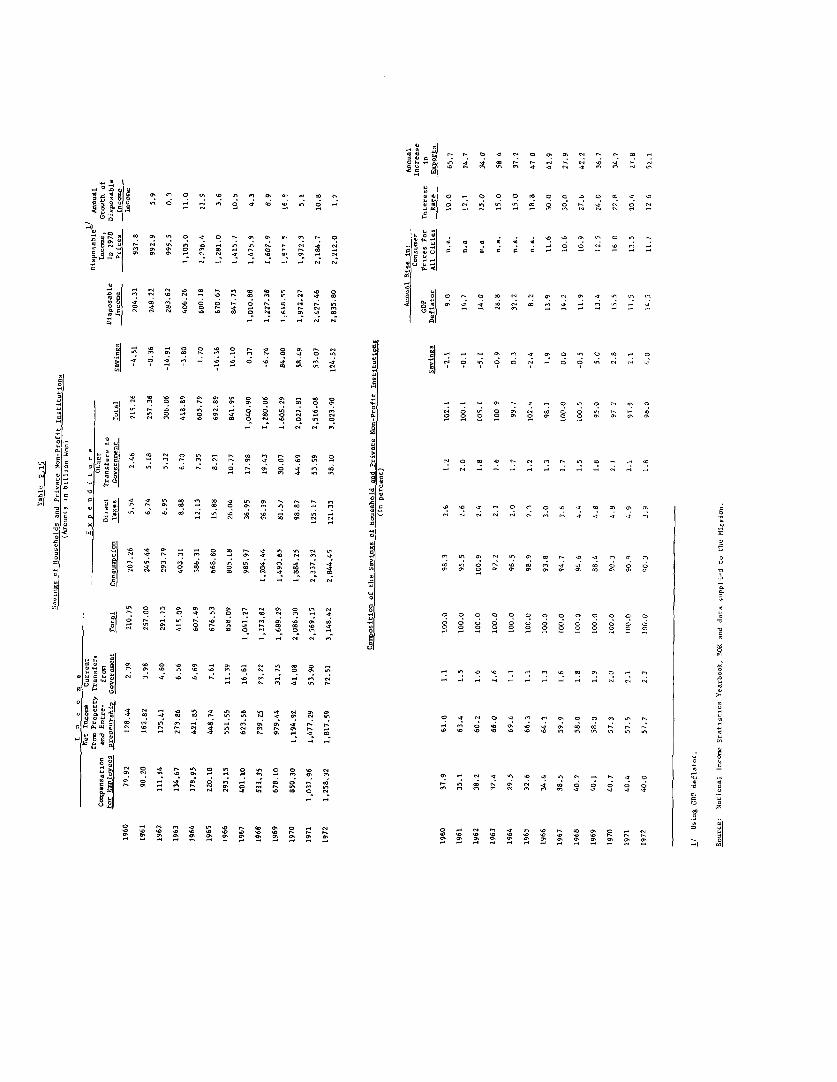
Table 2.5
Distribution of the National Income, 196 -72(In billion Won) 1~6-~
196 1966 1967 1968 1969 1970 l971 1972
National Income 712.35 901.66 1,095.50 1,349.07 1,756.31 2,177.73 2,662.94 3,241.87Compensation of Employees 220.18 295.15 401.10 511.35 678.10 850.30 1,037.96 1,258.32
A_VUG r nro,o.Lave, 25 44U.OV 4082.39 557.33 748.25 90535 1,155-71 1,443.71prises
Agriculture 248.05 291.23 302.36 343.23 457.02 556.88 718.60 869.76Income from Property 77.17 106.03 142.78 184.09 234.10 292.99 325.92 367.29Rent 39.53 46.78 62.43 72.44 89.00 102.85 121.28 140.31Interest 32.81 50.99 72.53 97.03 126.20 160.40 171.58 192.60Dividends 4.83 8.26 7.82 14.62 18.90 29.74 32.44 34.38Corporate Transfer Payments 2.66 2.63 4.97 5.61 6.85 9.14 10.16 17.84Saving of Corporation 20.71 23.60 29.78 30.31 32.44 35-85 37.50 47.04Direct Taxes on Corporations 6.26 11.99 16.51 24.81 33.44 42.70 57.o6 55.48General Goverment from property
and Enterpreneurship 17.19 20.44 25.73 45.16 36.56 58.76 59.87 71.19Less Interest on Public Debt 0.73 1.07 1.18 1.81 3.67 4.80 6.74 7.75Less Interest on Consumer's Debt 4.34 5.91 6.58 7.78 9.76 12,56 13.28 11.25
GNP 805.32 1,032.45 1,269.95 1,598. 2,081.52 2,589.26 3,151.75 3,60.00
Source: The Bank of Korea.

Table .
4stribution of the National In 1n 1965")-72(i1n- percen't)
1965 1966 1967 1968 1969 1970 1971 1972
National income 88.5 87.3 86.3 84.4 8h.4 84.1 84.5 83.9Compensation of employees 27.3 28.6 31.6 32.0 32.6 32.8 32.9 32.5Income from unincorporated enterprises 46e3 43.5 38.0 34.9 35.9 35.0 36.7 37.4Agriculture 30.8 28.2 23.8 21.5 22.0 21.5 22.8 22.5
Income from property 9.6 10.3 11.2 11.5 11.2 11.3 10.3 9.5Rent 4.9 4.5 4.9 4.5 4.3 4.0 3.8 3.6Interest 4-1 4.9 5.7 6.1 6.1 6.2 5.4 4.9Dividends 0.6 0.8 0.6 0.9 0.9 1.1 1.0 0.8
Corporate transfer payments 0.3 0.3 0.4 0.4 0.3 0.4 0.3 0.4Saving of corporation 2.6 2.3 2.3 1.9 1.6 1.4 1.2 1.2Direct taxes on corporations 0.8 1.2 1.3 1.6 1.6 1.6 1.8 1.4General Government income from property
and enterpreneurship 2.1 2.0 2.0 2.8 1.8 2.3 1.9 1.8Less: Interest on the public debt 0.1 0.1 0.1 0.1 0.2 0.2 0.2 0.2Less: Interest on consumers' debt 0.5 O.6 0.5 0.5 0.5 0.5 0.4 0.3
Gross National Product (current marketprices.) 100.0 100.0 100.0 100.0 100.0 100.0 100.0 100.0
Source: Based on 'i;able 2.5
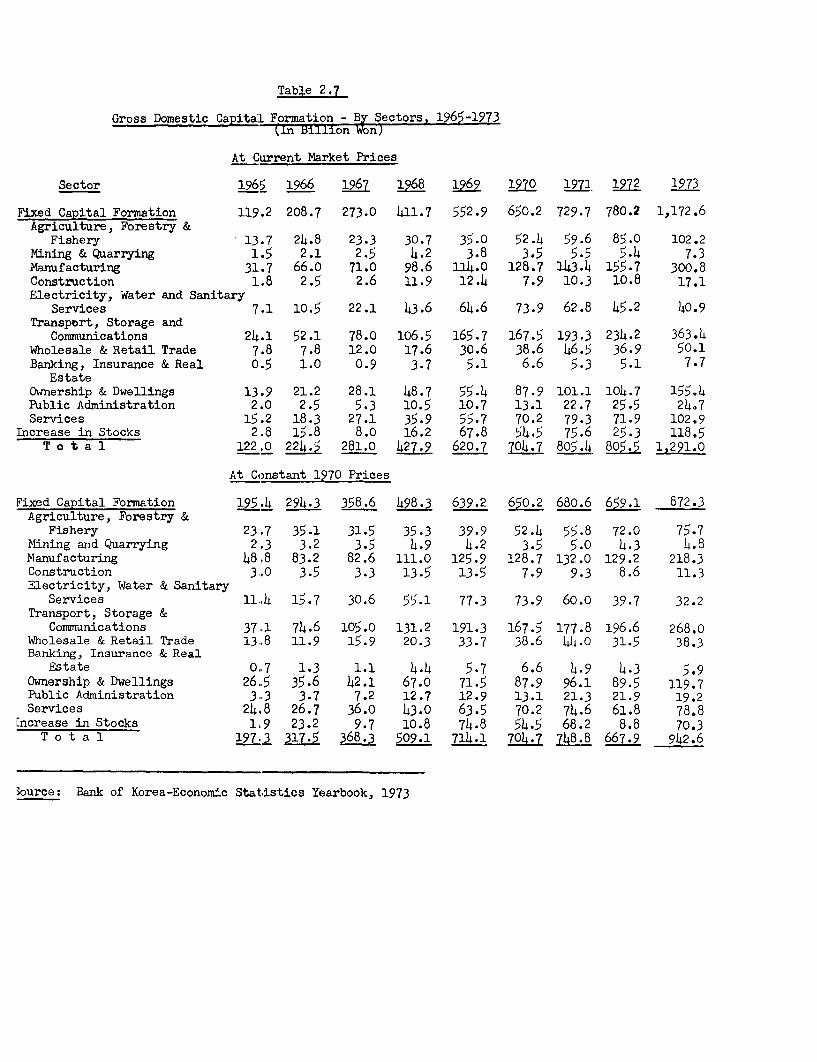
Tabl,e 2.7
Gross Domestic Capita:L Formation - B4 Sectors, 1965-1973(In Billion n)
At Current Market Prices
Sector 1965 1966 1967 1968 1969 1970 1971 1972 1973
Fixed Capital Formation 119.2 208.7 273.0 411.7 552.9 650.2 729.7 780.2 1,172.6Agriculture, Forestry &
Fishery 13.7 24.8 23.3 30.7 35.0 52 .4 59.6 85.0 102.2Mining & Quarrying 1.5 2.1 2.5 4.2 3.8 3.5 5.5 5.4 7.3Manufacturing 31.7 66.o 71.0 98.6 114.0 128.7 143.4 155.7 300.8Construction 1.8 2.5 2.6 11.9 12.4 7.9 10.3 10.8 17.1Electricity, Water and Sanitary
Services 7.1 10.5 22.1 43.6 64.6 73.9 62.8 45.2 40.9Transport, Storage and
Communications 24.1 52.1 78.0 106.5 165.7 167.5 193.3 234.2 363.4Wholesale & Retail Trade 7.8 7.8 12.0 17.6 30.6 38.6 46.5 36.9 50.1Banking, Insurance & Real 0.5 1.0 0.9 3.7 5.1 6.6 5.3 5.1 7.7
EstateOwnership & Dwellings 13.9 21.2 28.1 48.7 55.4 87.9 101.1 104.7 155.4Public Administration 2.0 2.5 5.3 10.5 10.7 13.1 22.7 25.5 24.7Services 15.2 18.3 27.1 35.9 55.7 70.2 79.3 71.9 102.9
Increase in Stocks 2.8 15.8 8.0 16.2 67.8 54.5 75.6 25.3 118.5T o t a 1 122.0 224.5 281.0 427.9 620.7 704.7 805.4 805.5 1,291.0
At Constant 1970 Prices
Fixed Capital Formation 195.4 294.3 358.6 498.3 639.2 650.2 680.6 659.1 572.3Agriculture, Forestry &
Fishery 23.7 35.1 31.5 35.3 39.9 52.4 55.8 72.0 75.7Mining and Quarrying 2.3 3.2 3.5 4.9 4.2 3.5 5.0 4.3 4.8Manufacturing 48.8 83.2 82.6 111.0 125.9 128.7 132.0 129.2 218.3Construction 3,0 3.5 3.3 13.5 13.5 7.9 9.3 8.6 11.3Electricity, Water & Sanitary
Services 11.4 15.7 30.6 55.1 77.3 73.9 60.0 39.7 32.2Transport, Storage &
Communications 37.1 74.6 105.0 131.2 191.3 167.5 177.8 196.6 268.0Wholesale & Retail Trade 13.8 11.9 15.9 20.3 33.7 38.6 44.0 31.5 38.3Banking, Insurance & Real
Estate 0.7 1.3 1.1 4.4 5.7 6.6 4.9 4.3 5.9Ownership & Dwellings 26,.5 35.6 42.1 67.0 71.5 87.9 96.1 89.5 119.7Public Administration 3.3 3.7 7.2 12.7 12.9 13.1 21.3 21.9 19.2Services 24.8 26.7 36.0 43.0 63.5 70.2 74.6 61.8 78.8
Increase in Stocks 1.9 23.2 9.7 10.8 74.8 54.5 68.2 8.8 70.3T o t a 1 197.3 317.5 368.3 509.1 714.1 704.7 748.8 667.9 942.6
,ource: Bank of Korea-Economic Statistics Yearbook, 1973

Table 2.8
Gross Domestic Fixed Capital Formation by Sectors, 196l-73(In Percent)
Sector 1965 1966 1967 1968 1969 1970 1971 1972 1973
At Current Market Prices
Fixed Capital Formation 97.7 93.0 97.1 96.2 89.1 92.3 90.6 96.9 90.8Agriculture, Forestry & Fishery 11.2 11.1 8.3 7.2 5.6 7.L 7.4 10.6 7.9Mining & Quarrying 1.2 0.9 0.9 1.0 0.6 0.5 0.7 0.7 o.6Manufacturing 26.0 29.4 25.3 23.0 18.4 18.3 17.8 19.3 23.3Construction 1.5 1.1 0.9 2.8 2.0 1.1 1.3 1.3 1.3Electricity,Water & Sanitary Services 5.8 4.7 7.8 10.2 10.4 10.5 7.8 5.6 3.2Transport,Storage & Cormmunication 19.7 23.2 27.8 24.9 26.7 23.8 24.0 29.1 28.1Wholesale & Retail Trade 6.4 3.5 4.3 4.1 5.0 5.5 5.8 4.6 3.9Banking; Insurance & Real Estate 0.4 0.4 0.3 0.8 0.8 0.9 0.7 o.6 o.6Ownership of Dwellings 11.4 9.5 10.0 11.4 8.9 12.5 12.5 13.0 12.0Public Administration 1.6 1.1 1.9 2.4 1.7 1.9 2.8 3.2 1.9Services 12.5 8.1 9.6 8.4 9.0 9.9 9.8 8.9 8.0
Increase in Stocks 2.3 7.0 2.9 3.8 10.9 7.7 9.4 3.1 9.2Total 100.0 100.0 100.0 100.0 100.0 100.0 100.0 100.0 100.0
At Constant 1970 Prices
Fixed Capital Formation 99.1 92.7 97.4 97.9 89.5 92.3 90.9 98.7 92.5Agriculture, Forestry & Fishery 12.0 11.0 8.6 6.9 5.6 7.4 7.5 10.8 8.0Mining & Quarrying 1.2 1.0 1.0 1.0 o.6 0.5 0.7 o.6 0.5Manufacturing 24.7 26.2 22.4 21.8 17.6 18.3 17.6 19.3 23.2Construction 1.5 1.1 0.9 2.7 1.9 1.1 1.2 1.3 1.2Electricity,Water & Sanitary Services 5.8 4.9 8.3 10.8 10.8 10.5 8.0 6.0 3.4Transport, Storage & Communication 18.8 23.5 28.5 25.8 26.8 23.8 23.7 29.4 28.4Wholesale & Retail Trade 7.0 3.8 4.3 4.0 4.7 5.5 5.9 4.7 4.1Banking, Insurance & Real Estate 0.3 0.4 0.3 0.8 0.8 0.9 0.7 o.6 o.60>mership of Dwellings 13.5 11.2 11.4 13.2 10.0 12.5 12.8 13.4 12.7Public Administration 1.7 1.2 1.9 2.5 1.8 1.9 2.8 3.3 2.0Services 12.6 8.4 9.8 8.4 8.9 9.9 10.0 9.3 8.4
Increase in Stocks 0.9 7.3 2.6 2.1 10.5 7.7 9.1 1.3 7.5Total 100.0 100.0 100.0 100.0 100.0 100.0 100.0 100.0 -1000
Source: Some as Table 2. 7
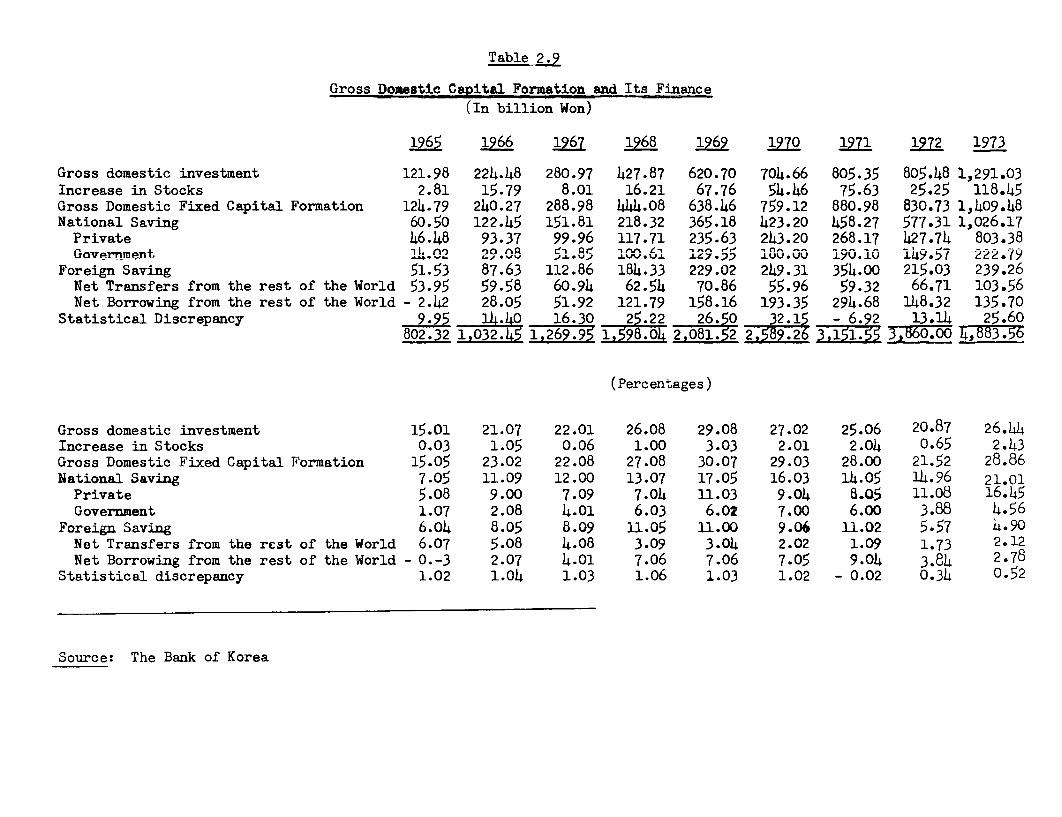
Table 2.9
Gross Domestic Capital Formation and Its Finance(In billion Won)
1965 1966 1967 1968 1969 1970 1971 1972 1973
Gross domestic investment 121.98 224.48 280.97 427.87 620.70 704.66 805.35 805.48 1,291.03Increase in Stocks 2.81 15.79 8.01 16.21 67.76 54.46 75.63 25.25 118.45Gross Domestic Fixed Capital Formation 124.79 240.27 288.98 444.08 638.46 759.12 880.98 830.73 1,409.48National Saving 60.50 122.45 151.81 218.32 365.18 423.20 458.27 577.31 1,026.17Private 46.48 93.37 99.96 117.71 235.63 243.20 268.17 427.74 803.38Government n) ,>o 9n8 5'8 if '1^ ."n , -^1 '95 iu u 190.10 149.57 222.79
Foreign Saving 51.53 87.63 112.86 184.33 229.02 249.31 354.00 215.03 239.26Net Transfers from the rest of the World 53.95 59.58 60.94 62.54 70.86 55.96 59.32 66.71 103.56Net-Borrowing from the rest of the World - 2.42 28.05 51.92 121.79 158.16 193.35 294.68 148.32 135.70
Statistical Discrepancy 9.95 14.40 16.30 25.22 26.50 32.15 - 6.92 13.14 25.60802.32 1,032.45 1 269.95 1598.04 2081.52 2589.26 3560.00 4,83.56
(Percentages)
Gross domestic investment 15.01 21.07 22.01 26.08 29.08 27.02 25.06 20.87 26.44Increase in Stocks 0.03 1.05 0.06 1.00 3.03 2.01 2.04 o.65 2.43Gross Domestic Fixed Capital Formation 15.05 23.02 22.08 27.08 30.07 29.03 28.00 21.52 28.86National Saving 7.05 11.09 12.00 13.07 17.05 16.03 14.05 14.96 21.01Private 5.08 9.00 7.09 7.04 11.03 9.04 8.Q5 11.08 16.45Government 1.07 2.08 4.01 6.03 6.02 7.00 6.00 3.88 4.56
Foreign Saving 6.04 8.05 8.09 11.05 11.00 9.06 11.02 5.57 4-.oNet Transfers from the rest of the World 6.07 5.08 4.08 3.09 3.04 2.02 1.09 1.73 2.12Net Borrowing from the rest of the World - 0.-3 2.07 4.01 7.06 7.06 7.05 9.04 3.84 2.78
Statistical discrepancy 1.02 1.04 1.03 1.06 1.03 1.02 - 0.02 0.34 0.52
Source: The Bank of Korea
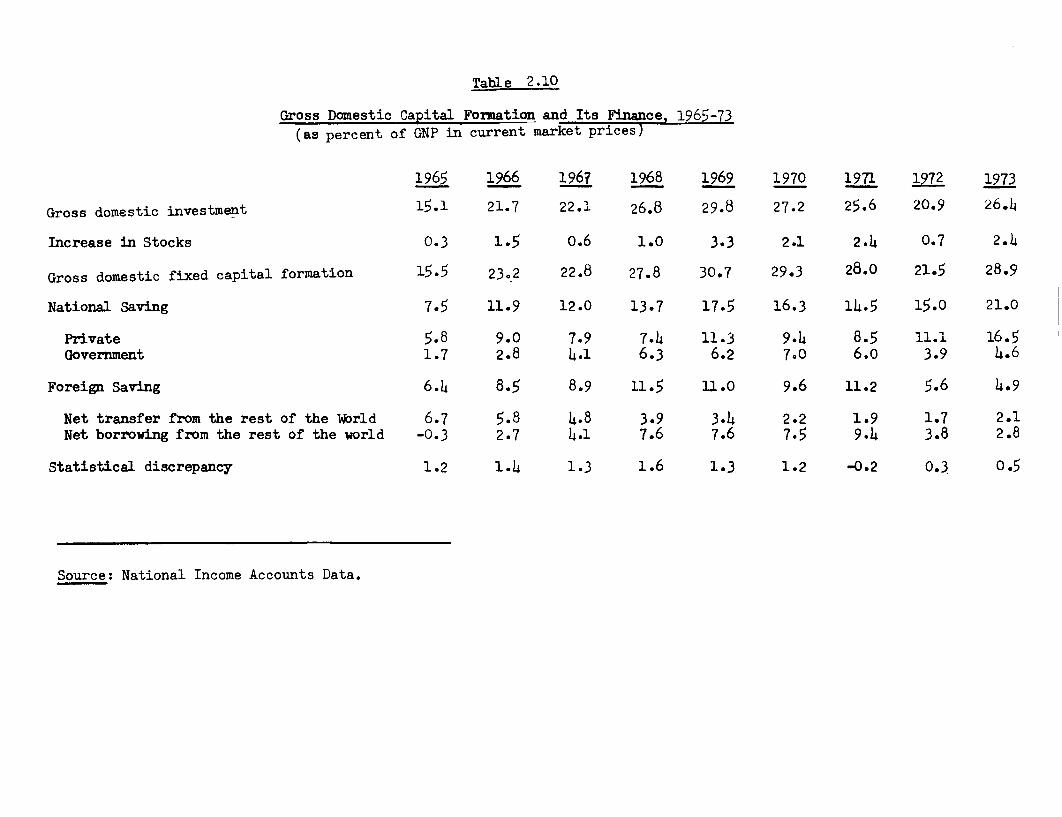
Table 2.10
Gross Domestic Capital Formation and Its Finance, 1965-73
(as percent of GNP in current market prices)
1965 1966 1967 1968 1969 1970 1971 1972 1973
Gross domestic investment 15.1 21.7 22.1 26.8 29.8 27.2 25.6 20.9 26.L
Increase in Stocks 0.3 1.5 o.6 1.0 3.3 2.1 2.4 0.7 2.4
Gross domestic fixed capital formation 15.5 23.2 22.8 27.8 30.7 29.3 28.0 21.5 28.9
National Saving 7.5 11.9 12.0 13.7 17.5 16.3 14.5 15.0 21.0
Private 5.8 9.0 7.9 7.4 11.3 9.4 8.5 11.1 16.5Government 1.7 2.8 4.1 6.3 6.2 7.0 6.o 3.9 4.6
Foreign Saving 6.h 8.5 8.9 11.5 U.0 9.6 11.2 5.6 4.9
Net transfer from the rest of the Wbrld 6.7 5.8 4.8 3.9 3.4 2.2 1.9 1.7 2.1Net borroving from the rest of the world -0.3 2.7 4.1 7.6 7.6 7.5 9.4 3.8 2.8
Statistical discrepancy 1.2 1.4 1.3 1.6 1.3 1.2 -0.2 0.3 0.5
Source: National Income Accounts Data.
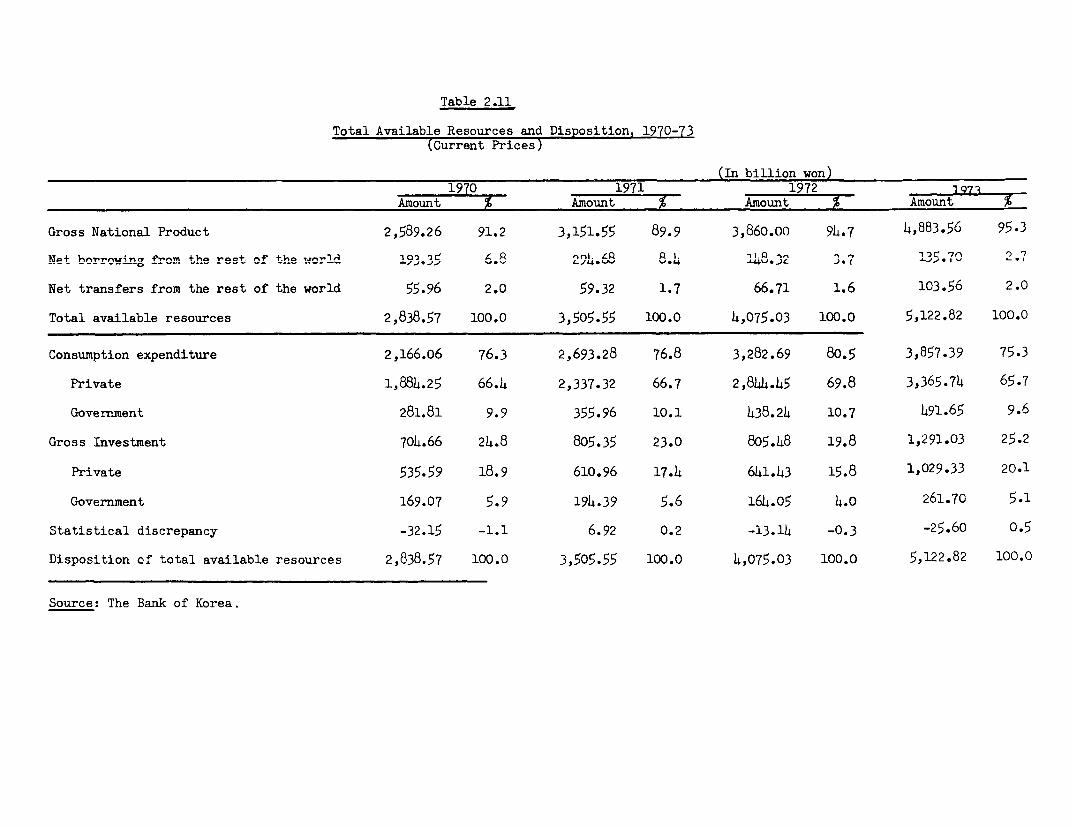
Table 2.11
Total Available Resources and Disposition, 1970-73(Current Prices)
(In billion won)
1970 1971 1972 1 -7 Amount % Amount Amount Amount
Gross National Product 2,589.26 91.2 3,151.55 89.9 3,860.00 94.7 4,883.56 95.3
Net borr.wina from the rest ^f the world 1°3.35 6.8 ,,. tR 8.4 -I8.32 Q..I 13.70 °.7
Net transfers from the rest of the world 55.96 2.0 59.32 1.7 66.71 1.6 103.56 2.0
Total available resources 2,838.57 100.0 3,505.55 100.0 4,075.03 1000. 5,122.82 100.0
Consumption expenditure 2,166.06 76.3 2,693.28 76.8 3,282.69 80.5 3,857.39 75.3
Private 1,884.25 66.4 2,337.32 66.7 2,844.45 69.8 3,365.74 65.7
Govern-ment 281.81 9.9 355.96 10.1 438.24 10.7 491.65 9.6
Gross Investment 704.66 24.8 805.35 23.0 805.48 19.8 1,291.03 25.2
Private 535-59 18.9 610.96 17.4 641.43 15.8 1,029.33 20.1
Government 169.07 5.9 194.39 5.6 164.05 4.0 261.70 5.1
Statistical discrepancy -32.15 -1.1 6.92 0.2 -13.14 -0.3 -25.60 0.5
Disposition of total available resources 2,838.57 100.0 3,505.55 100.0 4,075.03 100.0 5,122.82 100.0
Source: The Bank of Korea.
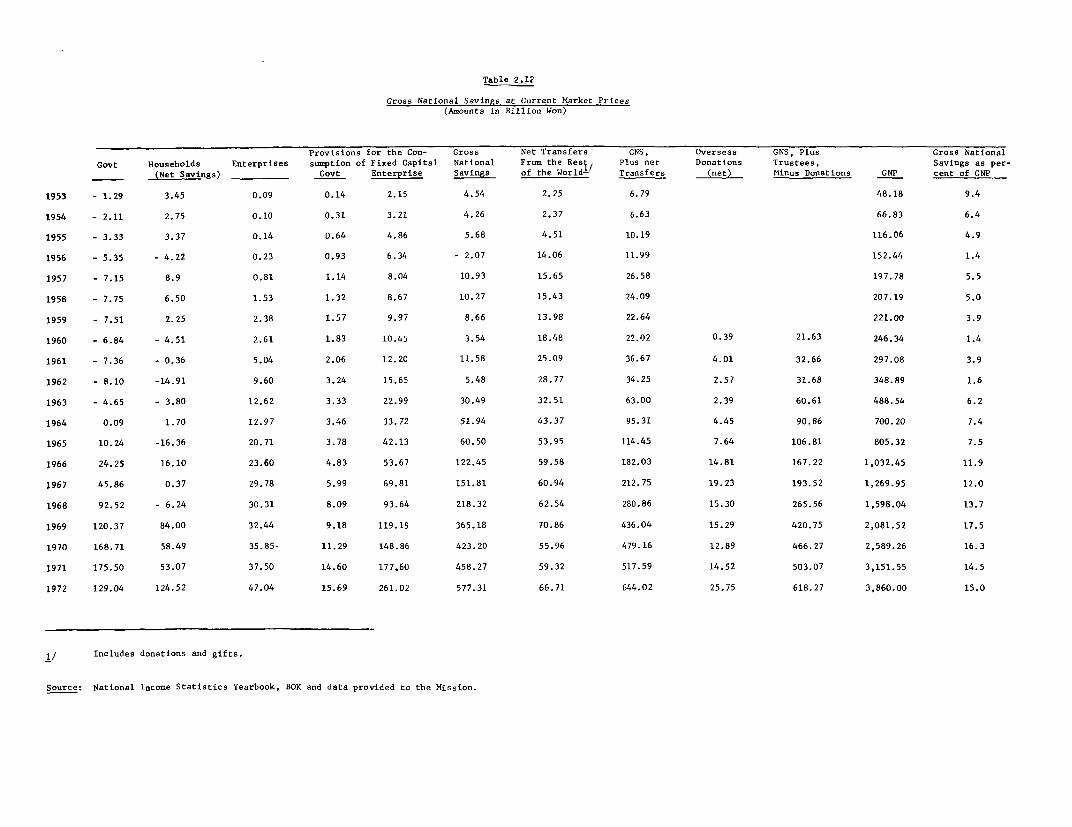
Table 2.12
Gross National Savings at Current Market Prices(Amounts in Billion Won)
Provisions for the Con- Gross Net Transfers GNS, Overseas GNS, Plus Gross NationalGovt Households Enterprises sumption of Fixed Capital National From the Resi, Plus net Donations Trustees, Savings as per-
__(Net Savings) Govt Enterprise Savings of the World- Transfers (iiet) Minus Donations GNP cent of GNP
1953 - 1.29 3.45 0.09 0.14 2.15 4.54 2.25 6.79 48.18 9.4
1954 - 2.11 2.75 0.10 0.31 3.21 4.26 2.37 6.63 66.83 6.4
1955 - 3.33 3.37 0.14 0.64 4.86 5.68 4.51 10.19 116.06 4.9
1956 - 5.35 - 4.22 0.23 0.93 6.34 - 2.07 14.06 11.99 152.44 1.4
1957 - 7.15 8.9 0.81 1.14 8.04 10.93 15.65 26.58 197.78 5.5
1958 - 7.75 6.50 1.53 1.32 8.67 10.27 15.43 24.09 207.19 5.0
1959 - 7.51 2.25 2.38 1.57 9.97 8.66 13.98 22.64 221.00 3.9
1960 - 6.84 - 4.51 2.61 1.83 10.45 3.54 18.48 22.02 0.39 21.63 246.34 1.4
1961 - 7.36 - 0.36 5.04 2.06 12.20 11.58 25.09 36.67 4.01 32.66 297.08 3.9
1962 - 8.10 -14.91 9.60 3.24 15.65 5.48 28.77 34.25 2.57 31.68 348.89 1.6
1963 - 4.65 - 3.80 12.62 3.33 22.99 30.49 32.51 63.00 2.39 60.61 488.54 6.2
1964 0.09 1.70 12.97 3.46 33.72 51.94 43.37 95.31 4.45 90.86 700.20 7.4
1965 10.24 -16.36 20.71 3.78 42.13 60.50 53.95 114.45 7.64 106.81 805.32 7.5
1966 24.25 16.10 23.60 4.83 53.67 122.45 59.58 182.03 14.81 167.22 1,032.45 11.9
1967 45.86 0.37 29.78 5.99 69.81 151.81 60.94 212.75 19.23 193.52 1,269.95 12.0
1968 92.52 - 6.24 30.31 8.09 93.64 218.32 62.54 280.86 15.30 265.56 1,598.04 13.7
1969 120.37 84.00 32.44 9.18 119.19 365.18 70.86 436.04 15.29 420.75 2,081.52 17.5
1970 168.71 58.49 35.85- 11.29 148.86 423.20 55.96 479.16 12.89 466.27 2,589.26 16.3
1971 175.50 53.07 37.50 14.60 177.60 458.27 59.32 517.59 14.52 503.07 3,151.55 14.5
1972 129.04 124.52 47.04 15.69 261.02 577.31 66.71 644.02 25.75 618.27 3,860.00 15.0
1/ Includes donations and gifts.
Source: National Income Statistics Yearbook, BOK and data provided to the Mission.

Table 2.13
The Rate of Gross Domestic Savings as percent of GDP(In percent)
Net Savings Provisionsfor the con- Factor Incomesumption of Payment
Govt. Household Interprises Total Fixed Capital (net) Total GDS
1953 - 2.7 7.2 0.2 4.7 4.8 - 1.2 8.3
1954 - 3.2 4.2 0.2 1.2 5.3 - 1.0 5.5
1955 - 2.9 3.0 0.1 0.2 4.8 - 1.2 3.8
1956 - 3.6 - 2.8 0.2 - 6.2 4.8 - 0.9 - 2.3
1957 - 3.7 4.1 0.4 0.8 4.7 - 0.7 4.8
1958 - 3.8 3.2 0.7 0.1 4.9 - 0.7 4.3
1959 - 3.4 1.0 1.1 - 1.3 5.3 - 0.7 3.3
1960 - 2.9 - 1.8 1.1 - 3.6 5.0 - 0.7 0.7
1961 - 2.5 - 0.1 1.7 - 0.9 4.8 - 0.9 3.0
1962 - 2.3 - 4.3 2.8 - 3.8 5.4 - 0.9 0.7
1963 - 1.0 - 0.8 2.6 0.8 5.4 - 0.6 5.6
1964 0.0 0.2 1.9 2.1 5.4 - 0. 8 6.7
1965 1.3 - 2.1 2.6 1.8 5.8 - 1.0 6.6
1966 2.4 1.6 2.3 6.3 5.7 - 1.3 10.7
1967 3.7 0.0 2.4 6.1 6.1 - 1. 8 10.4
1968 5.9 - 0.4 1.9 7.4 6.5 - 1.5 12.4
1969 5.8 4.1 1.6 11.5 6.2 - 1.2 16.5
1970 6.5 2.3 1.4 10.2 6.2 - 0.4 16.0
1971 5.5 1.7 1.2 8.5 6.1 0.1 14.6
1972 3.3 3.2 1.2 7.7 7.2 0.4 15.3
Source: Calculated from National Incone Data.

Table 2.14
Saving Ratios at Current and Constant Prices, 1954-72(Amiounts in Billion Won)
IAT CURRENT PRICES: AT CONSTANT 1970 PRICES:
Year Annual Changes in: Marginal Rate of Savings Annual Changes in: Marginal Rate of SavingsGNS GNP GDS GDP GNS GDS GNS GNP GDS GDP GNS GDS
(In percent) (In percent)
1954 - 0.28 18.65 - 0.35 18.63 - 1.5 - l.Y - 1.46 46.66 0.72 248.84 - 3.1 - 2.9
1955 0.92 49.23 0.68 48.44 1.9 1.4 -21.37 48.06 -21.59 47.84 -44.5 -45.1
1956 - 7.75 36.38 - 7.76 36.37 -21.3 -21.3 -37.75 3.97 -37.32 4.40 -950.9 -848.2
1957 13.00 45.34 12.96 45.30 28.7 28.0 41.46 72.23 41.22 71.99 57.4 57.3
1958 - 0.66 9.41 - 0.66 9.41 - 7.0 - 7.0 6.17 52.71 6.16 52.70 11.7 11.7
1959 - 1.61 13.81 - 1.64 13.78 -11.7 -11.9 0.04 41.18 - 0.14 41.00 0.1 - 0.3
1960 - 5.12 25.34 - 5.47 24.99 -20.2 -21.9 - 5.99 21.39 - 5.55 21.83 -28.0 -25.4
1961 8.04 50.74 7.07 49.77 15.9 14.2 44.60 54.76 46.46 56.62 81.5 82.1
1962 - 6.10 51.81 - 6.50 51.41 -11.8 -12.6 -30.54 36.50 -31.34 35.70 -83.7 -87.8
1963 25.01 139.65 24.86 139.50 17.9 17.8 70.80 107.33 70.42 106.95 66.0 65.8
1964 21.45 211.66 19.53 209.74 10.1 9.3 19.47 113.68 19.78 113.99 17.1 17.4
1965 8.56 105.12 6.17 102.72 8.1 6.0 17.49 87.71 16.19 86.41 19.9 18.7
1966 61.95 227.13 56.22 221.40 27.3 25.4 80.22 189.48 73.85 183.11 42.3 40.3
1967 29.36 237.50 20.79 228.93 12.4 9.1 21.61 133.89 11.73 123.95 16.1 9.5
1968 66.51 328.09 65.28 326.86 20.3 20.0 63.30 234.11 62.46 233.27 27.0 26.8
1969 146.86 483.48 145.01 481.63 30.4 30.1 165.26 313.37 164.33 312.44 52.7 52.6
1970 58.02 507.74 71.15 520.87 11.4 13.7 -11.98 188.77 3.08 203.83 - 6.4 1.5
1971 35.07 562.29 51.23 576.45 6.2 8.9 -22.76 237.56 - 8.84 251.48 _ 9.6 - 3.05
1972 119.04 708.45 132.10 721.51 16.8 18.3 65.34 196.81 75.43 206.90 33.2 36.5
II
Marginal Rates of Savings(In percent)
Averages of AT CONSTANT PRICES AT CURRENT PRICESYearly Rates
1953-57 -196.3 -174.8 0.5 0.3
1958-62 1.2 0.9 - 4.3 - 5.3
1963-67 28.5 26.4 15.1 13.4
1968-72 19.4 22.9 16.8 18.1
Source: Based on Official Statistics
4) 4%.�$.I 41100 .I r- I-. 0 4 IN 0 0' 41414.4.4.-4444) . . .41.141 It 111 4 -. 4NNIdNIN 4 .4 4. IN
13 4N4141In44IN4In4. IN Vt
-A4'. "� 9 0' '4 41 4 - 4 In 440...0004 0 0 4 0 4 4 4
4444 InO.4-41044t.4Q...��1$404 - - - - - � �
0j�
-c $4444 4 In 0 4 0 4 4 4. 411 N 0 4 4 4 41 0
*1441..44 0IN441..l4 4 t. 4 C 4 41
4' . .44))
14 41 4.414)
I) -
- - IN IN 4 4 -. 41 4 4 4 N 4 0
.4� 4 1
IN4IN..4r-. 4 In 4 IN 4 4 4 0 0 I' 0 4ININ 0IN4-4)41fl141
* � 41.*�0 4 4 0 0 04.04.44.4 I.. 4 4 '4 4IN4IN441InIn...4
414 IN N IN "' 41 IN - N IN 0 41 .4 IN In
4 4 0 414 IC 4 4
44 - 41
40.4 411 4' 440 4 0 4 - 0
4.) 4141-4.40 C�4 411
4 4 ID 4 4 4 41 4 41 '.4 4 - 4IN IN 0 4 N 4 4 4 0 IN 4 0 41414144.4...4In ON 4' 4
. . .N 4 4 In IN 41 0 IN 0 411 0 4 IN 4 0 0 4' 4. N 4
2 E2)ININIn.4SID��044��4In IN � c 41 0 0 0 4 0 4' 0 0 4 41' 4' 4
41 4
0-' 1414
� 441� 4
$4lI�� 4 4 IN 0 It' 41 N 4 In'4'�'InInInINN4 0 4 41 - $4 IN 41 4 4NINInN44...... 4
4 .411414.4.o IN 4 In 4 N 4 0 N 41. 0 4 In 4 In
41 41 - In .4 4 4 '014
41� 4' 4 - 40441 It' 4 41 41
.4 414)
-4 4 In 4 411 4 44NNN41 4141
In IN 4'44 4 4 4 - 0 4' 0 4 .3 4 4 41 4'
4 .11 1411 4 4 4 In 4' 4 .4 4 41 4 4 .' 4'.. INININNIN4.In.4.4 4It'
'4 1441
1114 4 4141IN 41.4 4 4 IN IN4)
4 4'
41 4 4 4' 41 0 4 N .4 1411 4 IN 4 4
IN �4 N 41 In 4 41 4 .4 .4 IN 41 4 -4 4' 411 4 IN In 4 4N 4 141 4' In
4 1'. 4 In 41 4 4 411 4 In 4 N .4 � 1111 0 N .4 0 411 .4 -440 41 0
0 4 4 0 4 .4 0 4 0 4 4 In 4 41 4' 4' 0 0 4 4 4 0' 4 4 411 4' 4 .4
4j IN IN 4 4 4 4 41 IN 4 4 41 4
21 4141414141 .4
4.
4 0 4' 4 4 In 4' N IN 4 0 In IN N
� N 0 41 41 414 1
04J4In 4141 4 4 0 0 0 0 0 0 0 0 41 0 0 0 0 41
ON 4141114. � � 4' 0' '4 4' � 0 0 0 0 41 0 0 0 41 0 0 0
44410NIn.4'N 4 4 .4 .4 4 0 0 0 0 41 4' 0 41 0 41 0 0
IN IN IN 4 '4 4 4 0 IN 4 0 It' 41 4 44141414141 .4
4 'C
1.) 0
� 4 4 0 4 4' - 4 41 IN It' 4 0 41 0
44�4 In 4 4 .4 4 4 In 41 IN N 0 0' 41 .4 4 4 '4 . 4 In 4 4 4' 0 41 In 41
44$44$4$4 41 4 .4 44.41.4.4.441414141 41 N 41 4 41 In INN $4
C� 4
41 14
41.
41 41 '4 41 .4 311 '4 4.404 41 04441 4, 0 4 IN 41 .4 41 In 4 0 0 41 4' N
IN 41414144141 4 4 4 N N ..� 41 0 '4 4 .4 '4 4 4 4 N N
N .1,4 4 .4 4 '0 4 4 44In4,In4'4 I)
IN 0 4 N In 4 41 0 41 0 0 14 IN14� 4 IN -� .4 0.41-441411. 414.41 4 - IN '4 IfI 44414.414. 4 0 '14 41
0
4 0
0 4 0 - 4 4 0 41 4 '4 4 0 41 40 N 44141NIN 4 0.4N44, 411 N 4 4 N 4 IN 0
4141414441.441 '4 4 41 44 414'141411INIn � o 0 0 41 41 .4 4
O41N41444.4 4 4 0 41 IN
'4 '4 '4-' '4 '4 '4 '4 14 '0 '4 N N N O��In4�t'.4N 4 4 0 41 IN
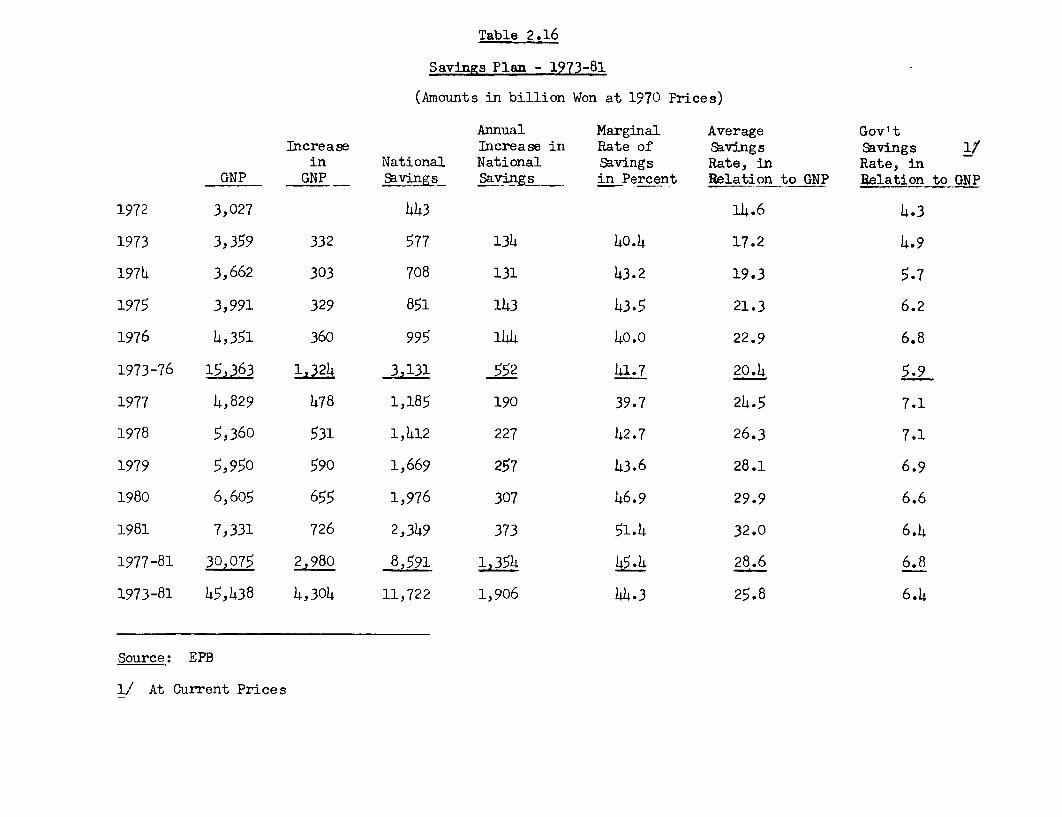
Table 2.16
Savings Plan - 1973-81
(Amounts in billion Won at 1970 Prices)
Annual Marginal Average Gov'tIncrease Increase in Rate of Savings Savings 1/
in National National Savings Rate, in Rate, inGNP GNP Savings Savings in Percent Relation to GNP Relation to GNP
1972 3,027 443 14.6 4.3
1973 3,359 332 577 134 40.4 17.2 4.9
1974 3,662 303 708 131 43.2 19.3 5.7
1975 3,991 329 851 143 43.5 21.3 6.2
1976 4,351 360 995 144 40.0 22.9 6.8
1973-76 15,363 1,324 3,131 552 41.7 20.4 5.9
1977 4,829 478 1,185 190 39.7 24.5 7.1
1978 5,360 531 1,412 227 42.7 26.3 7.1
1979 5,950 590 1,669 257 43.6 28.1 6.9
1980 6,605 655 1,976 307 46.9 29.9 6.6
1981 7,331 726 2,349 373 51.4 32.0 6.4
1977-81 30,075 2,980 8,591 1,354 45.4 28.6 6.8
1973-81 45,438 4,304 11,722 1,906 44.3 25.8 6.4
Source: EPB
1/ At Current Prices

Table 2.17
Sectoral Marginal Capital-Output Ratio
1967-71 1972 1973-76 1977-81
Agriculture, Forestryand Fisheries -0.68 3.3 3.1 3,5
Nining -3.78 n.a. 5.0 5.0
Manufacturing 1.42 1.2 2.0 2.0
Social Overhead Capital 6.17 12.4 6.5 7.0
Others 2.23 3.8 2.5 2.7
Average 2.63 3.2 2.9 3.0
Average GDPSummary Average ICORV Growth Rate %)
1959-1972 (Actual) 2.23 7.8
First Five-Year Plan (Actual (1962-66) 2.94 7.8
Second Five-Year Plan (Actual) (1967-71) 2.25 1005
Third Five-Year Plan (Criginal) 2.92 8.6
Third Five-Year Plan (Revised) (1972-76) 2.72 9.0?!
Fourth Five-Year Plan (1977-81) 3.0032/ 1.
1/ One-year lag.
2/ 9.5 percent (1973-76).
3/ Official estimates.
Source: Based on Natio:aal'Accounts Data and data supplied to the mission.

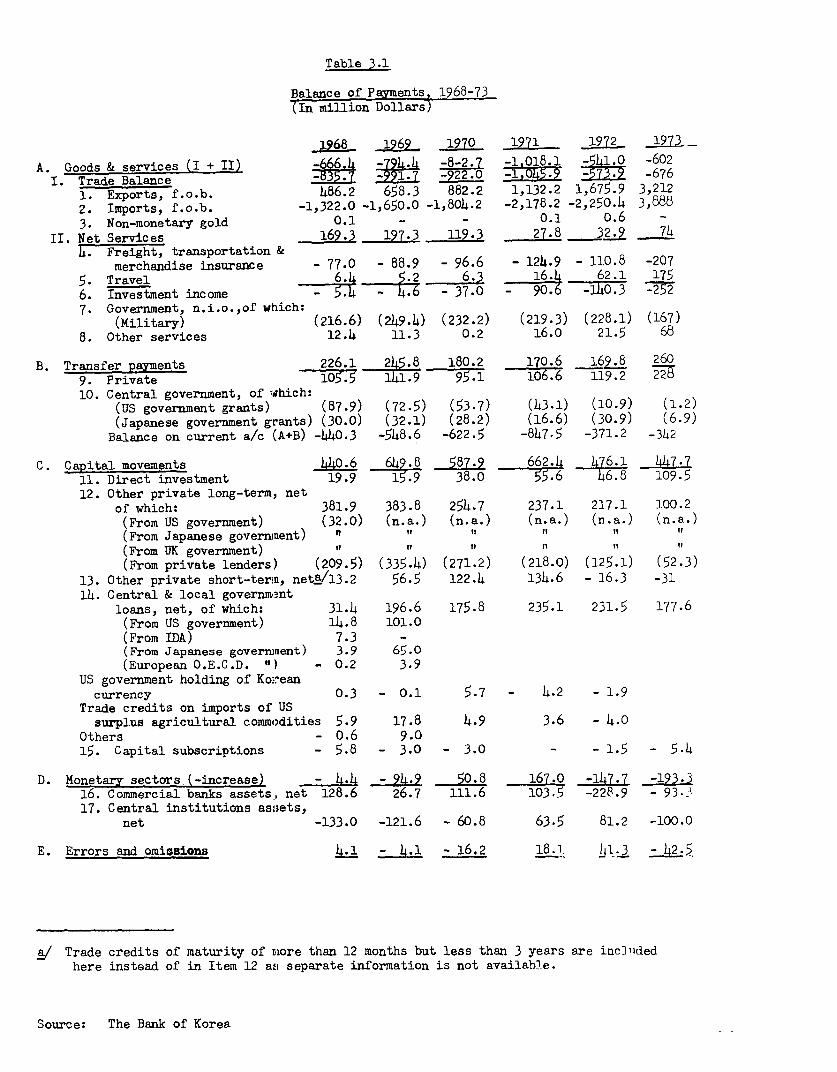
Table 3.1
Balance of Payments, 1968-73(In million Dollars)
1968 1969- 1970 1971 1972 _1973
A. Goods & services (I + -56 -1 018.1 -602I. Trade Balance -835.7 -99~1- 2l.2 -676.321
1. Exports, f.o.b. 486.2 658.3 882.2 1,132.2 1,675.9 3,2122. Imports, f.o.b. -1,322.0 -1,650.0 -1,804.2 -2,178.2 -2,250.4 3,8883. Non-monetary gold 0.1 - - 0.1 0.6 -
II. Net Services 169.3 197.3 119.3 27.8 32 744. Freight, transportation &
merchandise insurance - 77.0 - 88.9 - 96.6 - 124.9 - 110.8 -2075. Travel 6.4 6.3 16.4 62.1 1756. Investment income - 5.4 - 37.0 9o.6 -140.3 -227. Government, n.i.o.,of which:
(Military) (216.6) (249.4) (232.2) (219.3) (228.1) (167)8. Other services 12.4 11.3 0.2 16.0 21.5 68
B. Transfer payments 226.1 245.8 180.2 17o.6 _66.8 2609. Private 105.5 141.9 95.1 106.6 119.210. Central government, of ghich:
(US government grants) (87.9) (72.5) (53.7) (43.1) (10.9) (1.2)(Japanese government grants) (30.0) (32.1) (28.2) (16.6) (30.9) (6-9)
Balance on current a/c (A+B) -440.3 -548.6 -622.5 -847.5 -371.2 -342
C. Capital movements 440.6 649.8 587-9 662.4 476.1 447.711. Direct investment 19.9 15.9 38.0 .6 46.8 109.512. Other private long-term, net
of which: 381.9 383.8 254.7 237.1 217.1 100.2(From US government) (32.0) (n.a.) (n.a.) (n.a.) (n.a.) (n.a.)(From Japanese government) nI ni It(From UK government) n n It(From private lenders) (209.5) (335.4) (271.2) (218.0) (125.1) (52.3)
13. Other private short-terms, nett/13.2 56.5 122.4 134.6 - 16.3 -3114. Central & local government
loans, net, of which: 31.4 196.6 175.8 235.1 231.5 177.6(From US government) 14.8 101.0(From IDA) 7.3 -(From Japanese govermnent) 3.9 65.0(European O.E.C.D. ") - 0.2 3.9
US government holding of Koreancurrency 0.3 - 0.1 5.7 - 4.2 - 1.9
Trade credits on imports of USsurplus agricultural commodities 5.9 17.8 4.9 3.6 - 4.0
Others - 0.6 9.015. Capital subscriptions - 5.8 - 3.0 - 3.0 - - 1.5 - 5-4
D. Monetary sectors.(-increase) - 4.4 - 94.9 50.8 167.0 -147.7 -193.316. Commercial banks assets, net 128.6 26.7 111.6 103.5 -228.9 - 93.317. Central institutions ass;ets,
net -133.0 -121.6 - 60.8 63.5 81.2 -100.0
E. Errors and omissions 4.1 - 4.1 - 16.2 18.1. )1:1 I
a! Trade credits of maturity of more than 12 months but less than 3 years are incIldedhere instead of in Item 12 a<; separate information is not available.
Source: The Bank of Korea
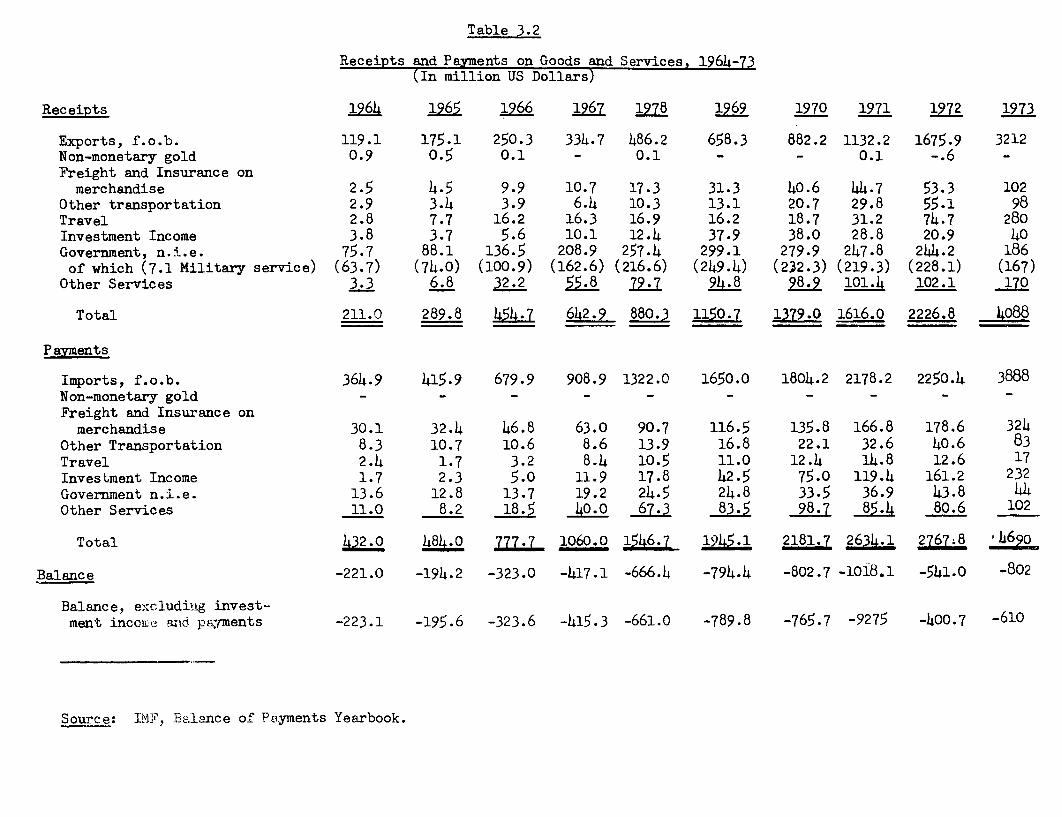
Table 3.2
Receipts and Payments on Goods and Services, 1964-73(In million US Dollars)
Receipts 1964 1965 1966 1967 1978 1969 1970 1971 1972 1973
Exports, f.o.b. 119.1 175.1 250.3 334.7 486.2 658.3 882.2 1132.2 1675.9 3212Non-monetary gold 0.9 0.5 0.1 - 0.1 - - 0.1 -. 6 -Freight and Insurance on
merchandise 2.5 4.5 9.9 10.7 17.3 31.3 40.6 44.7 53.3 102Other transportation 2.9 3.4 3.9 6.4 10.3 13.1 20.7 29.8 55.1 98Travel 2.8 7.7 16.2 16.3 16.9 16.2 18.7 31.2 74.7 280Investment Income 3.8 3.7 5.6 10.1 12.4 37.9 38.0 28.8 20.9 40Government, n.i.e. 75.7 88.1 136.5 208.9 257.4 299.1 279.9 247.8 244.2 186of which (7.1 Military service) (63.7) (74.0) (100.9) (162.6) (216.6) (249.4) (232.3) (219.3) (228.1) (167)
Other Services 3.3 6.8 32.2 79.7 9.8 98.9 101.4 102.1 170
Total 211.0 289.8 45.7 6142.9 880.3 1150.7 1379.0 1616.0 2226.8 14088
Payments
Imports, f.o.b. 364.9 415.9 679.9 908.9 1322.0 1650.0 1804.2 2178.2 2250.4 3888Non-monetary gold - - - - - - - - - -
Freight and Insurance onmerchandise 30.1 32.4 46.8 63.0 90.7 116.5 135.8 166.8 178.6 324
Other Transportation 8.3 10.7 10.6 8.6 13.9 16.8 22.1 32.6 40.6 83Travel 2.4 1.7 3.2 8.4 10.5 11.0 12.4 14.8 12.6 17Investment Income 1.7 2.3 5.0 11.9 17.8 42.5 75.0 119.4 161.2 232Government n.i.e. 13.6 12.8 13.7 19.2 24.5 24.8 33.5 36.9 43.8 44Other Services 11.0 8.2 18.5 40.0 67.3 83.5 98.7 85.4 80.6 102
Total 432.0 484.0 777.7 1060.0 1546.7 1945.1 2181.7 2634.1 2767.8 4b690
Balance -221.0 -194.2 -323.0 -417.1 -666.4 -794.4 -802.7 -1018.1 -541.0 -802
Balance, excluding invest-men-t incouic- axic' payments -223.1 -195.6 -323.6 -415.3 -661.0 -789.8 -765.7 -9275 -400.7 -610
Source: IMF, Balance of Payments Yearbook.
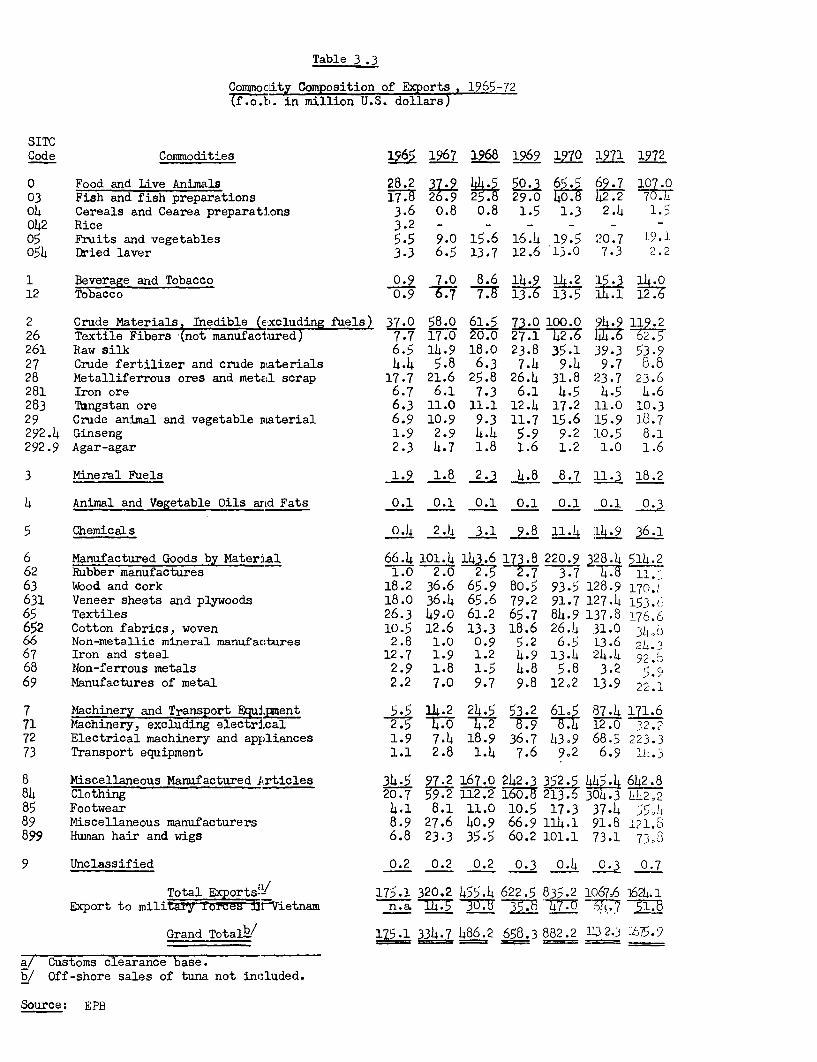
Table 3 .3
Commocdity Composition of Exports , 1965-72(f.o.b. in million U.S. dollars)
SITCCode Commodities 1965 1967 1968 1969 1970 1971 1972
O Food and Live Animals 28.2 37.9 44.5 50.3 65.5 69.7 107.003 Fish and fish preparations 17.8 2 59 2T 29.0 41o80 lt2.2 70.104 Cereals and Cearea preparations 3.6 0.8 0.8 1.5 1.3 2.4 1.5042 Rice 3.2 - - - - - _05 Fruits and vegetables 5.5 9.0 15.6 16.4 19.5 '20.7 19-1054 Dried laver 3.3 6.5 13.7 12.6 13.0 7.3 2.2
1 Beverage and Tobacco 0.9 7.0 8.6 14.9 14.2 15.3 14.012 Tobacco 0.9 6.7 77 13.6 :34.1 12 6
2 Crude Materials, Inedible (excluding fuels) 37.0 58.0 61.5 73.0 100.0 94.9 119.226 Textile Fibers (not manufactured) 7.7 17.0 20.0 27.1 -72 47.6 62.5261 Raw silk 6.5 14.9 18.0 23.8 35.1 39.3 53.927 Crude fertilizer and crude nmaterials 4.4 5.8 6.3 7.4 9.4 9.7 8.828 Metalliferrous ores and metal scrap 17.7 21.6 25.8 26.4 31.8 23.7 23.6281 Iron ore 6.7 6.1 7.3 6.1 4.5 4.5 4.6283 T1ngstan ore 6.3 11.0 11.1 12.4 17.2 11.0 10.329 Crude animal and vegetable material 6.9 10.9 9.3 11.7 15.6 :L5.9 18.7292.4 Ginseng 1.9 2.9 4.4 5.9 9.2 L0.5 8.1292.9 Agar-agar 2.3 4.7 1.8 1.6 1.2 1.0 1.6
3 Mineral Fuels 1.9 1.8 2.3 4.8 8.7 18.2
4 Animal and Vegetable Oils arnd Fats 0.1 0.1 0.1 0.1 0.1 0.1 0.3
5 Chemicals 0.4 2.4 3.1 9.8 11.4 14.9 36.1
6 Manufactured Goods by Material 66.4 101.4 143.6 173.8 220.9 228.4 .262 Rubber manufactures 1.0 2.0 2.5 2.7 3.7 4-8 11.:63 Wood and cork 18.2 36.6 65.9 80.5 93.5 128.9 170.:631 Veneer sheets and plywoods 18.0 36.4 65.6 79.2 91.7 127.4 153.865 Textiles 26.3 49.0 61.2 65.7 84.9 137.8 176.6652 Cotton fabrics, woven 10.5 12.6 13.3 18.6 26.4 31.0 34a,,66 Non-metallic mineral manufactures 2.8 1.0 0.9 5.2 6.5 13.6 24.367 Iron and steel 12.7 1.9 1.2 4.9 13.4 24.4 9268 Non-ferrous metals 2.9 1.8 1.5 4.8 5.8 3.2 r C
69 Manufactures of metal 2.2 7.0 9.7 9.8 12.2 13-9 22.1
7 Machinery and Transport EquipZ ent 5.5 14.2 24.5 53.2 61.5 87.4 171.671 Machinery, excluding electrical 2.5 4.0 4.2 T79 8.4 12.0 32.272 Electrical machinery and appliances 1.9 7.4 18.9 36.7 43.9 68.5 223.373 Transport equipment 1.1 2.8 1.4 7.6 9,2 6.9 1L.3
8 Miscellaneous Manufactured hrticles 34.5 97.2 167.0 242.3 352.5 445.4 642.884 Clothing 549 112.2 f6i5-I236 3 1P42.285 Footwear 4.1 8.1 11.0 10.5 17.3 37.4 ,5$489 Miscellaneous manufacturers 8.9 27.6 40.9 66.9 114.1 91.8 121.8899 Human hair and wigs 6.8 23.3 35.5 60.2 101.1 73.1 7308
9 Unclassified 0.2 0.2 0.2 0.3 0.4 0.3 0.7
Total Exports'/ 175.1 320.2 455.4 622.5 835.2 1067.6 6264.1Export to military forces nr-Vietnam n.-a 14.5 30.F 357B 7775 .77
Grand Totalb/ 175.1 334.7 486.2 658.3 882.2 12 2.3 675.9
a/ Customs clearance base.b/ 0ff-shore sales of tuna not included.
Source: EPB
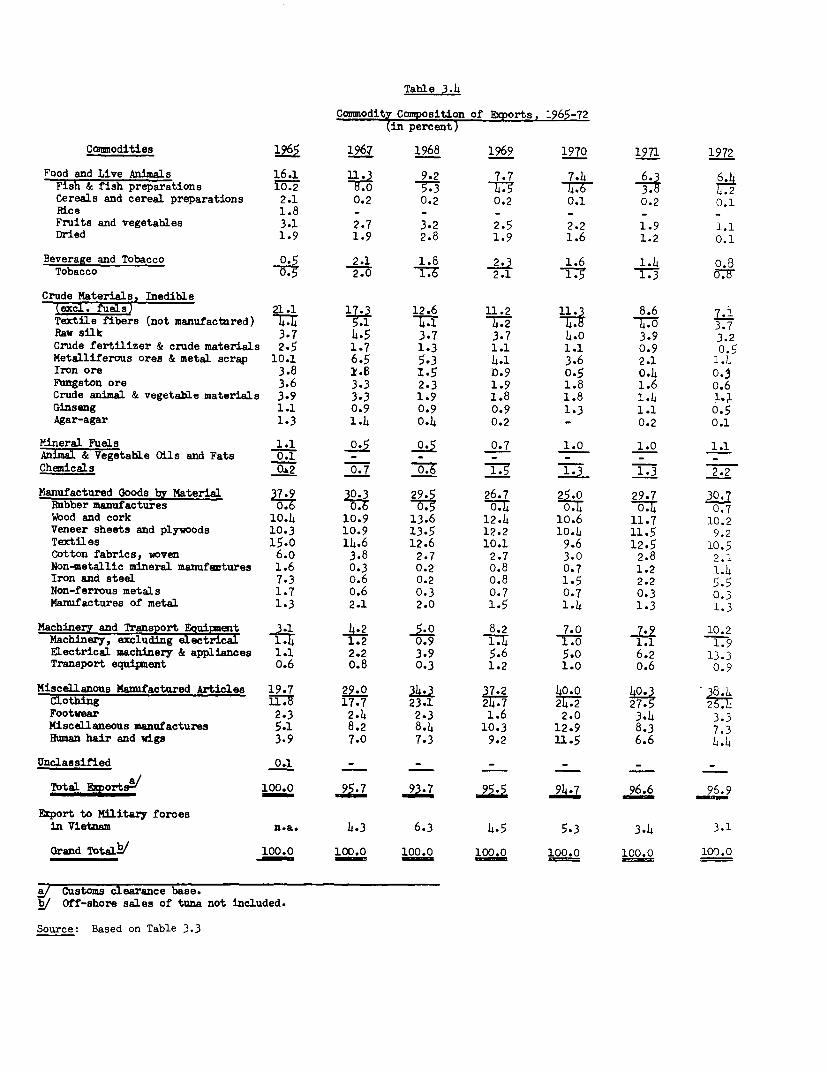
Table 3.4
Commodity Composition of Exports, 1965-72(in percent)
Commodities 1965 1967 1968 1969 1970 1971 1972
Food and Live Animals 16.1 21 9.2 7.7 7.4 6 6.4Fish & fish preparations 10.2 .0 5-3 4.5 4.6 3. 4.2Cereals and cereal preparations 2.1 0.2 0.2 0.2 0.1 0.2 0.1Rice 1.8 - - - - - -
Fruits and vegetables 3.1 2.7 3.2 2.5 2.2 1.9 1.1Dried 1.9 1.9 2.8 1.9 1.6 1.2 0.1
Beverage and Tobacco o.5 2.1 1.8 2.3 1.6 1.4 0.8Tobacco 0.5; 2 1.6 2.1 1 1.3 od
Crude Materials, Inedible(excl. fuels) 21.1 17.3 12.6 11.2 11.3 8.6 7.iTextile fibers (not manufactured) T7 51- 4.1 4.2- t 7-° 3.7Raw silk 3.7 4.5 3.7 3.7 4.0 3.9 3.2Crude fertilizer & crude materials 2.5 1.7 1.3 1.1 1.1 0.9 0.5Metalliferous ores & metal scrap 10.1 6.5 5.3 4.1 3.6 2.1 1.4Iron ore 3.8 1.8 1.5 D.9 0.5 0.4 °-3Fungston ore 3.6 3.3 2.3 1.9 1.8 1.6 o.6Crude animal & vegetable materials 3.9 3.3 1.9 1.8 1.8 1.4 3 XGinseng 1.1 0.9 0.9 0.9 1-3 1.1 0.5Agar-agar 1.3 1.4 0.4 0.2 - 0.2 0.1
Mineral Fuels 1.1 0.5 o.5 0.7 1.0 1.0 1.1Animal & Vegetable Oils and Fats 0.1 - - - - - -
Chemicals 0.2 0.7 _067 __13 1.73 2.2
Manufactured Goods by Material 37.9 30 295 26.7 25.o 29.7 3°7Rubber manufactures 2.6 0. 0.5 09. .71 0.7Wood and cork 10.4 10.9 13.6 12.4 10.6 11.7 10.2Veneer sheets and plyvoods 10.3 10.9 13.5 12.2 10.4 11.5 9.2Textiles 15.0 14.6 12.6 10.1 9.6 12.5 10.5Cotton fabrics, woven 6.o 3.8 2.7 2.7 3.0 2.8 2.1Non-metallic mineral manufactures 1.6 0.3 0.2 0.8 0.7 1.2 1.4Iron and steel 7.3 o.6 0.2 o.8 1.5 2.2 5.5Non-ferrous metals 1.7 o.6 0.3 0.7 0.7 0.3 0.3Manufactures of metal 1.3 2.1 2.0 1.5 1.4 1.3 1.3
Machinery and Transport Eauiiment 3.1 4.2 8.2 7.0 7.9 10.2Machinery, excluding electrical 1.4 1.2 0.9 1.4 1.0 1.1 1.9Electrical machinery & appliances 1.1 2.2 3.9 5.6 5.0 6.2 13.3Transport equipment 0.6 0.8 0.3 1.2 1.0 o.6 0.9
MiscelUanous Manufactured Articles 19.7 29.0 34 L 37-2 40.0 40.3 384Clothing 11.8 17.7 23.1 24.7 24.2 27.-
Footwear 2.3 2.4 2.3 1.6 2.0 3.4 3.3Miscellaneous manufactures 5.1 8.2 8.4 10.3 12.9 8.3 7.3Human hair and wigs 3.9 7.0 7.3 9.2 u1.5 6.6 4.4
Unclassified 0.1 - - - - -
Total MportsA' 100.0 L 93.7 95.5 96.6 -96.9
Export to Military forcesin Vietnam n.a. 4.3 6.3 4.5 5-3 3.4 3.1
Grand Totali 100.0 100.0 100.0 1000 100.0 lCo.0 100.0
/ Customs clearance base.o 0ff-shore sales of tuna not included.
Source: Based on Table 3.3

Table 3.5
Commodity Composition of Imports, 1964-73(c.i.f. in million U.S. dollars)
snTOCode Commodities 16 1965 19 196 1969 10 171 72 1973k'
0 Food 68.2 .5 72.4 9P4.1 1 3 T 275.D04 Cereals and cereal preparations 3E7T5 6.3 129.3 32S3 244.8 30 1.1 282.7
041 Wheat 36.8 35.9 40.5 46.3 62.8 90.3 79.5 115.1 128.1 84.706 Sugar and sugar preparations. 3.8 4.0 6.2 9.7 12.3 21.4 28.9 38.4 43.0 34.1
1 Beverages and Tobacco .1 .2 .3 .8 1.4 1j 1.6 3-8 7-9 5 o
2 Crude Material. Inedible (excluding faels) 97.1 110.0 153. 208.5 267.1 3462.7 45. 372.623 Crude rubber (excluding synthetic) 8 7 9.4 10.2 11.8 17.6 17.6 20.2 22.5 624 Wood, lumber and cork 18.5 20.8 43.1 58.5 91.5 108.5 125.4 153.7 110.9 128.725 Palp and paper 9.4 9.4 12.9 16.6 22.5 25.2 33.5 37.3 37.5 26.726 Textile fibers (not manufactured) 52.8 59.7 66.6 80.3 90.3 96.7 119.8 139.2 l'93 11' 2
2631 Raw cotton 37.3 40.8 42.8 49.3 49.1 52.0 62.7 84.2 85.5 3 :127 Crude fertilizer and crude minerals 4.3 4.7 5.1 12.6 16.0 22.5 23.3 26.8 25.9 16.828 Metallic ores and metal scrap 3.9 5.1 13.3 20.6 27.7 48.2 70.3 64.1 45.6 43.7
3 Mineral Fuels, Lubricants and RelatedMaterials 28.5 31.3 42.4 61.6 67j5 110.9 136.0 189.4 218.9 134.8
33 Petroleum and petroleum products 25.9 -28.9 40. 59.4 72.8 107.7 133.0 187.1 217.7 131.7
4 Animal and Vegetable Oils and Fats 3.9 3.8 5.5 6.9 8.3 12.3 15.3 21.3 20.3 13-3
5 Chemical 84.3 103. 134.5 113.0 136.7 163.8 201.0 223.5 152.051 Chemical elements and compounds 13.7 16.1 20. 334 47.3 60.8 77 101.3 111.2 76.653 Dyeing, tanning and coloring materials 3.7 4.8 4.6 7.1 7.8 10.3 11.6 13.7 19.2 16.354 Medicinal and pharmaceutical products 3.8 4.9 6.1 7.5 11.8 13.1 15.2 13.6 13.0 8.o56 Fertilizers, manufactured 55.9 65.8 88.9 43.9 30.6 11.9 4.0 7.1 11.1 7.158 Plastic materials 3.3 6.5 7.9 10.9 16.2 25.2 37.0 44.8 45.2 28.5
6 Manufactured Goods 46.1 71.2 125.2 183.7 242.2 278.7 0 363.3 396.1 335.165 Textile yarn fabrics 19. 6 4.2 69.6 102.7 109.6 127.8 137.0 129.0 116.266 Non-metallic mineral marufactures 2.1 1.5 6.1 12.5 9.2 9.8 9.0 9.9 18.6 7.967 Iron and steel 14.8 24.7 39.5 56.1 69.3 84.5 89.6 128.7 167;8 150.568 Non-ferrous metals 4.2 9.0 11.2 12.4 16.1 18.5 20.4 19.7 19.7 16.14
684 Aluminum 1.7 4.0 6.1 7.0 9.1 10.0 5.0 4.3 4.5 2.569 Manufacture of metal 3.0 7.1 18.8 26.7 34.3 45.5 44.0 49.1 40.9 27.8
7 Machinery, Transport Equipment 69.5 73.1 171.7 310.2 533.0 593.2 589.5 685.4 761.8 539.271 Machinery `except electrical) 3= 35.3 95.6 Da Mr. . 37 350.7 JbU.2 253.172 Electrical machinery 19.7 12.6 26.1 47.6 95.9 113.7 132.9 167.2 223.3 153.173 Transport equipment 11.6 25.2 50.0 121.4 154.3 172.5 150.8 167.5 170.2 132.9
8 Miscellaneous Manufactured Articles 5.3 6.8 1 17.2 22 55.2 47.3 66.8 81.3 58.886 Professional, scientific instruments 2.7 3.9 5.14 9 1.7 19.9 21.6 28.2 8L.9
9 Not classified 1.3 0.2 _ 0.1 0.4 0.9 0.8 0.1 0.2 O.1
TOTAL IMPORTS 404.4 463.4 716.4 996.2 1462.9 1823.6 1984.0 2394.3 2522.0 18991X
tPOTE: (-) denotes small magnitude
j/ January - June; commodity exports amounted to US $ 1353 million in the same period.
Source: Bank of Korea, Economic Statistics Yearbook; and Monthly Economic Statistics, August 1973.
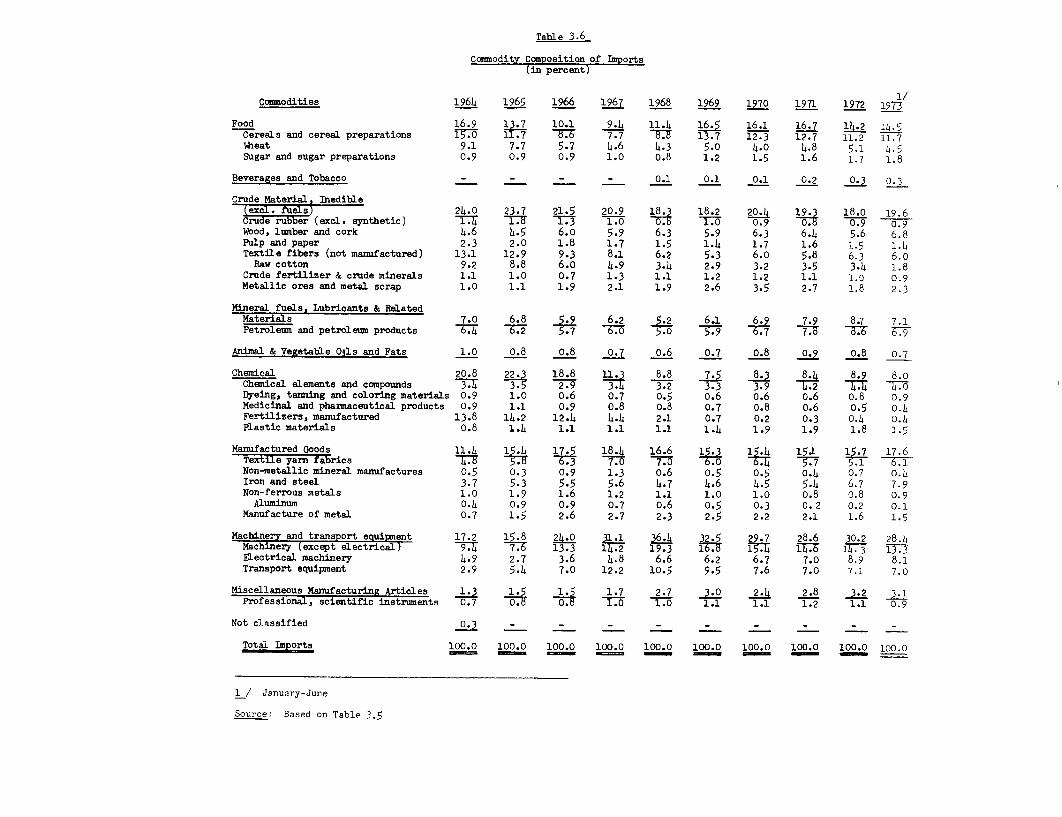
Table 3.6
Commodity Composition of Imports(in percent)
Commodities 1964 1965 1966 1967 1968 1969 1970 1971 1972 1973
Food 16.9 13.7 10.1 9.14 11.4 165 16.1 16.7 14.2 Th.5Cereals and cereal preparations 15.0 11.7 T 7.7 o.8 13.7 12.3 12.7 11.2 11.7Wheat 9.1 7.7 5.7 4.6 4.3 5.0 4.0 4.8 5.1 4.5Sugar and sugar preparations 0.9 0.9 0.9 1.0 0.8 1.2 1.5 1.6 1.7 1.8
Beverages and Tobacco - - - - 0.1 0.1 0.1 0.2 023 0.3
Crude Material InedibleCrudexl Materials5Inedibl 24.0 23.7 2 20.9 18.3 18.2 20.4 19.3 18.0 19.6Crude rubber (excl. synthetic) 1. l 1.3 1.0 0. 1.0 0.9 0.d 0.9 0.9Wood, lumber and cork 4.6 4.5 6.o 5.9 6.3 5.9 6.3 6.4 5.6 6.8Pulp and paper 2.3 2.0 1.8 1.7 1.5 1.4 1.7 1.6 1.5 1.4Textile fibers (not manufactured) 13.1 12.9 9.3 8.1 6.2 5.3 6.0 5.8 6.3 6.0
Raw cotton 9.2 8.8 6.o 4.9 3.4 2.9 3.2 3.5 3.4 1.8Crude fertilizer & crude minerals 1.1 1.0 0.7 1.3 1.1 1.2 1.2 1.1 1.0 0.9Metallic ores and metal scrap 1.0 1.1 1.9 2.1 1.9 2.6 3.5 2.7 1.8 2.3
Mineral fuels, Lubricants & RelatedMaterials 7.0 6.8 5.9 6.2 52 6.1 6.9 7.9 8.7 7.1Petroleumn and petroleum products 6. 7 6. 33.25- 7 6. 7 7. 8 9
Animal & Vegetable Oils and Fats 1.0 0.8 0.8 0.7 o.6 0.7 0.8 0.9 0.8 0.7
Chemical 20.8 22.3 18.8 11 8.8 7-5 8.3 8.4 8.9 8.0Chemical elements and compounds 37 3.5 2.9 3.4 3.2 3.3 3.9 4 2 4. I.Dyeing, tanning and coloring materials 0.9 1.0 0.6 0.7 0.5 o.6 0.6 o.6 0.8 0.9Medicinal and pharmaceutical products 0.9 1.1 0.9 0.8 o.8 0.7 0.8 0.6 0.5 o.4Fertilizers, manufactured 13.8 14.2 12.4 4.4 2.1 0.7 0.2 0.3 0.4 o.4Plastic materials 0.8 1.4 1.1 1.1 1.1 1.4 1.9 1.9 1.8 1.5
Manufactured Goods 11. 15.4 175 18.4 16.6 15.3 15.4 151 4157 17.6Textile yarn fabrics 5. 6 .3 7.0 6.0 6.14 .7 5.17.Non-metallic mineral manufactures 0.5 0.3 0.9 1.3 o.6 0.5 0.5 0.4 0.7 o.14Iron and steel 3.7 5.3 5.5 5.6 4.7 4.6 4.5 5.4 6.7 7.9Non-ferrous metals 1.0 1.9 1.6 1.2 1.1 1.0 1.0 0.8 0.8 0.9
Aluminum 0.4 0.9 0.9 0.7 o.6 0.5 0.3 0. 2 0.2 0.1Manufacture of metal 0.7 1.5 2.6 2.7 2.3 2.5 2.2 2.1 1.6 1.5
Machinery and transport equipment 17.2 15.8 24.0 31.1 36.4 32.5 29.7 28.6 30.2 28.1Machinery (except electrical) 9.T 7.6 13.3 14.2 19.3 1 1. 14. 1V3 13.3ELectrical machinery 4.9 2.7 3.6 4.8 6.6 6.2 6.7 7.0 8.9 8.1Transport equipment 2.9 5.4 7.0 12.2 10.5 9.5 7.6 7.0 7.1 7.0
Miscellaneous Mnactu 1.3 le 5 1.5 1.7 2.7 3 ° 2.4 2.8 3.2 3.1Professional, scientific instruments 0.7 0.8 0.8 1.0 .0 1.1 1.1 1.2 1.1 0.9
Not classified 0.3
Total Imports 100.0 100.0 100.0 100.0 100.0 100.0 100.0 100.0 100.0 100.0
1_/ January-June
Source: Based on Table 3.5
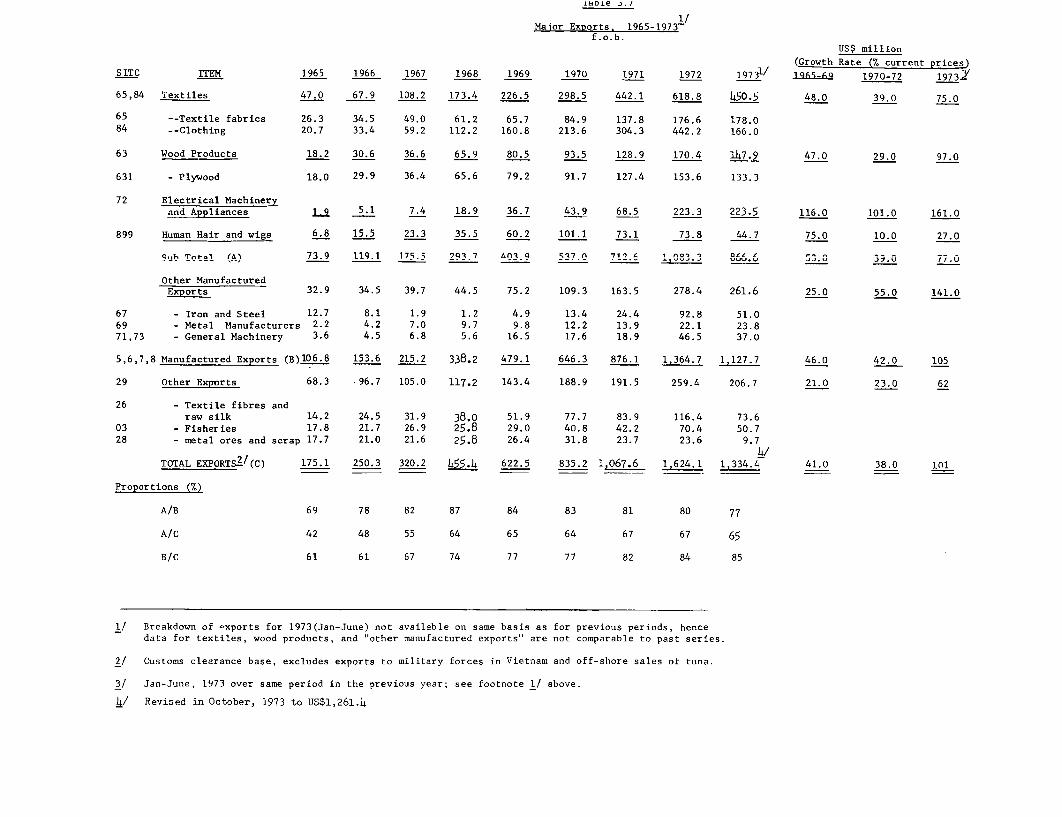
iaDLe o.i
1/Maior Exnorts, 1965-1973
f.o.b.US$ million
(Growth Rate (7. current- prices)
SITC ITEM 1965 1966 1967 1968 1969 1970 1971 1972 1973W- lQ6s_6 1970-72 1973 Y
65,84 Textiles 47.0 67.9 108.2 173.4 226.5 298.5 442.1 618.8 450.5 48.0 39.0 75.0
65 --Textile fabrics 26.3 34.5 49.0 61.2 65.7 84.9 137.8 176.6 178.084 --Clothing 20.7 33.4 59.2 112.2 160.8 213.6 304.3 442.2 166.0
63 Wood Products 18.2 30.6 36.6 65.9 80.5 93.5 128.9 170.4 147.9 47.0 29.0 97.0
631 - Plywood 18.0 29.9 36.4 65.6 79.2 91.7 127.4 153.6 133.3
72 Electrical Machineryand Appliances 1.9 5.1 7.4 18.9 36.7 43.9 68.5 223.3 223.5 116.0 101.0 161.0
899 Human Hair and wigs 6.8 15.5 23.3 35.5 60.2 101.1 73.1 73.8 44.7 75.0 10.0 27.0
Sub Total (A) 73.9 119.1 1755 2?Q37 Anl3Q c37.e 712.' 1. °66. O, 0 39.u 77.0
Other ManufacturedExports 32.9 34.5 39.7 44.5 75.2 109.3 163.5 278.4 261.6 25.0 55.0 141.0
67 - Iron and Steel 12.7 8.1 1.9 1.2 4.9 13.4 24.4 92.8 51.069 - Metal Manufacturers 2.2 4.2 7.0 9.7 9.8 12.2 13.9 22.1 23.871,73 - General Machinery 3.6 4.5 6.8 5.6 16.5 17.6 18.9 46.5 37.0
5,6,7,8 Manufactured Exports (B)i06-8 153.6 215.2 338.2 479.1 646.3 876.1 1,364.7 1,127.7 46.0 42.0 105
29 Other Exports 68.3 96.7 105.0 117.2 143.4 188.9 191.5 259.4 206.7 21.0 23.0 62
26 - Textile fibres andraw silk 14.2 24.5 31.9 38.0 51.9 77.7 83.9 116.4 73.6
03 - Fisheries 17.8 21.7 26.9 25.8 29.0 40.8 42.2 70.4 50.728 - metal ores and scrap 17.7 21.0 21.6 25.8 26.4 31.8 23.7 23.6 9.7
4/TOTAL EXPORTSZ/(C) 175.1 250.3 320.2 455.4 622.5 835.2 1,067.6 1,624.1 1,334.4 41.0 38.0 101
Proportions (7,)
A/B 69 78 82 87 84 83 81 80 77
A/C 42 48 55 64 65 64 67 67 65
B/C 61 61 67 74 77 77 82 84 85
1/ Breakdown of '.xports for 1973(Jan-June) not available on same basis as for previous periods, hencedata for textiles, wood products, and "other manufactured exports" are not comparable to past series.
2/ Customs clearance base, excludes exports to military forces in Vietnam and off-shore sales of tuna.
3/ Jan-June, 1973 over same period in the previous year; see footnote 1/ above.
4/ Revised in October, 1973 to US$1,261.4
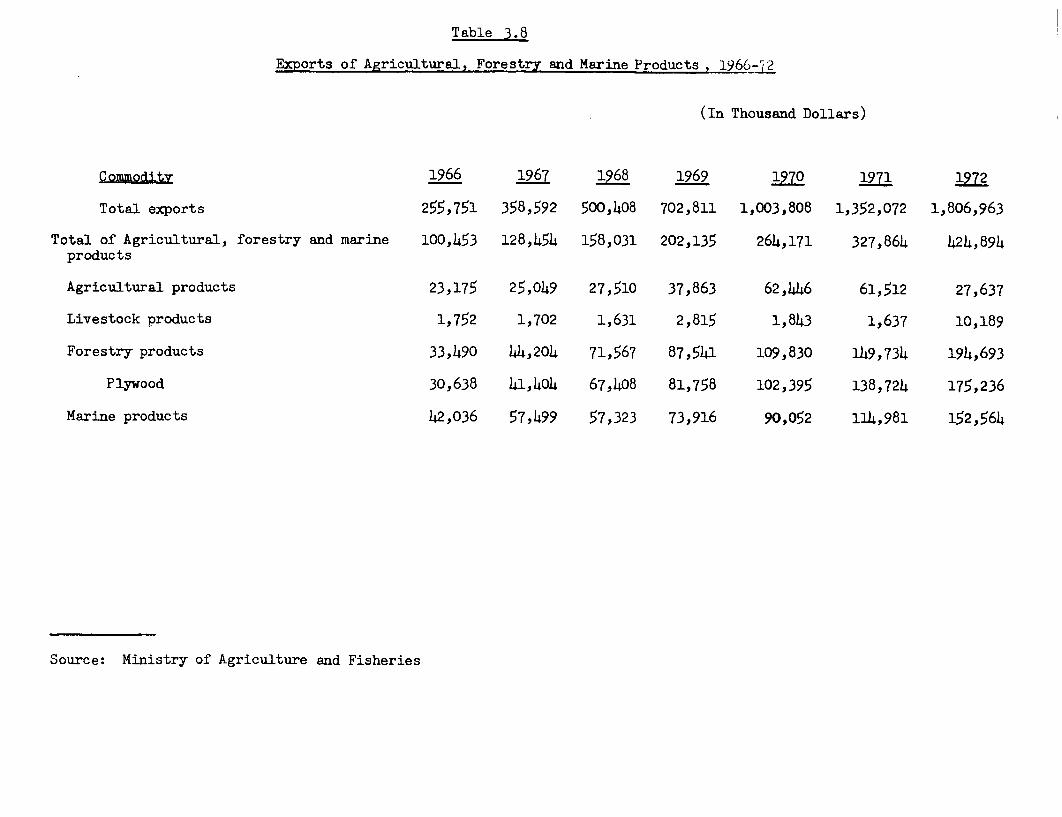
Table 3.8
Exports of Agricultural, Forestry and Marine Products , 1966-j72
(In Thousand Dollars)
Commodity 1966 1967 1968 1969 1970 1971 1972
Total exports 255,751 358,592 500,408 702,811 1,003,808 1,352,072 1,806,963
Total of Agricultural, forestry and marine 100,453 128,454 158,031 202,135 26 4.,171 327,864 424,894products
Agricultural products 23,175 25,049 27,510 37,863 6 2,44 6 61,512 27,637
Livestock products 1,752 1,702 1,631 2,815 1,843 1,637 10,189
Forestry products 33,490 44,204 71,567 87,541 109,830 149,734 194,693
Plywood 30,638 41,404 67,408 81,758 102,395 138,724 175,236
Marine products 42,036 57,499 57,323 73,916 90,052 114,9 81 152,564
Source: Ministry of Agriculture and Fisheries
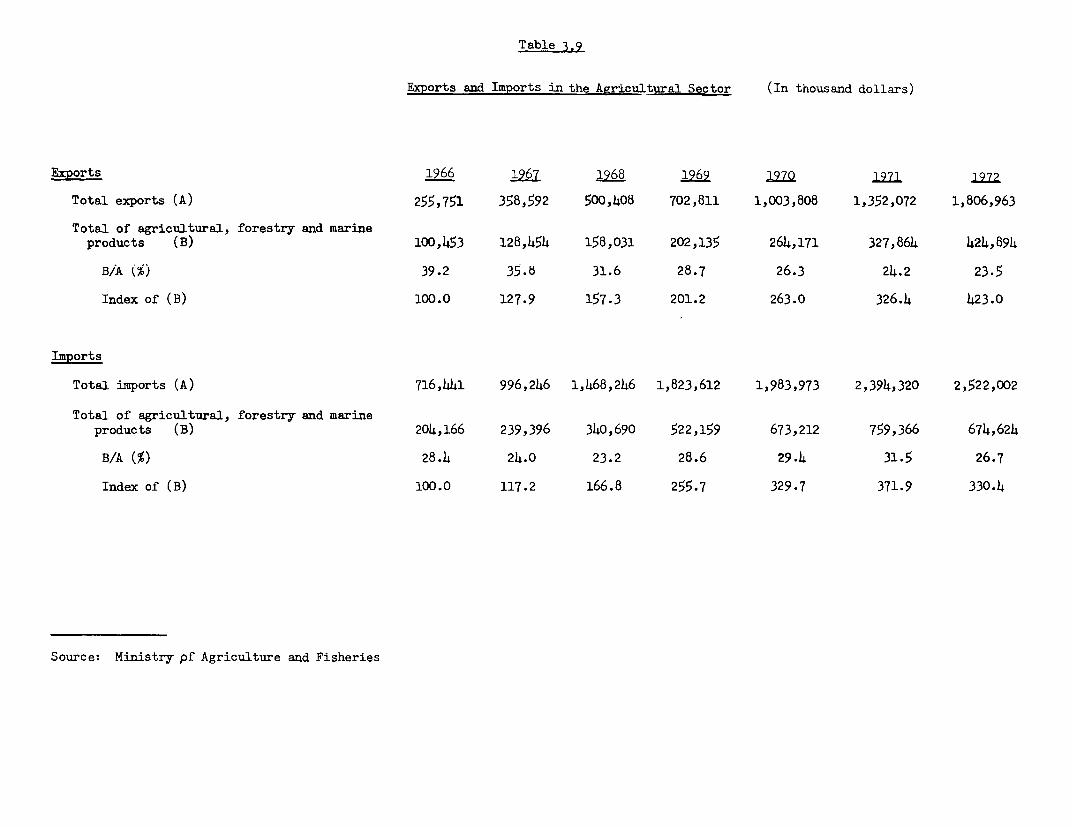
Table 3.9
Exports and Imports in the Agricultural Sector (In thousand dollars)
Exports 1966 1967 1968 1969 19j70 197 1272
Total exports (A) 255,751 358,592 500,408 702,811 1,003,808 1,352,072 1,806,963
Total of agricultural, forestry and marineproducts (B) l00,453 128,454 158,031 202,135 264,171 327,864 424,894
B/A (%) 39.2 35.6 31.6 28.7 26.3 24.2 23.5
Index of (B) 100.0 127.9 157.3 201.2 263.0 326.4 423.0
Imports
Total imports (A) 716,441 996,246 1,468,246 1,823,612 1,983,973 2,394,320 2,522,002
Total of agricultural, forestry and marineproducts (B) 204,166 239,396 340,690 522,159 673,212 759,366 674,624
B/A (%) 28.4 24.0 23.2 28.6 29.4 31.5 26.7
Index of (B) 100.0 117.2 166.8 255.7 329.7 371.9 330.4
Source: Ministry pf Agriculture and Fisheries
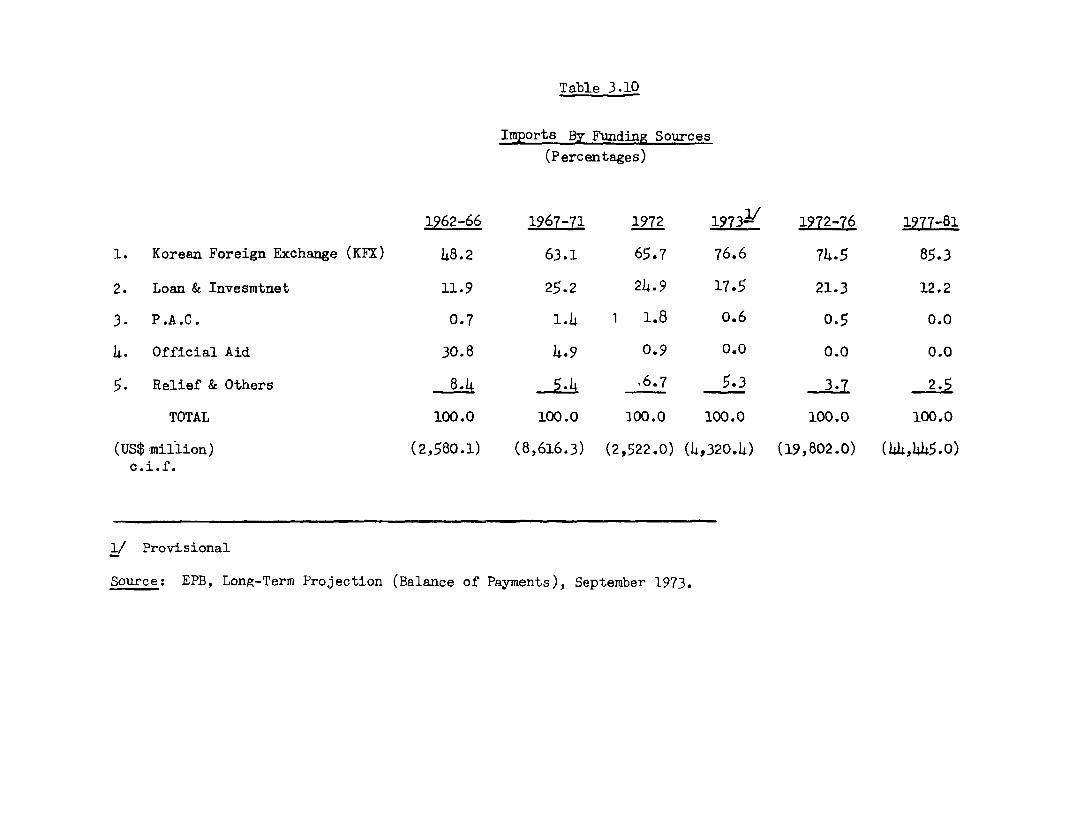
Table 3-10
Imports BY Funding Sources
(Percentages)
1962-66 1967-71 1972 1973i/ 1972-76 1977-81
1. Korean Foreign Exchange (KFX) 48.2 63.1 65.7 76.6 74.5 85.3
2. Loan & Invesmtnet 11.9 25.2 24.9 17.5 21.3 12.2
3. P.A.C. 0.7 1.4 1 1.8 0.6 0.5 0.0
4. Official Aid 30.8 4.9 0.9 0.0 0.0 0.0
5. Relief & Others 8.4 5.4 ,6.7 5.3 3.7 2.5
TOTAL 100.0 100.0 100.0 100.0 100.0 100.0
(US$ million) (2,580.1) (8,616.3) (2,522.0) (4b320.4) (19,802.0) (44,445.0)c.i.f.
1/ Provisional
Source: EPB, Long-Term Projection (Balance of Payments), September 1973.
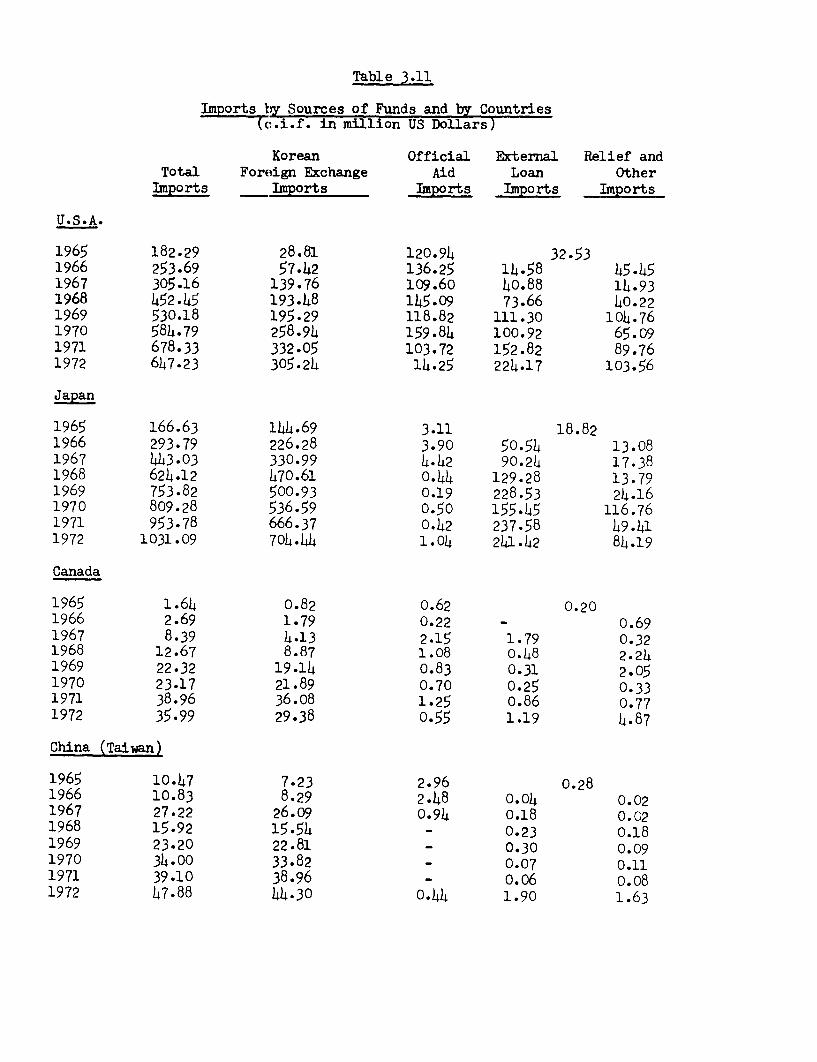
Table 3.11
Imports by Sources of Funds and by Countries(c.i.f. in million US Dollars)
Korean Official External Relief andTotal Foreign Exchange Aid Loan Other
Imports Imports Imports Imports Imports
U.S.A.
1965 182.29 28.81 120.94 32.531966 253.69 57.42 136.25 14.58 45.451967 305.16 139.76 109.60 40.88 14.931968 452.45 193.48 145.09 73.66 40.221969 530.18 195.29 118.82 111.30 104.761970 584.79 258.94 159.84 100.92 65.091971 678.33 332.05 103.72 152.82 89.761972 647.23 305.24 14.25 224.17 103.56
Japan
1965 166.63 144.69 3.11 18.821966 293.79 226.28 3.90 50.54 13.081967 443.03 330.99 4.42 90.24 17.381968 624.12 470.61 0.44 129.28 13.791969 753.82 500.93 0.19 228-53 24.161970 809.28 536.59 0.50 155.45 116.761971 953.78 666.37 0.42 237.58 49.411972 1031.09 704.44 1.04 241.42 84.19
Canada
1965 1.64 0.82 0.62 0.201966 2.69 1.79 0.22 - 0.691967 8.39 4.13 2.15 1.79 0.321968 12.67 8.87 1.08 0.48 2.241969 22.32 19.14 0.83 0.31 2.051970 23.17 21.89 0.70 0.25 0.331971 38.96 36.08 1.25 0.86 0.771972 35.99 29.38 0.55 1.19 4.87
China (Taiwan)
1965 10.47 7.23 2.96 0.281966 10.83 8.29 2.48 0.04 0.021967 27.22 26.09 0.94 0.18 0.021968 15.92 15.54 - 0.23 0.181969 23.20 22.81 - 0.30 0.091970 34.00 33.82 - 0.07 0.111971 39.10 38.96 - 0.06 0.181972 47.88 44.30 0.44 1.90 1.63
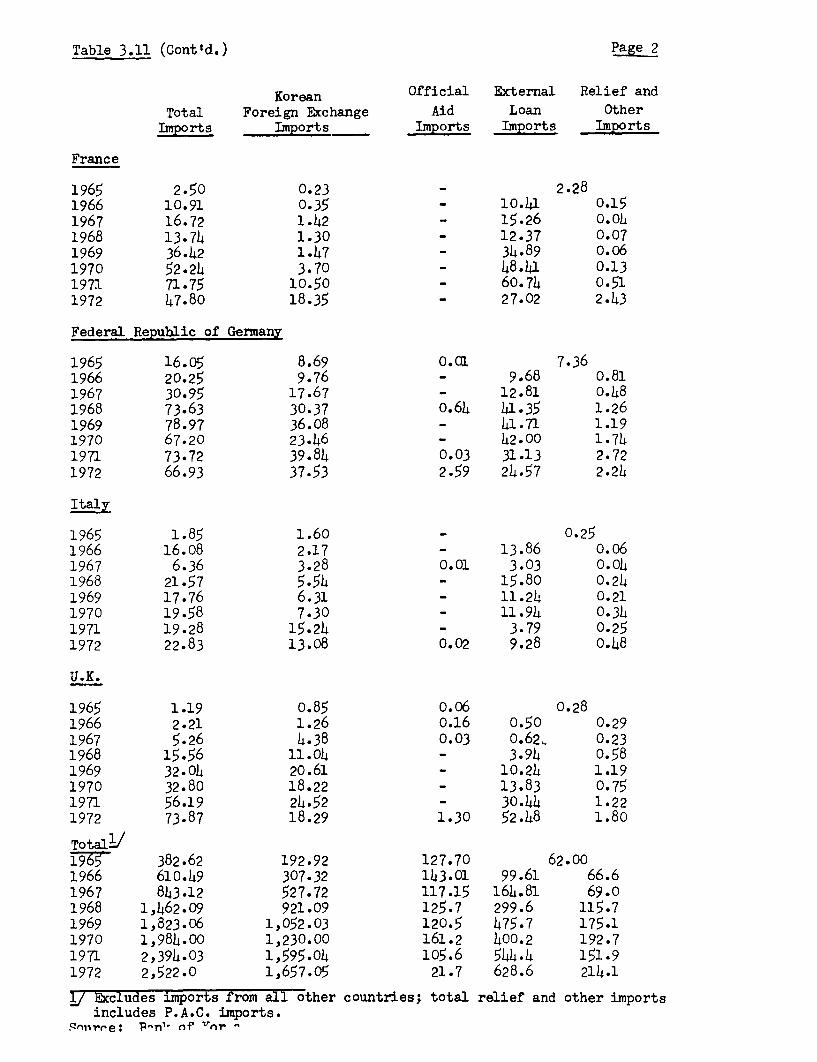
Table 3.11 (Contld.) Page 2
Korean Official External Relief and
Total Foreign Exchange Aid Loan OtherImports Imports Imports Imports Imports
France
1965 2.50 0.23 _ 2.281966 10.91 0.35 - 10.41 0.151967 16.72 1.42 - 15.26 0.0)41968 13.74 1.30 - 12.37 0.071969 36.42 1.47 - 34.89 0.061970 52.24 3.70 - 48.41 0.131971 71.75 10.50 - 60.74 0.511972 47.80 18.35 - 27.02 2.43
Federal Republic of Germany
1965 16.05 8.69 0.01 7.361966 20.25 9.76 - 9.68 0.811967 30.95 17.67 - 12.81 0.481968 73.63 30.37 0.64 41.35 1.261969 78.97 36.08 - 41.71 1.191970 67.20 23.46 - 42.00 1.741971 73.72 39.84 0.03 31.13 2.721972 66.93 37.53 2.59 24.57 2.24
Italy
1965 1.85 1.60 _ 0.251966 16.08 2.17 - 13.86 0.061967 6.36 3.28 0.01 3.03 0.041968 21.57 5.54 - 15.80 0.241969 17.76 6.31 - 11.24 0.211970 19.58 7.30 - 11.94 0.341971 19.28 15.24 - 3.79 0.251972 22.83 13.08 0.02 9.28 0.48
U.K.
1965 1.19 0.85 0.06 0.281966 2.21 1.26 0.16 0.50 0.291967 5.26 4.38 0.03 o.62. 0.231968 15.56 11.04 - 3.94 0.581969 32.04 20.61 - 10.24 1.191970 32.80 18.22 - 13.83 0.751971 56.19 24.52 - 30.44 1.221972 73.87 18.29 1.30 52.48 1.80
TotalL/1965 382.62 192.92 127.70 62.001966 610.49 307.32 143.01 99.61 66.61967 843.12 527.72 117.15 164.81 69.01968 1,462.09 921.09 125.7 299.6 115.71969 1,823.06 1,052.03 120.5 475.7 175.11970 1,984.00 1,230.00 161.2 400.2 192.71971 2,394.03 1,595.04 105.6 544.4 151.91972 2,522.0 1,657.05 21.7 628.6 214.1
1J Excludes imports from all other countries; total relief and other importsincludes P.A.C. imports.
qS _niiie * Pn l nu {fW "'st -

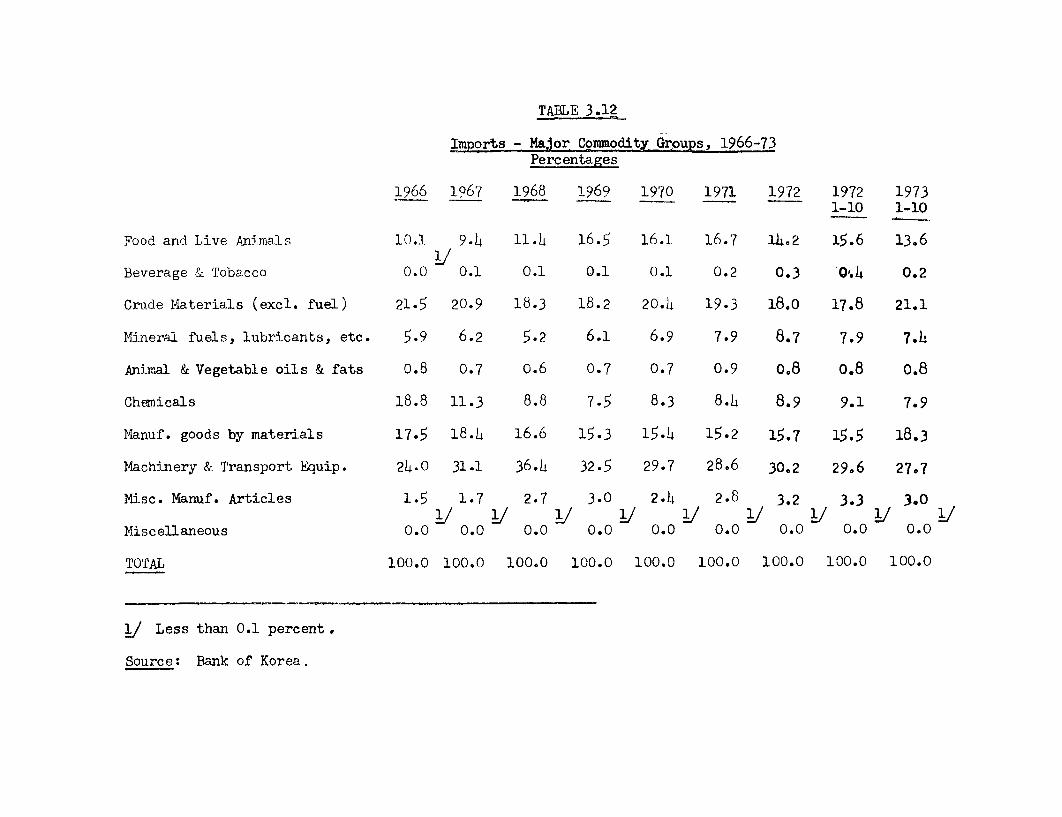
TABLE 3.12
Imports - Major Commodityl Grous, 1966-73Percentages
1966 1967 1968 1969 1970 1971 1972 1972 19731-10 1-10
Food and Live Animals 10.1 9-j 11.h 16.5 16.1 16.7 l1.2 15.6 13,61J
Beverage & Tobacco 0.0 0.1 0.1 0.1 0.1 0.2 0.3 O'Q.4 0.2
Crude Materials (excl. fuel) 21.5 20.9 18.3 18.2 20.4 19.3 18.0 17.8 21.1
Mineral fuels, lubricants, etc. 5.9 6.2 5.2 6.1 6.9 7.9 8.7 7.9 7.h
Animal & Vegetable oils & fats o08 0.7 o.6 0.7 0.7 0.9 o.8 o.8 0.8
Chenicals 18.8 11.3 8.8 7.5 8.3 8.4 8.9 9.1 7.9
Manuf. goods by materials 17.5 18.4 16.6 15.3 15.4 15.2 15.7 15.5 18.3
Machinery & Transport Equip. 24.0 31.1 36.4 32.5 29.7 28.6 30.2 29.6 27.7
Misc. Manuf. Articles 1.5 1.7 2.7 3.0 2.4 2.8 3.2 3.3 3.01/ / lJ 1] lJ lJ 1J &
Miscellaneous 0.0 0.0 0.0 0.0 0.0 0.0 0.0 0.0 0.0
TOTAL 100.0 100.0 100.0 100.0 100.0 100.0 100.0 100.0 100.0
1J Less than 0.1 percent.
Source: Bank of Korea,
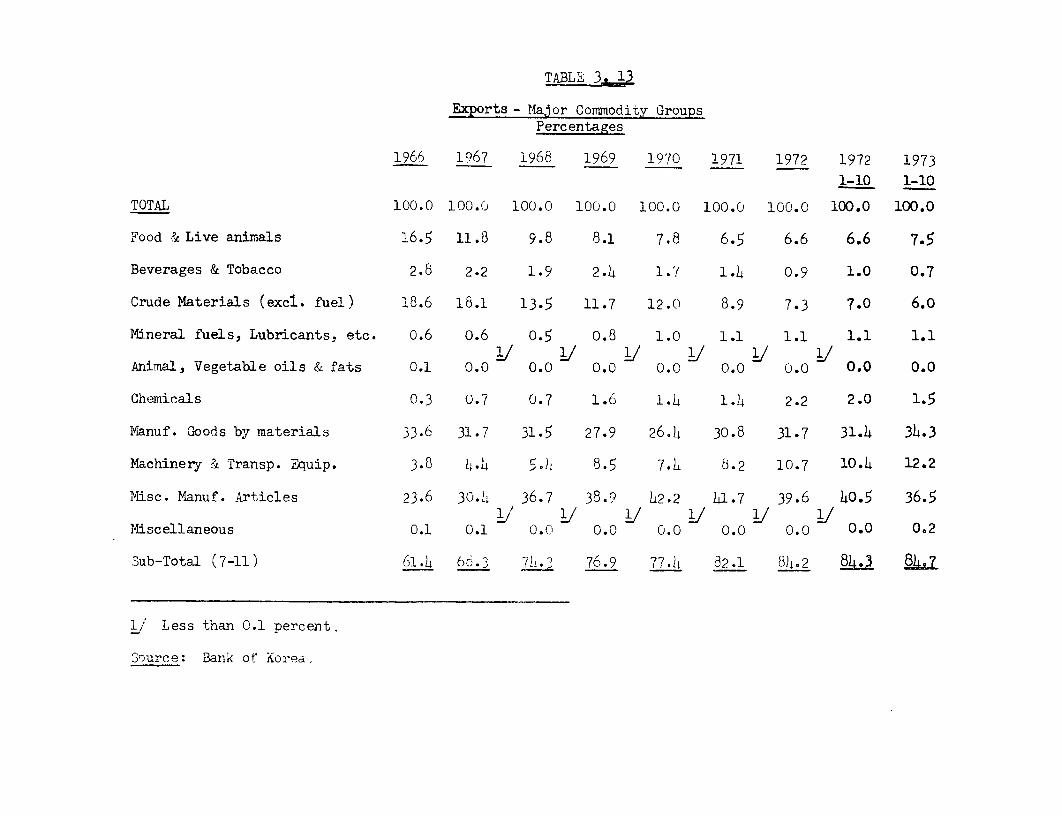
TABLE 3.13
Exports - Major Commodity GroupsPercentages
1966 1967 1968 1969 1970 1971 1972 1972 19731-10 1-10
TOTAL 100.0 100.0 100.0 100.0 100.0 100.0 100.0 100.0 100.0
Food & Live animals 1665 11.8 9.8 8.1 7.8 6.5 6.6 6.6 7.5
Beverages & Tobacco 2.8 2.2 1.9 2.h 1.7 1.4 0.9 1.0 0.7
Crude Materials (excl. fuel) 18.6 16.1 13.5 11.7 12.0 8.9 7.3 7.0 6.0
Mineral fuels, Lubricants, etc. o.6 0.6 0.5 o.8 1.0 1.1 1.1 1.1 1.1
Animal, Vegetable oils & fats 0.1 0.0 0.0 0.0 0.0 0.0 0.0 0.O 0.0
Chemicals 0.3 0.7 0.7 1.6 1.L 1J4 2.2 2.0 1.5
Manuf. Goods by materials 33.6 31.7 31.5 27.9 26.h 30.8 31.7 31.4 3h.3
Machinery & Transp. Equip. 3.8 ii.h 5. 8.5 7.L 8.2 10.7 l0.h 12.2
Misc. Manuf. Articles 23.6 30.!4 36.7 38.9 L2.2 41.7 39.6 40.5 36.5
Miscellaneous 0.1 0.1 0.0 0.0 0.0 0.0 0.0 0.0 0.2
Sub-Total (7-11) 61.h 66.3 ?U.3 76.9 7741t 82.1 84.2 L 3
1/ Less than 0.1 percent.
Source: Bank of Aorea,
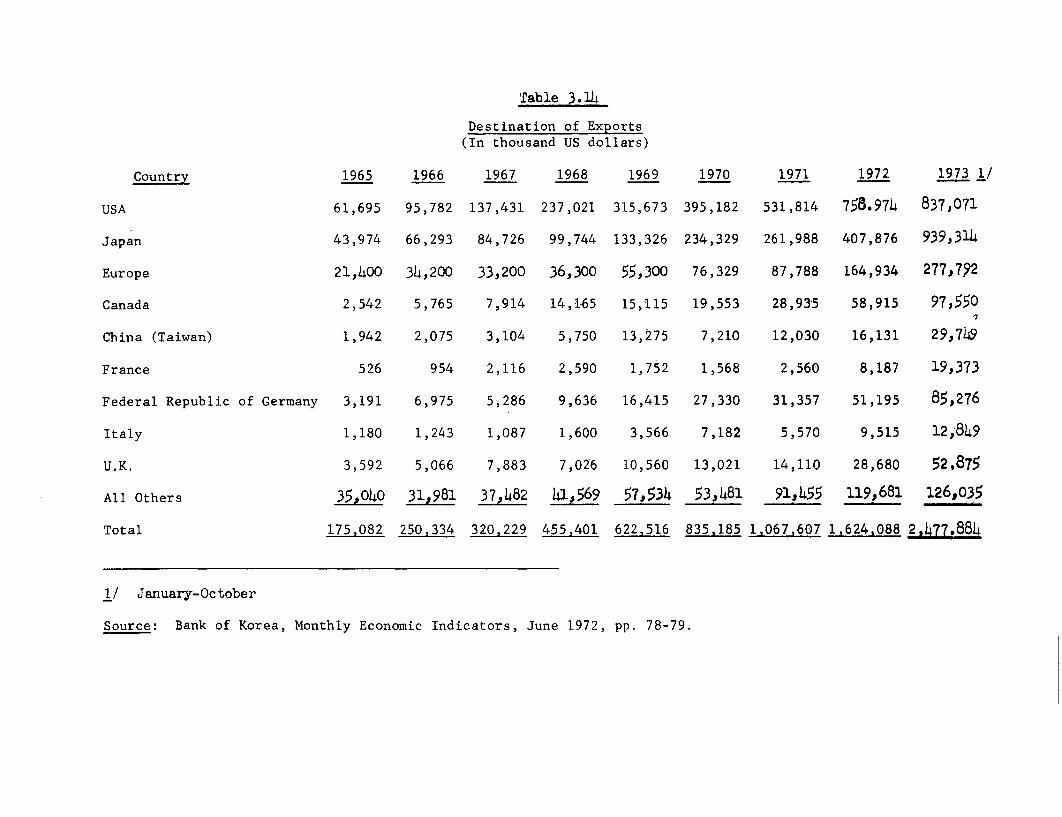
Table 3.14
Destination of Exports(In thousand US dollars)
Country 1965 1966 1967 1968 1969 1970 1971 1972 1973 l/
USA 61,695 95,782 137,431 237,021 315,673 395,182 531,814 758.974 837,071
Japan 43,974 66,293 84,726 99,744 133,326 234,329 261,988 407,876 939,314
Europe 21,400 34,200 33,200 36,300 55,300 76,329 87,788 164,934 277,792
Canada 2,542 5,765 7,914 14,165 15,115 19,553 28,935 58,915 97,550
China (Taiwan) 1,942 2,075 3,104 5,750 13,275 7,210 12,030 16,131 29,749
France 526 954 2,116 2,590 1,752 1,568 2,560 8,187 19,373
Federal Republic of Germany 3,191 6,975 5,286 9,636 16,415 27,330 31,357 51,195 85,276
Italy 1,180 1,243 1,087 1,600 3,566 7,182 5,570 9,515 12,849
U.K. 3,592 5,066 7,883 7,026 10,560 13,021 14,110 28,680 52,875
All Others 35040 31,98 37,482 41,569 57,534 53,481 91,455 119,681 126,035
Total 175,082 250,334 320,229 455,401 622,516 835.185 1.067,607 1.624,088 2,477.884
1/ January-October
Source: Bank of Korea, Monthly Economic Indicators, June 1972, pp. 78-79.
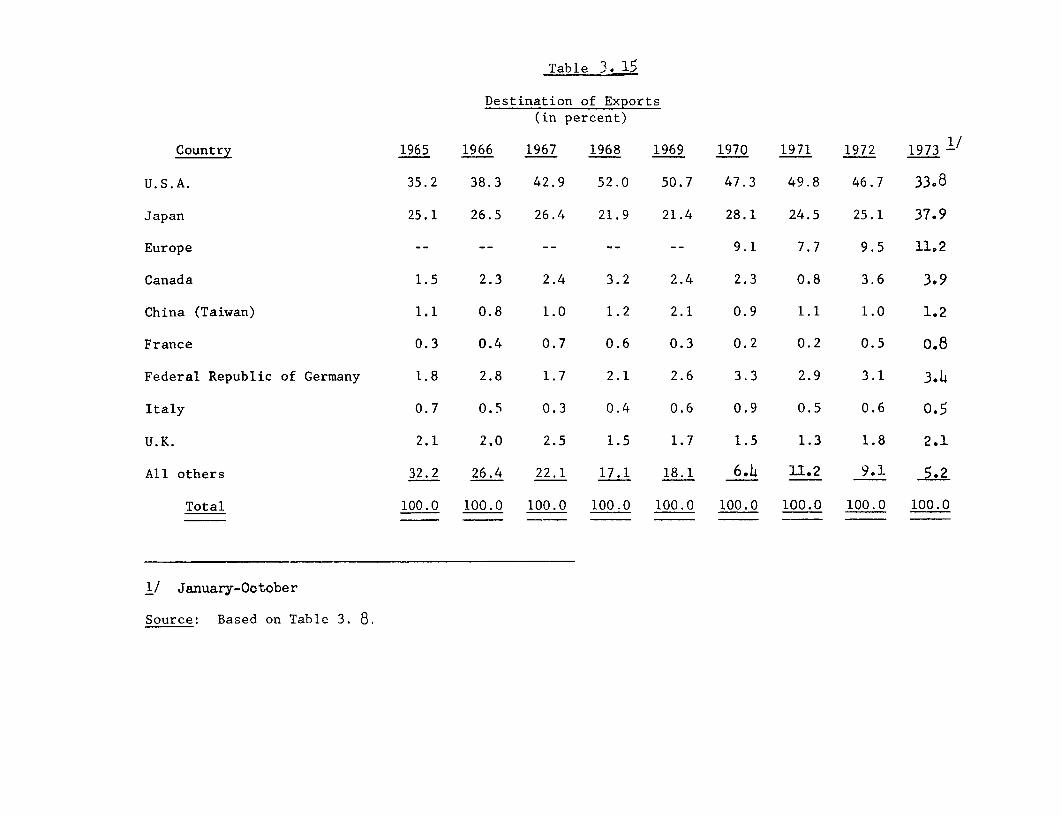
Table 3. 15
Destination of Exports(in percent)
Country 1965 1966 1967 1968 1969 1970 1971 1972 1973 -/
U.S.A. 35.2 38.3 42.9 52.0 50.7 47.3 49.8 46.7 33e8
Japan 25.1 26.5 26.4 21.9 21.4 28.1 24.5 25.1 37.9
Europe 9.1 7.7 9.5 11.2
Canada 1.5 2.3 2.4 3.2 2.4 2.3 0.8 3.6 3.9
China (Taiwan) 1.1 0.8 1.0 1.2 2.1 0.9 1.1 1.0 1.2
France 0.3 0.4 0.7 0.6 0.3 0.2 0.2 0.5 0.8
Federal Republic of Germany 1.8 2.8 1.7 2.1 2.6 3.3 2.9 3.1 3.4
Italy 0.7 0.5 0.3 0.4 0.6 0.9 0.5 0.6 0.5
U.K. 2.1 2.0 2.5 1.5 1.7 1.5 1.3 1.8 2.1
All others 32.2 26.4 22.1 17.1 18.1 6 .4 11.2 9.1 5.2
Total 100.0 100.0 100.0 100.0 100.0 100.0 100.0 100.0 100.0
1/ January-October
Source: Based on Table 3. 8.
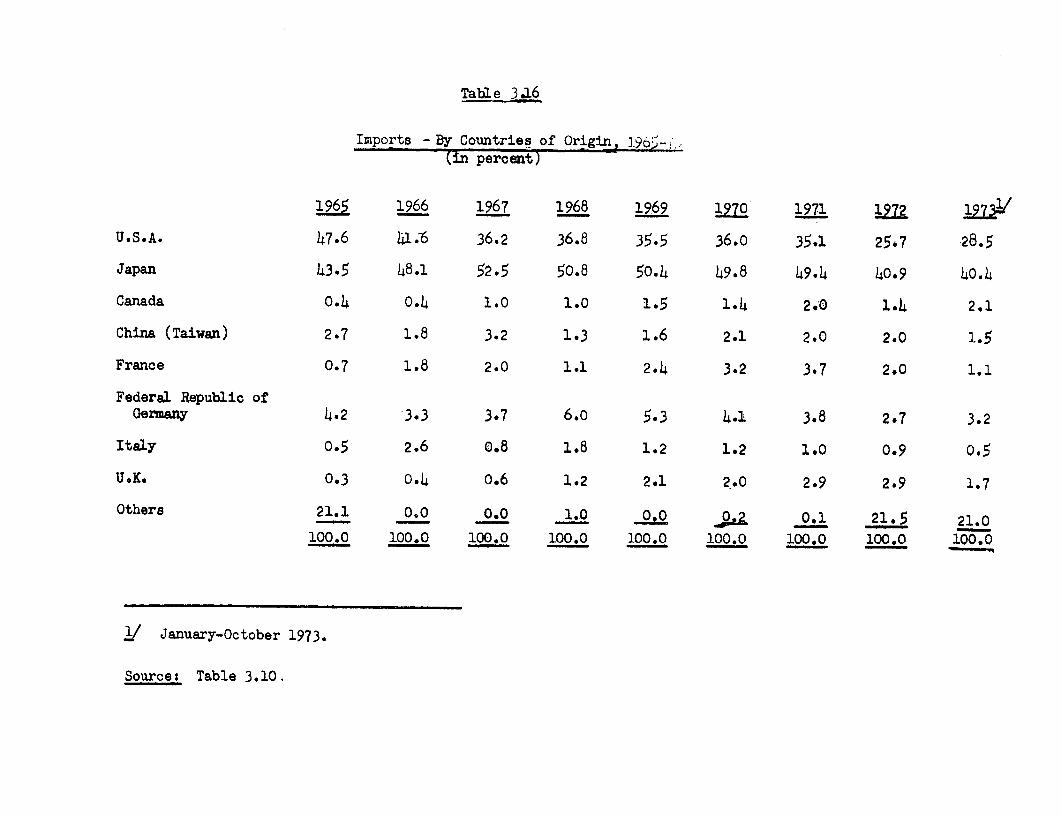
Table 3.16
Imports - By Countries of Origin, 196 .(in percent)
1965 1966 1967 1968 1969 1970 1971 121
U.S.A. 47.6 41.^6 36.2 36.8 35.5 36.0 35.1 25.7 -28.5
Japan 43.5 48.1 52.5 50.8 50.4 49.8 49.4 40.9 40.4
Canada 0.4 0.4 1.0 1.0 1.5 1.4 2.0 1.4 2.1
China (Taiwan) 2.7 1.8 3.2 1.3 1.6 2.1 2.0 2.0 1.5
France 0.7 1.8 2.0 1.1 2.4 3.2 3.7 2.0 1.1
Federal Republic ofGermany 4.2 3.3 3.7 6.o 5.3 4.1 3.8 2.7 3.2
Italy 0.5 2.6 0.8 1.8 1.2 1.2 1.0 0.9 0.5
U.K. 0.3 0.4 0.6 1.2 2.1 2.0 2.9 2.9 1.7
Others 21.1 0.0 0.0 1 .0 0.0 0.1 21.5 21.0
100.0 100.0 100.0 100.0 100.0 100.0 100.0 100.0 100.0
%/ January-October 1973.
Source: Table 3.10.
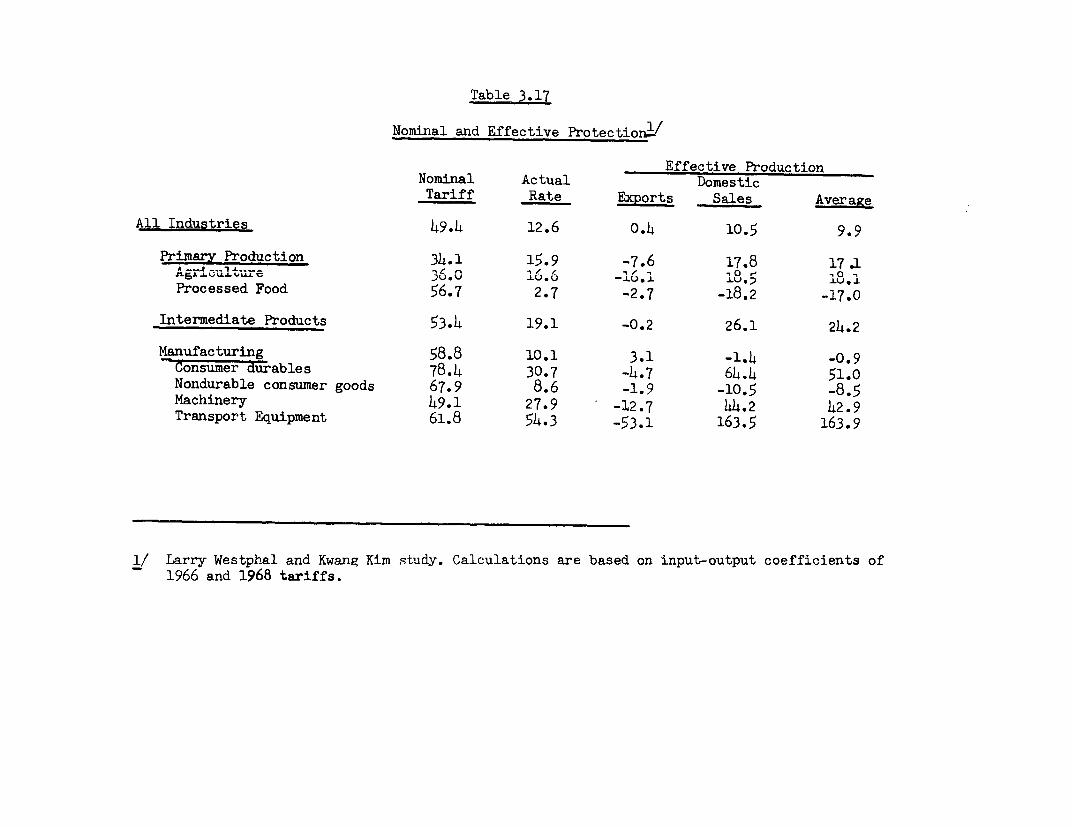
Table 3.17
Nominal and Effective Protectionl/
Effective ProductionNominal Actual DomesticTariff Rate Exports Sales Average
All Industries 49.4 12.6 0.4 10.5 9.9
Primary Production 34.1 15.9 -7.6 17.8 17 .1^we 3.9 --luO.u -1u. 8.5 i8.i
Processed Food 56.7 2.7 -2.7 -18.2 -17.0
Intermediate Products 53.4 19.1 -0.2 26.1 24.2
Manufacturing 58.8 10.1 3.1 -1.4 -0.9Consumer durables 78.4 30.7 -4.7 64.4 51.0
Nondurable consumer goods 67.9 8.6 -1.9 -10.5 -8.5Machinery 49.1 27.9 -12.7 44.2 42.9Transport Equipment 61.8 54.3 -53.1 163.5 163.9
1/ Larry Westphal and Kwang Kim study. Calculations are based on input-output coefficients of1966 and 1968 tariffs.

Table 3.18
Estimates of Subsidy Rates Afforded Exports and Domestic Sales in Korea -/
Average Nominal Protection Effective Subsidy
Tariff Rate Actual Rate Export Domestic Average
All Industries 49.4 12.6 8.6 10.1 10.0
Primary Industry 34.1 15.9 -2.7 21.6 20.9
Manufacturing 58.8 10.7 12.4 - 8.9 - 6.5
Export Industries 51.2 8.6 -. 26.0 - 13.3
Import-Competing Industries 47.5 35.2 30.7 83.1 82.7
Non-Import-Competing " 49.5 9.3 7.5 4.3 4.4
Major Commodities (Exports)
Plywood 10.2 0.0 95.6 - 68.7 48.5Cotton Fabrics 73.6 23.4 350.4 295.9 298.4Silk Fabrics 2/ 91.6 45.2 40.9 480.0 404.6Knit Products 61.3 11.7 3.1 17.9 9.8Apparel & Accessories 106.8 8.2 7.9 - 37.5 - 24.7Electronic Components 2/ 1.6 1.6 8.6 64.9 13.3Metal Processing Machinery 3/ 26.0 11.9 21.9 13.7 13.9Machinery Components 3/ 68.4 59.4 - 4.6 246.3 238.8Textile Machinery 3/ 13.9 0.5 - 0.1 - 20.3 - 20.0Steel Sheet and Bars 3/ 24.4 27.8 - 68.8 1451.6 1592.8Leather Shoes 89.9 6.7 6.3 - 11.8 - 10.1
Notes: 1/ Estimates by Larry Westphal and Koang Kim in 'Industrial Policy And Development in Korea' (draft) - Annex Table 2B2/ Export and Import Competing Goods3/ Import Competing Goods

Table 3.19 (Cont'd.) Page 2
Country Restrictions Commoditz
EC (Common) Variable import levy Agricultural products
Import quota system Cotton textile
West Germany Self-control of export Packing material and walltile
Italy Monopoly system Leaf tobacco
Benelux Import quota-system Garments
UK Administration tax Leaf tobacco(0.5% on CIF value)
Jnilateral import P/C fabric and its goodsrestriction
System of Origin All itemsnarking for importedgoods
Austria 3elf-control of export Cotton textile
Switzerland Self-control of export Cotton textile
Norway S3elf-control of export Cotton textile
Sweden :Import quota system Socks,sweater
Denmark 'elf-control of export Knitted goods,socks,underwears
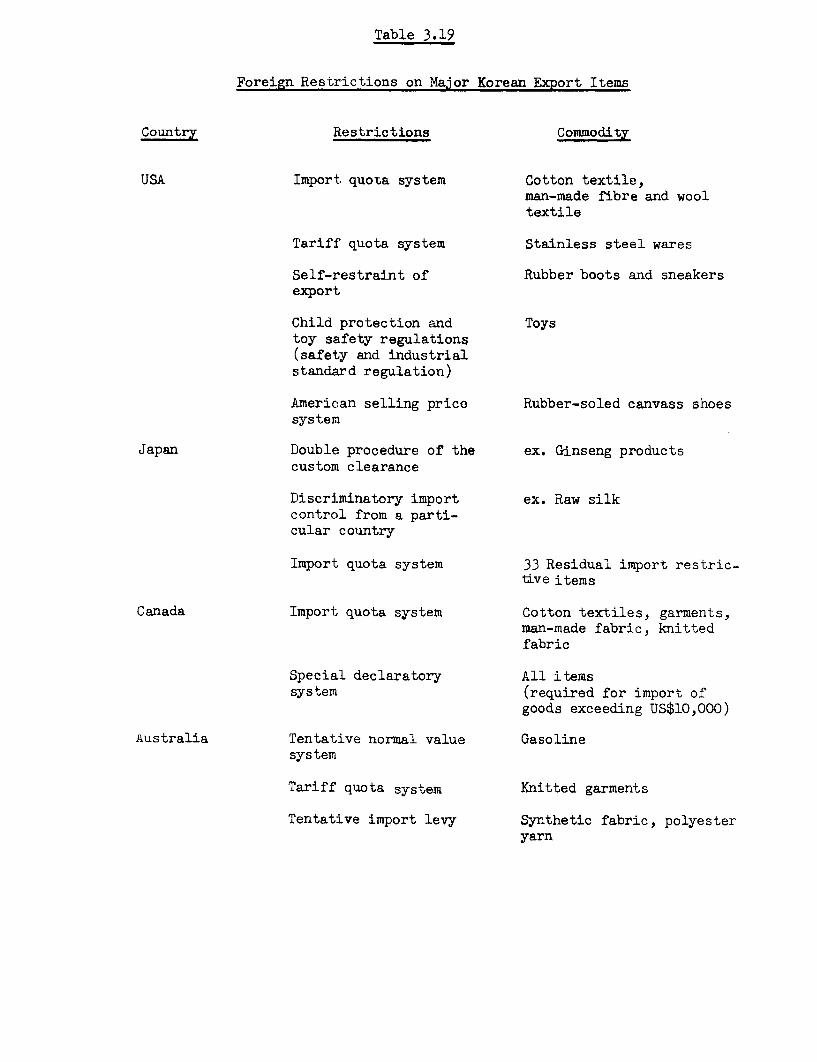
Table 3.19
Foreign Restrictions on Major Korean Export Items
Country Restrictions Commodity
USA Import quota system Cotton textile,man-made fibre and wooltextile
Tariff quota system Stainless steel wares
Self-restraint of Rubber boots and sneakersexport
Child protection and Toystoy safety regulations(safety and industrialstandard regulation)
American selling price Rubber-soled canvass shoessystem
Japan Double procedure of the ex. Ginseng productscustom clearance
Discriminatory import ex. Raw silkcontrol from a parti-cular country
Import quota system 33 Residual import restric-tlve items
Canada Import quota system Cotton textiles, garments,man-made fabric, knittedfabric
Special declaratory All itemssystem (required for import of
goods exceeding US$10,000)
Australia Tentative normal value Gasolinesystem
Tariff quota system Knitted garments
Tentative import levy Synthetic fabric, polyesteryarn
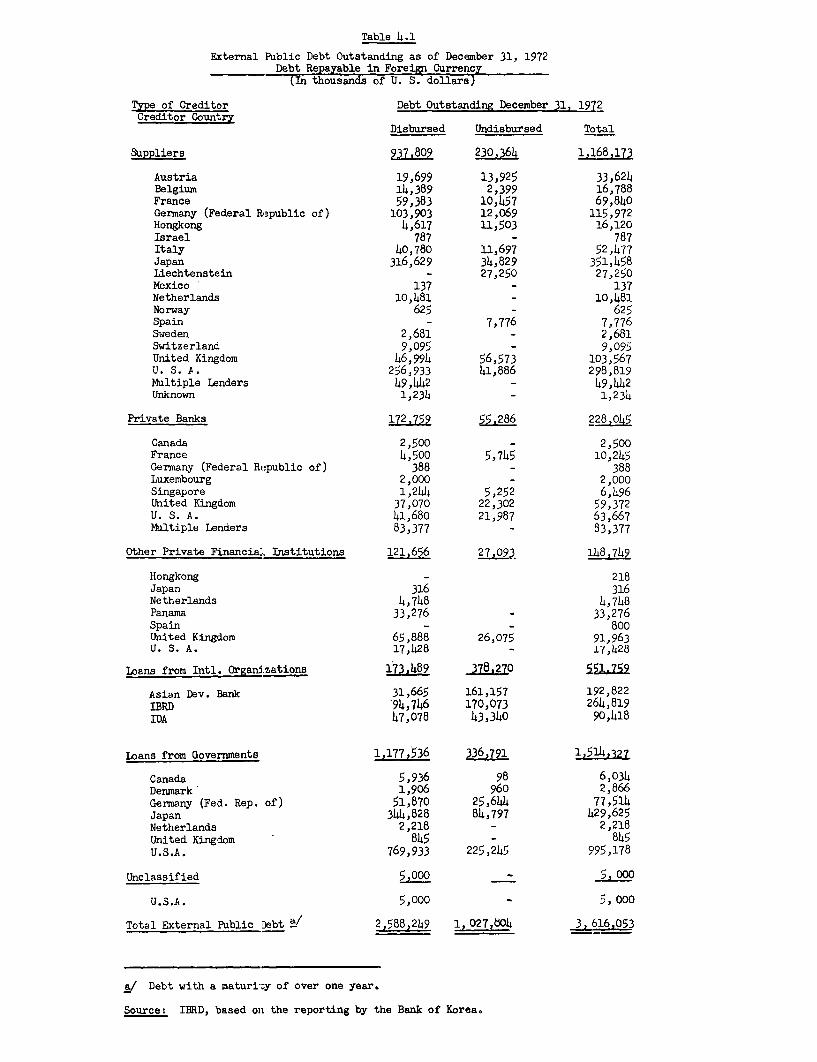
Table 4.1
External Public Debt Outstanding as of December 31, 1972Debt Repayable in Foreign Currency
(In thousands of U. S. dollars)
Type of Creditor Debt Outstanding December 31, 1972Creditor Country
Disbursed Undisbursed Total
Suppliers 937,809 230,364 1.168,173
Austria 19,699 13,925 33,624Belgium 14,389 2,399 16,788France 59,383 10,457 69,840Germany (Federal R3public of) 103,903 12,069 115,972Hongkong 4,617 11,503 16,120Israel 787 - 787Italy 40,780 11,697 52,477Japan 316,629 34,829 351,458Liechtenstein - 27,250 27,250Mexico 137 - 137Netherlands 10,481 - 10,481Norway 625 - 625Spain - 7,776 7,776Sweden 2,681 - 2,681Switzerland 9,095 - 9,095United Kingdom 46,994 56,573 103,567U. S. A. 256,933 41,886 298,819Multiple Lenders 49,442 - 49,442Unknown 1,234 - 1,234
Private Banks 172.759 55,286 228,045
Canada 2,500 - 2,500France 4,500 5,745 10,245Germany (Federal Republic of) 388 - 388Luxembourg 2,000 - 2,000Singapore 1,244 5,252 6,496United Kingdom 37,070 22,302 59,372U. S. A. 41,680 21,987 63,667Multiple Lenders 83,377 - 83,377
Other Private Financia:. Institutions 121,656 27.093 148,749
Hongkong - 218Japan 316 316Netherlands 4,748 4,748Panama 33,276 _ 33,276Spain - - 800United Kingdom 65,888 26,075 91,963U. S. A. 17,428 - 17,428
Loans from Intl. Organizations 173.489 378.27051.759
Asian Dev. Bank 31,665 161,157 192,822IBRD 94,746 170,073 264,819IDA 47,078 43,340 90,418
Loans from Governments 1,177,536 336,791 V14,5 37
Canada 5,936 98 6,034Denmark 1,906 960 2,866Germany (Fed. Rep. of) 51,870 25,644 77,514Japan 344,828 84,797 429,625Netherlands 2,218 - 2,218United Kingdom 845 - 845U.S.A. 769,933 225,245 995,178
Unclassified 5,000 5-
U.S.A. 5,000 - 5, 000
Total External Public Debt _/ 2,588,249 1, 027,d0 4 3, 616,053
i/ Debt with a maturi:y of over one year.
Source: IBRD, based on the reporting by the Bank of Korea.
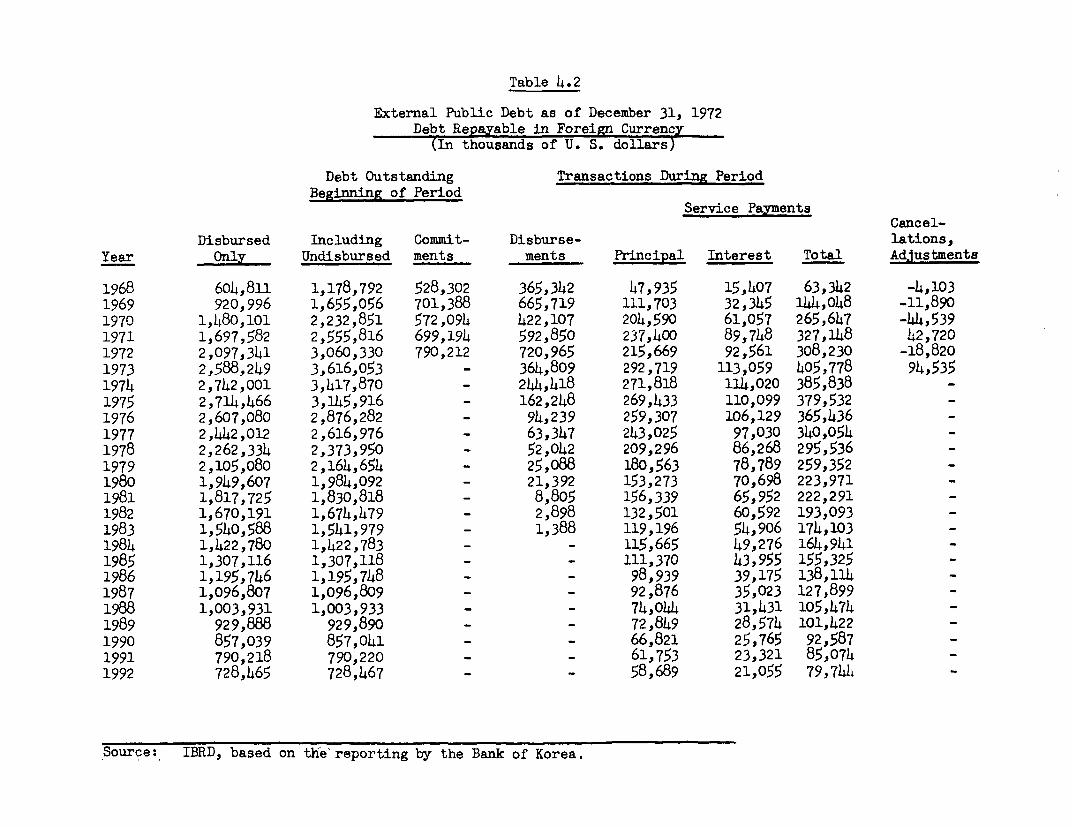
Table 4.2
External Public Debt as of December 31, 1972Debt Repayable in Foreign Currency
(In thousands of U. S. dollars)
Debt Outstanding Transactions During PeriodBeginning of Period
Service PaymentsCancel-
Disbursed Including Commit- Disburse- lations,Year Only Undisbursed ments ments Principal Interest Total Adjustments
1968 604,811 1,178,792 528,302 365,342 47,935 15,407 63,342 -4,1031969 920,996 1,655,056 701,388 665,719 111,703 32,345 144,048 -11,8901970 1,480,101 2,232,851 572,094 422,107 204,590 61,057 265,647 -44,5391971 1,697,582 2,555,816 699,194 592,850 237,400 89,748 327,148 42,7201972 2,097,341 3,060,330 790,212 720,965 215,669 92,561 308,230 -18,8201973 2,588,249 3,616,053 - 364,809 292,719 113,059 405,778 94,5351974 2,742,001 3,417,870 - 244,418 271,818 114,020 385,838 -1975 2,714,466 3,145,916 - 162,248 269,433 110,099 379,532 -1976 2,607,080 2,876,282 - 94,239 259,307 106,129 365,436 -1977 2,442,012 2,616,976 - 63,347 243,025 97,030 340,054 -1978 2,262,334 2,373,950 - 52,042 209,296 86,268 295,536 -1979 2,105,080 2,164,654 - 25,o88 180,563 78,789 259,352 -1980 1,949,607 1,984,092 - 21,392 153,273 70,698 223,971 -1981 1,817,725 1,830,818 - 8,805 156,339 65,952 222,291 -1982 1,670,191 1,674,479 - 2,898 132,501 60,592 193,093 -1983 1,540,588 1,541,979 - 1,388 119,196 54,906 174,103 -1984 1,422,780 1,422,783 - - 115,665 49,276 164,941 -1985 1,307,116 1,307,118 - - 111,370 43,955 155,325 -1986 1,195,746 1,195,748 - - 98,939 39,175 138,114 -1987 1,096,807 1,096,809 - - 92,876 35,023 127,899 -1988 1,003,931 1,003,933 - - 74,044 31,431 105,474 -1989 929,888 929,890 - - 72,849 28,574 101,422 -1990 857,039 857,041 - - 66,821 25,765 92,587 -1991 790,218 790,220 - - 61,753 23,321 85,074 -1992 728,465 728,467 - - 58,689 21,055 79,744 -
Source: IBRD, based on the reporting by the Bank of Korea.
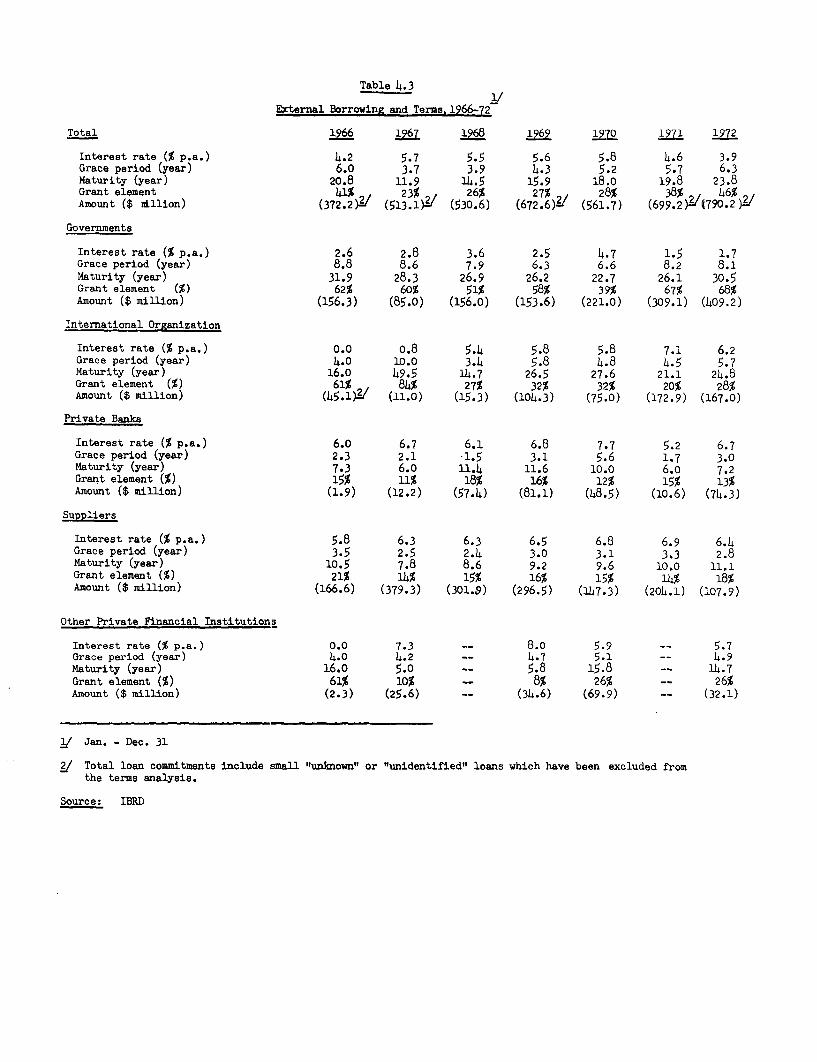
Table 4.3
External Borrowing and Terms, 1966-72
Total 1966 1967 1968 1969 191 1971 1972
Interest rate (% p.a.) 4.2 5.7 5.5 5.6 5.8 4.6 3.9Grace period (year) 6.0 3.7 3.9 4.3 5.2 5.7 6.3Maturity (year) 20.8 11.9 14.5 15.9 18.0 19.8 23.8Grant element 41% 23% 26% 27% 28% 38% 46%Amount ($ rillion) (372.2W (5 1 3 .1)L1 (530.6) (672.6)3W (561.7) (699.2)VV790.2Y./
Governments
Interest rate (% p.a.) 2.6 2.8 3.6 2.5 4.7 1.5 1.7Grace period (year) 8.8 8.6 7.9 6.3 6.6 8.2 8.1Maturity (year) 31.9 28.3 26.9 26.2 22.7 26.1 30.5Grant element (%) 62% 60% 51% 58% 39% 67% 68%Amount ($ million) (156.3) (85.0) (156.0) (153.6) (221.0) (309.1) (409.2)
International Organization
Interest rate (% p.a.) 0.0 o.8 5.4 5.8 5.8 7.1 6.2Grace period (year) 4.0 10.0 3.4 5.8 4.8 4.5 5.7Maturity (year) 16.0 49.5 14.7 26.5 27.6 21.1 24.8Grant element (%) 61% 84% 27% 32% 32% 20% 28%Amount ($ million) (45.1W (iL.O) (15.3) (104.3) (75.0) (172.9) (167.0)
Private Banks
Interest rate (% p.a.) 6.0 6.7 6.1 6.8 7.7 5.2 6.7Grace period (year) 2.3 2.1 -1.5 3.1 5.6 1.7 3.0Maturity (year) 7.3 6.0 11.4 11.6 10.0 6.o 7.2Grant element (%) 15% 11% 18% 16% 12% 15% 13%Amount ($ million) (1.9) (12.2) (57.4) (81.1) (48.5) (10.6) (74.3)
Suppliers
Interest rate (% p.a.) 5.8 6.3 6.3 6.5 6.8 6.9 6.4Grace period (year) 3.5 2.5 2.4 3.0 3.1 3.3 2.8Maturity (year) 10.5 7.8 8.6 9.2 9.6 10.0 11.1Grant element (%) 21% 14% 15% 16% 15% 14% 18%Amount ($ million) (166.6) (379.3) (301.9) (296.5) (147.3) (204.1) (107.9)
Other Private Financial Institutions
Interest rate (% p.a.) 0.0 7.3 -- 8.0 5.9 -- 5.7Grace period (year) 4.0 4.2 -- 4.7 5.1 -- 4.9Maturity (year) 16.0 5.0 -- 5.8 15.8 -- 14.7Grant element (%) 61% 10% -- 8% 26% -- 26%Amount ($ million) (2.3) (25.6) __ (34.6) (69.9) __ (32.1)
/ Jan. - Dec. 31
- Total loan commitments include small "unImown" or "unidentified" loans which have been excluded fromthe terms analysis.
Source: IBRD
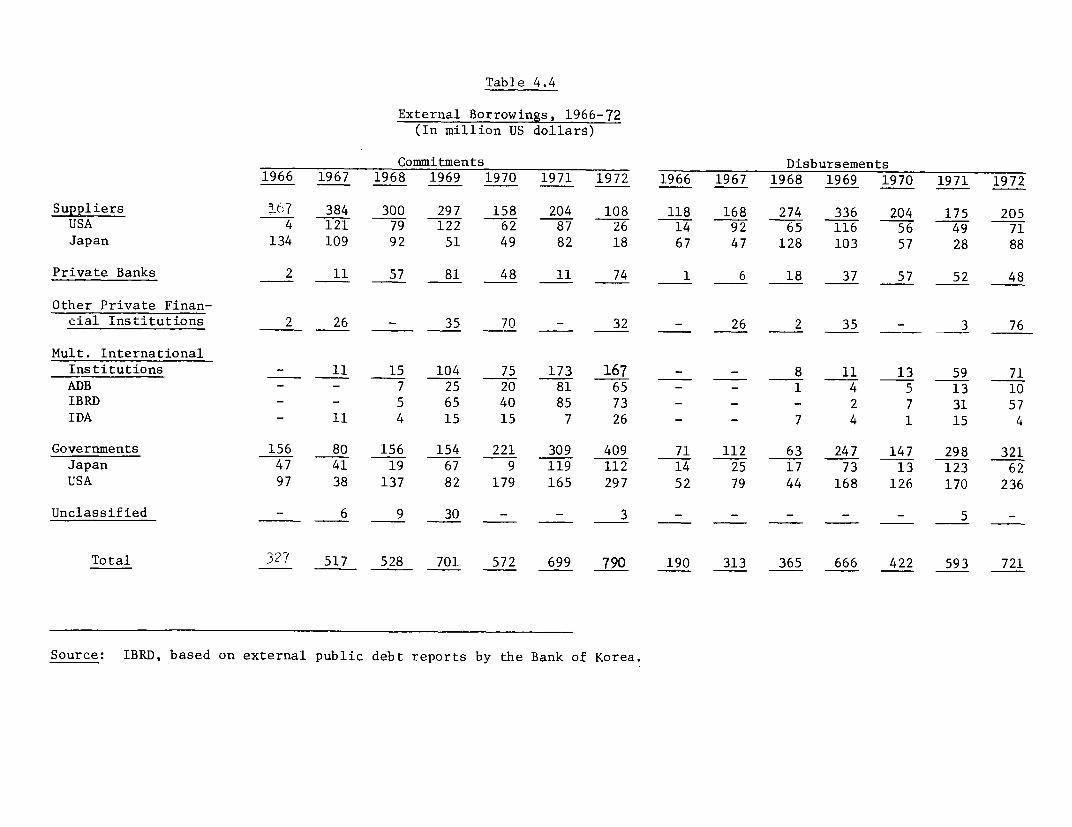
Table 4.4
External Borrowings, 1966-72(In million US dollars)
Commitments Disbursements1966 1967 1968 1969 1970 1971 1972 1966 1967 1968 1969 1970 1971 1972
Suppliers t:7 384 300 297 158 204 108 118 168 274 336 204 175 205
USA 4 121 79 122 62 87 26 14 92 65 116 56 49 71
Japan 134 109 92 51 49 82 18 67 47 128 103 57 28 88
Private Banks 2 11 57 81 48 11 74 1 6 18 37 57 52 48
Other Private Finan-cial Institutions 2 26 - 35 70 - 32 - 26 2 35 - 3 76
Mult. InternationalInstitutions - 11 15 104 75 173 167 - - 8 11 13 59 71
ADB - - 7 25 20 81 65 - - 1 4 5 13 10
IBRD - - 5 65 40 85 73 - - - 2 7 31 57
IDA - 11 4 15 15 7 26 - - 7 4 1 15 4
Governments 156 80 156 154 221 309 409 71 112 63 247 147 298 321
Japan 47 41 19 67 9 119 112 14 25 17 73 13 123 62
USA 97 38 137 82 179 165 297 52 79 44 168 126 170 236
Unclassified - 6 9 30 - - 3 - - - - 5 -
Total 327 517 528 701 572 699 790 190 313 365 666 422 593 721
Source: IBRD, based on external public debt reports by the Bank of Korea.

Table 4.5
Official Loans Classified by Terms_, 1959-73(Commitment Basis)
(In thousand dollars)
Sub-total 19731959-'66 1967 1968 1969 1970 1971 1967-'71 1972 (1959-1972)_ (Jan.-June) Total
Interest Rate
0-1% 78,028 10,645 17,467 15,000 7,000 50,112 25,500 153,640 20,000 173,6401-3% 193,601 31,920 27,467 111,112 61,014 218,287 449,810 261,600 905,011 19,035 924,0463-5% 64,037 28,911 17,846 11,073 8,899 8,000 74,729 164,900 303,666 200,099 503,7655-7% 5,270 6,800 86,887 93,687 98,957 - 98,957Over 7% 63,632 165,900 229,532 137,600 367,132 153,000 520,132Floating rate 1,197 5,000 5,000 6,197 6,197Total 342,133 71,476 57,123 226,539 148,545 399,187 902,870 589,600 1,834,603 392,134 2,226,737
Grace Period
0-3 years 21,196 11,800 37,088 22,232 64,400 135,520 33,300 190,016 56,923 246,9393-5 " 15,858 7,885 1,400 79,500 88,785 180,000 284,643 93,077 377,7205-7 " 44,677 29,831 17,846 55,654 60,518 42,723 206,572 92,900 344,149 5,029 349,1787-9 - - - - - - - -Over 9 year 260,402 41,645 27,477 125,912 64,395 212,564 471,993 283,400 1,015,795 237,105 1,252,900Total 342,133 71,476 57,123 226,539 148,545 399,187 902,870 589,600 1,834,603 392,134 2,226,737
Repayment Period-'
3-10 years 6,385 4,132 4,132 10,517 - 10,51710-15 14,858 11,800 37,988 10,000 70,000 129,788 58,300 202,946 - 202,94615-20 " 67,234 28,911 17,846 59,972 18,399 27,400 152,528 174,900 394,66i2 63,529 458,59120-30 Il 3,260 920 2,667 51,619 173,405 228,611 73,000 304,871 156,805 461,67630-40 " 236,403 31,000 127,477 111,112 49,395 121,382 340,366 257,900 834,669 146,800 981,469Over 40 years 13,993 10,645 14,800 15,000 7,000 47,445 25,500 86,938 25,000 111,938Total 342,133 71,476 157,123 226,539 148,545 399,187 902,870 589,600 1,834,603 392,134 2,226,737
1/ Includes grace period.
Source: Bureau of Economic Cooperation, EPB.
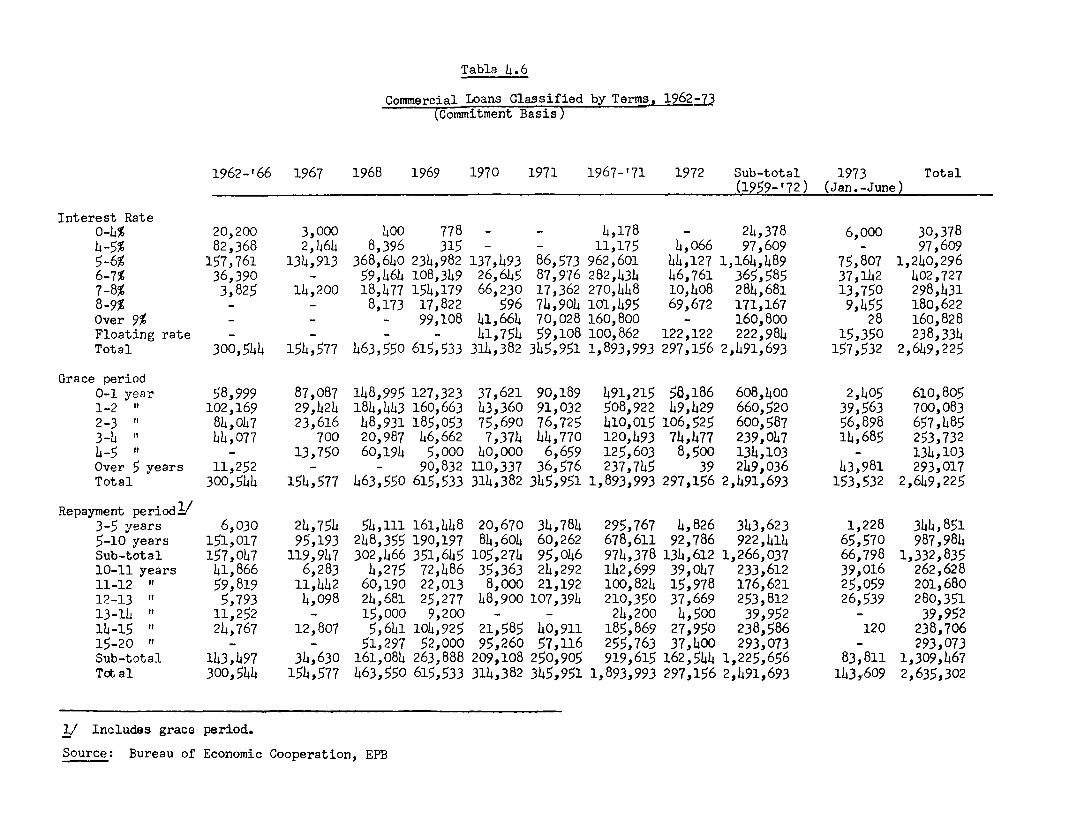
Tabla 4.6
Commercial Loans Classified by Terms. 1962-73(Commitment Basis)
1962-'66 1967 1968 1969 1970 1971 1967-'71 1972 Sub-total 1973 Total(1959- '72) (Jan.-June)
Interest Rate0-4% 20,200 3,000 400 778 - - 4,178 - 24,378 6,000 30,3784-5% 82,368 2,46b 8,396 315 - - 11,175 4,066 97,609 - 97,6095-6% 157,761 134,913 368,6b0 234,982 137,493 86,573 962,601 44,127 1,164,489 75,807 1,240,2966-7% 36,390 - 59,4 6 4 108,349 26 ,6 45 87,976 282,434 46,761 365,585 37,142 402,7277-8% 3,825 14,200 18,477 154,179 66,230 17,362 270,448 10,408 284,681 13,750 298,4318-9% - - 8,173 17,822 596 74,904 101,495 69,672 171,167 9,455 180,622Over 9% - - - 99,108 41, 66 4 70,028 160,800 - 160,800 28 160,828Floating rate - - - - 41,754 59,108 100,862 122,122 222,984 15,350 238,334Total 300,544 154,577 463,550 615,533 314,382 345,951 1,893,993 297,156 2,491,693 157,532 2,649,225
Grace period0-1 year 58,999 87,087 148,995 127,323 37,621 90,189 491,215 58,186 608,400 2,405 610,8051-2 102,169 29,42h 184,443 160,663 43,360 91,032 508,922 49,429 660,520 39,563 700,0832-3 84,047 23,616 48,931 185,053 75,690 76,725 410,015 106,525 600,587 56,898 657,4853-4 " 44,077 700 20,987 46,662 7,374 44,770 120,493 74,477 239,047 14,685 253,7324-5 - 13,750 60,194 5,000 40,000 6,659 125,603 8,500 134,103 - 134,103Over 5 years 11,252 - - 90,832 110,337 36,576 237,745 39 249,036 43,981 293,017Total 300,544 154,577 463,550 615,533 314,382 345,951 1,893,993 297,156 2,491,693 153,532 2,649,225
Repayment period1/3-5 years 6,030 24,754 54,111 161,448 20,670 34,784 295,767 4,826 343,623 1,228 344,8515-10 years 151,017 95,193 248,355 190,197 84,604 60,262 678,611 92,786 922,414 65,570 987,984Sub-total 157,047 119,947 302,466 351,645 105,274 95,046 974,378 134,612 1,266,037 66,798 1,332,83510-11 years 41,866 6,283 4,275 72,486 35,363 24,292 142,699 39,047 233,612 39,016 262,62811-12 " 59,819 11,442 60,190 22,013 8,000 21,192 100,824 15,978 176,621 25,059 201,68012-13 " 5,793 4,098 24,681 25,277 48,900 107,394 210,350 37,669 253,812 26,539 280,35113-14 " 11,252 - 15,000 9,200 - - 24,200 4,500 39,952 - 39,95214-15 24,767 12,807 5,61l 104,925 21,585 40,911 185,869 27,950 238,586 120 238,70615-20 " - - 51,297 52,000 95,260 57,116 255,763 37,400 293,073 - 293,073Sub-total 143,497 34,630 161,084 263,888 209,108 250,905 919,615 162,544 1,225,656 83,811 1,309,467TMtal 300,544 154,577 463,550 615,533 314,382 345,951 1,893,993 297,156 2,491,693 143,609 2,635,302
I/ Includes grace period.
Source: Bureau of Economic Cooperation, EPB
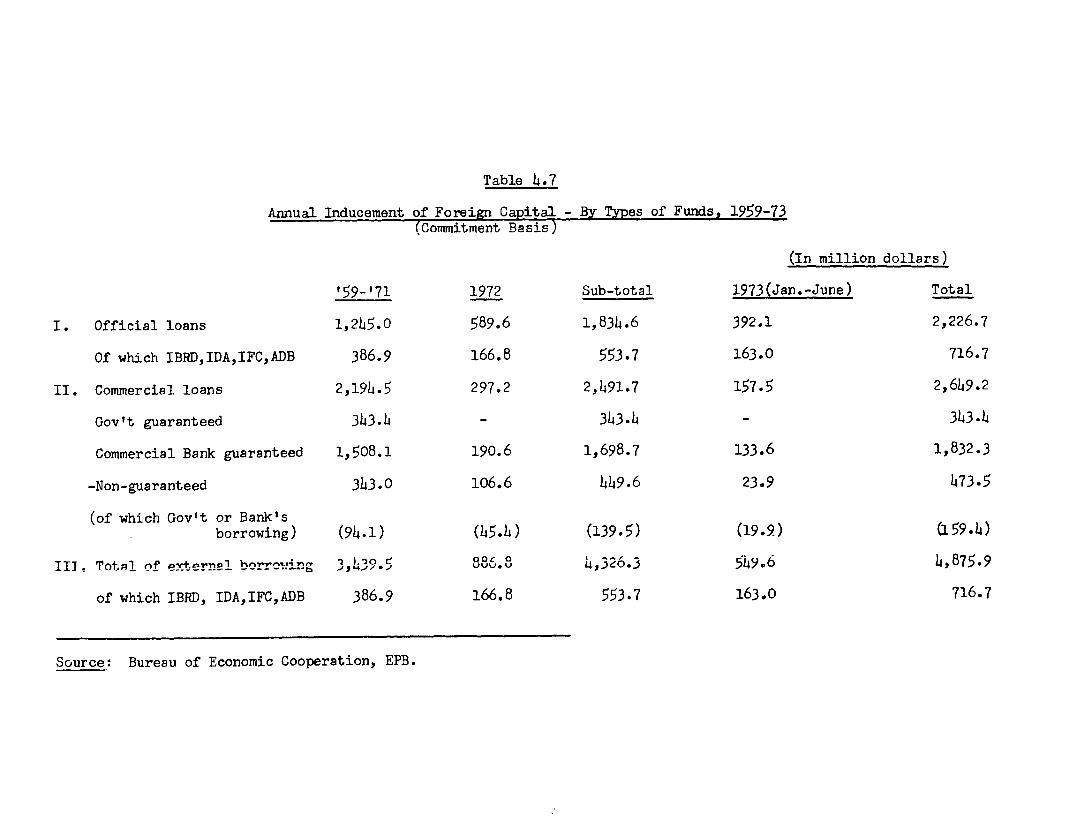
Table 4.7
Annual Inducement of Foreign Capital - By Types of Funds, 1959-73(Commitment Basis
(In million dollars)
'59-'71 1972 Sub-total 1973(Jan.-June) Total
I. Official loans 1,245.0 589.6 1,834.6 392.1 2,226.7
Of which IBRD,IDA,IFC,ADB 386.9 166.8 553.7 163.0 716.7II. Commercial loans 2,194.5 297.2 2,491.7 157.5 2,649.2
Gov't guaranteed 343.L - 343.4 _ 343.4
Commercial Bank guaranteed 1,5o8.1 190.6 1,698.7 133.6 1,832.3
-Non-guaranteed 343.0 106.6 449.6 23.9 473.5(of which Gov't or Bank's
borrowing) (94.1) (45.4) (139.5) (19.9) (159.4)II]. Total of et-ernel borrow-ng 3,43.5 886.8 4,326.3 549.6 4,875.9
of which IBRD, IDA,IFC,ADB 386.9 166.8 553.7 163.0 716.7
Source: Bureau of Economic Cooperation, EPB.

Table 4.8
Annuial Indiucemenit of Foreign Capital - By Types of Fuinds,_1959-73(Arrival Basis)
'59-'66 1967 1968 1969 1970 1971 1972 Sub- 1973 TotalTotal (Jan.-June)
Official loan 14O,847 105,619 70,220 138,934 115,325 303,395 324,436 1,198,776 227,981 1,426,757
Commercial loan 184,109 124,OO1 268,366 1408,671 366,708 345,193 326,415 2,023,463 182,356 2,205,819
Government guaranteed 171,813 66,363 66,491 25,635 11,627 36,396 27,074 405,399 14,045 414,444
Commercial bankguaranteed 5,187 38,963 161,728 365,916 276,902 275,931 2b9,908 1,374,535 151,009 1,525,544
Without guarantee 7,109 18,675 40,147 17,120 78,179 32,866 49,433 243,529 17,302 260,831
TOTAL 324,956 229,620 338,586 547,605 482,033 648,588 650,851 3,222,239 410,337 3,632,576
Source: Bureau of Economic Cooperation, EPB
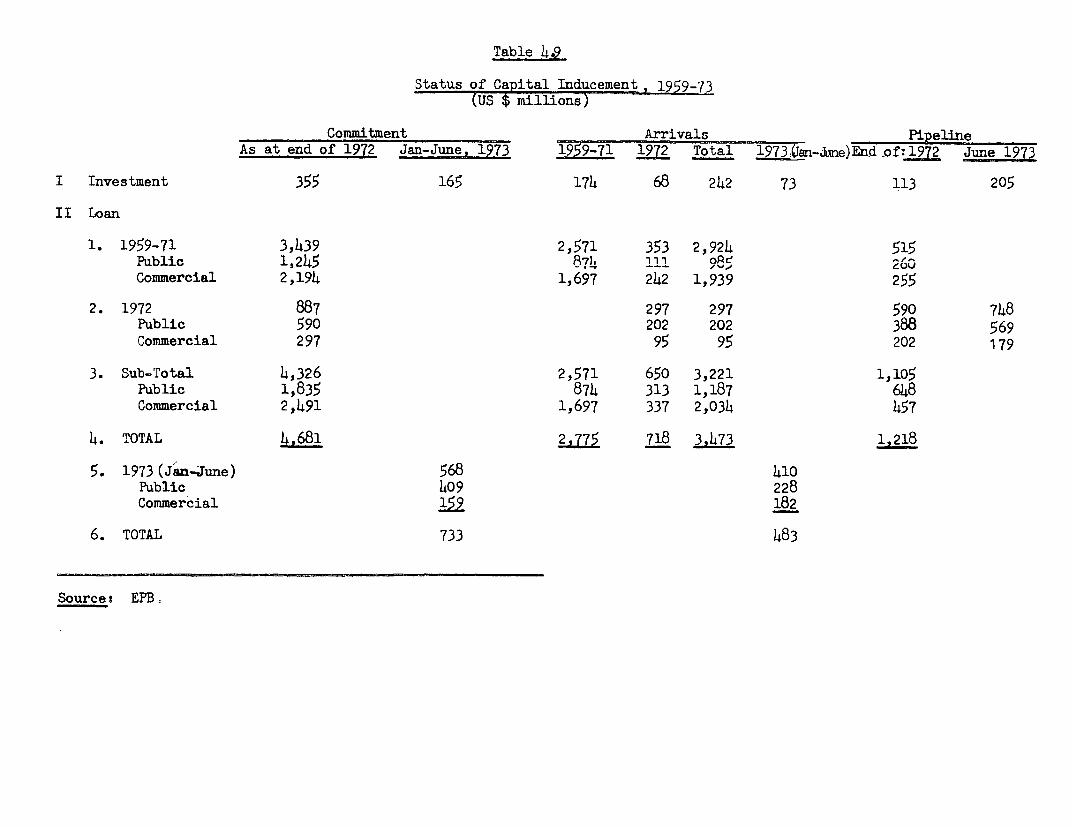
Table 4.9
Status of Capital Inducement, 1959-73tUS $f millions)
Commitment Arrivals PiRelineAs at end of 1972 Jan-June, 1399-71 1272 Total 1973 (Jan-ime) End o f 1972 June 1973
I Investment 355 165 174 68 242 73 113 205
II Loan
1. 1959-71 3,439 2,571 353 2,924 515Public 1,245 87? 111 526Commercial 2,194 1,697 242 1,939 255
2. 1972 887 297 297 590 748Public 590 202 202 388 569Commercial 297 95 95 202 179
3. Sub-Total 4,326 2,571 650 3,221 1,105Public 1,835 874 313 1,187 648Commercial 2,491 1,697 337 2,034 457
4. TOTAL 4,681 2,775 718 3,473 1,218
5. 1973 (Jan-June) 568 410Public 409 228Commercial 159 182
6. TOTAL 733 483
Sourcet EPB.


Table 5 o1
Central Government Budgets: Summary, 1967-1974(In billion Won)
1967 1968 1969 1970 1971 1972 19 7 3 A/ 19741/
General Budget.
Revenues 163.2 237.5 342.4 419.o 551.5 706.8 659.4 880.5
Tax Revenue 139.2 210.7 287.1 364.8 400.9 417.2 488.4 641.8
(Direct and Indirect) (129.2) (194.3) (262.8) (334.7) (355.5) (374.3) (431.4) (549.2)
(Monopoly Profits) (10.0) (16.4) (24.3) (30.1) (45.4) (42.9) (57.0) (69.0)
Other Revenue 24.0 26.8 55.3 54.2 150.6 289.6 171.0 238.7
Expenditures 179.9 260o4 367.3 439.6 546.3 706.8 659.4 880.5
General 84.3 116.2 154.6 192.5 234.2 292.7 299.8 385.4
Defense 49.5 64.4 83.3 100.3 134.8 173.9 184.3 221.6
Investment 33.5 58.9 95.5 119.7 ) 177.3 ) 240.2 175.3 273.5
Loans (net) 12.6 20.9 33.9 27.1 ) ) - -
Surplus (+) or Deficit (-) -16.7 -22.9 -24.9 -20.6 5.2 -
1/ Final budget data (EPB).
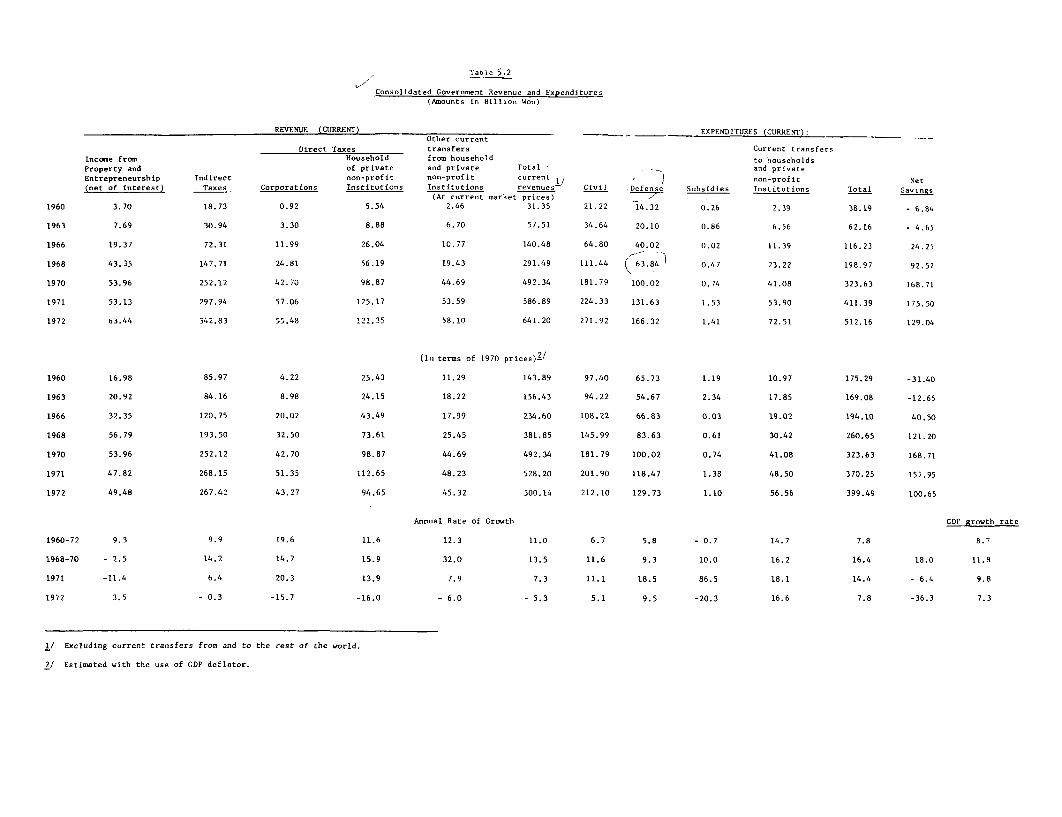
Table 5.2
Consolidated Government Revenue and Expenditures(Amounts in Billion Won)
REVENUE (CURRENT) _ EXPENDITURES (CURENT):Other current
Direct Taxes transfers Current transfersIncome from Household from household to householdsProperty and of private and private Total and privateEntrepreneurship Indirect non-profit non-profit current /' non-profit Net(net of interest) Taxes Corporations Institutions Institutions revenues) Civil .Defense Subsidies Institutions Total Savings
(At current market prices) ---11960 3.70 18.73 0.92 5.54 2.46 31.35 21.22 14.32 0.26 2.39 38.19 - 6.84
1963 7.69 30.94 3.30 8.88 6.70 57.51 34.64 20.10 0.86 6.56 62.16 - 4.65
1966 19.37 72.31 11.99 26.04 10.77 140.48 64.80 40.02 0.02 11.39 116.23 24.25
1968 43.35 147.71 24.81 56.19 19.43 291.49 111.44 63.84 0.47 23.22 198.97 92.52
1970 53.96 252.12 42.70 98.87 44.69 492.34 181.79 100.02 0.74 41.08 323.63 168.71
1971 53.13 297.94 57.06 125.17 53.59 586.89 224.33 131.63 1.53 53.90 411.39 175.50
1972 63.44 342.83 55.48 121.35 58.10 641.20 271.92 166.32 1.41 72.51 512.16 129.04
(In terms of 1970 prices)2/
1960 16.98 85.97 4.22 25.43 11.29 143.89 97.40 65.73 1.19 10.97 175.29 -31.40
1963 20.92 84.16 8.98 24.15 18.22 156.43 94.22 54.67 2.34 17.85 169.08 -12.65
1966 32.35 120.75 20.02 43.49 17.99 234.60 108.22 66.83 0.03 19.02 194.10 40.50
1968 56.79 193.50 32.50 73.61 25.45 381.85 145.99 83.63 0.61 30.42 260.65 121.20
1970 53.96 252.12 42.70 98.87 44.69 492.34 181.79 100.02 0.74 41.08 323.63 168.71
1971 47.82 268.15 51.35 112.65 48.23 528.20 201.90 118.47 1.38 48.50 370.25 157.95
1972 49.48 267.42 43.27 94.65 45.32 500.14 212.10 129.73 1.10 56.56 399.49 100.65
Annual Rate of Growth GDr growth rate
1960-72 9.3 9.9 19.6 11.6 12.3 11.0 6.7 5.8 - 0.7 14.7 7.8 8.7
1968-70 - 2.5 14.2 14.7 15.9 32.0 13.5 11.6 9.3 10.0 16.2 16.4 18.0 11.8
1971 -11.4 6.4 20.3 13.9 7.9 7.3 11.1 18.5 86.5 18.1 14.4 - 6.4 9.8
1972 3.5 - 0.3 -15.7 -16.0 - 6.0 - 5.3 5.1 9.5 -20.3 16.6 7.8 -36.3 7.3
I/ Excluding current transfers from and to the rest of the world.
2/ Estimated with the use of GDP deflator.
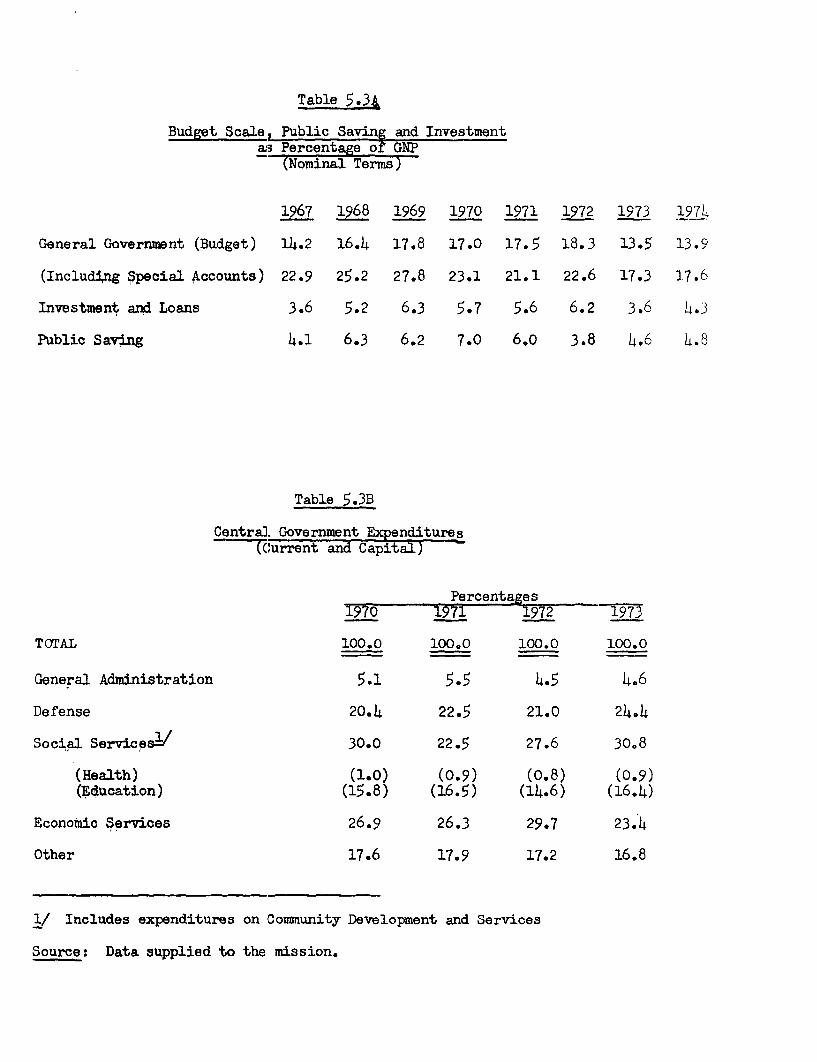
Table 5.3
Budget Scale, Public Saving and Investment&3 Percentage of GNP
(Nominal Terms)
1967 1968 1969 1970 1971 1972 1973 1974
General Government (Budget) 14.2 16.4 17.8 17.0 17.5 18.3 13.5 13.9
(IncludXng Special Accounts) 22.9 25.2 27.8 23.1 21.1 22.6 17.3 17.6
Investment and Loans 3.6 5.2 6.3 5.7 5.6 6.2 3.6 4.3
Public Saving 4.1 6.3 6.2 7.0 6.o 3.8 4.6 4.8
Table 5.3B
Central Government Expenditures?(Current and Capital)
Percentages
1970 1971 1972 1973
TOTAL 100.0 100.0 100.0 100.0
General Administration 5.1 5.5 4.5 4.6
Defense 20.4 22.5 21.0 24,4
Social Servicesl/ 30.0 22.5 27.6 30.8
(Health) (1.0) (0.9) (0.8) (0.9)(Education) (15.8) (16.5) (14.6) (16.4)
Economic Services 26.9 26.3 29.7 23.4
Other 17.6 17.9 17.2 16.8
1/ Includes expenditures on Community Development and Services
Source: Data supplied to the mission.
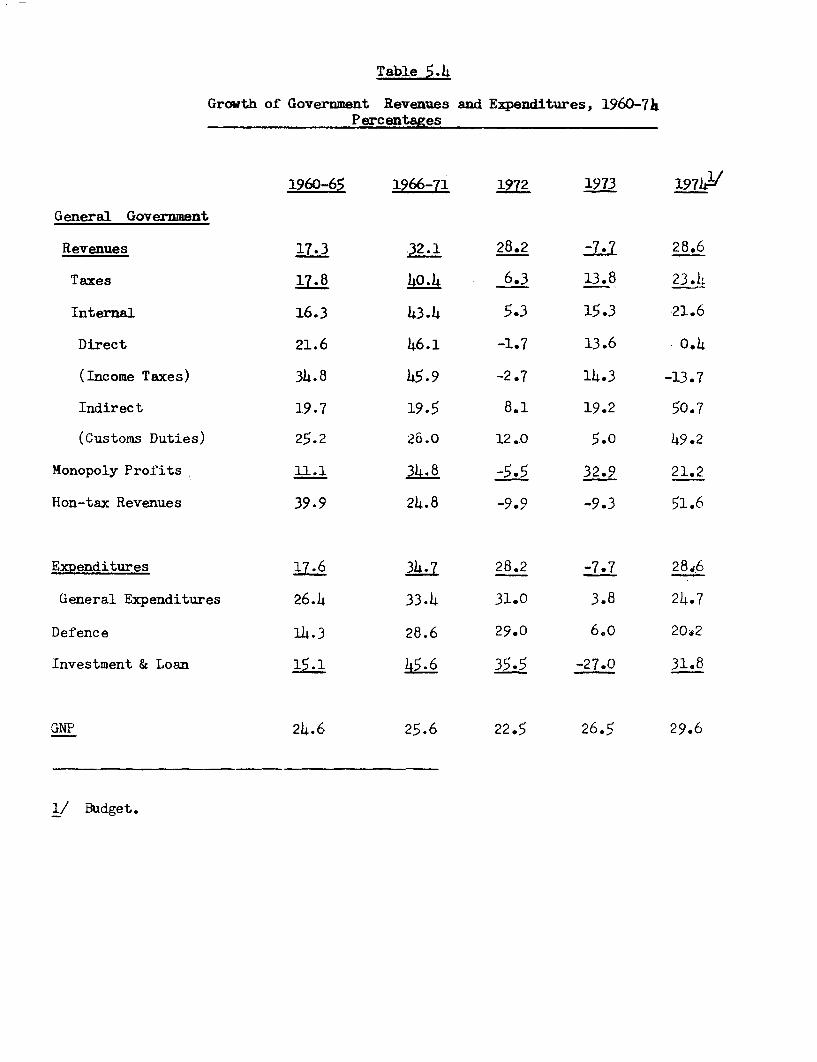
Table 5.4
Growth of Government Revenues and Expenditures, 1960-74Percentages
1960-65 1966-71 1972 1973 197L4
General Government
Revenues 17.3 32.1 28.2 -7.7 28.6
Taxes 18 4o4 6.3 13.8 23.4
Internal 16.3 43.4 5.3 15.3 21.6
Direct 21.6 46.1 -1*7 13.6 0.4
(Income Taxes) 34.8 45.9 -2.7 14.3 -13.7
Indirect 19.7 19.5 8.1 19.2 50.7
(Customs Duties) 25.2 28.0 12.0 5.0 49.2
Monopoly Profits 11.1 34-8 -5.5 32.9 21.2
Hon-tax Revenues 39.9 24.8 -9.9 -9.3 51.6
Expenditures 17-6 34-7 28.2 -7.7 28.6
General Expenditures 26.J 33.4 31.0 3.8 24.7
Defence 14 .3 28.6 29.0 60o 20c2
Investment & Loan 15s1 45-6 35.5 -27.0 31e8
GNP 24.6 25.6 22.5 26.5 29.6
1/ Budget.
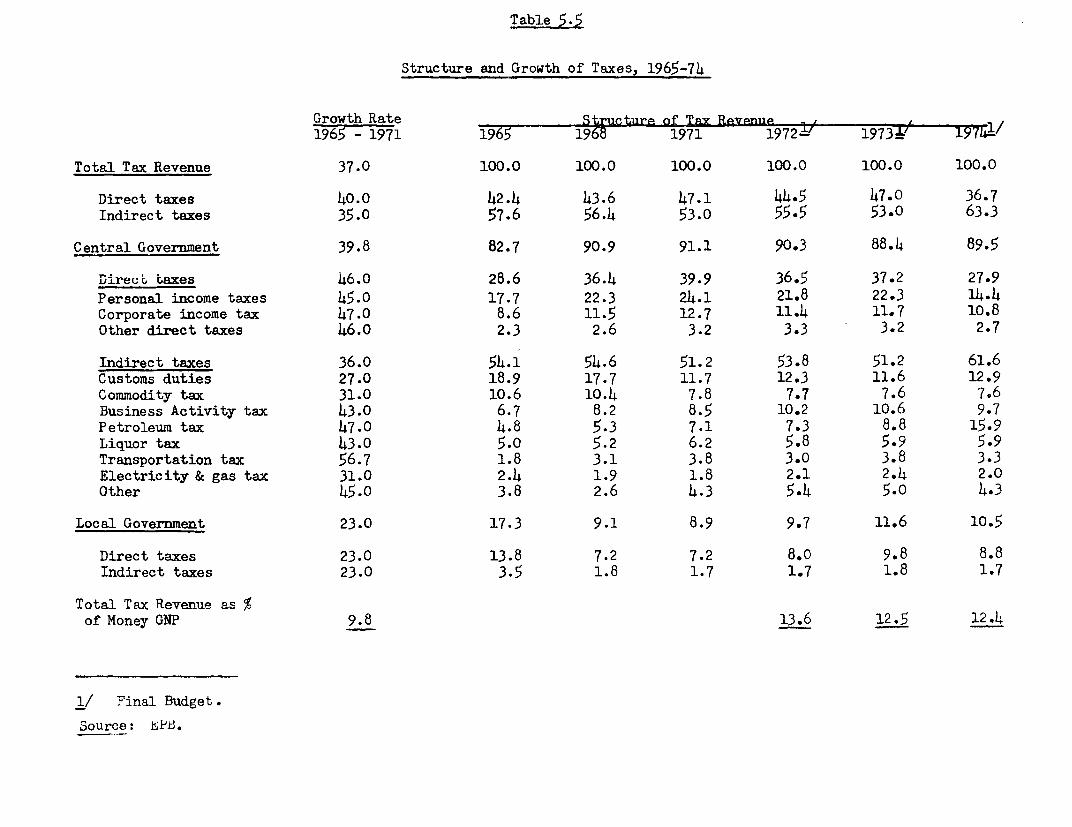
Table 5.5
Structure and Growth of Taxes, 1965-74
Growth Rate Structurf- of Tx Rpvenie---1965 - 1971 1965 1968 1971 19721- ' 1973k' -197L1/
Total Tax Revenue 37.0 100.0 100.0 100.0 100.0 100.0 100.0
Direct taxes 40.0 42.4 43.6 47.1 44.5 47.0 36.7Indirect taxes 35.0 57.6 56.4 53.0 55.5 53.0 63.3
Central Government 39.8 82.7 90.9 91.1 90.3 88.4 89.5
DireeG taxes 46.0 28.6 36.4 39.9 36.5 37.2 27.9Personal income taxes 45.0 17.7 22.3 24.1 21.8 22.3 14.4Corporate income tax 47.0 8.6 11.5 12.7 11.4 11.7 10.8Other direct taxes 46.o 2.3 2.6 3.2 3.3 3.2 2.7
Indirect taxes 36.0 54.1 54.6 51.2 53.8 51.2 61.6Customs duties 27.0 18.9 17.7 11.7 12.3 11.6 12.9Commodity tax 31.0 10.6 10.4 7.8 7.7 7.6 7.6Business Activity tax 43.0 6.7 8.2 8.5 10.2 10.6 9.7Petroleum tax 47.0 4.8 5.3 7.1 7.3 8.8 15.9Liquor tax 43.0 5.0 5.2 6.2 5.8 5.9 5.9Transportation tax 56.7 1.8 3.1 3.8 3.0 3.8 3.3Electricity & gas tax 31.0 2.4 1.9 1.8 2.1 2.4 2.0Other 45.0 3.8 2.6 4.3 5.4 5.0 4.3
Local Government 23.0 17.3 9.1 8.9 9.7 11.6 10.5
Direct taxes 23.0 13.8 7.2 7.2 8.0 9.8 8.8Indirect taxes 23.0 3.5 1.8 1.7 1.7 1.8 1.7
Total Tax Revenue as %of Money GNP 9.8 13.6 12.5 12.4
1/ Final Budget.
Source: h?B.
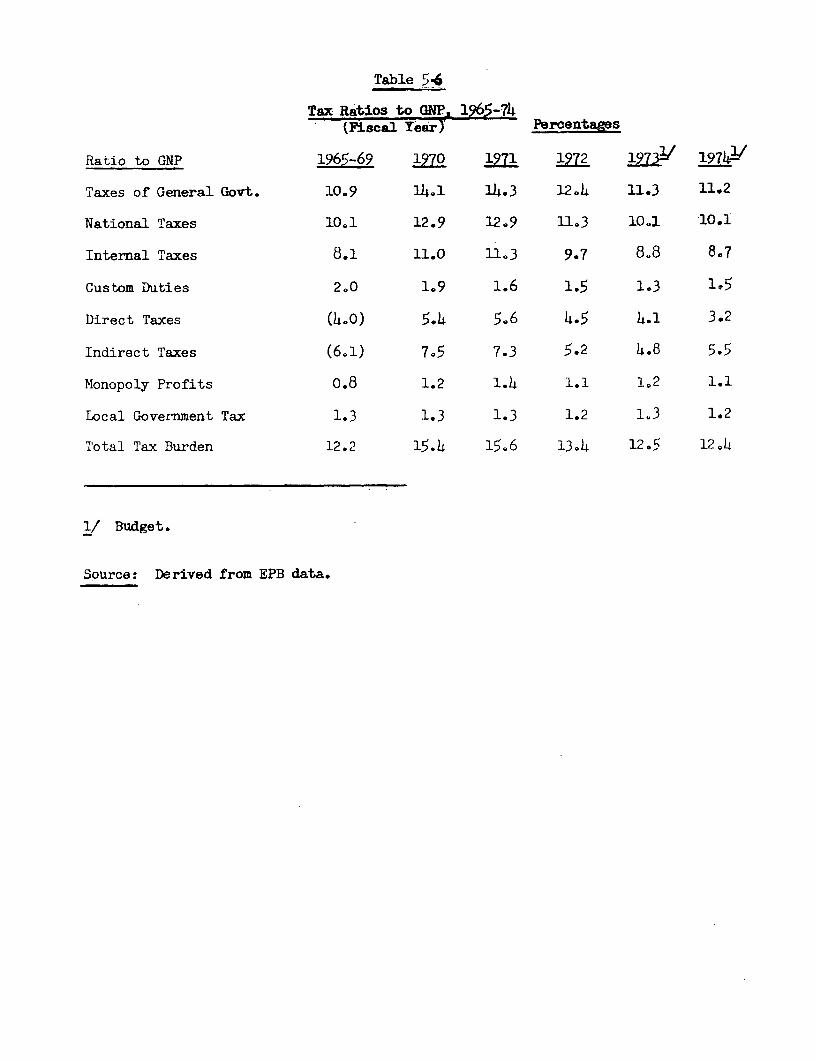
Table 546
Tax Ratios to GNP,, 1965-74(Fiscal Year) Percentages
Ratio to GNP 1965-69 1970 19711' 197421
Taxes of General Govt. 10.9 14e1 14.3 12.4 11.3 11.2
National Taxes 1001 12.9 12.9 11.3 10.1 -10.1
Internal Taxes 8.1 11.0 11.3 9.7 8.8 8.7
Custom Duties 2.0 1.9 1.6 1.5 1.3 1.5
Direct Taxes (h0o) 5.4 5.6 4.5 4h1 3.2
Indirect Taxes (6,1) 7,5 7,3 5.2 4.8 5.5
Monopoly Profits o.8 1.2 1.4 1.1 1.2 1.1
Local Government Tax 1.3 1.3 1.3 1.2 1.3 1.2
Total Tax Burden 12.2 15.4 15,6 1304 12.5 12.4
1/ Budget.
Source: Derived from EPB data.
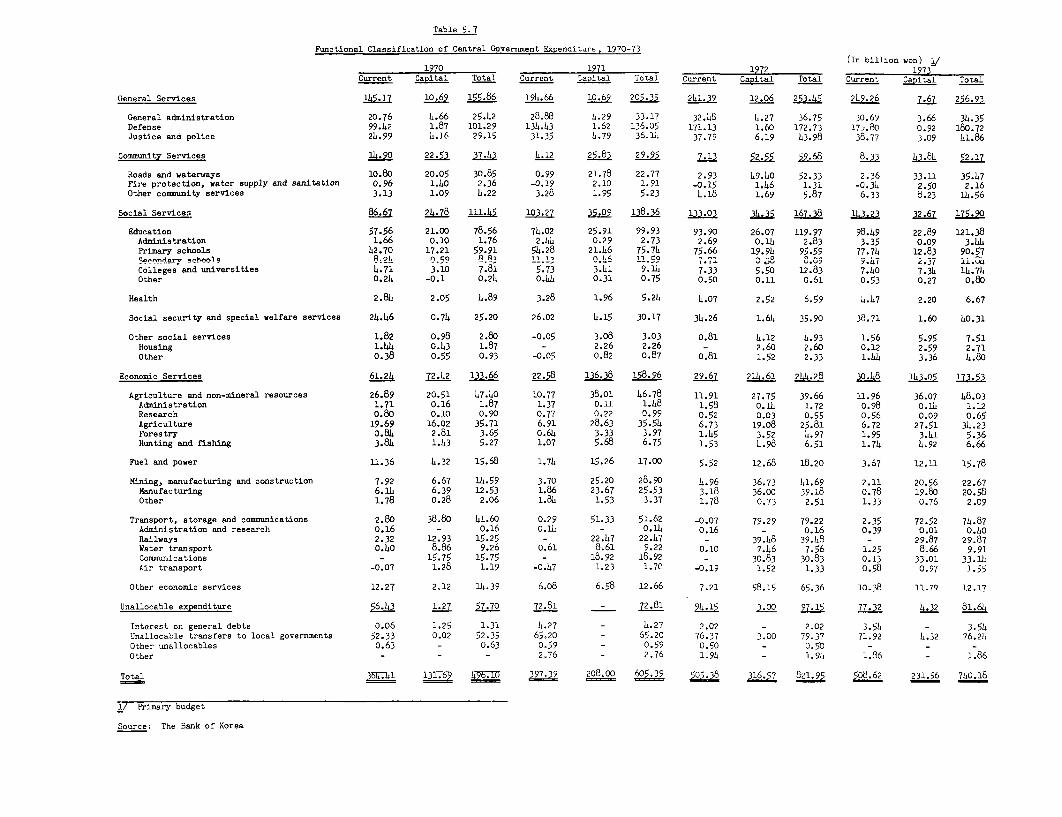
Table 5. 7
Functional Classification of Central Government Expenciture , 1970-73
1970 1971 1972 ~~~~~~~~~~~~~~~(In billion won) I~/__ __ _ __ __ _ __ __ _ __ __ _ ___1970__ _ __ ___1971_ 1972__ __ _ __ __ _ __ __ _1973
Current Capital Total Current Capital Total Curren Capital Total Current _api_al ota
General Services 145.1 10.69 155.86 198.66 10.69 a205.35 241.39 12.06 253±45 289.26 7.67 256.93
General adainistration 20.76 8.66 25.82 28.88 8.29 33.17 32.48 4.27 36.75 30.6? 3.66 38.35Defense 99.82 1.87 101.29 138.83 1.62 136.05 171.13 1.60 172.73 17-.80 0.92 180.72Justice end police 28.99 83.6 29.15 31.35 8.79 36.18 37.79 6.19 83.98 38.77 3.09 81.86
Community Services 14.92 22.53 37L43 4.12 25.83 2925±23i2.5 596 83 83.84 52.17
Roads and waterways 10.80 20.05 30.85 0.99 21.78 22.77 2.93 89.80 52.33 2.36 33.11. 35.47Fire protection, water supply and sanitation 0.96 1.80 2.36 -0.19 2.10 1.91 -0.15 1.86 1.31 -0.38 2.50 2.16Other community' services 3.13 1.09 8.22 3.28 1.95 5.23 8.18 1.69 5.87 6.33 8.23 18.56
Social Services 86.6 28.78 111.85 103.27 35So2 138±36 13323±IL J~~ 167.38 1.3.23f 32.67 17.9
Education 57.56 21.00 78.56 78.02 25.91 99.93 93.90 26.07 119.97 98.89 22.89 u.1.38Administration 1.66 0.10 1.76 2.88 0.29 2.73 2.69 0.18 2.83 3.35 0.09 3.88IPrimary schools 82.70 17.21 59.91 58.28 21.86 75.78 75.66 19.98 95.59 77.78 12.83 90.57
eo,'nrdnrv Arhn .2 0.9l.8 I11. 0.6 11.59I 7.1 C- -
Colleges end universities 8.71 3.10 7.81 5.73 3.81 9.18 7.33 5.50 12.83 7.80 7.38 18.74Other 0.28 -0.1 0.28 0.44 0.31 0.75 0.50 0.11 0.61 0.53 0.27 0.80
Health 2.88 2.05 8.89 3.28 1.96 5.28 8.07 2.52 6.59 8.87 2.20 6.67
Social security and special welfare services 28.86 0.78 25.20 26.02 8.15 30.17 38.26 1.68 35.90 38.71 1.60 80.31
Other social services 1.82 0.98 2.80 -0.05 3.08 3.03 0.81 8.12 8.93 1.56 5.95 7.51Housi-ng 1.88 0.83 1.87 - 2.26 2.26 -2.60 2.60 0.12 2.59 2.71Other 0.38 0.55 0.93 -0.05 0.82 0.87 0.81 1.52 2.33 1.88 3.36 4.80
Economic Services 61.28 72.82 133.66 22.58 136.38 158.96 29%67 218.61 288.28 3o.88 14.o 173.53
Agriculture and non-mineral resources 26.89 20.51 87.80 10.77 38.01 86.78 11.91 27.75 39.66 11.96 36.07 88.03Administration 1.71 0.16 1.87 1.37 0.11 1.88 1.58 0.18) 1.72 0.98 0.18 1.12Research 0.80 0.10 0.90 0.77 0.22 0.99 0.52 0.03 0.55 0.56 0.09 0.65Agriculture 19.69 16.02 35.71 6.91 28.63 35.58 6.73 19.08 25.81 6.72 27.51 38.23Forestry 0.84 2.81 3.65 0.68 3.33 3.97 1.45 3.52 8.97 1.95 3.41 5.36Hunting and fishing 3.84 1.83 5.27 1.07 5.68 6.75 1.53 8.98 6.51 1.78 8.92 6.66
F'uel end power 11.36 8.32 15.68 1.78 15.26 17.00 5.52 12.68 18.20 3.67 12.11 15.78
Mining, manufacturing and construction 7.92 6.67 18.59 3.70 25.20 28.90 8.96 36.73 81.69 2.11 20.56 22.67Manufacturing 6.18L 6.39 1.2.53 1.86 23.67 25.53 3.18 36.00 39.18 0.78 19.80 20.58Other 1.78 0.28 2.06 1.88 1.53 3.37 1.78 0.73 2.51 1.33 0.76 2.09
Transport, storage end communications 2.80 38.80 81.60 0.29 51.33 51.62 -0.07 79.29 79.22 2.35 72.52 78.87Administration and research 0.16 - 0.16 0.18 - 0.18 0.16 - 0.16 0.39 0.01 0.80Railways 2.32 12.93 15.25 - 22.87 22.87 - 39.88 39.88 - 29.87 29.87Water transport 0.40 8.86 9.26 0.61 8.61 9.22 0.10 7.86 7.56 1.25 8.66 9.91Communications - 15.75 15.75- 18.92 18.92 - 30.83 30.83 0.13 33.01 33.184Air transport -0.07 1.28 1.19 -0.87 1.23 1.70 -0.19 1.52 1.33 o.58 0.97 1-.55
Other economic services 12.27 2,12 18.39 6.08 6.58 12.66 7.21 58.15 65.36 10.38 11.79 12.17
Unallocable expendLiture564 1.27 57.70 72.81- 72.81 2 1 30 97.15 77.32 8.32 81.68
Interest on general debts 0.06 1.25 1.31 8.27 - 8.27 2.02 - 2.02 3.54 - 3.54Unallocable transfers to local governiments 52.33 0.02 52.35 65.20 - 65.20 76.37 3.00 79.37 71.92 8.32 76.28Other unallocables 0.63 - 0.63 0.59 - 0.59 0.50 - 0.50 - - -
Other - - -2.76 - 2.76 1.98 1.98. 1.86 - 1.86
Total 36R81 131.69 496710 397.39 208.00 605.3 505.3_8 316.57 8195 508.62 231.56 780.18
I/ Primary budget
Source: The Bank of Korea
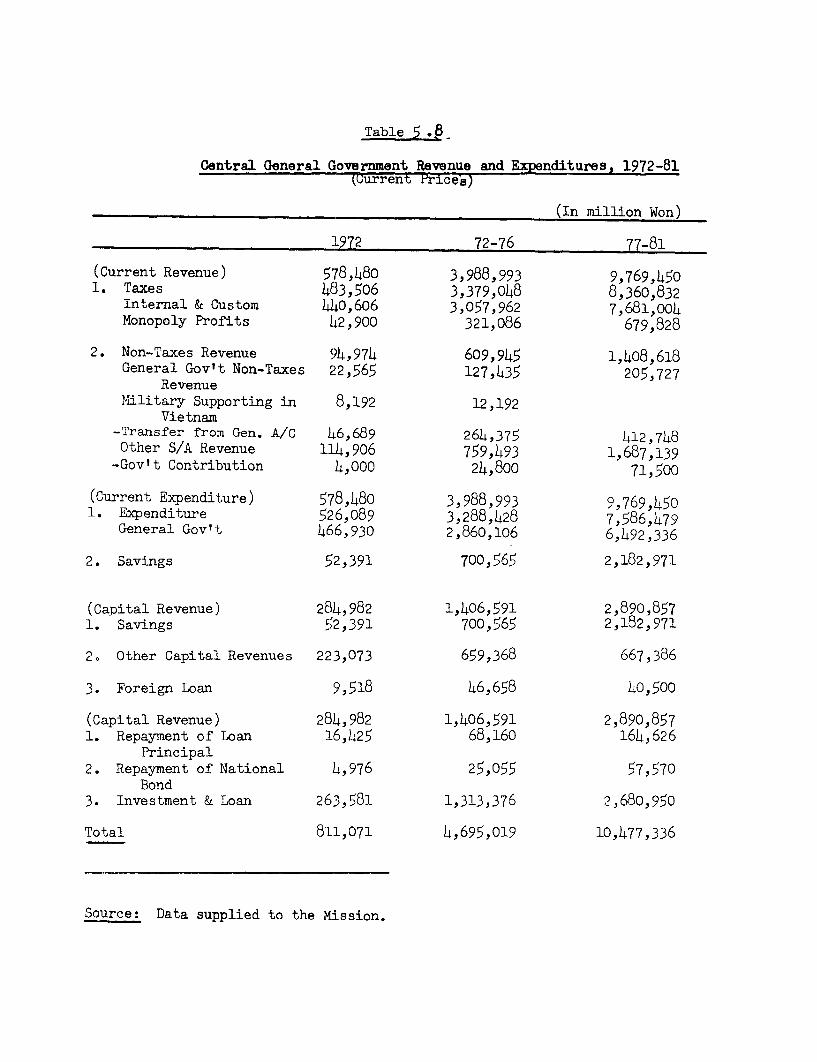
Table 5 .6
Central General Government Revenue and Expenditures, 1972-81(Current Price's)
(In million Won)
1972 72-76 77-81
(Current Revenue) 578,480 3,988,993 9,769,4501. Taxes 483,506 3,379,048 8,360,832
Internal & Custom 440,606 3,057,962 7,681,004Monopoly Profits 42,900 321,086 679,828
2. Non-Taxes Revenue 94,974 609,945 1,408,618General Gov't Non-Taxes 22,565 127,435 205,727
RevenueMilitary Supporting in 8,192 12,192
Vietnam-Transfer from Gen. A/C 146,689 264,375 412,748Other S/A Revenue 114,906 759,493 1,687,139
-Gov't Contribution 4,000 24,800 71,500
(Current Expenditure) 578,480 3,988,993 9,769,4501. Expenditure 526,089 3,288,428 7,586,479
General Gov't 466,930 2,860,106 6,492,336
2. Savings 52,391 700,565 2,182,971
(Capital Revenue) 284,982 1,406,591 2,890,8571. Savings 52,391 700,565 2,182,971
2. Other Capital Revenues 223,073 659,368 667,386
3. Foreign Loan 9,518 46,658 40,500
(Capital Revenue) 284,982 1,406,591 2,890,8571. Repayment of Loan :L6,425 68,160 164,626
Principal2. Repayment of National 4,976 25,055 57,570
Bond3. Investment & Loan 263,581 1,313,376 2,680,950
Total 811,071 4,695,019 10,477,336
Source: Data supplied to the Mission.
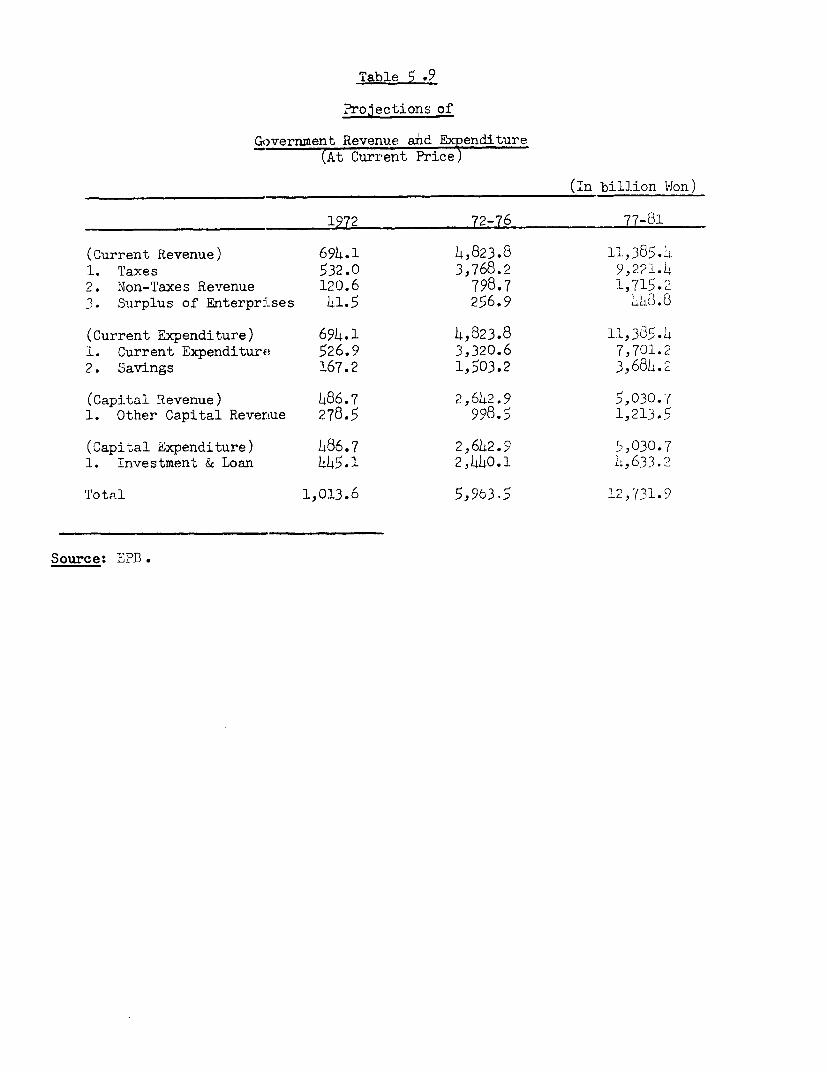
Table 5 .9
Projections of
G_vernment Revenue and Ependiture(At Current Price)
(In billion Won)
1972 72-76 77-81
(Current Revenue) 694.1 4,823.8 11,385.41. Taxes 532.0 3,768.2 9,221.42. Non-Taxes Revenue 120.6 798.7 1,715.93. Surplus of Enterpr-Lses 41.5 256.9 4a8.8
(Current Expenditure) 694.1 4,823.8 11,385.41. Current Expenditure 526.9 3,320.6 7,701.22. Savings 167.2 1,503.2 3,684.2
(Capital Revenue) 486.7 2,642.9 5,030.71. Other Capital Revernue 278.5 998.5 1,213.5
(Capital Expenditure) 486.7 2,642.9 5,030.71. Investment & Loan 445.1 2,440.1 4,633.2
Total 1,013.6 5,963.5 12,731.9
Source: EPD.

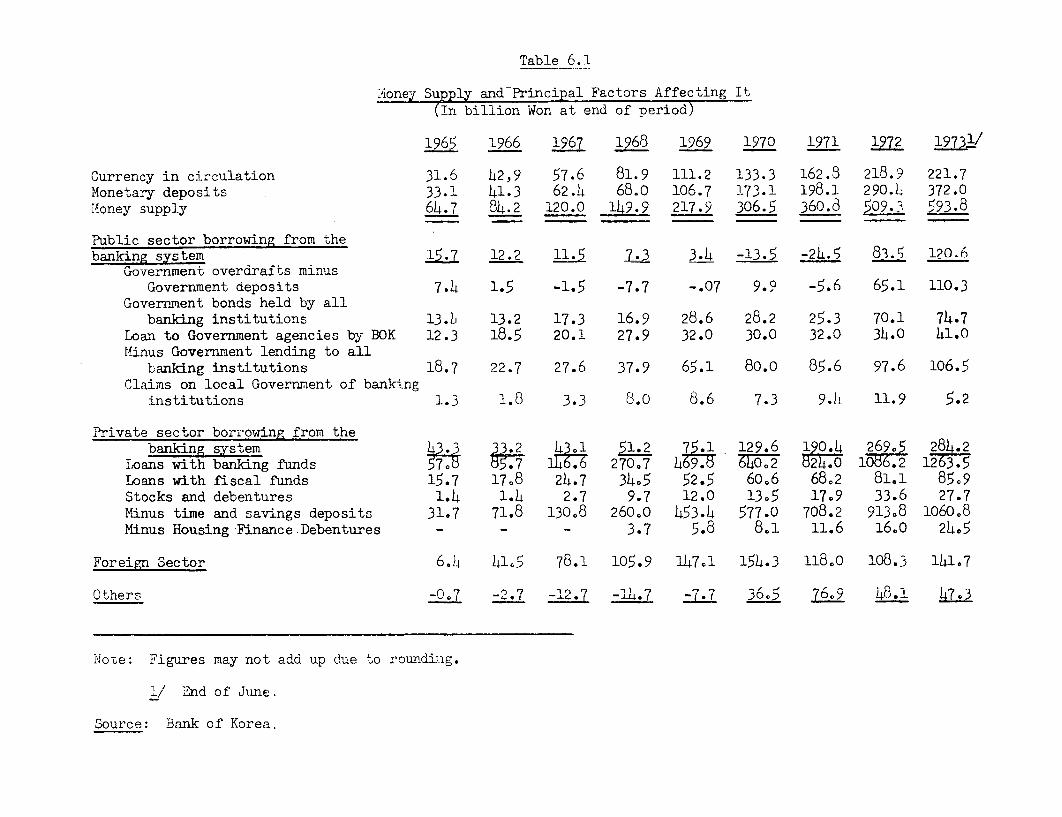
Table 6.1
Aoney Supply and Principal Factors Affecting It(In billion Won at end of period)
1965 1966 1967 1968 1969 1970 1971 1972 19731/
Currency in circulation 31.6 42,9 57.6 81.9 111.2 133.3 162.8 218.9 221.7Monetary deposits 33.1 41.3 62.14 68.0 106.7 173.1 198.1 290.4 372.0IM^oney supply 64.7 84.2 120.0 1i49.9 217.9 306.5 360.8 509.3 e 93.8
Public sector borrowing from thebanking system IL.1 12.2 11.5 -79 3.4 -13.5 -2aL5 83.5 120.6
uovernment overdrafts minusGovernment deposits 7.4 1.5 -1.5 -7.7 -. 07 9.9 -5.6 65.1 110.3
Government bonds held by allbanking institutions 13.. 13.2 17.3 16.9 28.6 28.2 25.3 70.1 74.7
Loan to Government agencies by BOK 12.3 18.5 20.1 27.9 32.0 30.0 32.0 34o0 41.0Minus Government lending to all
banking institutions 18.7 22.7 27.6 37.9 65.1 80.0 85.6 97.6 106.5Claims on local Government of banking
institutions 1.3 1.8 3.3 8.0 8.6 7.3 9.hl 11.9 5.2
Private sector borrowing from thebanking system -433 33.? 1 51.2 752 1 129.6 190o.4 2695 284.2
Loans with banking funds 57,5 i5.7 1h6.6 270.7 469b. 7 0 1056.2 1263.5Loans with fiscal funds 15.7 17.8 2h.7 34.5 52.5 60.6 68.2 81.1 85,9Stocks and debentures 14 1.4 2.7 9.7 12.0 13.5 17,9 33.6 27.7Minus time and savings deposits 31.7 71.8 130,8 260,0 453.4 577.0 708.2 913,8 1060.8Minus Housing Finance.Debentures - - - 3.7 5.8 8.1 11.6 16.0 24e5
Foreign Sector 6.4 415 78.1 105.9 147,1 154.3 118,0 108.3 141,7
Others -0,7 -2.7 -12.7 -].7 ~ 36.5 E 4)1 47.3
Note: Figures may not add up due to roundin;g.
1/ End of June.
Source: Bank of Korea.
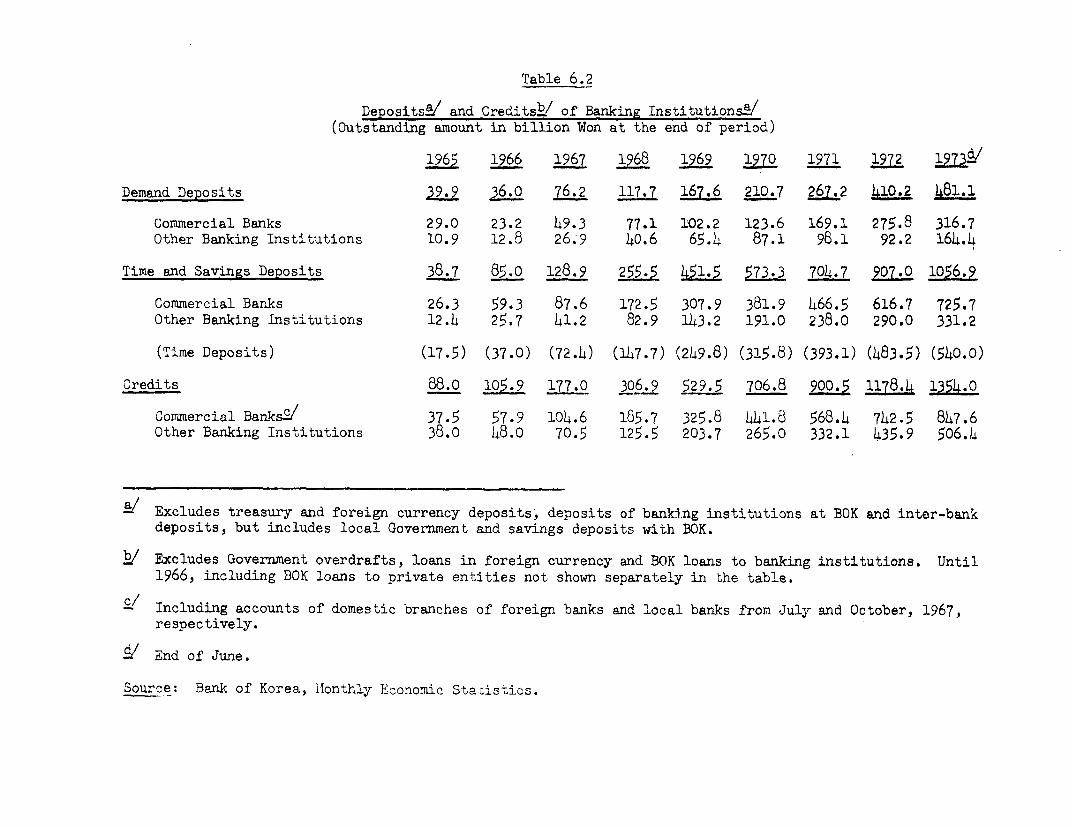
Table 6.2
Deposits-/ and Creditsh/ of Banking Institutionst/(Outstanding amount in billion Won at the end of period)
1965 1966 1967 1968 1969 1970 1971 l972
Demand Deposits 39.9 360 76.2 117.7 167.6 210.7 267.2 410.2 481.1
Commercial Banks 29.0 23.2 49.3 77.1 102.2 123.6 169.1 275.8 316.7Other Banking Institutions 10.9 12.8 26.-9 40.6 65.4 87.1 98.1 92.2 164.4
Time and Savings Deposits 38.7 85.0 128.9 255.5 451.5 573.3 704.7 907.0 1056.9
Commercial Banks 26.3 59.3 87.6 172.5 307.9 381.9 466.5 616.7 725.7Other Banking Institutions 12.4 25.7 41.2 82.9 143.2 191.0 238.0 290.0 331.2
(Time Deposits) (17.5) (37.0) (72.4) (147.7) (249.8) (315.8) (393.1) (483.5) (540.0)
Credits 88.0 105.9 177.0 c 306.9 529.5 706.8 900.5 1178.4 1354.0
Commercial Banks&" 37.5 57.9 104.6 185.7 325.8 b~L. 568.4 742.5 847.6Other Banking Institutions 38.0 48.0 70.5 125.5 203.7 265.0 332.1 435.9 506.4
Excludes treasury and foreign currency deposits, deposits of banking institutions at BOK and inter-bankdeposits, but includes local Government and savings deposits with BOK.
g/ Excludes Government overdrafts, loans in foreign currency and BOK loans to banking institutions. Until1966, including BOK loans to private entities not shown separately in the table.
c Including accounts of domestic branches of foreign banks and local banks from July and October, 1967,respectively.
End of June.
Source: Bank of Korea, ilonthly Economic Stacistics.
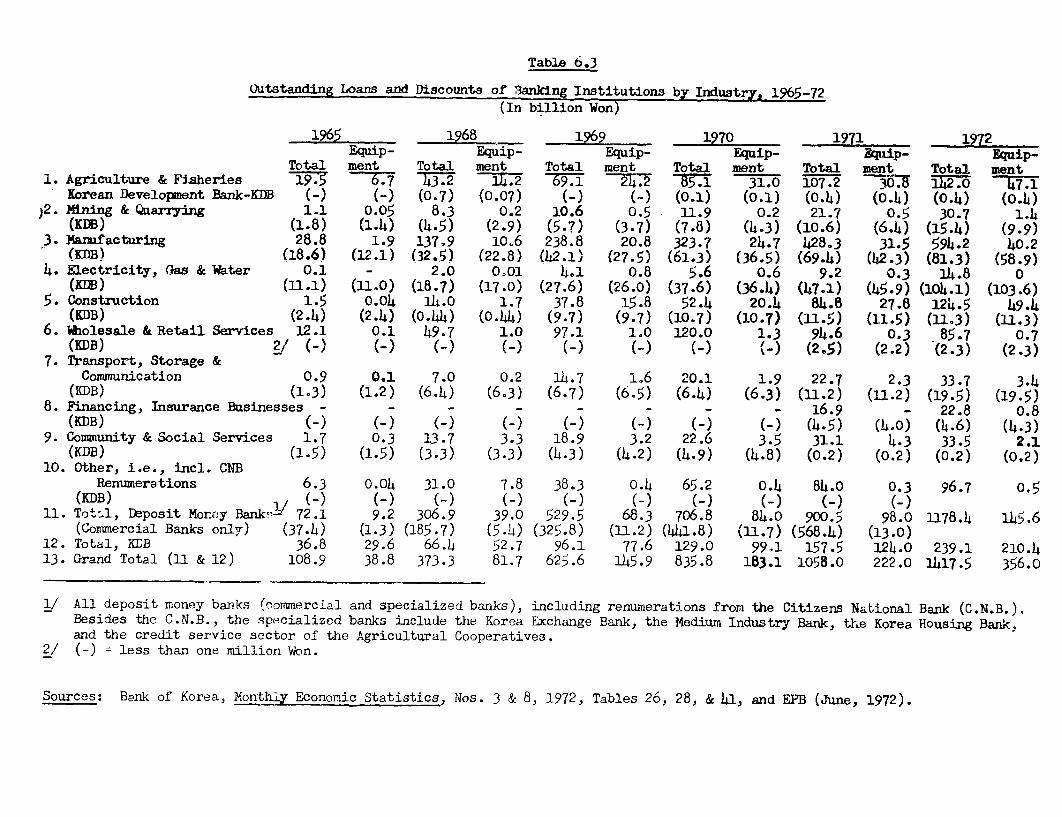
Table 6.3
Outstanding Loans and Discounts of Banking Institutions by Industry, 1965-72(In billion Won)
1965 ~1968 1969 _1970 1971 1972Equip- Equip- Equip- Equip- 17 uip- Equip-
Total ment Total ment Total ment Total ment Total ment Total ment1. Agriculture & Fisheries 19.5 6.7 3 14.2 $91 -272 31.0 107.2 30.8 II70 477.1
IKorean Development Bank-KDB (-) (-) (0-7) (0.07) (_) (-) (0.1) (0.1) (0.4) (0-4) (0-4) (0-4))2. Mining & Quarrying 1.1 0.05 8.3 0.2 10.6 0.5 11.9 0.2 21.7 0.5 30.7 1.4
(KnB) (1.8) (1.4) (4.5) (2.9) (5.7) (3.7) (7.8) (4.3) (10.6) (6.4) (15.4) (9.9)3. Manufacturing 28.8 1.9 137.9 10.6 238.8 20.8 323.7 24.7 428.3 31.5 594.2 40.2
(KDB) (18.6) (12.1) (32.5) (22.8) (42.1) (27.5) (61.3) (36.5) (69.4) (42.3) (81.3) (58.9)4. Electricity, Ggas & Water 0.1 _ 2.0 0o-01 4.1 0.8 5.6 0.6 9.2 0.3 14.8 0
(KDB) (11.1) (11.0) (18.7) (17.0) (27.6) (26.0) (37.6) (36.4) (47.1) (45.9) (1o4.1) (103.6)5. Construction 1.5 0.04 14.0 1.7 37.8 15.8 52.4 20.4 84.8 27.8 124.5 49.4
(KDB) (2.4) (2-4) (0.44) (0.44) (9.7) (9.7) (10.7) (10.7) (31u5) (11.5) (11.3) (U.3)6. 'iholesale & Retail Services 12.1 0.1 49.7 1.0 97.1 1.0 120.0 1.3 94.6 0.3 85.7 0.7
(KDB) 2/ 1 -) (-) (-) (-) (-) (-) (-) (-) (2.5) (2.2) (2.3) (2.3)7. Transport, Storage &
Communication 0.9 0.1 7.0 0.2 14.7 1.6 20.1 1.9 22.7 2.3 33.7 3.4(KDB) (1.3) (1.2) (6.4) (6-3) (6-7) (6-5) (6.4) (6-3) (11.2) (11.2) (19-5) (19.5)
8. Financing, Insurance 13usinesses - - - - 16.9 - 22.8 0.8(KDB) (-) (-) (-) -) (0) ( ) (4.6) (4-3)
9. Community & Social Services 1.7 0.3 13-.7 3.3 18.9 3.2 22.6 3.5 31.1 4.3 33.5 2.1(KDB) (1-5) (1-5) (3.3) (3.3) (4.3) (4.2) (4.9) (4.8) (0.2) (0.2) (0.2) (0.2)
10. Other, i.e., incl. CNBRenumerations 6.3 0.04 31.0 7.8 38.3 0.4 65.2 0.4 84.0 0.3 96.7 0.5
(KDB) .I/ (-) (_ (_ _ _ ) (_ - - _11. Tot.l, Deposit Monry Banks!- 72.1 9.2 306.9 39.0 529.5 68.3 706.8 84.0 900.5 98.0 1178.4 145.6
(Cormmercial Banks only) (37-4) (1-3) (185-7) (5.4) (325.8) (11.2) (441a.8) (11.7) (568.4) (13.0)12. Total, KDB 36.8 29.6 66.4 52.7 96.1 77.6 129.0 99.1 157.5 124.0 239.1 210.413. Grand Total (11 & 12) 108.9 38.8 373.3 81.7 625.6 145.9 835.8 183.1 1058.0 222.0 1417.5 356.o
1/ All deposit money banks (commercial and specialized banks), including renumerations from the Citizens National Bank (C.N.B.).Besides the C.N.B., the specialized banks include the Korea Exchange Bank, the Medium Industry Bank, the Korea Housing Bank,and the credit service sector of the Agricultural Cooperatives.
2/ (-) = less than one million Won.
Sources: Bank of Korea, Monthly Economic Statistics, Nos. 3 & 8, 1972, Tables 26, 28, & 41, and EPB (June, 1972).

Table 6.4
Selected Interest Rates on Loans and Discountsof the Bank of Korea(percent per annum)
Effective Date1965 1968 1969 1970 1971 1972
Nov. 16 Dec. 1 Mar. 1 Oct. 1 June 1 June 15 June 28 June 17 Aug. 3
Export on UN Supply Loans 3.5 3.5 3.5 3.5 3.5 3.5 3.5 3.5 3.5Rice Lien Loans 4.0 4.0 4.0 1.0 4.0 4.0 4.0 4.0 4.0Commercial Bills 21.0 28.0 21.0 23.0 22.0 21.0 16.0 13.0 13.0Other Bills 23.0 28.0 28.0 28.0 26.0 26.0 24.0 19.0 14.0Purchase of Aid Goods 23.0 26.0 26.0 25.2 24.0 - - -
Selected Interest Rates on Loans and Discountsof Commercial Banks(percent per annum)
1965 1969 1970 1971 1972 1973Prior to ISept. 30 June 1 June 18 June 28 June 17 Aug. 3 May 14
Export Bills 6.5 6.0a./ 6 .oa/ 6.0 6.o 6.0 7.0Import Bills - 6.0 6.0 6.0 6.o 6.0 7.0Commercial Bills 14.0 21.6 24.0 22.0 19.0 15.5 15.5Other Bills 16.0 24.0 24.0 23.Ob/ 20.0b/ 16.5 18.0Overdraft 18.0 26.0 26.0 214.0 22.0 17.5 17.5Overdue Loans 20.0 36.5 36.5 36.5 31.2 25.0 25.0Locns for Machinery
Industry Promotion - 12.0 12.0 12.0 12.0 10.0 10.0
a/ Commercial bank loans for raw materials imports for export production carry an interest rate of 6 percent;interest rate on loans for imports of raw materials for other purposes is 21 percent.
b/ Other bills applied to 3-5 years.
Source: Bank of Korea, Monthly Economic Statistics.
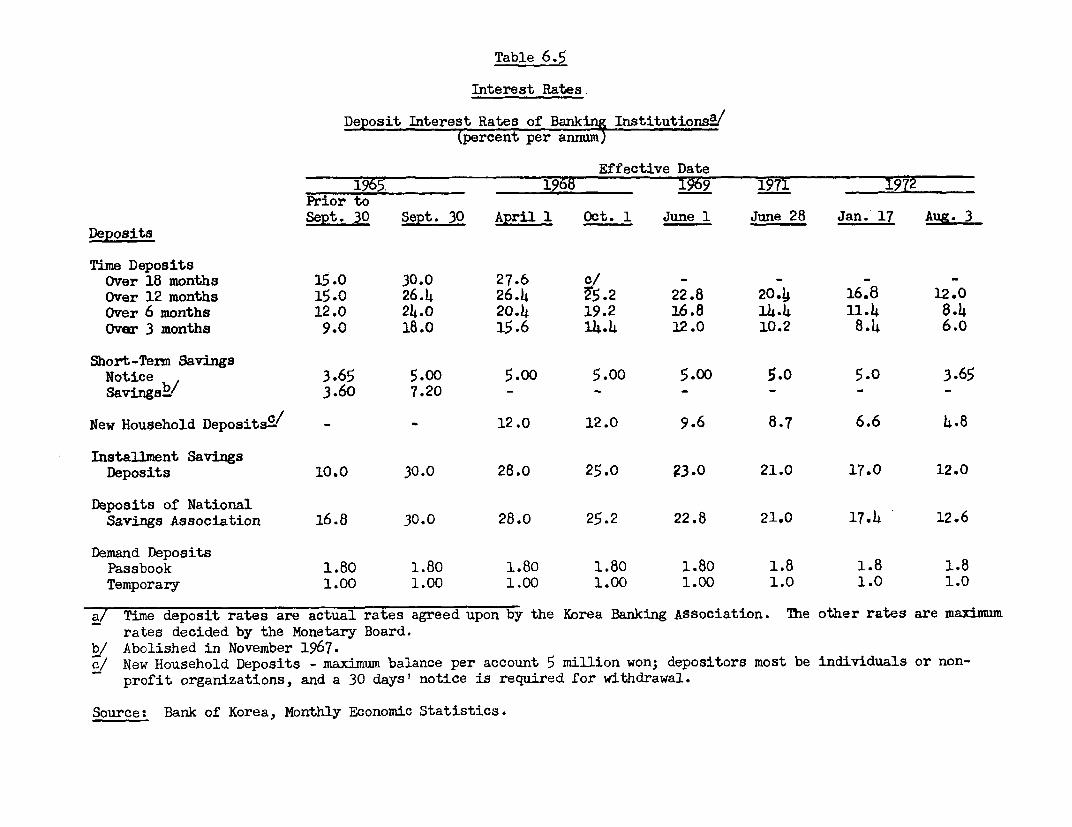
Table 6.5
Interest Rates
Deposit Interest Rates of Banking Institutions_/1
(percent per annum)
Effective Date1965 1968 1969 1971 1972
Prior toSept. 30 Sept. 30 April 1 Oct. 1 June 1 June 28 Jan. 17 Aug. 3
Deposits
Time DepositsOver 18 months 15.0 30.0 27.6 c/ - - - -Over 12 months 15.0 26.4 26.4 75.2 22.8 20.4 16.8 12.0Over 6 months 12.0 24.0 20.4 19.2 16.8 14.4 11.4 8.4Over 3 months 9.0 18.0 15.6 14.4 12.0 10.2 8.4 6.0
Short-Term SavingsNotice 3.65 5.00 5.00 5.00 5.00 5.0 5.0 3.65Savingsb/ 3.60 7.20 - - - - - -
New Household Deposits-/ - - 12.0 12.0 9.6 8.7 6.6 4.8
Installment SavingsDeposits 10.0 30.0 28.0 25.0 a3.0 21.0 17.0 12.0
Deposits of NationalSavings Association 16.8 30.0 28.0 25.2 22.8 21.0 17.4 12.6
Demand DepositsPassbook 1.80 1.80 1.80 1.80 1.80 1.8 1.8 1.8Temporary 1.00 1.00 1.00 1.00 1.00 1.0 1.0 1.0
a/ Time deposit rates are actual rates agreed upon by the Korea Banking Association. The other rates are maximmnrates decided by the Monetary Board.
b/ Abolished in November 1967.c/ New Household Deposits - maximum balance per account 5 million won; depositors most be individuals or non-
profit organizations, and a 30 days' notice is required for withdrawal.
Source: Bank of Korea, Monthly Economic Statistics.

Table 6.6
Selected Interest Rates on Loans and Discounts of Special Institutions(Percent per annum)
Sept. 30 June 29 Oct.l June 1 Aug. 3 May 211965 1967 1968 1969 1971 1972 1972 1973
National AgriculturalCooperative Federation
Banking fuinds for -/
Agriculture 15.0 15.0 15.0 15.0a/ 15.0 15.0 12.0 12.0Forestry 23.0 26.0 25.2 24.0 22.0 19.0 15.5 15.5Rice lien loans 11.0 11.0 11.0 11.0 - - - -
Government fun9 for -Agriculture fr 10.0 10.0 10.0 10.0 10.0 10.0 10.0 10.0Irrigation 3.5 3.5 3.5 3.5 3.5 3.5 3.5 3.5
Medium Industry BankBanking funds for -
Medium industry 23.0 23.0 23.021 22.0 19.0 15.5 15.5Medium industry 15.0 15.0 20.02/ 20.0 19.0 16.5 15.5
equipment /
Cooperative business 14.0 14.0 20.0-/ 20.0 17.0 15.5 15.5Government funds for -
Equipment - 12.0 12.02/ 12.0 12.0 10.0 10.0Cooperative business 12.0 12.0 12.O0/ 12.0 12.0 12.0 12.0
Citizens National BankBanking funds for -Mutual remuneration - 25.2-/ 24.8 24.0 22.0 19.0 15.5Mutual installments 20.0 20.2-Y 20.0 18.8 16.8 14.5 12.0
Government funds for -Household manufac- 16.0 16. A 16.0 18.0O/ 18.0 18.o 15.5
turingRelief - 8.SW 8.5 8.5 8.5 8.5 8.5
Korea Housing Bank-/Loans for housing -
Public - - 8.o 8.o 8.o 8.o 8.oPrivate - - 10.0 10.0 10.0 10.0 10.0
Loans for forminghousing sites -
Public - - 18.0 18.0 18.0 18.0 15.5Private - - 26.0 24.0 22.0 19.0 15.5
a/ On development loans for sericulture, drought relief and livestock, an interest rateof 9 percent is applied.
b/ Short-term funds provided from counterpart funds.
c/ As of June, 30, 1969.
d/ As of March 15, 1967
e/ Enforced from December 1, 1968
f/ Started operations in October, 1967.
Source: Bank of Korea, Monthly Economic Statistics
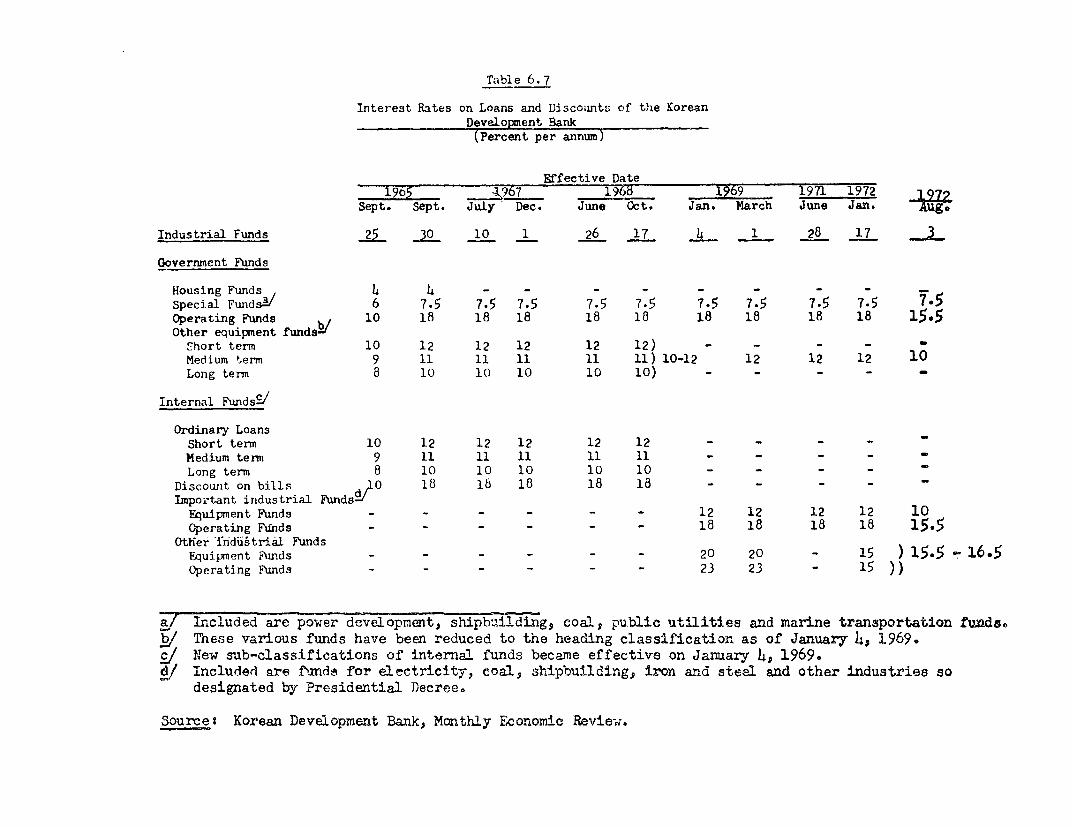
Table 6.7
Interest Rates on Loans and Discoumts of the KoreanDevelopment Bank
(Percent per annum)
Effective Date1965 _967 196b 1969 1971 1972
Sept. Sept. July Dec. June Oct. Jan. March June Jan.
Industrial Funds 25 o 10 1 26 17 1 l 28 17 2Government Funds
Housing Funds - - - - _ - - -Special Fundsj' 6 7.5 7.5 7.5 7.5 7.5 7.5 7.5 7.5 7.5Operating Funds 10 18 18 18 18 18 18 18 18 18 15.5Other equipment fundsh/
Short term 10 12 12 12 12 12) - - - - -Medium term 9 11 11 11 11 11) 10-12 12 12 12 10Long term 8 10 10 10 10 10) - - - - -
Internal Funds g
Ordinary LoansShort term 10 12 12 12 12 12 - - - -Medium term 9 11 11 11 11 11 - - - -Long term 8 10 10 10 10 10 - - - - -
Discowut on bills / 0 18 18 18 18 18 - - - - -Important industrial Funds_/
Equipment Funds - - - - - - 12 12 12 12 10Operating FUnds - - - - - - 18 18 18 18 15.5
Other Thdiitri&l FundsEquipment Funds - - - - - - 20 20 - 15 ) 15.5 16.5Operating Funds - - - - - - 23 23 - 15 ))
a/ Included are power development, shipbuilding, coals public utilities and marine transportation fuds0b/ These various funds have been reduced to the heading classification as of January 4t, 1969./ JNew sub-classifications of internal funds became effective on Jarnary 4s 1969.6/ Included are funds for electricity, coal, shipbuilding, iron and steel and other industries so
designated by ;rosidential Decree.
Source: Korean Development Bank, Mcnthly Economic Review.
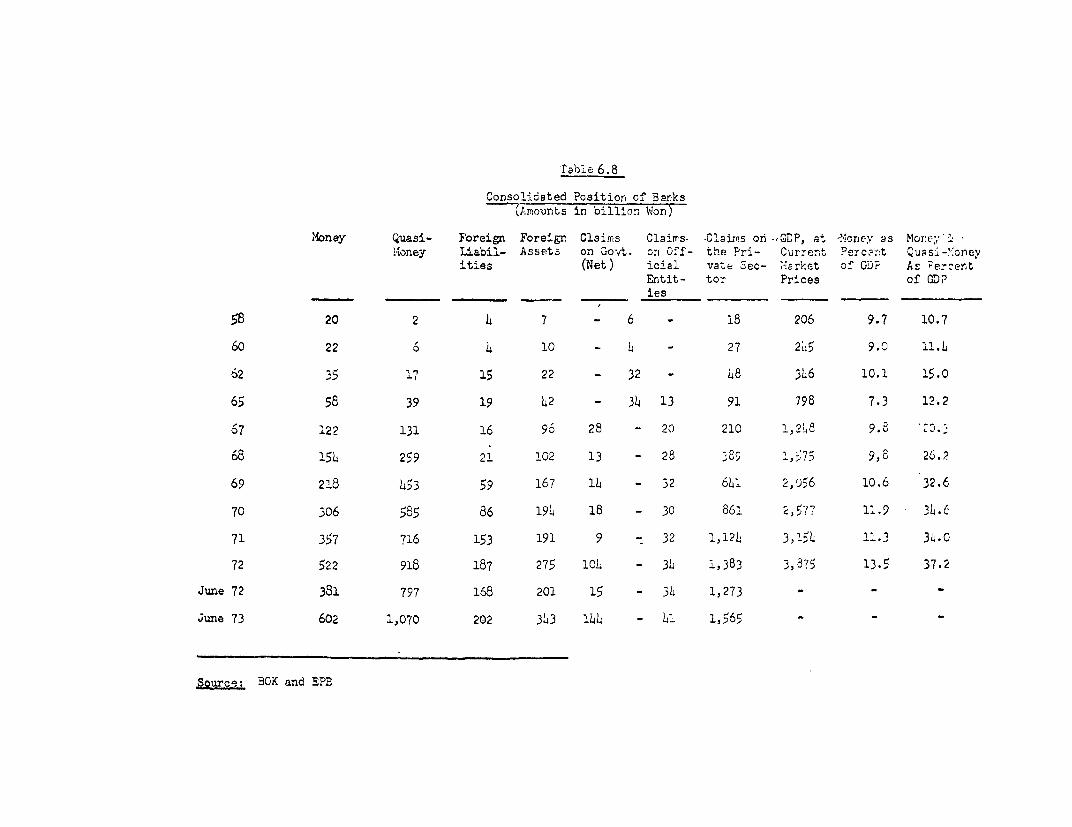
Table 6.8
Consolidated Positiorn of Barks(Amourts in billion Won)
Money Quasi- Foreig Foreign Claimss -Clairns orn -SDP, at -M4oney as Moi:t".'4oney Liabil- Assets on Govt. on Off- the Pri- Currert ?erc-.-:;t Quas -:cnev
ities (Net) icial vate Sec- Narket of GDP As ;'ercertEntit- to^ Prices of GD,ies
58 20 2 4 7 - 6 - 18 206 9.7 10.7
60 22 6 4 10 - 4 - 27 2145 9.0 1i.L
62 35 17 15 22 - 32 - 48 346 10.1 15.0
65 58 39 19 L2 - 34 13 91 798 7.3 12 .2
67 122 131 16 96 28 - 20 210 1,2148 9.2 _.3
68 154 259 21 102 13 - 28 385 , 1-75 9,8 26.2
69 218 1453 59 167 14 - 32 641 2,0,56 10.6 32.6
70 306 585 86 191 18 - 30 861 2,5?7 11.9 34.6
71 357 716 153 191 9 - 32 1,12L 3, 15L 11.3 34.C
72 522 918 187 275 104 - 314 1,383 3,875 13.5 37.2
June 72 381 797 168 201 15 - 3h 1,273 - - -
june 73 602 1,070 202 313 144 - 4i 1, 565 - -
Source: 3GK and EPB
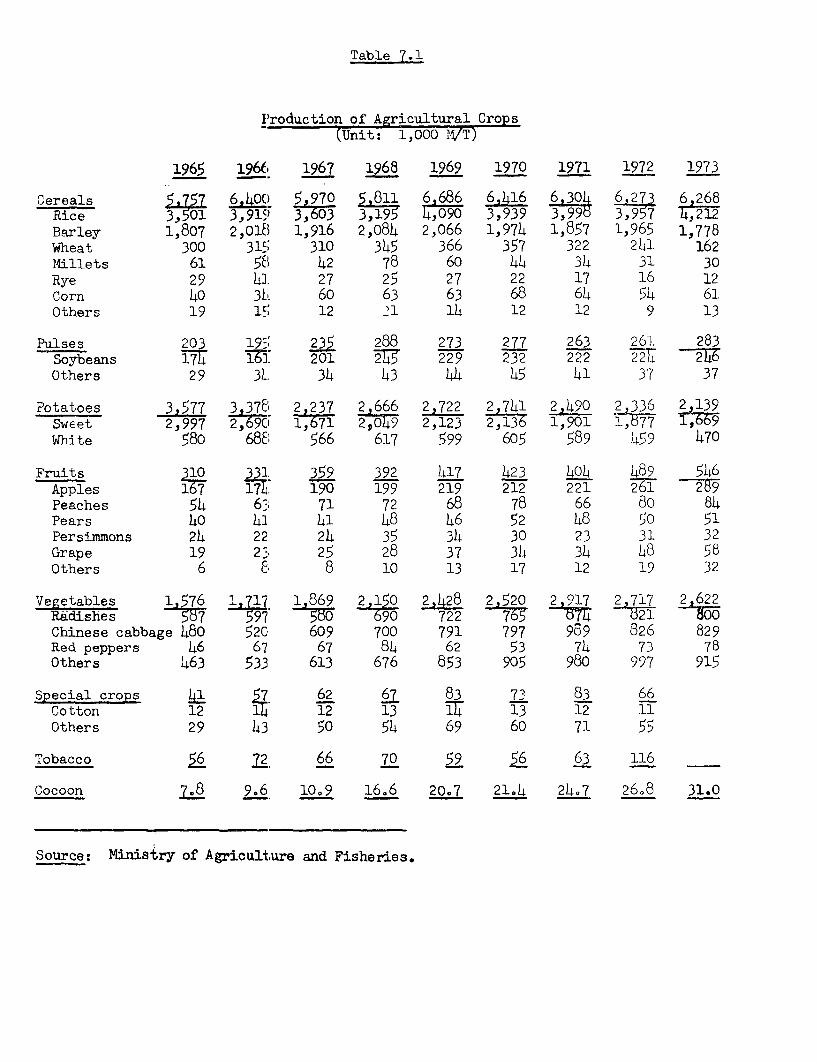
Table 7.1
IProduction of Agricultural Crops(Unit: 1,000 M/T)
1965 196& 1967 1968 1969 1970 1971 1972 1973
Cereals 5 757 6L.4O 5 970 5 811 6 686 6,416 6,304 6 '71 6 268Rice 3,301 3,919) 3 1T,9 3,939 3,9963 S Barley 1,807 2,018 1,916 2,084 2,066 1,974 1,857 1,965 1,778Wheat 300 315 310 345 366 357 322 241 162Millets 61 58 42 78 60 44 34 31 30Rye 29 hi. 27 25 27 22 17 16 12Corn 40 3I, 60 63 63 68 64 54 61Others 19 15; 12 '1 14 12 12 9 13
Pulses 203 19', 235 288 273 277 263 261 283Soybeans 174 T1i. 201 7 229 232 222 227 246Others 29 3L 34 43 44 45 41 37 37
Potatoes 35 3378 2 237 2 666 2,722 74 2,490 2 336 2 139Sweet 2,997 2, 2,123 2,13 1,901 1,1White 580 688 566 617 599 605 589 459 470
Fruits 310 33. 359 392 417 423 404 489 546Apples 167 17I 190 199 219 212 221 27 6Peaches 54 63 71 72 68 78 66 80 84Pears 40 41 h1 48 46 52 48 50 51Persimmons 24 22 24 35 34 30 23 31 32Grape 19 23 25 28 37 34 34 48 58Others 6 & 8 10 13 17 12 19 32
Vegetables 1,576 i17 1,869 2,150 2,428 2,520 2,917 2717 2622Radishes 507 597 580 690 722 765 74 21 80Chinese cabbage 480 52C 609 700 791 797 9g9 826 829Red peppers 46 67 67 84 62 53 74 73 78Others 463 533 613 676 853 905 980 997 915
Special crops 41 62 67 83 73 83 66Cotton 12 l1 12 13 T 13 12 11Others 29 43 50 54 69 60 71 55
Tobacco 5 72 66 70 59 56 63 116
Cocoon 9.6. 10.9 16.6 20.7 21.4 24h7 26.8 31.0
Source: Ministry of Agriculture and Fisheries.
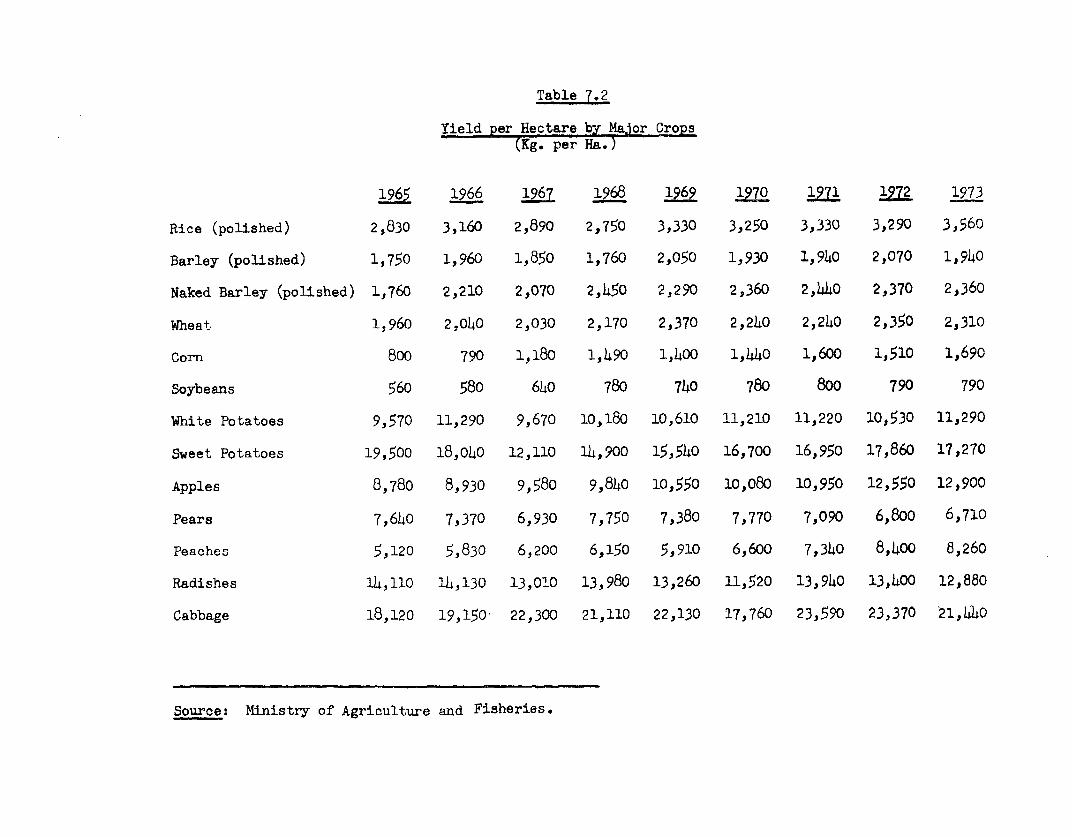
Yield per Hectare by MaJor Crops(Kg. per Ha.)
X~2~ 1966 1967 1968 1967 1973
Rice (polished) 2,830 3,160 2,890 2,750 3,330 3,250 3,330 3,290 3,560
Barley (polished) 1,750 1,960 1,850 1,760 2,050 1,930 1,940 2,070 1,940
Naked Barley (polished) 1,760 2,210 2,070 2,45o 2,290 2,360 2,440 2,370 2,360
Wheat 1,960 2,040 2,030 2,170 2,370 2.240 2,240 2,350 2,310
Corn 800 790 1,180 1,490 1,400 1,440 1,600 1,510 1,690
Soybeans 560 580 640 780 740 78o 800 790 790
White Potatoes 9,570 11,290 9,670 o.,18o 10,610 11,210 11,220 10,530 11,290
Sweet Potatoes 19,500 18,040 12,110 14,900 15,540 16,700 16,950 17,860 17,270
Apples 8,780 8,930 9,580 9,840 10,550 10,080 10,950 12,550 12,900
Pears 7,640 7,370 6,930 7,750 7,380 7,770 7,090 6,800 6,710
Peaches 5,120 5,830 6,200 6,150 5,910 6,600 7,340 8,400 8,260
Radishes 14,110 14,130 13,010 13,980 13,260 11,520 13,940 13,400 12,880
Cabbage 18,120 19,150 22,300 21,110 22,130 17,760 23,590 23,370 21,4X0
Source: Ministry of Agriculture and Fisheries.
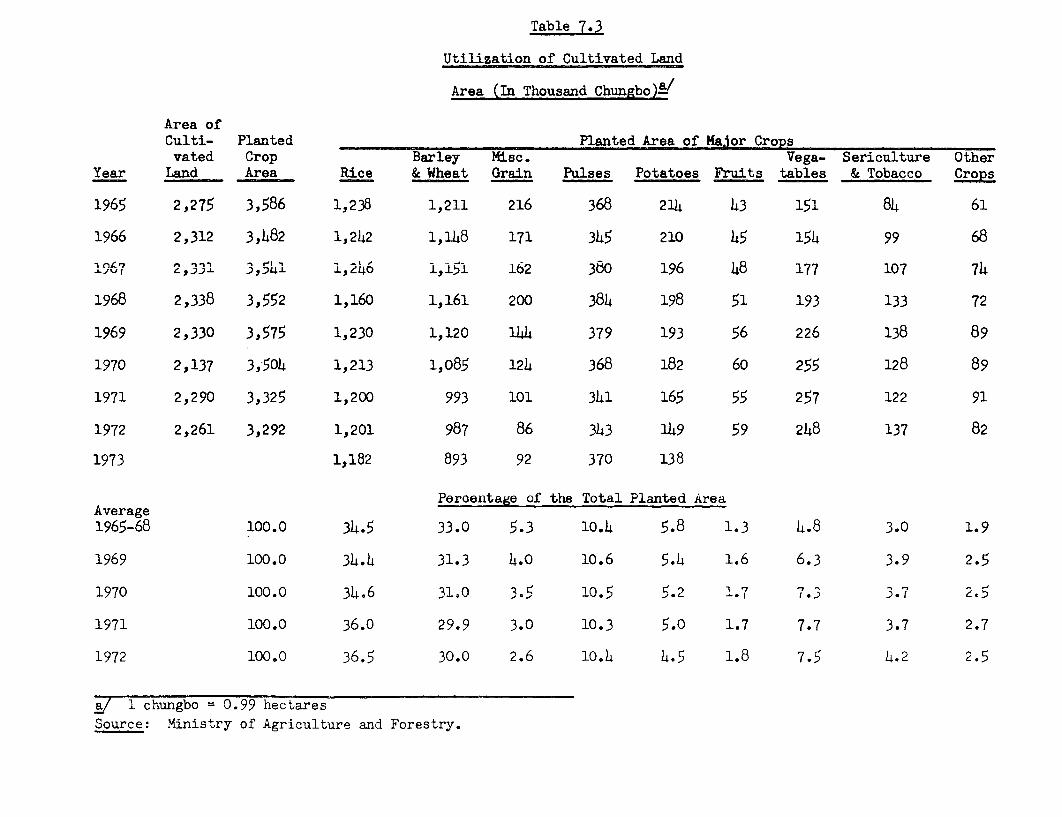
Table 7.3
Utilization of Cultivated Land
Area (In Thousand Chungbo)2'
Area ofCulti- Planted Planted Area of MaNor Cropsvated Crop Barley Misc. Vega- Sericulture Other
Year Land Area Rice & Wheat Grain Pulses Potatoes Fruits tables & Tobacco Crops
1965 2,275 3,586 1,238 1,211 216 368 214 43 151 84 61
1966 2,312 3,482 1,242 1,148 171 345 210 45 154 99 68
1967 2,,33 3,541j. l,246 1,151 L62 380 196 48 177 107 74
1968 2,338 3,552 1,160 1,161 200 384 198 51 193 133 72
1969 2,330 3,575 1,230 1,120 144 379 193 56 226 138 89
1970 2,137 3,5o4 1,213 1,085 124 368 182 60 255 128 89
1971 2,290 3,325 1,200 993 101 341 165 55 257 122 91
1972 2,261 3,292 1,201 987 86 343 149 59 248 137 82
1973 1,182 893 92 370 138
Percentage of the Total Planted AreaAverage1965-68 100.0 34.5 33.0 5.3 10.4 5.8 1.3 4.8 3.0 1.9
1969 100.0 34.4 31.3 4.0 10.6 5.4 1.6 6.3 3.9 2.5
1970 100.0 34.6 31.0 3. 5 10.5 5.2 1.7 7.3 3.7 26
1971 100.0 36.0 29.9 3.0 10.3 5.0 1.7 7.7 3.7 2.7
1972 100.0 36.5 30.0 2.6 1o.4 4.5 1.8 7.5 4.2 2.5
a/ 1 chungbo 0.99 hectares
Source: Ministry of Agriculture and Forestry.
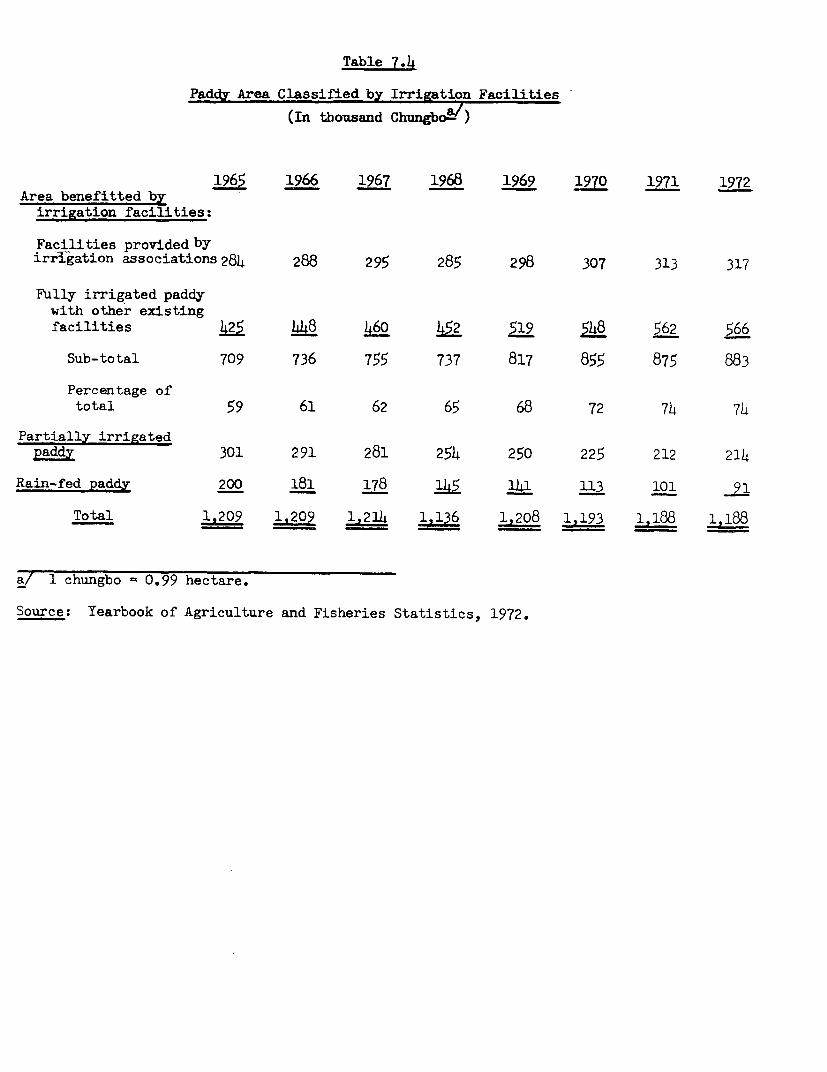
Table 7.4
Paddy Area Classified by Irrigation Facilities
(In thousand Chungbo-l)
1965 1966 1967 1968 1969 1970 1971 1972Area benefitted by
irrigation facilities:
Facilities provided byirri-gation associations 284 288 295 285 298 307 313 317
Fully irrigated paddywith other existingfacilities 425 448 460 519 X 8 562 566
Sub-total 709 736 755 737 817 855 875 883
Percentage oftotal 59 61 62 65 68 72 74 74
Partially irrigatedpaddy 301 291 281 254 250 225 212 214
Rain-fed paddy 200 181 178 145 141 113 101 91
Total 1,209 1,209 1_214 1,136 1,208 1,193 1.188 1 188
a/ 1 chungbo 0.99 hectare.
Source: Yearbook of Agriculture and Fisheries Statistics, 1972.

Table 7.5
Number of Livestock and Output of Livestock Products
1965 1966 1967 1968 1969 1970 1971 1972 1973
Number of Livestock(In thousands)
Draft cattle 1,314 1,290 1,243 1,193 1,202 1,271 1,247 1,333 1,417Dairy cows 7 9 10 14 19 23 30 36 41Beef cattle 1 1 2 3 4 3 2.9 4.8 6.3Pigs 1,382 1,457 1,296 1,396 1,339 1,121 1,333 1,248 1,334Goats 178 161 133 109 99 - - - -Sheep 1 2 2 2 3 - - -Rabbits 763 908 833 651 489 - - - _Chickens 11,893 14,008 17,079 25,968 22,651 23,477 25,903 24,537 29,073Ducks 210 233 227 319 199 - - _Turkeys 2 2 2 2 2 - - -
Output of Livestock Products
Meat (1,000 MT) 99.7 146.1 130.6 136.4 155.0 16 7.l.4 170.3 184.7 209.0
Beef 27.3 29.4 31.9 35.8 33.1 37.3 39.4 40.2 46.5Pork 55.9 95.8 72.2 61.8 76.1 82.5 80.9 90.2 103.3Poultry 14.6 18.7 24.0 35.8 42.2 45.2 50.0 54.3 59.2Other meat 1.9 2.2 2.5 3.0 3.6 2.4 - - _
Eggs (million) 856.0 1,298.0 1,349.0 1,585.0 2,430.0 2,456.0 2,536.0 2,790.0 3,079.0
Milk (1,000 MT) 10.6 14.6 19.2 23.4 35.5 51.9 65.3 79.9 103.3
Source: Livestock Bureau, Ministry of Agriculture and Fisheries.

Table 7.6
Number and Tonnage of Fishing Vessels, 1965-72
Non-Powered Powered TotalAverage Average Average
Number Tonnage Tonnage Number Tonnage Tonnage Number Tonnage Tonnage
1965 43,500 83,600 1.9 7,600 119,500 15.7 51,100 203,100 h.0
1966 44.,400 85,500 1.9 8,900 160,500 18.0 53,300 246,000 4.6
1967 46,300 83,000 1.8 11,000 179,000 16.3 57,300 262,000 4.6
1968 50,558 86,600 1.7 l1,I4j 206,362 18.0 62,002 292,962 4.7
1969 53,263 91,215 1.6 12,852 251,065 19.5 66,115 342,280 5.2
1970 54,270 90.184 1.6 14,085 268,182 19.1 68,355 358,365 5.2
1971 53,612 85,393 1.6 14,657 307,256 21.0 68,269 392,649 5.8
1972 52,938 84h,923 1.6 14,741 366,843 24.9 67,679 h51,767 6.7
Source: Office of Fisheries.
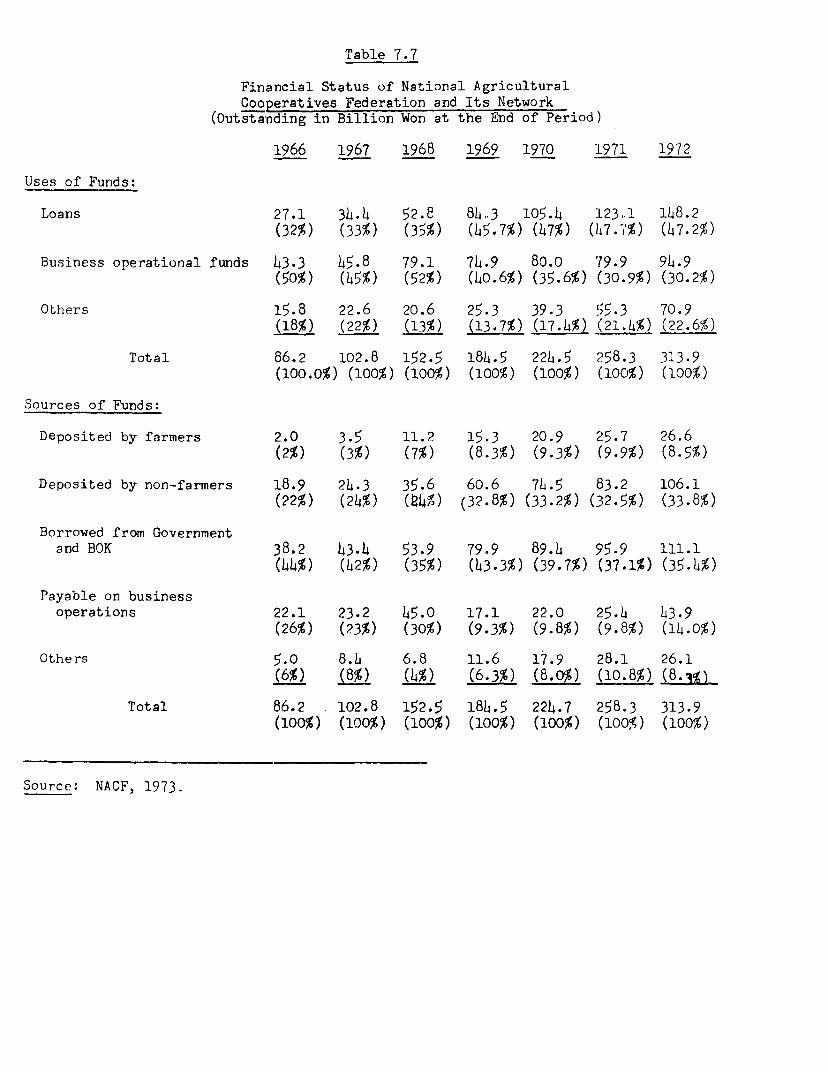
Table 7.7
Financial Status of National AgriculturalCooperatives Federation and Its Network
(Outstanding in Billion Won at the End of Period)
1966 1967 1968 1969 1970 1971 1972
Uses of Funds:
Loans 27.1 34.4 52.8 84.,3 105.4 123,.1 148.2(32%) (33%) (35%) (45.7%) (47%) (1h7.7%) (47.2%)
Business operational funds 43.3 t5.8 79.1 74.9 80.0 79.9 94.9(50%) (45%) (52%) (40.6%) (35.6%) (30.9%) (30.2%)
Others 15.8 22.6 20.6 25.3 39.3 55.3 70.9(18%) (22%) (13%) (13.7%) (17.4%) (21.4%) (22.6%)
Total 86.2 102.8 152.5 184.5 224.5 258.3 313.9(100.0%) (100%) (100%) (100%) (100%) (1OC'%) (100%)
Sources of Funds:
Deposited by farmers 2.0 3.5 11.2 15.3 20.9 25.7 26.6(2%) (3%) (7%) (8.3%) (9.3%) (9.9%) (8.5%)
Deposited by non-farmers 18.9 24.3 35.6 60.6 74.5 83.2 106.1(22%) (24%) (94t') (32.8%) (33.2%) (32.5%) (33.8%)
Borrowed from Governmentand BOK 38.2 43.4 53.9 79.9 89.4 95.9 111.1
(44%) (42%) (35%) (43.3%) (39.7%) (37.1%) (35.4%)
Payable on businessoperations 22.1 23.2 45.0 17.1 22.0 25.4 43.9
(26%) (23%) (30%) (9.3%) (9.8%) (9.8%) (14.0%)
Others 5.0 8.4 6.8 11.6 17.9 28.1 26.1(6% (8 (4%) (6.3%) (8.0%) .(10.8%) (8.AZI
Total 86.2 102.8 152.5 184.5 224.7 258.3 313.9(100%) (100%) (100%) (100%) (100%) (100%) (100%)
Source: NACF, 1973.

Table 7.8
Loans Extended by National Agriculture Cooperative Federation(In million Won)
Component Torms and Interest1967 1968 1969 1970 1971 1972 ratio rate per annum
Banking funds
Agricultural Droduction 3,018 5,841 6,865 7,580 10,956 15,896 6.5% 1 year 12%Agriculture and forestry 11,489 12,423 15,217 7,152 5,054 3,526 1.La 1 15.5Rice lien 1,589 1,068 131 - - _ - 1 -Fishery 2,136 8,843 13,824 15,838 20,088 17,324 6.9 1 9-15.5General commercial 22,931 52,167 78,741 100,284 125,303 131,401 52.5 1 15.5Special fisheries 5 - - - - - -Business loans-to cooperatives 12,193 10,569 9,653 3,149 7,115 6,756 2.7 1 9-15.5Commercial farms 1,828 5,320 4,661 10,699 8,899 8,049 3.2 1 15.5Trade financing 507 22,503 22,645 29,803 11.9 1 6Usury debt settlement - 11 1 -434 -0.2 1 12.0
Medium-term loan
Special program - 14,5884 12,321 6,983 6,584 11,812 4.7 3-13 8-9Sub-total (Banking Funds) 55,189 100,815 141,929 174,177 206,645 224,133 89.6
Government Funds
Short-and-medium-term loansAgriculture 5,433 5,439 10,289 5,282 9,195 19,238 7.7 1-15 9Fisheries - - - - -Price Stabilization fund - - 2,032 1,861 3,116 3,882 1.6 1 0-9
Long-term loansIrrigation 1,917 2,204 2,942 3,616 3,404 2,819 1.1 35 0-9Warehouse 12 - 10 - -Foreign loans -- 4,432 -268 2 5 7-40 o-8
Total of extended loans (A) 62,551 108,406 161,625 184,668 222,412 250,077 100.0
Total of outstanding loans (B) 314,377 52,811 84,413 105,360 123,068 148,245
Turnover Ratio (A/B) 1.82 2.05 1.91 1.75 1.81 1.69
Average term of loans (months) 6.6 5.8 6.3 6.8 6.6 7.1
Source: National Agriculture Cooperative Federation.
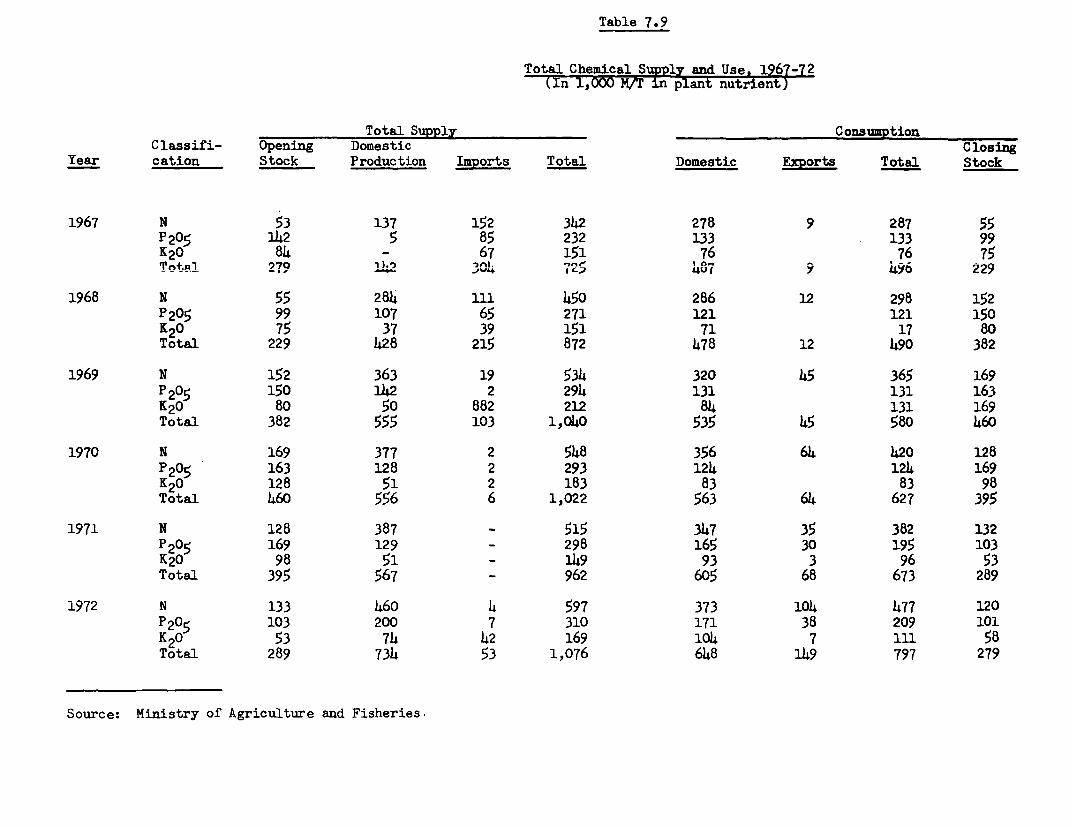
Table 7.9
Total Chemical Supply and Use, 1967-72(In 1,000 M/T plant nutrient)
Total Supply ConsumptionClassifi- Opening Domestic Closing
Year cation Stock Production Imports Total Domestic Exports Total Stock
1967 N 53 137 152 342 278 9 287 55P205 1142 5 85 232 133 133 99K20 84 - 67 151 76 76 75Tntn1 279 112 304 725 48r 9 496 229
1968 N 55 284 111 450 286 12 298 152P205 99 107 65 271 121 121 150K20 75 37 39 151 71 17 80Total 229 428 215 872 478 12 490 382
1969 N 152 363 19 534 320 45 365 169P205 150 142 2 294 131 131 163K20 80 50 882 212 84 131 169Total 382 555 103 1,040 535 45 580 460
1970 N 169 377 2 548 356 64 420 128P20s 163 128 2 293 124 124 169K 20 128 51 2 183 83 83 98
Total 460 556 6 1,022 563 64 627 395
1971 N 128 387 - 515 347 35 382 132P205 169 129 - 298 165 30 195 103K20 98 51 - 149 93 3 96 53Total 395 567 - 962 605 68 673 289
1972 N 133 460 4 597 373 104 477 120P205 103 200 7 310 171 38 209 101K20 53 74 42 169 104 7 1il 58Total 289 734 53 1,076 648 149 797 279
Source: Ministry of Agriculture and Fisheries.

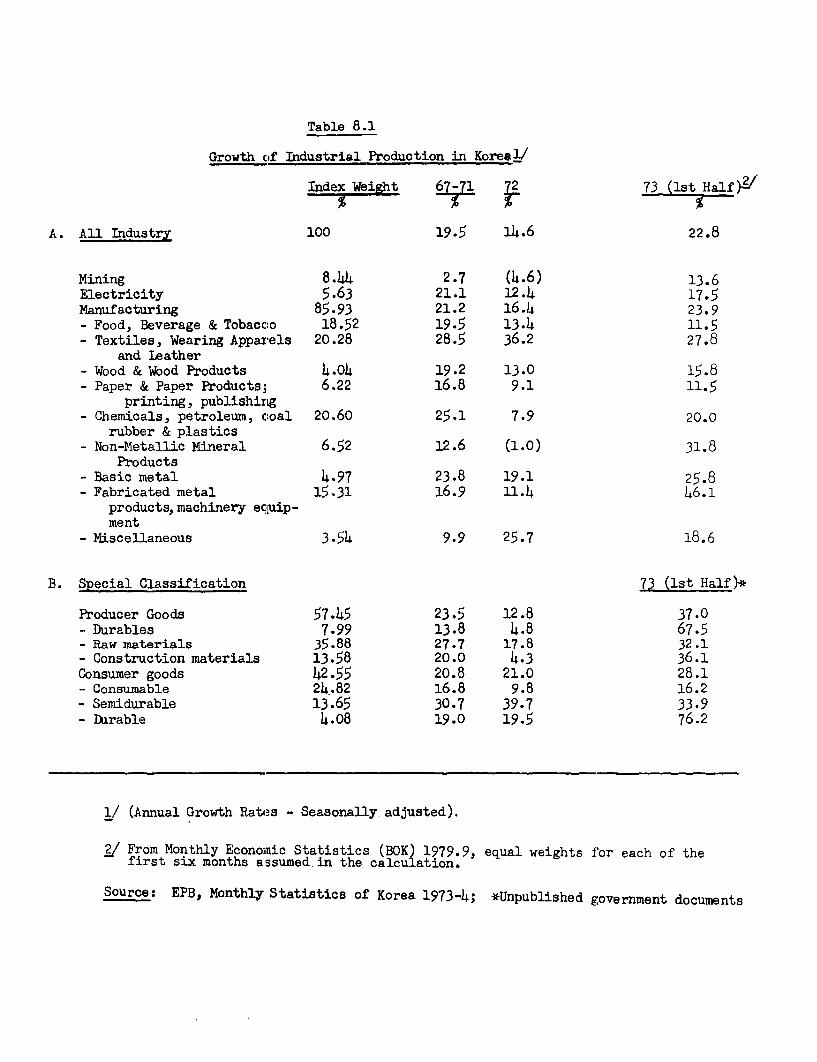
Table 8.1
Growth of Industrial Production in Kore8 /
Index Weight 67-71 f2 73 (lst Half)?/
A. All Industry 100 19.5 14.6 22.8
Mining 8.44 2.7 (4.6) 13.6Electricity 5.63 21.1 12.4 17.5Manufacturing 85.93 21.2 16.4 23.9- Food, Beverage & Tobacco 18.52 19.5 13.4 11.5- Textiles, Wearing Appar'els 20.28 28.5 36.2 27.8
and Leather- Wood & Wood Products 4.04 19.2 13.0 15.8- Paper & Paper Products; 6.22 16.8 9.1 11.5
printing, publishing- Chemicals, petroleum, coal 20.60 25.1 7.9 20.0
rubber & plastics- Non-Metallic Mineral 6.52 12.6 (1.0) 31.8
Products- Basic metal 4.97 23.8 19.1 25.8- Fabricated metal 15.31 16.9 11.4 46.1
products,machinery equip-ment
- Miscellaneous 3.54 9.9 25.7 18.6
B. Special Classification 73 (lst Half)*
Producer Goods 57.45 23.5 12.8 37.0- Durables 7.99 13.8 4.8 67.5- Raw materials 35.88 27.7 17.8 32.1- Construction materials 13.58 20.0 4.3 36.1Consumer goods 42.55 20.8 21.0 28.1- Consumable 24.82 16.8 9.8 16.2- Semidurable 13.65 30.7 39.7 33.9- Durable 4.08 19.0 19.5 76.2
1/ (Annual Growth Rates - Seasonally adjusted).
2/ From Monthly Economic Statistics (BOKt 1979.9, equal weights for each of thefirst six months assumed in the calcu ation.
Source: EPB, Monthly Statistics of Korea 1973-4; *Unpublished government documents
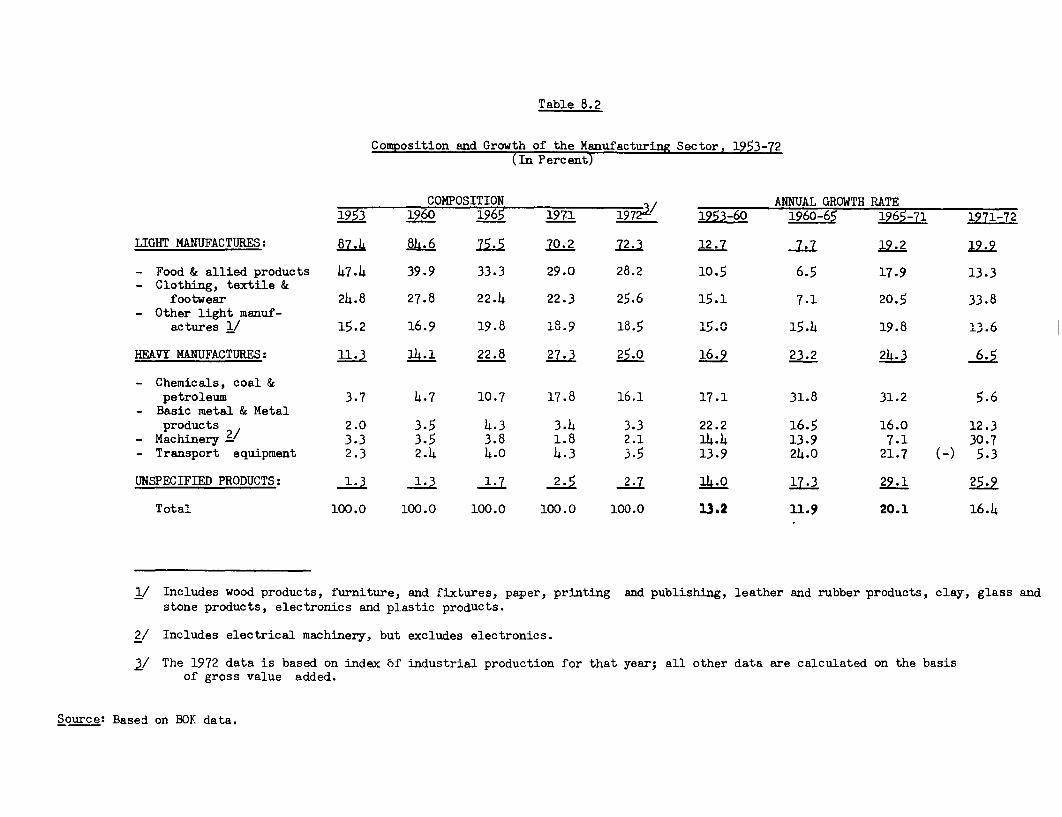
Table 8.2
Composition and Growth of the Manufacturing Sector, 1953-72(In Percent)
COMPOSITION ANNUAL GROWTH RATE1953 1960 1965 1971 1972 1953-60 1960-65 1965-71 1971-72
LIGHT MANUUFACTURES: 87.6 21.5 70.2 72 1 7 .2
- Food & allied products 47.4 39.9 33.3 29.0 28.2 10.5 6.5 17.9 13.3- Clothing, textile &
footwear 24.8 27.8 22.4 22.3 25.6 15.1 7.1 20.5 33.8- Other light manuf-
actures 1/ 15.2 16.9 19.8 18.9 18.5 15.0 15.4 19.8 13.6
HEAVY MANUFACTURES: 11.3 14.1 22.8 27.3 25.0 16.9 23.2 24.3 6.5
- Chemicals, coal &petroleum 3.7 4.7 10.7 17.8 16.1 17.1 31.8 31.2 5.6
- Basic metal & Metalproducts 2.0 3.5 4.3 3.4 3.3 22.2 16.5 16.0 12.3
- Machinery2/ 3.3 3.5 3.8 1.8 2.1 14.4 13.9 7.1 30.7- Transport equipment 2.3 2.4 4.0 4.3 3.5 13.9 24.0 21.7 (-) 5.3
UNSPECIFIED PRODUCTS: 1.3 1.3 1.7 2..j5 271. 17.3 29.1 25.9
Total 100.0 100.0 100.0 100.0 100.0 13.2 11.9 20.1 16.4
1/ Includes wood products, furniture, and fixtures, paper, printing and publishing, leather and rubber products, clay, glass andstone products, electronics and plastic products.
2/ Includes electrical machinery, but excludes electronics.
3/ The 1972 data is based on index bf industrial production for that year; all other data are calculated on the basisof gross value added.
Source: Based on BOk data.
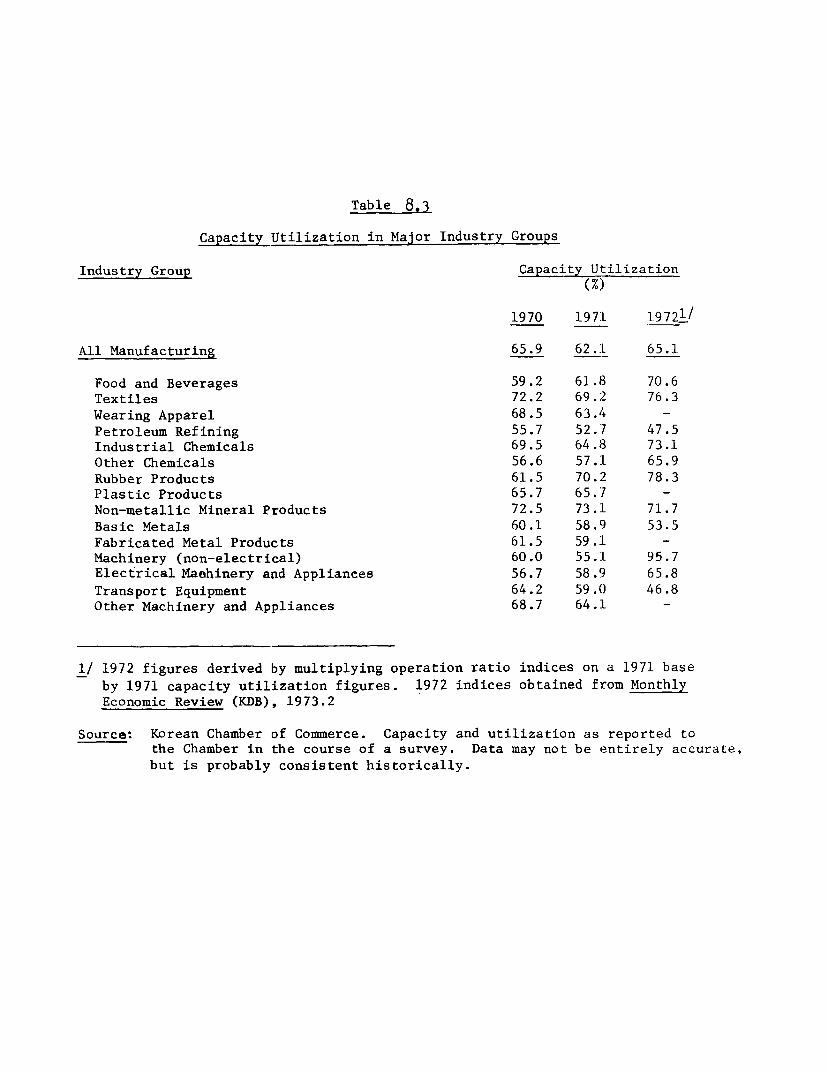
Table 8.3
Capacity Utilization in Major Industry Groups
Industry Group Capacity Utilization
(%)1970 197:L 19721/
All Manufacturing 65.9 62.1 65.1
Food and Beverages 59.2 61.8 70.6Textiles 72.2 69.2 76.3Wearing Apparel 68.5 63.4 -Petroleum Refining 55.7 52.7 47.5Industrial Chemicals 69.5 64.8 73.1Other Chemicals 56.6 57.1 65.9Rubber Products 61.5 70.2 78.3Plastic Products 65.7 65.7 -Non-metallic Mineral Products 72.5 73.1 71.7Basic Metals 60.1 58.9 53.5Fabricated Metal Products 61.5 59.1 -Machinery (non-electrical) 60.0 55.1 95.7Electrical Machinery and Appliances 56.7 58.9 65.8Transport Equipment 64.2 59.0 46.8Other Machinery and Appliances 68.7 64.1 -
1/ 1972 figures derived by multiplying operation ratio indices on a 1971 baseby 1971 capacity utilization figures. 1972 indices obtained from MonthlyEconomic Review (KDB), 1973.2
Source: Korean Chamber of Commerce. Capacity and utilization as reported tothe Chamber in the course of a survey. Data may not be entirely accurate,but is probably consistent historically.
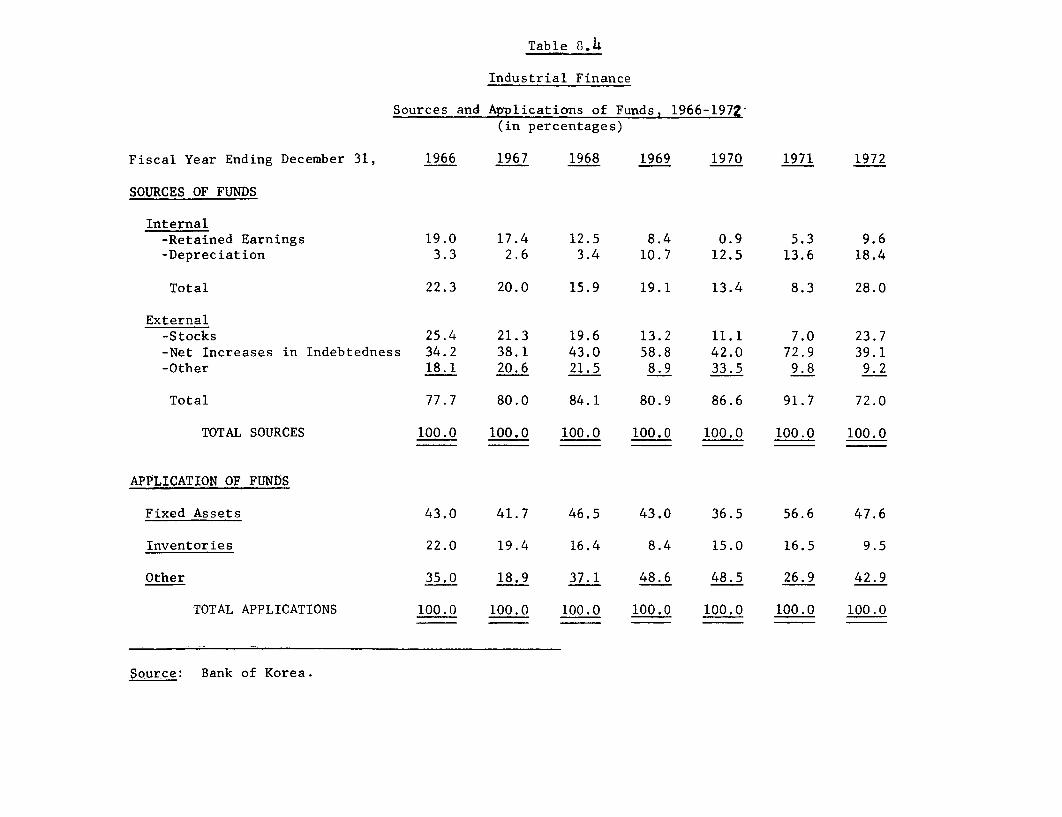
Table 8.4
Industrial Finance
Sources and Applicaticons of Funds, 1966-1972-(in percentages)
Fiscal Year Ending December 31, 1966 1967 1968 1969 1970 1971 1972
SOURCES OF FUNDS
Internal-Retained Earnings 19.0 17.4 12.5 8.4 0.9 5.3 9.6-Depreciation 3.3 2.6 3.4 10.7 12.5 13.6 18.4
Total 22.3 20.0 15.9 19.1 13.4 8.3 28.0
External-Stocks 25.4 21.3 19.6 13.2 11.1 7.0 23.7-Net Increases in Indebtedness 34.2 38.1 43.0 58.8 42.0 72.9 39.1-Other 18.1 20.6 21.5 8.9 33.5 9.8 9.2
Total 77.7 80.0 84.1 80.9 86.6 91.7 72.0
TOTAL SOURCES 100.0 100.0 100.0 100.0 100.0 100.0 100.0
APPLICATION OF FTUNtS
Fixed Assets 43.0 41.7 46.5 43.0 36.5 56.6 47.6
Inventories 22.0 19.4 16.4 8.4 15.0 16.5 9.5
Other 35.0 18.9 37.1 48.6 48.5 26.9 42.9
TOTAL APPLICATIONS 100.0 100.0 100.0 100.0 100.0 100.0 100.0
Sour,ce: Bank of Korea.
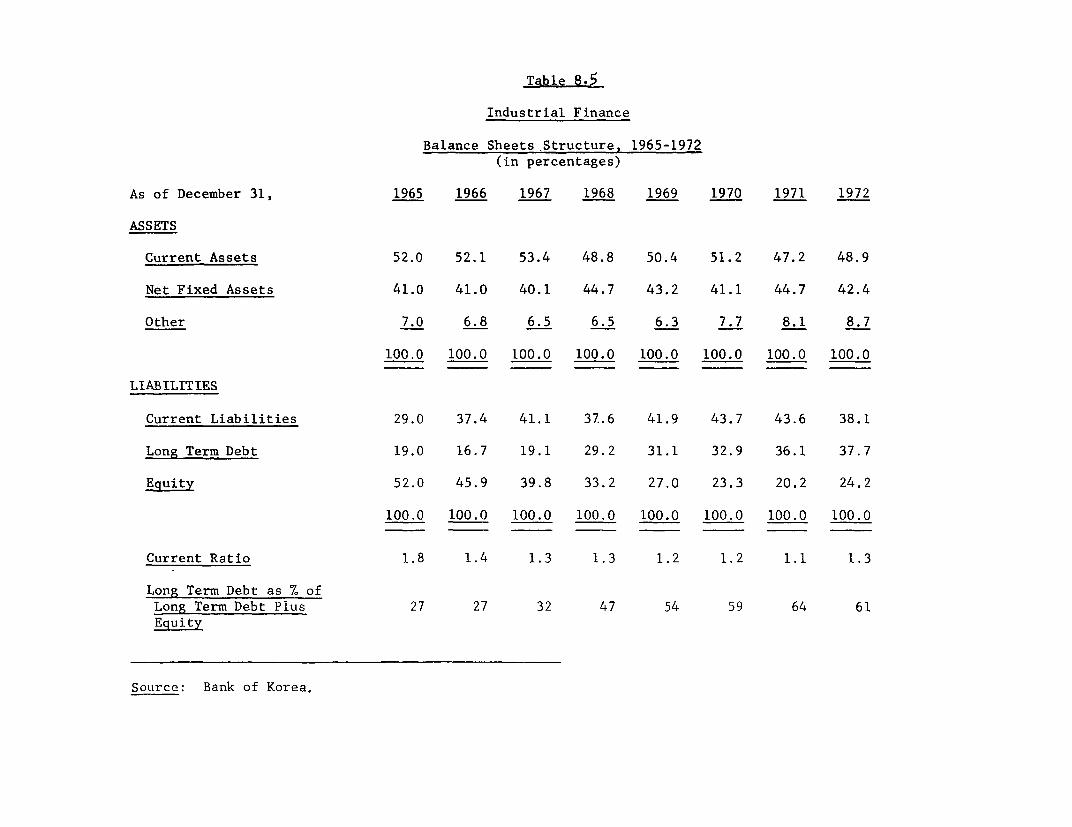
Table 8.5
Industrial Finance
Balance Sheets.Structure, 1965-1972(in percentages)
As of December 31, 1965 1966 1967 1968 1969 1970 1971 1972
ASSETS
Current Assets 52.0 52.1 53.4 48.8 50.4 51.2 47.2 48.9
Net Fixed Assets 41.0 41.0 40.1 44.7 43.2 41.1 44.7 42.4
Other 7.0 6.8 6.5 6.5 6.3 7.7 8.1 8.7
100.0 100.0 100.0 100.0 100.0 100.0 100.0 100.0
LIABILITIES
Current Liabilities 29.0 37.4 41.1 37.6 41.9 43.7 43.6 38.1
Long Term Debt 19.0 16.7 19.1 29.2 31.1 32.9 36.1 37.7
Equity 52.0 45.9 39.8 33.2 27.0 23.3 20.2 24.2
100.0 100.0 100.0 100.0 100.0 100.0 100.0 100.0
Current Ratio 1.8 1.4 1.3 1.3 1.2 1.2 1.1 1.3
Long Term Debt as % ofLong Term Debt Plus 27 27 32 47 54 59 64 61
Equity
Source: Bank of Korea,
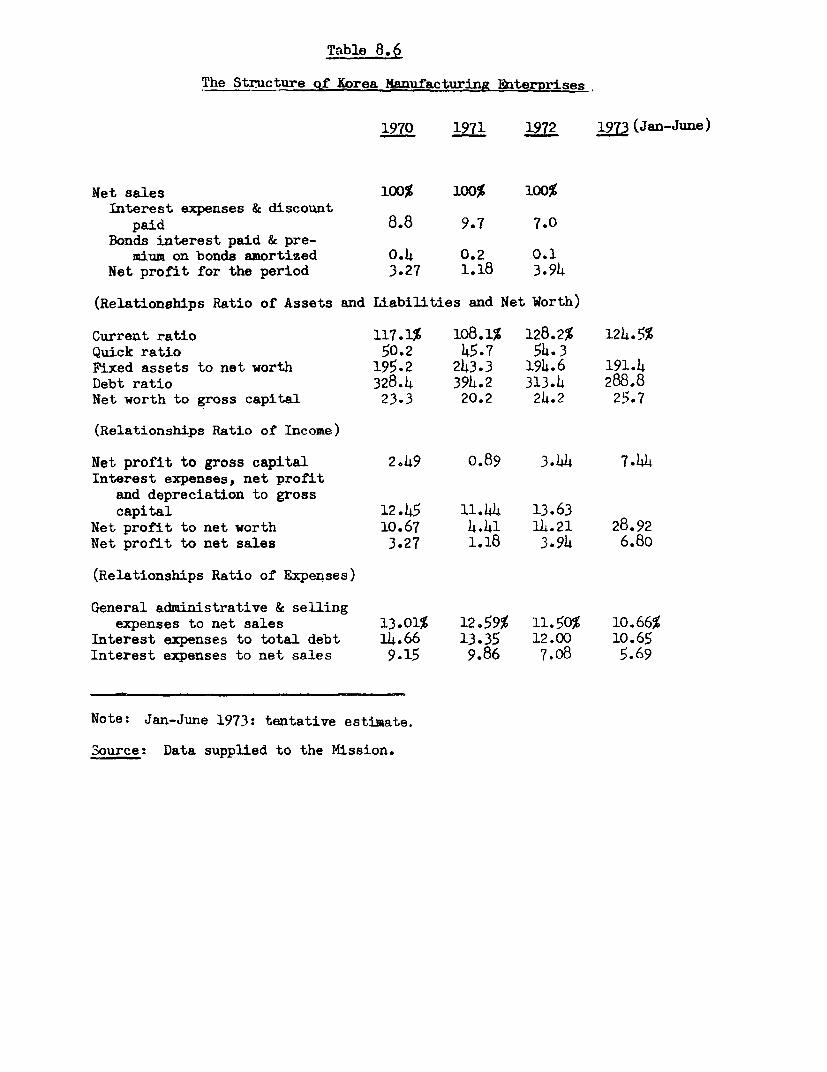
Table 8.6
The Structure o-f Koe auatrngEI rss
1970 1971 1972 1973(Jan-June)
Net sales 100% 100% 100%Interest expenses & discount
paid 8.8 9.7 7.0Bonds interest paid & pre-
mium on bonds amortized 0.4 0.2 0.1Net profit for the period 3.27 1.18 3.94
(Relationships Ratio of Assets and Liabilities and Net Worth)
Current ratio 117.1% 108.1% 128.2% 124.5%Quick ratio 50.2 45.7 54.3Fixed assets to net worth 195.2 243.3 194.6 191.4Debt ratio 328.4 394.2 313.h 288.8Net worth to gross capital 23.3 20.2 24.2 25.7
(Relationships Ratio of Income)
Net profit to gross capital 2.49 0.89 3.44 7.44Interest expenses, net profit
and depreciation to grosscapital 12 .45 11.44 13.63
Net profit to net worth 10.67 4.41 14.21 28.92Net profit to net sales 3.27 1.18 3.94 6.80
(Relationships Ratio of Expenses)
General administrative & sellingexpenses to net sales 13.01% 12059% 11.50% 10.66%
Interest expenses to total debt 14.66 13.35 12.00 10.65Interest expenses to net sales 9.15 9.86 7.o8 5.69
Note: Jan-June 1973: tentative estimate.
Source: Data supplied to the Mission.

Table 8.7
Investment by Industry Actual and Long Term Projection(At 1970 Prices)
(In billion Won)Second Five-Year Plan 72 Actual Long Term Plan
Plan (A) Actual (B) 7 6 ?- 1Ttal (73-T1Industry and Sector Amount L Amount % B/A Amount % Amount Z Amount % Amount
Total Investment 1,606.3h 100.0 3,0h4.91 100.0 88.b 685.35 100.0 4,093.00 100.0 9,364.10 100.0 13,457.10 100.0
Agriculture, Forestry andFishery 262.1h 16.3 214.85 7.0 -18.1 77.95 11.b 530.00 12.2 887.9) 9.2 1,L17.94 10.1
Agriewlture 168.L5 10.5 415.22 9.) 630.23 6.h 1,045.45 7.3
Forestry 33.60 2.1 26.07 0.6 [0.3L 0.4 66.81 0.5
Fishery 60 09 3.?7 8.31 2.2 217.37 2.4 305.68 2.3
Mining and Manufacturing 493.36 30.7 600.95 19.7 21.8 139.87 20. 1 1,39h.02 35.1 3,392.37 37.1 4,786.39 36.5
Mining 28.63 1.8 h5.2b 1.2 80.35 0.9 125.59 1.0
Manufacturing 46h.73 28.9 1,348.78 33.9 3,312.02 36.2 4,660.80 35.5
Heavy and Chemical Ind. 272.h0 17.0 974.50 24.5 2,005.20 21.9 2,979,70 22.7
Others 192.33 11.9 37h.28 9.4 1,306.82 14.3 1,681.10 12.8
Social Overhead Capital andOthers Services 850.84 53.0 2,229.11 73.3 162.0 467.53 68.2 2,168.98 52.7 5,o83.79 53.7 7,252.77 53.4
Electricity 129.06 8.0 273.22 6.9 650.23 7.1 923.h5 7.0
Communications 96.90 6.o 119.93 3.0 237.28 2.6 357.21 2.7
Transportation 2)5.79 15.3 659.75 16.6 1,035.22 15.7 2,09h.97 16.0
Public Works and other Const. 85.25 5.3 180.51 ).5 602.85 6.5 783.36 5.9
Education and Manpower Dev. 59.b4 3.7 181.80 3.3 361. L6 2.9 5)3.26 3.1
Health 14.50 0.9 33.12 0.6 59.21 0.4 92.33 0.5
liousing 122.69 7.6 86.11 10.7 891.62 9.8 1,317.73 10.0
Science and Technology 13.78 0.9 3L.b6 0.5 85.89 0. 120.35 0.L
Tourism 10.63 0.7 69.37 1.8 65.30 0.7 13).67 1.0
Others 72.80 )i.6 190.71 L.8 69).73 7.6 885.)4 6.8
Source: Data supolied to the Mission.

Table 8.8
ForeiIn Investment (1962-June 30, 1973)US$ million
A. Bl Approvals Arrivals
Enterprise No. ofSector Projects Amount Amount
Textiles and Apparel 61 126.1 57.7
Electric and Electronics 127 84.5 58.2
Oil Refining 4 33.0 32.9
Steel and Metals 50 31.7 14.6
Transport Equipment 6 27.6 25.6
Petrochemicals 62 24.0 20.3
Machinery 74 20.4 10.1
Ceramics 20 17.4 15.9
Food Processing 16 8.3 4.3
Others 142 46.5 34.5
Hotel and Tourism 9 52.2 9.3
Transportation and Storage 8 6.o 2.2
Other Services 8 27.8 12.9
Total 633 512.8 301.2
B. By Country
USA 119 169.6
Japan 476 305.3
Others 38 47.9
633 51.8
Source: EPB.
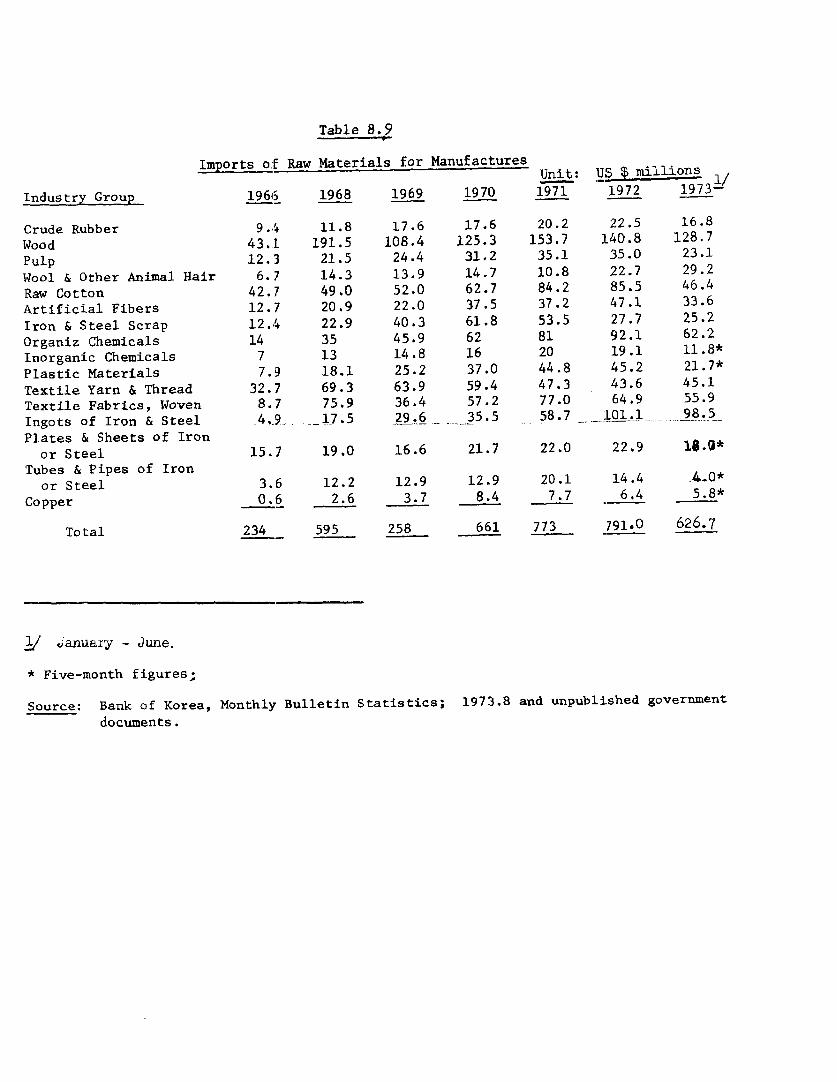
Table 8.9
Imports o:E Raw Materials for ManufacturesUnit: US $ millions Industry Group 19665 1968 1969 1970 1971 1972 1973
Crude Rubber 9.,4 11.8 17.6 17.6 20.2 22.5 16.8Wood 43.1 191.5 108.4 125.3 153.7 140.8 128.7Pulp 12.3 21.5 24.4 31.2 35.1 35.0 23.1Wool & Other Animal Hair 6.7 14.3 13.9 14.7 10.8 22.7 29.2Raw Cotton 42.7 49.0 52.0 62.7 84.2 85.5 46.4Artificial Fibers 12.7 20.9 22.0 37.5 37.2 47.1 33.6Iron & Steel Scrap 12.4 22.9 40.3 61.8 53.5 27.7 25.2Organiz Chemicals 14 35 45.9 62 81 92.1 62.2Inorganic Chemicals 7 13 14.8 16 20 19.1 11.8*Plastic Materials 7.9 18.1 25.2 37.0 44.8 45.2 21.7*Textile Yarn & Thread 32.7 69.3 63.9 59.4 47.3 43.6 45.1Textile Fabrics, Woven 8.7 75.9 36.4 57.2 77.0 64.9 55.9Ingots of Iron & Steel 4.9 _17.5 29.6 58.7 L _
Plates & Sheets of Ironor Steel 15.7 19.0 16.6 21.7 22.0 22.9 18.0*
Tubes & Pipes of Ironor Steel 3.6 12.2 12.9 12.9 20.1 14.4 .4.0*
Copper 0.6 2.6 3.7 8.4 7.7 6.4 5.8*
Total 234 595 258 661 773 791.0 626.7
2/ tanuaxy - June.
* Five-month figures;
Source: Bank of Korea, Monthly Bulletin Statistics; 1973.8 and unpublished governmentdocuments.
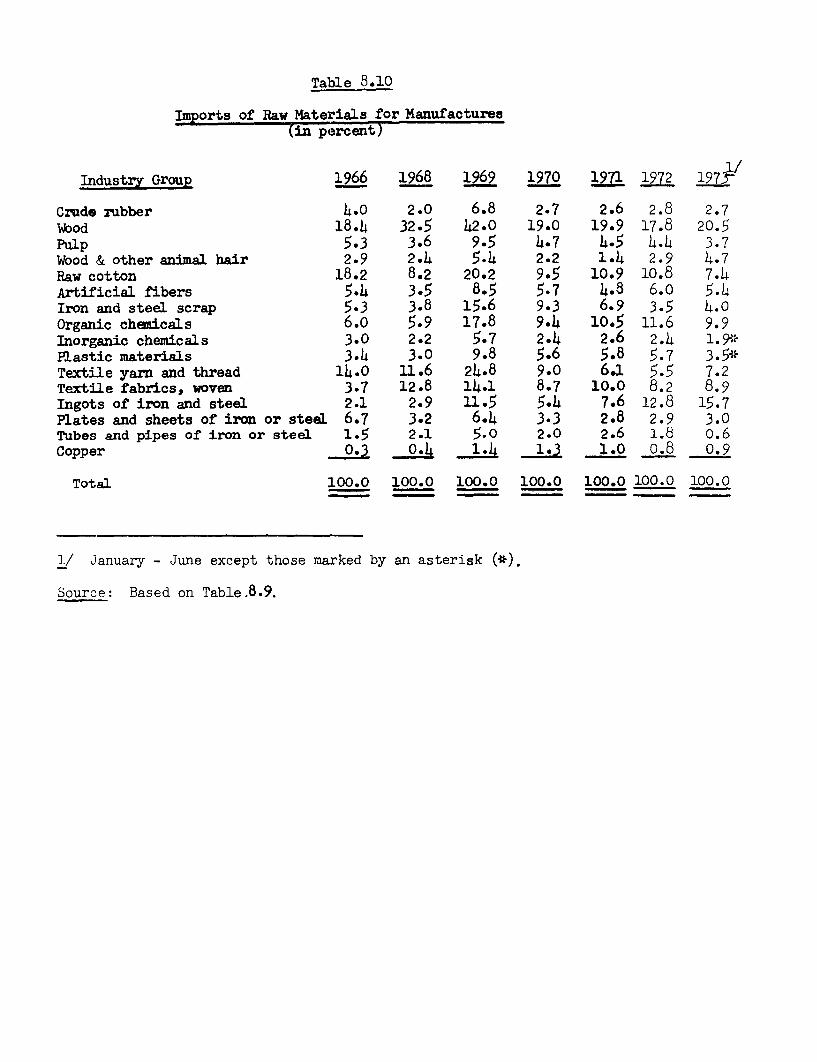
Table 8.10
Imports of Raw Materials for Manufactures(in percent)
Industry Group 1966 1968 1969 1970 1971 1972 1Lf
Crude rubber 4.0 2.0 6.8 2.7 2.6 2.8 2.7Wood 18.4 32.5 42.0 19.0 19.9 17.8 20.5Pulp 5.3 3.6 9.5 4.7 4.5 4.4 3.7Wood & other animal hair 2.9 2.4 5.4 2.2 1.4 2.9 4.7Raw cotton 18.2 8.2 20.2 9.5 10.9 10.8 7.4Artificial fibers 5.4 3.5 8.5 5.7 4.8 6.0 5.4Iron and steel scrap 5.3 3.8 15.6 9.3 6.9 3.5 4.0Organic chanicals 6.0 5.9 17.8 9.4 10.5 11.6 9.9Inorganic chemicals 3.0 2.2 5.7 2.4 2.6 2.4 1.9:*Plastic materials 3.4 3.0 9.8 5.6 5.8 5.7 3.5*Textile yarn and thread 14.0 11.6 24.8 9.0 6.1 5.5 7.2Textile fabrics, woven 3.7 12.8 14.1 8.7 10.0 8.2 8.9Ingots of iron and steel 2.1 2.9 11.5 5.4 7.6 12.8 15.7Plates and sheets of iron or steel 6.7 3.2 6.4 3.3 2.8 2.9 3.0Tubes and pipes of iron or steel 1.5 2.1 5.0 2.0 2.6 1.8 o.6Copper 0.3 0.4 1.4 1.3 1.0 o.8 0.9
Total 100.0 100.0 100.0 100.0 100.0 100.0 100.0
1/ January - June except those marked by an asterisk (*),
Source: Based on Table.8.9.
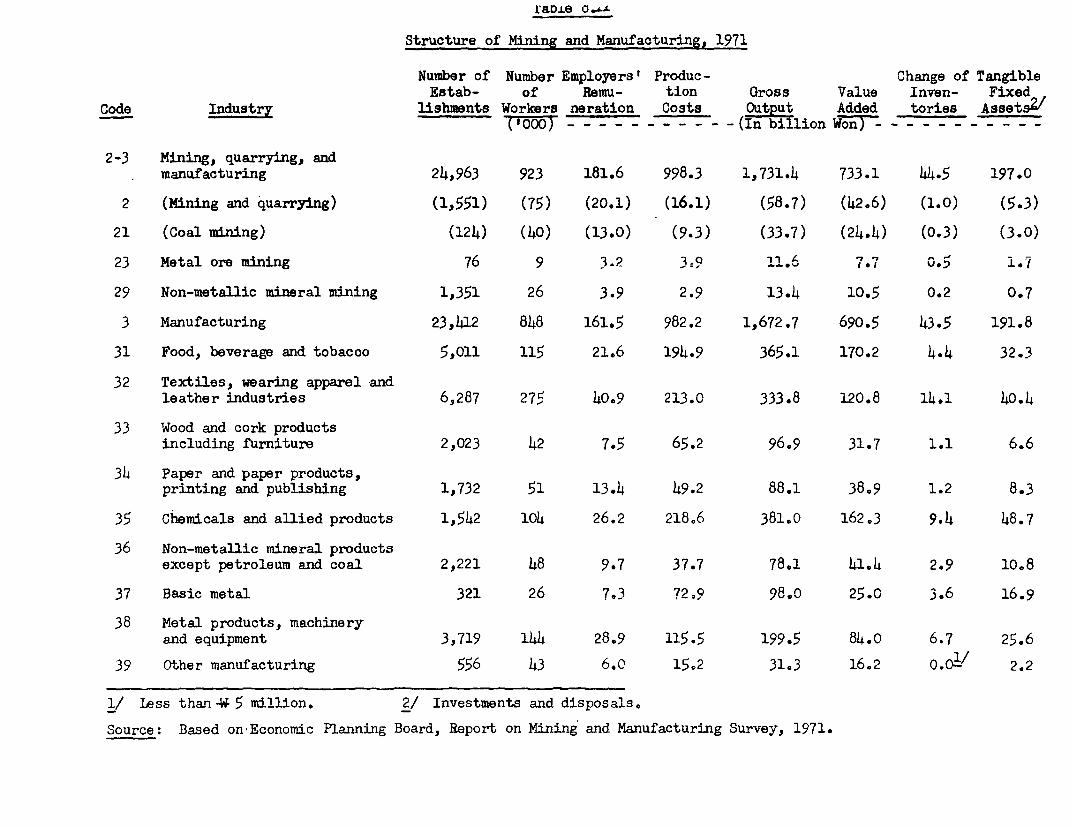
raD.Le o."
Structure of Mining and Manufacturing, 1971
Number of Number EmployersI Produc- Change of TangibleEstab- of Remu- tion Gross Value Inven- Fixed
Code Industry lishments Workers neration Costs Output Added tories Assetsm/('000) - - - - - - - - - - -(In billion Won)--
2-3 Mining, quarrying, andmanufacturing 24,963 923 181.6 998.3 1,731.4 733.1 44.5 197.0
2 (Mining and quarrying) (1,551) (75) (20.1) (16.1) (58.7) (42.6) (1.0) (5.3)
21 (Coal mining) (124) (40) (13.0) (9.3) (33.7) (24.4) (0.3) (3.0)
23 Metal ore mining 76 9 3.2 379 11.6 7. 0.5 1.7
29 Non-metallic mineral mining 1,351 26 3.9 2.9 13.4 10.5 0.2 0.7
3 Manufacturing 23,412 848 161.5 982.2 1,672.7 690.5 43.5 191.8
31 Food, beverage and tobacco 5,011 115 21.6 194.9 365.1 170.2 4.4 32.3
32 Textiles, wearing apparel andleather industries 6,287 275 40.9 213.0 333.8 120.8 14.1 40.4
33 Wood and cork productsincluding furniture 2,023 42 7.5 65.2 96.9 31.7 1.1 6.6
34 Paper and paper products,printing and publishing 1,732 51 13.4 49.2 88.1 38.9 1.2 8.3
35 Chemicals and allied products 1,542 104 26.2 218.6 381.0 162.3 9.4 48.7
36 Non-metaUic mineral productsexcept petroleum and coal 2,221 48 9.7 37.7 78.1 41.4 2.9 10.8
37 Basic metal 321 26 7.3 72.9 98.0 25.0 3.6 16.9
38 Metal products, machineryand equipment 3,719 144 28.9 115.5 199.5 84.0 6.7 25.6
39 Other manufacturing 556 43 6.0 15.2 31.3 16.2 0.oll 2.2
1/ Less than 4- 5 million. 2/ Investments and disposals.
Source: Based on Economic Planning Board, Report on Mining and Manufacturing Survey, 1971.
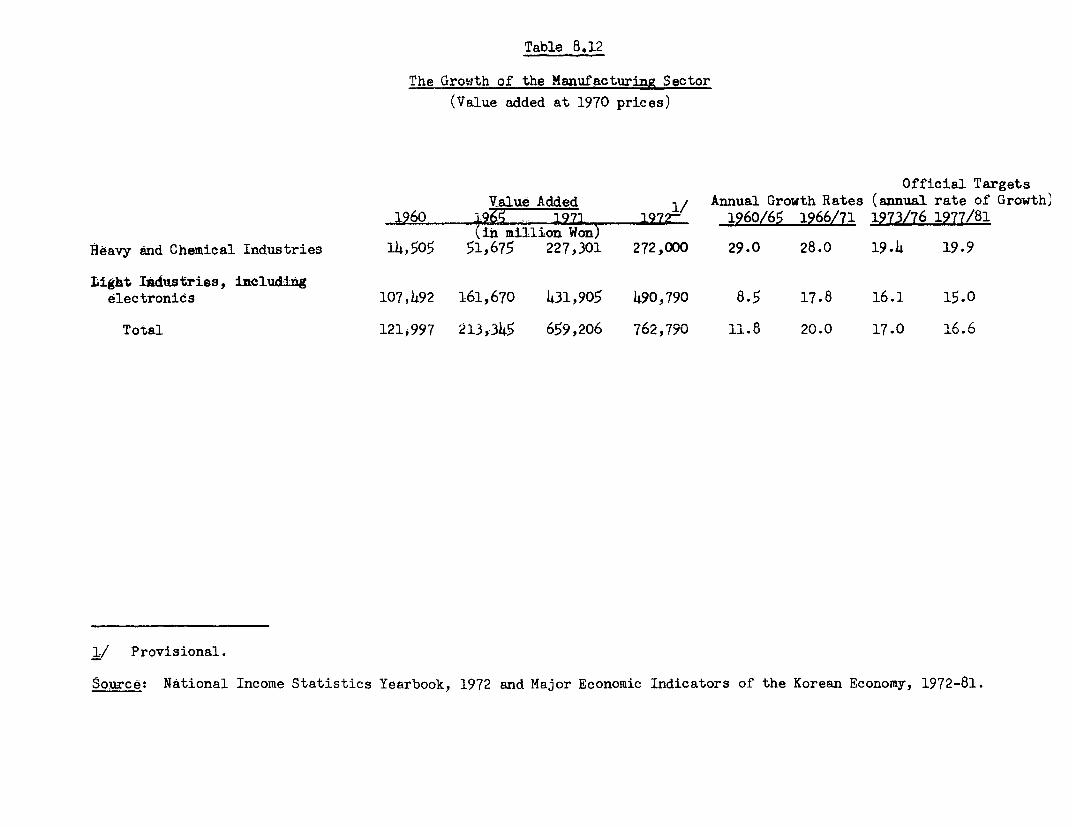
Table 8.12
The Growth of the Manufacturing Sector(Value added at 1970 prices)
Official TargetsValue Added 1/ Annual Growth Rates (annual rate of Growth)
1960 I96' , 1971 1972? , 1960/65 1966/71 1973/76 1977/81(in million Won)
Heavy and Chemical Industries 14,505 51,675 227,301 272,000 29.0 28.0 19.4 19.9
Light Iadustries, includiAgelectronics 107,h92 161,670 431,905 490,790 8.5 17.8 16.1 15.0
Total 121i997 213,345 659,206 762,790 11.8 20.0 17.0 16.6
1/ Provisional.
Source: National Income Statistics Yearbook, 1972 and Major Economic Indicators of the Korean Economy, 1972-81.
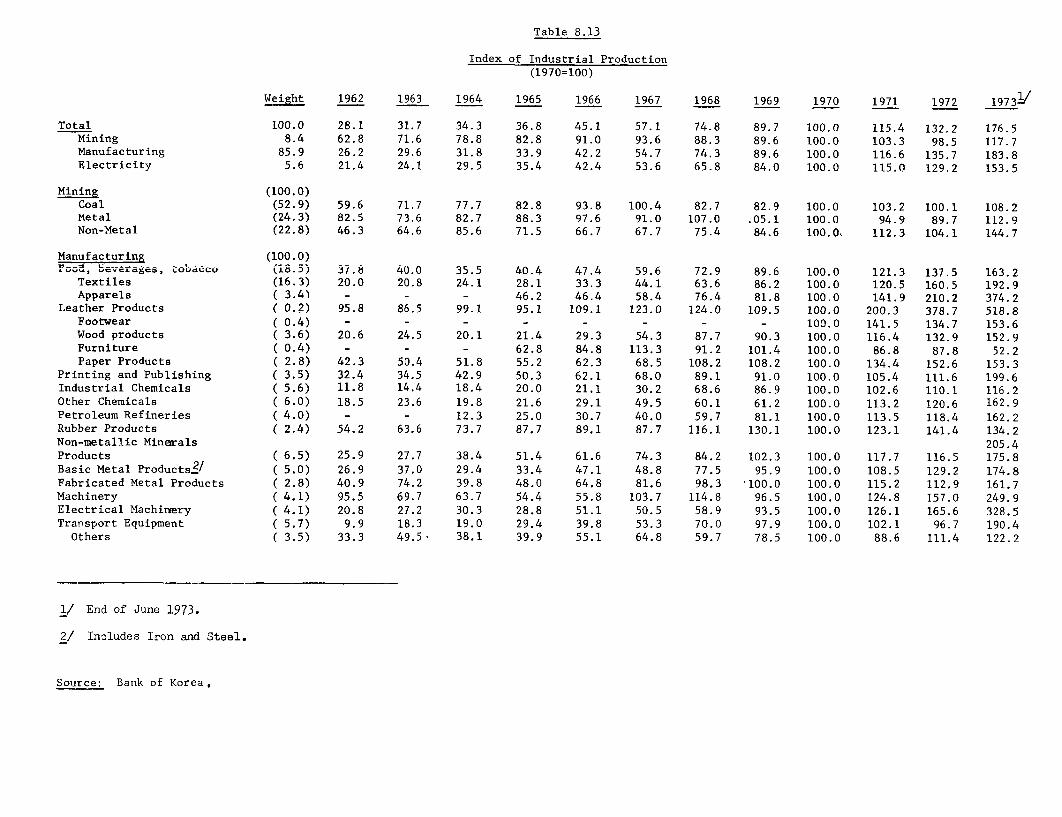
Table 8.13
Index of Industrial Production(1970=100)
Weight 1962 1963 1964 1965 1966 1967 1968 1969 1970 1971 1972 19731!
Total 100.0 28.1 31.7 34.3 36.8 45.1 57.1 74.8 89.7 100.0 115.4 132.2 176.5Mining 8.4 62.8 71.6 78.8 82.8 91.0 93.6 88.3 89.6 100.0 103.3 98.5 117.7Manufacturing 85.9 26.2 29.6 31.8 33.9 42.2 54.7 74.3 89.6 100.0 116.6 135.7 183.8Electricity 5.6 21.4 24.1 29.5 35.4 42.4 53.6 65.8 84.0 100.0 115.0 129.2 153.5
Mining (100.0)Coal (52.9) 59.6 71.7 77.7 82.8 93.8 100.4 82.7 82.9 100.0 103.2 100.1 108.2Metal (24.3) 82.5 73.6 82.7 88.3 97.6 91.0 107.0 .05.1 100.0 94.9 89.7 112.9Non-Metal (22.8) 46.3 64.6 85.6 71.5 66.7 67.7 75.4 84.6 100.01 112.3 104.1 144.7
Manufacturing (100.0)Frov, beverages, Lobacco (18.5) 37.8 40.0 35.5 40.4 47.4 59.6 72.9 89.6 100.0 121.3 137.5 163.2
Textiles (16.3) 20.0 20.8 24.1 28.1 33.3 44.1 63.6 86.2 100.0 120.5 160.5 192.9Apparels ( 3.4) - - - 46.2 46.4 58.4 76.4 81.8 100.0 141.9 210.2 374.2
Leather Products ( 0.2) 95.8 86.5 99.1 95.1 109.1 123.0 124.0 109.5 100.0 200.3 378.7 518.8Footwear ( 0.4) - - - - - - - - 100.0 141.5 134.7 153.6Wood products ( 3.6) 20.6 24.5 20.1 21.4 29.3 54.3 87.7 90.3 100.0 116.4 132.9 152.9Furniture ( 0.4) - - - 62.8 84.8 113.3 91.2 101.4 100.0 86.8 87.8 52.2Paper Products ( 2.8) 42.3 50.4 51.8 55.2 62.3 68.5 108.2 108.2 100.0 134.4 152.6 153.3
Printing and Publishing ( 3.5) 32.4 34.5 42.9 50.3 62.1 68.0 89.1 91.0 100.0 105.4 111.6 199.6Industrial Chemicals ( 5.6) 11.8 14.4 18.4 20.0 21.1 30.2 68.6 86.9 100.0 102.6 110.1 116.2Other Chemicals ( 6.0) 18.5 23.6 19.8 21.6 29.1 49.5 60.1 61.2 100.0 113.2 120.6 162.9Petroleum Refineries ( 4.0) - - 12.3 25.0 30.7 40.0 59.7 81.1 100.0 113.5 118.4 162.2Rubber Products ( 2.4) 54.2 63.6 73.7 87.7 89.1 87.7 116.1 130.1 100.0 123.1 141.4 134.2Non-metallic Minerals 205.4Products ( 6.5) 25.9 27.7 38.4 51.4 61.6 74.3 84.2 102.3 100.0 117.7 116.5 175.8Basic Metal Products2/ ( 5.0) 26.9 37.0 29.4 33.4 47.1 48.8 77.5 95.9 100.0 108.5 129.2 174.8Fabricated Metal Products ( 2.8) 40.9 74.2 39.8 48.0 64.8 81.6 98.3 '100.0 100.0 115.2 112.9 161.7Machinery ( 4.1) 95.5 69.7 63.7 54.4 55.8 103.7 114.8 96.5 100.0 124.8 157.0 249.9Electrical Machirnery ( 4.1) 20.8 27.2 30.3 28.8 51.1 50.5 58.9 93.5 100.0 126.1 165.6 328.5Transport Equipment ( 5.7) 9.9 18.3 19.0 29.4 39.8 53.3 70.0 97.9 100.0 102.1 96.7 190.4
Others ( 3.5) 33.3 49.5, 38.1 39.9 55.1 64.8 59.7 78.5 100.0 88.6 111.4 122.2
1/ End of June 1973.
2/ Includes Iron and Steel.
Source: Bank of Korea,
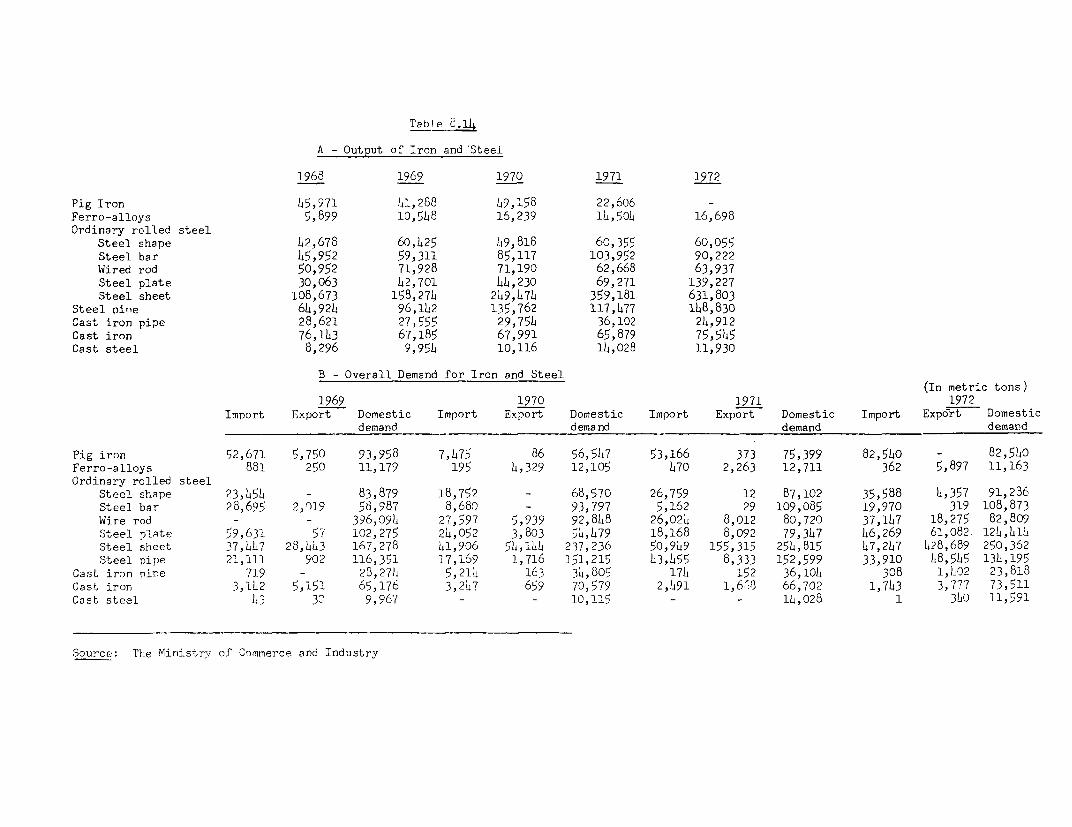
Table 8., L
A - Output of Iron and Steel
1968 1969 1970 1971 1972
Pig Iron 45,971 41,288 49,158 22,606 -Ferro-alloys 5,899 10,548 16,239 1L,504 16,698Ordinary rolled steel
Steel shape 42,678 60o425 149,818 60,355 60,055Steel bar 45,952 59,311 85,117 103,952 90,222Wired rod 50,952 71,928 71,190 62,668 63,937Steel plate 30,063 42,701 44,230 69,271 139,227Steel sheet 108,673 158,274 249,474 359,181 631,803
Steel pipe 64,924 96,142 135,762 117,477 148,830Cast iron pipe 28,621 27,555 29,754 36,102 24,912Cast iron 76,143 67,185 67,991 65,879 75,545Cast steel 8,296 9,954 10,116 14,028 11,930
B - Overall Demand for Iron and Steel(In metric tons)
1969 1970 1971 1972Import Export Domestic Import Export Domestic Import Export Domestic Import Export Domestic
demand demand demand demand
Pig iron 52,671 5,750 93,958 7,475 86 56,547 53,166 373 75,399 82,540 - 82,540Ferro-alloys 881 250 11,179 195 4,329 12,105 470 2,263 12,711 362 5,897 11,163Ordinary rolled steel
Steel shape 23,454 - 83,879 18,752 - 68,570 26,759 12 87,102 35,588 L,357 91,236Steel bar 28,695 2,019 58,987 8,680 - 93,797 5,162 29 109,085 19,970 319 108,873Wire rod - - 396,094 27,597 5,939 92,848 26,024 8,012 80,720 37,147 18,275 82,809Steel nlnte 59,631 57 102,275 24,052 3,803 5,0479 18,168 8,092 79,3)7 46,269 61,082. 1214,)41)4Steel sheet 37,12:7 28,443 167,278 )1,906 54,144 237,236 50,9)9 155,315 254,815 47,247 428,689 250,362Steel pipe 21,111 902 116,351 17,169 1,716 151,215 43,455 8,333 152,599 33,910 48,545 134,195
Cast iron pine 719 - 28,274 5,21)4 163 3)4,805 174 152 36,104 308 1,1402 23,818Cast iron 3,142 5,151 65,176 3,247 659 70,579 2,1491 1,6.8 66,702 1,743 3,777 73,511Cast steel 43 30 9,967 - - 10,115 - - 14,028 1 3)0 11,591
Source: The Ministry of Commerce and Industry
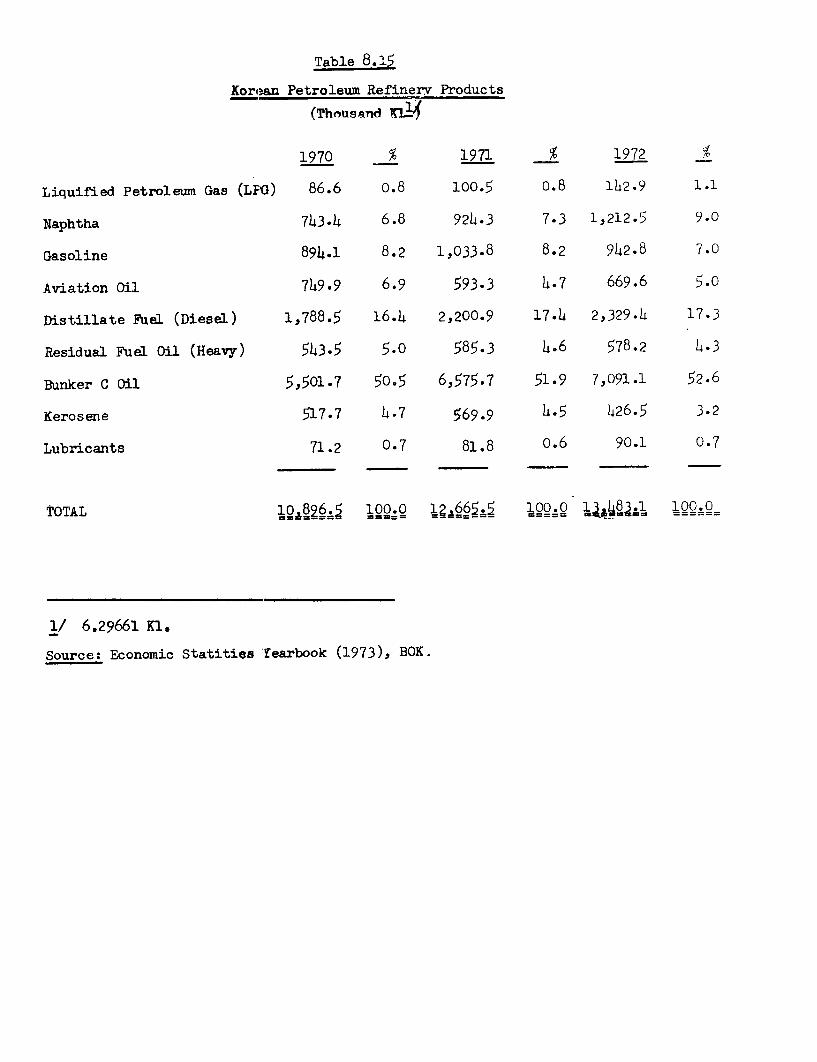
Table 8.15
Korean Petroleum Refinerv Products
(Thousand i4
1970 % 1971 % 1972 %
Liquified Petroleum Gas (LEG) 86.6 o.8 100.5 o.8 142.9 1.1
Naphtha 7h3.4 6.8 924.3 7.3 1,212.5 9.0
Gasoline 8941. 8.2 1,033.8 8.2 942.8 7.0
Aviation Oil 749.9 6.9 593.3 4.7 669.6 5.0
Distillate Fuel (Diesel) 1,788.5 16.4 2,200.9 17.4 2,329.4 17.3
Residual Fuel Oil (Heavy) 543.5 5.0 585.3 4.6 578.2 4.3
Bunker C Oil 5,501.7 50.5 6,575.7 51.9 7,091.1 52.6
Kerosene 517.7 4.7 569.9 4.5 426.5 3.2
Lubricants 71.2 0.7 81.8 o.6 90.1 0.7
TOTAL 10A826.a $ l. 1 665 1=000 ==10 0=.0=
1/ 6.29661 Kn.
Source: Economic Statities Yearbook (1973), BOK.
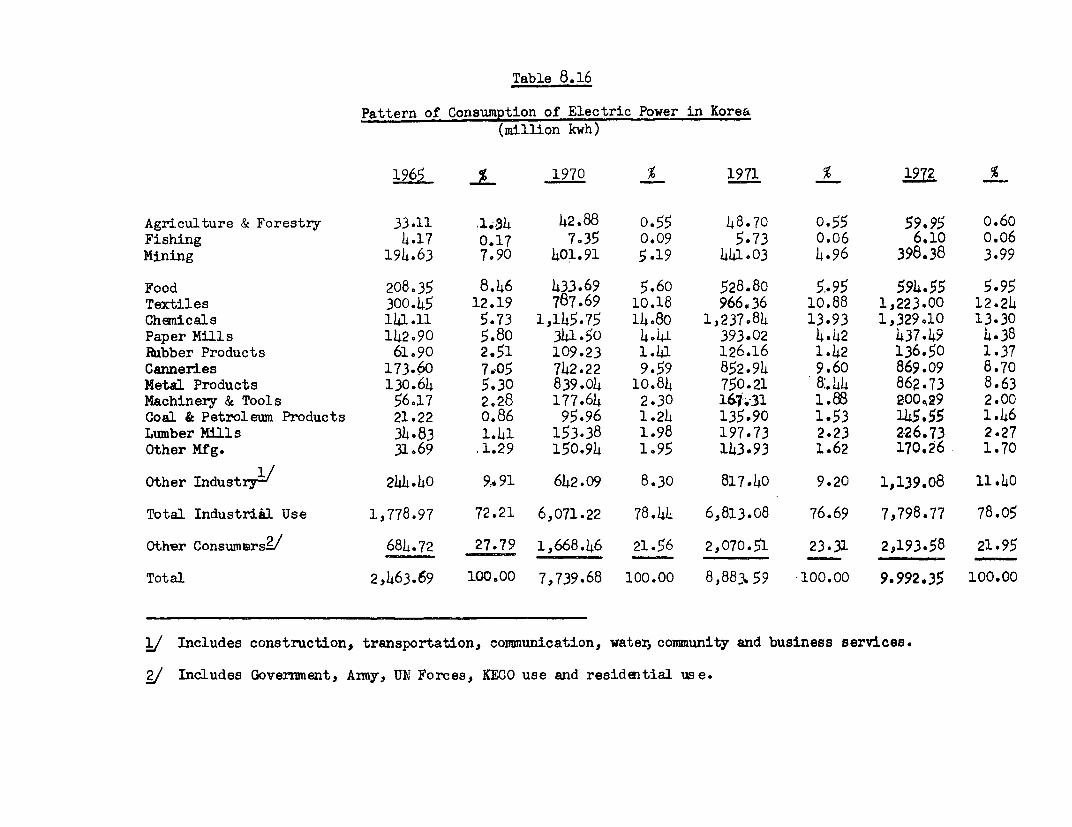
Table 8.16
Pattern of Consumption of Electric Power in Korea(million kwh)
1965 % 1970 % 1971 % 1972 %
Agriculture & Forestry 33.11 1.34 42.88 o.55 48.70 0.55 59.95 o.60Fishing 4.17 0.17 7.35 0.09 5.73 0.06 6.10 0.06Mining 194.63 7.90 401.91 5.19 441.03 4.96 398.38 3.99
Food 208.35 8.46 433.69 5.60 528.80 5.95 594.55 5.95Textiles 300.45 12.19 787.69 10.18 966.36 10.88 1,223.00 12.24Chenicals 141.11 5.73 1.,145.75 14.80 1,237.84 13.93 1,329.10 13.30Paper Mills 142.90 5.80 341.50 4,41 393.02 4.42 437.49 4.38IRabber Products 61.90 2.51 109.23 1.41 126.16 1.42 136.50 1.37Canneries 173.60 7.05 742.22 9.59 852.94 9.60 869.09 8.70Metal Products 130.64 5.30 839.04 10.84 750.21 8P44 862.73 8.63Machinery & Tools 56.17 2.28 177.64 2.30 16.-31 1.88 200O29 2.00Coal & Petroleum Products 21.22 0.86 95.96 1.24 135.90 1.53 145.55 1.46Lumber Mills 34.83 1.41 153.38 1.98 197.73 2.23 226.73 2.27Other Mfg. 31.69 .1.29 150.94 1.95 143.93 1.62 170.26 1.70
Other Industz' 1/ 244.40 9.b91 642.09 8.30 817.40 9.20 1,139.08 11.40
Total IndustriAl Use 1,778.97 72.21 6,071.22 78.44 6,813.08 76.69 7,798.77 78.05
Other Consumers?/ 684.72 27.79 1,668.46 21.56 2,070.51 23.31 2,193.58 21.95- - . . . . . ._ _ - - . -_
Total 2,463.69 100.00 7,739.68 100.00 8,883.59 100.00 9.992.35 100.00
vJ Includes construction, transportation, communication, water, community and business services.
2/ Includes Government, Army, UN Forces, KECO use and residential use.

Table 9.1
Changes in Price Deflators(In percent)
Annual Increases in Deflators Relating To:Consumption Expenditures:
GDP GDFCF Government Private
1954 31.5 38.2 84.0 29.51955 64.0 69.1 43.5 63.31956 31.7 25.8 31.8 34.91957 20.4 15.0 54.0 13.21958 -0.5 3.5 19.4 -1.51959 3.1 8.4 18.8 1.01960 9.0 6.2 13.7 12.21961 14.7 19.7 13.4 17.31962 14.0 11.3 21.2 12.01963 28.8 11.2 5.7 32.21964 32.2 29.3 14.7 36.61965 8.2 16.2 16.4 6.71966 13.9 16.2 24.8 12.81967 14.2 7.3 15.9 12.41968 11.9 8.5 20.1 10.31969 13.4 4.7 15.8 12.51970 15.5 15.6 18.6 14.21971 11.5 7.2 14.1 11.51972 14.5 10.4 18.0 16.2
Annual Averages
1954-57 36.90 37.03 53.33 35.231958-62 8.06 9.82 17.30 8.201963-67 19.46 16.04 15.50 20.141968-72 13.36 9.28 17032 12.94
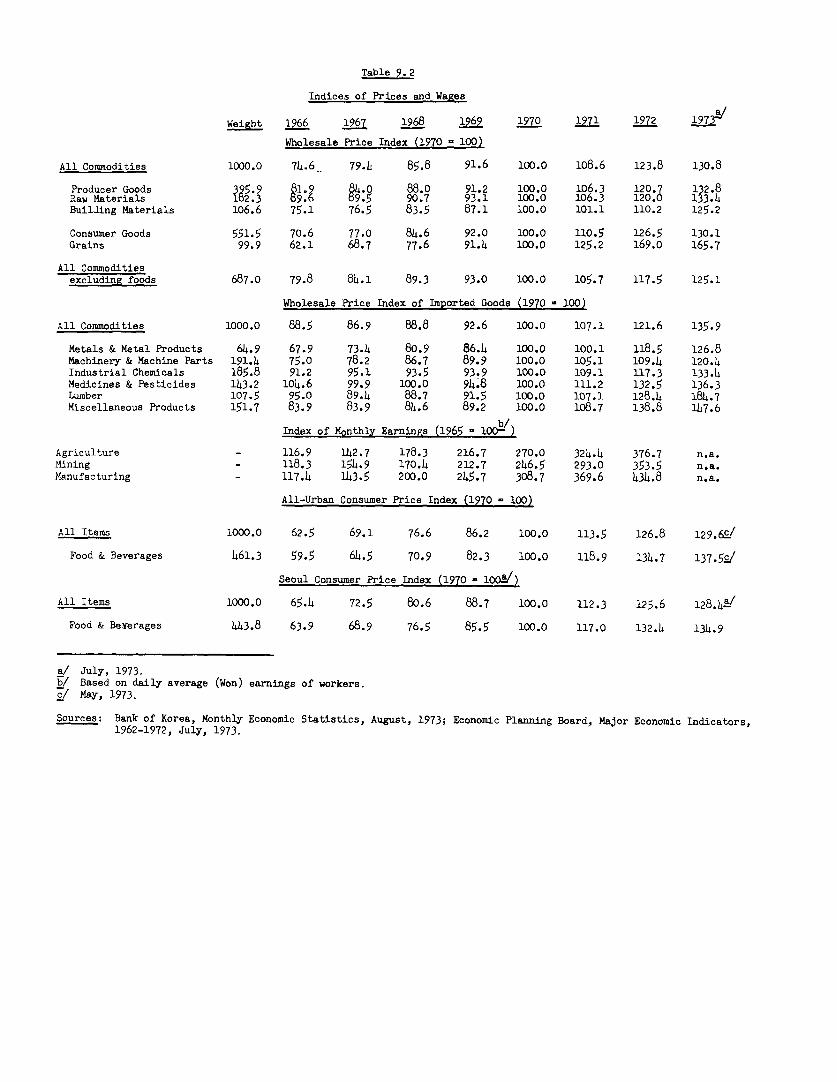
Table 9.2
Indices of Prices and Wages
Weight 1966 1967 1968 1969 1970 1971 1972 1
Wholesale Price Index (1970 - 100)
All Commodities 1000.0 74.6 79-4 85.8 91.6 100.0 108.6 123.8 130.8
Producer Goods 395.9 81.9 84o 0 88.0 91.2 100.0 106:3 120 132.8
.Raw Materials 1b2 3 89.6 89 5 90.7 93.1 100.0 106.3 120 0 133-4
Building Materials 106.6 75.1 76.5 83.5 87.1 100.0 101.1 110.2 125.2
Consumer Goods 551.5 70.6 77.0 84.6 92.0 100.0 110.5 126.5 130.1
Grains 99.9 62.1 68.7 77.6 91.4 100.0 125.2 169.0 165.7
All Commoditiesexcluding foods 687.0 79.8 84.1 89.3 93.0 100.0 105.7 117.5 125.1
Wholesale Price Index of Imported Goods (1970 a 100)
All Commodities 1000.0 88.5 86.9 88.8 92.6 100.0 107.1 121.6 135.9
Metals & Metal Products 64.9 67.9 73.4 80.9 86.4 100.0 100.1 118.5 126.8
Machinery & Machine Parts 191.4 75.0 78.2 86.7 89.9 100.0 105.1 109.4 120.4
Industrial Chemicals 185.8 91.2 95.1 93.5 93.9 100.0 109.1 117.3 133.4
Medicines & Pesticides 143.2 104.6 99.9 100.0 94.8 100.0 111.2 132.5 136.3
Lumber 107.5 95.0 89.4 88.7 91.5 100.0 107.1 128.4 184.7
Miscellaneous Products 151.7 83.9 83.9 84.6 89.2 100.0 108.7 138.8 147.6
Index of Monthly Earnings (1965 t 100-)
Agriculture - 116.9 142.7 178.3 216.7 270.0 324.4 376.7 n.a.
Mining - 118.3 154.9 170.4 212.7 246.5 293.0 353.5 n.a.
Manufacturing - 117.4 143.5 200.0 245.7 308.7 369.6 434.8 n.a.
All-Urban Consumer Price Index (1970 - 100)
All Items 1000.0 62.5 69.1 76.6 86.2 100.0 113.5 126.8 129.6-/
Food & Beverages 461.3 59.5 64.5 70.9 82.3 100.0 118.9 134.7 137.52/
Seoul Consumer Price Index (1970 - l00-/)
All Items 1000.0 65.4 72.5 80.6 88.7 100.0 112.3 125.6 128.4W/
Food & BeYerages 443.8 63.9 68.9 76.5 85.5 100.0 117.0 132.4 134.9
a/ July, 1973.b/ Based on daily average (Won) earnings of workers.
c/ May, 1973.
Sources: Bank of Korea, Monthly Economic Statistics, August, 1973; Economic Planning Board, Major Economic Indicators,
1962-1972, July, 1973,

Table 9.3
Price Adjustment, 1972-73
Item Unit Price Procurement Increase Price contri- Remarkbefore price rate (%) butiorL rateContIrol (%) 1/
Wheat Flour 22 Kg 884wo,n 1 1 3 0Won 27.8 0.56 72.12.3Ferro M/R 43,500 58,6 0 0 34.9 0.36 73.3.25
it 58 600 82 goo 39.9 0.55 73.7.11Feeding-stuff Kg 4O0i 508y 26.9 0.19 2.26
50C 56 13.3 0.11 7.11Wood in therough and re-constitutedwood 30-40 0.44 3.13Kraft Paper M/T 92,000 105,000 41.1 0.03 1.1
105,000 1144,000 37.1 0.09 8.8Electrolyticcopper " 570,000 630,000 10.5 O.OL 14.1
it 630,000 780,000 23.8 o.o8 7.25Other Forgeproducts 10-30 0.L9 4.15
Ramen 8o ~~~~ ~ ~~~~~~6-25 0.52 8.15Ramen Package 195° 21- 11.8 0.10 7.11Soap Each 33 44 33.3 O.s7 '?.1Oil Seeds Drum 55,000 60,100 9.3 0.02 7.11Petroleumproducts 13.0 0.87 8.8New Print M/T 87,000 102,000 17.14 0.09 8.8Printingpaper "I 135,000 186,ooo 37.8 0.11 8.8Board paper " 102,000 123,000 20.5 0.05 8.8Viscoserayon yarn Lb 3514- 1 14705° 32.7 0.011 8.8
Total 4.81
1/ Period covers August, 1972 to August, 1973. Data indicate contributionto changes in the wholesale price index.
Source: Data supplied to the Mission.
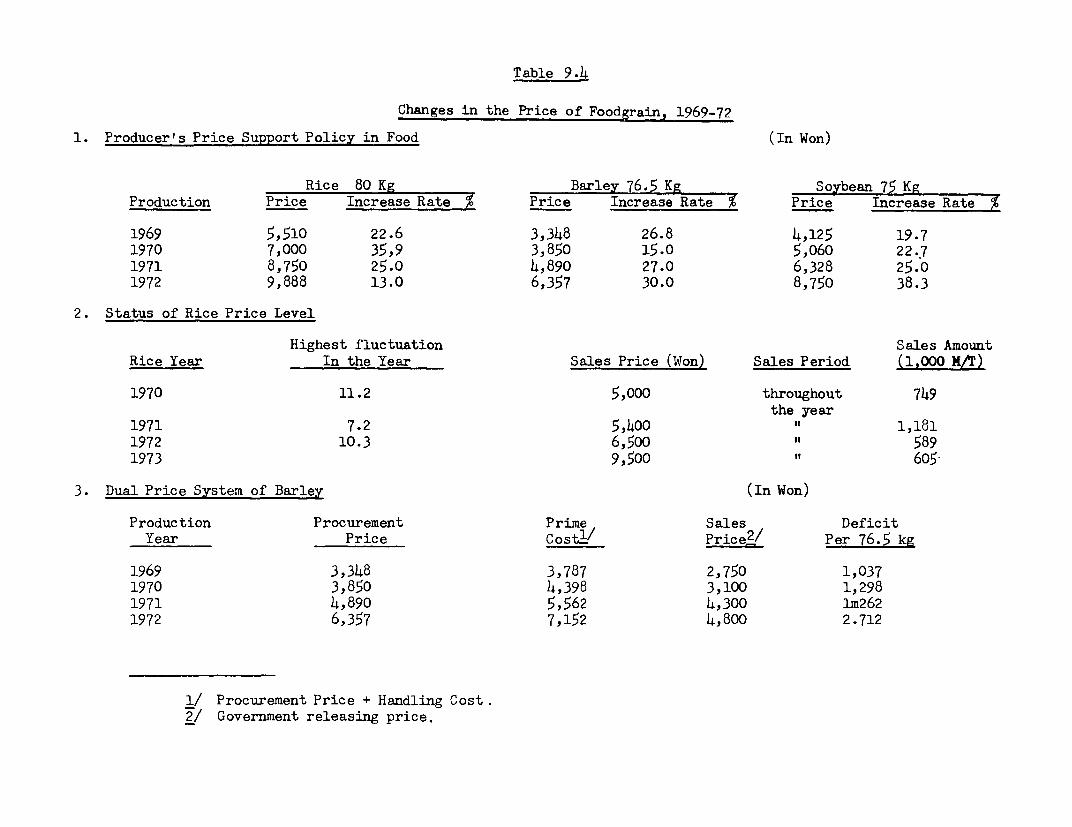
Table 9-.
Changes in the Price of Foodgrain, 1969-72
1. Producer's Price Support Policy in Food (In Won)
Rice 80 Kg Barley 76.5 Kg Soybean 75 KgProduction Price Increase Rate % Price Increase Rate % Price Increase Rate >
1969 5,510 22.6 3,348 26.8 4,125 19.71970 7,000 35,9 3,850 15.0 5,060 22.71971 8,750 25.0 4,890 27.0 6,328 25.01972 9,888 13.0 6,357 30.0 8,750 38.3
2. Status of Rice Price Level
Highest fluctuation Sales AmountRice Year In the Year Sales Price (Won) Sales Period (1.000 M/T)
1970 11.2 5,000 throughout 749the year
1971 7.2 5,400 " 1,1811972 10.3 6,500 5891973 9,500 605-
3. Dual Price System of Barley (In Won)
Production Procurement Prime Sales DeficitYear Price Cost.l Price'/ Per 76.5 kg
1969 3,348 3,787 2,750 1,0371970 3,850 4,398 3,100 1,2981971 4,890 5,562 4,300 lm2621972 6,357 7,152 4,800 2.712
1/ Procurement Price + Handling Cost.2/ Government releasing price.
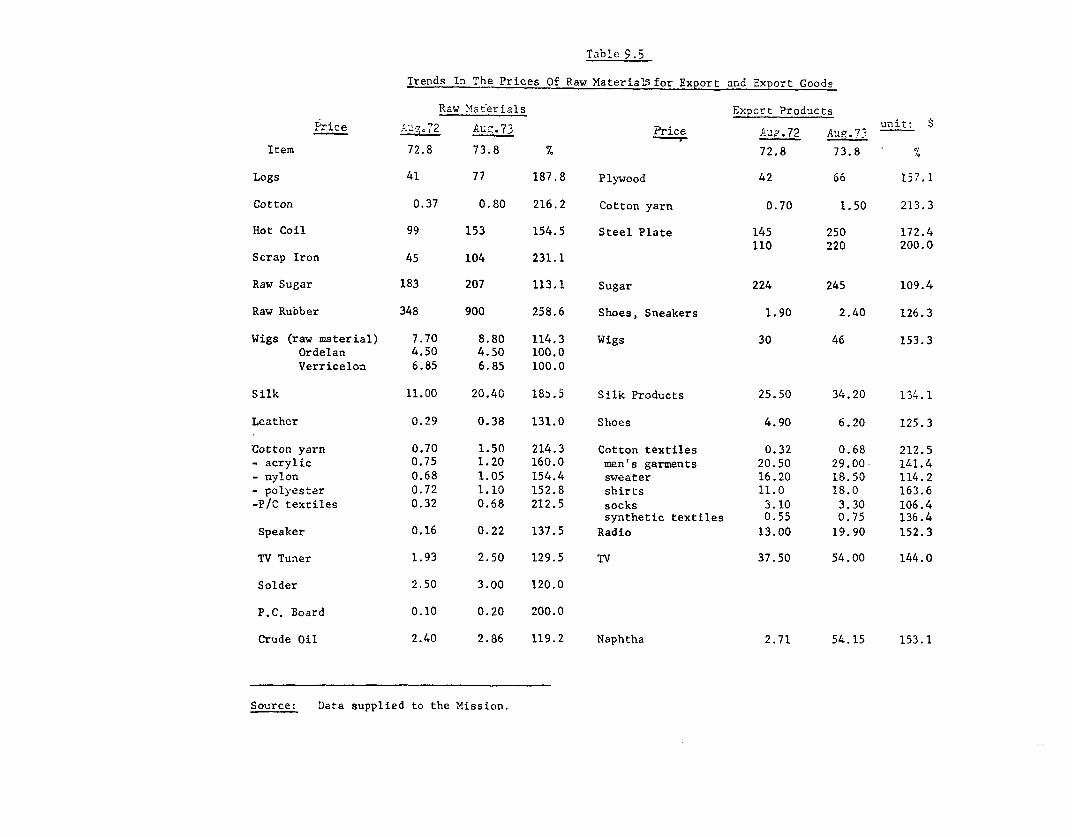
Table 9.5
Trends In The Prices Of Raw Material, for Export and Export Goods
Raw Materials Expcrt Products
Pz4ce . 7 2 Aug73 Price hAuj. 72 Aug 73 unit: $
Item 72.8 73.8 % 72.8 73.8 %
Logs 41 77 187.8 Plywood 42 66 157.1
Cotton 0.37 0.80 216.2 Cotton yarn 0.70 1.50 213.3
Hot Coil 99 153 154.5 Steel Plate 145 250 172.4
110 220 200.0
Scrap Iron 45 104 231.1
Raw Sugar 183 207 113.1 Sugar 224 245 109.4
Raw Rubber 348 900 258.6 Shoes, Sneakers 1.90 2.40 126.3
Wigs (raw material) 7.70 8.80 114.3 Wigs 30 46 153.3
Ordelan 4.50 4.50 100.0Verricelon 6.85 6.85 100.0
Silk 11.00 20.40 18,).5 Silk Products 25.50 34.20 134.1
Leather 0.29 0.38 131.0 Shoes 4.90 6.20 125.3
Cotton yarn 0.70 1.50 214.3 Cotton textiles 0.32 0.68 212.5
- acrylic 0.75 1.20 160.0 men's garments 20.50 29.00 141.4
- nylon 0.68 1.05 154.4 sweater 16.20 18.50 114.2
- polyester 0.72 1.10 152.8 shirts 11.0 18.0 163.6
-P/C textiles 0.32 0.68 212.5 socks 3.10 3.30 106.4synthetic textiles 0.55 0.75 136.4
Speaker 0.16 0.22 137.5 Radio 13.00 19.90 152.3
TV Tuner 1.93 2.50 129.5 TV 37.50 54.00 144.0
Solder 2.50 3.00 120.0
P.C. Board 0.10 0.20 200.0
Crude Oil 2.40 2.86 119.2 Naphtha 2.71 54.15 153.1
Source: Data supplied to the Mission.
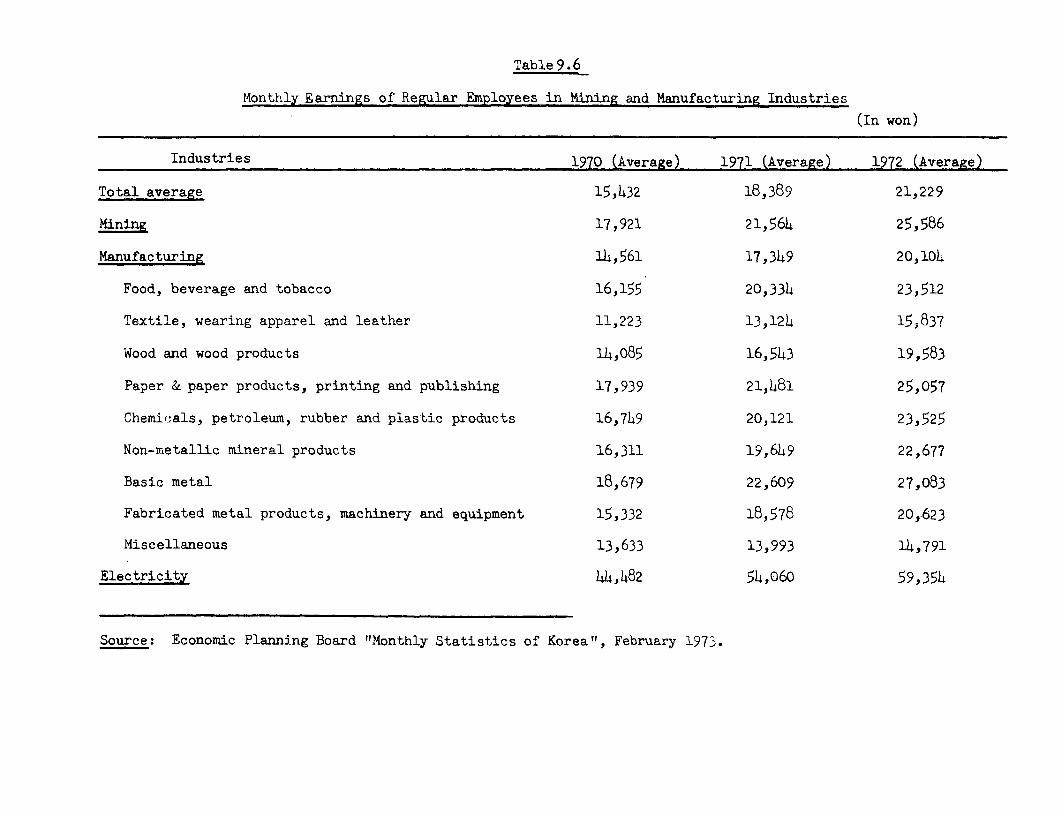
Table 9.6
Monthly Earnings of Regular Employees in Mining and Manufacturing Industries
(In won)
Industries 1970 (Average) 1971 (Average) 1972 (Average)
Total average 15,h32 18,389 21,229
Mining 17,921 21,564 25,586
Manufacturing 13,561 17,349 20,104
Food, beverage and tobacco 16,155 20,334 23,512
Textile, wearing apparel and leather 11,223 13,12h 15,837
Wood and wood products 14,085 16,543 19,583
Paper & paper products, printing and publishing 17,939 21,481 25,057
Chemicals, petroleum, rubber and plastic products 16,7[9 20,121 23,525
Non-metallic mineral products 16,311 19,6L9 22,677
Basic metal 18,679 22,609 27,083
Fabricated metal products, machinery and equipment 15,332 18,578 20,623
Miscellaneous 13,633 13,993 14,791
Electricity 4h,h82 5h,060 59,354
Source: Economic Planning Board "Monthly Statistics of Korea", February 1973.

Table 9.7
Monthly Earnings in Manufacturing Industries
19 7 21970 1 9 7 1 -RealX of % Change from % of Adjusted%/ Change from
Average Previous Year Average Wa _ Previous Year
Ave rage 100 5.0 100 16,742 3.3
Food 103.0 8.6 100 16,742 0.3Textiles 72.6 3.2 77.2 12,924 9.9Apparel 64.0 4.7 62.9 10,530 1.6Wood and Cork Products 93.3 1.8 95.8 16,045 6.2Industrial Chemicals 146.2 3.6 146,1 24,454 3.3Petroleum Refineries 291.5 20.6 273.6 45,800 (3.0)Non-Metallic Mineral Products 106.8 6.1 106.8 17,884 3.3Basic Metals 123.0 6.6 127.6 21,359 7.2Electrical Machinery 97.7 11.6 90.9 15,216 (3.9)Transport Equipment 133.4 1.3 130.5 21,842 1.1Fabricated Metal Products 86.6 5.3 86.6 14,L92 3.3
1/ Derived by adjusting current wage for changes in CPI for all cities. 1971 - 113.5; 1972 126.8.
Source: Bank of Korea.
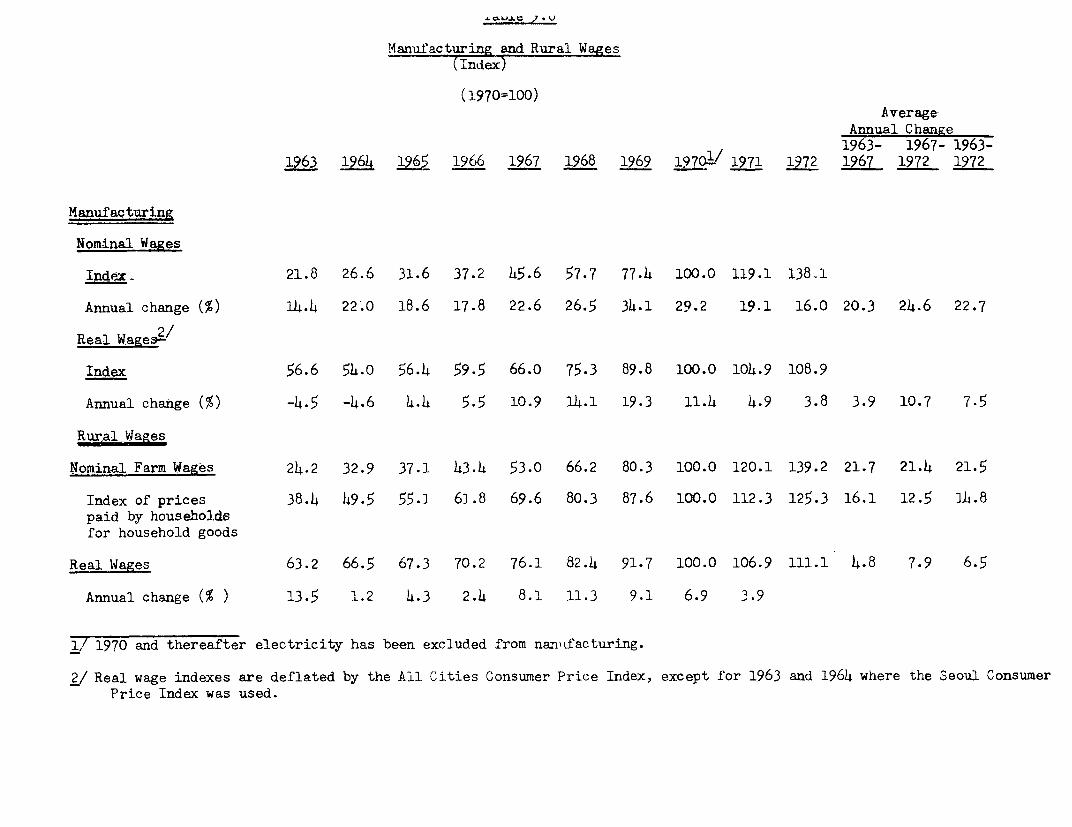
wMO- 7 7 .U
Manufacturing and Rural Wages(Index)
(1970=100)Average
Annual Change1963- 1967- 1963-
1963 1964 1965 1966 1967 1968 1969 1970i/ 1971 1972 1967 1972 1972
ManufaQturing
Nominal Wages
Index. 21.8 26.6 31.6 37.2 45.6 57.7 77.4 100.0 119.1 138.1
Annual change (%) 14.4 22.0 18.6 17.8 22.6 26.5 34.1 29.2 19.1 16.0 20.3 24.6 22.7
.2/Real Wages-_
Index 56.6 54.0 56.4 59.5 66.0 75.3 89.8 100.0 104.9 108.9
Annual change (%) -4.5 -4.6 4.4 5.5 10.9 14.1 19.3 11.h 4.9 3.8 3.9 10.7 7.5
Rural -Wages
Nominal Farm Wages 24.2 32.9 37.1 43.4 53.0 66.2 80.3 100.0 120.1 139.2 21.7 21.4 21.5
Index of prices 38.4 49.5 55.1 61.8 69.6 80.3 87.6 100.0 112.3 125.3 16.1 12.5 14.8paid by householdsfor household goods
Real-Wages 63.2 66.5 67.3 70.2 76.1 82.4 91.7 100.0 106.9 111.1 4.8 7.9 6.5
Annual change (% ) 13.5 1.2 4.3 2.4 8.1 11.3 9.1 6.9 3.9
1/ 1970 and thereafter electricity has been excluded from nanufacturing.
2 Real wage indexes are deflated by the All Cities Consumer Price Index, except for 1963 and 1964 where the Seoul ConsumerPrice Index was used.

Table 10.1
Family Income Distribution (in all cities)
1965 1969 1970 1971Income Class Frequency Income Class Frequency Income Class Frequency Income Class Frequency
(won) (won) (won) (won)
- 2,000 0.6 - 7,999 3.0 -11,999 6.2 -19,999 16.7
2,000- ,o0oo 10.8 8,000-23999 1n3 11?AO -1QQQ9 2f,000-27,090 20.4
4,000- 6,000 24.0 12,000-15,999 16.5 20,000-27,999 28.7 28,000-35,999 25.1
6,000- 8,000 21.5 16,000-19,000 15.1 28,000-35,999 19.2 36,000-43,999 12.1
8,000-10,000 14.2 20,000-23,999 14.1 36,000-43,999 8.6 44,000-51,999 7.3
10,000-12,000 10.4 24,000-27,999 9.7 44,000-51,999 6.1 52,000-5s9,999 2.6
12,000-14,000 6.8 28,000-31,999 9.9 52,000 won and 6.4 60,000 won and 6.8over over
14,000 won and 11.7 32,000-35,999 4.7over
36,000-39,999 2.9
40,000- won and 13.7over
Source: Economic Planning Board, "Annual Report on the Family Income and Expenditure Survey."
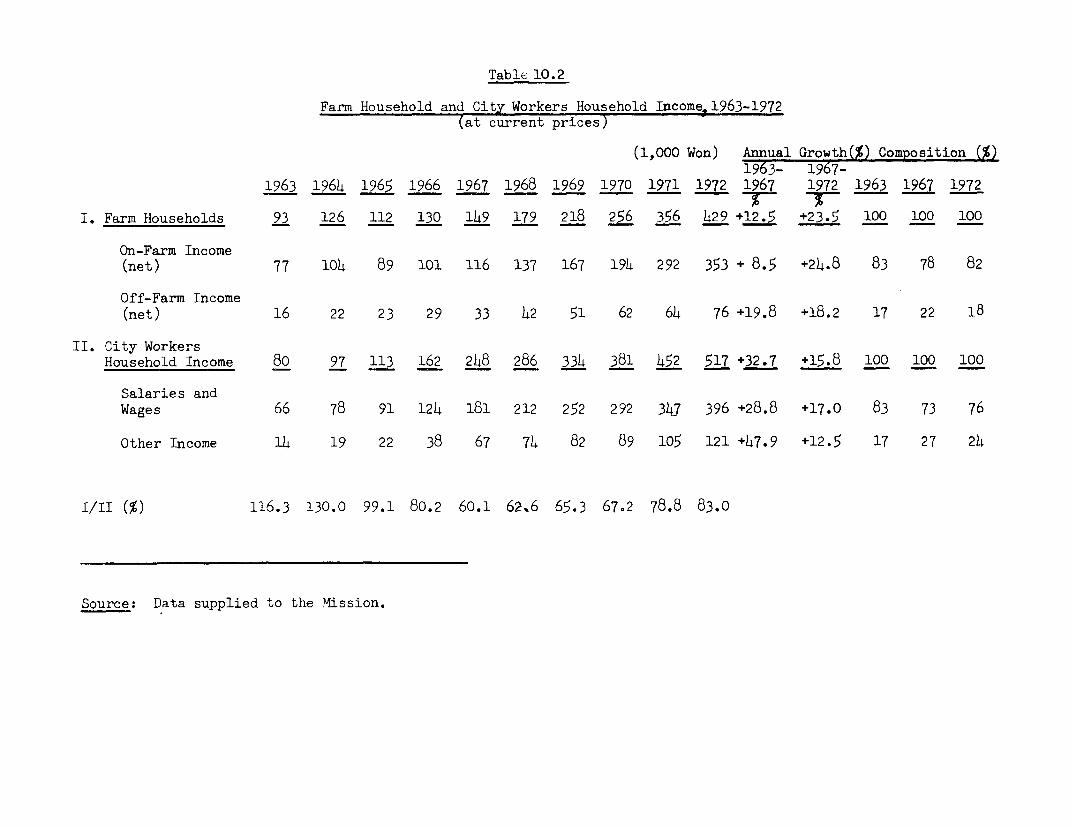
Table 10.2
Farm Household and City Workers Household Income21963-1972(at current prices)
(1,000 Won) Annual Growth(%) Composition (%)1963- 1967-
1963 1964 1965 1966 1967 1968 1969 1970 1971 1972 1967 1972 1963 1967 1972r_-rI. Farm Households 93 126 112 130 149 179 218 256 356 429 +12.5 +23.5 100 100 100
On-Farm Income(net) 77 104 89 101 116 137 167 194 292 353 + 8.5 +24.8 83 78 82
Off-Farm Income(net) 16 22 23 29 33 42 51 62 64 76 +19.8 +18.2 17 22 18
II. City WorkersHousehold Income 80 97 113 162 248 286 334 381 452 517 +32.7 +15.8 100 100 100
Salaries andWages 66 78 91 124 181 212 252 292 347 396 +28.8 +17.0 83 73 76
Other Income 14 19 22 38 67 74 82 89 105 121 +47.9 +12.5 17 27 24
I/II (%) 116.3 130.0 99.1 80.2 60.1 62.6 65.3 67.2 78.8 83.0
Source: Data supplied to the Mission.
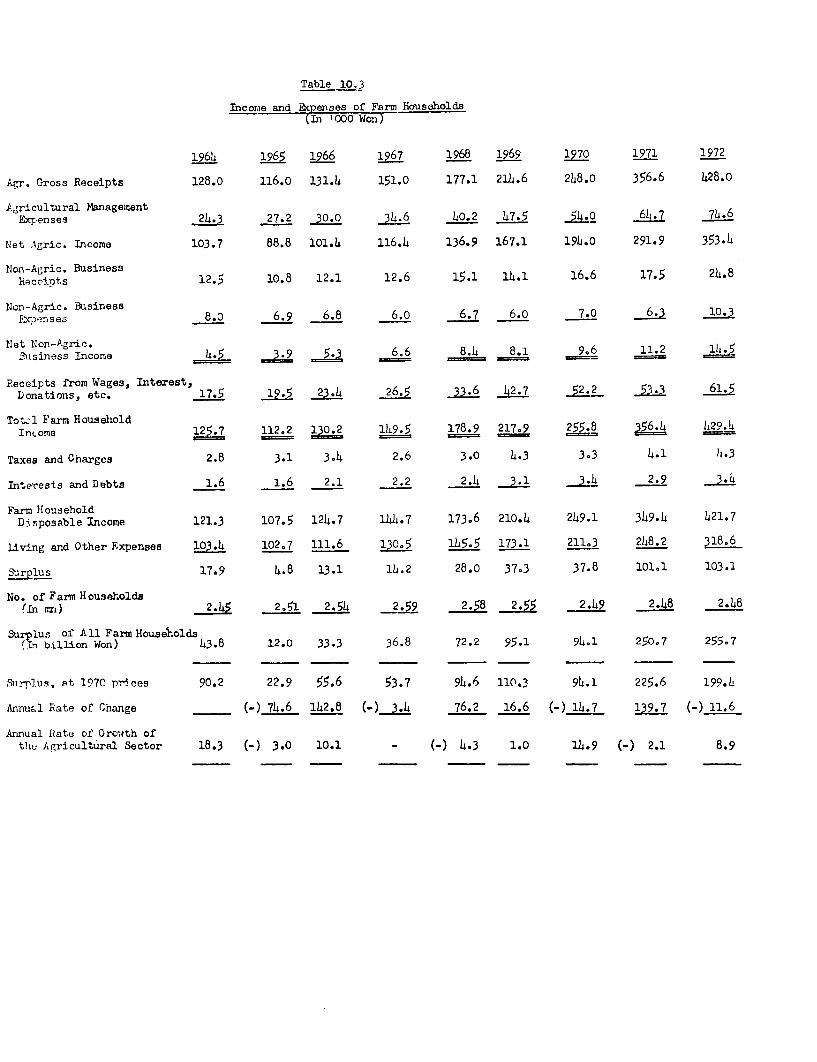
Table 10.3
Income and Bcpenses of Farmn Households(In 'OWon M6)
1964 1965 1966 1967 1968 1969 1970 1971 1972
Agr. Gross Receipts 128.0 116.0 1314 1510 177.1 214.6 248.0 356.6 428.0
A.gricultural ManagementExpenses 2_4.3 27.2 30.0 34.6 40.2 47.5 54.0 64.7 74.6
Ntet 1gric. Income 103.7 88.8 101.4 116.4 136.9 167.1 194.0 291.9 353.1
Non-Agric. BusinessReco'i.Bts 12.5 10.8 12.1 12.6 15.1 14.1 16.6 17.5 24.8
Non-Agric. Business&'Clp -?n s e 3 8.0 6.9 6.8 6.o 647 6.o 7.0 6.3 10.3
Nlet Non-Agric. 645 3 5 6.6 8.4 8.1 9.6 11.2 14.53-usiness Tncome 4___5 ____ ____ ___ _9_
Receipts from Wages, Interest,Donations, etc. 17.5 19.5 23.4 26.5 33.6 42.7 52.2 53615
Intome 125.7 112.2 13002 1149.5 178.9 217.9 255.8 356.4 429.4
Taxes and Charges 2.8 3.1 3.4 2.6 3.0 4.3 3.3 4.1 h.3
Interests and Dfebts 1.6 1.6 2.1 2.2 2.4 3 1 314 2.9 3.4
Farm HlouseholdDisposable Income 121.3 107.5 124.7 144.7 173.6 210.4 249.1 349.4 421.7
Living and Other Expenses 103.4 102.7 111.6 130,5 145.5 173.1 211.3 248.2 318.6
Surplus 17.9 4.8 13.1 14.2 28.0 37.3 37.8 101,1 103.1
No. of Farm Households(In o )m2 2.51 2.54 2.59 2.58 2.55 2.49 2.48 2.48
Surplus of All Farm House'oldsbIn billion Won) 43.8 12.0 33.3 36.8 72.2 95.1 94.1 250.7 255.7
Surplu-9, st 1970 prices 90.2 22.9 55.6 53.7 94.6 110.3 94.1 225.6 199.4
Annual Rate of Change - (_) 74.6 142.8 (-) 3.4 76.2 16.6 () 14.7 139.7 (_.) 11.6
Annual Rlate of Growth ofthe Agricultural Sector 18.3 (-) 3.0 10.1 - 4-) 4.3 1.0 14.9 (-) 2.1 8.9


Table 11.1
Number of Registered Automobiles, 1964-73
--1/
End of Period 1964 1965 1966 1967 1968 1969 1970 1971 1972 197 )#
Cars 11,409 13,001 17,502 23,235 33,112 50,299 60,677 67,582 70,244 78,334
Trucks 14,951 16,015 19,432 22,955 31,582 40,134 48,901 53,405 55,116 64,584
Buses 8,617 9,316 10,888 11,499 12,786 14,237 15,831 17,411 17,550 18,871?!'
Micro-Buses 2,160 2,385 295 536 810 856 154 166 182 -
Special Vehicles 678 794 2,o43 2,472 2,661 3,143 3,808 5,773 6.943 8,925
Total: 37,815 41,511 50,160 60,697 80,951 108,669 129,371 144,337 150,035 1703714
1/ Provisional.
2/ Includes micro-buses.
Source: Ministry of Construction and Ministry of Transportation.
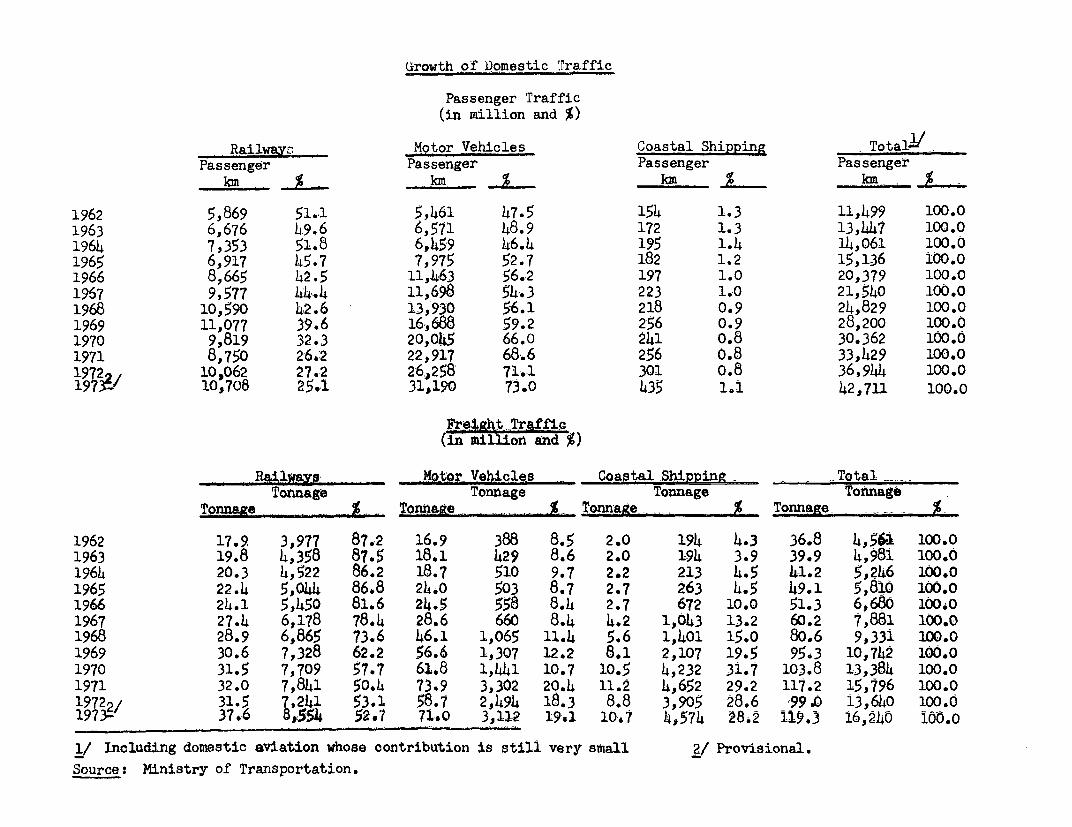
Growth of Domestic Traffic
Passenger Traffic(in million and %)
Railways. Motor Vehicles Coastal Shipping TotalJPassenger Passenger Passenger Passenger
km - km km .% km-,
1962 5,869 51.1 5,461 47.5 154 1.3 11,499 100.01963 6,676 h9.6 6,571 48.9 172 1.3 13,447 100.01964 7,353 51.8 6,459 46.4 195 1.4 14 ,061 100.01965 6,917 45.7 7,975 52.7 182 1.2 15,136 100.01966 8,665 42.5 11,463 56.2 197 1.0 20,379 100.01967 9,577 4.44 11,698 54.3 223 1.o 21,540 100.01968 10,590 42.6 13,930 5-6.1 218 0.9 24,829 100.01969 11,077 39.6 16,688 59.2 256 0.9 28,200 100.01970 9,819 32.3 20,0145 66.0 241 0.8 30.362 100.01971 8,750 26.:2 22,917 68.6 256 o.8 33,429 100.0
,10062 27.2 26,258 71.1 301 0.8 36 ,944 100.0197Y-1 10,708 25.1 31,190 73.0 435 1.1 42,711 100.0
t,-i,ht-Trraffi.c(in millior and7%)
Railweai. Motor Vehicleg Coastal -Shping - TotalTonnage Tonnage Tonnage Tonnage
Tonn_M e Ton a. .% TonnaLe % Tonnage -.
1962 17.9 3,977 87.2 16.9 388 8.5 2.0 194 4.3 36.8 4,56w 100.01963 19.8 4,358 87.5 18.1 429 8.6 2.0 194 3.9 39.9 4,981 100.o1964 20.3 4,522 86.2 18.7 510 9.7 2.2 213 4.5 41.2 5,246 100.01965 22.4 5,044 86.8 24.0 503 8.7 2.7 263 4.5 49.1 5,810 100.01966 24.1 5,450 81.6 24.5 558 8.4 2.7 672 10.0 51.3 6,680 1oo.o1967 27.4 6,178 78.4 28.6 660 8.4 4.2 1,043 13.2 60.2 7,881 ioo.o1968 28.9 6,865 73.6 46.1 1,065 11.4 5.6 1,401 15.0 80.6 9,331 100.01969 30.6 7,328 62.2 56.6 1,307 12.2 8.1 2,107 19.5 95.3 10,742 100.o1970 31.5 7,709 57.7 61.8 1,441 10.7 10.5 4,232 31.7 103.8 13,384 100.01971 32.0 7,841 50.4 73.9 3,302 20.4 11.2 4,652 29.2 117.2 15,796 100.019722/ 31.5 7,241 53.1 58.7 2,494 18.3 8.8 3,905 28.6 99.0 13,640 100.01973= 37.6 8,554 52.7 71.0 3,112 19.1 10.7 4,574 28M2 119.3 16,240 100.0
1/ Including domestic aviation whose contribution is still very simall 2/ Provisional.Source: Ministry of Transportation.
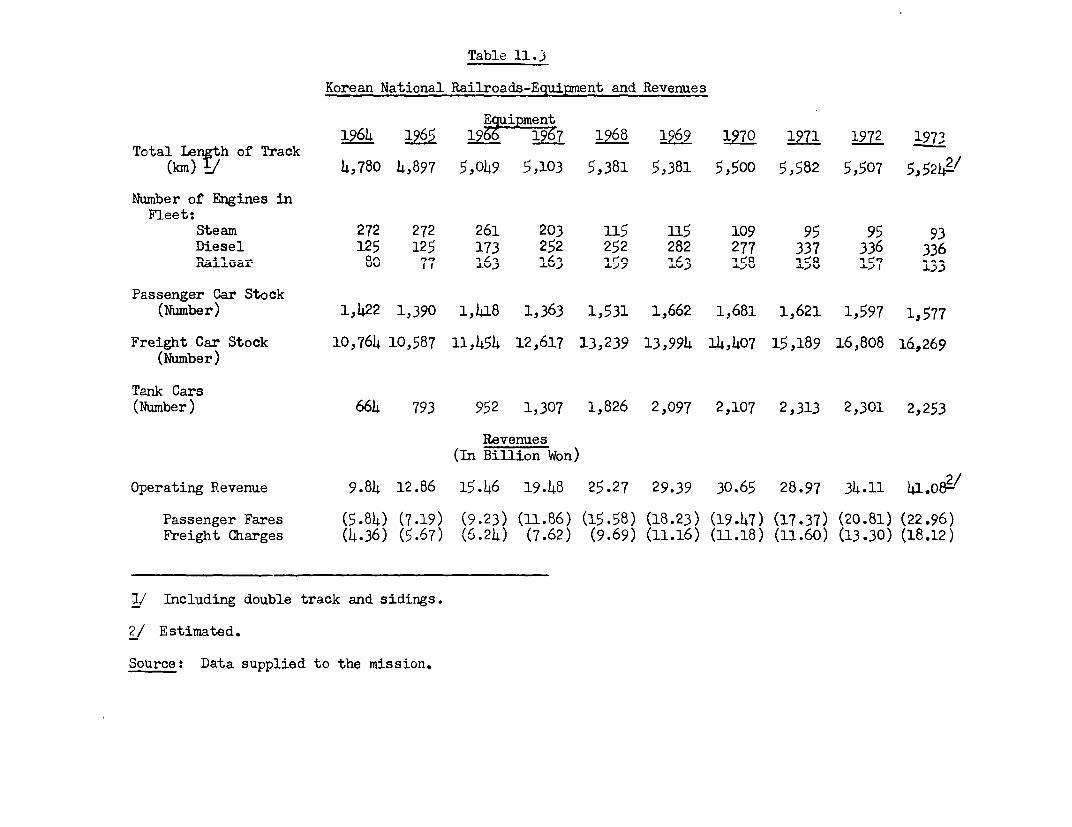
Table 11. 3
Korean National Railroads-Equipnent and Revenues
Equpmet19614 1965 1966 _-97 1968 1969 19-70 1971 1972 1973
Total 1enyth of Track---(km)' 14,780 14,897 5,0o49 5,103 5,381 5,381 5,Soo 5,582 5,507 5,5214~/
Number of Engines inFleet:
Steam 272 272 261 203 115 115 109 95 95 93Diesel 125 125 173 252 252 282 277 337 336 336
Passenger Car Stock(Number) 1~,422 1,390 1,1418 1,363 1,531 1,662 1,681 1,621 1,597 1,577
Freight Car Stock 10,7614 10,587 11,14514 12,617 13,239 13,9914 114,1407 15,189 16,808 16t269
(Number)
Tank Cars(Number) 6614 793 952 1,307 1,826 2,097 2.,107 2,313 2,301 2.,253
Revenues(In Billion Won)
Operating Revenue 9.814 12.86 15.146 19.148 25.27 29.39 30.65 28.97 314.11 4~1.08='
Passenger Fares (5.814) (7.19) (9.23) (u1.86) (15.58) (18.23) (19.147) (17.37) (20.81) (22.96)
Freight Charges (14.36) (5.67) (6.214) (7.62) (9.69) (11.16) (11.18) (11.60) (13.30) (18.12)
1)!Including double track and sidings.
21 Estimated.
Source: Data supplied to the mission.
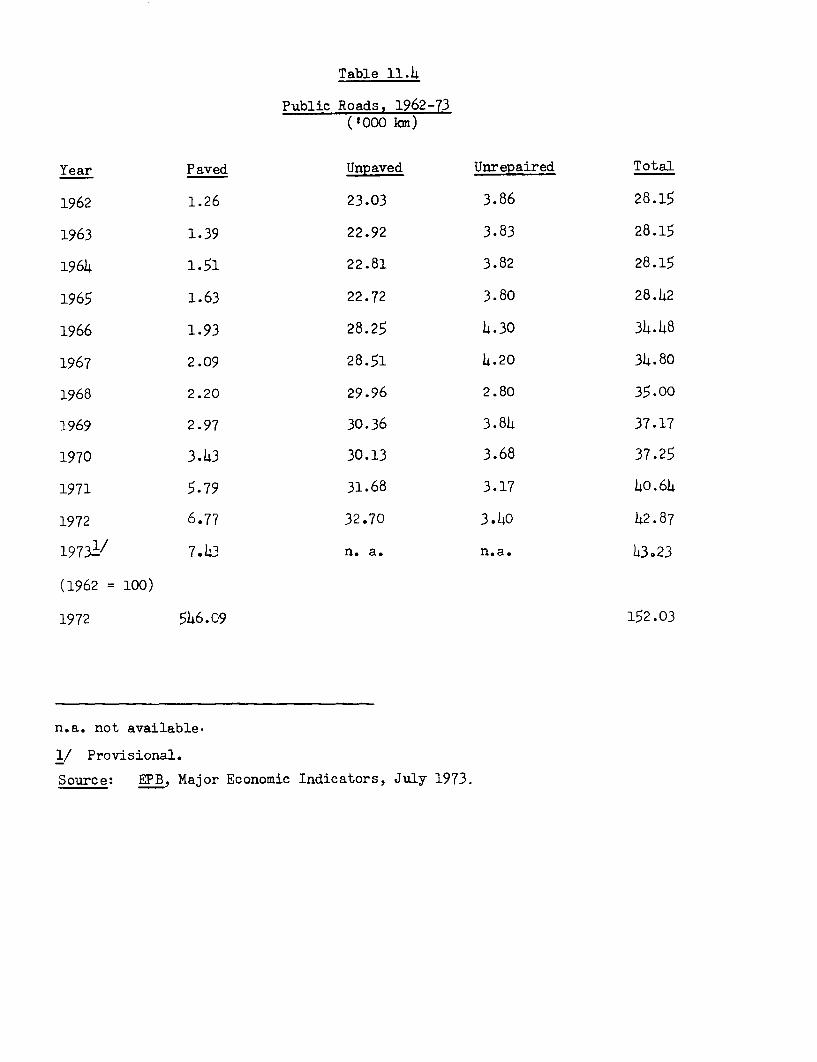
Table 11.4
Public Roads, 1962-73('I000 kcm)
Year Paved Unpaved Unrepaired Total
1962 1.26 23.03 3.86 28.15
1963 1.39 22.92 3.83 28.15
1964 1.51 22.81 3.82 28.15
1965 1.63 22.72 3.80 28.42
1966 1.93 28.25 4.30 34.48
1967 2.09 28.51 4.20 34.80
1968 2.20 29.96 2.80 35.00
1969 2.97 30.36 3.84 37.17
1970 3.43 30.13 3.68 37.25
1971 5.79 31.68 3.17 40.64
1972 6.77 32.70 3.h0 42.87
19731/ 7.43 n. a. n.a. 43.23
(1962 = 100)
1972 546.09 152.03
n.a. not available.
1/ Provisional.
Source: EPB, Major Economic Indicators, July 1973.
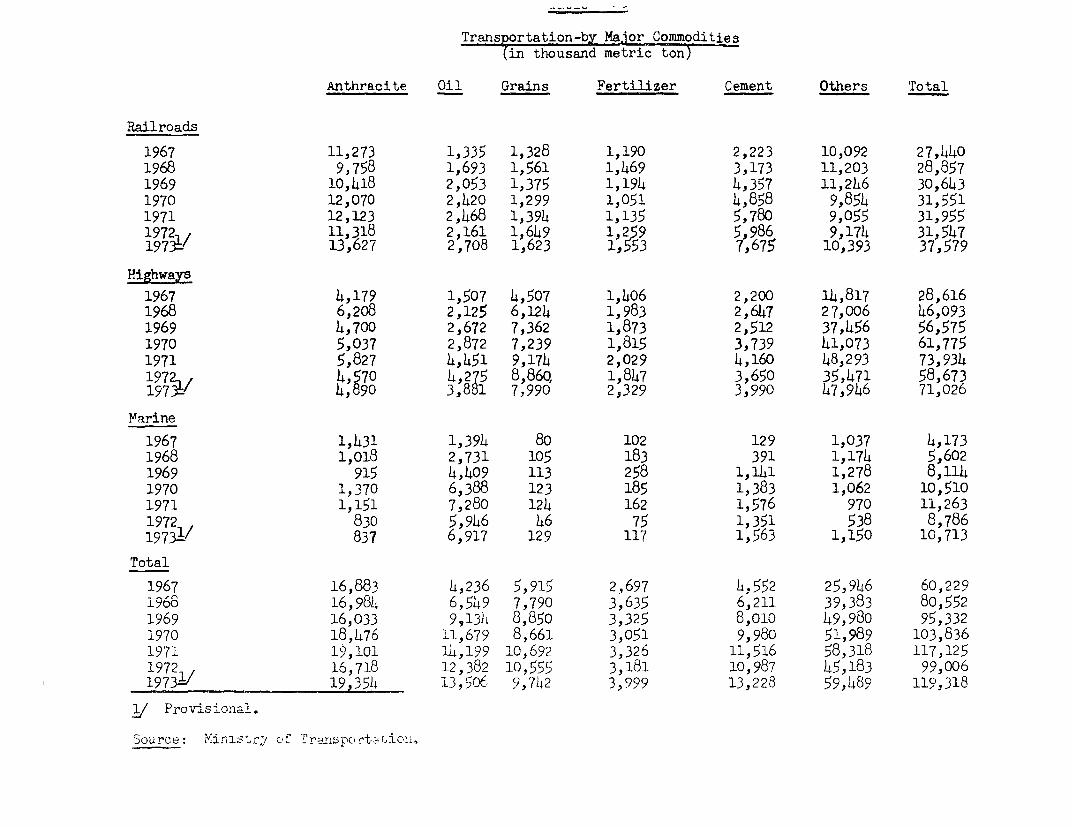
Transportation-by Major Commodities(in thousand metric ton)
Anthracite Oil Grains Fertilizer Cement Others Total
Railroads
1967 11,273 1,335 1,328 1,190 2,223 10,092 27,4401968 9,758 1,693 1,561 1,469 3,173 11,203 28,8571969 10,418 2,053 1,375 1,194 4,357 11,246 30,6431970 12,070 2,420 1,299 1,051 4,858 9,854 31,5511971 12,123 2,468 1,394 1,135 5,780 9,055 31,95519725 11,318 2,161 1,649 1,259 5,986 9,174 31,5471973-,/ 13,627 2,708 1,623 1,553 7,675 10,393 37,579
Highways
1967 4,179 1,507 4,507 1,406 2,200 14,817 28,6161968 6,208 2,125 6,124 1,983 2,647 27,006 46,0931969 4,700 2,672 7,362 1,873 2,512 37,456 56,5751970 5,037 2,872 7,239 1,815 3,739 41,073 61,7751971 5,827 4,451 9,174 2,029 4,160 48,293 73,934
4,570 4,275 8,860 1,847 3,650 35,471 58,6731973t/ 4,890 3,881 7,990 2,329 3,990 47,946 71,026
Yarine
1967 1,431 1,394 80 102 129 1,037 4,1731968 1,018 2,731 105 183 391 1,174 5,6021969 915 4,409 113 258 1,141 1,278 8,1141970 1,370 6,388 123 185 1,383 1,062 10,5101971 1,151 7,280 124 162 1,576 970 11,2631972 830 5,946 46 75 1,351 538 8,78619732/ 837 6,917 129 117 1,563 1,150 10,713
Total
1967 16,883 4,236 5,915 2,697 L,552 25,946 60,2291968 16,984 6,549 7,790 3,635 6,211 39,383 80,5521969 16,033 9,134 8,850 3,325 8,o0o 49,980 95,3321970 18,476 11,679 8,661 3,051 9,980 51,989 103,8361971 19,101 14,199 10,692 3,326 11,516 58,318 117,1251972 16,718 12,382 10,555 3,181 10,987 45,183 99,00619731" 19,3514 13,506 9,742 3,999 13,228 59,489 119,318
i/ Provisional.
S-ource: Minis;Of Tranc,cft,0 t i
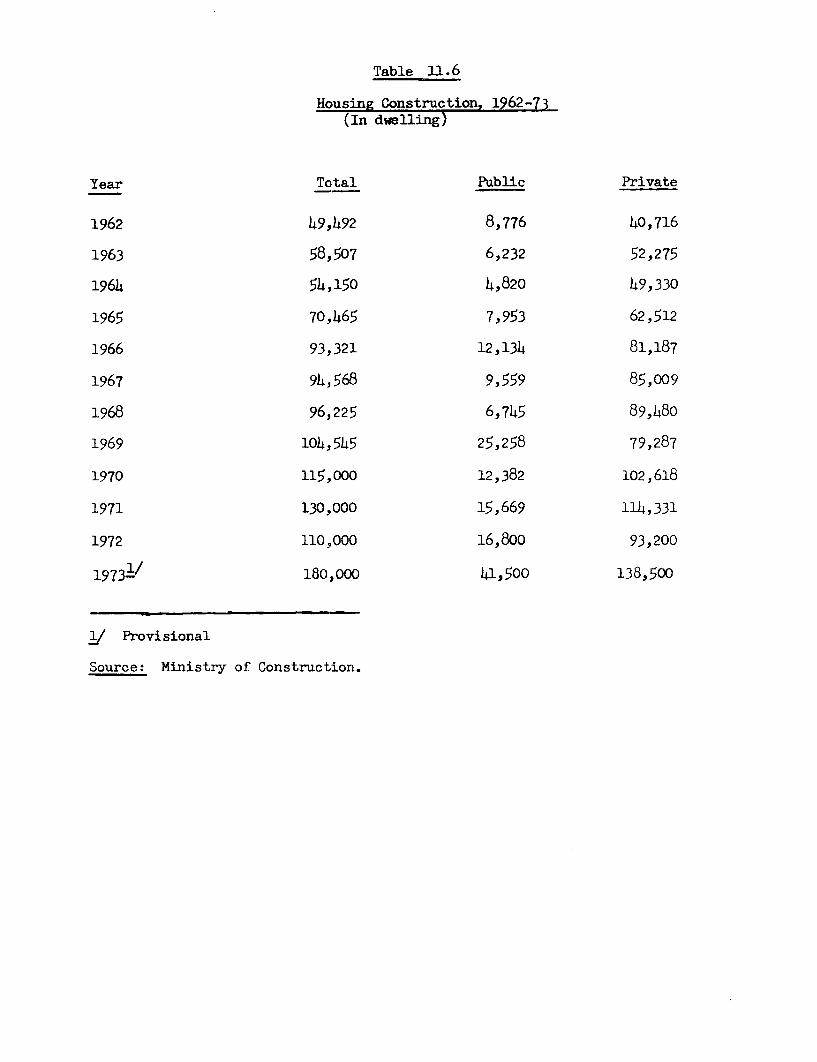
Table 11.6
Housing Construction, 1962-73(In dwelling)
Year Total Public Private
1962 49,492 8,776 40,716
1963 58,507 6,232 52,275
1964 54,150 4,820 49,330
1965 70,465 7,953 62,512
1966 93,321 12,134 81,187
1967 94,568 9,559 85,009
1968 96,225 6,745 89,480
1969 104,545 25,258 79,287
1970 115,000 12,382 102,618
1971 130,000 15,669 114,331
1972 110,000 16,800 93,200
19731/ 180,000 41,500 138,500
)/ Provisional
Source: Ministry of Construction.
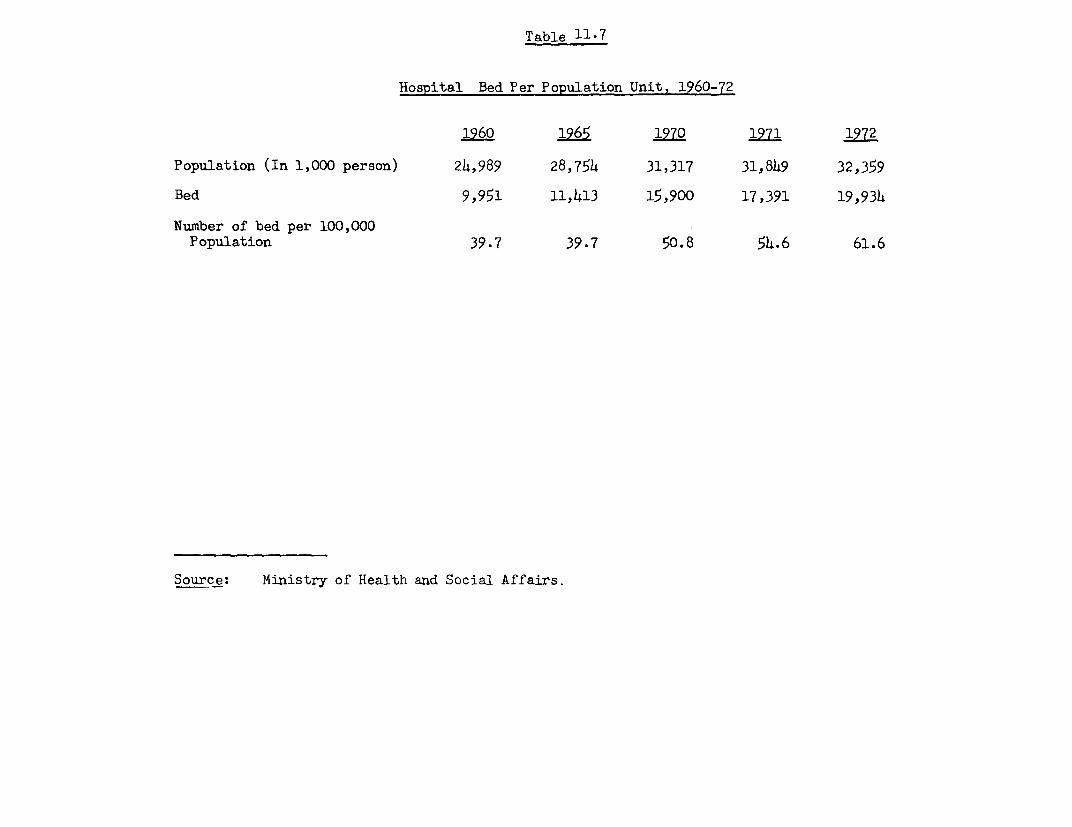
Table 11.7
Hospital Bed Per Population Unit, 1960-72
1960 1965 1970 1971 1972
Population (In 1,000 person) 24,989 28,754 31,317 31,849 32,359
Bed 9,951 11,413 15,900 17,391 19,934
Number of bed per 100,000Population 39.7 39.7 50.8 54.6 61.6
Source: Ministry of Health and Social Affairs.
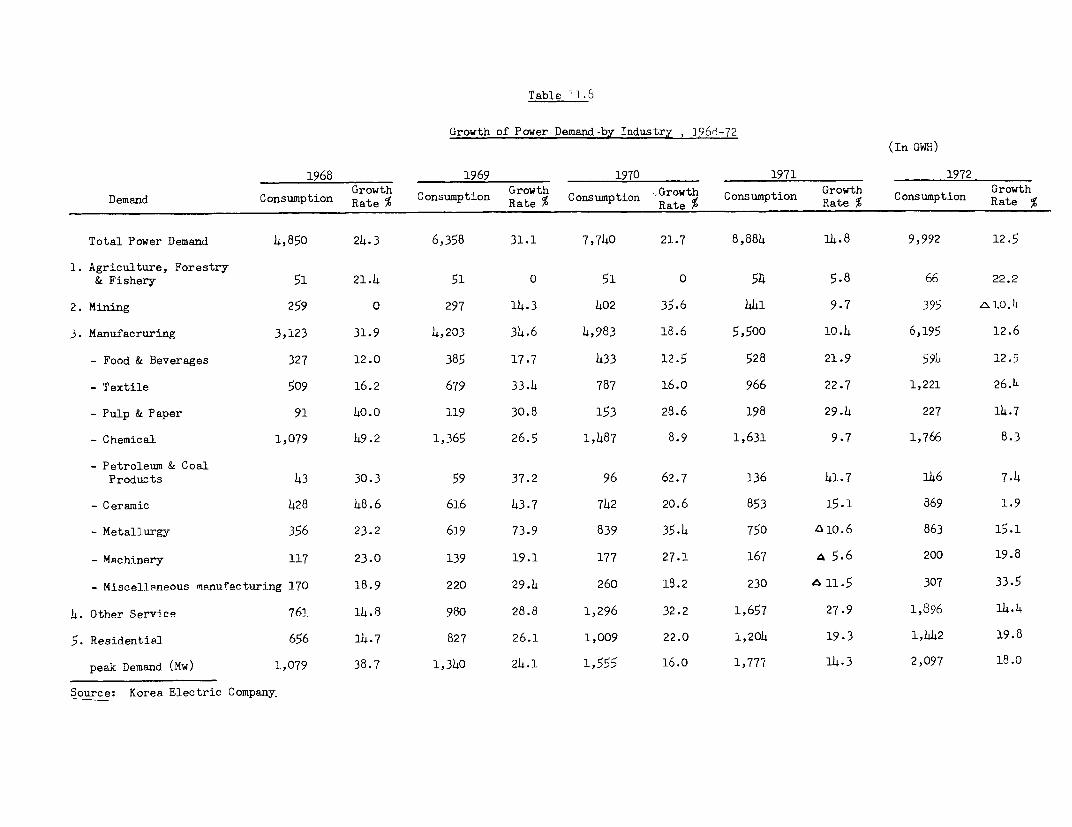
Table I i.6
Growth of Power Demand-by Industry , 3968-72
(In GWH)
1968 1969 1970 1971 1972
Demand Consumption Growth CoGtsumption GRth Consumption 'Growth Consumption Growth Consumption GrowthRate % ~~Rate % Cnupin Rate % Cnupin Rate % Cnupin Rate %
Total Power Demand 4,850 24.3 6,358 31.1 7,740 21.7 8,884 14.8 9,992 12.5
1. Agriculture, Forestry& Fishery 51 21.4 51 0 51 0 54 5.8 66 22.2
2. Mining 259 0 297 14.3 402 35.6 441 9.7 395 A 4
3. Manufacruring 3,123 31.9 4,203 34.6 14,983 18.6 5,500 1044 6,195 12.6
- Food & Beverages 327 12.0 385 17.7 433 12.5 528 21.9 59) 12.5
- Textile 509 16.2 679 33.4 787 16.0 966 22.7 1,221 26.4
- Pulp & Paper 91 40.0 119 30.8 153 28.6 198 29.4 227 14.7
- Chemical 1,079 49.2 1,365 26.5 1,487 8.9 1,631 9.7 1,766 8.3
- Petroleum & CoalProducts 43 30.3 59 37.2 96 62.7 136 41.7 146 7.4
- Ceramic 428 48.6 616 43.7 742 20.6 853 15.1 869 1.9
- Metallurgy 356 23.2 619 73.9 839 35.4 750 a o.6 863 15.1
- Machinery 117 23.0 139 19.1 177 27.1 167 o 5.6 200 19.8
- Miscellaneous manufacturing 170 18.9 220 29.4 260 18.2 230 a 11.5 307 33.5
4. Other Service 761 14.8 980 28.8 1,296 32.2 1,657 27.9 1,896 14.4
5. Residential 656 14.7 827 26.1 1,009 22.0 1,204 19.3 1,442 19.8
peak Demand (Mw) 1,079 38.7 1,340 24.1 1,555 16.0 1,777 14.3 2,097 18.0
Source: Korea Electric Company.
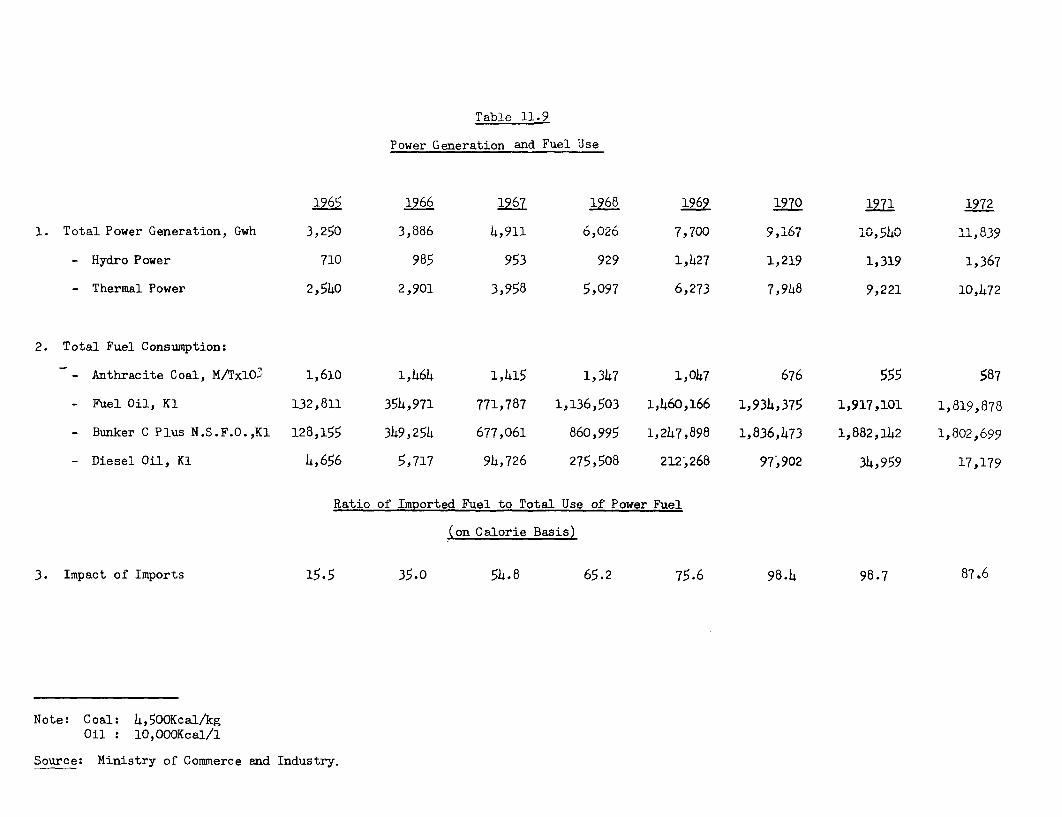
Table 11.9
Power Generation and Fuel Use
1965 1966 1967 1968 1969 1970 1971 1972
1. Total Power Generation, Gwh 3,250 3,886 4,911 6,026 7,700 9,167 10,540 11,839
- Hydro Power 710 985 953 929 1,427 1,219 1,319 1,367
- Thermal Power 2,540 2,901 3,958 5,097 6,273 7,948 9,221 10,472
2. Total Fuel Consumption:
- Anthracite Coal, M/TxlO- 1,610 1,464 1,415 1,347 1,047 676 555 587
- Fuel Oil, Kl 132,811 354,971 771,787 1,136,503 1,460,166 1,934,375 1,917,101 1,819,878
- Bunker C Plus N.S.F.0.,K1 128,155 349,254 677,061 860,995 1,247,898 1,836,473 1,882,142 1,802,699
- Diesel Oil, Kl 4,656 5,717 94,726 275,508 212,268 97,902 34,959 17,179
Ratio of Imported Fuel to Total Use of Power Fuel
(on Calorie Basis)
3. Impact of Imports 15.5 35.0 54.8 65.2 75.6 98.4 98.7 87.6
Note: Coal: 4,500Kcal/kgOil : 10,OOOKcal/l
Source: Ministry of Commerce and Industry.
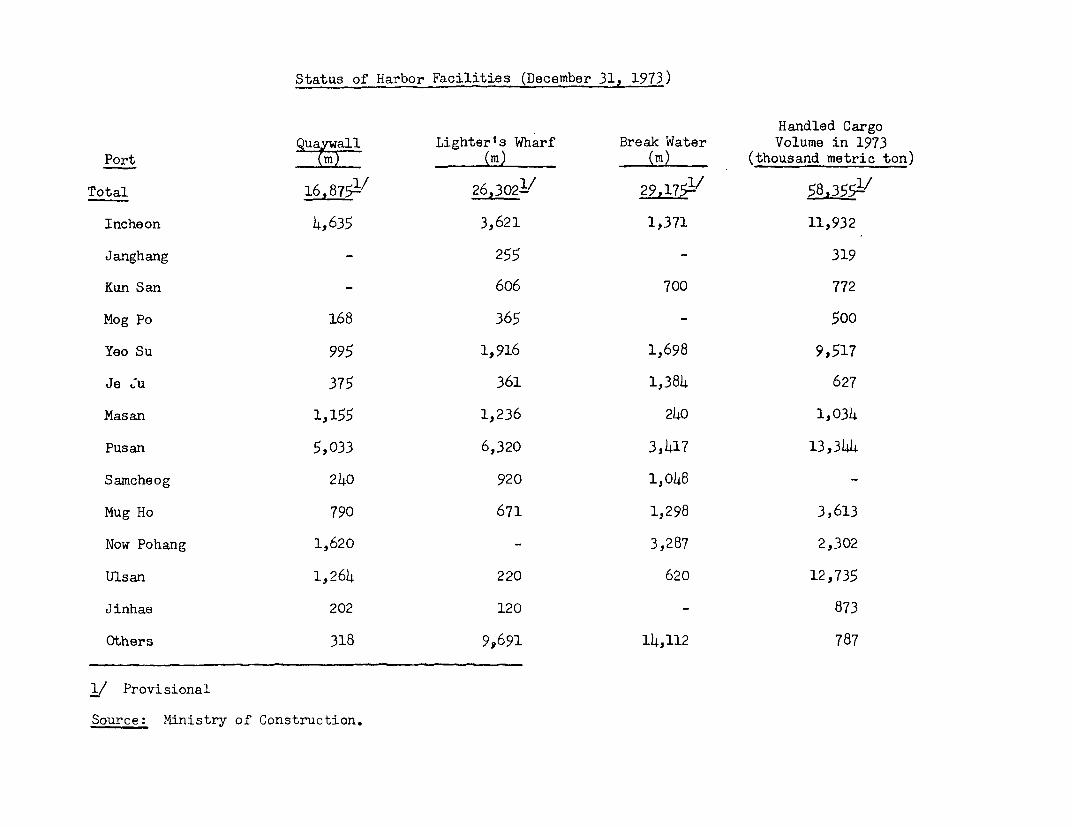
Status of Harbor Facilities (December 31, 1973)
Handled CargoQuaywall Lighter's Wharf Break Water Volume in 1973
Port )(m) _ (m) (thousand metric ton)
Total 16,8751/ 26,302 29,1752 58,355:-
Incheon 4,635 3,621 1,371 11,932
Janghang - 255 319
Kun San - 606 700 772
Mog Po 168 365 - 500
Yeo Su 995 1,916 1,698 9,517
Je Ju 375 361 1,384 627
Masan 1,155 1,236 240 1,034
Pusan 5,033 6,320 3,417 13,344
Samcheog 240 920 1,048 -
Mug Ho 790 671 1,298 3,613
Now Pohang 1,620 - 3,287 2,302
Ulsan 1,264 220 620 12,735
Jinhae 202 120 - 873
Others 318 99691 14,112 787
.L/ Provisional
Source: Ministry of Construction.