Embed Size (px)
Citation preview

Currency Union and Investment Flows:Estimating the Euro E¤ect on FDI
Marián Dinga and Vilma Dingová�
CERGE-EI, Praguey IES, Charles University, Prague
Abstract
This paper studies the e¤ect of the euro introduction on international FDI�ows. Using country-pair data on 35 OECD economies during 1997-2008 andadopting the propensity score matching as identi�cation strategy, we investigatethe impact of the euro on capital reallocation. In general, the euro exhibits nosigni�cant impact on FDI. However, the e¤ect becomes signi�cant on the subsetof EU countries, increasing FDI �ows by 14.3 to 42.5 percent. Furthermore,we �nd that the EU membership fosters FDI �ows much more than the euro,increasing FDI �ows by 55 to 166 percent. Among other FDI determinants, highgross domestic product, low distance between countries and low unit labor costs intarget country have a positive e¤ect on FDI. On the contrary, long-term exchangerate volatility deters FDI �ows.
Keywords: monetary union, foreign direct investment, common currency area,euro
JEL classi�cation: E42, F15, F21
�Correspondence addresses: CERGE-EI, P.O.Box 882, Politických vµezµn°u 7, Prague, Czech Republic,email: [email protected], IES FSV UK, Opletalova 26, Prague 1, 110 00 Czech Republic, email:[email protected]. This research was supported by a grant from the CERGE-EI Foundationunder a program of the Global Development Network (RRC X-42). All opinions expressed are those ofthe authors and have not been endorsed by CERGE-EI, IES or the GDN. The usual disclaimer applies.
yCERGE-EI is a joint workplace of the Center for Economic Research and Graduate Education,Charles University, and the Economics Institute of the Academy of Sciences of the Czech Republic.
1

1 Introduction
In 1999, the euro was introduced as a common currency in eleven countries of theEuropean Union (EU). The establishment of the European Monetary Union (EMU)was viewed as a necessary step towards closer political and economic integration. Fromthe political perspective, the common currency was expected to become a unifyingsymbol of European identity. From the economic perspective, the common currencywas supposed to enhance a free movement of capital which is a fundamental principleof the EU. At the same time, it would promote trade through diminishing transactioncosts resulting from the elimination of exchange rate volatility (Rose 2000). In a broadercontext, the common currency was believed to ensure better functioning of the EuropeanSingle Market (Delors 1989).The euro project has been generally supported by policymakers and politicians.
Expectations about the economic gains of a common currency were ambitious andseveral waves of enlargement took place over the last decade (Table 1).1 Nevertheless,eurosceptics objected that one currency does not �t monetary needs of diverse economiesand the initial weak growth of the euro area only fueled their arguments. Amongacademics, the decision to form a common currency area led to a huge interest. Theliterature ranges from the assessment of the ful�llment of Mundell-McKinnon-Kenencriteria, evaluation of arguments in favor and against a currency union (e.g. Giavazziand Torres 1993), comparison of co-movements in macroeconomic variables betweenthe EU and the USA or the analysis of their asymmetric shocks (e.g., Bayoumi andEichengreen 1993).The debate on the contribution of a common currency to economic development is
vital. In our paper, we contribute to the mosaic of the impacts of a common currencyon the economy by investigating one speci�c aspect of a common currency �the linkbetween the introduction of the euro and the in�ow of foreign direct investment (FDI).Two main research questions regarding euro and FDI are being asked: �rst, has thecommon currency enhanced FDI �ows for countries that adopted the euro as comparedwith the rest of OECD countries and, second, has the euro fostered capital reallocationfor euro countries as compared with the rest of the EU? In addition, the role of botheconomic and monetary integration is inspected and the impact of introducing the eurois compared with the impact of the EU membership.The euro exerts in�uence on many economic activities, one of them being the �ow
of capital among countries resulting from the removal of restrictions on investment lo-cation decisions (Baldwin et al. 2008). It is important to study and understand �rms�international strategies as FDI is associated with higher economic growth, developedtechnologies and knowledge spillovers among countries (Harris and Taylor 2005). Liter-ature has shown that uncertainty negatively a¤ects investment and, more speci�cally,that uncertainty about exchange rate movement has adverse e¤ect on FDI decisions
1Greece joined the club in 2001. The EMU was enlarged later by Slovenia in 2007, Cyprus andMalta in 2008, Slovakia in 2009 and the newest euro area member is Estonia which joined the EMUin 2011. Thus, 17 of 27 EU countries now use the euro as an o¢ cial currency.
2

(Carruth et al. 2000). In particular, a persistent deviation of the exchange rate fromthe long run equilibrium negatively a¤ects FDI �ows (Campa 1993). Thus, it is naturalto ask whether the elimination of the exchange rate movements resulting from the in-troduction of a common currency in�uences �rms´ long-term investment decisions andFDI in general.The common currency can a¤ect FDI in�ows through three channels: reduced ex-
change rate uncertainty, reduced transaction costs and increased price transparency.First, the elimination of exchange rate risk leads to cost saving stemming from theabsence of a need for hedging, thereby positively a¤ecting expected returns to �rms.Many multinational enterprises (MNEs) are export-oriented and FDI serves mainly asa production platform for their exports (Bergstrand and Egger 2006). Naturally, amotivation of MNEs to locate their manufactures in the EMU increases as foreign in-vestors�expansion into the euro area leads to an access to the rest of the euro areacountries and to the surrounding EU market. Secondly, the reduction of transactionand operational costs associated with the use of many currencies decreases the cost ofcapital �ows. Thirdly, the common currency enhances price transparency, facilitatinga comparison of factor prices and costs calculations. Many investments abroad are mo-tivated by �rms�e¤ort to produce e¢ ciently and the endowment and prices of primaryfactors of production �land, labor and capital �are important determinants of �rms�localization decisions.Answering the question about the euro impact on capital reallocation through FDI
would bring about broad policy implications. Apart from traditional location deter-minants (infrastructure, human capital), countries use various institutional factors toattract FDI. Speci�cally, governments spend vast amounts of public money on FDIpromotion policies and investment incentive schemes. Thus, the quanti�cation of theimpact of the euro on FDI �ows might become one of the factors under considerationof the EU countries that have not adopted the euro so far. Furthermore, it may also in-dicate the advantage of a common currency for di¤erent regions or groups of countries,too.The reminder of the paper is organized as follows. In Section 2 we analyze global
FDI �ows and the role of the FDI in the EU. In Section 3 we review related literature.Sections 4 and 5 are devoted to methodology issues and data description and Section 6presents the identi�cation strategy. In Section 7 we present our results and robustnesschecks. Section 8 summarizes and presents concluding remarks.
2 FDI in the EU
Global FDI �ows have grown dramatically over past three decades, increasing from$54 billion in 1980 to $1,771 billion in 2008. In the 1980s and early 1990s, therewas an evident increasing trend in FDI to developing countries as productive factorswere emphasized as one of the most important motivation for FDI.2 These countries
2Locating �rm�s activities to countries with the lowest production costs leads to vertical FDI.
3

capitalized on the advantage of lower productive costs, mainly labor costs, and theirshare in global FDI �ows rose from 14 percent in 1980 to 37 percent in 2008, as shownin Table 2. There is a dip in world FDI �ows starting in 2001 related to the slowdownin the world economy and a decline in cross-border mergers and acquisitions. Afterrecovering during 2004-2007, there was a more recent decline in 2008, mainly due toan incoming economic and �nancial crisis. However, the overall share of FDI �owsto developing countries has remained signi�cantly lower than the share of �ows todeveloped economies (37 vs. 57 percent in 2008).Europe is absorbing about two thirds of total FDI in�ows to developed economies,
followed by North America with the share of 26 percent (Table 3). Besides beingthe main recipient of world FDI �ows, Europe is also the main source of these �ows,followed by the United States and Japan. Further disentangling the structure of FDI�ows, approximately 96 percent of FDI �ows into Europe aim to the EU and morethan 66 percent into the EMU. From 1995, FDI in�ows to Europe have increased, withan exception of periods 2001-2004 and 2008-2009 when the world FDI �ows decreaseddue to a �nancial and economic crisis. However, it has remained the prevalent globalrecipient of FDI �ows.The euro area, becoming a single huge market with more than 300 millions con-
sumers, is expected to attract FDI by its enormous size, economic power and no ex-change rate risk. FDI is often associated with indirect e¤ects on host countries throughspillovers on domestic suppliers, customers or �rms in general. These spillovers are ei-ther horizontal or vertical. Horizontal FDI spillovers occur when a new foreign companywith a high productivity in�uences domestic competing companies which are in turnforced to increase their e¢ ciency either by new technology implementation or by hir-ing new, better trained workers and managers (Javorcik 2004). Vertical FDI spilloversare represented by the in�uences of the foreign company on domestic suppliers or con-sumers. Nevertheless, the literature on FDI technology spillovers o¤ers ambiguousempirical evidence. Using meta-analysis approach, Havranek and Irsova (2010) exam-ine numerous empirical FDI spillover studies and they conclude that FDI spillover e¤ectis positive only for certain situation, e.g. the impact on domestic suppliers. In this light,it will be interesting to analyze the e¤ect of the common currency on FDI.
3 Literature Survey
A rapid growth of investment �ows in a globalized world economy over the last decadeshas sparked academic interest in FDI determinants and the FDI e¤ects on both host andhome economies. The empirical literature acknowledges that foreign investors�locationdecisions are in�uenced by �rm-level factors as well as macroeconomic, geographic andinstitutional variables. One strand of literature on the FDI determinants arises fromthe eclectic paradigm (Dunning 1997) which is also known as OLI model.3 Based on
3OLI model is based on three categories of advantages of foreign investment: O � Ownershipadvantage (trademark, entrepreneurial skills etc.), L �Location advantage (access to raw materials,
4

the new trade theory it emphasizes ownership and location advantages and analyzesFDI from the investors´ point of view. Investors�decisions whether to become a multi-national enterprise is examined mainly through �rm costs represented as plant-levelcosts and trade costs (Markusen and Venables 1998; Kleinert 2001). Another strand ofliterature looks at determinants of FDI location from the perspective of country di¤er-ences, attempting to identify how country-level factors such as size, institutions, taxes,exchange rate, trade protection, production factor prices and human capital endowmenta¤ect FDI �ows.4
Literature focusing on the e¤ect of exchange rate on FDI has two branches, oneexamining the relation between exchange rate levels and international investment �owsand the second focusing on the exchange rate volatility and the role of uncertainty andexpectations about future exchange rate. Studies based on the �rm-level frameworkand the option theory �nd that greater exchange rate uncertainty increases the outsideoption for �rms so that it pays o¤ to delay their investment, which depresses currentFDI.5
Since the formation of the European Monetary Union (EMU), analysis of the roleof exchange rate uncertainty on FDI �ows is supplemented by the aspect of commoncurrency and its impact on investment �ows. The literature studying the link betweenthe euro and FDI �nds a signi�cant positive impact of euro on FDI (Petroulas 2007;Schiavo 2007; De Sousa and Lochard 2006; Buch et al. 2003). However, there is noaccordance regarding the size of the e¤ect, therefore the exact magnitude of the impactof the euro on FDI remains unclear.Baldwin et al. (2008) highlight that usual shortcoming preventing a proper es-
timation of the euro e¤ect on FDI is a less-developed methodology and identi�cationstrategy. In our paper, we use a rigorous identi�cation technique to obtain more reliableestimates on the common currency impact on international investment.Standard approach to analyze the impact of euro on FDI employs a gravity model
augmented with a dummy variable for a common currency. De Sousa and Lochard(2006) investigate FDI decision of a �rm to set up an a¢ liate abroad and estimate thee¤ect of euro on FDI for 21 OECD countries. They �nd that a common currency hasa positive impact on FDI within the euro area. They also �nd that impact of euro onFDI is higher in the EU peripheral countries like Greece or Italy. When they drop thesetwo countries from the sample, the e¤ect of euro on FDI decreases by 10 percentagepoints to 19 percent. However, the question whether the euro has attracted also capitalfrom the rest of the world is not addressed. Petroulas (2007), using a di¤erence-in-di¤erences approach for a panel of unilateral FDI �ows for 18 countries, tackles alsothis issue as he explores changes in FDI �ows within euro area, between euro areacountries and non-euro area countries, and between non-euro area countries, too. He
prices of production factors etc.), I �Internalization advantage (licensing, joint venture etc.).4Bloningen (2005) o¤ers a good survey of literature on FDI determinants.5Dixit (1989) theoretically models �rm�s entry and exit decisions under uncertainty and Carruth
et al. (2000) provide a complete survey of empirical literature on exchange rate volatility and FDIbased on the option theory.
5

�nds that the introduction of euro raised inward FDI �ows by approximately 16 percentwithin the euro area and by about 11 percent for non-member states. FDI �ows fromthe non-member countries into the euro area increases by 8 percent. On the same note,Schiavo (2007) estimates the e¤ect of a common currency on bilateral FDI �ows among25 OECD countries applying a gravity-type empirical model with a parsimonious setof explanatory variables. He concludes that a reduction in exchange rate uncertaintydue to the introduction of euro increases cross-country investment �ows by 160 to 320percent. An alternative speci�cation using three-year averages in order to eliminatea high variability in FDI �ows decreases the magnitude to 70 to 250 percent. Theendogeneity of FDI with respect to GDP is partly resolved by the use of �xed e¤ects.However, the wide range of the results suggests that estimates should be interpretedwith caution.The majority of mentioned papers (Sousa and Lochard 2006; Petroulas 2007; Schi-
avo 2007) use country-pair �xed e¤ects, capturing time-invariant heterogeneity betweencountry-pairs, thereby reducing concerns about endogeneity of investment �ows. How-ever, this variation includes also time-invariant observable controls (e.g. common lan-guage) and, consequently, precludes the quanti�cation of their impact separately. Thisposes a serious concern for a validity of the use of gravity model, as the model�s intuitionis built behind the incorporation of time-invariant factors like land area and distancebetween countries.Apart from examining FDI �ows using the data from balance of payments, there
are studies inspecting plant-level micro data. Buch et al. (2003) analyze the impactof euro on German data from a mandatory �rm-level survey organized by the Bundes-bank.6 They �nd that FDI from the EU signi�cantly increases after the introductionof the euro. The e¤ect is present to a smaller extent also for non-euro countries. Theadvantage of their approach is the use of reliable �rm-level data as compared to generalcapital account FDI data. However, they face the problem of using a single nation�sdata and the uncertainty that the results are driven by national asymmetric shocks.These suspicions are partly con�rmed by Petroulas (2007) who �nds that Germany andBelgium-Luxembourg act as a hub for FDI �ows of the euro area.7 Thus, the size ofthe impact of the euro on FDI �ows for individual countries seems to be ambiguous asSchiavo (2007), contrary to Petroulas (2007) and Sousa and Lochard (2006), does not�nd that any country faces higher impact of euro on its FDI �ows.Summarizing, exchange rate uncertainty has received a considerable interest in the
empirical literature on FDI in recent years. However, all papers work with the dataending by the year 2001 or 2002, and thus the question whether the euro has in�u-enced �rms�long-term investment decisions and actually their decisions on FDI hasstill remained mostly unanswered. Furthermore, since the common currency a¤ects
6In general, �rm-level studies on FDI issues are not numerous due to unavailable or insu¢ cientdata.
7After excluding Germany and Belgium-Luxembourg, most of the euro e¤ect disappears. On theother hand, if they are excluded only as a receiver country or only as an investor country, the euroe¤ect remains nearly the same.
6

international investments via various channels, we might be suspicious that some ofthese channels might need a longer period for transmission than two or three yearsafter the common currency is introduced. Therefore, our paper investigates the impactof the euro using the data on FDI �ows until 2008. It allows us to examine the e¤ectof common currency on FDI in the longer period (nine years after EMU establishment)and to shed light on foreign investor�s motivation by including countries from the latestwave of the euro area enlargement.
4 Methodology
We adopt the approach commonly used in the trade literature employing the gravity-equation model specifying trade �ows between countries as a function of the GDP ofeach country and the distance between these two countries.8 Recently, the gravityequation models have proven to be useful also in explaining international investment�ows.9 The focus is put on time-invariant exogenous and policy variables so thatendogeneity problem is eliminated. Explanatory variables such as geographic distance,cultural ties (common language) and policy changes are used. The advantage is takenfrom the fact that panel data makes it possible to analyze structural policy breaks. Inour paper, such an exogenous break is represented by the accession of a country to theeuro area.The model thus combines institutional factors with environmental factors. The tra-
ditional gravity literature (e.g., Brainard 1997) speci�es �nancial �ows between coun-tries as a function of various institutional and geographical factors. Following thisapproach, the amount of FDI �ow from a country i into a country j at time t can beexpressed as
lnFDIijt = �(ln distij; lnGDPijt; lnULCijt; EERSRijt; EERLRijt;
borderij; langij; t; EUijt; euroijt); (1)
where FDIijt is FDI �ow from a country i into a country j , dist represents the ge-ographical distance between countries, GDP stands for a product of gross domesticproducts, ULC is a ratio of exchange rate adjusted unit labor costs, EERSR standsfor a short-term exchange rate volatility and is expressed as a two-year coe¢ cient ofvariation of a ratio of countries�real e¤ective exchange rate indices, EERLR standsfor a long-term exchange rate volatility and is expressed as a �ve-year coe¢ cient ofvariation of a ratio of countries�real e¤ective exchange rate indices, border indicatesa common border, lang is a dummy indicating countries share the same language,10
t is a time trend capturing changes in FDI �ows a¤ected by aggregate factors (e.g.
8Anderson (1979) presented a theoretical foundation for the gravity model. This approach haswidely been used to inspect trade �ows between countries (e.g. Anderson and Wincoop 2003).
9Frankel and Wei (1996) �rst applied the gravity equations on FDI �ows.10In case a country has more than one o¢ cial language, it is su¢ cient if any of these languages is
shared with the second country in a pair.
7

macroeconomic factors) common to all countries, EU is a dummy indicating presenceof both countries in the EU and euro is a dummy indicating that both countries belonginto the euro area.The semi-log functional form is chosen over the linear speci�cation due to a better
�t of the model. Given the skewness of FDI data, this speci�cation leads more likely torobust standard errors (Bloningen and Davies 2004). Moreover, it reduces the weight ofoutliers with very large FDI �ows and it allows us to interpret the estimated coe¢ cientsof continuous variables as elasticities. However, this transformation is at the expenseof losing information from negative �ows.The abovementioned variables are traditional determinants of FDI �ows, each hav-
ing its economic rationale.11 The size of the two economies measured as a product oftheir GDP approximates the market potential of these countries. Empirical literature�nds that increasing size of two economies enhances FDI �ows between them. Interna-tional price competitiveness expressed by unit labor costs a¤ects FDI negatively. Animprovement in ULC may occur via increases in labor productivity or cuts in taxes andthe size of this e¤ect on FDI depends on the sensitivity of a particular type of FDI. Thesensitivity of FDI to a change in unit labor costs varies across sectors; FDI demandinghighly quali�ed labor force is not very sensitive, while FDI demanding low quali�edlabor force is very sensitive to changes in unit labor costs.12 The e¤ective exchangerate as a measure of whether a currency is appreciating or depreciating to the exchangerate against a basket of foreign currencies with whom the country trades enhances thee¤ect of exchange rate and its volatility on FDI �ows. The literature supposes negativerelation between FDI and exchange rate volatility as volatility increases macroeconomicuncertainty, thereby reducing the attractiveness of domestic assets. We distinguish be-tween short term volatility of exchange rate and long term misalignments. The distancebetween countries is another factor a¤ecting FDI location mechanism. Empirical lit-erature typically �nds that it has a negative impact on FDI �ows as greater distancebetween countries makes a foreign a¢ liation more di¢ cult to establish, manage andmonitor (Egger and Pfa¤ermayer 2001). Following the same logic, the border dummyis expected to a¤ect FDI �ows positively as common border represents smaller commu-nication costs and closer ties between countries. The e¤ect of the common language onFDI is expected to be also positive as the common language decreases communicationcosts for FDI �ows. These three variables - geographical distance, border and languageare often named as cultural distance - are proxies for time-invariant asymmetries be-tween countries which can strengthen the investment linkages between countries. TheEU membership captures the overall bene�ts of the single market on FDI �ows and isexpected to be positive. Finally, the euro dummy is pivotal for our paper as it expressesthe e¤ect of the common currency on FDI.
11Billington (1999) o¤ers summary of economic and political determinants of FDI. Chakrabarti(2001) examines the impact of the whole set of variables on FDI and checks their robustness to smallchanges in conditioning information set. Martín and Velázquez (1997) present FDI determinants forOECD countries.
12Bellak et al. (2008) investigate the e¤ect of labor costs on FDI.
8

5 Data
Annual FDI �ows data during the period 1997-2008 are used for the analysis. Theavailability of the such span presents an advantage over previously mentioned studieson FDI impact of euro, which use only a limited number of years (one to three) afterthe euro introduction. As the focus of this paper is the analysis of European FDI �ows,the main source of the data on investment �ows is Eurostat, compiling harmonized FDIfrom regulatory reports to central banks and surveys �lled by resident business units.13
It provides data on unilateral FDI �ows for each reporting country by partner country.Both FDI in�ows and out�ows are reported for 35 countries (29 OECD members and6 non-OECD countries).14 The choice of countries is motivated by the e¤ort to coverFDI �ows between the majority of European countries and their major FDI partners.Overall, the data sample consists of 589 country-pairs, providing us with an unbalancedpanel of 11,457 observations.15
One-way outward investment �ows FDIijt are used, representing investment fromcountry i to country j in period t. It can occur that FDI �ow from country i to countryj is measured in two di¤erent ways �either reported by investing country i as an out�owto country j or reported by recipient country j as an in�ow from country i. In reality,there is often a discrepancy between these two values. There is no information indicatingthat any of these values is �better�, therefore, we ameliorate this measurement errorby constructing the average of the two series.Table 4 displays the descriptive statistics of covariates for both euro and non-euro
country pairs.16 The majority of observations belongs to non-euro country pairs (10,367vs. 1,090 observations). With the exception of FDI �ows, exchange rate volatility,language and border dummy, observable characteristics for euro and non-euro pairs arenot very di¤erent. This is not surprising as most OECD Member States are developedand quite homogenous economies. More important, it suggests that the variance in FDI
13FDI benchmark de�nition, according to OECD, regards FDI as a sum of �the net sales of sharesand loans (including non-cash acquisitions made against equipment, manufacturing rights, etc.) tothe parent company plus the parent �rm´s share of the a¢ liate´s reinvested earnings plus total netintra-company loans (short- and long-term) provided by the parent company�.
14Out of a total number of 34 OECD countries, Luxemburg, Israel, Chile, Mexico and Switzerlandare omitted. Unit labor costs data for Switzerland are not available. In case of Luxemburg, balanceof payment data displays large FDI �ows associated with the favourable bank environment which isnot a primary focus of this paper. Israel, Chile and Mexico exhibit a considerable number of missingvalues on bilateral FDI �ows. Six non-OECD countries are Bulgaria, Cyprus, Latvia, Lithuania, Malta,Romania.
15Although 35 considered countries constitute 35*34/2 = 595 country-pairs, we do not possessinformation for FDI �ows between Australia, Canada, New Zealand and South Korea (6 country-pairs) for any year during 1997-2008. Out of 589 country-pairs, there is information on both FDIin�ow and out�ow during the whole period of 12 years for 191 country-pairs, the rest contains at leastone missing value. However, we have at least 20 observations for 353 country-pairs and at least 10observations for at least 567 country-pairs.
16As stated above, a pair is viewed as �euro pair�during a given period when both countries usethe euro as a currency during this period. Otherwise (when one or both countries do not use euro),the pair is referred to as non-euro pair.
9

�ows is not directly attributed to the level of GDP or distance between countries.Table 5 compares a trend of FDI for euro and non-euro pairs over time. It illus-
trates the U-shaped behavior of both groups of country-pairs, with a modest declineduring 2000-2003, indicating that time trend is not a signi�cant factor in explainingthe di¤erence in FDI �ows between euro vs. non-euro country pairs, too.The source of unit labor costs data is OECD and we construct unit labor costs
ratio as a fraction of unit labor costs in an originating country over unit labor costsin a recipient country. The source of data on GDP is the International MonetaryFund (IMF) and the real e¤ective exchange rate indices (REER) are obtained fromthe Bank of International Settlements (BIS) database.17 A short-term exchange ratevolatility is expressed as a two-year coe¢ cient of variation of a ratio of countries�reale¤ective exchange rate indices and a long-term exchange rate volatility is expressed asa �ve-year coe¢ cient of variation of a ratio of countries�real e¤ective exchange rateindices. Additional data include geographical and cultural factors such as distancebetween countries (measured as a distance between capital cities), common border andlanguage dummies.
6 Econometric Analysis
Empirical results of euro impact on FDI have been less numerous than on other issuesconcerning the impact of a common currency (e.g. trade e¤ect), mainly due to a lessdeveloped empirical methodology and a lack of data (Baldwin et al. 2008). A sim-ple OLS estimation may be potentially biased due to the self-selection of countries toadopt the euro. Therefore, after presenting OLS results, we address this shortcoming byexploiting variation in FDI �ows before and after the introduction of the euro and per-forming a Tobit estimation due to a left-censored character of the dependent variable.18
Moreover, a pivotal aspect of our paper is that we account for a potential selectionbias for euro adoption: the estimation is performed only for a comparable subset ofcountry pairs matched by propensity score matching technique. Using this approach,the analysis is based on the comparison of otherwise similar country-pairs (identi�ed bya similar propensity to share the euro), the only di¤erence being the adoption of euro.
6.1 Di¤erence-in-di¤erences estimation
A di¤erence-in-di¤erences estimation allows us to exploit policy change and estimatethe impact of euro adoption on FDI �ows. The following econometric speci�cation is
17The BIS real efective exchange rate indices are calculated as geometric weighted average of acountry�s currency relative to an index of other major currencies adjusted for the e¤ects of in�ation.
18Due to disinvestment, many FDI �ows are negative, thereby precluding a conversion into a loga-rithmic scale. These missing observation are considered as censored from the left.
10

estimated:
lnFDIijt = �1 ln distij + �2 lnGDPijt + �3ULCijt + �4EERSRijt + �5EERLRijt +
�6borderij + �7langij + �8t+ 1EUijt + 2euroijt + �ijt; (2)
where 1 and 2 are the coe¢ cients estimating the impact of the EU and the euro onFDI �ows, respectively.However, because of data nature, using simple OLS regression would bias our
estimates. Due to disinvestment, reported FDI �ow is often zero or even negativewhich imposes a serious limitations when using logarithmic form of the dependentvariable.19 In order to exploit the maximum amount of information from the avail-able dataset, data are modi�ed in a way that also observations with negative FDI�ows can be used. One possibility of data modi�cation is to perform a transformationlnFDIijt � ln(x + FDIijt), where x is a positive scalar (Gujarati 1995). However, insuch case, it would be di¢ cult to correctly interpret the parameter estimates. Alterna-tive transformation enables the adoption of the Tobit model (Tobin 1958), de�ning thedependent variable in a following way:
lnFDIijt � 0 if FDIijt � 0lnFDIijt � ln(1 + FDIijt) if FDIijt > 0:
This speci�cation of the dependent variable exhibits a left censoring threshold at zero.Tobit estimation controls for this feature of the data and yields consistent parameterestimates.
6.2 Propensity Scores Matching
A propensity score matching technique attempts to provide an unbiased estimation oftreatment e¤ects using the approximation of a counterfactual outcome despite the lackof experimental data (Rosenbaum and Rubin 1983). It allows us to match country-pairsbased on their observable characteristics and compare the potential outcomes betweencountry-pairs which share euro currency and the countries that do not. In this way,we identify a control group of country-pairs with a similar propensity of sharing eurowhich actually do not share the euro.Let FDI1ijt denote the value of FDI �ow from country i to country j in the case they
both use euro at time t and let FDI0ijt denote the level of FDI �ows from country i tocountry j in the case they do not share a common currency. The impact of adoptingthe euro is then estimated as FDI1ijt � FDI0ijt:The main problem in identifying the e¤ect of euro on FDI �ows is that FDI is ob-
served only for one scenario of the treatment variable (euroijt) and remains unobservedfor the other. One way how to solve this problem is to use similar countries selectedby some matching mechanism and use this group as an approximated counterfactual.
19Out of 11,457 observations, 1,908 report negative FDI �ows.
11

This identi�cation strategy assumes that the potential amount of FDI between coun-tries that adopted the euro would be the same as was the amount of FDI for the controlgroup that did not adopt the euro:
E(FDI0ijtjeuro = 1) = E(FDI0ijtjeuro = 0): (3)
However, it is di¢ cult to match country-pairs based on many observable charac-teristics. A more lucid way is to construct a one-dimensional metric as a matchingindicator. For this purpose, we employ a method uniting relevant observed characteris-tics into a single score known as a propensity score matching. These propensity scoresare obtained from the probit equation estimating the probability of the event that acountry-par shares the euro as a function of speci�ed independent variables.
The probability of receiving the treatment (sharing the euro) is estimated as follows:
P (euroijt = 1) = �(ln distij; lnGDPcapijt; ln areaij; langij; bordij; landlockij) (4)
where P (euroijt = 1) stands for the probability that countries i an j both use the euroat time t, dist represents the geographical distance between countries i and j, langis a dummy for the same language, bord states for a common border,landlock is anumber of landlocked countries in a country-pair, GDPcap is standing for the productof countries�GDP per capita and areaij as a product of the land mass of i and j inkm2.After estimating the probit equation and obtaining the propensity scores, a matching
algorithm is de�ned. Each treated pair, or in other words pair in which both countriesshare a common currency, is matched to one or more control pairs (depending on thematching technique) that consist of countries that do not share a common currency. Thedi¤erence in their FDI �ows serves as an estimate of the euro impact on FDI �ows. Themost common technique for matching is the nearest neighbor (NN) matching in whicheuro-pair is matched to the non-euro pair with the most similar value of propensityscore. Unmatched pairs are discarded. Afterwards, the gravity equation 2 is estimatedonly for matched country-pairs in order to estimate the impact of the euro on FDI�ows.We perform two matching speci�cations of probit equation - restricted and unre-
stricted, di¤ering by the constraint applied to the potential control group. The unre-stricted speci�cation does not constrain matched observations to be from the same year,matching a combination of a country-pair/year to control country-pair/year. In con-trast, the restricted speci�cation matches a treated country-pair to a control country-pair from the same year. Thus, we estimate an alternative speci�cation of the probitequation:
P (euroij = 1) = �(ln distij; lnGDPcapij; ln areaij; langij; bordij; landlockij); (5)
where P (euroij = 1) is the probability that countries i an j adopted the euro during1999-2008 and lnGDPcapij denotes the logarithm of GDPcap as for 1998 (prior to
12

the euro adoption). Including all observations for treated and control country-pairs indi¤erence-in-di¤erences estimation (2), this restricted speci�cation e¤ectively comparesFDI �ows from the same year (heterogeneity across country-pairs is controlled by �xede¤ects and di¤erences between years is partly captured by the trend).It is crucial to stress that the objective of the probit equation is not to build a
statistical or even a political model explaining the EMUmembership in the best possibleway. It is even possible that some relevant variables a¤ecting the euro area membershipare missing. Conversely, the close-to-perfect match would make matching more di¢ cultas there would be only few country-pair matches with a similar probability of sharingthe euro, the only di¤erence being the euro currency. The imperfect prediction of thetreatment does not present a problem as long as the omitted variables are unrelated toother FDI determinants. Summarizing, the aim is not to obtain the best �t for euromembership in probit estimation, but obtain a tool to identify and evaluate the impactof the euro introduction on FDI �ows.A propensity framework setup requires the ful�llment of some assumptions. First,
the potential amount of FDI in the case of not sharing the euro is equal for euro andnon-euro country-pairs so that the latter group can serve as an adequate control group(conditional independence assumption). This assumption is satis�ed as the explanatoryvariables FDI equation include a vast set of indicators a¤ecting FDI �ows such asdistance between countries, variable for GDP measure, unit labor costs ratio, exchangerate volatility, border and language dummies and time trend, �ltering out heterogeneityin FDI �ows caused by observable characteristics. All remaining di¤erences can beattributed to the common currency dummy. Second, country-pairs with similar valuesof the relevant covariates have a positive probability of sharing and non-sharing the euro(common support assumption). In other words, there should be no signi�cant di¤erencebetween means of explanatory variables in equation (4) for euro and non-euro country-pairs. Based on the descriptive statistics displayed in Table 4 this condition is assumedto be satis�ed. Third, FDI of a country-pairs sharing the euro is not a¤ected by anothercountry-pair�s euro or non-euro state (stable unit treatment value assumption). Here, itcan not be assumed that there are no spillovers as a particular country-pair�s assignmentinto the euro area might be a¤ected by other country-pairs�assignments.Nevertheless, we can still make some inference about the impact of the euro by
rede�ning the causal e¤ect: instead of measuring the e¤ect as �the di¤erence betweenwhat would have been observed in a world in which units received the treatment andwhat would have been observed in a world where no treatment exists�, we de�ne thee¤ect as �the di¤erence between the particular unit�s observed outcome and what wouldhave been observed had that unit received no treatment.�The average of these esti-mated unit-level e¤ects gives us the demanded estimate of the average e¤ect for thetreated. Therefore, even in the absence of the stable unit treatment value assumption,well-de�ned causal question enables an attempt at an analysis.
13

7 Results
7.1 The Gravity Model
Results for several baseline speci�cations using the full sample of country pairs are re-ported in Table 6. The �rst speci�cation is a simple OLS and the second speci�cation isTobit estimation which accounts for the left-censoring character of the dependent vari-able. The third and fourth speci�cations are augmented by country-pair �xed e¤ects,helping to control for unobserved heterogeneity among various country-pairs.Before focusing on a relationship between a common currency and FDI �ows, we
brie�y present the results for other explanatory variables. Results con�rm the ideabehind a gravity model �the product of countries�GDP has positive and signi�cantimpact on FDI �ows, indicates the link between economic strength of particular coun-tries in a country-pair and FDI �ows.20 Geographical distance between two economieshas a signi�cant negative e¤ect as expected. On the same note, common border and acommon language (measuring a cultural proximity) both exhibit a positive and signi�-cant e¤ect on FDI �ows. These �ndings con�rm the positive role of geographic factorsin FDI allocation.Unit labor cost variable indicates that the higher relative labor costs in originating
country, the higher the FDI �ow in recipient country, which is also in line with a theoret-ical proposition that investors seek cheap labor force. Finally, we �nd negative impactof exchange rate long term volatility while short term volatility remains insigni�cant.These �ndings re�ect an easier and less expensive possibility of �rms to insure againstthe risk of short term volatility by foreign exchange market instruments, meanwhile thelong run exchange rate misalignments are more costly and hardly avoidable, thereforethey have a deterrent e¤ect on FDI �ows.
7.2 EU vs. Euro impact
Following with the interpretation of the results displayed in Table 6, the main contri-bution is the segregation of the e¤ect of EU membership on FDI �ows from that of theEMU membership. In a simple OLS speci�cation, the impact of euro is estimated to bepositive. However, in more appropriate speci�cations accounting for unobserved het-erogeneity (�xed-e¤ects) or left-censoring (Tobit), this e¤ect becomes insigni�cant. Onthe contrary, the magnitude of the EU dummy capturing the bene�ts of the commonmarket remains signi�cant even with the inclusion of �xed e¤ects. As can be observedin last column, the EU membership increases bilateral FDI �ows by exp(0.732)-1 =107.9 percent.21 On the other hand, the EMU impact is insigni�cant, increasing FDI
20In our regressions we use the log of the product of the gdpijt, assuming that the coe¢ cient on"sender country GDP" should be equal to the coe¢ cient on "receiving country GDP". We also triedan estimation with a less constrained speci�cation, namely one coe¢ cient for log (gdpi) and anotherfor log (gdpj) and, the coe¢ cients were not statistically di¤erent.
21The interpretation of a dummy cooe¢ cient when the dependent variable is log-tranformed isgiven by � = 100*(exp( )-1).
14

�ows only by exp(0.138)-1 = 14.8 percent.The �ndings from the baseline speci�cations become even more robust by using the
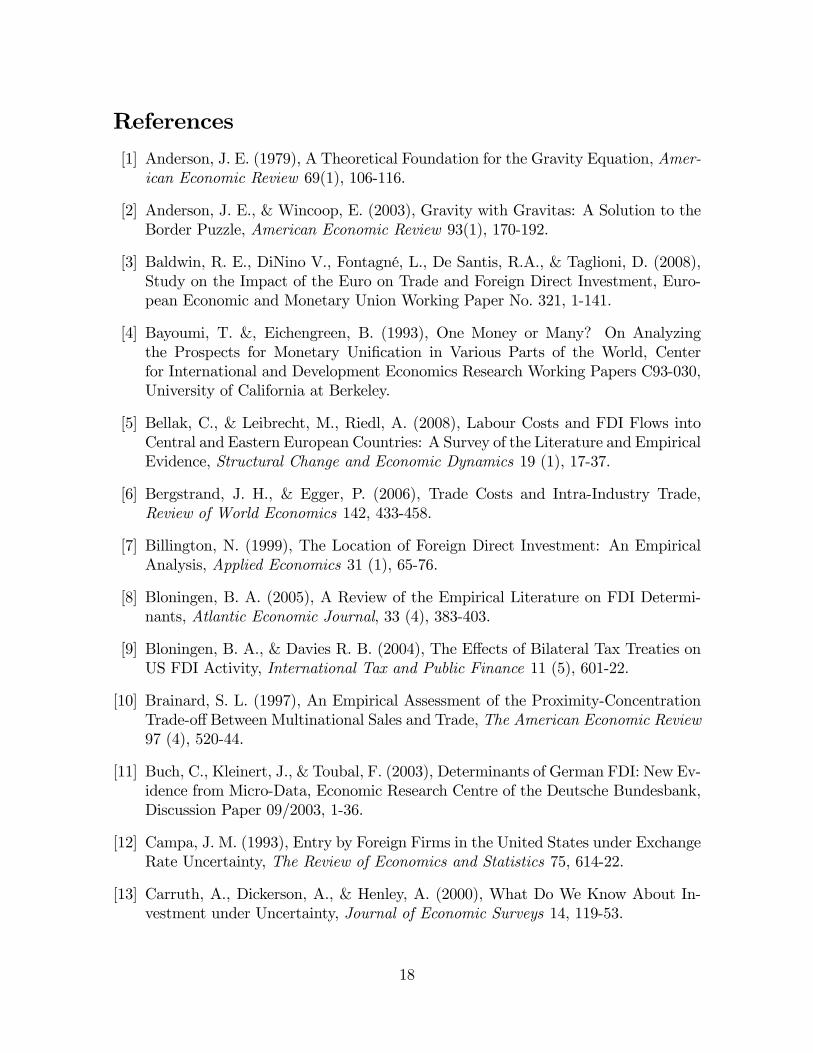
propensity score matching technique. Elaborating the analysis, the Tobit estimation isrun only for country-pairs matched by propensity score matching. Table 7 reports thecoe¢ cients for the EU and the euro variables. Under unrestricted matching (linkingcountry-pair in a particular year to other country-pairs in other years), the impact ofbelonging to the EU on FDI �ows ranges from 54.5 to 71.9 percent. In restricted-matching speci�cation (matching treated country-pair with a control country-pairs andusing this match for the whole period), this impact increases to 150.7 to 166.2 percent.On the contrary, the e¤ect of sharing the euro ranges around zero (from -5.6 to 7.4 per-cent) and is clearly insigni�cant. Smith and Todd (2004) �nd that restricted matchingestimators are more robust as they allow for time-invariant unobservable di¤erences inoutcomes between euro country-pairs and non-euro country-pairs. Thus our preferredestimator is the restricted matching estimator and the unrestricted estimates are per-formed as a robustness check. In addition, the robustness of the results is checked alsoby employing various versions of matching techniques.22
The sign and signi�cance of other estimates are similar to those from baseline spec-i�cations. In particular, long-term exchange rate volatility reduces FDI between coun-tries, high gross domestic product in both originating and target country encouragesFDI �ows, while the distance between countries and the unit labor costs gap decreaseFDI �ows.Overall, the �ndings suggest a limited impact of the common currency on FDI �ows.
Being the EU member shows to be a far more crucial factor in FDI boost. However,it should be noted that the euro adoption inherently reduces exchange rate volatility.As a result, the coe¢ cient of the euro dummy in Table 7 captures the part of the euroe¤ect on FDI not caused by reduction of exchange rate volatility.23
22We use following matching techniques: three nearest neighbours (NN3), Radius matching andKernel matching. The di¤erence among theme lies in the number of available comparasion units and,more units for matches avoid the risk of bad matches.The NN3 allows matching of euro country-pairto the weighted outcome of three nearest non-euro country-pairs. Radius matching uses not only threenearest neighbours but also equally weights all of the comparison members within the radius. Andlast Kernel matching requires that all euro-pairs are matched with a weighted average of all non-europairs where weights are calculated using a kernel function and weights are inversely proportional tothe di¤erences between propensity scores.
23Indeed, excluding short-term and long-term exchange rate volatility variables from the modelslightly increases the euro impact; however, it remains statistically insigni�cant. For the sake ofbrevity, these results are not reported.
15

7.3 Euro impact within EU
In our dataset, all countries using the euro are members of the European Union.24 Inorder to extend our analysis, we investigate the impact of a common currency solely forthe EU countries. It should be noted that the new sample does not contain countries likeU.S., Canada or Australia, which should be taken into consideration when interpretingthe estimates.Table 8 presents the e¤ect of the common currency on FDI �ows within the Euro-
pean Union. Under this baseline speci�cation, the euro dummy is signi�cant, increasingbilateral FDI �ows by exp(0.338)-1 = 40.2 percent. Table 9 shows estimates obtainedonly on the subsample of the EU countries and limited by country-pairs matched bypropensity score matching. The euro increases bilateral FDI �ows by 16.8 to 42.5 per-cent in unrestricted speci�cation and by 14.3 to 36.5 percent in restricted speci�cation.Overall, this �nding suggests that the common currency positively a¤ects FDI �owswithin a group of relatively integrated markets. These results should be viewed in thecontext of the hypothesis of endogeneity assuming that higher economic linkages amongthe members of currency union lead to the creation of optimal currency union ex post(Frankel and Rose 1998). Thus, the �ndings on the positive e¤ect of the euro on FDI�ows might indicate also a creation of closer linkages between countries.
7.4 Time dimension of the euro e¤ect on FDI �ows
The results on the link between the common currency and FDI �ows are slightly con-tradictory to the existing literature on the FDI e¤ect of the euro as most of the existingliterature �nds a positive and signi�cant e¤ect (Petroulas 2007; Schiavo 2007). Twopossible explanations of this discrepancy are of methodological and time-dimensionalnature, respectively. Firstly, the previous �ndings of a signi�cant and often huge im-pact of the euro on FDI �ows might be biased due to selection bias.25 Secondly, usingdata until 2001 or 2002, these studies su¤er from a short time span. Addressing thisissue, we explore the time dimension of the euro impact on FDI, analyzing separatelythe period 1997-2003 which corresponds roughly to the time span used in previouslymentioned studies.Table 10 o¤ers a comparison of estimates for the initial period (1997-2003) and the
full time span (1997-2008). The results reveal that the euro impact is more pronouncedin the �rst years after the launch of the euro currency (ranging from 23.7 to 54.1percent), becoming negligible only in the longer run. It should be recognized that the
24Strictly speaking, it is possible for a country to use the euro without being the EU member. Thereare formal agreements between the EU and Vatican City, San Marino and Monaco, specifying the useof the euro as a legal tendar. In addition, Montenegro and Andorra use the euro without a formalapproval.
25According to Persson (2001), within-sample estimation might be seriously biased if the countriesbelonging to existing currency union are non-randomly selected. Applying propensity matching tech-nique, he contradicts the �ndings by Rose (2000) who �nds that a currency union expands bilateraltrade between two members by 200 percent or more.
16
euro dummy covers a di¤erent set of country-pairs for di¤erent years as new countriesadopted the euro as the o¢ cial currency.The �ndings indicate a positive initial impact of the euro on FDI. However, this
e¤ect is only temporary and vanishes over the upcoming years. A possible explanationof this behavior might be a saturation of investors inclined to locate in the euro area.Arguably, it can be concluded that the common currency union impact is present in theform of one-o¤ capital reallocation of multinational companies, nevertheless, revertingto pre-euro levels in the longer run.
8 Conclusion
In this paper, we investigate the impact of the euro currency on international FDI�ows. Analyzing bilateral FDI �ows between 35 developed countries during 1997-2008,we estimate the di¤erence in FDI �ows for country-pairs sharing the euro and country-pairs with at least one country using other currency. The identi�cation strategy is basedon propensity score matching, ensuring that the control group of districts contains onlysimilar countries in terms of probability to introduce the euro.The �ndings indicate that the impact of the euro on FDI �ows is negligible (-5.6 to
7.4 percent). Interestingly, the EU membership fosters FDI much more that the euro,increasing FDI �ows by 54.5 to 166.2 (depending on the matching speci�cation).The e¤ect of the euro on FDI �ows, however, di¤ers for the sample of OECD coun-
tries and for the subsample of EU countries. In former case it does not signi�cantlyincrease FDI �ows, while in latter case it accelerates FDI �ows by 14.3 to 42.5 percent.The results suggest that the impact of the euro on FDI �ows is smaller than pre-
sented in recent literature. One reason of this discrepancy may be the use of a moreelaborated econometric technique (propensity score matching). Another reason maythe di¤erent (longer) time span used in our study. Indeed, the short time span of threeyears (used in prevous studies) shows a positive e¤ect of the euro on FDI also in oursetup. Nevertheless, considering the high variability of FDI �ows, this impact shouldbe interpreted with caution. The EU membership, being a more dominant factor inFDI attraction that the euro, also contributes to a weakening role of the euro over time.
17
References
[1] Anderson, J. E. (1979), A Theoretical Foundation for the Gravity Equation, Amer-ican Economic Review 69(1), 106-116.
[2] Anderson, J. E., & Wincoop, E. (2003), Gravity with Gravitas: A Solution to theBorder Puzzle, American Economic Review 93(1), 170-192.
[3] Baldwin, R. E., DiNino V., Fontagné, L., De Santis, R.A., & Taglioni, D. (2008),Study on the Impact of the Euro on Trade and Foreign Direct Investment, Euro-pean Economic and Monetary Union Working Paper No. 321, 1-141.
[4] Bayoumi, T. &, Eichengreen, B. (1993), One Money or Many? On Analyzingthe Prospects for Monetary Uni�cation in Various Parts of the World, Centerfor International and Development Economics Research Working Papers C93-030,University of California at Berkeley.
[5] Bellak, C., & Leibrecht, M., Riedl, A. (2008), Labour Costs and FDI Flows intoCentral and Eastern European Countries: A Survey of the Literature and EmpiricalEvidence, Structural Change and Economic Dynamics 19 (1), 17-37.
[6] Bergstrand, J. H., & Egger, P. (2006), Trade Costs and Intra-Industry Trade,Review of World Economics 142, 433-458.
[7] Billington, N. (1999), The Location of Foreign Direct Investment: An EmpiricalAnalysis, Applied Economics 31 (1), 65-76.
[8] Bloningen, B. A. (2005), A Review of the Empirical Literature on FDI Determi-nants, Atlantic Economic Journal, 33 (4), 383-403.
[9] Bloningen, B. A., & Davies R. B. (2004), The E¤ects of Bilateral Tax Treaties onUS FDI Activity, International Tax and Public Finance 11 (5), 601-22.
[10] Brainard, S. L. (1997), An Empirical Assessment of the Proximity-ConcentrationTrade-o¤Between Multinational Sales and Trade, The American Economic Review97 (4), 520-44.
[11] Buch, C., Kleinert, J., & Toubal, F. (2003), Determinants of German FDI: New Ev-idence from Micro-Data, Economic Research Centre of the Deutsche Bundesbank,Discussion Paper 09/2003, 1-36.
[12] Campa, J. M. (1993), Entry by Foreign Firms in the United States under ExchangeRate Uncertainty, The Review of Economics and Statistics 75, 614-22.
[13] Carruth, A., Dickerson, A., & Henley, A. (2000), What Do We Know About In-vestment under Uncertainty, Journal of Economic Surveys 14, 119-53.
18

[14] Chakrabarti, A. (2001), The Determinants of Foreign Direct Investment: Sensitiv-ity Analyses of Cross-Country Regressions, Kyklos 54 (1), 89-113.
[15] De Sousa, J., & Lochard, J. (2006), Does the Single Currency A¤ect FDI? AGravity-Like Approach, University of Paris, mimeo, 1-22.
[16] Delors J. (1989), Report on Economic and Monetary Union in the European Com-munity, Committee for the Study of Economic and Monetary Union, 1-40.
[17] Dixit, A. (1989), Entry and Exit Decisions Under Uncertainty, Journal of PoliticalEconomy 97, 620-638.
[18] Dunning, J. (1997), Trade, location of economic activities and the MNE: A searchfor an eclectic approach. In P.-O. Hesselborn, B. Ohlin and P.-M. Wijkman (eds.),The International Allocation of Economic Activity. London: MacMillan. 395-418.
[19] Egger, P., & Pfa¤ermayer, M. (2001), Distance, Trade and FDI: A Hausman-TaylorSUR Approach, WIFO Working Paper No. 164.
[20] Frankel, J. A., & Wei, S. J. (1996), ASEAN in a Regional Perspective, Centerfor International and Development Economics Research Working Paper C96-074,University of California at Berkeley.
[21] Frankel, J. A., & Rose A. K. (1998), The Endogeneity of the Optimum CurrencyArea Criteria, Economic Journal, 108 (449), 1009-25.
[22] Giavazzi, F., & Torres, F. (eds.) (1993), Adjustment Growth in the EuropeanMonetary Union, Cambridge University Press, 388.
[23] Gujarati, D. N. (1995), Basic Econometrics, Third Edition, McGraw-Hill College.
[24] Havranek, T., & Irsova, Z. (2010), Which Foreigners Are Worth Wooing? A Meta-Analysis of Vertical Spillovers from FDI, WP IES 2010/16, Charles UniversityPrague, Faculty of Social Sciences, Institute of Economic Studies.
[25] Harris, R., & Taylor, M. (2005), Capital Subsidies and Their Impact on TotalFactor Productivity: Firm-level Evidence from Ireland, Journal of Regional Studies45, 49-74.
[26] Javorcik, B.S. (2004), Does Foreign Direct Investment Increase the Productivityof Domestic Firms? In Search of Spillovers through Backward Linkages, AmericanEconomic Review 94, 605-627.
[27] Kleinert, J. (2001), The Time Pattern of the Internationalization of Production,German Economic Review, 2 (1), 79-98.
[28] Markusen, J., & Venables, T. (1998), Multinational Firms and the New TradeTheory, Journal of International Economics 46, 183-203.
19

[29] Martín, C., & Velázquez, F. J. (1997), The Determining Factors of Foreign DirectInvestment in Spain and the Rest of the OECD: Lessons for the CEECs, CEPRDiscussion Paper No. 1637.
[30] Persson, T. (2001), Currency Unions and Trade: How large is the Treatment Ef-fect?, Economic Policy, CEPR, CES, MSH, 16 (33), 433-462.
[31] Petroulas, P. (2007), The E¤ect of the Euro on Foreign Direct Investment, Euro-pean Economic Review 51, 1468-1491.
[32] Rose, A. K. (2000), One Money, One Market: Estimating the E¤ect of CommonCurrencies on Trade, Economic Policy 15 (30), 7-46.
[33] Rosenbaum, P., & Rubin, D. (1983), The Central Role of the Propensity Score inObservational Studies for Causal E¤ects, Biometrica 70, 41-50.
[34] Schiavo, S. (2007), Common Currencies and FDI Flows, Oxford Economic Papers59, 536-560.
[35] Smith, J., & Todd, P. (2004), Does Matching Address Lalonde�s Critique of Non-experimental Estimators?, Journal of Econometrics 125, 305-353.
[36] Tobin, J. (1958), Estimation of Relationships for Limited Dependent Variables,Econometrica 26 (1), 24�36.
20

Table 1: A timeline of the euro area enlargement
EMU membership 1997-98 1999-2000 2001-06 2007 2008 2009-10 2011Austria x x x x x xBelgium x x x x x xCyprus x x xEstonia xFinland x x x x x xFrance x x x x x xGermany x x x x x xGreece x x x x xIreland x x x x x xItaly x x x x x xLuxembourg x x x x x xMalta x x xNetherlands x x x x x xPortugal x x x x x xSlovakia x xSlovenia x x x xSpain x x x x x x
Note: Sign �x�indicates EMU membership during a particular period of time.
Table 2: World FDI �ows by recipient country
FDI �ows World Developing Transition Developed EU EMUyear bil. USD (at current prices) % % % % %1980 54 14 0 86 39 -1990 208 17 0 83 47 -2000 1382 19 1 81 49 362001 825 26 1 73 47 352002 628 28 2 70 49 392003 566 33 4 82 46 392004 733 40 4 56 29 172005 986 34 3 63 51 272006 1459 30 4 67 40 232007 2100 27 5 69 43 282008 1771 37 7 57 30 17
Source: http://unctadstat.unctad.org/
Note: According to UN methodology, countries are classi�ed as developed economies, developing
economies or transition economies. The development of a country is represented by the Human De-
velopment Index (HDI), a compound indicator integrating income per capita, life expectancy and the
rate of literacy.
21

Table 3: Annual FDI �ows to developed economies
FDI �ows Europe N. America Asia Oceania Developed Totalmil. USD (current prices)1995 137 68 2 16 2221997 155 115 5 10 2851999 532 308 16 3 8512001 395 187 8 11 6012003 280 61 10 12 3622004 218 136 11 45 4102005 509 131 8 -23 6252006 628 297 9 36 9702007 988 375 31 49 1,4442008 551 380 35 52 1,0182009 378 149 16 23 566
Source: http://unctadstat.unctad.org/
Note: North America is represented by the United States, Bermuda, Canada, Greenland, Saint Pierre
and Miquelon.
Table 4: Comparison of averages, euro vs, non-euro country-pairs (1997-2008)
euroij = 1 euroij = 0log(FDIij) 4.49 2.77log(GDPi �GDPj) 39.19 37.62log(distance) 7.14 7.84ULC ratio 1.00 1.02EER short 0.11 0.44EER long 0.03 0.07common border 0.18 0.06common language 0.09 0.05landlocked 0.18 0.24# observations 1,090 10,367
Note: Dummy euroij equals 1 if both countries in a pair use the Euro currency; otherwise it equals0. FDIij stands for FDI �ows from country i to country j in mil. USD, GDP is a gross domestic
product per capita in USD (de�ated to year 2000), ULC ratio is a ratio of exchange rate adjusted unit
labor costs in country i compared to country j, EER short is a two-year coe¢ cient of variation of a
ratio of countries�real e¤ective exchange rate indices, EER long is a �ve-year coe¢ cient of variation
of a ratio of counties�real e¤ective exchange rate indices, landlocked takes values 0, 1 or 2 according
to number of landlocked countries in a country-pair.
22

Table 5: Comparison of dependent variable means, by year
year euroij = 1 (# obs.) euroij = 0 (# obs.)1997 2.50 6791998 2.61 7111999 4.83 78 2.37 7082000 5.30 78 2.25 7932001 4.70 98 1.02 8922002 4.11 109 1.89 9482003 4.17 110 1.87 9892004 4.18 110 2.09 10262005 4.46 110 2.18 10472006 4.74 110 2.46 10602007 4.72 132 2.75 9182008 4.03 155 2.82 596
23

Table6:Baselineresults:FDIin�owdeterminants
OLS
Tobit
Fixede¤ects
Tobit(FE)
(1)
(2)
(3)
(4)
log(GDPi�GDPj)
0.602���
(0.008)
0.895���
(0.014)
0.471��
(0.220)
0.613���
(0.022)
log(distance)
-0.603���
(0.026)
-1.026���
(0.043)
ULCratio
0.872���
(0.103)
1.377���
(0.163)
0.105
(0.113)
1.449���
(0.143)
EERshort
-1.609�
(0.856)
-1.777
(1.393)
0.101
(0.733)
-0.252
(1.289)
EERlong
-1.834���
(0.636)
-4.102���
(1.042)
-0.706
(0.619)
-2.734��
(1.091)
EU
0.493���
(0.058)
0.653���
(0.090)
0.447���
(0.064)
0.732���
(0.112)
euro
0.178��
(0.080)
-0.084
(0.121)
0.124
(0.113)
0.138
(0.192)
commonborder
0.488���
(0.093)
0.344��
(0.141)
commonlanguage
1.562���
(0.095)
1.904���
(0.143)
Country-pairdummies
No
No
Yes
Yes
Observations
11,457
11,457
11,457
11,457
4,613
censor.
4,613
censor.
R2
adj.
0.401
pseudo
0.108
overall
0.319
pseudo
0.175
Note:ThedependentvariableisthelogarithmofFDI�owfrom
originatingtorecipientcountry.Unitlaborcostsratioisafractionofunit
laborcostsinoriginatingcountryoverunitlaborcostsinrecipientcountry,shortexchangeratevolatilityisatwo-yearcoe¢cientofvariationof
aratioofcountries�reale¤ectiveexchangerateindices,longexchangeratevolatilityisa�ve-yearcoe¢cientofvariationofaratioofcountries�
reale¤ectiveexchangerateindices.Timeandcountry-pairdummiesarenotreported.Standarderrorsinparentheses.Signi�cancelevels:***
1%,**5%,*10%.
24
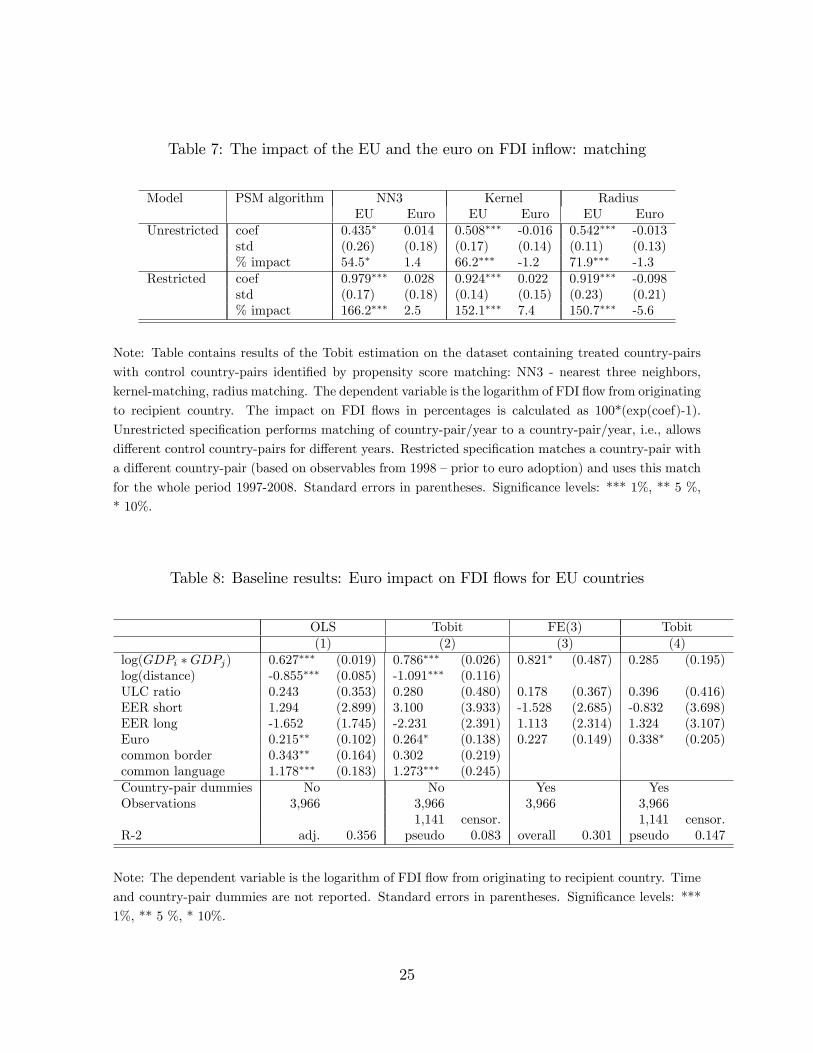
Table 7: The impact of the EU and the euro on FDI in�ow: matching
Model PSM algorithm NN3 Kernel RadiusEU Euro EU Euro EU Euro
Unrestricted coef 0.435� 0.014 0.508��� -0.016 0.542��� -0.013std (0.26) (0.18) (0.17) (0.14) (0.11) (0.13)% impact 54.5� 1.4 66.2��� -1.2 71.9��� -1.3
Restricted coef 0.979��� 0.028 0.924��� 0.022 0.919��� -0.098std (0.17) (0.18) (0.14) (0.15) (0.23) (0.21)% impact 166.2��� 2.5 152.1��� 7.4 150.7��� -5.6
Note: Table contains results of the Tobit estimation on the dataset containing treated country-pairs
with control country-pairs identi�ed by propensity score matching: NN3 - nearest three neighbors,
kernel-matching, radius matching. The dependent variable is the logarithm of FDI �ow from originating
to recipient country. The impact on FDI �ows in percentages is calculated as 100*(exp(coef)-1).
Unrestricted speci�cation performs matching of country-pair/year to a country-pair/year, i.e., allows
di¤erent control country-pairs for di¤erent years. Restricted speci�cation matches a country-pair with
a di¤erent country-pair (based on observables from 1998 �prior to euro adoption) and uses this match
for the whole period 1997-2008. Standard errors in parentheses. Signi�cance levels: *** 1%, ** 5 %,
* 10%.
Table 8: Baseline results: Euro impact on FDI �ows for EU countries
OLS Tobit FE(3) Tobit(1) (2) (3) (4)
log(GDPi �GDPj) 0.627��� (0.019) 0.786��� (0.026) 0.821� (0.487) 0.285 (0.195)log(distance) -0.855��� (0.085) -1.091��� (0.116)ULC ratio 0.243 (0.353) 0.280 (0.480) 0.178 (0.367) 0.396 (0.416)EER short 1.294 (2.899) 3.100 (3.933) -1.528 (2.685) -0.832 (3.698)EER long -1.652 (1.745) -2.231 (2.391) 1.113 (2.314) 1.324 (3.107)Euro 0.215�� (0.102) 0.264� (0.138) 0.227 (0.149) 0.338� (0.205)common border 0.343�� (0.164) 0.302 (0.219)common language 1.178��� (0.183) 1.273��� (0.245)Country-pair dummies No No Yes YesObservations 3,966 3,966 3,966 3,966
1,141 censor. 1,141 censor.R-2 adj. 0.356 pseudo 0.083 overall 0.301 pseudo 0.147
Note: The dependent variable is the logarithm of FDI �ow from originating to recipient country. Time
and country-pair dummies are not reported. Standard errors in parentheses. Signi�cance levels: ***
1%, ** 5 %, * 10%.
25

Table 9: The impact of the euro on FDI in�ow for EMU countries: matching
Model Matching algorithm NN3 Kernel RadiusEuro Euro Euro
Unrestricted coef 0.354� 0.155 0.238�
std (0.18) (0.15) (0.14)% impact 42.5� 16.8 26.9�
Restricted coef 0.311� 0.134 0.234std (0.17) (0.15) (0.20)% impact 36.5� 14.3 26.4
Note: The table contains results of the Tobit estimation on the dataset containing EU countries
during 1997-2008. The dependent variable is the logarithm of FDI �ow from originating to recipient
country. Alternative PSM algorithms are used: NN1 - nearest neighbor, NN3 - nearest three neighbors,
kernel-matching, radius matching. The impact of the euro on FDI �ows in percentages is calculated
as 100*(exp(coef)-1). Unrestricted speci�cation performs matching of country-pair/year to a country-
pair/year, i.e., allows di¤erent control country-pairs for di¤erent years. Restricted speci�cation matches
a country-pair with a di¤erent country-pair (based on observables from 1998 �prior to euro adoption)
and uses this match for the whole period 1997-2008. Standard errors in parentheses. Signi�cance
levels: *** 1%, ** 5 %, * 10%.
Table 10: The impact of the euro on FDI in�ow: matching by time period
Model PSM algorithm NN3 Kernel Radius1997-2003 coef 0.280 0.213 0.432�
std (0.24) (0.20) (0.26)% impact 32.3 23.7 54.1
1997-2008 coef 0.024 0.071 -0.058std (0.17) (0.15) (0.21)% impact 2.5 7.4 -5.6
Note: The table contains results of the Tobit estimation with the logarithm of FDI �ow from originating
to recipient country as a dependent variable. Alternative PSM algorithms are used: NN1 - nearest
neighbor, NN3 - nearest three neighbors, kernel-matching, radius matching. The impact of the euro on
FDI �ows in percentages is calculated as 100*(exp(coef)-1). The speci�cation matches a country-pair
with a di¤erent country-pair (based on observables from 1998 �prior to euro adoption) and uses this
match for the whole period. Standard errors in parentheses. Signi�cance levels: *** 1%, ** 5 %, *
10%.
26