Embed Size (px)
Citation preview
Proceedings of The 7th Annual International Conference (AIC) Syiah Kuala University and The 6th International
Conference on Multidisciplinary Research (ICMR) in conjunction with the International Conference on Electrical
Engineering and Informatics (ICELTICs) 2017, October 18-20, 2017, Banda Aceh, Indonesia
34
Currency Demand Approach and Underground
Economy in Qatar 1*Jauhari B. Dahalan, and 2Awadh Ahmed Mohammed Al-Gamal
1Universiti Kuala Lumpur Business School, Malaysia; 2School of Economics, Finance and Banking, University Utara Malaysia, Malaysia;
*Corresponding author: [email protected]
Abstract
The growth of the underground economy has become a serious
challenge and concern to the official economy of many countries.
Based on the adjusted currency demand function this paper estimates
the magnitude of the underground economy behind tax evasion in
Qatar over the period of 1980-2010. The results show that the average
of the underground economy in Qatar constitutes 17.03% of the
official GDP. While, the average of the tax evasion as a percent of the
total non-oil tax revenues estimated at 16.50% and at 2.12% of the
official GDP respectively.
Keywords: tax evasion, underground economy, gdp, tax revenues,
Qatar.
Introduction
The research on underground economy has received a considerable attention among
the economists over the world (Torgler & Schneider, 2009). This is due to its impact
on macroeconomic variables (Trebicka, 2014). The extent and magnitude of the
activities of the underground economy differ from country to country (Asiedu &
Stengos, 2014; Putniņs & Sauka, 2011).
Due to the concealed nature of the underground activities, various methods have
been used to measure its size as no official data is available or can be collected
(Schneider & Savasan, 2007). Thus, it is difficult to obtain an accurate estimation
about the true size of the underground economy, either in emerging or advanced
economies (Torgler & Schneider, 2009; AnaMaria, 2013). Nevertheless, many
studies have been conducted for the developed countries (Schneider, 2006;
Schneider & Enste, 2000; Schneider & Klinglmiar, 2005; Feld & Schneider, 2010;
Dreher & Schneider, 2010; Schneider, Buehn, & Montenegro, 2010) and very few for
developing countries (Schneider et al., 2010; Schneider & Klinglmiar, 2005).
Qatar, a member of the GCC countries is also experiencing growing activities of the
underground economy. Financial restrictions for sending money out of the country
by the foreign workers contribute to the use of illegal means to send their money to
their home countries (Naufal & Termos, 2010). Foreign workers in Qatar are not
allowed to transfer money that exceeds their total salaries received for the period of
six months. The tight regulations imposed on the foreigners in Qatar have forced
them to use relatives and friends or unlicensed financial intermediaries to send
money home (Shah, 2009; Naufal & Vargas-Silva, 2010). According to Shah (2010),
the illegal transfers of money from the country to abroad is predominantly practiced
Jauhari B. Dahalan and Awadh Ahmed Mohammed Al-Gamal
35
among illegal workers. By resorting to illegal channels, they avoid paying taxes and
higher processing fees (Naufal & Vargas-Silva, 2010).
Applying MIMIC model which is based on currency demand approach Schneider et al.
(2010) found that the weighted average volume of the underground economy (as a
percent of official GDP) in Qatar was 14.4%. The estimation is considered as weak
and biased because of the assumption of equal velocity of money in both
underground and formal economies (Ahumada, Alvaredo and Canavese; 2009).
Therefore, the main drawback of the study is that the estimated coefficients are
biased and unreliable. In the same vein, the estimated values may bring about a
meaningful understanding of the actual phenomenon of the underground economy in
Qatar.
By employing the Adjusted Currency Demand Approach (Ahumada, et al.; 2009) the
study aims to measure the extent of the underground activities through a behavioral
pattern of financial variable (example; tax burden). This study looks at the outflow
of money and the activities of the underground economy in the Qatari economy.
The organization of this paper is as follows: Second section introduces an overview
of Currency Demand Approach Evolution. The third section describes the
methodology behind the model specification. In the fourth section, the results of the
empirical analysis will be presented. The last section introduces the conclusion with
the contribution.
Literature Review
The currency demand approach as a proxy to estimate the magnitude of the
underground economy is based on the assumption that money in terms of cash is
used to perform the transactions that were concealed from the authorities (Breusch,
2005; Ahumada et al., 2008). Unlike transactions in other form of assets that are
documented in financial institutions and easily traced (AnaMaria, 2013), these
transactions are hard to trace as they leave no observable tracks (Ahumada et al.,
2009; Agbi, 2014). Therefore, an increase in the size of underground activities in the
economy can be linked to an excessive use of cash (Berger, Pickhardt, Pitsoulis,
Prinz, & Sarda, 2014). If the amount of cash used to undertake illegal transactions
can be estimated, then this amount could be multiplied by the income elasticity of
money to obtain a measure of the volume of the underground economy (Ahumada
et al., 2007).
According to Schneider (2006), Cagan (1958) used currency demand approach to
link the increased in money and the tax burden to the underground activities in the
U.S. over the period of 1875 -1955. Applying the same approach, Gutmann (1977)
estimated the size of the underground economy in the US over the period of 1937-
1976 based on four fundamental assumptions (Fethi et al., 2006). First, the tight
regulations and higher rate of tax burden forcing individuals to engage in
underground economic activities (Gerxhani, 2004; Schneider et al., 2010). Second,
cash is the only used as a medium to perform the concealed transactions in the
underground economy, and the excessive use of cash is an indication of the
expansion of the underground economic activities and tax evasion (Schneider, 2012;
Schneider & Buehn, 2013). Third, the magnitude of the underground economy can
be estimated based on the sample size of money demand over time (Fethi et al.,
2006). Finally, the income elasticity of money (money velocity of income) is
assumed to be the same in both economies (formal economy and underground
economy). Then, the volume of the underground economy is calculated by
multiplying the velocity of money with the value of illegal money that can be used to
perform illegal activities (Ahmed & Ahmed, 1995; Breusch, 2005; Ahmed & Hussain,
2008).
Proceedings of The 7th Annual International Conference (AIC) Syiah Kuala University and The 6th International
Conference on Multidisciplinary Research (ICMR) in conjunction with the International Conference on Electrical
Engineering and Informatics (ICELTICs) 2017, October 18-20, 2017, Banda Aceh, Indonesia
36
Cagan’s approach has also been employed by Tanzi (1980, 1982, 1983) for the US
economy. The basic idea of Tanzi was to form a link between the ratios of money
demand in relation to soared rates of the tax burden (Ahumada et al., 2009).
Consequently, this was used to obtain new estimates of the volume of the
underground economy for the US (Dell’Anno & Halicioglu, 2010).
Ferwerda et al. (2010) stated that Tanzi (1983) proposed his basic regression model
for the currency demand and concentrated on the possible conventional causes or
normal causes of raising tax burden and other causes of making agents to engage in
the underground economy. In his model, the main factors included were the ratio of
cash holdings to current and deposit accounts, a weighted average tax rate, a
proportion of wages and salaries to the national income, the interest paid on savings
deposits and the per capita income (Fethi et al., 2006; Ferwerda et al., 2010). Using
currency demand function, the size and the growth trend of the underground
economy can be estimated as the difference between the estimated volume of
money or currency without tax variable i.e. fiscal variable or taxation variable; and
the volume of actual currency with tax variable (Ahmed & Hussain, 2008). The
process captures the estimation of extra volume of money that was assumed as
money hold by agents for their transactions in the underground economy (Dell’Anno
& Halicioglu, 2010).
Next, we assume that the income velocity of money (currency) is the same and its
uses in the underground economy for legal demand for money, M1 in the official
economy. Then, the volume of the underground economy can be calculated and then
it also can be compared to the official statistics of GDP (Schneider & Klinglmiar,
2005). The method of currency demand is the most widely employed method in the
study of the underground economy (Amin, 2008). It has been applied to measure
the magnitude of the underground economy through an excessive use of money in
terms of cash in many countries in the world (Hernandez, 2009). For example, it
was applied in the studies on the U.S., Tanzania, Italy, New Zealand, Spain, Mexico,
South Africa, Peru, Pakistan, Ghana, Ethiopia, Romania, Canada, Turkey, and
Colombia. Nonetheless, some questions have been raised regarding some aspects of
currency demand approach (Schneider & Hametner, 2014). First, not all
transactions in the underground economy are using cash. Therefore, the total size of
the underground economy (including transactions in the form of barter) may be
larger than the one previously estimated (Schneider, 2006).
Second, only the financial variable such as tax burden was considered as a main
cause of the underground economy (Schneider & Hametner, 2014; Schneider &
Savasan, 2007). Meanwhile, other variables which may also contribute to the
underground economy such as the tight regulation, and taxpayers’ behavior toward
the authority were ignored. Although lacking in the reliable data for the majority of
the countries in the study, however these neglected variables may show a larger
size of the underground economy (Schneider & Hametner, 2014). Third, the studies
that were conducted using the currency demand approach to measure the extent of
the underground economy were built on the assumption that the velocity of money
has the same value in both economies (Alexandru & Dobre, 2011).
As claimed by Ahumada et al. (2007), the assumption is only commensurate if the
income elasticity of money is one which is not the case with the previous studies.
Therefore, the estimation of the underground economy should be adjusted as
suggested by Ahumada et al. (2007: 2009). Finally, the method assumes that there
are no illegal activities of the underground economy in the base year of the study’s
period. Where the assumption remains vulnerable to criticism, shirking this
assumption nevertheless will require adjustment on the size of the underground

Jauhari B. Dahalan and Awadh Ahmed Mohammed Al-Gamal
37
economy, and as a result the estimated size of the underground economy could be
larger than that volume reported (Schneider & Buehn, 2013).
Research Method
Model Specification
Following the literature, the currency demand model is based on the recent model of
currency demand approach of Ahumada et al., (2009) where the coefficient of
income elasticity for money in the long run is not equal to one as in the previous
studies. The model is expressed as follows:
( )1 2 3
0 1 ...............(1)i th
t t t tM TR G Rem exp
Where M1t is the currency in circulation plus demand deposits at time t as the
dependent variable, TRt is the total non-oil tax revenues over all the economy at
time t excluding the receipts of oil revenues, Gt is the nominal Gross Demostic
Product at time t, REMt is the outflow of money that is remitted by the foreign
workers to their home countries at time t, ht in equation (1) represents the
opportunity cost of holding money it, which is interest rate on deposits over a period
t, and t is the inflation rate at time t, i.e. ht = (it + t), α0 is a constant, and t is
the error terms.
By taking natural logarithms of both sides of equation (1), and substituting for th
.
The estimable model of currency demand function in equation (1) is now
transformed into a linear form:
0 1 2 3 1 2..........................(2)1
t t t t t t tlnM lnTR lnG lnRem i
All variables are in nominal term, and the expected signs for the parameters of the
explanatory variables in the equation (2) are as follows:
1 2 3 1 2, 0, ., , 0
Zivot and Andrews (1992) Unit Root Test
The procedure of Zivot and Andrews (1992) unit root will be conducted in order to
capture strong inferences about the order of integration of the variables in the
currency demand function model of Qatar. A spurious finding in the presence of the
structural break, and a sharp reduction in power of the properties of a series has
been argued to be attributed to the usual ADF test (Gregory, Nason & Watt, 1996;
Gregory & Hansen, 1996). Therefore, Zivot-Andrews‘s (1992) unit root test as one
of the widely acclaimed unit root tests that takes into consideration the presence of
structural break in the series is employed. The test allows for only one time break in
each tested variable, in which case, the time break point is endogenously estimated
at unknown point as it occurs at time t. The test consists of three models as follows:
Model (A): the change in the level shift or intercept of series at unknown time break
point, :
1
1
ˆˆ ˆ ˆˆ ˆ ...........................(3)k A
A A A A A
t t b t i t i tti
Y DU d T Y C et D Y
Model (B): the change in the slope of series in the trend function occurring at
unknown time break point, :
Proceedings of The 7th Annual International Conference (AIC) Syiah Kuala University and The 6th International
Conference on Multidisciplinary Research (ICMR) in conjunction with the International Conference on Electrical
Engineering and Informatics (ICELTICs) 2017, October 18-20, 2017, Banda Aceh, Indonesia
38
*
1
1
ˆ ˆ ˆˆ ˆ ...............................................(T 4)k B
B B B B
t t t i t i t
i
t DY Y C Y e
Model (C): the change in the level shift and in the slope of series with trend
occurring at unknown time break point, :
*
1
1
ˆˆ ˆ ˆ ˆˆ ˆ .............(T 5)k C
C C C C C C
t t t b t i t i tti
Y DU d T Yt D D C Y e
Where tDU
in equations (3) and (5) is a dummy variable for level shift at each time
a break occurs, while *
Tt
Din both equations (4) and (5) is a dummy variable
representing change that occurs in the trend. The dummy of1
tDU
if bt T
, or 0 if
bt T
, while the dummy of *
Tt b
TD t if b
t T, or 0 if b
t T. Where b
Tis the date at
which structural break takes place. The guideline for choosing the date of a
structural break is by selecting the minimum value of the t-statistics for testing the
null of1ˆ ( 1)
for the whole models. f the t-statistics is less than its critical
values at all levels of significance, it implies that the included variable has a unit root
or non-stationary with one structural break point. If the t-statistics is greater than
its critical value, it implies that the variable under test has no unit root with one
break point or stationary with one break. Since rejection of null does not mean
rejection of a unit root itself, but would imply rejection of unit root without a break
(Lee & Strazicich, 2003). The critical values are provided by Zivot and Andrews
(1992), while the optimal number of lag length will be based on Akaike Information
criterion (AIC).
Gregory and Hansen Cointegration Test
Gregory and Hansen’s (1996) cointegration test is an extension of Engle-Granger
(1987) technique of cointegration test. It is applied to investigate the long run
relationship between currency demand function and its determinants in the presence
of a possible structural break (Singh & Pandey, 2012; Banafea, 2014). The test is a
residual-based approach to test the null hypothesis of no cointegration against the
alternative hypothesis of cointegration with one unknown structural break (Gregory
& Hansen, 1996; Kumer, Webber & Fargher, 2013). It allows for I(1) variables over
all the system at one unknown time break point (Omotor, 2011). The determination
of a potential unknown break point is endogenously estimated, since the time break
point is unknown (Gregory & Hansen, 1996). Gregory and Hansen (1996a) have
presented three models that allow to test the null against alternative hypothesis of
long run relationship taking into account the existence of structural break in the
cointegrating relationship.
Model (1): the possible structural change in the level shift at unknown time break
point, as:
1 2 1......................................................................................(6)
t tk t tY DU X e
Model (2): the possible change in the level shift with trend at unknown time break
point, as:
1 2 3 1..............................................................................(7)
t tk t tY DU X et

Jauhari B. Dahalan and Awadh Ahmed Mohammed Al-Gamal
39
Model(3): the possible change in the regime shift or full break where both the level
shift and the slope coefficients change at unknown time break point, as:
1 2 1 2...................................................................(8)
t tk t t t tY DU X X DU e
Where tY
the dependent variable of cointegrating system is, tX
is independent
variable, t is a time trend. 1
represents the intercept before the level change, while
2
denotes the change in the intercept at a time break. 1
represents the
cointegrating slope coefficients before time break occurs, while 2
denotes the
change in the slope coefficients of the cointegrating system after time break occurs,
t is the time subscript and te
is an error term.
In all these three models, 1
tkDU
if t k and 0
tkDU
if t k , where k is the break
time point at which break occurs. The time break dates are achieved by an
estimation of the cointegrating systems for all possible break dates. The time break
date is chosen at a value that minimizes the t-statistics or at which absolute value
of the test t-statistic is at its maximum compare to its critical values provided by
Gregory and Hnsen (1996) using Monte Carlo experiments. The number of optimal
lag length will be chosen automatically based on the criteria of Schwartz Bayesian
information criterion (BIC), Akaike Information criterion (AIC) and t-test criterion
(TTC)1. The three models above in equations (6), (7) and (8) are extended to test
the cointegration relation for all the variables that are included in the currency
demand function of Qatar. The new models can be expressed as follows:
Model (1): cointegration equation with level shift dummy as:
1 2 1 2 3 4 5................1 ( ...(9))
t tk t t t t t tlnM DU ln TR lnG lnRem i
Model (2): cointegration equation with level shift dummy and trend as:
1 2 1 1 2 3 4 5.........(11 ( ) 0)
t tk t t t t t tlnM DU ln TR lnG lnRem it
Model (3): cointegration equation with regime shift dummy (full break) where both
the level shift and the slope coefficients change as:
1 2 1 1 11 2 22 3 33
4 44 5 55..................................
1 ( ) (
............................................(1
)
1)
t tk t t tk t t t t tk
t t tk t t tk t
lnM DU ln TR ln TR DU lnG lnG lnRem lnRem DU
i i
t
DU DU
The choice of the best model to investigate the long run relationships between
currency demand and its determinants will be based on the model that is consistent
with the theory and passes the diagnostic tests. However, the residuals obtained
should be tested for its stationary in level as introduced by Engle-Granger (1987).
This is in order to realize a robust inference on the cointegrating relationship.
1 The econometric software, RATS version 8.1 package will be used to perform the test of Gregory and Hansen’s (1996) cointegration test.

Proceedings of The 7th Annual International Conference (AIC) Syiah Kuala University and The 6th International
Conference on Multidisciplinary Research (ICMR) in conjunction with the International Conference on Electrical
Engineering and Informatics (ICELTICs) 2017, October 18-20, 2017, Banda Aceh, Indonesia
40
Short Run Estimation and Diagnostic Tests
In this paper the dynamic short run Error Correction Model (ECM) will be constructed
based on the LSE-Hendry method called the General to Specific (GETS) approach as
explained by Rao, Singh and Kumar (2010). To do this, the currency demand
function in its first adjustment in Equation (2) is transformed into the following
form:
0 1 2 3 1 2[ ( )].......1 .1 ) (1 )( 2
t t t t t t tlnM lnM ln TR lnG lnRem i
Where refers to an adjustment coefficient of ECM. It should be negative, less than
one and significant. This is due to the fact that the demand for currency can
fluctuate in the current time period as a result of the changes in its determinants.
The independent variable that may interpret the behavior of currency demanded can
also change in the current and past time period. Thus, equation (12) will be re-
written in a more general accurate specification as follows:
1
0 1 2 3 1 2
1 1
1 1 1
[ ( )]
...................................................
1 1 ( )
( )
1
t t t t t t t
n n n
i t j i t j i t j
i i i
n n n
i t j i t j i t j
i i i
lnM lnM ln TR lnG lnRem i
ln TR lnG lnRem
i lnM
.............(13)
Where the difference operator, and the term is 1
t jlnM
describes the changes in
the lagged dependent variable. The term ECM is the difference between the actual
and estimated currency demand at time , which is included in the equation (13)
in order to introduce most capable fit of general dynamic specification of the
adjustment process. In line with this technique, equation (13) will be estimated
using OLS and the insignificant lagged variables will be discarded till the last fitted
version of the adjustment model of the short run dynamic error correction is
obtained.
In essence, the short run error correction model will be obtained based on the
estimation of the equation (13). Hence, the dependent variable of currency demand
is regressed on its lags, its own determinants with their current and lagged terms
and the one period lagged residuals that are obtained from the cointegrating
equation which were determined by Gergory and Hansen’s (1996) methodology (see
Singh & Pandey, 2009; Rao & Kumar, 2009; Omotor, 2011; Dritsakis, 2012; Kumar
& Webber, 2013; Kumar, Webber & Fargher, 2013). The final version of short run
dynamic error correction model will be tested for normality, serial correlation,
functional form (for model misspecification), heteroscedasticity of the residuals and
the stability test of currency demand function using Cumulative Sum of Recursive
Residuals (CUSUM) and Cumulative Sum of Squares of Recursive Residuals
(CUSUMSQ) tests.
Estimation of the Underground Economy
Following Ahumada et al (2009), Ahmed and Hussain (2008) and Macias and
Cazzavillan (2009), the analysis of the underground economy in the Qatari economy
is conducted. For each year over the study’s period, the predicted values of the
currency demand function will be derived first with the tax revenues variable
( ̂ ) and in the second time, the predicted values of the currency demand
Jauhari B. Dahalan and Awadh Ahmed Mohammed Al-Gamal
41
function will be derived without tax revenues variable ( ̂ ). The difference
between these two predicted values is multiplied by the actual total value of money
outside banks M1 over the period to give the level of illegal currency. The illegal
money to demand currency ratio for each year will be formulated as follows:
Illegal money ( ) = [(ln ̂ )-(ln ̂ )]…………………….…….. (`14)
Assuming that the total money in the economy can either be used for legal or illegal
transactions, the true legal money in the economy is computed by taking the
difference between total actual money outside banks M1 and illegal money .
Mathematically, this can be expressed as follows:
Legal money ( ) = [M1 ( )]…………………………………….… (15)
The most essential part of this paper is that its process of estimation will be
subjected to the conditions suggested by Ahumada et al (2009) in estimating the
volume of the underground economy. According to Ahumada et al. (2007) and
based on the currency demand approach to estimating the underground economy,
the velocity of income elasticity of money demand is an empirical issue and its
calculation reflects both formal and informal transactions in the economy. Thus, the
values of the velocity must be known prior to the estimation of underground
economy (Macias & Cazzavillan, 2009). The velocity of money in the economy of
Qatar is mathematically expressed as:
...............................................................................................(16)M1 (IM1 )
t
t
VGDP
Equation (16) is used to capture an estimation of the underground economy,
whereas the size of the underground economy in the Qatari economy over the
period 1980-2010 can be obtained by multiplying illegal money by the velocity of
money as follows:
The underground economy = * V ……………………………… (17)
The paper assumes that the coefficient value of (Income elasticity of money
demand) is different from 1. So, in this paper the estimation of predicted values of
the underground economy is corrected using the suggested method by Ahumada et
al (2007). This is shown below as follows:
1 1
( ..............................(
( ) ) 8
1
)
t t t
t t t
Underground Illegal Currency Underground
Official GDP Legal Currency OfficialGDP
Equation (18) corrects the estimation of the underground economy when the
coefficient of income elasticity is not equal to one which is the expected case in this
study2. Ahumada et al. (2007) prove that it is wrong to assume the equality of the
velocity of money using currency demand function in estimating the underground
economy under the hypothesis that the coefficient of income elasticity is equal to
one. Finally, the total tax evasion in the Qatari economy (for each year over the
period of this study) is obtained by multiplying the estimates of the underground
economy by the ratio of total tax revenue to the GDP. This can expressed as follow:
2 See appendix A: an aggregation framework for a suggested correction in estimating the underground economy.

Proceedings of The 7th Annual International Conference (AIC) Syiah Kuala University and The 6th International
Conference on Multidisciplinary Research (ICMR) in conjunction with the International Conference on Electrical
Engineering and Informatics (ICELTICs) 2017, October 18-20, 2017, Banda Aceh, Indonesia
42
Re
* t
t
t
Total Tax venueTax Evasion TE UE
GDP
(19)
Results and Discussion
Analysis of the Underground Economy in Qatar
Based on the estimated GH-2 model, Table 5 provides estimates of the size of the
underground economy in Qatar over the period of 1980-2010. The results introduce
that the underground economy in the Qatari economy grew from about R.Q4,839
billion in 1980 to R.Q71,908 billion in 2010. As a percentage of GDP, the average
size of the underground economy constitutes 17.03% of the official GDP over the
study’s period. It was 16.90% of the official GDP in 1980 and 15.51% of the official
GDP in 2010. As can be shown in Table 5, the average size of the underground
economy in Qatar is greater than that average size, as reported by Schnieder et al.
(2010).
From the results, the magnitude of the underground economy as a percent of the
official GDP has been steadily increasing since 1980 to the end of 2010, excluding
the year 1998s. This is because the average was at its peak point of 18.14% of the
official GDP. The statistics of Table 5 indicate that the underground economy in the
Qatari economy has increased significantly since 1980. The development of the
trend for the underground economy in Qatar is less compared to some other Asian
and African developing countries such as Bangladesh, Malaysia, Morocco, Guyana,
Tanzania, Malawi, Ethiopia. However, the rank of the underground economy in the
Qatari economy itself is relatively bigger than its official economy.
Table 5. Estimates of illegal money, underground economy and tax evasion in
Qatar based on the GH-2 model over the period of 1980-2010. Year Legal Money
(Bil. of RQ) Illegal Money (Mil.of RQ)
Velocity of Money
Underground Eco. (Bil. of RQ)***
Under-ground Eco. (% of GDP)
Tax Evasion (Mil. of RQ)
Tax Ev. (% of GDP)
1980
1981 1982 1983 1984 1985 1986 1987 1988 1989 1990 1991 1992 1993 1994 1995 1996 1997 1998 1999 2000 2001 2002 2003 2004 2005 2006
1,680,211,724
2,506,016,183 2,800,476,372 2,705,612,955 3,062,021,239 2,949,538,444 3,300,653,900 3,524,488,249 2,510,161,208 2,493,708,481 2,974,347,065 2,651,476,047 2,917,861,117 3,106,132,111 2,856,341,752 2,707,908,563 2,833,110,305 2,998,384,624 3,047,351,134 3,047,950,312 3,243,051,926 6,899,122,911 8,805,002,450 11,596,854,908 14,481,574,996 23,819,178,351 31,767,705,818
593,868,276
897,083,817 994,363,629 918,897,045 1,072,478,761 1,067,161,556 1,186,526,100 1,253,871,751 888,368,793 908,981,519 1,080,702,935 977,213,953 1,071,918,883 1,148,167,889 1,053,958,248 1,012,191,437 1,051,889,695 1,132,115,376 1,168,948,866 1,130,749,688 1,205,848,074 2,511,114,089 3,228,558,550 4,198,553,092 5,338,949,004 8,603,009,649 11,479,338,182
1.51
1.50 1.48 1.45 1.46 1.47 1.45 1.44 1.47 1.48 1.48 1.49 1.49 1.48 1.49 1.50 1.50 1.52 1.52 1.52 1.54 1.48 1.47 1.46 1.47 1.45 1.45
4,838,740,199
5,374,857,995 4,701,512,021 3,854,416,034 4,114,358,476 3,914,769,617 3,220,739,710 3,424,684,406 3,760,665,993 4,149,279,580 4,667,545,738 4,440,131,206 4,894,656,642 4,622,429,171 4,748,743,098 5,286,879,341 5,820,138,795 7,314,518,024 6,772,382,737 7,853,926,746 11,117,391,485 10,752,437,850 11,912,047,900 14,183,766,508 19,213,438,575 25,272,329,461 35,076,201,265
16.9
17.05 17.00 16.37 16.86 17.48 17.51 17.27 17.11 17.57 17.42 17.72 17.59 17.74 17.69 17.85 17.65 17.79 18.14 17.41 17.20 16.84 16.90 16.56 16.66 16.13 15.93
189,621,972
345,060,188 336,478,098 154,883,936 292,172,718 492,885,559 496,602,939 441,019,879 288,992,430 473,681,307 530,656,337 607,470,058 629,066,775 747,751,089 665,881,923 787,267,068 729,458,830 102,717,007 1,386,406,274 764,134,790 833,726,973 1,212,344,105 1,756,623,147 1,816,372,513 3,123,696,041 3,445,332,188 4,553,687,612
0.66
1.09 1.22 0.65 1.20 2.20 2.70 2.22 1.31 2.01 1.98 2.42 2.26 2.87 2.48 2.66 2.21 2.50 3.71 1.69 1.29 1.90 2.49 2.12 2.71 2.20 2.07
Jauhari B. Dahalan and Awadh Ahmed Mohammed Al-Gamal
43
2007 2008 2009 2010
38,387,658,678 49,204,626,155 51,970,173,967 64,302,127,030
14,113,014,322 18,101,079,845 19,422,636,033 23,276,425,970
1.46 1.47 1.46 1.45
46,437,971,881 66,262,269,945 57,464,800,305 71,908,106,879
16.04 15.83 16.18 15.51
7,556,107,930 9,657,497,306 13,967,251,310 9,162,547,145
2.61 2.31 3.93 1.98
Sources: From the authors’ compilation based on the estimated coefficients of the
currency demand model of Qatar.
*** refers to the estimates of the underground economy are corrected based on the
correction condition, which was introduced by Ahumada et al. (2009).
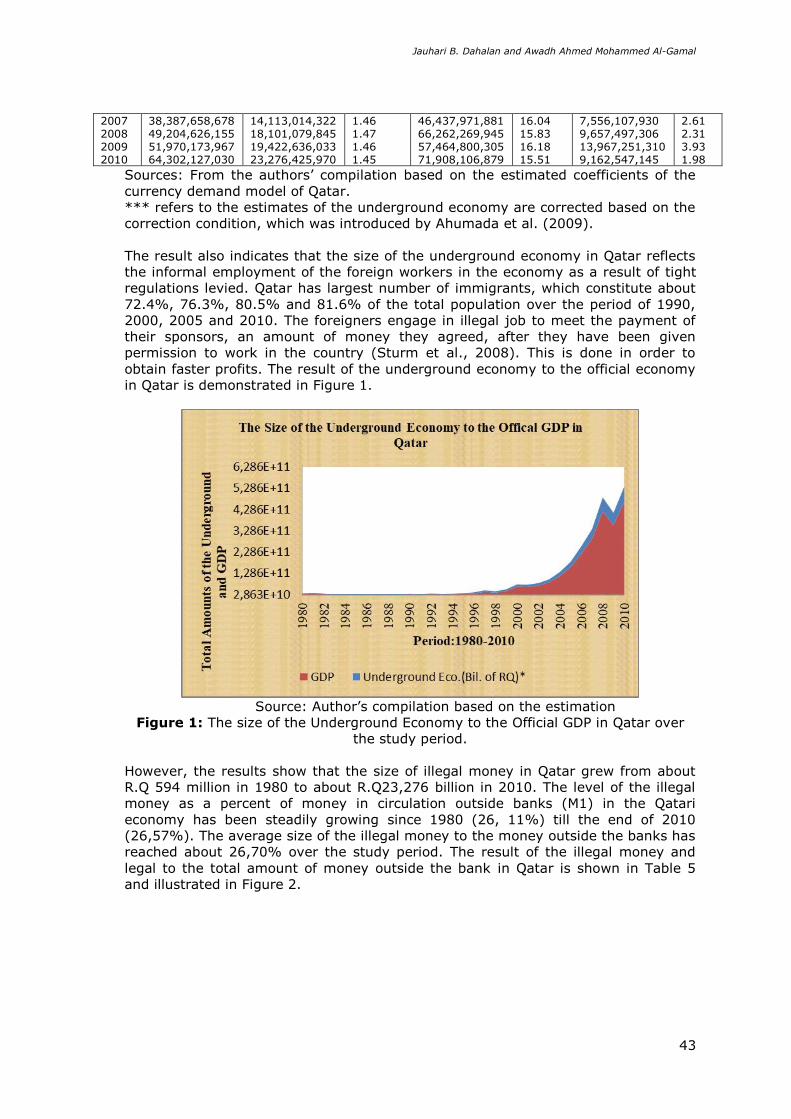
The result also indicates that the size of the underground economy in Qatar reflects
the informal employment of the foreign workers in the economy as a result of tight
regulations levied. Qatar has largest number of immigrants, which constitute about
72.4%, 76.3%, 80.5% and 81.6% of the total population over the period of 1990,
2000, 2005 and 2010. The foreigners engage in illegal job to meet the payment of
their sponsors, an amount of money they agreed, after they have been given
permission to work in the country (Sturm et al., 2008). This is done in order to
obtain faster profits. The result of the underground economy to the official economy
in Qatar is demonstrated in Figure 1.
Source: Author’s compilation based on the estimation
Figure 1: The size of the Underground Economy to the Official GDP in Qatar over
the study period.
However, the results show that the size of illegal money in Qatar grew from about
R.Q 594 million in 1980 to about R.Q23,276 billion in 2010. The level of the illegal
money as a percent of money in circulation outside banks (M1) in the Qatari
economy has been steadily growing since 1980 (26, 11%) till the end of 2010
(26,57%). The average size of the illegal money to the money outside the banks has
reached about 26,70% over the study period. The result of the illegal money and
legal to the total amount of money outside the bank in Qatar is shown in Table 5
and illustrated in Figure 2.

Proceedings of The 7th Annual International Conference (AIC) Syiah Kuala University and The 6th International
Conference on Multidisciplinary Research (ICMR) in conjunction with the International Conference on Electrical
Engineering and Informatics (ICELTICs) 2017, October 18-20, 2017, Banda Aceh, Indonesia
44
Source: Author’s compilation based on the estimation
Figure 2: The size of illegal, legal money to the money outside the banks in Qatar
over the study period.
This finding provides that the underground economy in Qatar is brought about by
the huge outflow of money to abroad illegally due to the distortion in the economic
policies. In addition, an increase in the underground economic activities is attributed
to the fact that illegal workers have no way to access legal banking services, which
requires that workers in most cases should be resident of the country officially.
However, even if the workers are resident officially, formal or informal workers have
a limited financial constrain to remit (less than their salaries) their money home (De
Brauw, Mueller, & Woldehanna, 2013). Since the owners have to account for the
sources of large amounts of money owned, much money goes unrecorded through
informal channels. In addition, there is no red tape restriction to sending money in
illegal ways and the cost of sending such money is less than that in the formal ways
(Freund & Spatafora, 2005; Beine, Lodigiani, & Vermeulen, 2012). To that extent,
the size and growth of the tax evasion in the Qatari economy amounted to about
R.Q 190 million in 1980 to R.Q 9,163 billion in 2010. It has been growing steadily
since 1980 from 0.66% to 1.98% in the end of 2010, excluding the years of 1998
and 2009. The higher rates of tax evasion compared to the official GDP reached
3.71% in 1998 and 3.93% in 2009. The level of tax evasion as a percent of GDP is
soaring rapidly since 1998. The higher level of tax evasion compared to the official
GDP was estimated at R.Q 7.556, 9.657, 13.967 and 9.163 billion respectively in the
last four years of the study period. The result of tax evasion to the official GDP is
illustrated in Figure 3.

Jauhari B. Dahalan and Awadh Ahmed Mohammed Al-Gamal
45
Source: Author’s compilation based on the estimation
Figure 3: Tax evasion to the GDP in Qatar over the study period.
On the other hand, the results indicate that the tax evasion constitutes a significant
portion of the non-oil tax revenues in the Qatari economy. The growth rate of tax
evasion as a percent of total non-oil tax revenues was estimated at 16.90% in 1980
to about 15.50% in 2010. The average growth rate is 16.50% over the study period.
The result suggests that tax evasion practices in the Qatari economy are
concentrated among the Small and Medium-sized enterprises. The result can be
shown as in Figure 4.
Source: Author’s compilation based on the estimation
Figure 4: The size of tax evasion to the non-oil tax revenues in Qatar.
The results show that an increase of tax evasion in the Qatari economy is attributed
to the higher growth rate of the tax burden in the economy. Since, the average rate
of non-oil revenues as in percentage to the Gross Domestic Product in Qatar which
reflects the tax burden amounted to 13.11% over the study period. The higher
average rate was around 20% in 1998 and remained at the highest level over the

Proceedings of The 7th Annual International Conference (AIC) Syiah Kuala University and The 6th International
Conference on Multidisciplinary Research (ICMR) in conjunction with the International Conference on Electrical
Engineering and Informatics (ICELTICs) 2017, October 18-20, 2017, Banda Aceh, Indonesia
46
later period of study. The result on the size of tax evasion as a component of the
underground economy in the Qatari economy could be a result of wrong fiscal policy,
which led to loses in the revenues of the government. The increased tax burden is
more costly to owners of business firms in the private sector (Dabla-Norris,Gradstein
& Inchauste, 2008). In fact, this result confirms that taxation and underground
economy move together over time, as it can be seen in Figure 5. However, the
result suggests that tax evasion is a component of illegal activities of the
underground economy in the Qatari economy. The underground economy involves
different illegal activities.
Source: Author’s compilation based on the estimation
Figure 5: The trend of tax evasion in and underground economy Qatar over the
study period.
Conclusions
This study estimated the size of the underground economy and tax evasion in the
Qatari economy over the period of 1980-2010 using the Gregory and Hansen
cointegration test based currency demand approach. The results suggest that the
size of the underground economy in Qatar is growing significantly over the period of
study. The level of the underground economy as a percent of the official GDP
increased steadily from 1980 to 2010. The average size of the underground
economy in Qatar constitutes 17.03% of the official GDP over the study period. It
was 16.90% and 15.51% of the official GDP in 1980 and 2010 respectively, while
the average size constitutes 17.03% of the official GDP. From the analysis, the
average size of the underground economy in Qatar is greater than that reported by
Schnieder et al. (2010). The development of the trend for the underground economy
in Qatar is less in comparison to some other Asian and African developing countries
such as Bangladesh, Malaysia, Morocco, Guyana, Tanzania, Malawi, and Ethiopia.
However, the rank of the underground economy in the Qatari economy itself is
relatively higher than its official economy.
The findings also reveal that the size of illegal money in the Qatari economy is
around R.Q 594 million in 1980 to about R.Q 23,276 billion in 2010. The growth
level of the illegal money as a percent of money outside banks (M1) in the Qatari
economy had been steadily growing from 26, 11% since 1980 to 26,57% till the end
of 2010. The average size of the illegal money to the money outside the banks has
risen to about 26,70% over the period of study. However, the magnitude of the tax
evasion amounted to about R.Q 190 million in 1980 to R.Q 9,163 billion in 2010. It
had been growing steadily from 1980 to the end of 2010, excluding the year 1998
and 2009 respectively. The growth rate of the tax evasion as a percent of the official
GDP in Qatar had been steadily increasing from 0.66% in 1980 to 1.98% in the end
of 2010, and it was soaring rapidly since 1998. The higher rates of tax evasion in

Jauhari B. Dahalan and Awadh Ahmed Mohammed Al-Gamal
47
comparison to the official GDP reached 3.71% in 1998 and 3.93% in 2009. The
findings provide that the underground economy in Qatar stems from the higher rate
of tax burden and the huge outflow of money that is remitted by the foreign workers
to abroad illegally due to the distortion in the economic policies. The size mainly
reflects the informal employment of the foreign workers in the economy as a result
of the cheapest price of foreign labor compared to local.
To that extent, Qatar has the largest number of immigrants compared to its national
population. The Qatari authorities embarked on tight regulation that can drive
foreign workers to engage in illegal activities of the underground economy.
Foreigners get permission to work by themselves within the country based on their
agreement with their sponsors to pay back an agreed amount of money (Sturm et
al., 2008). This study suggests that the size of the underground economy in Qatar
should be taken into account when any economic policy is formulated. There are a
number of reasons for this conclusion: First, due to its negative impact of reducing
government revenues since the tax evasion is increasing and the oil reserves could
not forever sustain the economy (Muceku & Muca, 2014). Second, the size of the
underground economy is currently estimated at 15.51% of the official GDP as at end
of 2010, which is bigger compared to the relative size of its economy. Finally, an
increase in the illegal activities of the underground economy could be a damaging
factor to economic development planning in the Qatari economy.
References
Ahumada, H., Alvaredo, F., & Canavese, A. (2009). The Monetary Method to
Measure the Size of the Shadow Economy » A Critical Examination of its Use.
Journal of Review Economics, 60 (5), 1069-1078.
Ahiabu, S. (2006). Inflation and the underground economy. University Library of
Munich, Germany, MPRA Paper No.763.
Asiedu, E., & Stengos, T. (2014). An Empirical Estimation of the Underground
Economy in Ghana. Economics Research International, 2014.
Agbi, S. (2014). The Virtuos and the Variance of the Various Approaches for
Measuring Shadow Economy around the World: Implications for Policy
Makers. European Journal of Business and Innovation Research, 2(6),40-55.
Ahumada, H., Alvaredo, F., & Canavese, A. (2007). The monetary method and the
size of the Shadow economy: a critical assessment. Review of Income and
Wealth, 53 (2), 363-371.
Ahumada, H., Alvaredo, F., & Canavese, A. (2008). The monetary method to
measure the Shadow economy: The forgotten problem of the initial conditions.
Economics Letters, 101(2), 97-99.
Alexandru, A. A. M. (2013). Estimating the size of Romanian shadow economy using
Gutmann’s simple currency ratio approach. Theoretical and Applied Economics,
18(10 (587)), 33-48.
Alexandru, A., & Dobre, I. (2011). The Impact of Unemployment Rate on the
Romanian Shadow Economy: An Empirical Investigation Using Granger
Causality Analysis. Economic Computation and Economic Cybernetics Studies
and Research, ASE Publishing, 45(1), 55-76.
Ahmed, Q. M., & Hussain, M. H. (2008). Estimating the Black Economy through a
Monetary Approach: A Case Study of Pakistan. Economic Issues, 13 (1), 45-60.
Ahmed, M., & Ahmed, Q. M. (1995). Estimation of the black economy of Pakistan
through the monetary approach. The Pakistan Development Review, 34 (4),
791-807.
Banafea, W. A. (2014). Endogenous Structural Breaks and the Stability of the Money
Demand Function in Saudi Arabia. International Journal of Economics &
Finance, 6(1), 155-164.
Breusch, T. (2005). The Canadian Underground Economy: An Examination of Giles
and Tedds. Canadian Tax Journal, 53 (2), 367-391.

Proceedings of The 7th Annual International Conference (AIC) Syiah Kuala University and The 6th International
Conference on Multidisciplinary Research (ICMR) in conjunction with the International Conference on Electrical
Engineering and Informatics (ICELTICs) 2017, October 18-20, 2017, Banda Aceh, Indonesia
48
Berger, W., Pickhardt, M., Pitsoulis, A., Prinz, A., & Sardà, J. (2014). The hard
shadow of the Greek economy: new estimates of the size of the underground
economy and its fiscal impact. Applied Economics, 46(18), 2190-2204.
Beine, M., Lodigiani, E., & Vermeulen, R. (2012). Remittances and financial
openness. Regional Science and Urban Economics, 42(5), 844-857.
Cagan, P. (1958). The demand for currency relative to total money supply. Journal
of Political Economy, 66(4), 303-328.
Dabla-Norris, E., Gradstein, M., & Inchauste, G. (2008). What causes firms to hide
output? The determinants of informality. Journal of Development Economics,
85(1), 1-27.
Dreher, A., & Schneider, F. (2010). Corruption and the shadow economy: an
empirical analysis. Public Choice, 144 (1-2), 215-238.
Dell’Anno, R., & Halicioglu, F. (2010). An ARDL Model of unrecorded and recorded
economies in Turkey. Journal of Economic Studies, 37(6), 627-646.
De Brauw, A., Mueller, V., & Woldehanna, T. (2013). Motives to remit: evidence
from tracked internal migrants in Ethiopia. World Development, 50(n), 13-23.
Engle, R. F., & Granger, C. W. (1987). Co-integration and error correction:
representation, estimation, and testing. Econometrica: journal of the
Econometric Society, 55(2), 251-276.
Fethi, M. D., Fethi, S., & Katircioglu, S. T. (2006). Estimating the size of the Cypriot
Underground economy: A comparison with European experience. International
Journal of Manpower, 27 (6), 515-534.
Feld, L. P., & Schneider, F. (2010). Survey on the shadow economy and undeclared
earnings in OECD countries. German Economic Review, 11(2), 109-149.
Ferwerda, J., Deleanu, I., & Unger, B. (2010). Reevaluating the Tanzi-model to
estimate the Underground Economy. Tjalling C. Koopmans Research Institute,
Discussion Paper, 10 (4), 1-29.
Gerxhani, K. (2004). The informal sector in developed and less developed countries:
a literature survey. Public choice, 120(3-4), 267-300.
Gutmann, P. M. (1977). The subterranean economy. Financial Analysts Journal,
33(6), 26-27.
Gregory, A. W., & Hansen, B. E. (1996). Residual-based tests for cointegration in
models with Regime shifts. Journal of Econometrics, 70 (1), 99-126.
Gregory, A. W., Nason, J. M., & Watt, D. G. (1996). Testing for structural breaks in
cointegrated Relationships. Journal of Econometrics, 71 (1), 321-341.
Hernandez, M. A. (2009). Estimating the Size of the Hidden Economy in Peru: A
Currency Demand Approach. Revista de Ciencias Empresarialesy Economia,
8(1), 85-104.
Kumar, S. &Webber, D. J. (2013). Australasian money demand stability: application
of structural break tests. Journal of Applied Economics, 45 (8), 1011-1025.
Kumar, S., Webber, D. J., & Fargher, S. (2013). Money demand stability: A case
study of Nigeria. Journal of Policy Modeling, 35(6), 978-991.
Lee, J., & Strazicich, M. C. (2003). Minimum Lagrange multiplier unit root test with
two Structural breaks. Review of Economics and Statistics, 85(4), 1082-1089.
Marcias, J. B., & Cazzavillan, G. (2009). The dynamics of parallel economies.
Measuring the Informal sector in Mexico. Research in Economics, 63 (3), 189-
199.
Muceku, H., & Muça, A. (2014). Informal Economy In Albania–Its Costs in the
Country Development. Mediterranean Journal of Social Sciences, 5(9), 642.
Naufal, G.S., & Vargas-Silva, C. (2010). Remitters in Dubai. Swiss Society of
Economics and Statistics, 146 (4), 769–780.
Naufal, G., S., & Termos, A. (2010). Remittances from the GCC Countries: A Brief
Outlook. Migration and the Gulf, Middle East Institute, Washington, DC, 1
(2010), 37-41. Retrieved from:
http://www.voltairenet.org/IMG/pdf/MigrationandtheGulf .pdf.

Jauhari B. Dahalan and Awadh Ahmed Mohammed Al-Gamal
49
Omotor, D. G., & O motor, P. E. (2011). Structural Breaks, Demand for Money and
Monetary Policy in Nigeria. Ekonomski pregled, 62 (9-10), 559-582.
Putnins, T. J.,& Sauka ,A. (2011). Size and determinants of shadow economies in
the Baltic States. Baltic Journal of Economics, 11(2), 5-25.
Rao, B., B., Singh, R., & Kumar, S. (2010). Do we need time series Econometrics.
Applied Economics Letters, 17(7), 695-697.
Rao, B. B., & Kumar, S. (2009). Cointegration, structural breaks and the demand for
money in Bangladesh. Applied Economics, 41(10), 1277-1283.
Schneider, F., & Buehn, A. (2013). Estimating the Size of the Shadow Economy:
Methods, Problems and Open Questions. CESifo Working Paper No. 4448.
Schneider, F., Buehn, A., & Montenegro, C.E. (2010). New Estimates for the Shadow
Economies all over the World. International Economic Journal, 24 (4), 443–
461.
Schneider, F., & Savasan, F. (2007). Dymimic Estimates of the Size of Shadow
Economies of Turkey and of Her Neighboring Countries. International Research
Journal of Finance and Economics, 9(5), 126-143.
Schneider, F., & Klinglmair, R. (2005). Shadow economies around the world: What
do we know?. European Journal of Political Economy, 21(3), 598–642.
Schneider, F. (2006). Shadow economies around the world: what do we really
know?. European Journal of Political Economy, 21 (3), 598-642.
Schneider, F., & Enste, D. (2000). Shadow economies: Size, causes, and
consequences. The Journal of Economic Literature, American Economic
Association, 38 (1), 77–114.
Schneider, F., & Hametner, B. (2014). The Shadow Economy in Colombia: Size and
Effects on Economic Growth. Peace Economics, Peace Science and Public Policy,
20(2), 293-325.
Singh, P., & Pandey, M. K. (2012). Is Long-Run Demand for Money Stable in India?–
An Application of the Gregory-Hansen Model. The IUP Journal of Applied
Economics, 11(2), 59-69.
Sturm, M., Strasky, J., Adolf, P., & Peschel, D. (2008). The Gulf Cooperation Council
Countries-Economic Structures, Recent Developments and Role in the Global
Economy. ECB Occasional Paper No.92.
Shah, N. M. (2009). The management of irregular migration and its consequence for
development: Gulf Cooperation Council. International Labor Organization,
working paper No. 431863. Retrieved from:
http://www.ilo.org/wcmsp5/groups/public/---asia/---ro-
bangkok/documents/publication/wcms_105105.pdf.
Taghavi, M. (2012). The Impact of Workers’ Remittances on Macro Indicators: The
case of the Gulf Cooperation Council. Middle Eastern and African Economies, 14
(9), 49-73.
Torgler, B., & Schneider, F. (2009). The impact of tax morale and institutional
quality on the shadow economy. Journal of Economic Psychology, 30(2), 228-
245.
Trebicka, B. (2014). Mimic Model: A Tool to Estimate the Shadow Economy.
Academic Journal of Interdisciplinary Studies, 3(6), 295.
Tanzi, V. (1982). Underground economy and tax evasion in the United States:
Estimates and implications. In Vito Tanzi, V. (1st Ed). The underground
economy in the United States and abroad, 69-92. Lexington, MA: Lexington
Books.
Zivot, E., & Andrews, D. W. K. (1992). Further evidence on the great crash, the oil-
price shock, and the unit-root hypothesis. Journal of Business & Economic
Statistics, 10 (1), 251-270.


![Untitled-1 [] · 2019-09-23 · rasgas qdvc . projects doha-qatar . cooling list of ongoing projects 2. wakra stadium qatar university pearl qatar lpw pearl qatar bvs 56 pearl qatar](https://img.dokumen.tips/doc/110x75/5e53388898cc9834405de475/untitled-1-2019-09-23-rasgas-qdvc-projects-doha-qatar-cooling-list-of.jpg)