Embed Size (px)
Citation preview

1
WCRF-AICR Continuous Update Project report on diet and cancer
Protocol
Continuous Update Project: epidemiological evidence on food, nutrition,
physical activity and the risk of endometrial and ovarian cancers
Prepared by: CUP team, Imperial College London
WCRF/AICR has been the global leader in elucidating the relationship between food,
nutrition, physical activity and cancer. The first and second expert reports represent
the most extensive analysis of the existing science on the subject to date. To keep the
evidence current and updated into the future, WCRF/AICR is undertaking the
Continuous Update Project (CUP), in collaboration with Imperial College London
(ICL).
The Continuous Update Project will provide the scientific community with a
comprehensive and up to date depiction of scientific developments on the relationship
between diet, physical activity, obesity and cancer. It will also provide an impartial
analysis and interpretation of the data as a basis for reviewing and where necessary
revising WCRF/AICR's cancer prevention recommendations based on the 2007
Second Expert Report.
WCRF/AICR has convened a panel of experts (the Continuous Update Project Panel)
consisting of leading scientists in the field of diet, physical activity, obesity and
cancer who will consider the evidence produced by the systematic literature review
and meta-analysis, and will consider the results and draw conclusions before making
recommendations.
In the same way that the Second Expert Report was informed by a process of
systematic literature reviews (SLRs), the CUP will systematically review all of the
science as it is published. The ongoing systematic literature review will be conducted
by a team of scientists at ICL in liaison with the SLR centres where possible.
The current protocol for the continuous update of endometrial and ovarian cancers
should ensure consistency of approach to the evidence, common approach to the
analysis and format for displaying the evidence used in the literature reviews1 for the
Second Expert Report.
The starting point for this protocol are:
• The convention for conducting systematic reviews1 developed by WCRF
International for the Second Expert Report.
• The protocols developed by the SLR groups for the Second Expert Report for:
• Endometrial cancer (Kaiser Permanente) 2
• Ovarian cancer (National Cancer Institute, Milan, Italy) 3
The peer-reviewed protocol will represent the agreed plan for the Continuous Update
Project. Should departure from the agreed plan be considered necessary at a later

2
stage, this must be agreed by the Continuous Update Project Panel and the reasons
documented.
Background
Endometrial cancer
The majority of cancers that occur in the corpus uteri are endometrial cancers, mostly
adenocarcinomas.
Endometrial cancer is the fifth most commonly diagnosed cancer in women
worldwide. It is more frequent in high-income countries, where age standardised
incidence rates were estimated as 12.9 per 100, 000 females in 2008, compared to less
developed areas where incidence rate was estimated at 5.94 .Around three quarters of
women with this cancer survive for 5 years.
Risk increases with age, with most diagnoses made post menopause. Nulliparous
women are at increased risk of cancer of the endometrium. There is also substantial
evidence that, as with breast and ovarian cancer, late natural menopause increases the
risk of endometrial cancer. Oral contraceptives protect against this cancer. Oestrogen-
only hormone replacement therapy and tamoxifen are both associated with an
increased risk of this cancer. Polycystic ovary syndrome and insulin sensitivity,
which are both components of metabolic syndrome, may play a role in the
pathogenesis of endometrial cancer, perhaps through hormonal disruption5.
In the judgment of the Panel of the WCRF-AICR Second Expert Report 5, the factors
listed below modify the risk of cancers of the endometrium.
CANCER OF ENDOMETRIUM
DECREASES RISK
INCREASES RISK
Convincing No factor identified Body fatness
Probable Physical activity Abdominal fatness
Limited –suggestive Non-starchy vegetables
Red meat
Adult attained height
Limited –no
conclusion
Cereals (grains) and their products; dietary fibre ; fruits;
pulses (legumes); soya and soya products; poultry; fish;
eggs; milk and dairy products; total fat; animal fat;
saturated fatty acids; cholesterol; coffee; alcohol;
carbohydrates; protein; retinol; vitamin C; vitamin E; beta-
carotene; lactation; energy intake
Substantial
effect on risk
unlikely
No factor identified

3
Ovarian cancer
Ovarian cancer is the third most common female gynaecological cancer worldwide
and the second in developed countries after endometrial cancer. Worldwide there
were 225,500 new cases of ovarian cancer estimated in 2008, accounting for around
4% of all cancers diagnosed in women4.Ovarian cancer rates are nearly three times
higher in high than in middle- to low-income countries. Risk increases with age, with
most ovarian cancers occurring after menopause. Ovarian cancer is diagnosed often in
advanced stages and survival rates are poor.
The etiology of epithelial ovarian cancer remains poorly understood. Most ovarian
cancers occur spontaneously, although up to 10 per cent of cases develop due to a
genetic predisposition (i.e., BRCA1, BRCA2, MLH1, MSH2)6.
Use of oral contraceptives, parity, tubal ligation, and hysterectomy have been
associated with decreased risk, while use of hormone replacement therapy, a family
history of ovarian cancer and infertility have been associated with increased risk of
ovarian cancer. Early menarche and late menopause have also been associated with an
increased risk of ovarian cancer likely due to increased ovulation6.
In the judgment of the Panel of the WCRF-AICR Second Expert Report 5, the factors
listed below modify the risk of ovarian cancer.
CANCER OF THE OVARY
DECREASES RISK
INCREASES RISK
Convincing No factor identified No factor identified
Probable No factor identified Adult attained height
Limited –suggestive Non-starchy vegetables
Lactation
No factor identified
Limited –no
conclusion
Dietary fibre; fruit; pulses/legumes; meat; poultry; fish;
eggs; milk and dairy products; total fat; cholesterol; coffee;
tea; alcohol; carbohydrate; lactose; protein; vitamin A;
folate; vitamin C; vitamin E; recreational activity; body
fatness; abdominal fatness; weight change; energy intake
Substantial
effect on risk
unlikely
No factor identified
1. Research question
The research topic is:
The associations between food, nutrition and physical activity and the risk of
endometrial cancer and ovarian cancers.

4
2. Review team
Name Current position at IC Role within team
Teresa Norat Principal Research Fellow Principal investigator
Rui Vieira Data manager Responsible of the data
management, the design and
architecture of the database
Doris Chan Research Assistant Nutritional epidemiologist,
supervisor of data entry, analyst
Ana Rita Vieira Research Assistant Nutritional epidemiologist,
reviewer
Deborah Navarro Research Assistant Nutritional epidemiologist,
reviewer
Review coordinator, WCRF: Rachel Thompson
Statistical advisor: Darren Greenwood, senior Research Lecturer, University of Leeds
3. Timeline.
The SLR’s for the Second Expert Report ended in December 30th
2005. A pre-
publication update extended the search to June 30th
2006 for exposures and cancer
sites with suggestive, probable, convincing associations with the exposures of interest.
In order to ensure the completeness of the database, the ICL team will repeat the
search conducted for the pre-publication update. Therefore, the CUP will include the
articles added to Medline from January 1st 2006. The reviewers will verify that there
are not duplicities in the database. With that purpose, a module for article search has
been implemented in the interface for data entry.
List of tasks and deadlines for the CUP on endometrial and ovarian cancers:
Task Deadline
Start Medline search of relevant articles published from
January 2006
1st April, 2011
Review abstracts and citations identified in initial electronic
search. Select papers for complete review
Monthly
Review relevant papers. Select papers for data extraction Monthly
Data extraction Monthly
Start quantitative analysis January 2012*
End of quantitative analysis March 2012
Send report to WCRF-AICR May 2012
Transfer Endnote files to WCRF May 2012
*Search will end in December 31st 2011

5
4. Search strategy
The search will be conducted in Medline using PubMed as interface. An automatic
system for monthly searches has been implemented by the review team. The search
for one cancer site will be conducted independently of the search for the other cancer
sites.
The CUP team will use the search strategy established in the SLR Guidelines with the
modifications implemented by the SLR centres (Kaiser Permanente, for endometrial
cancer 2 and
National Cancer Institute, Milan, Italy for cancers of and ovary
3) for the
WCRF-AICR Second Expert Report.
The search will not be limited to “human studies” as it can't be guaranteed that all
studies on PubMed have been coded as human. The full search strategy for each
cancer site is in Annex 1.
5. Selection of articles
Only articles that match the inclusion criteria (see 5.1) will be updated in the database.
Pooled analysis and meta-analysis will be identified in the search, but they will not be
included in the database. The results of these studies will be used as support document
in the preparation of the report. The inclusion of a pooling project as a single study in
the CUP may decrease the heterogeneity, if included as a single study. However, if
study-specific results are shown in the manuscript of a pooling project, these results
will be extracted and included separately in meta-analyses In the CUP.
5.1 Inclusion criteria
The articles to be included in the review:
• Have to be included in Medline from January 1st 2006 (closure date of the
database for the Second Expert Report5).
• Have to present results from an epidemiologic study of one of the following
types†:
o Randomized controlled trial
o Group randomized controlled trial (Community trial)
o Prospective cohort study
o Nested case-control study
o Case-cohort study
o Historical cohort study
• Must have as outcome of interest cancer incidence or mortality of:
o Endometrial cancer, or
o Ovarian cancer
• Have to present results on the relevant exposures

6
† Only trials and cohort studies will be included in the review because they are
considered to be less prone to bias than case-control studies. Filters for study design
will not be implemented in the search strategy.
Note on articles published in languages other than English:
The relevance of articles in languages other than English will be assessed by
inspection of the title and if available in English, the abstract. If the same study is
published in English and in another language, only the data of the article in English
will be extracted.
5.2 Exclusion criteria
The articles to be excluded from the review:
• Are out of the research topic
• Do not report measure of association between the exposure and the risk of any of
the cancers investigated (endometrial, ovary).
• Cohort studies in which the measure of the relationship between exposure and
outcome is only the mean difference of exposure as this is not adjusted by main
confounders.
• Are supplement to the main manuscript (e.g. Authors’ Reply).
6. Exposures
The CUP will use the labels and exposure codes listed in the SLR Guidelines1 for the
Second Expert Report. Additional codes for sub-exposures were added during the
SLRs for the Second Expert Report and in the continuous update of prostate,
colorectal, breast and pancreatic cancers at Imperial College.
The original SLR code list of exposures and the additional sub-exposure codes has
been updated by the ICL review team to ensure the identity of codes and labels for all
cancer sites. The codes defined in the SLR Guidelines remained the same.
The updated list of selected codes for exposures is in Annex 2. The exposures listed
represent the minimum list of exposures to be examined. These exposures are
programmed in the interface for data entry generated at Imperial College with the
purpose of facilitating data entry.
6.1 Biomarkers of exposure
In the SLR for the Second Expert Report5, biomarkers of exposure were included
under the heading and with the code of the corresponding exposure. Some review
centres decided to include only biomarkers for which there was some evidence on
reliability or validity, while other centres included in the database results on all the
biomarkers retrieved in the search, independently of their validity. During the process
of evaluation of the evidence, the Panel of Experts took in consideration the validity
of the reported biomarkers.
The SLR centre on prostate cancer (Bristol) prepared a list of biomarkers that should
not be included in the review, based on data of studies on validity and repeatability of

7
the biomarkers. A table with included and excluded biomarkers and the reasons for
exclusion are in Annex 3.
Study results on “new” biomarkers whose validity has not yet been fully documented
will be extracted in the CUP database.
The excluded biomarkers are:
Vit D: 1.25 (OH)2D, Alkaline phosphatase activity (serum)
Iron (serum, hair, nails)
Copper (plasma, serum, hair)
Glutathione peroxidase (plasma, serum, erythrocytes, blood)
Zinc, metallotein levels (any)
Lipids: total fats (any)
Cholesterol, LDL (any)
Lipoprotein levels (serum)
Monounsaturated fatty acids (oleic acid) (plasma, adipose tissue)
Saturated fatty acids (palmitic acid, stearic acids) (plasma)
Protein (any)
Biomarkers of effect and biomarkers of cancer are not included in this review.
7. Outcome
The outcomes of interest are endometrial and ovarian cancers, encompassing
incidence and mortality.
8. Search databases
Only the Medline database will be initially searched used PubMed as platform. Data
provided from the Second Expert Report2, 3
indicates that most articles included in the
review have been retrieved from the Medline database.
9. Hand searching for cited references
For feasibility reasons, it was decided that full hand search will not be done.
However, we will conduct to test for potential missing articles:
- The references of reviews and meta-analyses identified during the search will
be hand searched. - The references of the articles relevant to the review and published in 2010 and
2011 (last two years before the preparation of the report) will be hand
searched.
If the hand searching shows that articles have been missed by PubMed, the Imperial
College team will consider other strategies, such as modifying the search strategy and
looking into other databases.

8
10. Selecting articles
The results of the PubMed searches will be downloaded monthly into the Reference
Manager Databases. The articles of ovarian and endometrial cancer will be
downloaded into two separated databases, one for each cancer site.
Initially a further electronic search will be undertaken within Reference Manager to
identify and remove irrelevant records. This will be achieved by generating a list of
stop words. The list of stop words was developed and tested by the SLR Leeds during
the preparation of the WCRF-AICR second expert report. The list of stop words
(Annex 4) was compiled from terms that describe surgical, diagnostic or oncology
procedures. Also included in the stop word are terms referring to animal studies and
in vitro studies. These terms will be used to identify non human studies. All
references that include any of these stop words in the title of the citation will be
excluded and stored in a separate Reference Manager database.
In a second step the remaining articles downloaded from PubMed will be inspected by
a reviewer, who will indicate which articles are potentially relevant, articles to be
excluded and articles that cannot be classified upon reading the title and abstracts.
The complete article of potentially relevant references and of references that cannot
be excluded upon reading the title and abstracts will be retrieved. A second
assessment will be done after review of the complete papers.
The assessment of papers will be checked by a second reviewer.
11. Labelling of references
For consistency, the Imperial College team will use the same labelling of articles
employed during the SLR process for the Second Expert Report1: the unique identifier
for an article will be constructed using a 3-letter code to represent the cancer site:
OVA for ovary and END for endometrial cancer, followed by a 5-digit number that
will be allocated in sequence.
12. Reference Manager Files
Reference Manager files containing the references retrieved on the initial search are
generated in the CUP. The variables contained in the Reference manager files are
those generated using the filter Medline for importing data. Additionally, customized
fields will be implemented.
Three Reference Manager Files will be created:
.
1) A file containing the results of the initial search. The study identifier should be
entered under a customized field titled ‘label’. Another customised field named
‘inclusion’ should be marked ‘in’ or ‘out’ for each paper, thereby indicating which
papers were deemed potentially relevant based on an assessment of the title and
abstract.
2) A file containing the excluded papers. The study identifier should be entered

9
under a customized field titled ‘label’. Another customised field named ‘reasons’
should include the reason for exclusion for each paper. This file will be named
Endometrium- (or Ovary-) excluded.
3) A file containing the included papers. The study identifier should be entered
under a customized field titled ‘label’. Another customised field named “study
design” should include a letter (A-Q) representing the study design of each
paper, allocated using the study design algorithm in Annex 5. This file will be named
Endometrium- (or Ovary-) included.
The Reference Management databases will be converted to EndNote and sent once
per year to the WCRF Secretariat.
13. Data extraction
The IC team will update the database using the interface created at Imperial College
for this purpose. The interface allows the update of all the information included in the
Access databases generated during the SLRs for the Second Expert Report. This
includes information on study design, characteristics of study population, methods of
exposure assessment, study results, analytical methods, adjustment variables,
matching variables, and whether methods for correction of measurement error were
used.
The study design algorithm devised for use of the SLR centres for the Second Expert
Report will be used to allocate study designs to papers (Annex 5). In some cases it
will be appropriate to assign more than one design to a particular paper (e.g. analyses
in the entire cohort and nested case-control).
13.1 Quality control
Data extraction will not be performed in duplicate. This will require important
resources. Instead, all the data extracted during the first year of the CUP will be
checked by a second reviewer at Imperial College. In the second year, a random
sample of 10% of the data extracted will be assessed by a second reviewer. If there
are no errors, no more articles will be reviewed for that year. If there are errors,
another 10% will be assessed by a second reviewer. The process will be continued in
this way to guarantee the quality of the data extracted.
The extracted data will be also checked automatically by the data manager, who will
prepare monthly reports of the errors identified for its correction by the reviewer.
Examples of automatic checks are checking if the confidence interval contains the
effect estimate and if it is symmetrical, checking that the sum of cases and non case
individuals by categories of exposure add up to the total number of cases and non case
individuals.
13.2 Choice of Result
There could be several results for a particular exposure within a study according to the
number of models presented in the article (unadjusted, minimally, maximally) and the
10
number of subgroup or stratified analyses conducted (by gender, race, outcome type,
etc.)
The results obtained using all the models reported in the paper and all the subgroup or
stratified analysis should be extracted by the reviewer.
The reviewer should label the results as not adjusted, minimally adjusted,
intermediately adjusted and maximally adjusted. In addition, the IC reviewer should
indicate results obtained with a “best model”. This serves the dual purpose of marking
that result to be exported to the reports and also flagging it as the best model for
potential inclusion in a meta-analysis.
The identification of “best model” will be undertaken firstly on the appropriateness of
adjustment.
Minimally adjusted models should have been adjusted for age, and in dietary
analyses, for energy intake.
“Best” adjusted models in analyses of ovarian cancer should have been adjusted for menopausal status, oral contraceptive use, hormone replacement therapy use among
postmenopausal women and parity.
“Best” adjusted models in analyses of endometrial cancer should have been adjusted
for BMI, menopausal status, oral contraceptive use, hormone replacement therapy use
among postmenopausal women and parity.
Where there is more than one model adjusting for the main potential confounders, the
most adjusted one will be considered to be the best model. Exception to this criterion
will be “mechanistic” models, adjusting for variables likely to be in the causal
pathway. When such results (over adjusted results) are reported, the most adjusted
results that are not over adjusted will be extracted.
Sometimes, potential risk factors are not kept in the model because their inclusion
does not modify the risk estimates. If this is specified in the article text, this model
should also be considered the “best model”.
In addition to adjustment, other subsidiary criteria to consider for identifying the ‘best
model’ for meta-analysis are the number of cases (highest), and in certain
circumstances the completeness of the data (e.g. where quantile ranges are provided
over where missing).
13.3 Effect modification and interaction
The IC team should report whether interaction or heterogeneity tests were conducted
and extract the results of these tests. The results will be summarized in Tables and
when possible, meta-analyses will be conducted. These should be considered
cautiously as often only statistically significant results of subgroup analyses are
reported in the publications and therefore, they can be subject to selective publication
bias.
In the SLR for the 2nd
Expert Report, the results of stratified analyses were included in
the database generally as subgroup analyses. Results of interaction analyses were

11
extracted using the same module of data entry by creating new “double entry” sub-
exposures (e.g. Body mass index and physical activity).
In the CUP, the results of stratified analyses will be extracted using the module
“Subgroup analysis”. To avoid the creation of new “double entry” exposures, the IC
team has developed a new module for data entry of results of interaction analysis. The
module ‘interaction’ allows the use of existing headings of single exposures during
data entry that will be automatically linked in the database. The reviewer will not
need to create new sub-exposures codes.
13.4 Gene and hormone interactions with dietary exposures, physical activity or
measures of adiposity.
No attempt was made to critically appraise or analyse the studies that reported gene
and endogenous or exogenous hormone interactions with dietary exposures, physical
activity or measures of adiposity in the Second Expert Report.
The search strategy will not include gene or hormone related terms; however, when
literature on gene and hormone interactions with dietary exposures, physical activity
or measures of adiposity will arise, they will be also retrieved and reviewed, but we
will not include these studies in the meta-analyses.
The results of these studies will be described in the narrative review under the
relevant exposures. Dose-response meta-analyses will be conducted if there is
available data from at least three studies.
13.5 Multiple articles
Different updates of a specific analysis from the same study are published.
Occasionally, the same study results are published in more than one paper. The data
of all relevant papers should be extracted, even if there is more than one paper from
the same study reporting the same results.
The most appropriate data set will be selected during the reporting and data analysis
process to ensure there is no duplication of data from the same study in an analysis.
Multiple reports from the same study will be identified using first the study name.
Study names are assigned automatically from a list include in the interface for data
entry created by the IC team. In other occasions the selection of the best dataset will
be made by visual inspection during data analysis using the criteria for inclusion in
meta-analysis (in 14.2).
If needed, the IC team should contact the authors for clarification. If the matter
remains unresolved the review coordinator of the CUP will discuss the issue with the
WCRF Secretariat and the Panel, if necessary.
14. Data analysis
The meta-analyses of studies on endometrial and ovarian cancers will be conducted
separately for each cancer site.
Studies with incidence as outcome will be analysed separately from those with
mortality as outcome. However, because survival from ovarian cancer is low, the IC

12
team will also do analyses combining studies on ovarian cancer incidence and
mortality, and explore if the outcome explains potential heterogeneity.
When possible, the analyses will be stratified by menopausal status and histological
subtype. Sensitivity analyses will be conducted excluding results that are not “best”
adjusted models.
Scoring of study quality will not be used as it is unclear which of the many published
scales is better. During the analyses, when the number of studies makes it possible,
the IC team will conduct sensitivity analyses using as criteria, those included in the
Newcastle –Ottawa quality assessment scale7. For clinical trials –if any is identified in
the search- the CU team will use The Cochrane Collaboration’s tool for assessing risk
of bias8.
Meta-analytic and narrative aspects of the data analysis will complement each other.
The meta-analyses will examine the evidence for dose-response effects.
Information will be collected on whether individual studies investigated non-linearity,
the methods used, and whether there was any evidence of non-linearity.
Non-linear dose-response meta-analysis will be conducted if the data suggest a non-
linear shape.
STATA version 10.0 (College Station, TX, USA) will be used to analyse the data.
14.1 When to do a meta-analysis
A meta-analysis for a particular exposure and outcome will be conducted when 3 or
more trials or cohort studies has been published in the period reviewed, and if the total
number of studies in the database totalise to more than 3 trials or 5 cohort studies with
enough information to conduct a dose-response meta-analysis or providing data to
calculate the required information.
The study results extracted during the SLR and the studies identified in the CUP will
be included in the meta-analysis. Special care will be taken to avoid including more
than once the results of the same study (see 14.2).
14.2 Selection of results for meta-analyses and reporting.
The following guidelines for inclusion of studies in the meta-analysis will be applied:
1. Where more than one paper was published from the same study, the paper using the
larger number of cases for analysis will be selected. This is often the most recent
paper.
2. Where the same exposure was analysed in more than one way with different levels
of adjustment, the best model will be the one with the most appropriate adjustment for
confounding. This is often the maximally adjusted analysis (except mechanistic
models).
3. Where an exposure was presented for all study participants, and by subgroup, the
analysis of all study participants will be used.

13
4. Where an exposure was presented only by subgroup, the subgroups will be pooled
first and then included in the meta-analysis. This is essentially equivalent to including
the overall estimate and will provide a better estimate of heterogeneity across studies.
5. Where a paper presented results from two separate studies and included a pooled
analysis of different studies (e.g. the Nurses’ Health Study and the New York
University- Women’s Health Study), then the studies will be included separately and
the pooled result will not be included. This maintains the independence of
observations included and permits to look at heterogeneity across study results. The
results of the pooled analysis will be mentioned in the narrative review.

14
14.3 Statistical Methods
To enable comparison of different studies, the relative risk estimates per unit of intake
increase (with its standard error) provided by the studies or computed by us from the
categorical data will be pooledusing the methods of Greenland & Longnecker9 (the
pool last approach) and Chêne and Thompson10
. Means or medians of the intake
categories will be used if reported in the articles. Zero consumption was used as
boundary when the lowest category was open-ended. When the highest category was
open-ended, we used the amplitude of the lower nearest category.The same methods
were used to do the linear dose-response meta-analyses in the SLRs for the Second
Expert Report. The advantage of the method proposed by Greenland & Longnecker is
that it provides dose-response estimates that take account of the correlation induced
by using the same reference group. The relative risk estimates for each unit of
increase of the exposure will be derived with the method of DerSimonian and Laird11
using the assumption of a random effects model that incorporates between-study
variability. The unit of increment will be kept as the same unit used in the SLR. We
will use the “best” (most adjusted risk estimate) from each study and if no model is
considered the “best”, we will use the most adjusted model that is not mechanistic
model. Sensitivity tests will be conducted, limiting the analyses to the “best” models.
14.4 Derivation of data required for meta-analyses.
The information required for data to be usable for meta-analysis, for each type of
result is:
Dose-response data (regression coefficients)
-Estimated odds, risk, or hazard ratio per unit increase in exposure with
confidence interval (or standard error of log ratio or p value)
-Unit of measurement
Quantile-based or category data
-No. of cases and non cases (or person-time denominator for cohort studies)
in each group; or total number of cases and non cases (or study size) plus
explicitly defined equal-sized groups (for quantile-based data)
-Estimated odds, risk, or hazard ratios with confidence intervals (or standard
error of log ratio or p value) compared with the baseline group, for each non
baseline group (if these are not reported, unadjusted odds ratios can be
calculated from the numbers of cases and controls)
-Range, mean, or median of exposure in each group
-Unit of measurement
The data needed to estimate the dose-response associations are often incompletely
reported, which may result in exclusion of results from meta-analyses. Failure to
include all available evidence will reduce precision of summary estimates and may
also lead to bias if propensity to report results in sufficient detail is associated with the
magnitude and/or direction of associations.
A number of approaches have to be taken in order to derive the information required.
These will be applied in the following order of priority:

15
1. Where the exposure was measured as a continuous variable and the dose-response
slope given, this will be used directly.
2. Where the slope (and its standard error or confidence interval) was not given in the
text, these will be estimated applying the methods of Greenland & Longnecker9
and
using the mean exposure in each category given in the paper. No additional assumptions
are required.
3. Greenland & Longnecker’s method9 requires the total numbers of cases and
controls to be known, and starting estimates for the number of cases in each category.
Where these were not presented, values will be estimated based on the categorisation
into quantiles or on the information contained in each category estimated from the
width of the confidence intervals.
4. Mean exposure for each category is rarely given. The midpoints will be used
instead.
5. For open-ended categories, the methods of Chêne & Thompson10
will be used to
estimate the means. This approach made the assumption of a normally distributed
exposure, or a distribution that could be transformed to normality. If the method can’t
be applied, the midpoint will be calculated using the amplitude of the adjacent
category.
6. Where no confidence intervals were given in the paper, but approximate standard
errors can be obtained from the cell counts, these will be used to derive approximate
confidence intervals for the adjusted relative risks. Greenland & Longnecker’s
method9 will then be applied using means given in the paper or estimated assuming
normality, based on these derived confidence intervals.
7. Where there is a category representing a zero exposure, such as “non-drinker” or
“not consumed”, this will be treated separately for the purposes of estimating means
in each category. Such “never” categories often lead to a peak in the distribution at
zero, and the data will not follow neither a normal nor a lognormal distribution. By
using a mean of zero for the “never” category and estimating means for the other
categories separately, distributional assumptions could be made and more studies
could be included in the meta-analysis.
8. The decision whether to log-transform will be made on an exposure by exposure
basis. This will based on whether log-transformation were used in the articles to be
included in the meta-analyses and in the experience of the SLR on endometrial 2 and
ovarian 3 cancers for the Second Expert Report.
14.4 Missing values.
Insufficient detail in reporting of results of observational studies can lead to exclusion
of these results from meta-analyses and is an important threat to the validity of
systematic reviews of such research. It has been reported that only 64% of the results
of cohort studies provide enough data to be included in dose-response meta-analysis11
.
Moreover, results that showed evidence of an association were more likely to be
usable in dose-response meta-analysis than results that found no such evidence.

16
The most frequently occurring problems in reporting and the suggested solutions to
make results usable in a dose-response meta-analysis are 12
:
Type of data Problem Assumptions
Dose-response
data
Serving size is not quantified or
ranges are missing, but group
descriptions are given
Use serving size recommended in SLR
Prostate (Annex 6)
Standard error missing The p value (either exact or the upper
bound) or the confidence interval is used to
estimate the standard error
Quantile-based
data
Numbers of controls (or the
denominator in cohort studies) are
missing
Group sizes are assumed to be
approximately equal
Confidence interval is missing Standard error and hence confidence
interval were calculated from raw numbers
(although doing so may result in a
somewhat smaller standard error than
would be obtained in an adjusted analysis)
Group mean are missing This information may be estimated by
using the method of Chêne and Thompson 10 with a normal or lognormal distribution,
as appropriate, or by taking midpoints
(scaled in unbounded groups according to
group numbers) if the number of groups is
too small to calculate a distribution (see
14.3)
Category data Numbers of cases and controls (or
the denominator in cohort studies)
is missing
These numbers may be inferred based on
numbers of cases and the reported odds
ratio (proportions will be correct unless
adjustment for confounding factors
considerably alter the crude odds ratios)
14. 5 Analysis of heterogeneity and potential bias
Heterogeneity between studies will be assessed with the I2 statistic as a measure of the
proportion of total variation in estimates that is due to heterogeneity, where I2 values
of 25%, 50%, and 75% correspond to cut-off points for low, moderate, and high
degrees of heterogeneity 13
.
Meta-regression will be performed to investigate sources of heterogeneity if there are
enough studies to do it. The variables that will be examined as sources of
heterogeneity are menopausal status, level of adjustment (best model, not best model),
geographic area (North-America –Non black population, North-America –Black
population, Europe, Asia, Other), length of follow-up, whether the dose-response
slope was reported in the article or derived by the CUP team from categorical data.
Other variables that may be considered as source of heterogeneity are characterisation of the exposure (FFQ, recall, diary, anthropometry etc.) and exposure range (including correction for measurement error, length of intervention).
The interpretation of the exploration of heterogeneity should be cautious. If a
considerable number of study characteristics are considered as possible explanations
for heterogeneity in a meta-analysis containing only a small number of studies, then
there is a high probability that one or more will be found to explain heterogeneity,

17
even in the absence of real associations between the study characteristics and the size
of associations.
Small study bias (e.g. publication bias) was explored through visual examination of
funnel plots and through Egger’s test.
Influence-analyses where each individual study will be omitted in turn will be done to
investigate the sensitivity of the pooled estimates to inclusion or exclusion of
particular studies 14
.
14.6 Non linear trends in meta-analysis.
Non-linear meta-analysis will be applied when the data suggest that the dose-response
curve is non-linear and when detecting a threshold of exposure might be of interest.
Considering a non-linear dose-response curve using the Greenland and Longnecker’s
pool-last approach is not possible. However a non-linear dose-response can be
examined if means and covariances of the individual studies are pooled before
estimating the slope (pool first approach).
Non-linear dose-response meta-analysis will be conducted using the pool first
approach method implemented within Stata by Darren Greenwood (personal
communication). The studies that only provide linear dose-response estimates per unit
of increase will be excluded from the non-linear meta-analysis. The best fitting
nonlinear dose-response curve from a family of fractional polynomials will be
selected. The best model will be the one that gives the most improvement (decrease)
in deviance compared to the linear model.
15. Reports
An update of the report will be produced in 2012 by the IC team. The report will
include the following elements:
15.1 Results of the search
Information on number of records downloaded, number of papers thought
potentially relevant after reading titles and abstracts and number of papers
included. The reasons for excluding papers should also be described.
This information will be summarised in a flowchart.
15. 2 Description of studies identified in the CUP
Number of studies by study design and publication year
Number of studies by population characteristics (gender, geographic area,
others)
Number of studies by exposure (main heading and selected subheadings) and
publication year
Number of studies by exposure and outcome subtype
15.3 Summary of number of studies by exposure and study type in the database,
separated on new (studies identified in the CUP).

18
Example of table of summary study numbers:
Exposure
Code
Exposure
Name
Outcome Number of controlled
trials
Number of cohort studies
Total SLR CUP Total SLR CUP
15.4 Tabulation of study characteristics
Information on the characteristics (e.g. population, exposure, outcome, study design)
and results of the study (e.g. direction and magnitude) of the relevant studies will be
summarised in tables using the same format as for the SLR for the Second Expert
Report1.
Within this table the studies should be ordered according to design (trials, cohort
studies).
Example of table of study characteristics (in two parts below):
Author,
Year,
country,
WCRF
Code
Study
design
Country, Ethnicity,
other
characteristics
Age
(mean)
Cases
(n)
Non cases
(n/person-
years)
Case
ascertainment
Follow-up
(years)
Adjustment factors Assessment
details
Category
of
exposure
Subgroup No
cat
OR (95%
CI)
p
trend
A B C D E F G
Where
A: Age
B: Oral contraceptive use, parity, hormone replacement therapy use
C: Smoking
D: Anthropometry: height, BMI, others
E: Physical activity
F: Energy intake, other dietary factors
G: Others, e.g. Family history of the cancer, marital status, race, socioeconomic
status
15. 5 Graphic presentation
Tabular presentation may be complemented with graphic displays when the elevated
number of studies justifies it. Study results will be displayed in forest plots showing
relative risk estimates and 95% confidence interval of ‘‘high versus low’’
comparisons for each study. No summary effect estimate of high versus low
comparison will be calculated. Studies will be ordered chronologically.
Dose-response graphs are given for individual studies in which the information is
available.
15.6 Results of meta-analysis

19
Main characteristics of included and excluded studies in dose-response meta-analysis
will be tabulated, and reasons for exclusions will be detailed.
The results of meta-analysis will be presented in tables and forest plots, as well as the
results of the exploration of heterogeneity and sensitivity analyses.
Studies already included in a meta-analysis during the SLR for the Second Expert
Report will be identified with a star (*).
15.7 Future reports
After 2012, the CUP team at Imperial College will produce annual reports with tables
summarising number of studies identified in the CUP and total number of studies by
exposure. An updated report with meta-analyses will be produced upon
recommendation of the WCRF Secretariat and the CUP Panel of Experts.
References
1. World Cancer Research Fund/ American Institute for Cancer Research. Systematic
Literature Review. The SLR Specification Manual In : Food, Nutrition, Physical
Activity and the Prevention of Cancer: A Global Perspective (Support
Resource).Washington DC: AICR , 2007
2. World Cancer Research Fund/ American Institute for Cancer Research. Kaiser
Permanente SLR Team: Systematic Literature Review. The associations between
food, nutrition and physical activity and the risk of endometrial cancer and
underlying mechanisms. In: Food, Nutrition, Physical Activity and the Prevention of
Cancer: A Global Perspective (Support Resource).Washington DC: AICR , 2007
3. World Cancer Research Fund/ American Institute for Cancer Research. National
Cancer Institute Milan, Italy SLR Team: Systematic Literature Review. The
associations between food, nutrition and physical activity and the risk of ovarian
cancer and underlying mechanisms. In: Food, Nutrition, Physical Activity and the
Prevention of Cancer: A Global Perspective (Support Resource).Washington DC:
AICR , 2007
4. Ferlay J, Shin HR, Bray F, Forman D, Mathers C and Parkin DM. GLOBOCAN
2008, Cancer Incidence and Mortality Worldwide: IARC CancerBase No. 10
[Internet]. Lyon, France: International Agency for Research on Cancer; 2010.
Available from: http://globocan.iarc.fr
5. World Cancer Research Fund/ American Institute for Cancer Research. Food,
Nutrition, Physical Activity and the Prevention of Cancer: A Global Perspective.page
305 Washington DC: AICR , 2007
6. Schorge JO, Modesitt SC, Coleman RL, Cohn DE, Kauff ND, Duska LR, Herzog
TJ.SGO White Paper on ovarian cancer: etiology, screening and surveillance.
Gynecol Oncol. 2010 Oct; 119(1):7-17.

20
7. Stang A. Critical evaluation of the Newcastle-Ottawa scale for the assessment of
the quality of nonrandomized studies in meta-analyses. European Journal of
Epidemiology 25 (9): 603-605, DOI: 10.1007/s10654-010-9491-z.
8. Cochrane Handbook for Systematic Reviews of Interventions [Internet] Available
from http://www.cochrane.org/training/cochrane-handbook.
9. N Orsini, R Bellocco and S Greenland, Generalized least squares for trend
estimation of summarized dose-response data, Stata J 6 (2006), pp. 40–57.
10. Chêne G, Thompson SG. Methods for summarizing the risk associations of
quantitative variables in epidemiologic studies in a consistent form.Am J Epidemiol.
1996; 144(6):610-21.
11. DerSimonian R, Laird N (1986) Meta-analysis in clinical trials. Control Clin
Trials 7:177–188
12. Bekkering GE et al. How much of the data published in observational studies of
the association between diet and prostate or bladder cancer is usable for meta-
analysis? Am J Epidemiol (2008); 167(9):1017-26.
13. JP Higgins and SG Thompson, Quantifying heterogeneity in a meta-analysis, Stat
Med 21 (2002), pp. 1539–1558.
14. A Tobias. Assessing the influence of a single study in meta-analysis, Stata Tech
Bull 47 (1999), pp. 15–17.

AI-1
Annex 1.
WCRF - PUBMED SEARCH STRATEGY
a) Searching for all studies relating to food, nutrition and physical activity:
#1 diet therapy[MeSH Terms] OR nutrition[MeSH Terms] #2 diet[tiab] OR diets[tiab] OR dietetic[tiab] OR dietary[tiab] OR eating[tiab] OR intake[tiab] OR nutrient*[tiab] OR nutrition[tiab] OR vegetarian*[tiab] OR vegan*[tiab] OR "seventh day adventist"[tiab] OR macrobiotic[tiab] #3 food and beverages[MeSH Terms] #4 food*[tiab] OR cereal*[tiab] OR grain*[tiab] OR granary[tiab] OR wholegrain[tiab] OR wholewheat[tiab] OR roots[tiab] OR plantain*[tiab] OR tuber[tiab] OR tubers[tiab] OR vegetable*[tiab] OR fruit*[tiab] OR pulses[tiab] OR beans[tiab] OR lentils[tiab] OR chickpeas[tiab] OR legume*[tiab] OR soy[tiab] OR soya[tiab] OR
nut[tiab] OR nuts[tiab] OR peanut*[tiab] OR groundnut*[tiab] OR (seeds[tiab] and
(diet*[tiab] OR food*[tiab])) OR meat[tiab] OR beef[tiab] OR pork[tiab] OR lamb[tiab] OR poultry[tiab] OR chicken[tiab] OR turkey[tiab] OR duck[tiab] OR fish[tiab] OR
((fat[tiab] OR fats[tiab] OR fatty[tiab]) AND (diet*[tiab] or food*[tiab] or adipose[tiab]
or blood[tiab] or serum[tiab] or plasma[tiab])) OR egg[tiab] OR eggs[tiab] OR
bread[tiab] OR (oils[tiab] AND and (diet*[tiab] or food*[tiab] or adipose[tiab] or
blood[tiab]or serum[tiab] or plasma[tiab])) OR shellfish[tiab] OR seafood[tiab] OR sugar[tiab] OR syrup[tiab] OR dairy[tiab] OR milk[tiab] OR herbs[tiab] OR spices[tiab] OR chilli[tiab] OR chillis[tiab] OR pepper*[tiab] OR condiments[tiab] OR tomato*[tiab] #5 fluid intake[tiab] OR water[tiab] OR drinks[tiab] OR drinking[tiab] OR tea[tiab] OR coffee[tiab] OR caffeine[tiab] OR juice[tiab] OR beer[tiab] OR spirits[tiab] OR liquor[tiab] OR wine[tiab] OR alcohol[tiab] OR alcoholic[tiab] OR beverage*[tiab] OR
(ethanol[tiab] and (drink*[tiab] or intake[tiab] or consumption[tiab])) OR yerba mate[tiab] OR ilex paraguariensis[tiab] #6 pesticides[MeSH Terms] OR fertilizers[MeSH Terms] OR "veterinary drugs"[MeSH Terms] #7 pesticide*[tiab] OR herbicide*[tiab] OR DDT[tiab] OR fertiliser*[tiab] OR fertilizer*[tiab] OR organic[tiab] OR contaminants[tiab] OR contaminate*[tiab] OR veterinary drug*[tiab] OR polychlorinated dibenzofuran*[tiab] OR PCDF*[tiab] OR polychlorinated dibenzodioxin*[tiab] OR PCDD*[tiab] OR polychlorinated biphenyl*[tiab] OR PCB*[tiab] OR cadmium[tiab] OR arsenic[tiab] OR chlorinated hydrocarbon*[tiab] OR microbial contamination*[tiab] #8 food preservation[MeSH Terms] #9 mycotoxin*[tiab] OR aflatoxin*[tiab] OR pickled[tiab] OR bottled[tiab] OR bottling[tiab] OR canned[tiab] OR canning[tiab] OR vacuum pack*[tiab] OR refrigerate*[tiab] OR refrigeration[tiab] OR cured[tiab] OR smoked[tiab] OR preserved[tiab] OR preservatives[tiab] OR nitrosamine[tiab] OR hydrogenation[tiab] OR fortified[tiab] OR additive*[tiab] OR colouring*[tiab] OR coloring*[tiab] OR flavouring*[tiab] OR flavoring*[tiab] OR nitrates[tiab] OR nitrites[tiab] OR solvent[tiab] OR solvents[tiab] OR ferment*[tiab] OR processed[tiab] OR antioxidant*[tiab] OR genetic modif*[tiab] OR genetically modif*[tiab] OR vinyl chloride[tiab] OR packaging[tiab] OR labelling[tiab] OR phthalates[tiab] #10 cookery[MeSH Terms] #11 cooking[tiab] OR cooked[tiab] OR grill[tiab] OR grilled[tiab] OR fried[tiab] OR fry[tiab] OR roast[tiab] OR bake[tiab] OR baked[tiab] OR stewing[tiab] OR stewed[tiab] OR casserol*[tiab] OR broil[tiab] OR broiled[tiab] OR boiled[tiab] OR (microwave[tiab]
and (diet*[tiab] or food*[tiab])) OR microwaved[tiab] OR re-heating[tiab] OR reheating[tiab] OR heating[tiab] OR re-heated[tiab] OR heated[tiab] OR poach[tiab] OR
AI-2
poached[tiab] OR steamed[tiab] OR barbecue*[tiab] OR chargrill*[tiab] OR heterocyclic amines[tiab] OR polycyclic aromatic hydrocarbons[tiab]
#12 ((carbohydrates[MeSH Terms] OR proteins[MeSH Terms]) and (diet*[tiab] or
food*[tiab])) OR sweetening agents[MeSH Terms] #13 salt[tiab] OR salting[tiab] OR salted[tiab] OR fiber[tiab] OR fibre[tiab] OR polysaccharide*[tiab] OR starch[tiab] OR starchy[tiab] OR carbohydrate*[tiab] OR
lipid*[tiab] OR ((linoleic acid*[tiab] OR sterols[tiab] OR stanols[tiab]) AND (diet*[tiab]
or food*[tiab] or adipose [tiab] or blood[tiab] or serum[tiab] or plasma[tiab])) OR sugar*[tiab] OR sweetener*[tiab] OR saccharin*[tiab] OR aspartame[tiab] OR acesulfame[tiab] OR cyclamates[tiab] OR maltose[tiab] OR mannitol[tiab] OR sorbitol[tiab] OR sucrose[tiab] OR xylitol[tiab] OR cholesterol[tiab] OR protein[tiab] OR proteins[tiab] OR hydrogenated dietary oils[tiab] OR hydrogenated lard[tiab] OR hydrogenated oils[tiab] #14 vitamins[MeSH Terms] #15 supplements[tiab] OR supplement[tiab] OR vitamin*[tiab] OR retinol[tiab] OR carotenoid*[tiab] OR tocopherol[tiab] OR folate*[tiab] OR folic acid[tiab] OR methionine[tiab] OR riboflavin[tiab] OR thiamine[tiab] OR niacin[tiab] OR
pyridoxine[tiab] OR cobalamin[tiab] OR mineral*[tiab] OR (sodium[tiab] AND
(diet*[tiab] or food*[tiab])) OR iron[tiab] OR ((calcium[tiab] AND (diet*[tiab] or
food*[tiab] or supplement*[tiab])) OR selenium[tiab] OR (iodine[tiab] AND and
(diet*[tiab] or food*[tiab] or supplement*[tiab] or deficiency)) OR magnesium[tiab] OR potassium[tiab] OR zinc[tiab] OR copper[tiab] OR phosphorus[tiab] OR manganese[tiab] OR chromium[tiab] OR phytochemical[tiab] OR allium[tiab] OR isothiocyanate*[tiab] OR glucosinolate*[tiab] OR indoles[tiab] OR polyphenol*[tiab] OR phytoestrogen*[tiab] OR genistein[tiab] OR saponin*[tiab] OR coumarin*[tiab] OR lycopene[tiab] #16 physical fitness[MeSH Terms] OR exertion[MeSH Terms] OR physical endurance[MeSH Terms] or walking[MeSH Terms] #17 recreational activit*[tiab] OR household activit*[tiab] OR occupational activit*[tiab] OR physical activit*[tiab] OR physical inactivit*[tiab] OR exercise[tiab] OR exercising[tiab] OR energy intake[tiab] OR energy expenditure[tiab] OR energy balance[tiab] OR energy density[tiab] #18 body weight [MeSH Terms] OR anthropometry[MeSH Terms] OR body composition[MeSH Terms] OR body constitution[MeSH Terms] #19 weight loss[tiab] or weight gain[tiab] OR anthropometry[tiab] OR birth weight[tiab] OR birthweight[tiab] OR birth-weight[tiab] OR child development[tiab] OR height[tiab] OR body composition[tiab] OR body mass[tiab] OR BMI[tiab] OR obesity[tiab] OR obese[tiab] OR overweight[tiab] OR over-weight[tiab] OR over weight[tiab] OR skinfold measurement*[tiab] OR skinfold thickness[tiab] OR DEXA[tiab] OR bio-impedence[tiab] OR waist circumference[tiab] OR hip circumference[tiab] OR waist hip ratio*[tiab] #20 #1 OR #2 OR #3 OR #4 OR #5 OR #6 OR #7 OR #8 OR #9 OR #10 OR #11 OR #12 OR #13 OR #14 OR #15 OR #16 OR #17 OR #18 OR #19 #21 animal[MeSH Terms] NOT human[MeSH Terms] #22 #20 NOT #21
b) Searching for all studies relating to endometrial cancer:
#23 endometrial neoplasm [MeSH]
#24 malign* [tiab] OR cancer*[tiab] OR carcinoma*[tiab] OR tumor*[tiab] OR
tumour*[tiab]

AI-3
#25 endometr* [tiab] OR corpus uteri [tiab] OR uterine [tiab]
#26 #24 AND #25
#27 #23 AND #26
c) Searching for all studies relating endometrial cancer, and food, nutrition and physical
activity:
#28 #22 AND #27
d) Searching for all studies relating to ovarian cancer:
#29 Ovarian Neoplasms [MeSH]
#30 Ovar* AND (cancer* OR carcinoma* OR neoplasm* OR tumor* OR tumour* OR
adenocarcinoma* Or Endometrioid carcinoma* OR cystoadenoma* OR
cystoadenocarcinoma* OR adenoma*)
#31 Androblastom* OR arrhenoblastoma* OR sertoli leydig OR Brenner OR granulosa
cell tumor* OR granulosa cell tumour* OR luteoma* OR luteinoma*
#32 #29 OR #30 OR #31
e) Searching for all studies relating endometrial cancer, and food, nutrition and physical
activity:
#1 #22 AND #32

Annex 2. List of exposure codes (new sub-exposure codes indicated with *)
1 Patterns of diet
1.1 Regionally defined diets
*1.1.1 Mediterranean diet
Include all regionally defined diets, evident in the literature. These are likely to
include Mediterranean, Mesoamerican, oriental, including Japanese and Chinese,
and “western type”.
1.2 Socio-economically defined diets
To include diets of low-income, middle-income and high-income countries (presented,
when available in this order). Rich and poor populations within low-income, middle-
income and high-income countries should also be considered. This section should
also include the concept of poverty diets (monotonous diets consumed by
impoverished populations in the economically-developing world mostly made up of
one starchy staple, and may be lacking in micronutrients).
1.3 Culturally defined diets
To include dietary patterns such as vegetarianism, vegan diets, macrobiotic diets and
diets of Seventh-day Adventists.
1.4 Individual level dietary patterns
To include work on factor and cluster analysis, and various scores and indexes (e.g.
diet diversity indexes) that do not fit into the headings above.
1.5 Other dietary patterns
Include under this heading any other dietary patterns present in the literature, that
are not regionally, socio-economically, culturally or individually defined.
1.6 Breastfeeding
1.6.1 Mother
Include here also age at first lactation, duration of breastfeeding, number of children
breast-fed
1.6.2 Child
Results concerning the effects of breastfeeding on the development of cancer should
be disaggregated into effects on the mother and effects on the child. Wherever

possible detailed information on duration of total and exclusive breastfeeding, and of
complementary feeding should be included.
1.7 Other issues
For example results related to diet diversity, meal frequency, frequency of snacking,
dessert-eating and breakfast-eating should be reported here. Eating out of home
should be reported here.
2 Foods
*2.0.1 Plant foods
2.1 Starchy foods
2.1.1 Cereals (grains)
* 2.1.1.0.1 Rice, pasta, noodles
* 2.1.1.0.2 Bread
* 2.1.1.0.3 Cereal
* Report under this subheading the cereals when it is not specified if they are
wholegrain or refined cereals (e.g. fortified cereals)
2.1.1.1 Wholegrain cereals and cereal products
* 2.1.1.1.1 Wholegrain rice, pasta, noodles
* 2.1.1.1.2 Wholegrain bread
* 2.1.1.1.3 Wholegrain cereal
2.1.1.2 Refined cereals and cereal products
* 2.1.1.2.1 Refined rice, pasta, noodles
* 2.1.1.2.2 Refined bread
* 2.1.1.2.3 Refined cereal
2.1.2 Starchy roots, tubers and plantains
* 2.1.2.1 Potatoes
2.1.3 Other starchy foods
*Report polenta under this heading
2.2 Fruit and (non-starchy) vegetables
Results for “fruit and vegetables” and “fruits, vegetables and fruit juices” should be
reported here. If the definition of vegetables used here is different from that used in
the first report, this should be highlighted.
2.2.1 Non-starchy vegetables

This heading should be used to report total non-starchy vegetables. If results about
specific vegetables are reported they should be recorded under one of the sub-
headings below or if not covered, they should be recorded under ‘2.2.1.5 other’. 2.2.1.1 Non-starchy root vegetables and tubers
*2.2.1.1.1 Carrots
2.2.1.2 Cruciferous vegetables
2.2.1.3 Allium vegetables
2.2.1.4 Green leafy vegetables (not including cruciferous vegetables)
2.2.1.5 Other non-starchy vegetables
*2.2.1.5.13 Tomatoes
*2.2.1.5.1 Fresh beans (e.g. string beans, French beans) and peas
Other non-starchy vegetables’ should include foods that are botanically fruits but are
eaten as vegetables, e.g. courgettes. In addition vegetables such as French beans that
do not fit into the other categories, above.
If there is another sub-category of vegetables that does not easily fit into a category
above eg salted root vegetables (ie you do not know if it is starchy or not) then report
under 2.2.1.5. and note the precise definition used by the study. If in doubt, enter the
exposure more than once in this way.
2.2.1.6 Raw vegetables
This section should include any vegetables specified as eaten raw. Results concerning
specific groups and type of raw vegetable should be reported twice i.e. also under the
relevant headings 2.2.1.1 –2.2.1.5.
2.2.2 Fruits
*2.2.2.0.1 Fruit, dried
*2.2.2.0.2 Fruit, canned
*2.2.2.0.3 Fruit, cooked
2.2.2.1 Citrus fruit
2.2.2.1.1 Oranges
2.2.2.1.2 Other citrus fruits (e.g. grapefruits)
2.2.2.2 Other fruits
*2.2.2.2.1 Bananas
*2.2.2.2.4 Melon
*2.2.2.2.5 Papaya
*2.2.2.2.7 Blueberries, strawberries and other berries
*2.2.2.2.8 Apples, pears
*2.2.2.2.10 Peaches, apricots, plums
*2.2.2.2.11 Grapes
If results are available that consider other groups of fruit or a particular fruit please
report under ‘other’, specifying the grouping/fruit used in the literature.
2.3 Pulses (legumes)
*2.3.1 Soya, soya products
*2.3.1.1 Miso, soya paste soup
*2.3.1.2 Soya juice
*2.3.1.4 Soya milk
*2.3.1.5 Tofu
*2.3.2 Dried beans, chickpeas, lentiles
*2.3.4 Peanuts, peanut products
Where results are available for a specific pulse/legume, please report under a
separate heading.
2.4 Nuts and Seeds
To include all tree nuts and seeds, but not peanuts (groundnuts). Where results are
available for a specific nut/seed, e.g. brazil nuts, please report under a separate
heading.
2.5 Meat, poultry, fish and eggs
Wherever possible please differentiate between farmed and wild meat, poultry and
fish.
2.5.1 Meat
This heading refers only to red meat: essentially beef, lamb, pork from farmed
domesticated animals either fresh or frozen, or dried without any other form of
preservation. It does not refer to poultry or fish.
Where there are data for offal (organs and other non-flesh parts of meat) and also
when there are data for wild and non-domesticated animals, please show these
separately under this general heading as a subcategory.
2.5.1.1 Fresh Meat
2.5.1.2 Processed meat
*2.5.1.2.1 Ham
*2.5.1.2.1.7 Burgers
*2.5.1.2.8 Bacon
*2.5.1.2.9 Hot dogs
*2.5.1.2.10 Sausages
Repeat results concerning processed meat here and under the relevant section under
4. Food Production and Processing. Please record the definition of ‘processed meat’
used by each study.

2.5.1.3 Red meat
*2.5.1.3.1 Beef
*2.5.1.3.2 Lamb
*2.5.1.3.3 Pork
*2.5.1.3.6 Horse, rabbit, wild meat (game)
Where results are available for a particular type of meat, e.g. beef, pork or lamb,
please report under a separate heading.
Show any data on wild meat (game) under this heading as a separate sub-category.
2.5.1.4 Poultry
Show any data on wild birds under this heading as a separate sub-category.
*2.5.1.5 Offals, offal products (organ meats)
2.5.2 Fish
*2.5.2.3 Fish, processed (dried, salted, smoked)
*2.5.2.5 Fatty Fish
*2.5.2.7 Dried Fish
*2.5.2.9 White fish, lean fish 2.5.3 Shellfish and other seafood
2.5.4 Eggs
2.6 Fats, oils and sugars
2.6.1 Animal fats
*2.6.1.1 Butter
*2.6.1.2 Lard
*2.6.1.3 Gravy
*2.6.1.4 Fish oil
2.6.2 Plant oils
2.6.3 Hydrogenated fats and oils
*2.6.3.1 Margarine
Results concerning hydrogenated fats and oils should be reported twice, here and
under 4.3.2 Hydrogenation
2.6.4 Sugars
This heading refers to added (extrinsic) sugars and syrups as a food, that is refined
sugars, such as table sugar, or sugar used in bakery products.

2.7 Milk and dairy products
Results concerning milk should be reported twice, here and under 3.3 Milk
*2.7.1 Milk, fresh milk, dried milk
*2.7.1.1 Whole milk, full-fat milks
*2.7.1.2 Semi skimmed milk, skimmed milk, low fat milk, 2% Milk
*2.7.2 Cheese
*2.7.2.1 Cottage cheese
*2.7.2.2 Cheese, low fat
*2.7.3 Yoghurt, buttermilk, sour milk, fermented milk drinks
*2.7.3.1 Fermented whole milk
*2.7.3.2 Fermented skimmed milk
*2.7.7 Ice cream
2.8 Herbs, spices, condiments
*2.8.1 Ginseng
*2.8.2 Chili pepper, green chili pepper, red chili pepper
2.9 Composite foods
Eg, snacks, crisps, desserts, pizza. Also report any mixed food exposures here ie if an
exposure is reported as a combination of 2 or more foods that cross categories (eg
bacon and eggs). Label each mixed food exposure.
*2.9.1 Cakes, biscuits and pastry
*2.9.2 Cookies
*2.9.3 Confectionery
*2.9.4 Soups
*2.9.5 Pizza
*2.9.6 Chocolate, candy bars
*2.9.7 Snacks
3 Beverages
3.1 Total fluid intake
3.2 Water
3.3 Milk
For results concerning milk please report twice, here and under 2.7 Milk and Dairy
Products.

3.4 Soft drinks
Soft drinks that are both carbonated and sugary should be reported under this
general heading. Drinks that contain artificial sweeteners should be reported
separately and labelled as such.
3.4.1 Sugary (not carbonated)
3.4.2 Carbonated (not sugary)
The precise definition used by the studies should be highlighted, as definitions used
for various soft drinks vary greatly.
*3.5 Fruit and vegetable juices
*3.5.1 Citrus fruit juice
*3.5.2 Fruit juice
*3.5.3 Vegetable juice
*3.5.4 Tomato juice
3.6 Hot drinks
3.6.1 Coffee
3.6.2 Tea
Report herbal tea as a sub-category under tea.
3.6.2.1 Black tea
3.6.2.2 Green tea 3.6.3 Maté
3.6.4 Other hot drinks
3.7 Alcoholic drinks
3.7.1 Total
3.7.1.1 Beers
3.7.1.2 Wines
3.7.1.3 Spirits
3.7.1.4 Other alcoholic drinks
4 Food production, preservation, processing and preparation
4.1 Production
4.1.1 Traditional methods (to include ‘organic’)
4.1.2 Chemical contaminants
Only results based on human evidence should be reported here (see instructions for
dealing with mechanistic studies). Please be comprehensive and cover the exposures
listed below:
4.1.2.1 Pesticides

4.1.2.2 DDT
4.1.2.3 Herbicides
4.1.2.4 Fertilisers
4.1.2.5 Veterinary drugs
4.1.2.6 Other chemicals
4.1.2.6.1 Polychlorinated dibenzofurans (PCDFs)
4.1.2.6.2 Polychlorinated dibenzodioxins (PCDDs)
4.1.2.6.3 Polychlorinated biphenyls (PCBs)
4.1.2.7 Heavy metals
4.1.2.7.1 Cadmium
4.1.2.7.2 Arsenic
4.1.2.8 Waterborne residues
4.1.2.8.1 Chlorinated hydrocarbons
4.1.2.9 Other contaminants
Please also report any results that cover the cumulative effect of low doses of
contaminants in this section.
4.2 Preservation
4.2.1 Drying
4.2.2 Storage
4.2.2.1 Mycotoxins
4.2.2.1.1 Aflatoxins
4.2.2.1.2 Others
4.2.3 Bottling, canning, vacuum packing
4.2.4 Refrigeration
4.2.5 Salt, salting
4.2.5.1 Salt
4.2.5.2 Salting
4.2.5.3 Salted foods
4.2.5.3.1 Salted animal food
4.2.5.3.2 Salted plant food
4.2.6 Pickling
4.2.7 Curing and smoking
4.2.7.1 Cured foods
4.2.7.1.1 Cured meats
4.2.7.1.2 Smoked foods

For some cancers e.g. colon, rectum, stomach and pancreas, it may be important to
report results about specific cured foods, cured meats and smoked meats. N-
nitrososamines should also be covered here.
4.3 Processing
4.3.1 Refining
Results concerning refined cereals and cereal products should be reported twice, here
and under 2.1.1.2 refined cereals and cereal products.
4.3.2 Hydrogenation
Results concerning hydrogenated fats and oils should be reported twice, here and
under 2.6.3 Hydrogenated fats and oils
4.3.3 Fermenting
4.3.4 Compositional manipulation
4.3.4.1 Fortification
4.3.4.2 Genetic modification
4.3.4.3 Other methods
4.3.5 Food additives
4.3.5.1 Flavours
Report results for monosodium glutamate as a separate category under 4.3.5.1
Flavours.
4.3.5.2 Sweeteners (non-caloric)
4.3.5.3 Colours
4.3.5.4 Preservatives
4.3.5.4.1 Nitrites and nitrates
4.3.5.5 Solvents
4.3.5.6 Fat substitutes
4.3.5.7 Other food additives
Please also report any results that cover the cumulative effect of low doses of
additives.
Please also report any results that cover synthetic antioxidants
4.3.6 Packaging
4.3.6.1 Vinyl chloride
4.3.6.2 Phthalates
4.4 Preparation
4.4.1 Fresh food

4.4.1.1 Raw
Report results regarding all raw food other than fruit and vegetables here. There is a
separate heading for raw fruit and vegetables (2.2.1.6).
4.4.1.2 Juiced
4.4.2 Cooked food
4.4.2.1 Steaming, boiling, poaching
4.4.2.2 Stewing, casseroling
4.4.2.3 Baking, roasting
4.4.2.4 Microwaving
4.4.2.5 Frying
4.4.2.6 Grilling (broiling) and barbecuing
4.4.2.7 Heating, re-heating
Some studies may have reported methods of cooking in terms of temperature or
cooking medium, and also some studies may have indicated whether the food was
cooked in a direct or indirect flame. When this information is available, it should be
included in the SLR report.
Results linked to mechanisms e.g. heterocyclic amines, acrylamides and polycyclic
aromatic hydrocarbons should also be reported here. There may also be some
literature on burned food that should be reported in this section.
5 Dietary constituents
Food constituents’ relationship to outcome needs to be considered in relation to dose
and form including use in fortified foods, food supplements, nutrient supplements and
specially formulated foods. Where relevant and possible these should be
disaggregated.
5.1 Carbohydrate
5.1.1 Total carbohydrate
5.1.2 Non-starch polysaccharides/dietary fibre
5.1.2.1 Cereal fibre
5.1.2.2 Vegetable fibre
5.1.2.3 Fruit fibre
5.1.3 Starch
5.1.3.1 Resistant starch
5.1.4 Sugars *5.1.5 Glycemic index, glycemic load
This heading refers to intrinsic sugars that are naturally incorporated into the
cellular structure of foods, and also extrinsic sugars not incorporated into the cellular
structure of foods. Results for intrinsic and extrinsic sugars should be presented
separately. Count honey and sugars in fruit juices as extrinsic. They can be natural
and unprocessed, such as honey, or refined such as table sugar. Any results related to
specific sugars e.g. fructose should be reported here.
5.2 Lipids
5.2.1 Total fat
5.2.2 Saturated fatty acids
5.2.3 Monounsaturated fatty acids
5.2.4 Polyunsaturated fatty acids
5.2.4.1 n-3 fatty acids
Where available, results concerning alpha linolenic acid and long chain n-3 PUFA
should be reported here, and if possible separately.
5.2.4.2 n-6 fatty acids
5.2.4.3 Conjugated linoleic acid
5.2.5 Trans fatty acids
5.2.6 Other dietary lipids, cholesterol, plant sterols and stanols.
For certain cancers, e.g. endometrium, lung, and pancreas, results concerning dietary
cholesterol may be available. These results should be reported under this section.
5.3 Protein
5.3.1 Total protein
5.3.2 Plant protein
5.3.3 Animal protein
5.4 Alcohol
This section refers to ethanol the chemical. Results related to specific alcoholic drinks
should be reported under 3.7 Alcoholic drinks. Past alcohol refers, for example, to
intake at age 18, during adolescence, etc.
*5.4.1 Total Alcohol (as ethanol)
*5.4.1.1 Alcohol (as ethanol) from beer
*5.4.1.2 Alcohol (as ethanol) from wine
*5.4.1.3 Alcohol (as ethanol) from spirits
*5.4.1.4 Alcohol (as ethanol) from other alcoholic drinks
* 5.4.1.5 Total alcohol (as ethanol), lifetime exposure
* 5.4.1.6 Total alcohol (as ethanol), past
5.5 Vitamins

*5.5.0 Vitamin supplements
*5.5.0.1 Vitamin and mineral supplements
*5.5.0.2 Vitamin B supplement
5.5.1 Vitamin A
5.5.1.1 Retinol
5.5.1.2 Provitamin A carotenoids
5.5.2 Non-provitamin A carotenoids
Record total carotenoids under 5.5.2 as a separate category marked Total
Carotenoids.
5.5.3 Folates and associated compounds
*5.5.3.1 Total folate
*5.5.3.2 Dietary folate
*5.5.3.3 Folate from supplements
Examples of the associated compounds are lipotropes, methionine and other methyl
donors.
5.5.4 Riboflavin
5.5.5 Thiamin (vitamin B1)
5.5.6 Niacin
5.5.7 Pyridoxine (vitamin B6)
5.5.8 Cobalamin (vitamin B12)
5.5.9 Vitamin C
5.5.10 Vitamin D (and calcium)
5.5.11 Vitamin E
5.5.12 Vitamin K
5.5.13 Other
If results are available concerning any other vitamins not listed here, then these
should be reported at the end of this section. In addition, where information is
available concerning multiple vitamin deficiencies, these should be reported at the
end of this section under ‘other’.
5.6 Minerals
5.6.1 Sodium
5.6.2 Iron
5.6.3 Calcium (and Vitamin D)
5.6.4 Selenium
5.6.5 Iodine
5.6.6 Other
Results are likely to be available on other minerals e.g. magnesium, potassium, zinc,
copper, phosphorus, manganese and chromium for certain cancers. These should be
reported at the end of this section when appropriate under ‘other’.
5.7 Phytochemicals

5.7.1 Allium compounds
5.7.2 Isothiocyanates
5.7.3 Glucosinolates and indoles
5.7.4 Polyphenols
5.7.5 Phytoestrogens eg genistein
5.7.6 Caffeine
5.7.7 Other
Where available report results relating to other phytochemicals such as saponins and
coumarins. Results concerning any other bioactive compounds, which are not
phytochemicals should be reported under the separate heading ‘other bioactive
compounds’. Eg flavonoids, isoflavonoids, glycoalkaloids, cyanogens,
oligosaccharides and anthocyanins should be reported separately under this heading.
5.8 Other bioactive compounds
6 Physical activity
6.1 Total physical activity (overall summary measures)
6.1.1 Type of activity
6.1.1.1 Occupational
6.1.1.2 Recreational
6.1.1.3 Household
6.1.1.4 Transportation
6.1.2 Frequency of physical activity
*6.1.2.1 Frequency of occupational physical activity
*6.1.2.2 Frequency of recreational physical activity
6.1.3 Intensity of physical activity
*6.1.3.1 Intensity of occupational physical activity
*6.1.3.2 Intensity of recreational physical activity
6.1.4 Duration of physical activity
*6.1.4.1 Duration of occupational physical activity *6.1.4.2 Duration of recreational physical activity
6.2 Physical inactivity
6.3 Surrogate markers for physical activity e.g. occupation
7 Energy balance
7.1 Energy intake
*7.1.0.1 Energy from fats
*7.1.0.2 Energy from protein

*7.1.0.3 Energy from carbohydrates
*7.1.0.4 Energy from alcohol
*7.1.0.5 Energy from all other sources
7.1.1 Energy density of diet
7.2 Energy expenditure
8 Anthropometry
8.1 Markers of body composition
8.1.1 BMI 8.1.2 Other weight adjusted for height measures
8.1.3 Weight
8.1.4 Skinfold measurements
8.1.5 Other (e.g. DEXA, bio- impedance, etc)
8.1.6 Change in body composition (including weight gain)
8.2 Markers of distribution of fat
8.2.1 Waist circumference
8.2.2 Hips circumference
8.2.3 Waist to hip ratio
8.2.4 Skinfolds ratio
8.2.5 Other e.g. CT, ultrasound
8.3 Skeletal size
8.3.1 Height (and proxy measures)
8.3.2 Other (e.g. leg length)
8.4 Growth in fetal life, infancy or childhood
8.4.1 Birthweight,
8.4.2 Weight at one year

AIII-1
Annex 3. Tables of excluded and included biomarkers proposed by the SLR centre Bristol.
Extracted from: Food, Nutrition, Physical Activity and the Prevention of Cancer: A Global Perspective
Systematic Literature Review – Support Resource
SLR Prostate Cancer (pp 1185-1186)
The reviewers of the SLR centre Bristol used two chapters (Willet: Nutritional epidemiology (Chapter 9), 1998; Margetts and Nelson: Design
concepts in nutritional epidemiology (Chapter 7), 1997) to guide their decisions. If there was no info, the biomarker was excluded. If one of the
chapters stated the biomarker was useful, the data on validity were checked. Biomarkers with a correlation >0.20 were included. If the chapters
stated that there were no good biomarkers for a nutrient or that the biomarker was valid for certain range of intake only, the biomarker was
excluded. It was assumed that if biomarkers measured in plasma were valid, this would also be true for serum and vice versa.
The reviewers of the SLR centre Bristol have been more inclusive with respect to the validation required for biomarkers of important nutrients and
have therefore added serum/plasma retinol, retinol binding protein, vit B6, ferritin, magnesium, erythrocyte superoxide dismutase (more details
below). They have also included biomarkers where validity is not possible: this happens in the case of toxins and phytochemicals where dietary
data are sparse. Various contaminants, such as cadmium, lead, PCBs in the serum are also included now although validity data are not available.
The level of these chemicals in human tissues is often the only available measure of ingestion.

AIII-2
Measured
in
Include Exclude
Serum Provit A carotenoids: Carotene, B-carotene, Alpha-carotene
Nonprovit A carotenoids: Carotenoids, Lycopene,
Cryptoxanthin (B-), Lutein+zeaxanthin
Vit E: alpha-tocopherol, gamma tocopherol
Selenium
n-3 fatty acids: EPA (Eicosapentaenoic), DHA
(Docosahexaenoic)
Magnesium
Vit A: Retinol &Retinol Binding Protein
Pyridoxic acid (vit B6)
Phytoestrogen: Genistein, Daidzein*
[glycitein, O-desmethylangolensin, equol, enterodiol, and
enterolactone] Chemical food contaminants
Polychlorinated biphenyls (PCBs)
Phytochemicals
Prealbumin
Minerals: Zinc, Copper, Copper/zinc ratio, Zinc/retinol
ratio
Other dietary lipids: Cholesterol, Triglycerides
Saturated fatty acids, Monounsaturated fatty acids,
Polyunsaturated fatty acids
Lipids (as nutrients), Total fat (as nutrients), Total
protein
Urine 4-pyridoxic acid (vit B6) in 24-h urine Nitrosamines
Xanthurenic acid in 24-h urine
Arsenic
Ferritin
Saliva Other dietary lipids: Cholesterol, Triglycerides
Erythrocyte Linoleic acid
Selenium
Superoxide dismutase
Cadmium
Minerals: Zinc, Copper
Monounsaturated fatty acids
n-3 fatty acids: EPA (Eicosapentaenoic), DHA
(Docosahexaenoic)
n-6 fatty acids (other than linoleic acid)
Polyunsaturated fatty acids, Saturated fatty acids
Glutathione peroxidase

AIII-3
Measured
in
Include Exclude
Plasma Vit D
Vit E: alpha-tocopherol, gamma tocopherol
Vit C
Provit A carotenoids: Carotene, Alpha-carotene, B-carotene
Nonprovit A carotenoids: Lycopene, Cryptoxanthin (B-),
zeaxanthin, Lutein
Selenium, Selenoprotein
Folate,
Iron: ferritin
Vit A Retinol: Retinol Binding Protein
Cadmium, Cadmium/zinc ratio
EPA DHA fatty acids
Alkaline phosphatase
Minerals: Zinc, Copper, caeruloplasmin
Other dietary lipids: Cholesterol, Triglycerides, LDL,
HDL
Adipose
tissue
n-3 fatty acids: EPA (Eicosapentaenoic), DHA
(Docosahexaenoic)
n-6 fatty acids
Trans fatty acids , Polyunsaturated fatty acids, Saturated fatty
acids
Unsaturated fat, Monounsaturated fatty acids
n-9 fatty acids
other measures of polyunsat fa: M:S ratio, M:P ratio,
n3-n6 ratio
leucocyte Vit C Zinc
Erythrocyte
membrane
n-6 fatty acids: linoleic n-6 fatty acids (other than linoleic)
n-3 fatty acids: EPA (Eicosapentaenoic), DHA
(Docosahexaenoic)
Hair Minerals: Zinc, Copper, Manganese, Iron
Cadmium
Toenails or
fingernails
Selenium Cadmium, zinc

AIII-4
Reasons for exclusion and inclusion of biomarkers proposed by the SLR centre Bristol.
Extracted from: Food, Nutrition, Physical Activity and the Prevention of Cancer: A Global Perspective
Systematic Literature Review – Support Resource
SLR Prostate Cancer (pp 1187-1189)
(Source: Willet: Nutritional epidemiology (Chapter 9), 1998; Margetts and Nelson: Design concepts in nutritional
epidemiology (Chapter 7), 1997)
Exposure Measured in Valid? Reason (Willett) Reason (Margetts / Nelson)
Retinol
Plasma/se
rum
Yes
Can be measured adequately, but limited
interpretability in well-nourished population (p
190).
Main biochemical marker of vit A intake is
serum retinol (p 194) although in western
countries dietary intake of this vitamin is only a
very minor determinant of its plasma levels.
Retinol-Binding
protein
Serum Yes Retinol levels are highly correlated to
RBP(p192).
May be measure of physiologically available
form. Not if certain disease processes exist (p
192).
Beta-carotene Plasma Yes
Yes (p 194) although blood levels much more
responsive to supplemental beta-carotene than
beta-carotene from food sources (p 193)
Yes (p 197)
Alpha-carotene
Beta-cryptoxanthin
Lutein+zeaxanthin
Lycopene
Plasma Yes Yes (p 194) There is some evidence for interaction between
carotenoids during intestinal absorption, which
may complicate relationship between intake and
blood levels (p 198)
Vit E
Plasma Yes Yes (p 196)
NB. Strong confounding with serum cholesterol
and total lipid concentrations (p 196).
Plasma, red and white blood cells. Yes, if used
for vit E supplements. Yes, although if used for
diet, associations are only moderate (p199)

AIII-5
Exposure Measured
in
Valid? Reason (Willett) Reason (Margetts / Nelson)
Vit D: D25 (OH)D
Plasma
Serum
Yes Yes (P 198/199) NB. Seasonal variation exists,
especially in elderly populations, decreasing in
winter and rising during summer (p 198)
Sunshine exposure is most important
determinant; level is better marker of dietary
intake in subjects with low sun exposure
Both can be used to measure vit D status, but
the higher plasma concentration and lesser
metabolic control of d25 makes this, by far, the
better option (p 198).
Vit D: 1.25 (OH)2D No No. Influenced by calcium and phosphate levels
and parathyroid hormone (p 199).
Vit D: Alkaline
phosphatase activity
Serum No No. Is indirect measure of vit D status and is
susceptible to other disease processes (p 199)
No info
Vit C Plasma
Leukocyt
e
Serum
Yes Yes (p 200). Leukocyte may be preferred for
long-term intake and plasma and serum reflects
more recent intake (p 201)
Yes (p 209), vit C exhibits the strongest and
most significant correlation between intake and
biochemical indices. Known confounders are:
gender, smoking
Vitamin B6 Plasma Yes Yes response to supplementation shows
response in PLP. PLP better measure of short
term rather than long term
Recent studies show that there is unlikely to be
a strong correlation between dietary intake and
plasma pyridoxal phosphate levels (PPL)
PLP and 4 Pyridoxic
acid
Urinary Yes Urinary B6 may be more responsive to recent
dietary intake than plasma PLP. Random
samples of urine 4 –pyridoxic acid correlate
well with 24 hour collections
Folacin (folate)
Serum
Erythrocy
te
Yes Yes good correlation with dietary folate in both
serum and erythrocytes
Used for assessing folate status Table 7.11p
Magnesium Serum Yes Yes stronger correlation with supplement users
than with dietary Mg
Iron Serum
Hair/nails
No
No
No, short-term variability is very high (p 208).
No, remains to be determined
Iron: Ferritin Serum Yes Meat intake predicts serum ferritin level (p 208) No marker of iron intake is satisfactory (p. 192)

AIII-6
Exposure Measured
in
Valid? Reason (Willett) Reason (Margetts / Nelson)
Copper : Superoxide
dismutase
Erythrocy
te
Yes Among four men fed a copper deficient diet for
4 months, erythrocyte S.O.D declined for all 4.
Copper repletion restored S.O.D levels
Copper Plasma/se
rum
No No (p 211): large number of lifestyle
factors/pathologic conditions probably alter
blood copper concentrations (smoking,
infections)
Copper Hair No No evidence (212) and data suggests influenced
by external contamination
No. Copper-dependent enzyme superoxide
dismutase in erythrocytes and copper-protein
complex caeroplasmin in serum have been
shown to be associated with copper intake, but
these markers may be influenced by nondietary
factors (p 193)
Selenium Blood
compone
nts
Toenails
Yes
Yes. Erythrocyte is probably superior to serum
as
measure of long-term intake (p 206). Lower
influence of environment in countries where
wearing shoes is norm (toenails). Selenium
status is reduced by smoking, also in older
persons (p 207); Relationship of selenium with
disease may be modified by other antioxidants
(vit E and C)
Yes (p 193). Relationship between selenium
intake and biomarkers is reasonably good.
Urine: reasonable marker, plasma reflects intake
provided that the range of variation is large. Red
cell and glutathione perioxidase are
markers of longer-term intakes. Hair and
toenails are alternative possibilities, although
contamination of hair samples with shampoo
must be controlled for
Glutathione
perioxidase
Plasma
Serum
Erythrocy
tes
Blood
No Is poor measure of selenium intake among
persons with moderate and high exposure (p
206)

AIII-7
Exposure Measured
in
Valid? Reason (Willett) Reason (Margetts / Nelson)
Zinc
Metallothionein levels
Any
No
No
No (p 212) May be marker of short-term intake
(p 213)
No biochemical marker is a good indicator of
zinc intake (p 192/193). This is, in general
terms, also true for other trace metal nutrients
such as copper, manganese, chromium, etc
Lipids: total fats Any No No (p 213) No, there are no markers of total fat intake (p
215)
Cholesterol, LDL
Lipoprotein levels
Serum No No, but may be useful to predict dietary changes
but not for dietary intake (p 215)
No, relationship dietary cholesterol and
lipoprotein levels of cholesterol are complex
and appears to vary across range of intake
(p218)
Linoleic acid
Plasma
Adipose
tissue
No
Yes
Plasma linoleic acid can discriminate between
groups with relatively large differences in intake
but performs less well on an individual basis (p
220)
Yes (p 220)
No consistent relation between dietary linoleic
acid intake and plasma linoleic acid (p 220).
Across the range of fatty acids in the diet, fatty
acids levels in blood and other tissue (adipose
tissue) reflect the dietary levels. NB levels are
not comparable across tissues
Marine omega-3 fatty
acids (EPA, DHA)
Serum
Plasma
Adipose
tissue
Yes Yes (p 222/223), although dose-response
relation
remains to be determined
Monounsat fatty acids
(oleic acid)
Plasma
Adipose
tissue
No
No
No, plasma levels are poor predictors of oleic
acid intake, but adipose tissue may weakly
reflect oleic acid intake (p. 224). Validity is too
low
Polyunsat fatty acids Adipose
tissue
Yes Yes (p 220) No info

AIII-8
Exposure Measured
in
Valid? Reason (Willett) Reason (Margetts / Nelson)
Saturated fatty acids
(Palmitic acid, stearic
acids)
Adipose
tissue
Plasma
Yes
No
Yes, long term sat fatty acid intake may be
reflected in adipose tissue levels (p 224)
No, levels of palmitic and stearic acids in
plasma do not provide a simple index of intake
(p 224).
No info
Trans-fatty acids Adipose
tissue
Yes Yes (p 225) No info
Protein Any No No (p 226) No
info
Nitrogen Urine Yes Yes, but several 24-h samples are needed to
provide a stable estimate of nitrogen intake (p
227) Nitrogen excretion increases with body
size and exercise and decreased caloric intake
Yes (p 219) One assumes that subjects are in
nitrogen
Balance

AIII-9
Data on validity and reliability of included biomarkers
Extracted from: Food, Nutrition, Physical Activity and the Prevention of Cancer: A Global Perspective
Systematic Literature Review – Support Resource
SLR Prostate Cancer (pp 1187-1189)
Nutrient Biologic
tissue
Val./reproduc Coef Details
Retinol Plasma Validity 0.17 Borderline Correlation between pre-formed vit A intake and plasma retinol.
However plasma retinol is a recognized marker of vit A nutritional status for
undernourished populations
Beta-carotene 0.51 Correlation between plasma beta-carotene level (averaged from 2 samples
taken 1 week apart) and a 7-day diet record estimate of beta-carotene in 98 non-
smoking women (Willett, p 194).
0.38 Cross-sectional correlation between dietary intake of carotene and plasma
betacarotene in 902 adult females. In males (n=880): r=0.20 (Margetts, table
7.9a).
Plasma
Reproducibility 0.45 Correlation for carotene (80% beta-carotene, 20% alpha-carotene) between two
measurements taken 6 years apart (Willett, p 194).
Beta-cryptoxanthin Plasma Validity 0.49 Correlation between plasma beta-carotene level (averaged from 2
Lutein+zeaxanthin Plasma Validity 0.31 samples taken 1 week apart) and a 7-day diet record estimate of beta carotene
Lycopene Plasma Validity 0.50 in 98 non-smoking women (Willett, p 194)
Alpha-carotene Plasma Validity 0.58
Alpha-carotene Plasma Validity 0.43 Cross-sectional correlation between dietary intake of carotene and plasma
alphacarotene in 902 adult females. In males (n=880): r=0.41 (Margetts, table
7.9a).
Carotenoids Plasma Reproducibility !080 Within-person variability of plasma levels over 1 week (Willett, p 194).
Vitamin E
Plasma Validity 0.53 Lipid-adjusted alpha-tocopherol measurements and estimated intake (incl.
supplements). After excluding supplement users: r=0.35 (Willett, p 196)
Plasma Reproducibility 0.65 Unadjusted repeated measures over a 6-year period (p 188). Adjusting for
serum cholesterol reduced correlation to r=0.46 (p 188). Also r=0.65 was found
over a 4-year period in 105 adults in Finland (Willett, p 196).
Plasma Validity 0.20 Cross-sectional correlation between dietary intake of vit E and plasma vit E in
880 adult males. In females (n=906): r=0.14 (Margetts, table 7.9a)
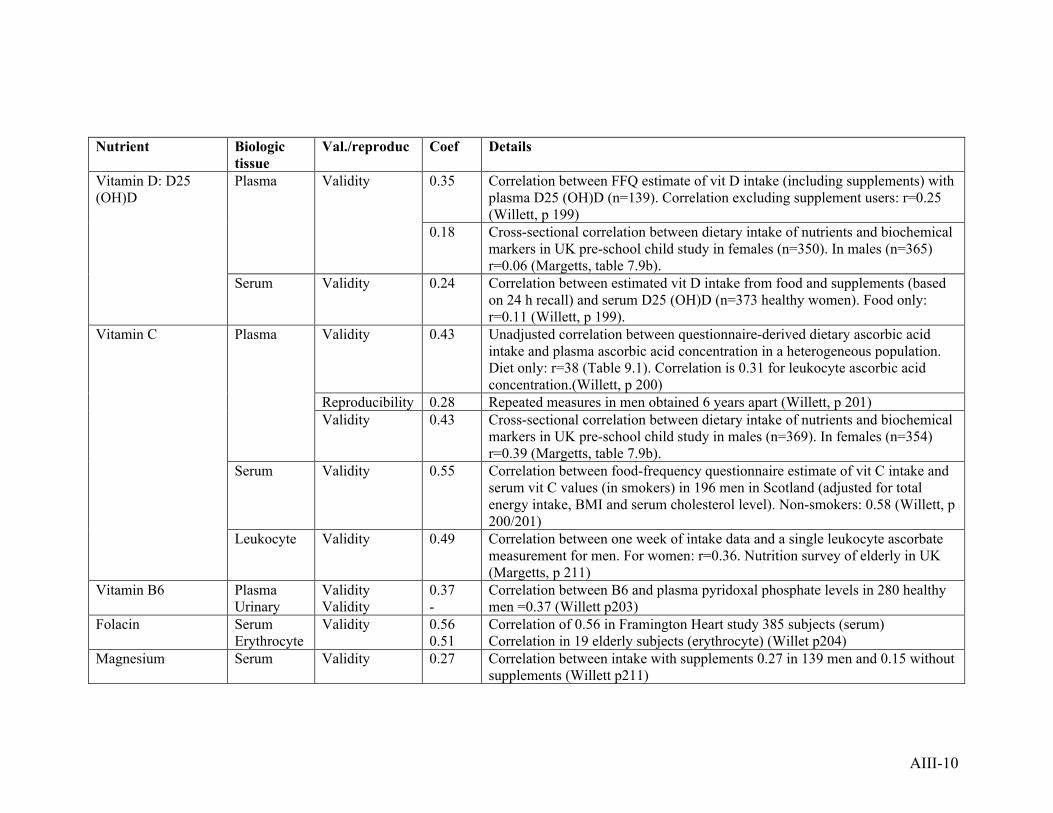
AIII-10
Nutrient Biologic
tissue
Val./reproduc Coef Details
Vitamin D: D25
(OH)D
Plasma Validity
0.35 Correlation between FFQ estimate of vit D intake (including supplements) with
plasma D25 (OH)D (n=139). Correlation excluding supplement users: r=0.25
(Willett, p 199)
0.18 Cross-sectional correlation between dietary intake of nutrients and biochemical
markers in UK pre-school child study in females (n=350). In males (n=365)
r=0.06 (Margetts, table 7.9b).
Serum Validity 0.24 Correlation between estimated vit D intake from food and supplements (based
on 24 h recall) and serum D25 (OH)D (n=373 healthy women). Food only:
r=0.11 (Willett, p 199).
Vitamin C
Plasma
Validity 0.43 Unadjusted correlation between questionnaire-derived dietary ascorbic acid
intake and plasma ascorbic acid concentration in a heterogeneous population.
Diet only: r=38 (Table 9.1). Correlation is 0.31 for leukocyte ascorbic acid
concentration.(Willett, p 200)
Reproducibility 0.28 Repeated measures in men obtained 6 years apart (Willett, p 201)
Validity 0.43
Cross-sectional correlation between dietary intake of nutrients and biochemical
markers in UK pre-school child study in males (n=369). In females (n=354)
r=0.39 (Margetts, table 7.9b).
Serum Validity 0.55 Correlation between food-frequency questionnaire estimate of vit C intake and
serum vit C values (in smokers) in 196 men in Scotland (adjusted for total
energy intake, BMI and serum cholesterol level). Non-smokers: 0.58 (Willett, p
200/201)
Leukocyte Validity 0.49 Correlation between one week of intake data and a single leukocyte ascorbate
measurement for men. For women: r=0.36. Nutrition survey of elderly in UK
(Margetts, p 211)
Vitamin B6 Plasma
Urinary
Validity
Validity
0.37
-
Correlation between B6 and plasma pyridoxal phosphate levels in 280 healthy
men =0.37 (Willett p203)
Folacin Serum
Erythrocyte
Validity 0.56
0.51
Correlation of 0.56 in Framington Heart study 385 subjects (serum)
Correlation in 19 elderly subjects (erythrocyte) (Willet p204)
Magnesium Serum Validity 0.27 Correlation between intake with supplements 0.27 in 139 men and 0.15 without
supplements (Willett p211)

AIII-11
Nutrient Biologic
tissue
Val./reproduc Coef Details
Iron (ferritin) Serum Validity 0.16 Borderline 0.16 correlation with heme intake but only r-0.15 with total iron
intake (Willett p 208). Included as marker of iron storage
Copper (Superoxide
dismutase)
Erythrocyte - - S.O.D levels reflect both depletion and repletion of Cu (Willett p 212)
Selenium Serum
Validity 0.63 Correlation between selenium intake and serum selenium in South Dakotans
(n=44)(Willett, p 186)
Reproducibility 0.76 Average correlation between repeated measurements at four 3-month intervals
in 78 adults (Willett, p 188)
Toenails
Validity 0.59 Correlation between selenium intake and toenail selenium level in South
Dakotans (n=44) (Willett, p 186)`
Reproducibility 0.48 Correlation for selenium levels in toenails collected 6 years apart from 127 US
women (Willett, p 206)
Whole
blood
Validity 0.62 Correlation between selenium intake and whole blood selenium in South
Dakotans (n=44) (Willett, p 186)
Reproducibility 0.95 Average correlation between repeated measurements at four 3-month intervals
in 78 adults (Willett, p 188)
Linoleic acid Adipose
tissue
Validity 0.57 Correlation between dietary linoleic acid intakes determined from 7-day
weighted diet records and the relative proportion of linoleic acid in adipose
tissue in Scottish men (n=164). Also correlation between linoleic acid measured
in adipose tissue and calculated from FFQ in 118 Boston-area men (Willett, p
220)
Eicosapentaenoic
(n-3)
Adipose
tissue
Validity 0.40 Correlation with intake estimated from three 7-day weighted food records
(Willett, p 223).
Reproducibility 0.68 Correlation over 8 months in 27 men and women aged 20-29 (Willett, p 223).
Plasma
Validity 0.23 Correlation of cholesterol ester fraction and intake in 3,570 adults (Willett, p
223)
Reproducibility 0.38 Correlation of two measurements taken 6 years apart in study of 759 Finnish
youths (Willett, p 219)

AIII-12
Nutrient Biologic
tissue
Val./reproduc Coef Details
Docosahexaenoic
(n-3)
Adipose
Tissue
Validity 0.66 Correlation with intake estimated from three 7-day weighted food records
(Willett, p 223)
Reproducibility 0.93 Correlation over 8 months in 27 men and women aged 20-29 (Willett, p 223).
Plasma
Validity 0.42 Correlation of cholesterol ester fraction and intake in 3,570 adults (Willett, p
223)
Reproducibility 0.38 Correlation of two measurements taken 6 years apart in study of 759 Finnish
youths (Willett, p 219)
Polyunsaturated
fatty acids
Adipose
tissue
Validity 0.80 Correlation between % of polyunsaturated fatty acid relative to total fatty acid
intake and relative % of adipose tissue polyunsaturated fatty acid (Willett, p
220)
Palmitic acid Adipose
tissue
Validity 0.27 Correlation adipose tissue measurement with a FFQ estimate among 118 men.
A correlation of 0.14 was reported among women. Among 20 healthy subjects,
correlations between normal intake of total saturated fatty acids and fatty acid
composition of triglycerides in adipose tissue was 0.57 (Willett, p 224)
Stearic acid Adipose
tissue
Validity 0.56 Among 20 healthy subjects, correlations between normal intake of total
saturated fatty acids and fatty acid composition of triglycerides in adipose
tissue (Willett, p 224)
Trans fatty acids Adipose
tissue
Validity 0.40 Correlation between adipose trans and intake estimated from the average of two
FFQ among 140 Boston-area women. Previous study: 115 Boston area women,
correlation of 0.51 between trans intake estimated from a single FFQ and a fatty
acid measurement. Among 118 Boston-area men: correlation of 0.29 between
trans fatty acid measured in adipose and by FFQ (Willett, p 225)
Nitrogen Urine Validity 0.69 Correlation between nitrogen intakes estimated from weighted food records of
16 days and the average of six 24-h urine nitrogen levels (160 women) (Willett,
p 227)
Phyto Oestrogens
Genistein, daidzein
Plasma
24 hr urine
Validity 0.97
0.92
Urinary excretion (24 h) and plasma concentrations of PO were significantly
related to measured dietary PO intake (r 0.97, P<0.001 and r 0.92,
P<0.001 respectively). These findings validate the PO database and indicate
that 24 h urinary excretion and timed plasma concentrations can be used as
biomarkers of PO intake. Br J Nutr. 2004 Mar;91(3):447-57

AIII-13
Nutrient Biologic
tissue
Val./reproduc Coef Details
Enterodiol
Enterolactone
Serum
Urine
Validity 0.13 to
0.29
Urinary enterodiol and enterolactone and serum enterolactone were
significantly correlated with dietary fiber intake (r = 0.13-0.29) Cancer
Epidemiol Biomarkers Prev. 2004 May;13(5):698-708

Appendix 4 Stop Words for use within Reference Manager database
Resection
MRI (magnetic resonance imaging)
PET (positron emission tomography)
CT (computer tomography)
Radiotherapy
Radiochemotherapy
Cisplatin
Fluorouracil
5 FU
Gemcitabine
Antineoplastic
Peptides
Cell
Inhibitor
Novel
Model
Receptor
Antibody
P53
Transgenic
Mice
Hamster
Rat
Dog
Cat
In vitro

Annex 5. Study design algorithm
Key to study design algorithm
Study design A Case-study / case series
Study design B Cross-sectional study
Study design C Randomised controlled trial
Study design D Group randomised control trial
Study design E Uncontrolled trial
Study design F Ecologic study
Study design G Case-control study
Study design H Non-randomised control trial
Study design J Prospective cohort study
Study design K Nested case-control study
Study design L Historical cohort study
Study design M Case-cohort study
Study design N Time series with multiple measurement
Other (see definitions in Appendix K)
Study design P Case only study with prospective exposure measurement
Study design Q Case only study with retrospective exposure measurement

Annex 6. List of conversion units
In cases where the units of measurement differed between results the units would be
converted, where possible, such that all results used the same measurement. Where
assumptions had to be made on portion or serving sizes an agreement was reached after
discussion between team members and consultation of various sources. The following
general sizes were agreed upon:
Beer 400ml serving
Cereals 60g serving
Cheese 35g serving
Dried fish 10g serving
Eggs 55g serving (1 egg)
Fats 10g serving
Fruit & Vegetables 80g serving
Fruit Juice 125ml serving
General drinks inc soft & hot drinks 200ml serving
Meat & Fish 120g serving
Milk 50ml serving
Milk as beverage 200ml serving
Processed cheese slice 10g serving
Processed meat 50g serving
Shellfish 60g serving
Spirits 25ml serving
Staple foods (rice, pasta, potatoes,
beans & lentils, foods boiled in soy sauce) 150g serving
Water & Fluid intake 8oz cup
Wine 125ml serving