Embed Size (px)
Citation preview

CUNY Central Office 2018-2019
AFFIRMATIVE ACTION PLAN
Affirmative Action Plan covering Italian Americans
Contact:
Michael J. Valente, Esq. , Chief Diversity Off icer
395 Hudson Street, 5 t h F loor
New York, New York 10014
646-664-3310
Please contact Mr. Valente if you require assistance with reading this
document due to a disabil ity.
This plan is available for review at the address noted above.

2
TABLE OF CONTENTS
PART ONE: INTRODUCTION AND BACKGROUND . . . . . . . . . . . . . . . . . . . . . . . . . . . . . . . . . . . . . . . . . . . . . . . . . . . . 4
COLLEGE OVERVIEW . . . . . . . . . . . . . . . . . . . . . . . . . . . . . . . . . . . . . . . . . . . . . . . . . . . . . . . . . . . . . . . . . . . . . . . . . . . . . . . . . . . . . . . . . 5
H is tory . . . . . . . . . . . . . . . . . . . . . . . . . . . . . . . . . . . . . . . . . . . . . . . . . . . . . . . . . . . . . . . . . . . . . . . . . . . . . . . . . . . . . . . . . . . . . . . . . . . . . . . . 5
Miss ion . . . . . . . . . . . . . . . . . . . . . . . . . . . . . . . . . . . . . . . . . . . . . . . . . . . . . . . . . . . . . . . . . . . . . . . . . . . . . . . . . . . . . . . . . . . . . . . . . . . . . . . 6
ORGANIZATION CHART . . . . . . . . . . . . . . . . . . . . . . . . . . . . . . . . . . . . . . . . . . . . . . . . . . . . . . . . . . . . . . . . . . . . . . . . . . . . . . . . . . . . . 7
Relevant Pol ic ies . . . . . . . . . . . . . . . . . . . . . . . . . . . . . . . . . . . . . . . . . . . . . . . . . . . . . . . . . . . . . . . . . . . . . . . . . . . . . . . . . . . . . . . . . . . . . 7
Equa l Opportuni ty and Non -D iscr iminat ion Po l icy . . . . . . . . . . . . . . . . . . . . . . . . . . . . . . . . . . . . . . . . . . . . 7
Af f i rmat ive Act ion Pol icy . . . . . . . . . . . . . . . . . . . . . . . . . . . . . . . . . . . . . . . . . . . . . . . . . . . . . . . . . . . . . . . . . . . . . . . . . . . . . . . 8
Sexua l Misconduct Pol icy . . . . . . . . . . . . . . . . . . . . . . . . . . . . . . . . . . . . . . . . . . . . . . . . . . . . . . . . . . . . . . . . . . . . . . . . . . . . . . 8
Other Po l ic ies . . . . . . . . . . . . . . . . . . . . . . . . . . . . . . . . . . . . . . . . . . . . . . . . . . . . . . . . . . . . . . . . . . . . . . . . . . . . . . . . . . . . . . . . . . . . . . 9
RESPONSIBIL ITY FOR IMPLEMENTATION . . . . . . . . . . . . . . . . . . . . . . . . . . . . . . . . . . . . . . . . . . . . . . . . . . . . . . . . . . . . . 10
The V ice Chance l lor for the Of f ice o f Human Resources Management . . . . . . . . . . . . . . . 10
Chie f D ivers ity Of f icer . . . . . . . . . . . . . . . . . . . . . . . . . . . . . . . . . . . . . . . . . . . . . . . . . . . . . . . . . . . . . . . . . . . . . . . . . . . . . . . . 10
Centra l Of f ice Of f ic ia l s . . . . . . . . . . . . . . . . . . . . . . . . . . . . . . . . . . . . . . . . . . . . . . . . . . . . . . . . . . . . . . . . . . . . . . . . . . . . . . . 11
Univers i ty Management . . . . . . . . . . . . . . . . . . . . . . . . . . . . . . . . . . . . . . . . . . . . . . . . . . . . . . . . . . . . . . . . . . . . . . . . . . . . . . 11
PART TWO: DATA AND A NALYSIS . . . . . . . . . . . . . . . . . . . . . . . . . . . . . . . . . . . . . . . . . . . . . . . . . . . . . . . . . . . . . . . . . . . . . 12
WORKFORCE ANALYSIS . . . . . . . . . . . . . . . . . . . . . . . . . . . . . . . . . . . . . . . . . . . . . . . . . . . . . . . . . . . . . . . . . . . . . . . . . . . . . . . . . . . 13
JOB GROUPS, DISCIPLINES, AND MARKET DATA . . . . . . . . . . . . . . . . . . . . . . . . . . . . . . . . . . . . . . . . . . . . . . . . . . . 13
Job Groups . . . . . . . . . . . . . . . . . . . . . . . . . . . . . . . . . . . . . . . . . . . . . . . . . . . . . . . . . . . . . . . . . . . . . . . . . . . . . . . . . . . . . . . . . . . . . . . . 13
Labor Market Ava i labi l i ty . . . . . . . . . . . . . . . . . . . . . . . . . . . . . . . . . . . . . . . . . . . . . . . . . . . . . . . . . . . . . . . . . . . . . . . . . . . . 15
UTIL IZATION ANALYSIS . . . . . . . . . . . . . . . . . . . . . . . . . . . . . . . . . . . . . . . . . . . . . . . . . . . . . . . . . . . . . . . . . . . . . . . . . . . . . . . . . . . 15
D iscuss ion . . . . . . . . . . . . . . . . . . . . . . . . . . . . . . . . . . . . . . . . . . . . . . . . . . . . . . . . . . . . . . . . . . . . . . . . . . . . . . . . . . . . . . . . . . . . . . . . . 15
Ut i l i zat ion, Underut i l i zat ion, and P lacement Goals . . . . . . . . . . . . . . . . . . . . . . . . . . . . . . . . . . . . . . . . . 18
OTHER ANALYSES . . . . . . . . . . . . . . . . . . . . . . . . . . . . . . . . . . . . . . . . . . . . . . . . . . . . . . . . . . . . . . . . . . . . . . . . . . . . . . . . . . . . . . . . . . . 18
Personne l Act iv i ty . . . . . . . . . . . . . . . . . . . . . . . . . . . . . . . . . . . . . . . . . . . . . . . . . . . . . . . . . . . . . . . . . . . . . . . . . . . . . . . . . . . . . . 18
Recru i t ing Act iv i ty . . . . . . . . . . . . . . . . . . . . . . . . . . . . . . . . . . . . . . . . . . . . . . . . . . . . . . . . . . . . . . . . . . . . . . . . . . . . . . . . . . . . . . 18
Hi r ing f rom C iv i l Serv ice Appl icant Poo ls . . . . . . . . . . . . . . . . . . . . . . . . . . . . . . . . . . . . . . . . . . . . . . . . . . . . . . . 20
PART THREE: ACTION-ORIENTED PROGRAMS . . . . . . . . . . . . . . . . . . . . . . . . . . . . . . . . . . . . . . . . . . . . . . . . . . . . . 21
IMPLEMENTATION OF PRIOR -YEAR PROGRAMS . . . . . . . . . . . . . . . . . . . . . . . . . . . . . . . . . . . . . . . . . . . . . . . . . . . . 21
Exh ib i t : Summary o f Campus Programs, 2017 -2018 . . . . . . . . . . . . . . . . . . . . . . . . . . . . . . . . . . . . . . . . . 21
IMPLEMENTATION OF 2018 -2019 PROGRAMS . . . . . . . . . . . . . . . . . . . . . . . . . . . . . . . . . . . . . . . . . . . . . . . . . . . . . . 22
Exh ib i t : P lanned Campus Programs, 2018 -2019 . . . . . . . . . . . . . . . . . . . . . . . . . . . . . . . . . . . . . . . . . . . . . . 22

3
ONGOING ACTIVITIES IN SUPPORT OF AFFIRMATIVE ACTION . . . . . . . . . . . . . . . . . . . . . . . . . . . . . . . . . . 22
INTERNAL AUDIT AND REPORTING . . . . . . . . . . . . . . . . . . . . . . . . . . . . . . . . . . . . . . . . . . . . . . . . . . . . . . . . . . . . . . . . . . . . 23
APPENDICES . . . . . . . . . . . . . . . . . . . . . . . . . . . . . . . . . . . . . . . . . . . . . . . . . . . . . . . . . . . . . . . . . . . . . . . . . . . . . . . . . . . . . . . . . . . . . . . . . 25
The Appendices fo l low th is document and are numbered separate ly .

4
PART ONE: INTRODUCTION AND BACKGROUND
The Centra l Of f ice produces an Af f i rmat ive Act ion P lan (AAP) required by federa l
regulat ions :
For wom en and federa l ly protected rac ia l/ethnic groups : Pres ident ia l Execut ive
Order 11246
For covered Veterans : Vietnam Era Veterans ’ Readjustment Ass is tance Act o f
1974, as amended
For Indiv idua ls wi th D isabi l i t ies : Sect ion 503 o f the Rehabi l i tat ion Act o f 1973 , as
amended.
The Centra l Of f ice a l so produces an Af f i rmat ive A ct ion P lan for I ta l ian Amer icans
separate f rom the federa l Af f i rm at ive Act ion P lan. The Chance l lor o f CUNY
des ignate d I ta l ian Amer icans as a protected group at CUNY in 1976 . Methodo log ies
are s im i lar for the p lans , except that the ana lyses inc lude I ta l ian Am er icans as a
protected group and the narrat ive wi l l h igh l ight i ssues re lated to I ta l ian Amer ican
ut i l i zat ion and a ct ion-or iented program s.
Part One prov ides an overv iew of the C entra l Of f ice and those indiv idua ls and
groups who share respons ib i l i ty for the Centra l Of f i ce ’ s Aff i rm at ive Act ion and
D ivers i ty program s.
The Census Date for em ployees i s June 1 , 201 8. The P lan Report ing Y ear (bas is for
h is tor ica l data) i s June 1 , 2017 –May 31 , 201 8. The Program Year i s Septem ber 1 ,
201 8–August 31 , 2019 .
Th is P lan i s ava i lab le for publ ic rev iew at the locat ion l is ted on the f ront cover .

5
C O L L E G E O V E R V I E W
The C i ty Univers i ty o f New York (CUNY) i s the nat ion's leading urban publ ic
univers i ty serv ing hundreds o f thousands o f s tudents at 24 co l leges and inst itut ions
in New York C i ty . The Univers ity 's 2 5 inst i tut ions inc lude 11 senior co l leges , seven
community co l leges , the Wi l l iam E . Macaulay Honors Co l lege at CUNY, the Graduate
Schoo l and Univers i ty Center , the CUNY Graduate Schoo l o f Journa l i sm, the CUNY
Schoo l o f Law, the CUNY Schoo l o f Profess iona l Studies , the CUNY Schoo l o f Publ ic
Hea l th , and the CUNY Schoo l o f Labor and Urban Studies . More than 100 centers
and research inst i tutes , located throughout the C ity ’ s f ive boroughs , a l so are an
integra l part o f the Univers i ty .
The Centr al Of f ice i s the adminis t rat ive uni t o f CUNY. The essent ia l funct ion o f the Central Of f ice i s to prov ide adminis t rat ive , acade mic , log is t ica l, financ ia l , technica l
and o ther support and guidan ce to CUNY’s 24 const i t uent co l leges and inst i t ut ions . The Central Of fice cons is ts o f 929 fu l l -t ime employees , located in 14 o ff ices throughout New York C ity and A lbany . The he adquarters o f the Centra l Of f ice is
located at 205 E . 42nd
Street , New York, New York 10017. The Centra l O ff ice cons is ts o f CUNY executive and adminis trat ive o f ficers heading a workforce in the fo l lowing areas: Ac ade mic Af fa i rs , S tudent Af fa i rs , Univers i ty Re latio ns , Lega l
Affa i rs , Budget and F inance , Hu man Resources Manage ment , Labor Re lat ions , Enro l lment Management , Ope rat ions , Comput ing and Info rmat ion Se rv ices , Publ ic
Safety , a nd Fac i l i t ies P lanning, Construct ion, a nd Management . The Off ice o f Human Resources Manage ment prov ides comprehens ive prog rams and serv ices to the Centra l O ff ice employees as wel l as p rovid ing guida nce and sup port to CUNY’s
const i tuent co l leges and inst i t ut io ns . The other de partments o f the Centra l Off ice pr imar i ly prov ide support, gu ida nce , and ass i stance to CUNY’s member co lleges and
inst i tut ions . A ll Central Of fice employe es u lt imate ly report to the Chance l l or o f CUNY, who repor ts to the Board o f Trustees .
The Af f i r mat ive Action Program fo r the Centra l Of f ice emanates f rom the
headquart ers . Spec i f ica l ly , the Vice Chancel lor o f the CUNY Off ice o f Human
Resources Management (OHRM) has been de legated respons ib i l i ty for overs ee ing the
Centra l Off ice ’s A ff irmat ive Action Progra m. She has , however, delegated the
overs ight respo ns ib il i ty to the Centra l Of f ice Chie f D ivers i ty Of f icer , who works in
OHRM’s Of f ice o f Recru i tment and D ivers ity , and who has the da y-to -day
respons ibi l i ty o f ensuring that equal e mplo yment opportunit ies a re a fforded to a l l
appl icants and employees o f the Centra l Of f ice .
H i s t o r y
The C i ty Univers i ty o f New York t races i t s or ig ins to the founding o f the Free
Academy in 1847 by Townsend Harr is . The Academy’s goa l was to educate male
graduates of publ ic grammar schoo ls . The Free Academy lat er became the C i ty
Co l lege o f New York , the o ldest inst i tut ion among the CUNY co l leges . In 1914
Hunter Co l lege , which had ex is ted as Normal Co l lege s ince 1870, opened i ts doors .
By 1930 Brook lyn Co l lege had been establ i shed, and in 1937 Queens Co l lege beg an
to admit s tudents . The New York State Inst i tute o f Appl ied Arts and Sc iences

6
( forerunner o f New York C ity Technica l Co l lege) admit ted i t s f i rst c lass in 1947 , and
in 1955 the Co l lege of Staten I s land s tarted to admit s tudents . The last four senior
co l leges establ i shed were: John Jay Co l lege o f Cr imina l Just ice in 1960, York
Co l lege in 1966 , Lehman Co l lege in 1968 ( former ly the Bronx branch o f Hunter
Co l lege) , and Medgar Evers Co l lege in 1970. In the decades a f ter 1960 , s ix
community co l leges jo ined the e f fort to meet the academic and career needs o f the
City ’ s res idents . In August 2012, Guttman Community Co l lege ( former ly known as
the New Community Co l lege) opened i t s doors to s tudents as CUNY’s seventh
community co l lege .
In 1926 , the New York Stat e Leg is lature created the Board o f H igher Educat ion o f
the C i ty o f New York to integrate , coordinate and expand the inst i tut ions o f h igher
educat ion in the c ity . In 1961 , Governor Ne lson Rockefe l ler s igned the b i l l that
formal ly c reated the C i ty Univers it y o f New York to integrate senior and community
co l leges and a new graduate schoo l into a coordinated system of h igher educat ion
for the C i ty . By 1979, the Board o f H igher Educat ion had become the Board o f
Trustees of the C i ty Univers i ty .
As demand for h igher educat ion rapid ly grew after Wor ld War I I , the increased
demand for l imited co l lege s lots had the ef fect o f intens i fy ing the compet i t iveness
o f the New York C ity 's system of h igher educat ion. In response to demands for
greater access , in part icu lar f rom the C ity ’s underrepresented groups , the Board
implemented an admiss ions po l icy to assure a l l h igh schoo l graduates entrance to
the Univers i ty . S tudents who are not d i rect ly admit ted to the senior co l leges
because they do not meet academic admiss ions s tandards may enro l l in an
assoc iate degree program at one of CUNY’s community co l leges and then earn
admiss ion to the senior co l leges . As stated in the C i ty Univers ity o f New York ’s
Master P lan 2012 -2016, “ CUNY i s a leader in def in ing publ ic educat ion fo r the
21stcentury , whether deve loping new approaches to s tudent learn ing, bui ld ing
co l laborat ive research models , o r creat ively partner ing with the c i ty ’ s
communit ies .”
M i s s i o n
The 1979 New York Sta te Educat ion Law Sect i on 6201 sets forth the mission o f T he
C i ty Univers ity of New York . Th is mission is to prov ide access to h igher educat ion for
a l l who seek i t, to “ cont i nue to mainta in and expand i t s co mmitment to acade mic
exce l lence and to the prov is ion o f equal access and oppor tuni ty for s tudents , facul ty
and s taf f from a l l e thn ic and rac ia l groups and f rom both sexes .” The Unive rsi ty
embraces and advances i t s core va lues : an ins istence on academic r igor , a ccountabil ity ,
and assess ment coup led with an un wavering com mitment to serv ing students f rom a l l
backgrounds and support ing a wor ld class f acul ty . These va lues underg i rd the
Univers i ty ’s funda menta l mission: teaching, research, and serv ice .

7
O R G A N I Z A T I O N C H A R T
Appendix A d i sp lays an organizat ion chart .
R E L E V A N T P O L I C I E S
As a part o f The C i ty Univers i ty o f New York (CUNY) , a publ ic univers i ty system, the
Central Office adheres to federa l , s tate , and c i ty laws and regulat ions regarding non -d iscr im inat ion and aff i rm at ive act ion inc luding am ong others , Execut ive Order
11246, as amended, T i t les V I and VI I o f the C iv i l R ights Act o f 1964 , T i t le IX o f the
Educat ion Am endm ents o f 1972 , Sect ions 503 and 504 o f the Rehabi l i tat ion Act o f
1973 and the Am er icans with D isabi l i t ies Act o f 1990 , Sect ion 402 o f the V ietnam
Era Veterans ’ Readjustm ent Ass is tance Act o f 1974, as am ended, the Equal Pay Act
o f 1963 , the Age D iscr im inat ion in Em ploym ent Act o f 1967, as am ended and the Age
D iscr im inat ion Act o f 1975 , the New York State Hum an R ights Law and the New York
City Hum an R ights Law. The “ protected c lasses ,” de l ineate d in Execut ive Order
11246 and updates are : Am er ican Indian or A laska Nat ive , As ian, B lack or Afr ican
Am er ican, H ispanic or Lat ino , Nat ive Hawai ian or Other Pac i f i c Is lander , Two or
More Races , and Wom en. Addi t iona l ly , the Chance l lor o f CUNY des ignated I ta l i an
Am er icans as a protected group in 1976 and CUNY prepares a separate I ta l ian
Am er ican Af f i rm at ive Act ion P lan.
CUNY has posted i t s p ol ic ies and procedures on non -d iscr im inat ion, sexua l
m isconduct , and af f i rm at ive act ion on i t s webs i te .
Cl ic k for CUNY's Pol ic i es
(www.c uny.edu/about/adminis trat ion/off ic es/ohrm/pol ic i es -proc edures .html )
E q u a l O p p o r t u n i t y a n d N o n - D i s c r i m i n a t i o n P o l i c y
The C i ty Univer s i ty of New Yor k (“Univers i ty” or “ CUNY” ) , located in a
his tor ica l ly d iverse munic ipa l i ty , i s committed to a po l i cy of equal
employment and equal access in i ts educat ional pr ograms and act iv i t ies .
D ivers i ty , inc lus ion, and an env i ronment f ree f rom d iscr imi nat ion are
centra l to the miss ion of T he Univers ity .
I t i s the po l i cy of T he Univers ity —appl icable to a l l co l leges and uni t s —
to r ecr u i t , employ , reta in , pr omote , and prov ide benef i t s to employees
( inc lud ing paid and u npaid interns ) and to admit and prov i de serv ices
for s tudents without regar d to race , co lor , c reed, nat ional or ig in ,
e thnic i ty , ancestr y , re l ig ion, age , sex ( inc lud ing pregnancy , ch i ldb i r th
and re lated condi t ions ) , sexual or ientat ion, gender , gender ident i ty ,
mar i ta l s tatus , par tnersh ip statu s , d isabi l i ty , genet ic in format ion,
a l ienage, c i t i zensh ip , mi l i tary or veteran status , status as a v ic t im of
domest ic v io lence/stalk ing/sex of fenses , unemployment s tatus , or any
other legal ly prohib i ted bas is in accor dance with federa l , s tate and c i ty
laws .

8
I t i s a l so T he Univers ity ’ s po l i cy to prov ide reasonable acco mmodat ions
to appl icants , employees and other persons on the bas is of d i sabi l i ty ,
re l ig ious pract ices , pregnancy or ch i ldb i r th - re lated medica l condi t ions ,
or s tatus as v ic t ims of domest ic v io le nce/sta lk ing/sex of fenses .
Th is Po l i cy a lso prohib i t s reta l iat ion for repor t ing or oppos ing
d iscr iminat ion, or cooperat ing with an invest igat ion of a d iscr iminat ion
compla int .
A f f i r m a t i v e A c t i o n P o l i c y
The Univers i ty ’ s overa l l po l icy on Af f i rmat ive Act io n of May 28 , 1985 i s part o f
CUNY’s Manua l o f Genera l Po l icy .
ARTICLE V FACULTY, STAFF AND ADMINISTRATION
Po l i cy 5 .04 - Af f i rmative Act ion:
RESOLVED, that the Board of Trustees of The C i ty Univers ity of New York
reaf f i rms i t s commitment to af f i rmat ive act ion and d i rects the
Chance l lery and the co l leges to reemphas ize the tak ing of the pos i t ive
s teps that wi l l lead to recru it ing, h i r ing, reta in ing, tenur i ng, and
promot ing increased numbers of qual i f ied minor i t ies and women. (Board
of Trustees Minutes , 1985 -05-28 , Sect ion 6-C)
S e x u a l M i s c o n d u c t P o l i c y
CUNY’s Po l icy on Sexua l Misconduct addresses sexua l harassment , gender -based
harassment and sexua l v io lence . I t out l ines procedures appl icable to s tudents and
employees for address ing compla ints . The text o f the po l icy s tatement fo l lows:
Every member of The C i ty Univers i ty of New York (“ CUNY” ) community ,
inc lud ing s tudents , employees and v is i tors , dese rves the opportuni ty to
l i ve , learn and work free from Sexual Misconduct ( sexual harassment ,
gender -based harassment and sexual v io lence) . Accord ingly , CUNY i s
committed to :
Def in ing conduct that const i tutes prohib i ted Sexual Misconduct ;
P rov id ing c lear gu ide l ines for s tudents , employees and v i s i tors on how
to repor t inc idents of Sexual Misconduct and a commitment that any
compla ints wi l l be handled respect fu l ly ;
P rompt ly responding to and invest igat ing a l legat ions of Sexual
Misconduct , pursu ing d isc ip l in ary act ion when appropr iate , re fer r ing the
inc ident to loca l law enforcement when appropr iate , and tak ing act ion
to invest igate and address any a l legat ions of reta l iat ion;

9
Prov id ing ongoing ass i s tance and support to s tudents and employees
who make a l legat ions of Sexual Misconduct;
P rov id ing awareness and prevent ion informat ion on Sexual Misconduct ,
inc lud ing wide ly d isseminat ing th is po l i cy , as wel l as a “ s tudents ’ b i l l o f
r ights” and implement ing t r a in ing and educat ional programs on Sexual
Misconduct to co l lege const i tuenc ies; and
Gather ing and analyz ing informat ion and data that wi l l be rev iewed in
or der to improve safety , repor t ing, responsiveness and the reso lut ion of
inc idents .
Th is i s the so le po l i cy at CUNY addr ess ing Sexual Misconduct and i s
appl i cable at a l l co l lege and uni t s at the Univers i ty . I t w i l l be
interpreted in accordance with the pr inc ip les of academic freedom
adopted by CUNY’s Board of Trustees .
CUNY has establ i shed the fo l lowing po l ic ies . L inks are accurate as o f June, 2018 .
The CUNY Po l icy o n Equal Oppo rtuni ty and Nondiscr im inat ion prohib i t s
d iscr iminat ion o n the bas is o f numerous protected character i s t ics in accordance
with federa l , s tate and loca l law , and addresses sex d iscr iminat ion other than
Sexua l Misconduct covered by th is po l icy .
The CUNY Campus and Workplace V io lence Po l icy addresses workplace v io lence .
The CUNY Domest ic Vio lence and the Workplace Po l icy addresses domest ic
v io lence in or a f fect ing employees in the workplace .
The CUNY Procedures for Implement ing Reasonable Accommodat ions and
Academic Adjustments addresses the procedures CUNY wi l l fo l low when there i s
a request f or a reasonable accommodat ion or academic adjustment .
In addi t ion, CUNY cam puses are required to repo rt c r im e s tat i st ics , inc luding
s tat i s t ics re lat ing to sexua l v io lence , under the federa l J eanne C lery Act .
Informat ion i s ava i lab le f rom the Of f ice o f Publ ic Safety .
O t h e r P o l i c i e s
I t i s the po l icy o f the Central Office to recru i t , em ploy , reta in , promote , and prov ide
benef i t s to em ployees and to adm it and prov ide serv ices for s tudents wi thout regard
to race, co lor , nat iona l or e thnic or ig in , re l ig ion, age, s ex , sexua l or ientat ion,
gender ident i ty , m ar ita l s tatus, d i sabi l i ty , genet ic predispos i t ion or carr ier status ,
a l ienage , c i t i zenship , m i l i tary or veteran status , unem ploym ent s tatus or status as
v ic t im of domest ic v io lence .
The Central Office po l i cy i s reaf f i rmed by the Chancellor annual ly . Appendix B conta ins a
copy o f the annual Reaf f i rm at ion Let ter which was i ssued on Decem ber 8 , 2017 .

10
R E S P O N S I B I L I T Y F O R I M P L E M E N T A T I O N
Whi le the ent i re Central Office com m unity part ic ipates in promot ing divers i ty and
inc lus ion, the Centra l Of f ice has ass igned certa in respons ib i l i t ies in im plement ing
Af f i rm at ive Act ion programs .
T h e V i c e C h a n c e l l o r f o r t h e O f f i c e o f H u m a n R e s o u r c e s M a n a g e m e n t
The pr imary respons ib i l i ty and accountabi l i ty for im plem ent ing the AAP rests with Margaret Egan, the Interim Vice Chance l lor for the Of f ice o f Hum an Resources
Managem ent . The V ice Chance l lor has the pr im ary respons ib i l i ty to prov ide
leadership and oversee the im plem entat ion o f the Centra l Of f ice ’s a f f i rm at ive act ion
po l ic ies , procedures a nd d ivers i ty program s as wel l as assur ing compl iance with a l l
re lated federa l , s tate , and c i ty laws , ru les and regulat ions as we l l as the po l ic ies o f
The C ity Univers i ty o f New York . Th is ro le inc ludes , but i s not l im ited to , the
fo l lowing dut ies :
Des ignates perso nnel respons ib le for aspects o f Af f i rm at ive Act io n, d ivers i ty ,
and com pl iance , inc luding a Chie f D ivers ity Of f icer (CDO) , 504/ADA
Coordinator and T i t le IX Coordinator , and ensures respons ib le personnel have
the author i ty , s ta f f , and other r esources to success fu l ly implem ent the i r
ass igned respons ib i l i t ies
Communicates a co mm itment to equal emplo yment opportuni ty programs,
d ivers i ty , and af f i rmat ive act ion.
Submits required reports to Univers i ty o ff i ces and externa l part ies as needed.
C h i e f D i v e r s i t y O f f i c e r
The V ice Chance l lor has des ignated Michael J . Va lente , Esq. as the Chie f D ivers i ty
Of f icer (CDO) . As the V ice Chance l lor ’ s pr imary des ignee, the CDO:
P rov ides conf ident ia l consul tat ion fo r , invest igat es and reso lves
discr iminat ion/harassment com pla ints
Dist r ibutes re levant po l ic ies , no t ices and rev is ions , and assures integrat ion into
tra in ing programs, search committee or ientat io ns , webs i tes , and other media
Prepares and communicat es Af f i rm at ive Act io n P lan reports and eva luates t he
im pact o f spec i f i c in it ia t ives and Af f i rmat ive A ct ion programs overa l l
Consul ts wi th search c ommittees and h i r ing managers on recru itment and
se lect ion, oversee ing search p lans and ef fect ive recru i tm ent/select ion
st rateg ies to pro mo te a d iverse workforce
Assures the C entra l Of f ice ’ s part ic ipat io n in univers i ty -wide in i t iat ives

11
pro mo t ing d ivers i ty and inc lus ion.
C e n t r a l O f f i c e O f f i c i a l s
Centra l Of f ice execut ive s , managers , and superv isor s are c r i t i cal partners in the
equal employment/ aff i rmat ive act ion program . They he lp ensure compl iance with
regulat ions and po l ic ies , fo ster an inc lus ive env i ronment , and ass i s t in deve loping,
mainta in ing, and implement ing the Af f i rmat ive Act io n P lan.
U n i v e r s i t y M a n a g e m e n t
The Univers i ty ’ s Of f ice o f Recruitment and D ivers i ty repo rts summary s tat is t ics to
senior managem ent on a quarter ly bas is and pro v ide per io dic data f i les to the
co l leges . Det a i l s o f Univers i ty reports and d ivers i ty pro grams are prov ided here :
C l i ck for Univers i ty Divers i ty Resources

12
PART TWO: DATA AND ANALYSIS
The C entra l Of f ice ana lyzes data us ing mult ip le metho ds prescr ibed by regulat ion and
best pract ice in prepar ing Af f i rmat ive Act ion P lans . No one metho d prov ides a complete
p ic ture , and none should be used as a so le measurement . Methods inc lude:
Workforce Analys i s of em ploy ees with in o rganizat iona l uni t s
Establ i shment o f Jo b Groups and re levant academic D isc ip l ines
Deve lopment o f Labor Market Ava i lab i l i ty measure s
Ut i l i zat ion Analys i s fo r Job Gro ups and D isc ip l ines
Rev iew of Personnel Act ions (e .g . , H i r ing , Separat ion, Promot ion)
Rev iew of Recru i tm ent Act iv i ty
Rev iew of Hi r ing f ro m C iv i l Serv ice appl icant poo ls
Rev iew of Compensat ion.
Indiv idua ls interested in learn ing mo re abo ut data ana lys i s in Af f i rmat ive Act io n P lans
may wish to re fer to resources prov ided by the U.S . Department o f Labor ’s Of f ice o f
Contr act Co mpl iance Programs (OFCCP) at : C l i ck for U.S . Department o f Labor Webs i te
The so urce for th is rev iew and a l l subsequent data i s an ext ract f rom CUNY’s system
of record, CUNYFirs t , o f fu l l - t ime act ive emplo yees and employees on se lected pa id
leaves ( such as medica l leave or fe l lo wship/sabbat ica l leave) as o f June 1 , 2018 . The
populat ion does not inc lude s tudent wo rkers or ind iv idua ls employed by CUNY’s
Research Foundat ion. We created th is ext ract in Ju ly , 2018 .
To eva luate representat io n by race/ethnic ity , we use federa l ly -mandated categor ies
o f As ian, B lack/ Afr ican Am er ican, and Hispanic . Emplo yees who ident i fy as Amer ican
Ind ian/ Alaska Nat ive and emplo yees who ident i fy as “Two or More Races” are not
l i s ted separate ly , but are inc luded in the Tota l Minor ity category . Employees
ident i fy ing as Hawai ian/Nat ive Pac i f i c I s lander are l i sted with the As ian category .
I ta l ian Amer icans are l i s ted as a protected group in the ana lyses . To reta in overa l l
com par iso ns to the federa l p lan, I ta l ian Amer icans are not inc luded in the Tota l
Mino r i ty category ( i .e . , the Tota l Minor i ty category i s t he same fo r both federa l and
I ta l ian Amer ican P lans) .
To eva luate representat io n by gender , we use federa l ly -mandated categor ies o f
Male and Female .

13
W O R K F O R C E A N A L Y S I S
The Wo rkforce Analys i s i s a rev iew of protected group s (gender and ethnic i ty )
organi zed by department/uni t and presented by job t i t le in descending h ierarchica l
o rder .
The Workforce Analys i s i s intended to rev iew overa l l representat ion o f females or
minor it ies by organizat iona l uni t and t i t le/rank with in uni t .
Due to length , the Workforce Analys i s charts are not inc luded in the P lan.
The C entra l Of f ice conducted a se l f - ident i f i cat ion canvas in May 2018 by contact ing
employees v ia emai l , encourag ing them to update se l f - ident i f i cat ion data . The
Centra l Of f ice prov ided inst ruct ions and a Quest ion and Answer document
expla in ing the reasons behind co l lect ing sel f - ident i f i cat ion data , and s t ress ing that
prov id ing th is informat ion was vo luntary .
In tota l , no employees at the C entra l Of f ice d id not ident i fy a gender and only 1
employee e i ther d id not ident i fy a race/ethnic i ty or d id not complete ly spec i fy one
( for example , ident i f ied as non -Hispanic without prov id ing a spec i f i c race) . Anyone
who d id not spec i fy a gender and/or ethnic i ty i s inc luded in the workforce ana lys i s
but not inc luded in a protected group for further ana lyses .
J O B G R O U P S , D I S C I P L I N E S , A N D M A R K E T D A T A
We base further ana lyses on creat ing job grou ps cons is t ing o f job t i t les wi th s imi lar
respons ib i l i t ies and opportuni t ies for advancement . 69 Central Off i c e em ployees
c urrently se l f - ident i fy as I ta l ian Amer ic an s , wi th a maj or i ty of those I ta l ian
Americ ans (61%) work ing in Exec utive, Adminis t rat ive and Manager ia l pos i t ions .
The Centra l Of f ice , which does not employee Facul ty or Co l lege Laboratory
Technic ians , i s not a “ t radi t iona l co l lege” in the academic inst ruct iona l and
d isc ip l ine sense .
Appendix C presents further deta i l s o f the t i t les inc luded in each Job Group .
J o b G r o u p s
Job Groups are comprised o f s imi lar job t i t les b ased on dut ies , qua l i f i cat ions , and other
condi t ions o f employment . The Univers ity rev iews groupings annual ly . The Exhib i t on
the fo l lowing page l i st s the Job Groups and summar izes s taf f ing in each g roup.

Exhibit: Workforce Summary (IA)Central Office Total Employees: 929
Executive/Administrative/Managerial
StaffJob Group Female # Minority # Italian Am. #Female % Minority % Italian Am. %
Administration 1 (Executive) 79 44 55.7% 20 25.3% 12 15.2%Administration 2 (Manager) 250 152 60.8% 118 47.2% 22 8.8%Facility Manager 2 0 0.0% 0 0.0% 1 50.0%IT Computer Manager 76 22 28.9% 43 56.6% 6 7.9%Security Manager 4 1 25.0% 2 50.0% 1 25.0%
Professional Non‐Faculty
StaffJob Group Female # Minority # Italian Am. #Female % Minority % Italian Am. %
Accountant 3 3 100.0% 3 100.0% 0 0.0%Administration 3 (Professional) 237 180 75.9% 173 73.0% 12 5.1%Administration 5 (Engineer‐Architect 20 3 15.0% 9 45.0% 3 15.0%IT Computer Professional 129 51 39.5% 88 68.2% 8 6.2%
Administrative Support Workers
StaffJob Group Female # Minority # Italian Am. #Female % Minority % Italian Am. %
Accountant Assistant 3 3 100.0% 3 100.0% 0 0.0%Administrative Assistant 7 7 100.0% 6 85.7% 0 0.0%Office Assistant 32 26 81.3% 24 75.0% 2 6.3%Mail Services Worker 12 0 0.0% 9 75.0% 2 16.7%
Craft Workers
StaffJob Group Female # Minority # Italian Am. #Female % Minority % Italian Am. %
Laborers and Helpers 1 0 0.0% 0 0.0% 0 0.0%
Technicians
StaffJob Group Female # Minority # Italian Am. #Female % Minority % Italian Am. %
Broadcast/Media 38 13 34.2% 21 55.3% 0 0.0%Engineering Technician 1 0 0.0% 0 0.0% 0 0.0%IT Support Technician 11 5 45.5% 10 90.9% 0 0.0%Print Shop 2 0 0.0% 2 100.0% 0 0.0%
Service Workers and Others
StaffJob Group Female # Minority # Italian Am. #Female % Minority % Italian Am. %
Campus Peace Officer‐Sergeant 10 3 30.0% 8 80.0% 0 0.0%Campus Peace Officer‐Level 2 1 0 0.0% 1 100.0% 0 0.0%Campus Peace Officer‐Level 1 4 0 0.0% 4 100.0% 0 0.0%Custodial Supervisor 3 0 0.0% 3 100.0% 0 0.0%Custodial 4 1 25.0% 3 75.0% 0 0.0%
Workforce Summary

15
L a b o r M a r k e t A v a i l a b i l i t y
Labor Market Ava i labi l i ty i s the measurement used to benchmark ut i l i zat ion o f
protected groups . I t represents t he proport ion o f each protected group ava i lab le for
employment in the labor market f rom which we recru i t .
The Univers i ty ca lcu lates ava i lab i l i ty by job group and d isc ip l ine , bas ed on interna l
and externa l factors . The interna l labor market i s an est imate o f e l ig ib le employees
on a promot iona l path into a job group and has been ca lcu lated based on employee
data in e i ther fa l l 2013 or s pr ing 2014. The externa l labor market uses locat ion and
qua l i f i cat ions o f ind iv idua ls ava i lab le for employment , typ ica l ly an educat ion factor
and a geographic factor . Educat iona l data comes from “ Earned Degrees Conferred”
reports f rom the U.S . Department o f Educat ion (2013 -2014 f igures) and other
informat ion comes f rom the Amer ican Communi ty Survey o f t he U.S . Census (2007 -
2011) . G eographic factors may be Nat ional (genera l ly for h ighest - leve l pos i t ions and
facul ty ) , Reg iona l ( the four -state reg ion o f New York , New Jersey , Pennsy lvania , and
Connect icut ) , o r Local (New York C i ty ) .
For the I ta l ian Amer ican P lan only , we ca lcu late Labor Market Ava i lab i l i ty based on
“ earned degrees conferred” and the Amer ican Community Survey - I ta l ian Amer ican
(2007–2011) .
CUNY rev iews and updates Labor Market Ava i lab i l i ty f igures every other year . There
were no updates made to the ava i lab i l i ty data th is past year .
Appendix C (prev iously re ferenced ) l i s t s ava i lab i l i ty factors and weight ings .
U T I L I Z A T I O N A N A L Y S I S
D i s c u s s i o n
The C entra l Of f ice rev iewed i t s employee populat ion by Job G roup and protected
c lass in compar ison to Labor Market Ava i lab i l i ty for groups where there are f ive or
more employees .
We report underut i l i zat ion when s ign i f i cant ly fewer minor i t ies or women are
employed than would be reasonabl y expected g iven ava i lab i l i ty . We report
underut i l i zat ion where the ut i l i zat ion i s more than 20% be low ava i lab i l i ty and the
d i f ference can be expressed as at least one fu l l - t ime equiva lent employee.
Job Groups and D isc ip l ines for which there i s underut i l i zat ion are cons idered
pr ior i t ies for Co l lege Af f i rmat ive Act ion programs.
Appendix E deta i l s each indiv idua l Job Group/Aff i rmat ive Act ion Uni t and Academic
Program/Category (Facul ty and Co l lege Laboratory Technic ians) .

16
Changes in underut i l izat ion f rom year to year m ay ar i se f rom mult ip le factors . These
inc lude h i res , separat ions ( inc luding vo luntary separat ions and ret i rements) ,
updated Labor Market A va i lab i l i ty and changes to the compos i t ion o f Job G roups or
D isc ip l ines . I t i s o f ten not po ss ib le to p inpo int a s ing le , d i rect cause , and i t may not
a lways be poss ib le to ant ic ipate and/or preven t increases in underut i l i zat ion in
border l ine s i tuat ions .
The fo l lowing Exhib i t summar izes staf f ing and underut i l i zat ion for each job group
with a compar ison to the two prev ious years .

Exhibit: Summary of Historical Changes in Underutilization ‐Staff (IA Plan)
This is a summary of utilization, and underutilization, of protected groups by staff Job Group. Only those groups with five or more employees are included here.
This version compares underutilization for this report (2018) to that reported in the 2017 Affirmative Action Plan. If there is no entry under Total Staff, this means that the discipline was not reported in the Affirmative Action Plan in one of the years.
Boxes in red represent increases in underutilization (negative progress); boxes in green represent decreases in underutilization (positive progress).
Female Total Minority
Asian/Nat. Haw./Other
Pac. Isl.
Black/African Am.
Hispanic/ Latino
Job Group
UNDERUTILIZATION
Total Staff Italian American
2018 2017 2018 20172018 20172018 20172018 20172018 20172018 2017
Central Office
Category: Executive/Administrative/Managerial
36 3 379Administration 1 (Executive) 81
250Administration 2 (Manager) 253
76IT Computer Manager 74 6 6
Category: Professional Non‐Faculty
237Administration 3 (Professional) 243 15 14
2 220Administration 5 (Engineer‐Architect)
20
129IT Computer Professional 132 8 9
Category: Administrative Support Workers
1 1 17Administrative Assistant 9
5 16 112Mail Services Worker 14
32Office Assistant 36 3 2
Category: Technicians
38Broadcast/Media 41 6 7
1 111IT Support Technician 14 2 1
Category: Service Workers and Others
1 31 310Campus Peace Officer‐Sergeant 11

18
U t i l i z a t i o n , U n d e r u t i l i z a t i o n , a n d P l a c e m e n t G o a l s
Changes in underut i l izat ion for I ta l ian Amer icans are noted be low, f rom 2017 to
2018:
The Administ rat ion 3 AAU increased underut i l i zat ion f rom 14 to 15 .
The IT Computer Profess iona l AAU decreased underut i l i zat ion f rom 9 to 8 .
The Of f ice Ass istant AAU increased underut i l i zat ion f rom 2 to 3 .
The Broadcast/Media AAU dec reased underut i l i zat ion f rom 7 to 6 .
The IT Support Technic ian AAU inc reased underut i l i zat ion f rom 1 to 2 .
O T H E R A N A L Y S E S
P e r s o n n e l A c t i v i t y
We rev iew personnel act ions for potent ia l adverse impact , meaning personnel
se lect ions at d i f ferent rates for d i f ferent groups .
Appendix F prov ides deta i l on personnel a ct iv i ty by Job Group :
Job Act ions by Job Group and Ethnic i ty
Job Act ions by Job Group and Gender
We compare d employee t i t le changes between referen ce dates ( i .e . , Ju ly 1 , 2017 and
June 1 , 2018 ) . The reports t rack h i res , moves to a h igher or lower Job Group, moves
with in a Job Group, and Separat ions .
P ersonnel act ions invo lv ing employees who leave one Job Group to take a pos i t ion
in another are reported as two act ions and are l i s ted as hav ing separated f rom one
group and jo ined another group .
R e c r u i t i n g A c t i v i t y
Recrui t ing and se lect ion take p lace with in a process des igned to promote both
e f fect iveness and d ivers i ty . P r ior to post ing a pos i t ion, the Chief D ivers i ty Of f icer
rev iews and approves the post ing language f rom the s tandpo int o f any requirements
that may impose b ias. The Chie f D ivers ity Of f icer may a lso create and/or rev iew a
Search P lan out l in ing intended methods of outreach for the pos it ion , or o f fer

19
suggest ions on addi t iona l outreach e f forts .
Many h i r ing pro jects are conducted by a d iverse Search Commit tee , part icu lar ly
searches for facul ty , adminis t rators , and execut ives . The Chie f D ivers i ty Of f icer
prov ides an or ientat ion , o r “charge ,” to committee members on e f fect ive se lect ion
pract ices , inc luding pract ices a imed at reduc ing the potent ia l for b ias . T he CDO
rev iews the appl icant poo l for suf f ic ient representat ion and cert i f ies the poo l pr ior
to a rev iew by the committee . The CDO rev iews the l i s t o f ind iv idua ls se lected for
interv iews, and at the end o f the recru it ing process , approves the ent i re search .
The s tandard in eva luat ing recru i t ing data i s re ferred to as Impact Ana lys i s . Federa l
guide l ines recommend that “ Adverse Impact” may occur when any one group has a
se lect ion rate which is less than 80% of the se lect ion rate o f the group which i s
most f requent ly se lected.
Appendix G summar izes recru i t ing , by job group, data based on current ly ava i lab le
informat ion about searches that were noted as o f f i c ia l ly conc luded with a job o f fer
between June 1 , 2017 and May 31 , 2018 .
For some job groups , notably facul ty , there i s a t ime gap between of fers and s tart
dates . For recru it ing rev iews, we t rack t iming on the bas is o f the c lose o f the search
(accepted job o f fer ) . A lso , we report on a l l searches resul t ing in an o f fer , regardless
o f whether the search i s c ance l led at some po int a f ter an o ffer i s made.
Current ly , appl icant categor ies fo l low the Internet Appl icant Rule and cons is t o f :
Appl icant (Qual i f ied indiv idua l submit t ing an appl icat ion for a spec i f i c
pos i t ion)
Interv iew (Se lected for an interv iew, and interv iewed)
Offer/Hire (Se lected for the pos it ion)
As with many h igher educat ion inst i tut ions , there may be a gap in t ime between
of fer and h i re for facul ty members , as they are genera l ly se lected in the spr in g to
teach the fo l lowing fa l l . Th is t ime per iod can span two academic years . We report
recru i t ing data based upon the date the search c loses , and we report personnel
act iv i ty data based on the employee’s h i re date . Thus the number o f h i res in
recru i t ing exhib i t s may not match the number o f h i res in the personnel exhib i t s .
In the normal conduct o f bus iness , the Chie f D ivers ity Of f icer rev iews appl icant se l f -
ident i f i cat ion data and determines whether there i s a need for r ea l - t ime
adjustments to recru it ing and outreach p lans in order to assure d ive rse , qua l i f ied
appl icant poo ls . The Chie f D ivers ity Of f icer may require addi t iona l outreach pr ior to
proceeding with se lect ion and/or interv iews should there be a concern that
appl icant poo ls are not suf f ic ient ly d iverse .

20
H i r i n g f r o m C i v i l S e r v i c e A p p l i c a n t P o o l s
The C entra l Of f ice part ic ipated in no Univers i ty -wide h i r ing poo ls for C lass i f ied C iv i l
Serv ice h i res . At a h i r ing poo l , appl icants who a re pre -qua l i f ied based on a C iv i l
Serv ice examinat ion score i ndicate the i r inte rest in work ing at one or more
Co l leges, and co l leges make se lect ions as per C iv i l Serv ice regulat ions . These h i res
are inc luded in the counts o f employees hi red in Appendix F and the counts o f
appl icants in Appendix G.

21
PART THREE: ACTION-ORIENTED PROGRAMS
Th is sect ion deta i l s a qua l i tat ive assessment o f programs over the pr ior year ,
eva luate s how the Col lege has , o r has not , ach ieved i t s goa ls , and ident i f ies p lanned
act iv i t ies a imed at achiev ing the coming year ’ s goa ls .
Part Three conta ins :
Implementat ion o f Pr ior -Year Programs
Implementat ion o f 2018 -2019 Programs
Ongoing Act iv i t ies in Support o f Af f i rmat ive Act ion
Interna l Audi t and Report ing .
I M P L E M E N T A T I O N O F P R I O R - Y E A R P R O G R A M S
Over the pr ior p lan year , the C entra l Of f ice undertook the fo l lowing programs to
support Af f i rmat ive Act ion and create a c l imate o f inc lus ion.
E x h i b i t : S u m m a r y o f C a m p u s P r o g r a m s , 2 0 1 7 - 2 0 1 8
Program Impac t
C o n t i n u a t i o n o f t h e C D O ’ s i n - p e r s o n ,
i n t e r a c t i v e E E O t r a i n i n g s e s s i o n s f o r
a l l C e n t r a l O f f i c e e m p l o y e e s , i n c l u d i n g
m a n a g e r s a n d s u p e r v i s o r s . T h e s e
t r a i n i n g s e s s i o n s i n s t r u c t t h a t I t a l i a n
A m e r i c a n s a r e a p r o t e c t e d a f f i r m a t i v e
a c t i o n g r o u p a t C U N Y a n d r e m i n d
a t t e n d e e s o f t h e i r o p t i o n t o s e l f -
i d e n t i f y t h e i r e t h n i c i t y , r a c e , a n d
g e n d e r , v e t e r a n a n d d i s a b i l i t y s t a t u s .
E d u c a t e a l l C e n t r a l O f f i c e e m p l o y e e s ,
i n c l u d i n g h i r i n g m a n a g e r s a n d
p o t e n t i a l s e a r c h c o m m i t t e e
m e m b e r s , o n t h e b e n e f i t s o f
w o r k p l a c e d i v e r s i t y a n d t h e l a w s a n d
p o l i c i e s g o v e r n i n g f a i r e m p l o y m e n t
p r a c t i c e s .
C D O c h a r g e o f s e a r c h c o m m i t t e e s ,
w i t h s p e c i f i c m e n t i o n o f I t a l i a n
A m e r i c a n s a s a p r o t e c t e d a f f i r m a t i v e
a c t i o n g r o u p a t C U N Y .
S e n s i t i z e h i r i n g m a n a g e r s a n d s e a r c h
c o m m i t t e e m e m b e r s t o c h e c k t h e i r
i m p l i c i t b i a s e s ; P r o v i d e g u i d a n c e o n
l a w s a n d p o l i c i e s g o v e r n i n g e q u a l
e m p l o y m e n t o p p o r t u n i t y ; H i g h l i g h t
f o c u s o n a c a n d i d a t e ’ s q u a l i f i c a t i o n s
f o r t h e p o s i t i o n . W i t h s o m e
r e d u c t i o n o f u n d e r u t i l i z a t i o n i n
va r i o u s A A U s d u r i n g t h e p a s t y e a r ,
t h e C D O c h a r g e m e e t i n g s s e e m t o

22
Program Impac t
h a ve h a d a p o s i t i ve i m p a c t o n t h e
C e n t r a l O f f i c e h i r i n g p r o c e s s a n d
i n c l u s i v e c l i m a t e .
T a r g e t e d o u t r e a c h w h e r e t h e r e i s
u n d e r u t i l i z a t i o n , e . g . , f o r w a r d i n g I T
p o s t i n g s t o c e r t a i n I t a l i a n A m e r i c a n
L i n k e d I n a c c o u n t s
Mixed resul t s : reduct ion o f
underut i l i zat ion for I ta l ian
Amer icans in the IT Computer
Profess iona l AAU, but a s l ight
increase in underut i l izat ion for
I ta l ian Amer icans in the IT Support
Technic ian AAU
I M P L E M E N T A T I O N O F 2 0 1 8 - 2 0 1 9 P R O G R A M S
In th is sect ion, we af f i rm the Col lege ’s placement goa ls and key in i t iat ives for the
coming year .
E x h i b i t : P l a n n e d C a m p u s P r o g r a m s , 2 0 1 8 - 2 0 1 9
Program Expec ted Impac t
C o n t i n u e w i t h t h e C D O ’ s l i v e E E O t r a i n i n g
s e s s i o n s f o r a l l C e n t r a l O f f i c e e m p l o y e e s ,
b e c a u s e a f e w o f f i c e s h a ve n o t b e e n
t r a i n e d . T o d a t e , a l m o s t a l l C e n t r a l
O f f i c e u n i t s h a v e r e c e i ve d t r a i n i n g , w i t h
n e a r l y 1 2 0 0 C e n t r a l O f f i c e e m p l o y e e s
t r a i n e d .
G o a l i s t o f u r t h e r r e d u c e
u n d e r u t i l i z a t i o n .
C D O c h a r g e o f s e a r c h c o m m i t t e e s . G o a l i s t o f u r t h e r r e d u c e
u n d e r u t i l i z a t i o n .
T a r g e t e d O u t r e a c h , e s p e c i a l l y f o r I T j o b
o p e n i n g s . G o a l i s t o f u r t h e r r e d u c e
u n d e r u t i l i z a t i o n . A s n o t e d a b o ve , t h e
r e s u l t s o f t a r g e t e d o u t r e a c h w e r e
m i x e d f r o m 2 0 1 7 t o 2 0 1 8 . N e e d
a d d i t i o n a l d a t a t o a s s e s s w h e t h e r
o u t r e a c h i s e f f e c t i v e .
O N G O I N G A C T I V I T I E S I N S U P P O R T O F A F F I R M A T I V E A C T I O N
The John D . Ca landra I ta l ian Amer ican Inst itute o f Queens Co l lege serves as an
inte l lectua l and cu l tura l center for I ta l ian Amer icans and those interested in I ta l ian
Amer ican Studies . Programs and events are open to the Univers i ty community .

23
The Centra l Of f ice ’ s programs benef it f rom addi t iona l Univers i ty -wide recru i tment ,
d ivers i ty , and compl iance programs . The Univers i ty :
Sends job post ings to State Workforce Agenc ies and Veterans ’ career centers
Mainta ins conso l idated advert i s ing programs, inc luding job boards serv ing
Veterans , Ind iv idua ls wi th D isabi l i t ies , wom en, and protected minor ity groups
Mainta ins soc ia l media accounts for recru i tment and employment branding
Advert i ses and adminis ters C iv i l Serv ice examinat ions
Publ i shes gu ides and t ra in ing mater ia l s on e f fect ive and compl iant search
pract ices
Publ i shes an annual not ice o f non -d iscr iminat ion in the New York T imes
Prov ides t ra in ing and ongo ing updates to Chie f D ivers i ty Of f icers .
Recru i tment po l ic ies support deve loping d iverse appl icant poo ls through:
Required post ing o f open pos i t ions and o f C iv i l Serv ice Not ices o f Exam ;
typ ica l faculty vacancies are posted for 30 -60 days and adminis trat ive
vacanc ies are post ed for 14-30 days
Col lect ion o f a l l appl icat ions into a s ing le automated system where pre-
establ i shed screening pract ices re levant to the spec i f i c funct ion may be
appl ied
A job appl icat ion process where a l l candidates are automat ica l ly inv i ted to
se l f - ident i fy race/ethnic i ty , gender , veteran s tatus , o r d isabi l i ty s tatus;
informat ion i s kept conf ident ia l ly and used to ana lyze the compos i t ion o f
appl icant poo ls
A committee recru i t ing process by which a d iverse team eva luates candidates
according to cons is tent c r i ter ia and job -re lated interv iew quest ions
An annual survey o f newly appo inted employees to ident i fy potent ia l areas o f
concern in how the Co l lege communicates with i t s candidates .
I N T E R N A L A U D I T A N D R E P O R T I N G
The Chie f D ivers i ty Of f icer posts and d ist r ibutes not ices o f non -d iscr iminat ion
po l ic ies , changes in regulat ions , and s imi lar compl iance informat ion, and makes the
Af f i rmat ive Act ion P lan ava i lab le for publ ic inspect ion. He a lso integrates

24
compl iance informat ion into t ra in ing programs for staf f .
The Chie f D ivers i ty Of f icer i s respons ib le for audi t s and rev iew s o f the e f fe ct iveness
o f Co l lege programs. Th is inc ludes :
Monitor ing records of personnel act iv i t ies , inc luding new hi res , t ransfer s ,
promot ions , and terminat ions
Monitor ing the s tatus o f employee se l f - ident i f i cat ion programs
Rev iewing the e f fect iveness o f recru it ing outreach and advert i s ing
Monitor ing compla ints or inc ident reports which may indicate under ly ing t rends
Rev iew ing personnel act iv i t ies and the A f f irmat ive Act ion P lan with senior leve l
o f f i cers
Adv is ing management o f program ef fect iveness and prov ide re commendat ions for
improvement .
The C entra l Of f ice mainta ins e mployment records in the centra l CUNYFirs t system
used to prov ide the data under ly ing Af f i rmat ive Act ion P lans . The Chie f D ivers i ty
Of f icer works with Human Resources staf f to assure that records are complete ,
accurate , and t imely . Data qua l i ty i s audi ted further by the Univers i ty per iodica l ly
throughout the year .
The Univers i ty reports s tat i st ics and d ivers i ty metr ics to the Univers i ty Community
and the CUNY Board o f Trustees on a quarter ly bas is .

25
APPENDICES
A. SUMMARY ORGANIZATION CHART
B . RE-AFFIRMATION LETTE R
C . JOB GROUPS AND LABOR MARKET AVAILABIL ITY FACTORS
E . UTIL IZATION ANALYSIS (ADMINISTRATORS AND STAFF)
F . SUMMARY OF P ERSONNEL ACTIVITY
G . SUMMARY OF RECRUITMENT ACTIVITY

APPENDIX A ‐ ORGANIZATION CHART
This Appendix provides a high‐level organization chart.
Central Office
APP A

Board of Trustees
Chairman
William C Thompson Jr.
Central Administration OverviewJune 2018
Secretary of the Board
Gayle Horwitz
Interim Vice Chancellor
Human Resources
Management
Meg Egan
Interim Deputy to Vice
Chancellor
Dona Roy
Univ. Dean Recruitment,
Diversity & Compliance
Arlene Torres
Deputy General
Counsel
Jane Sovern
Assoc. General
Counsel
Education Unit
Katherine Raymond
Vice Chancellor
Facilities Planning,
Construct. & Mgmt.
Judith Bergtraum
Chief of Staff
Gustavo Ordonez
Sr. Univ Director
Of Human Resources
Operations
Judith Opperman
Director
City Relations
John Kotowski
Assoc. General
Counsel
Commercial Unit
Marina Ho
Interim Chancellor
Vita Rabinowitz
Exec. Director Design,
Construction &
Management
Robert Lemieux
Interim Executive Vice Chancellor & Univ. Provost
Academic Affairs
Jane Bowers
Exec. Dir. Central Office
Human Resources
Sonia Pearson
Interim Chief Operating Officer
Marc Shaw
Director Admin.
Computing
James Anastasio
Vice Chancellor
Chief Info Officer
Brian Cohen
Director
Administrative
Services
Richard Del Giorno
Sr. Vice Chancellor
Chief Financial Officer
Matthew Sapienza
Univ Deputy Exec
Budget Director
Catherine Abata
Interim Vice
Chancellor
Student Affairs
Christopher Rosa
Univ. Dean Institutional
Research & Assessment
David Crook
Univ. Director
Admission Services
Laura Bruno
Executive Director
CUNY Athletic
Conference
Zarko Ivkovic
Deputy CIO
Enterprise Application
Infrastructure
Lester Jacobs
Univ Vice Provost for
Research
Gary Michael Guy
University Dean
Lucinda Zoe
Univ. Director
Environmental Health,
Safety & Risk Mgmt
Howard Apsan
Board of Trustees
Loretta Martinez
General Counsel to the Board
Vice Chancellor for
Legal Affairs
Loretta Martinez
Deputy Vice Chancellor Operations
Burton Sacks
Interim Director
CUNY-TV
Gail Yancosek
Director, Internal
Audit
Gordon Taylor
Special Advisor to Vice
Chancellor
Ivan Nunez
Director Management
Analysis
&Communications
Wendy Lader
Deputy CIO Strategic
Initiatives
James Haggard
Univ. Deputy Secretary
to Board
Anne Fenton
University Deputy
Controller
Vacant
University Library Systems
Director
Gregory Gosselin
Sr. Univ. Dean Academic Affairs & Dean
School of Prof. Studies
John Mogulescu
Vice Chancellor
Labor Relations
Pamela Silverblatt
Univ. Director
Classified Staff Labor
Relations
Carmelo Batista
Deputy Senior Univ.
Director for Labor
Relations
Laura Blank
Univ. Associate Dean
Ashleigh Thompson
Sr. Univ. Dean of Academic
Affairs & Dean School of
Professional Studies
John Mogulescu
Director Space Planning
& Cap Budget
Meghan Moore-Wilk
Acting Director Public
Private Partnership
Meghan Mulgrew
Director Capital Budget
Gwen Perlman
University Exec
Director Public Safety
William Barry
Univ. Director, Internal Audit
Gordon Taylor
Director
Media Relations
Frank Sobrino
Chief Investment Officer
Janet M. Krone
University Director of
Labor Hearings and
Appeals
Vacant
Univ. Admin - Chief of Staff
Vacant
University Student
Affairs Director
Kevin Tucker
University Controller
Sara Pappas Montero
University Treasurer
Thomas Zhou
Deputy Chief Financial
Officer
Christina Chiappa
Univ. Dir. Of
Compliance
Vacant
Assoc. VC for Corp. Foundation and Major Gifts Dev.
Andrea Davis
Vice Chancellor Institutional
Advancement
Brigette Bryant
University Director of
Instructional Staff
Labor Relations
Jerry Rothman
Director Rogowsky
Internship Program
Anthony Maniscalco
Deputy Chief Operating
Officer
Ronald Spalter
Assistant Vice Chancellor
Rachel Stephenson
University Assoc VC
Academic Strategy
Amy McIntosh
Special Advisor
Gayle Horwitz

APPENDIX B ‐ REAFFIRMATION LETTER
This Appendix contains a copy of the Re‐affirmation Letter distributed this past Plan Year.
Central Office
APP B


APPENDIX C ‐ JOB GROUPS / LABOR MARKET AVAILABILITY FACTORS (ITALIAN AMERICAN PLAN)
This report lists those CUNY job groups for which the college has employees. Groups with fewer than five employees are listed here but will not be included in Utilization Analysis worksheets. Titles added to CUNY's job system in the past year are listed at the end of this Appendix.
Individuals in the Chief Executive role are not included in this report.
Labor Market Availability factors (LMA) are listed for each group. LMA Factor 1 is an external Labor Market measure. Availabiity factors for all groups, including Italian Americans, are detailed here. The weighting of external factors is identical for all groups. LMA Factor 2 is an internal factor (i.e., employees eligible for promotion into the group).
929Full Time Employee Count:
Central Office
APP C‐1

APPENDIX C ‐ JOB GROUPS / LABOR MARKET AVAILABILITY FACTORS (ITALIAN AMERICAN PLAN)
Category: Executive/Administrative/Managerial
Employee Count: 79
Administration 1 (Executive)
Executive Compensation Plan (Other Than Chief Executive)
Title(s)
1‐External Earned Degrees Conferred (EDC) US ‐ Ph.D., M.A., B.A., 2013‐1440.00%
2‐Internal (all groups)
Promotable, Transferable, Trainable employees within contractors organization. ‐ CUNY Survey ‐ selected titles, service requirement and criteria ‐Source Spring 2013.
60.00%
Executive Compensation Plan; Chief Executives (Presidents, Deans of Major Schools) are excluded
Employee(s)
LMA Factor ExplanationWeightLabor Market Availability Factors
1‐Ext Italian‐Amer.
2007‐2011 American Community Survey (ACS) ‐ U.S. ‐ Italian American Ph.D., M.A., B.A. holders, ages 28‐65; 100% First Ancestry and 50% Second Ancestry
1Exec Vice Chancellor
1HEO/Asst Admin
1Secy to Board
1Sr Vice Chancellor
32Univ Administrator
12Univ Assc Administrator
5Univ Assc Dean
8Univ Asst Administrator
1Univ Asst VC
7Univ Dean
4University Associate VC
6Vice Chancellor
Employee Count: 250
Administration 2 (Manager)
Manager‐Level Administrators
Title(s)
1‐External Earned Degrees Conferred (ECD) 4‐State (NY/NJ/CT/PA); B.A., 2013‐201440.00%
2‐Internal (all groups)
Promotable, Transferable, Trainable employees within contractors organization. ‐ CUNY Survey ‐ selected titles, service requirement and criteria ‐Source Spring 2014.
60.00%
Employee(s)
LMA Factor ExplanationWeightLabor Market Availability Factors
1‐Ext Italian‐Amer.
2007‐2011 American Community Survey (ACS) 4‐State (NY/NJ/CT/PA) Italian American B.A. holders, ages 21‐65; 100% First Ancestry and 50% Second Ancestry
116HE Associate
134HE Officer
APP C‐2

APPENDIX C ‐ JOB GROUPS / LABOR MARKET AVAILABILITY FACTORS (ITALIAN AMERICAN PLAN)
Category: Executive/Administrative/Managerial
Employee Count: 2
Facility Manager
Facility Superintendents (Managerial)
Title(s)
1‐External 2007‐2011 US Census‐American Community Survey (ACS) 4‐State (NY/NJ/CT/PA), First Line Supervisor/Managers of Housekeeping and Janitorial Workers (4200)
100.00%
2‐Internal (all groups)
NA0.00%
In 2017, combined Admin Superintendent and Chief Admin Superintendent groups.
Employee(s)
LMA Factor ExplanationWeightLabor Market Availability Factors
1‐Ext Italian‐Amer.
2007‐2011 US Census‐American Community Survey (ACS) 4‐State (NY/NJ/CT/PA), First Line Supervisor/Managers of Housekeeping and Janitorial Workers (4200); 100% First Ancestry and 50% Second Ancestry for Italian Americans
1Admin Supt Builds Grds
1Chief Admin Supt ‐ Competitive
Employee Count: 76
IT Computer Manager
Information Technology Managers (Managerial)
Title(s)
1‐External 2007‐2011 US Census‐American Community Survey (ACS) 4‐State (NY/NJ/CT/PA), Computer and Information Systems Managers (1110)
100.00%
2‐Internal (all groups)
NA0.00%
Employee(s)
LMA Factor ExplanationWeightLabor Market Availability Factors
1‐Ext Italian‐Amer.
2007‐2011 US Census‐American Community Survey (ACS) 4‐State (NY/NJ/CT/PA), Computer and Information Systems Managers (1110); 100% First Ancestry and 50% Second Ancestry for Italian Americans
3IT Computer Operations Mgr
73IT Computer Systems Mgr
APP C‐3

APPENDIX C ‐ JOB GROUPS / LABOR MARKET AVAILABILITY FACTORS (ITALIAN AMERICAN PLAN)
Category: Executive/Administrative/Managerial
Employee Count: 4
Security Manager
Campus Security Managers (Managerial)
Title(s)
1‐External 2007‐2011 US Census‐American Community Survey (ACS) ‐ Residence Geography, New York City ‐ Police and Sheriffs Patrol Officer (3850)
100.00%
2‐Internal (all groups)
NA0.00%
Employee(s)
LMA Factor ExplanationWeightLabor Market Availability Factors
1‐Ext Italian‐Amer.
2007‐2011 US Census‐American Community Survey (ACS) ‐ Residence Geography, New York City ‐ Police and Sheriffs Patrol Officer (3850); 100% First Ancestry and 50% Second Ancestry for Italian Americans
1Campus Security Asst Dir
3Campus Security Dir
APP C‐4

APPENDIX C ‐ JOB GROUPS / LABOR MARKET AVAILABILITY FACTORS (ITALIAN AMERICAN PLAN)
Category: Professional Non‐Faculty
Employee Count: 3
Accountant
Accountants (Professionals)
Title(s)
1‐External Internal Only0.00%
2‐Internal (all groups)
CUNY Survey Fall 2013, Permanent College Accounting Assistants. On September 19, 2013 College Accounting Assistants received an opportunity for promotion based on service and educational qualifications.
100.00%
Employee(s)
LMA Factor ExplanationWeightLabor Market Availability Factors
1‐Ext Italian‐Amer.
Internal Only
1Finance Accountant
2Purchasing Agent
Employee Count: 237
Administration 3 (Professional)
Administrators (Professionals)
Title(s)
1‐External Earned Degrees Conferred (ECD) 4‐State (NY/NJ/CT/PA); B.A., 2013‐201470.00%
2‐Internal (all groups)
Promotable, Transferable, Trainable employees within contractors organization. ‐ CUNY Survey ‐ selected titles, service requirement and criteria ‐Source Spring 2014.
30.00%
Employee(s)
LMA Factor ExplanationWeightLabor Market Availability Factors
1‐Ext Italian‐Amer.
2007‐2011 American Community Survey (ACS) 4‐State (NY/NJ/CT/PA) Italian American B.A. holders, ages 21‐65; 100% First Ancestry and 50% Second Ancestry
141Asst to HEO
95HE Assistant
1Research Assc
APP C‐5

APPENDIX C ‐ JOB GROUPS / LABOR MARKET AVAILABILITY FACTORS (ITALIAN AMERICAN PLAN)
Category: Professional Non‐Faculty
Employee Count: 20
Administration 5 (Engineer‐Architect)
Engineers and Architects and related professional staff
Title(s)
1‐External 2007‐2011 American Community Survey (ACS) for NY State only; Engineering Managers (300) and Architects, Except Naval (1300)
100.00%
2‐Internal (all groups)
NA0.00%
Employee(s)
LMA Factor ExplanationWeightLabor Market Availability Factors
1‐Ext Italian‐Amer.
2007‐2011 American Community Survey (ACS) for NY State only; Engineering Managers (300) and Architects, Except Naval (1300); 100% First Ancestry and 50% Second Ancestry for Italian Americans
1Architect
3Engineer
13Project Mgr
2Univ Assc Chief Engineer
1Univ Chief Architect
Employee Count: 129
IT Computer Professional
Information Technology Professionals
Title(s)
1‐External 2007‐2011 US Census‐American Community Survey (ACS) 4‐State (NY/NJ/CT/PA), Computer Scientist Systems Analyst (1000); Computer Programmer (1010); Computer Software Engineers (1020); Database Administrator (1060); Network Systems & Data Communication Analysts (1110); Computer Hardware Engineers (1400); Computer Operators (5800); and Computer Control Programmers and Operators (7900)
100.00%
2‐Internal (all groups)
NA0.00%
In 2017, split from IT Technicians and moved to Professionals' group
Employee(s)
LMA Factor ExplanationWeightLabor Market Availability Factors
1‐Ext Italian‐Amer.
2007‐2011 US Census‐American Community Survey (ACS) 4‐State (NY/NJ/CT/PA), Computer Scientist Systems Analyst (1000); Computer Programmer (1010); Computer Software Engineers (1020); Database Administrator (1060); Network Systems & Data Communication Analysts (1110); Computer Hardware Engineers (1400); Computer Operators (5800); and Computer Control Programmers and Operators (7900); 100% First Ancestry and 50% Second Ancestry for Italian Americans
31IT Associate
47IT Asst
1IT Software Dev‐PeopleSoft
50IT Sr Associate
APP C‐6

APPENDIX C ‐ JOB GROUPS / LABOR MARKET AVAILABILITY FACTORS (ITALIAN AMERICAN PLAN)
Category: Administrative Support Workers
Employee Count: 3
Accountant Assistant
Accounting Support Staff
Title(s)
1‐External 2007‐2011 US Census‐American Community Survey (ACS)‐NY/NJ/CT/PA, Accountants and Auditors (code 800) and Purchasing Managers (150)
100.00%
2‐Internal (all groups)
NA0.00%
In 2017, incorporated new CUNY Payroll Clerk title
Employee(s)
LMA Factor ExplanationWeightLabor Market Availability Factors
1‐Ext Italian‐Amer.
2007‐2011 US Census‐American Community Survey (ACS)‐NY/NJ/CT/PA, Accountants and Auditors (code 800) and Purchasing Managers (150); 100% First Ancestry and 50% Second Ancestry for Italian Americans
1Asst Purchasing Agent
1Finance Accountant Asst
1Univ Payroll Analyst
Employee Count: 7
Administrative Assistant
Administrative Support Staff‐Senior Level
Title(s)
1‐External Internal Only0.00%
2‐Internal (all groups)
CUNY Survey Spring 2011 ‐ CUNY Administrative Assistant title is strictly promotional from the Permanent CUNY Office Assistant (level 3 or above).
100.00%
Employee(s)
LMA Factor ExplanationWeightLabor Market Availability Factors
1‐Ext Italian‐Amer.
Internal Only
7CUNY Admin Asst
APP C‐7

APPENDIX C ‐ JOB GROUPS / LABOR MARKET AVAILABILITY FACTORS (ITALIAN AMERICAN PLAN)
Category: Administrative Support Workers
Employee Count: 12
Mail Services Worker
Mail Services Workers
Title(s)
1‐External 2007‐2011 US Census‐American Community Survey (ACS) 4‐State (NY/NJ/CT/PA), Mail Clerks/Mail Machine Operators, Except Postal Service (5850)
100.00%
2‐Internal (all groups)
NA0.00%
Employee(s)
LMA Factor ExplanationWeightLabor Market Availability Factors
1‐Ext Italian‐Amer.
2007‐2011 US Census‐American Community Survey (ACS) 4‐State (NY/NJ/CT/PA), Mail Clerks/Mail Machine Operators, Except Postal Service (5850); 100% First Ancestry and 50% Second Ancestry for Italian Americans
12Mail Message Svcs Worker
Employee Count: 32
Office Assistant
Administrative Support Staff‐Entry Level
Title(s)
1‐External 2007‐2011 US Census‐American Community Survey (ACS) 4‐State (NY/NJ/CT/PA), Secretaries, and Administrative Assistants (5700); Word Processors and Typists (5820); and Office Administrative Support Workers, all other (5940), Office Clerks, General (5860)
100.00%
2‐Internal (all groups)
NA0.00%
Employee(s)
LMA Factor ExplanationWeightLabor Market Availability Factors
1‐Ext Italian‐Amer.
2007‐2011 US Census‐American Community Survey (ACS) 4‐State (NY/NJ/CT/PA), Secretaries, and Administrative Assistants (5700); Word Processors and Typists (5820); and Office Administrative Support Workers, all other (5940), Office Clerks, General (5860); 100% First Ancestry and 50% Second Ancestry for Italian Americans
4Clerical Associate
27CUNY Office Assistant
1EOC Office Assistant
APP C‐8

APPENDIX C ‐ JOB GROUPS / LABOR MARKET AVAILABILITY FACTORS (ITALIAN AMERICAN PLAN)
Category: Technicians
Employee Count: 38
Broadcast/Media
Broadcast and Mass Media Technicians
Title(s)
1‐External 2007‐2011 US Census‐American Community Survey (ACS) 4‐State (NY/NJ/CT/PA), Broadcast and Sound Engineer Technicians and Radio Operators and Other Media and Communications Equipment Workers (2900)
100.00%
2‐Internal (all groups)
NA0.00%
Employee(s)
LMA Factor ExplanationWeightLabor Market Availability Factors
1‐Ext Italian‐Amer.
2007‐2011 US Census‐American Community Survey (ACS) 4‐State (NY/NJ/CT/PA), Broadcast and Sound Engineer Technicians and Radio Operators and Other Media and Communications Equipment Workers (2900); 100% First Ancestry and 50% Second Ancestry for Italian Americans
38Broadcast Assc
Employee Count: 1
Engineering Technician
Engineering and Architectural Technicians
Title(s)
1‐External 2007‐2011 US Census‐American Community Survey (ACS) 4‐State (NY/NJ/CT/PA), Engineering Technicians (1550)
100.00%
2‐Internal (all groups)
NA0.00%
Employee(s)
LMA Factor ExplanationWeightLabor Market Availability Factors
1‐Ext Italian‐Amer.
2007‐2011 US Census‐American Community Survey (ACS) 4‐State (NY/NJ/CT/PA), Engineering Technicians (1550); 100% First Ancestry and 50% Second Ancestry for Italian Americans
1Facilities Coord
APP C‐9

APPENDIX C ‐ JOB GROUPS / LABOR MARKET AVAILABILITY FACTORS (ITALIAN AMERICAN PLAN)
Category: Technicians
Employee Count: 11
IT Support Technician
IT Technical Support Workers
Title(s)
1‐External 2007‐2011 US Census‐American Community Survey (ACS) 4‐State (NY/NJ/CT/PA), Computer Support Specialists (1050)
100.00%
2‐Internal (all groups)
NA0.00%
In 2017, split from the Professional IT Staff
Employee(s)
LMA Factor ExplanationWeightLabor Market Availability Factors
1‐Ext Italian‐Amer.
2007‐2011 US Census‐American Community Survey (ACS) 4‐State (NY/NJ/CT/PA), Computer Support Specialists (1050); 100% First Ancestry and 50% Second Ancestry for Italian Americans
11IT Support Asst
Employee Count: 2
Print Shop
Print Shop and Related Tech Workers
Title(s)
1‐External 2007‐2011 US Census‐American Community Survey (ACS) 4‐State (NY/NJ/CT/PA), Miscellaneous Media & Communication Workers (2860) and Printing Machine Operators (8255)
100.00%
2‐Internal (all groups)
NA0.00%
Employee(s)
LMA Factor ExplanationWeightLabor Market Availability Factors
1‐Ext Italian‐Amer.
2007‐2011 US Census‐American Community Survey (ACS) 4‐State (NY/NJ/CT/PA), Miscellaneous Media & Communication Workers (2860) and Printing Machine Operators (8255); 100% First Ancestry and 50% Second Ancestry for Italian Americans
1Graphics Designer
1Print Shop Associate
APP C‐10

APPENDIX C ‐ JOB GROUPS / LABOR MARKET AVAILABILITY FACTORS (ITALIAN AMERICAN PLAN)
Category: Craft Workers
Employee Count: 1
Laborers and Helpers
Entry‐Level Craft Workers
Title(s)
1‐External 2007‐2011 US Census‐American Community Survey (ACS) 4‐State (NY/NJ/CT/PA), Laborers (53‐7062) and Helpers (47‐3010)
100.00%
2‐Internal (all groups)
NA0.00%
In 2017, split from Skilled Trades
Employee(s)
LMA Factor ExplanationWeightLabor Market Availability Factors
1‐Ext Italian‐Amer.
2007‐2011 US Census‐American Community Survey (ACS) 4‐State (NY/NJ/CT/PA), Laborers (53‐7062) and Helpers (47‐3010); 100% First Ancestry and 50% Second Ancestry for Italian Americans
1Stock Worker
APP C‐11

APPENDIX C ‐ JOB GROUPS / LABOR MARKET AVAILABILITY FACTORS (ITALIAN AMERICAN PLAN)
Category: Service Workers and Others
Employee Count: 4
Campus Peace Officer‐Level 1
Campus Security‐Entry Level Staff
Title(s)
1‐External 2007‐2011 US Census‐American Community Survey (ACS) ‐ Residence Geography, New York City ‐ Police and Sheriffs Patrol Officer (3850)
100.00%
2‐Internal (all groups)
NA0.00%
Employee(s)
LMA Factor ExplanationWeightLabor Market Availability Factors
1‐Ext Italian‐Amer.
2007‐2011 US Census‐American Community Survey (ACS) ‐ Residence Geography, New York City ‐ Police and Sheriffs Patrol Officer (3850); 100% First Ancestry and 50% Second Ancestry for Italian Americans
4Campus Peace Officer
Employee Count: 1
Campus Peace Officer‐Level 2
Campus Security‐Mid Level Staff
Title(s)
1‐External Internal Only0.00%
2‐Internal (all groups)
CUNY Survey Spring 2011 ‐ Permanent Campus Peace/Security Officer Level 1 ‐ The Campus Peace/Security Officer Level 2 title is strictly promotional from the Permanent Campus Peace/Security Officer Level 1 title with years of service requirement.
100.00%
Employee(s)
LMA Factor ExplanationWeightLabor Market Availability Factors
1‐Ext Italian‐Amer.
Internal Only
1Campus Peace Officer
Employee Count: 10
Campus Peace Officer‐Sergeant
Campus Security Supervisors
Title(s)
1‐External Internal Only0.00%
2‐Internal (all groups)
CUNY Permanent Campus Peace Officer Level 1 and 2100.00%
Employee(s)
LMA Factor ExplanationWeightLabor Market Availability Factors
1‐Ext Italian‐Amer.
Internal Only
APP C‐12

APPENDIX C ‐ JOB GROUPS / LABOR MARKET AVAILABILITY FACTORS (ITALIAN AMERICAN PLAN)
Category: Service Workers and Others
1Campus Pub Safety Sergeant
9Campus Security Specialist
Employee Count: 4
Custodial
Custodians‐Entry Level
Title(s)
1‐External 2007‐2011 US Census‐American Community Survey (ACS) 4‐State (NY/NJ/CT/PA), Janitors and Building Cleaners (4220)
100.00%
2‐Internal (all groups)
NA0.00%
Employee(s)
LMA Factor ExplanationWeightLabor Market Availability Factors
1‐Ext Italian‐Amer.
2007‐2011 US Census‐American Community Survey (ACS) 4‐State (NY/NJ/CT/PA), Janitors and Building Cleaners (4220); 100% First Ancestry and 50% Second Ancestry for Italian Americans
4Custodial Assistant
Employee Count: 3
Custodial Supervisor
Custodial Supervisors
Title(s)
1‐External 2007‐2011 US Census‐American Community Survey (ACS) 4‐State (NY/NJ/CT/PA), First Line Supervisors/Managers of Housekeeping/Janitorial Workers (4200)
100.00%
2‐Internal (all groups)
NA0.00%
Employee(s)
LMA Factor ExplanationWeightLabor Market Availability Factors
1‐Ext Italian‐Amer.
2007‐2011 US Census‐American Community Survey (ACS) 4‐State (NY/NJ/CT/PA), First Line Supervisors/Managers of Housekeeping/Janitorial Workers (4200); 100% First Ancestry and 50% Second Ancestry for Italian Americans
1Custodial Asst Principal Supv
1Custodial Principal Supv
1Custodial Supervisor
APP C‐13

APPENDIX C ‐ JOB GROUPS / LABOR MARKET AVAILABILITY FACTORS (ITALIAN AMERICAN PLAN)
Note: In the 2017‐2018 Academic Year, CUNY added the titles listed below (not all are used at the College).
Job Code Title Name Job Group200444 University Senior Vice Chancellor for Design and Construction Administration 1 (Executives)
200544 University Associate Vice Chancellor for Research Administration 1 (Executives)
200545 Exec Dir Labor Relations‐Assistant Administrator Administration 1 (Executives)
200546 Dean School Prof Stds‐Senior University Dean Administration 1 (Executives)
200547 University Associate Vice Chancellor for Academic Strategy Administration 1 (Executives)
200548 University Executive Director of Procurement Administration 1 (Executives)
200549 Associate Dean Research Administration 1 (Executives)
200550 University Assistant Vice Chancellor Academic Affairs Administration 1 (Executives)
200551 University Deputy Secretary to the Board‐University Associate Administrator Administration 1 (Executives)
200552 Exec Chief Librarian ‐ Dean Administration 1 (Executives)
200553 University Executive Director of Technology Strategy‐University Administrator Administration 1 (Executives)
200554 University Vice Chancellor University Advancement Administration 1 (Executives)
200555 University Associate Vice Chancellor for Academic Affairs Administration 1 (Executives)
200556 Assistant Dean Institutional Research and Strategic Planning Administration 1 (Executives)
200557 University Assistant Vice Chancellor Enrollment Management Administration 1 (Executives)
200558 Assistant VP Enroll Management Student Success Administration 1 (Executives)
200559 University Dean Health and Human Services Administration 1 (Executives)
200560 Dean School of Labor and Urban Studies Administration 1 (Executives)
200561 Executive Director Financial Services‐AstAdm Administration 1 (Executives)
400697 Associate Legal Counsel‐Higher Education Officer Administration 2 (Managers)
500086 Elevator Mechanic (previous title re‐activated) Skilled Trades
500282 University Senior Payroll Analyst 1 Accountant Assistant
500283 University Senior Payroll Analyst 2 Accountant Assistant
200564 Univ Exec Gen Counsel‐Uadm Administration 1 (Executives)
APP C‐14

APPENDIX E‐1 ‐ ADMINISTRATOR / STAFF UTILIZATION BY JOB GROUP (ITALIAN AMERICAN PLAN)
Central Office
Appendix E‐1 presents utilization and underutilization of protected groups by job group. A group is displayed only when there are five or more employees assigned to it.
Underutilization occurs where the utilization of a protected group is less than 80% of Labor Market Availability. We calculate a number approximating the number of full‐time employees that would be needed to make utilization equal to the labor market. Where utilization is zero (0), underutilization exists but not to the level of one full‐time equivalent employee. Blanks indicate no underutilization.
Underutilization numbers represent specific placement goals as prescribed for federal Affirmative Action Plans.
Total Minority is comprised of Asian/Hawaiian/Other Pacific Islander, Black/African American, Hispanic/Latino, American Indian/Alaska Native and Two or More Races.
APP E1‐1

APPENDIX E‐1 ‐ ADMINISTRATOR / STAFF UTILIZATION BY JOB GROUP (ITALIAN AMERICAN PLAN)
Category: Executive/Administrative/Managerial
Job Group: Administration 1 (Executive)
Employees in this group hold the following titles:
Full‐Time Employees: 79
Description: Executive Compensation Plan (Other Than Chief Executive)
Title ID Title Name
Exec Vice Chancellor04329
HEO/Asst Admin04494
Secy to Board04715
Sr Vice Chancellor04712
Univ Administrator04704
Univ Assc Administrator04318
Univ Assc Dean04317
Univ Asst Administrator04721
Univ Asst VC04351
Univ Dean04703
University Associate VC04350
Vice Chancellor04326
Utilization Report
Number of Employees
8.9%11.1%8.5%49.3%Labor Market Avail. Percent 29.7%
7.6%7.6%10.1%25.3%Actual Utilization Percent 55.7%
3Number Underutilized
YUnderutilized (Yes/No)
Hispanic/ Latino
6
Black/African Am.
6
Asian/Nat. Haw./Other
Pac. Isl.
8
Total Minority
20
Female
44
Italian American
12
15.2%
6.9%
APP E1‐2

APPENDIX E‐1 ‐ ADMINISTRATOR / STAFF UTILIZATION BY JOB GROUP (ITALIAN AMERICAN PLAN)
Category: Executive/Administrative/Managerial
Job Group: Administration 2 (Manager)
Employees in this group hold the following titles:
Full‐Time Employees: 250
Description: Manager‐Level Administrators
Title ID Title Name
HE Associate04075
HE Officer04097
Utilization Report
Number of Employees
13.5%16.3%10.6%59.9%Labor Market Avail. Percent 41.4%
13.6%20.8%11.6%47.2%Actual Utilization Percent 60.8%
Number Underutilized
Underutilized (Yes/No)
Hispanic/ Latino
34
Black/African Am.
52
Asian/Nat. Haw./Other
Pac. Isl.
29
Total Minority
118
Female
152
Italian American
22
8.8%
8.6%
APP E1‐3

APPENDIX E‐1 ‐ ADMINISTRATOR / STAFF UTILIZATION BY JOB GROUP (ITALIAN AMERICAN PLAN)
Category: Executive/Administrative/Managerial
Job Group: IT Computer Manager
Employees in this group hold the following titles:
Full‐Time Employees: 76
Description: Information Technology Managers (Managerial)
Title ID Title Name
IT Computer Operations Mgr04972
IT Computer Systems Mgr04973
Utilization Report
Number of Employees
5.2%4.3%15.7%28.5%Labor Market Avail. Percent 26.6%
6.6%14.5%30.3%56.6%Actual Utilization Percent 28.9%
Number Underutilized
Underutilized (Yes/No)
Hispanic/ Latino
5
Black/African Am.
11
Asian/Nat. Haw./Other
Pac. Isl.
23
Total Minority
43
Female
22
Italian American
6
Y
6
7.9%
15.3%
APP E1‐4

APPENDIX E‐1 ‐ ADMINISTRATOR / STAFF UTILIZATION BY JOB GROUP (ITALIAN AMERICAN PLAN)
Category: Professional Non‐Faculty
Job Group: Administration 3 (Professional)
Employees in this group hold the following titles:
Full‐Time Employees: 237
Description: Administrators (Professionals)
Title ID Title Name
Asst to HEO04017
HE Assistant04099
Research Assc04134
Utilization Report
Number of Employees
12.0%14.3%9.6%61.1%Labor Market Avail. Percent 37.6%
23.2%34.6%12.7%73.0%Actual Utilization Percent 75.9%
Number Underutilized
Underutilized (Yes/No)
Hispanic/ Latino
55
Black/African Am.
82
Asian/Nat. Haw./Other
Pac. Isl.
30
Total Minority
173
Female
180
Italian American
12
Y
15
5.1%
11.5%
APP E1‐5

APPENDIX E‐1 ‐ ADMINISTRATOR / STAFF UTILIZATION BY JOB GROUP (ITALIAN AMERICAN PLAN)
Category: Professional Non‐Faculty
Job Group: Administration 5 (Engineer‐Architect)
Employees in this group hold the following titles:
Full‐Time Employees: 20
Description: Engineers and Architects and related professional staff
Title ID Title Name
Architect04822
Engineer04829
Project Mgr04819
Univ Assc Chief Engineer04811
Univ Chief Architect04824
Utilization Report
Number of Employees
7.8%4.1%11.6%22.6%Labor Market Avail. Percent 24.9%
10.0%15.0%20.0%45.0%Actual Utilization Percent 15.0%
Number Underutilized 2
Underutilized (Yes/No) Y
Hispanic/ Latino
2
Black/African Am.
3
Asian/Nat. Haw./Other
Pac. Isl.
4
Total Minority
9
Female
3
Italian American
3
15.0%
13.1%
APP E1‐6

APPENDIX E‐1 ‐ ADMINISTRATOR / STAFF UTILIZATION BY JOB GROUP (ITALIAN AMERICAN PLAN)
Category: Professional Non‐Faculty
Job Group: IT Computer Professional
Employees in this group hold the following titles:
Full‐Time Employees: 129
Description: Information Technology Professionals
Title ID Title Name
IT Associate04877
IT Asst04875
IT Software Dev‐PeopleSoft04884
IT Sr Associate04880
Utilization Report
Number of Employees
5.4%7.1%19.7%26.4%Labor Market Avail. Percent 33.6%
22.5%17.1%27.9%68.2%Actual Utilization Percent 39.5%
Number Underutilized
Underutilized (Yes/No)
Hispanic/ Latino
29
Black/African Am.
22
Asian/Nat. Haw./Other
Pac. Isl.
36
Total Minority
88
Female
51
Italian American
8
Y
8
6.2%
12.1%
APP E1‐7

APPENDIX E‐1 ‐ ADMINISTRATOR / STAFF UTILIZATION BY JOB GROUP (ITALIAN AMERICAN PLAN)
Category: Administrative Support Workers
Job Group: Administrative Assistant
Employees in this group hold the following titles:
Full‐Time Employees: 7
Description: Administrative Support Staff‐Senior Level
Title ID Title Name
CUNY Admin Asst04804
Utilization Report
Number of Employees
27.0%38.1%8.0%91.1%Labor Market Avail. Percent 74.0%
14.3%71.4%0.0%85.7%Actual Utilization Percent 100.0%
11Number Underutilized
YYUnderutilized (Yes/No)
Hispanic/ Latino
1
Black/African Am.
5
Asian/Nat. Haw./Other
Pac. Isl.
0
Total Minority
6
Female
7
Italian American
0
Y
0
0.0%
5.4%
APP E1‐8

APPENDIX E‐1 ‐ ADMINISTRATOR / STAFF UTILIZATION BY JOB GROUP (ITALIAN AMERICAN PLAN)
Category: Administrative Support Workers
Job Group: Office Assistant
Employees in this group hold the following titles:
Full‐Time Employees: 32
Description: Administrative Support Staff‐Entry Level
Title ID Title Name
Clerical Associate04922
CUNY Office Assistant04802
EOC Office Assistant04870
Utilization Report
Number of Employees
9.8%11.6%3.7%89.9%Labor Market Avail. Percent 26.5%
18.8%40.6%15.6%75.0%Actual Utilization Percent 81.3%
Number Underutilized
Underutilized (Yes/No)
Hispanic/ Latino
6
Black/African Am.
13
Asian/Nat. Haw./Other
Pac. Isl.
5
Total Minority
24
Female
26
Italian American
2
Y
3
6.3%
16.7%
APP E1‐9

APPENDIX E‐1 ‐ ADMINISTRATOR / STAFF UTILIZATION BY JOB GROUP (ITALIAN AMERICAN PLAN)
Category: Administrative Support Workers
Job Group: Mail Services Worker
Employees in this group hold the following titles:
Full‐Time Employees: 12
Description: Mail Services Workers
Title ID Title Name
Mail Message Svcs Worker04921
Utilization Report
Number of Employees
16.9%19.2%4.9%41.5%Labor Market Avail. Percent 42.7%
16.7%58.3%0.0%75.0%Actual Utilization Percent 0.0%
1Number Underutilized 5
YUnderutilized (Yes/No) Y
Hispanic/ Latino
2
Black/African Am.
7
Asian/Nat. Haw./Other
Pac. Isl.
0
Total Minority
9
Female
0
Italian American
2
16.7%
11.6%
APP E1‐10

APPENDIX E‐1 ‐ ADMINISTRATOR / STAFF UTILIZATION BY JOB GROUP (ITALIAN AMERICAN PLAN)
Category: Technicians
Job Group: Broadcast/Media
Employees in this group hold the following titles:
Full‐Time Employees: 38
Description: Broadcast and Mass Media Technicians
Title ID Title Name
Broadcast Assc04992
Utilization Report
Number of Employees
8.1%11.3%2.7%12.9%Labor Market Avail. Percent 23.8%
15.8%34.2%5.3%55.3%Actual Utilization Percent 34.2%
Number Underutilized
Underutilized (Yes/No)
Hispanic/ Latino
6
Black/African Am.
13
Asian/Nat. Haw./Other
Pac. Isl.
2
Total Minority
21
Female
13
Italian American
0
Y
6
0.0%
17.0%
APP E1‐11

APPENDIX E‐1 ‐ ADMINISTRATOR / STAFF UTILIZATION BY JOB GROUP (ITALIAN AMERICAN PLAN)
Category: Technicians
Job Group: IT Support Technician
Employees in this group hold the following titles:
Full‐Time Employees: 11
Description: IT Technical Support Workers
Title ID Title Name
IT Support Asst04865
Utilization Report
Number of Employees
9.0%11.7%10.4%29.0%Labor Market Avail. Percent 32.6%
54.5%36.4%0.0%90.9%Actual Utilization Percent 45.5%
1Number Underutilized
YUnderutilized (Yes/No)
Hispanic/ Latino
6
Black/African Am.
4
Asian/Nat. Haw./Other
Pac. Isl.
0
Total Minority
10
Female
5
Italian American
0
Y
2
0.0%
14.6%
APP E1‐12

APPENDIX E‐1 ‐ ADMINISTRATOR / STAFF UTILIZATION BY JOB GROUP (ITALIAN AMERICAN PLAN)
Category: Service Workers and Others
Job Group: Campus Peace Officer‐Sergeant
Employees in this group hold the following titles:
Full‐Time Employees: 10
Description: Campus Security Supervisors
Title ID Title Name
Campus Pub Safety Sergeant04846
Campus Security Specialist04845
Utilization Report
Number of Employees
23.8%55.1%6.1%22.6%Labor Market Avail. Percent 85.9%
50.0%30.0%0.0%80.0%Actual Utilization Percent 30.0%
1 3Number Underutilized
YYUnderutilized (Yes/No)
Hispanic/ Latino
5
Black/African Am.
3
Asian/Nat. Haw./Other
Pac. Isl.
0
Total Minority
8
Female
3
Italian American
0
Y
0
0.0%
1.5%
APP E1‐13

APPENDIX F ‐ SUMMARY OF PERSONNEL ACTIVITY
This Appendix provides tables with detail on personnel activities and faculty tenure actions by ethnicity and gender.
Central Office
Index to Personnel Actions
Action Type Description
Hire Employed at the college for the first time, or re‐hired after a break in service; includes employees who previously worked at another CUNY College and individuals appointed through Civil Service Transfer Rosters.
Left to Advance to Higher Group + Advanced from a Lower
Employee took a new job that represents a career advancement. This is counted as a hire in the new group and a separation in the old group.
Left Faculty to Move to Executives + Joined Executives from Faculty
A faculty member left a faculty appointment to join the Executive ranks. Normally he/she retains tenure in the faculty appointment.
Left Executives to Return to Faculty + Joined Faculty from Executives
A faculty member returned to a faculty appointment after serving in Executive ranks.
Left Group‐Other + Transferred from Other Group
Other change in Job Group where there is no stated or implied career advancement.
Separation or Separation within Plan Year
Employee left employment in the College. If occurred within single Plan Year, may be counted as both a Hire and Separation from the same Job Group.
Advanced Within Group Employee took a higher title (or higher level of the same job title) within the same group.
Title Change Within Group‐Other
Employee took another title within the same job group with no stated or implied career advancement.
Awarded Tenure Awarded Tenure or CCE following a review process.
Hired with Tenure Granted tenure upon initial hire, generally due to having a tenured status at a previous institution.
Denied Tenure Tenure denied after a review process. If a job title is not provided, this indicates employee has left CUNY employment (was not counted in the Census).
APP F

Campus Summary‐All Groups
Net Group Changes Addition #
Additions %
Hire (Outside CUNY and Other CUNY College)
Move from a Higher Group
Move from a Lower Group
Other Change of Group
Return to Faculty from
Other Title Sub. # Sub %
Separation (Left College or Left CUNY)
Move to Higher Group
Move to Lower Group
Other Change of Group
Return to Faculty Title
Title Change Within Group
Title Change %
Total (38) 115 93 1 18 3 ‐ (153) (131) (18) (1) (3) ‐ 18
Male (32) 47 41% 40 ‐ 7 ‐ ‐ (79) 52% (72) (7) ‐ ‐ ‐ 7 39% Female (6) 68 59% 53 1 11 3 ‐ (74) 48% (59) (11) (1) (3) ‐ 11 61% Other/Unknown ‐ ‐ 0% ‐ ‐ ‐ ‐ ‐ ‐ 0% ‐ ‐ ‐ ‐ ‐ ‐ 0%
Total Min (2) 69 60% 60 ‐ 7 2 ‐ (71) 46% (62) (7) ‐ (2) ‐ 7 39%
Asian 3 26 23% 22 ‐ 3 1 ‐ (23) 15% (19) (3) ‐ (1) ‐ 2 11% Black 1 23 20% 21 ‐ 2 ‐ ‐ (22) 14% (20) (2) ‐ ‐ ‐ 4 22% Hispanic (3) 18 16% 15 ‐ 2 1 ‐ (21) 14% (18) (2) ‐ (1) ‐ 1 6% Other Minority (3) 2 2% 2 ‐ ‐ ‐ ‐ (5) 3% (5) ‐ ‐ ‐ ‐ ‐ 0%
Italian‐American (5) 12 10% 7 ‐ 4 1 ‐ (17) 11% (12) (4) ‐ (1) ‐ 4 22%
White (Not Ital) (31) 34 30% 26 1 7 ‐ ‐ (65) 42% (57) (7) (1) ‐ ‐ 7 39%
All White (36) 46 40% 33 1 11 1 ‐ (82) 54% (69) (11) (1) (1) ‐ 11 61%
Unknown ‐ ‐ 0% ‐ ‐ ‐ ‐ ‐ ‐ 0% ‐ ‐ ‐ ‐ ‐ ‐ 0%
Veterans 4 5 4% 5 ‐ ‐ ‐ ‐ (1) 1% (1) ‐ ‐ ‐ ‐ ‐ 0%
Individuals w/Disabilities 2 6 5% 4 ‐ 2 ‐ ‐ (4) 3% (4) ‐ ‐ ‐ ‐ ‐ 0%
TITLE CHANGES WITHIN GROUP NET ADDITIONS
Joined Group ‐ HIRE Joined Group‐INTERNAL MOVE NET SUBTRACTIONS
Left Group ‐ SEPARATION Left Group‐INTERNAL MOVE
Personnel Action Summary Page 1 of 26

Net Group Changes Addition #
Additions %
Hire (Outside CUNY and Other CUNY College)
Move from a Higher Group
Move from a Lower Group
Other Change of Group
Return to Faculty from
Other Title Sub. # Sub %
Separation (Left College or Left CUNY)
Move to Higher Group
Move to Lower Group
Other Change of Group
Return to Faculty Title
Title Change Within Group
Title Change %
Total (2) 61 45 1 13 2 ‐ (63) (58) (2) (1) (2) ‐ 9
Male (4) 29 48% 24 ‐ 5 ‐ ‐ (33) 52% (32) (1) ‐ ‐ ‐ 2 22% Female 2 32 52% 21 1 8 2 ‐ (30) 48% (26) (1) (1) (2) ‐ 7 78% Other/Unknown ‐ ‐ 0% ‐ ‐ ‐ ‐ ‐ ‐ 0% ‐ ‐ ‐ ‐ ‐ ‐ 0%
Total Min 5 26 43% 21 ‐ 4 1 ‐ (21) 33% (19) (1) ‐ (1) ‐ 2 22%
Asian 10 15 25% 13 ‐ 2 ‐ ‐ (5) 8% (4) (1) ‐ ‐ ‐ ‐ 0% Black ‐ 7 11% 5 ‐ 2 ‐ ‐ (7) 11% (7) ‐ ‐ ‐ ‐ 1 11% Hispanic (2) 3 5% 2 ‐ ‐ 1 ‐ (5) 8% (4) ‐ ‐ (1) ‐ 1 11% Other Minority (3) 1 2% 1 ‐ ‐ ‐ ‐ (4) 6% (4) ‐ ‐ ‐ ‐ ‐ 0%
Italian‐American 4 10 16% 6 ‐ 3 1 ‐ (6) 10% (5) ‐ ‐ (1) ‐ 3 33%
White (Not Ital) (11) 25 41% 18 1 6 ‐ ‐ (36) 57% (34) (1) (1) ‐ ‐ 4 44%
All White (7) 35 57% 24 1 9 1 ‐ (42) 67% (39) (1) (1) (1) ‐ 7 78%
Unknown ‐ ‐ 0% ‐ ‐ ‐ ‐ ‐ ‐ 0% ‐ ‐ ‐ ‐ ‐ ‐ 0%
Veterans (1) ‐ 0% ‐ ‐ ‐ ‐ ‐ (1) 2% (1) ‐ ‐ ‐ ‐ ‐ 0% Individuals w/Disabilities (1) 1 2% ‐ ‐ 1 ‐ ‐ (2) 3% (2) ‐ ‐ ‐ ‐ ‐ 0%
TITLE CHANGES WITHIN GROUP
Joined Group ‐ HIRE Joined Group‐INTERNAL MOVE
Left Group ‐ SEPARATION Left Group‐INTERNAL MOVE
Category Summary
Executive/Administrative/Managerial
Executive/Administrative/Managerial
NET ADDITIONS NET SUBTRACTIONS
Personnel Action Summary Page 2 of 26

Net Group Changes Addition #
Additions %
Hire (Outside CUNY and Other CUNY College)
Move from a Higher Group
Move from a Lower Group
Other Change of Group
Return to Faculty from
Other Title Sub. # Sub %
Separation (Left College or Left CUNY)
Move to Higher Group
Move to Lower Group
Other Change of Group
Return to Faculty Title
Title Change Within Group
Title Change %
Total (2) 19 17 ‐ 2 ‐ ‐ (21) (19) ‐ (1) (1) ‐ 2
Male (1) 8 42% 7 ‐ 1 ‐ ‐ (9) 43% (9) ‐ ‐ ‐ ‐ ‐ 0% Female (1) 11 58% 10 ‐ 1 ‐ ‐ (12) 57% (10) ‐ (1) (1) ‐ 2 100% Other/Unknown ‐ ‐ 0% ‐ ‐ ‐ ‐ ‐ ‐ 0% ‐ ‐ ‐ ‐ ‐ ‐ 0%
Total Min 2 7 37% 6 ‐ 1 ‐ ‐ (5) 24% (5) ‐ ‐ ‐ ‐ ‐ 0%
Asian 4 4 21% 3 ‐ 1 ‐ ‐ ‐ 0% ‐ ‐ ‐ ‐ ‐ ‐ 0% Black ‐ 2 11% 2 ‐ ‐ ‐ ‐ (2) 10% (2) ‐ ‐ ‐ ‐ ‐ 0% Hispanic (1) 1 5% 1 ‐ ‐ ‐ ‐ (2) 10% (2) ‐ ‐ ‐ ‐ ‐ 0% Other Minority (1) ‐ 0% ‐ ‐ ‐ ‐ ‐ (1) 5% (1) ‐ ‐ ‐ ‐ ‐ 0%
Italian‐American (1) 3 16% 3 ‐ ‐ ‐ ‐ (4) 19% (3) ‐ ‐ (1) ‐ 1 50%
White (Not Ital) (3) 9 47% 8 ‐ 1 ‐ ‐ (12) 57% (11) ‐ (1) ‐ ‐ 1 50%
All White (4) 12 63% 11 ‐ 1 ‐ ‐ (16) 76% (14) ‐ (1) (1) ‐ 2 100%
Unknown ‐ ‐ 0% ‐ ‐ ‐ ‐ ‐ ‐ 0% ‐ ‐ ‐ ‐ ‐ ‐ 0%
Veterans (1) ‐ 0% ‐ ‐ ‐ ‐ ‐ (1) 5% (1) ‐ ‐ ‐ ‐ ‐ 0% Individuals w/Disabilities (1) ‐ 0% ‐ ‐ ‐ ‐ ‐ (1) 5% (1) ‐ ‐ ‐ ‐ ‐ 0%
NET SUBTRACTIONSLeft Group ‐ SEPARATION Left Group‐INTERNAL MOVE
TITLE CHANGES WITHIN GROUP
Administration 1 (Executive)
Job Group Summary
ADMIN1‐EXEC
NET ADDITIONS Joined Group ‐
HIRE Joined Group‐INTERNAL MOVE
Personnel Action Summary Page 3 of 26

Net Group Changes Addition #
Additions %
Hire (Outside CUNY and Other CUNY College)
Move from a Higher Group
Move from a Lower Group
Other Change of Group
Return to Faculty from
Other Title Sub. # Sub %
Separation (Left College or Left CUNY)
Move to Higher Group
Move to Lower Group
Other Change of Group
Return to Faculty Title
Title Change Within Group
Title Change %
Total (3) 29 17 1 11 ‐ ‐ (32) (29) (2) ‐ (1) ‐ 7
Male (6) 10 34% 6 ‐ 4 ‐ ‐ (16) 50% (15) (1) ‐ ‐ ‐ 2 29% Female 3 19 66% 11 1 7 ‐ ‐ (16) 50% (14) (1) ‐ (1) ‐ 5 71% Other/Unknown ‐ ‐ 0% ‐ ‐ ‐ ‐ ‐ ‐ 0% ‐ ‐ ‐ ‐ ‐ ‐ 0%
Total Min ‐ 12 41% 9 ‐ 3 ‐ ‐ (12) 38% (10) (1) ‐ (1) ‐ 2 29%
Asian 2 6 21% 5 ‐ 1 ‐ ‐ (4) 13% (3) (1) ‐ ‐ ‐ ‐ 0% Black 2 5 17% 3 ‐ 2 ‐ ‐ (3) 9% (3) ‐ ‐ ‐ ‐ 1 14% Hispanic (2) 1 3% 1 ‐ ‐ ‐ ‐ (3) 9% (2) ‐ ‐ (1) ‐ 1 14% Other Minority (2) ‐ 0% ‐ ‐ ‐ ‐ ‐ (2) 6% (2) ‐ ‐ ‐ ‐ ‐ 0%
Italian‐American 3 5 17% 2 ‐ 3 ‐ ‐ (2) 6% (2) ‐ ‐ ‐ ‐ 2 29%
White (Not Ital) (6) 12 41% 6 1 5 ‐ ‐ (18) 56% (17) (1) ‐ ‐ ‐ 3 43%
All White (3) 17 59% 8 1 8 ‐ ‐ (20) 63% (19) (1) ‐ ‐ ‐ 5 71%
Unknown ‐ ‐ 0% ‐ ‐ ‐ ‐ ‐ ‐ 0% ‐ ‐ ‐ ‐ ‐ ‐ 0%
Veterans ‐ ‐ 0% ‐ ‐ ‐ ‐ ‐ ‐ 0% ‐ ‐ ‐ ‐ ‐ ‐ 0% Individuals w/Disabilities ‐ 1 3% ‐ ‐ 1 ‐ ‐ (1) 3% (1) ‐ ‐ ‐ ‐ ‐ 0%
NET SUBTRACTIONSLeft Group ‐ SEPARATION Left Group‐INTERNAL MOVE
TITLE CHANGES WITHIN GROUP
Job Group Summary
Administration 2 (Managers)
ADMIN2
NET ADDITIONS Joined Group ‐
HIRE Joined Group‐INTERNAL MOVE
Personnel Action Summary Page 4 of 26
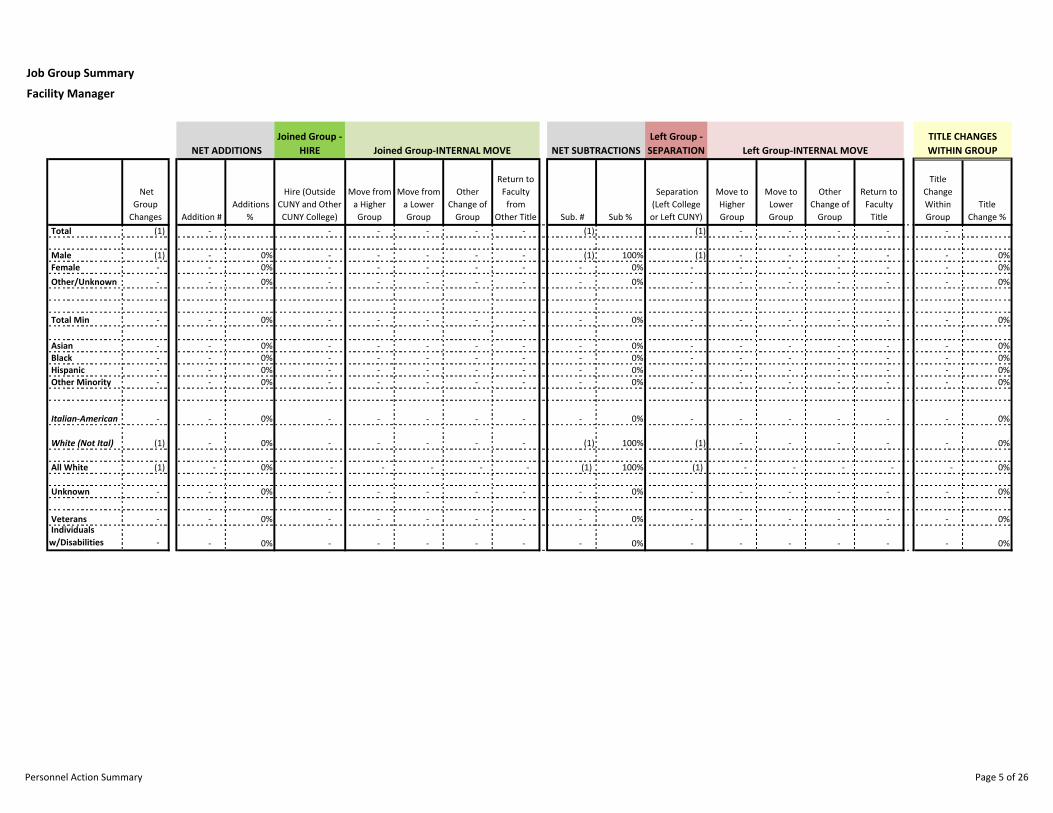
Net Group Changes Addition #
Additions %
Hire (Outside CUNY and Other CUNY College)
Move from a Higher Group
Move from a Lower Group
Other Change of Group
Return to Faculty from
Other Title Sub. # Sub %
Separation (Left College or Left CUNY)
Move to Higher Group
Move to Lower Group
Other Change of Group
Return to Faculty Title
Title Change Within Group
Title Change %
Total (1) ‐ ‐ ‐ ‐ ‐ ‐ (1) (1) ‐ ‐ ‐ ‐ ‐
Male (1) ‐ 0% ‐ ‐ ‐ ‐ ‐ (1) 100% (1) ‐ ‐ ‐ ‐ ‐ 0% Female ‐ ‐ 0% ‐ ‐ ‐ ‐ ‐ ‐ 0% ‐ ‐ ‐ ‐ ‐ ‐ 0% Other/Unknown ‐ ‐ 0% ‐ ‐ ‐ ‐ ‐ ‐ 0% ‐ ‐ ‐ ‐ ‐ ‐ 0%
Total Min ‐ ‐ 0% ‐ ‐ ‐ ‐ ‐ ‐ 0% ‐ ‐ ‐ ‐ ‐ ‐ 0%
Asian ‐ ‐ 0% ‐ ‐ ‐ ‐ ‐ ‐ 0% ‐ ‐ ‐ ‐ ‐ ‐ 0% Black ‐ ‐ 0% ‐ ‐ ‐ ‐ ‐ ‐ 0% ‐ ‐ ‐ ‐ ‐ ‐ 0% Hispanic ‐ ‐ 0% ‐ ‐ ‐ ‐ ‐ ‐ 0% ‐ ‐ ‐ ‐ ‐ ‐ 0% Other Minority ‐ ‐ 0% ‐ ‐ ‐ ‐ ‐ ‐ 0% ‐ ‐ ‐ ‐ ‐ ‐ 0%
Italian‐American ‐ ‐ 0% ‐ ‐ ‐ ‐ ‐ ‐ 0% ‐ ‐ ‐ ‐ ‐ ‐ 0%
White (Not Ital) (1) ‐ 0% ‐ ‐ ‐ ‐ ‐ (1) 100% (1) ‐ ‐ ‐ ‐ ‐ 0%
All White (1) ‐ 0% ‐ ‐ ‐ ‐ ‐ (1) 100% (1) ‐ ‐ ‐ ‐ ‐ 0%
Unknown ‐ ‐ 0% ‐ ‐ ‐ ‐ ‐ ‐ 0% ‐ ‐ ‐ ‐ ‐ ‐ 0%
Veterans ‐ ‐ 0% ‐ ‐ ‐ ‐ ‐ ‐ 0% ‐ ‐ ‐ ‐ ‐ ‐ 0% Individuals w/Disabilities ‐ ‐ 0% ‐ ‐ ‐ ‐ ‐ ‐ 0% ‐ ‐ ‐ ‐ ‐ ‐ 0%
NET SUBTRACTIONSLeft Group ‐ SEPARATION Left Group‐INTERNAL MOVE
TITLE CHANGES WITHIN GROUP
Job Group Summary
Facility Manager
FCLY‐MGR
NET ADDITIONS Joined Group ‐
HIRE Joined Group‐INTERNAL MOVE
Personnel Action Summary Page 5 of 26

Net Group Changes Addition #
Additions %
Hire (Outside CUNY and Other CUNY College)
Move from a Higher Group
Move from a Lower Group
Other Change of Group
Return to Faculty from
Other Title Sub. # Sub %
Separation (Left College or Left CUNY)
Move to Higher Group
Move to Lower Group
Other Change of Group
Return to Faculty Title
Title Change Within Group
Title Change %
Total 1 2 2 ‐ ‐ ‐ ‐ (1) (1) ‐ ‐ ‐ ‐ ‐
Male 1 2 100% 2 ‐ ‐ ‐ ‐ (1) 100% (1) ‐ ‐ ‐ ‐ ‐ 0% Female ‐ ‐ 0% ‐ ‐ ‐ ‐ ‐ ‐ 0% ‐ ‐ ‐ ‐ ‐ ‐ 0% Other/Unknown ‐ ‐ 0% ‐ ‐ ‐ ‐ ‐ ‐ 0% ‐ ‐ ‐ ‐ ‐ ‐ 0%
Total Min ‐ ‐ 0% ‐ ‐ ‐ ‐ ‐ ‐ 0% ‐ ‐ ‐ ‐ ‐ ‐ 0%
Asian ‐ ‐ 0% ‐ ‐ ‐ ‐ ‐ ‐ 0% ‐ ‐ ‐ ‐ ‐ ‐ 0% Black ‐ ‐ 0% ‐ ‐ ‐ ‐ ‐ ‐ 0% ‐ ‐ ‐ ‐ ‐ ‐ 0% Hispanic ‐ ‐ 0% ‐ ‐ ‐ ‐ ‐ ‐ 0% ‐ ‐ ‐ ‐ ‐ ‐ 0% Other Minority ‐ ‐ 0% ‐ ‐ ‐ ‐ ‐ ‐ 0% ‐ ‐ ‐ ‐ ‐ ‐ 0%
Italian‐American 1 1 50% 1 ‐ ‐ ‐ ‐ ‐ 0% ‐ ‐ ‐ ‐ ‐ ‐ 0%
White (Not Ital) ‐ 1 50% 1 ‐ ‐ ‐ ‐ (1) 100% (1) ‐ ‐ ‐ ‐ ‐ 0%
All White 1 2 100% 2 ‐ ‐ ‐ ‐ (1) 100% (1) ‐ ‐ ‐ ‐ ‐ 0%
Unknown ‐ ‐ 0% ‐ ‐ ‐ ‐ ‐ ‐ 0% ‐ ‐ ‐ ‐ ‐ ‐ 0%
Veterans ‐ ‐ 0% ‐ ‐ ‐ ‐ ‐ ‐ 0% ‐ ‐ ‐ ‐ ‐ ‐ 0% Individuals w/Disabilities ‐ ‐ 0% ‐ ‐ ‐ ‐ ‐ ‐ 0% ‐ ‐ ‐ ‐ ‐ ‐ 0%
NET SUBTRACTIONSLeft Group ‐ SEPARATION Left Group‐INTERNAL MOVE
TITLE CHANGES WITHIN GROUP
Job Group Summary
Security Manager
SEC‐MGR
NET ADDITIONS Joined Group ‐
HIRE Joined Group‐INTERNAL MOVE
Personnel Action Summary Page 6 of 26

Net Group Changes Addition #
Additions %
Hire (Outside CUNY and Other CUNY College)
Move from a Higher Group
Move from a Lower Group
Other Change of Group
Return to Faculty from
Other Title Sub. # Sub %
Separation (Left College or Left CUNY)
Move to Higher Group
Move to Lower Group
Other Change of Group
Return to Faculty Title
Title Change Within Group
Title Change %
Total 2 10 9 ‐ ‐ 1 ‐ (8) (8) ‐ ‐ ‐ ‐ ‐
Male 3 9 90% 9 ‐ ‐ ‐ ‐ (6) 75% (6) ‐ ‐ ‐ ‐ ‐ 0% Female (1) 1 10% ‐ ‐ ‐ 1 ‐ (2) 25% (2) ‐ ‐ ‐ ‐ ‐ 0% Other/Unknown ‐ ‐ 0% ‐ ‐ ‐ ‐ ‐ ‐ 0% ‐ ‐ ‐ ‐ ‐ ‐ 0%
Total Min 3 7 70% 6 ‐ ‐ 1 ‐ (4) 50% (4) ‐ ‐ ‐ ‐ ‐ 0%
Asian 4 5 50% 5 ‐ ‐ ‐ ‐ (1) 13% (1) ‐ ‐ ‐ ‐ ‐ 0% Black (2) ‐ 0% ‐ ‐ ‐ ‐ ‐ (2) 25% (2) ‐ ‐ ‐ ‐ ‐ 0% Hispanic 1 1 10% ‐ ‐ ‐ 1 ‐ ‐ 0% ‐ ‐ ‐ ‐ ‐ ‐ 0% Other Minority ‐ 1 10% 1 ‐ ‐ ‐ ‐ (1) 13% (1) ‐ ‐ ‐ ‐ ‐ 0%
Italian‐American ‐ ‐ 0% ‐ ‐ ‐ ‐ ‐ ‐ 0% ‐ ‐ ‐ ‐ ‐ ‐ 0%
White (Not Ital) (1) 3 30% 3 ‐ ‐ ‐ ‐ (4) 50% (4) ‐ ‐ ‐ ‐ ‐ 0%
All White (1) 3 30% 3 ‐ ‐ ‐ ‐ (4) 50% (4) ‐ ‐ ‐ ‐ ‐ 0%
Unknown ‐ ‐ 0% ‐ ‐ ‐ ‐ ‐ ‐ 0% ‐ ‐ ‐ ‐ ‐ ‐ 0%
Veterans ‐ ‐ 0% ‐ ‐ ‐ ‐ ‐ ‐ 0% ‐ ‐ ‐ ‐ ‐ ‐ 0% Individuals w/Disabilities ‐ ‐ 0% ‐ ‐ ‐ ‐ ‐ ‐ 0% ‐ ‐ ‐ ‐ ‐ ‐ 0%
NET SUBTRACTIONSLeft Group ‐ SEPARATION Left Group‐INTERNAL MOVE
TITLE CHANGES WITHIN GROUP
Job Group Summary
IT Manager
IT‐MGR
NET ADDITIONS Joined Group ‐
HIRE Joined Group‐INTERNAL MOVE
Personnel Action Summary Page 7 of 26

Net Group Changes Addition #
Additions %
Hire (Outside CUNY and Other CUNY College)
Move from a Higher Group
Move from a Lower Group
Other Change of Group
Return to Faculty from
Other Title Sub. # Sub %
Separation (Left College or Left CUNY)
Move to Higher Group
Move to Lower Group
Other Change of Group
Return to Faculty Title
Title Change Within Group
Title Change %
Total (11) ‐ ‐ ‐ ‐ ‐ ‐ (11) (11) ‐ ‐ ‐ ‐ ‐
Male (9) ‐ 0% ‐ ‐ ‐ ‐ ‐ (9) 82% (9) ‐ ‐ ‐ ‐ ‐ 0% Female (2) ‐ 0% ‐ ‐ ‐ ‐ ‐ (2) 18% (2) ‐ ‐ ‐ ‐ ‐ 0% Other/Unknown ‐ ‐ 0% ‐ ‐ ‐ ‐ ‐ ‐ 0% ‐ ‐ ‐ ‐ ‐ ‐ 0%
Total Min (4) ‐ 0% ‐ ‐ ‐ ‐ ‐ (4) 36% (4) ‐ ‐ ‐ ‐ ‐ 0%
Asian (4) ‐ 0% ‐ ‐ ‐ ‐ ‐ (4) 36% (4) ‐ ‐ ‐ ‐ ‐ 0% Black ‐ ‐ 0% ‐ ‐ ‐ ‐ ‐ ‐ 0% ‐ ‐ ‐ ‐ ‐ ‐ 0% Hispanic ‐ ‐ 0% ‐ ‐ ‐ ‐ ‐ ‐ 0% ‐ ‐ ‐ ‐ ‐ ‐ 0% Other Minority ‐ ‐ 0% ‐ ‐ ‐ ‐ ‐ ‐ 0% ‐ ‐ ‐ ‐ ‐ ‐ 0%
Italian‐American (1) ‐ 0% ‐ ‐ ‐ ‐ ‐ (1) 9% (1) ‐ ‐ ‐ ‐ ‐ 0%
White (Not Ital) (6) ‐ 0% ‐ ‐ ‐ ‐ ‐ (6) 55% (6) ‐ ‐ ‐ ‐ ‐ 0%
All White (7) ‐ 0% ‐ ‐ ‐ ‐ ‐ (7) 64% (7) ‐ ‐ ‐ ‐ ‐ 0%
Unknown ‐ ‐ 0% ‐ ‐ ‐ ‐ ‐ ‐ 0% ‐ ‐ ‐ ‐ ‐ ‐ 0%
Veterans ‐ ‐ 0% ‐ ‐ ‐ ‐ ‐ ‐ 0% ‐ ‐ ‐ ‐ ‐ ‐ 0%
Individuals w/Disabilities ‐ ‐ 0% ‐ ‐ ‐ ‐ ‐ ‐ 0% ‐ ‐ ‐ ‐ ‐ ‐ 0%
NET SUBTRACTIONSLeft Group ‐ SEPARATION Left Group‐INTERNAL MOVE
TITLE CHANGES WITHIN GROUP
Category Summary
Professional Faculty
Professional Faculty
NET ADDITIONS Joined Group ‐
HIRE Joined Group‐INTERNAL MOVE
Personnel Action Summary Page 8 of 26

Net Group Changes Addition #
Additions %
Hire (Outside CUNY and Other CUNY College)
Move from a Higher Group
Move from a Lower Group
Other Change of Group
Return to Faculty from
Other Title Sub. # Sub %
Separation (Left College or Left CUNY)
Move to Higher Group
Move to Lower Group
Other Change of Group
Return to Faculty Title
Title Change Within Group
Title Change %
Total (11) ‐ ‐ ‐ ‐ ‐ ‐ (11) (11) ‐ ‐ ‐ ‐ ‐
Male (9) ‐ 0% ‐ ‐ ‐ ‐ ‐ (9) 82% (9) ‐ ‐ ‐ ‐ ‐ 0% Female (2) ‐ 0% ‐ ‐ ‐ ‐ ‐ (2) 18% (2) ‐ ‐ ‐ ‐ ‐ 0% Other/Unknown ‐ ‐ 0% ‐ ‐ ‐ ‐ ‐ ‐ 0% ‐ ‐ ‐ ‐ ‐ ‐ 0%
Total Min (4) ‐ 0% ‐ ‐ ‐ ‐ ‐ (4) 36% (4) ‐ ‐ ‐ ‐ ‐ 0%
Asian (4) ‐ 0% ‐ ‐ ‐ ‐ ‐ (4) 36% (4) ‐ ‐ ‐ ‐ ‐ 0% Black ‐ ‐ 0% ‐ ‐ ‐ ‐ ‐ ‐ 0% ‐ ‐ ‐ ‐ ‐ ‐ 0% Hispanic ‐ ‐ 0% ‐ ‐ ‐ ‐ ‐ ‐ 0% ‐ ‐ ‐ ‐ ‐ ‐ 0% Other Minority ‐ ‐ 0% ‐ ‐ ‐ ‐ ‐ ‐ 0% ‐ ‐ ‐ ‐ ‐ ‐ 0%
Italian‐American (1) ‐ 0% ‐ ‐ ‐ ‐ ‐ (1) 9% (1) ‐ ‐ ‐ ‐ ‐ 0%
White (Not Ital) (6) ‐ 0% ‐ ‐ ‐ ‐ ‐ (6) 55% (6) ‐ ‐ ‐ ‐ ‐ 0%
All White (7) ‐ 0% ‐ ‐ ‐ ‐ ‐ (7) 64% (7) ‐ ‐ ‐ ‐ ‐ 0%
Unknown ‐ ‐ 0% ‐ ‐ ‐ ‐ ‐ ‐ 0% ‐ ‐ ‐ ‐ ‐ ‐ 0%
Veterans ‐ ‐ 0% ‐ ‐ ‐ ‐ ‐ ‐ 0% ‐ ‐ ‐ ‐ ‐ ‐ 0%
Individuals w/Disabilities ‐ ‐ 0% ‐ ‐ ‐ ‐ ‐ ‐ 0% ‐ ‐ ‐ ‐ ‐ ‐ 0%
NET SUBTRACTIONSLeft Group ‐ SEPARATION Left Group‐INTERNAL MOVE
TITLE CHANGES WITHIN GROUP
Job Group Summary
Faculty‐Professorial
FAC‐PROF
NET ADDITIONS Joined Group ‐
HIRE Joined Group‐INTERNAL MOVE
Personnel Action Summary Page 9 of 26

Net Group Changes Addition #
Additions %
Hire (Outside CUNY and Other CUNY College)
Move from a Higher Group
Move from a Lower Group
Other Change of Group
Return to Faculty from
Other Title Sub. # Sub %
Separation (Left College or Left CUNY)
Move to Higher Group
Move to Lower Group
Other Change of Group
Return to Faculty Title
Title Change Within Group
Title Change %
Total (10) 50 44 ‐ 5 1 ‐ (60) (49) (10) ‐ (1) ‐ 9
Male (11) 15 30% 13 ‐ 2 ‐ ‐ (26) 43% (23) (3) ‐ ‐ ‐ 5 56% Female 1 35 70% 31 ‐ 3 1 ‐ (34) 57% (26) (7) ‐ (1) ‐ 4 44% Other/Unknown ‐ ‐ 0% ‐ ‐ ‐ ‐ ‐ ‐ 0% ‐ ‐ ‐ ‐ ‐ ‐ 0%
Total Min 2 40 80% 36 ‐ 3 1 ‐ (38) 63% (33) (4) ‐ (1) ‐ 5 56%
Asian (2) 10 20% 8 ‐ 1 1 ‐ (12) 20% (10) (1) ‐ (1) ‐ 2 22% Black 2 14 28% 14 ‐ ‐ ‐ ‐ (12) 20% (10) (2) ‐ ‐ ‐ 3 33% Hispanic 2 15 30% 13 ‐ 2 ‐ ‐ (13) 22% (12) (1) ‐ ‐ ‐ ‐ 0% Other Minority ‐ 1 2% 1 ‐ ‐ ‐ ‐ (1) 2% (1) ‐ ‐ ‐ ‐ ‐ 0%
Italian‐American (5) 2 4% 1 ‐ 1 ‐ ‐ (7) 12% (4) (3) ‐ ‐ ‐ 1 11%
White (Not Ital) (7) 8 16% 7 ‐ 1 ‐ ‐ (15) 25% (12) (3) ‐ ‐ ‐ 3 33%
All White (12) 10 20% 8 ‐ 2 ‐ ‐ (22) 37% (16) (6) ‐ ‐ ‐ 4 44%
Unknown ‐ ‐ 0% ‐ ‐ ‐ ‐ ‐ ‐ 0% ‐ ‐ ‐ ‐ ‐ ‐ 0%
Veterans ‐ ‐ 0% ‐ ‐ ‐ ‐ ‐ ‐ 0% ‐ ‐ ‐ ‐ ‐ ‐ 0%
Individuals w/Disabilities (3) 1 2% ‐ ‐ 1 ‐ ‐ (4) 7% (2) (2) ‐ ‐ ‐ ‐ 0%
NET SUBTRACTIONSLeft Group ‐ SEPARATION Left Group‐INTERNAL MOVE
TITLE CHANGES WITHIN GROUP
Category Summary
Professional Non‐Faculty
Professional Non‐Faculty
NET ADDITIONS Joined Group ‐
HIRE Joined Group‐INTERNAL MOVE
Personnel Action Summary Page 10 of 26

Net Group Changes Addition #
Additions %
Hire (Outside CUNY and Other CUNY College)
Move from a Higher Group
Move from a Lower Group
Other Change of Group
Return to Faculty from
Other Title Sub. # Sub %
Separation (Left College or Left CUNY)
Move to Higher Group
Move to Lower Group
Other Change of Group
Return to Faculty Title
Title Change Within Group
Title Change %
Total (1) ‐ ‐ ‐ ‐ ‐ ‐ (1) ‐ (1) ‐ ‐ ‐ ‐
Male ‐ ‐ 0% ‐ ‐ ‐ ‐ ‐ ‐ 0% ‐ ‐ ‐ ‐ ‐ ‐ 0% Female (1) ‐ 0% ‐ ‐ ‐ ‐ ‐ (1) 100% ‐ (1) ‐ ‐ ‐ ‐ 0% Other/Unknown ‐ ‐ 0% ‐ ‐ ‐ ‐ ‐ ‐ 0% ‐ ‐ ‐ ‐ ‐ ‐ 0%
Total Min (1) ‐ 0% ‐ ‐ ‐ ‐ ‐ (1) 100% ‐ (1) ‐ ‐ ‐ ‐ 0%
Asian ‐ ‐ 0% ‐ ‐ ‐ ‐ ‐ ‐ 0% ‐ ‐ ‐ ‐ ‐ ‐ 0% Black ‐ ‐ 0% ‐ ‐ ‐ ‐ ‐ ‐ 0% ‐ ‐ ‐ ‐ ‐ ‐ 0% Hispanic (1) ‐ 0% ‐ ‐ ‐ ‐ ‐ (1) 100% ‐ (1) ‐ ‐ ‐ ‐ 0% Other Minority ‐ ‐ 0% ‐ ‐ ‐ ‐ ‐ ‐ 0% ‐ ‐ ‐ ‐ ‐ ‐ 0%
Italian‐American ‐ ‐ 0% ‐ ‐ ‐ ‐ ‐ ‐ 0% ‐ ‐ ‐ ‐ ‐ ‐ 0%
White (Not Ital) ‐ ‐ 0% ‐ ‐ ‐ ‐ ‐ ‐ 0% ‐ ‐ ‐ ‐ ‐ ‐ 0%
All White ‐ ‐ 0% ‐ ‐ ‐ ‐ ‐ ‐ 0% ‐ ‐ ‐ ‐ ‐ ‐ 0%
Unknown ‐ ‐ 0% ‐ ‐ ‐ ‐ ‐ ‐ 0% ‐ ‐ ‐ ‐ ‐ ‐ 0%
Veterans ‐ ‐ 0% ‐ ‐ ‐ ‐ ‐ ‐ 0% ‐ ‐ ‐ ‐ ‐ ‐ 0%
Individuals w/Disabilities (1) ‐ 0% ‐ ‐ ‐ ‐ ‐ (1) 100% ‐ (1) ‐ ‐ ‐ ‐ 0%
NET SUBTRACTIONSLeft Group ‐ SEPARATION Left Group‐INTERNAL MOVE
TITLE CHANGES WITHIN GROUP
Job Group Summary
Accountant
ACCT‐PRFL
NET ADDITIONS Joined Group ‐
HIRE Joined Group‐INTERNAL MOVE
Personnel Action Summary Page 11 of 26

Net Group Changes Addition #
Additions %
Hire (Outside CUNY and Other CUNY College)
Move from a Higher Group
Move from a Lower Group
Other Change of Group
Return to Faculty from
Other Title Sub. # Sub %
Separation (Left College or Left CUNY)
Move to Higher Group
Move to Lower Group
Other Change of Group
Return to Faculty Title
Title Change Within Group
Title Change %
Total (6) 43 40 ‐ 3 ‐ ‐ (49) (39) (9) ‐ (1) ‐ 5
Male (9) 10 23% 10 ‐ ‐ ‐ ‐ (19) 39% (16) (3) ‐ ‐ ‐ 1 20% Female 3 33 77% 30 ‐ 3 ‐ ‐ (30) 61% (23) (6) ‐ (1) ‐ 4 80% Other/Unknown ‐ ‐ 0% ‐ ‐ ‐ ‐ ‐ ‐ 0% ‐ ‐ ‐ ‐ ‐ ‐ 0%
Total Min 5 35 81% 33 ‐ 2 ‐ ‐ (30) 61% (26) (3) ‐ (1) ‐ 3 60%
Asian ‐ 9 21% 8 ‐ 1 ‐ ‐ (9) 18% (7) (1) ‐ (1) ‐ 1 20% Black 4 14 33% 14 ‐ ‐ ‐ ‐ (10) 20% (8) (2) ‐ ‐ ‐ 2 40% Hispanic 2 12 28% 11 ‐ 1 ‐ ‐ (10) 20% (10) ‐ ‐ ‐ ‐ ‐ 0% Other Minority (1) ‐ 0% ‐ ‐ ‐ ‐ ‐ (1) 2% (1) ‐ ‐ ‐ ‐ ‐ 0%
Italian‐American (5) 1 2% 1 ‐ ‐ ‐ ‐ (6) 12% (3) (3) ‐ ‐ ‐ 1 20%
White (Not Ital) (6) 7 16% 6 ‐ 1 ‐ ‐ (13) 27% (10) (3) ‐ ‐ ‐ 1 20%
All White (11) 8 19% 7 ‐ 1 ‐ ‐ (19) 39% (13) (6) ‐ ‐ ‐ 2 40%
Unknown ‐ ‐ 0% ‐ ‐ ‐ ‐ ‐ ‐ 0% ‐ ‐ ‐ ‐ ‐ ‐ 0%
Veterans ‐ ‐ 0% ‐ ‐ ‐ ‐ ‐ ‐ 0% ‐ ‐ ‐ ‐ ‐ ‐ 0%
Individuals w/Disabilities (2) 1 2% ‐ ‐ 1 ‐ ‐ (3) 6% (2) (1) ‐ ‐ ‐ ‐ 0%
NET SUBTRACTIONSLeft Group ‐ SEPARATION Left Group‐INTERNAL MOVE
TITLE CHANGES WITHIN GROUP
Job Group Summary
Administration 3 (Professional)
ADMIN3
NET ADDITIONS Joined Group ‐
HIRE Joined Group‐INTERNAL MOVE
Personnel Action Summary Page 12 of 26

Net Group Changes Addition #
Additions %
Hire (Outside CUNY and Other CUNY College)
Move from a Higher Group
Move from a Lower Group
Other Change of Group
Return to Faculty from
Other Title Sub. # Sub %
Separation (Left College or Left CUNY)
Move to Higher Group
Move to Lower Group
Other Change of Group
Return to Faculty Title
Title Change Within Group
Title Change %
Total (3) 7 4 ‐ 2 1 ‐ (10) (10) ‐ ‐ ‐ ‐ 4
Male (2) 5 71% 3 ‐ 2 ‐ ‐ (7) 70% (7) ‐ ‐ ‐ ‐ 4 100% Female (1) 2 29% 1 ‐ ‐ 1 ‐ (3) 30% (3) ‐ ‐ ‐ ‐ ‐ 0% Other/Unknown ‐ ‐ 0% ‐ ‐ ‐ ‐ ‐ ‐ 0% ‐ ‐ ‐ ‐ ‐ ‐ 0%
Total Min (2) 5 71% 3 ‐ 1 1 ‐ (7) 70% (7) ‐ ‐ ‐ ‐ 2 50%
Asian (2) 1 14% ‐ ‐ ‐ 1 ‐ (3) 30% (3) ‐ ‐ ‐ ‐ 1 25% Black (2) ‐ 0% ‐ ‐ ‐ ‐ ‐ (2) 20% (2) ‐ ‐ ‐ ‐ 1 25% Hispanic 1 3 43% 2 ‐ 1 ‐ ‐ (2) 20% (2) ‐ ‐ ‐ ‐ ‐ 0% Other Minority 1 1 14% 1 ‐ ‐ ‐ ‐ ‐ 0% ‐ ‐ ‐ ‐ ‐ ‐ 0%
Italian‐American ‐ 1 14% ‐ ‐ 1 ‐ ‐ (1) 10% (1) ‐ ‐ ‐ ‐ ‐ 0%
White (Not Ital) (1) 1 14% 1 ‐ ‐ ‐ ‐ (2) 20% (2) ‐ ‐ ‐ ‐ 2 50%
All White (1) 2 29% 1 ‐ 1 ‐ ‐ (3) 30% (3) ‐ ‐ ‐ ‐ 2 50%
Unknown ‐ ‐ 0% ‐ ‐ ‐ ‐ ‐ ‐ 0% ‐ ‐ ‐ ‐ ‐ ‐ 0%
Veterans ‐ ‐ 0% ‐ ‐ ‐ ‐ ‐ ‐ 0% ‐ ‐ ‐ ‐ ‐ ‐ 0%
Individuals w/Disabilities ‐ ‐ 0% ‐ ‐ ‐ ‐ ‐ ‐ 0% ‐ ‐ ‐ ‐ ‐ ‐ 0%
NET SUBTRACTIONSLeft Group ‐ SEPARATION Left Group‐INTERNAL MOVE
TITLE CHANGES WITHIN GROUP
Job Group Summary
IT Computer Professional
IT‐PRFL
NET ADDITIONS Joined Group ‐
HIRE Joined Group‐INTERNAL MOVE
Personnel Action Summary Page 13 of 26

Net Group Changes Addition #
Additions %
Hire (Outside CUNY and Other CUNY College)
Move from a Higher Group
Move from a Lower Group
Other Change of Group
Return to Faculty from
Other Title Sub. # Sub %
Separation (Left College or Left CUNY)
Move to Higher Group
Move to Lower Group
Other Change of Group
Return to Faculty Title
Title Change Within Group
Title Change %
Total (7) 2 2 ‐ ‐ ‐ ‐ (9) (7) (2) ‐ ‐ ‐ ‐
Male (3) 1 50% 1 ‐ ‐ ‐ ‐ (4) 44% (4) ‐ ‐ ‐ ‐ ‐ 0% Female (4) 1 50% 1 ‐ ‐ ‐ ‐ (5) 56% (3) (2) ‐ ‐ ‐ ‐ 0% Other/Unknown ‐ ‐ 0% ‐ ‐ ‐ ‐ ‐ ‐ 0% ‐ ‐ ‐ ‐ ‐ ‐ 0%
Total Min (1) 2 100% 2 ‐ ‐ ‐ ‐ (3) 33% (2) (1) ‐ ‐ ‐ ‐ 0%
Asian ‐ 1 50% 1 ‐ ‐ ‐ ‐ (1) 11% ‐ (1) ‐ ‐ ‐ ‐ 0% Black ‐ 1 50% 1 ‐ ‐ ‐ ‐ (1) 11% (1) ‐ ‐ ‐ ‐ ‐ 0% Hispanic (1) ‐ 0% ‐ ‐ ‐ ‐ ‐ (1) 11% (1) ‐ ‐ ‐ ‐ ‐ 0% Other Minority ‐ ‐ 0% ‐ ‐ ‐ ‐ ‐ ‐ 0% ‐ ‐ ‐ ‐ ‐ ‐ 0%
Italian‐American (2) ‐ 0% ‐ ‐ ‐ ‐ ‐ (2) 22% (2) ‐ ‐ ‐ ‐ ‐ 0%
White (Not Ital) (4) ‐ 0% ‐ ‐ ‐ ‐ ‐ (4) 44% (3) (1) ‐ ‐ ‐ ‐ 0%
All White (6) ‐ 0% ‐ ‐ ‐ ‐ ‐ (6) 67% (5) (1) ‐ ‐ ‐ ‐ 0%
Unknown ‐ ‐ 0% ‐ ‐ ‐ ‐ ‐ ‐ 0% ‐ ‐ ‐ ‐ ‐ ‐ 0%
Veterans ‐ ‐ 0% ‐ ‐ ‐ ‐ ‐ ‐ 0% ‐ ‐ ‐ ‐ ‐ ‐ 0%
Individuals w/Disabilities ‐ ‐ 0% ‐ ‐ ‐ ‐ ‐ ‐ 0% ‐ ‐ ‐ ‐ ‐ ‐ 0%
NET SUBTRACTIONSLeft Group ‐ SEPARATION Left Group‐INTERNAL MOVE
TITLE CHANGES WITHIN GROUP
Category Summary
Administrative Support Workers
Administrative Support Workers
NET ADDITIONS Joined Group ‐
HIRE Joined Group‐INTERNAL MOVE
Personnel Action Summary Page 14 of 26

Net Group Changes Addition #
Additions %
Hire (Outside CUNY and Other CUNY College)
Move from a Higher Group
Move from a Lower Group
Other Change of Group
Return to Faculty from
Other Title Sub. # Sub %
Separation (Left College or Left CUNY)
Move to Higher Group
Move to Lower Group
Other Change of Group
Return to Faculty Title
Title Change Within Group
Title Change %
Total 1 1 1 ‐ ‐ ‐ ‐ ‐ ‐ ‐ ‐ ‐ ‐ ‐
Male ‐ ‐ 0% ‐ ‐ ‐ ‐ ‐ ‐ 0% ‐ ‐ ‐ ‐ ‐ ‐ 0% Female 1 1 100% 1 ‐ ‐ ‐ ‐ ‐ 0% ‐ ‐ ‐ ‐ ‐ ‐ 0% Other/Unknown ‐ ‐ 0% ‐ ‐ ‐ ‐ ‐ ‐ 0% ‐ ‐ ‐ ‐ ‐ ‐ 0%
Total Min 1 1 100% 1 ‐ ‐ ‐ ‐ ‐ 0% ‐ ‐ ‐ ‐ ‐ ‐ 0%
Asian 1 1 100% 1 ‐ ‐ ‐ ‐ ‐ 0% ‐ ‐ ‐ ‐ ‐ ‐ 0% Black ‐ ‐ 0% ‐ ‐ ‐ ‐ ‐ ‐ 0% ‐ ‐ ‐ ‐ ‐ ‐ 0% Hispanic ‐ ‐ 0% ‐ ‐ ‐ ‐ ‐ ‐ 0% ‐ ‐ ‐ ‐ ‐ ‐ 0% Other Minority ‐ ‐ 0% ‐ ‐ ‐ ‐ ‐ ‐ 0% ‐ ‐ ‐ ‐ ‐ ‐ 0%
Italian‐American ‐ ‐ 0% ‐ ‐ ‐ ‐ ‐ ‐ 0% ‐ ‐ ‐ ‐ ‐ ‐ 0%
White (Not Ital) ‐ ‐ 0% ‐ ‐ ‐ ‐ ‐ ‐ 0% ‐ ‐ ‐ ‐ ‐ ‐ 0%
All White ‐ ‐ 0% ‐ ‐ ‐ ‐ ‐ ‐ 0% ‐ ‐ ‐ ‐ ‐ ‐ 0%
Unknown ‐ ‐ 0% ‐ ‐ ‐ ‐ ‐ ‐ 0% ‐ ‐ ‐ ‐ ‐ ‐ 0%
Veterans ‐ ‐ 0% ‐ ‐ ‐ ‐ ‐ ‐ 0% ‐ ‐ ‐ ‐ ‐ ‐ 0%
Individuals w/Disabilities ‐ ‐ 0% ‐ ‐ ‐ ‐ ‐ ‐ 0% ‐ ‐ ‐ ‐ ‐ ‐ 0%
NET SUBTRACTIONSLeft Group ‐ SEPARATION Left Group‐INTERNAL MOVE
TITLE CHANGES WITHIN GROUP
Job Group Summary
Accountant Assistant
ACCT‐TECH
NET ADDITIONS Joined Group ‐
HIRE Joined Group‐INTERNAL MOVE
Personnel Action Summary Page 15 of 26

Net Group Changes Addition #
Additions %
Hire (Outside CUNY and Other CUNY College)
Move from a Higher Group
Move from a Lower Group
Other Change of Group
Return to Faculty from
Other Title Sub. # Sub %
Separation (Left College or Left CUNY)
Move to Higher Group
Move to Lower Group
Other Change of Group
Return to Faculty Title
Title Change Within Group
Title Change %
Total (4) ‐ ‐ ‐ ‐ ‐ ‐ (4) (3) (1) ‐ ‐ ‐ ‐
Male (1) ‐ 0% ‐ ‐ ‐ ‐ ‐ (1) 25% (1) ‐ ‐ ‐ ‐ ‐ 0% Female (3) ‐ 0% ‐ ‐ ‐ ‐ ‐ (3) 75% (2) (1) ‐ ‐ ‐ ‐ 0% Other/Unknown ‐ ‐ 0% ‐ ‐ ‐ ‐ ‐ ‐ 0% ‐ ‐ ‐ ‐ ‐ ‐ 0%
Total Min (1) ‐ 0% ‐ ‐ ‐ ‐ ‐ (1) 25% (1) ‐ ‐ ‐ ‐ ‐ 0%
Asian ‐ ‐ 0% ‐ ‐ ‐ ‐ ‐ ‐ 0% ‐ ‐ ‐ ‐ ‐ ‐ 0% Black (1) ‐ 0% ‐ ‐ ‐ ‐ ‐ (1) 25% (1) ‐ ‐ ‐ ‐ ‐ 0% Hispanic ‐ ‐ 0% ‐ ‐ ‐ ‐ ‐ ‐ 0% ‐ ‐ ‐ ‐ ‐ ‐ 0% Other Minority ‐ ‐ 0% ‐ ‐ ‐ ‐ ‐ ‐ 0% ‐ ‐ ‐ ‐ ‐ ‐ 0%
Italian‐American (2) ‐ 0% ‐ ‐ ‐ ‐ ‐ (2) 50% (2) ‐ ‐ ‐ ‐ ‐ 0%
White (Not Ital) (1) ‐ 0% ‐ ‐ ‐ ‐ ‐ (1) 25% ‐ (1) ‐ ‐ ‐ ‐ 0%
All White (3) ‐ 0% ‐ ‐ ‐ ‐ ‐ (3) 75% (2) (1) ‐ ‐ ‐ ‐ 0%
Unknown ‐ ‐ 0% ‐ ‐ ‐ ‐ ‐ ‐ 0% ‐ ‐ ‐ ‐ ‐ ‐ 0%
Veterans ‐ ‐ 0% ‐ ‐ ‐ ‐ ‐ ‐ 0% ‐ ‐ ‐ ‐ ‐ ‐ 0%
Individuals w/Disabilities ‐ ‐ 0% ‐ ‐ ‐ ‐ ‐ ‐ 0% ‐ ‐ ‐ ‐ ‐ ‐ 0%
NET SUBTRACTIONSLeft Group ‐ SEPARATION Left Group‐INTERNAL MOVE
TITLE CHANGES WITHIN GROUP
Job Group Summary
CUNY Office Assistant
COA
NET ADDITIONS Joined Group ‐
HIRE Joined Group‐INTERNAL MOVE
Personnel Action Summary Page 16 of 26

Net Group Changes Addition #
Additions %
Hire (Outside CUNY and Other CUNY College)
Move from a Higher Group
Move from a Lower Group
Other Change of Group
Return to Faculty from
Other Title Sub. # Sub %
Separation (Left College or Left CUNY)
Move to Higher Group
Move to Lower Group
Other Change of Group
Return to Faculty Title
Title Change Within Group
Title Change %
Total (2) ‐ ‐ ‐ ‐ ‐ ‐ (2) (1) (1) ‐ ‐ ‐ ‐
Male ‐ ‐ 0% ‐ ‐ ‐ ‐ ‐ ‐ 0% ‐ ‐ ‐ ‐ ‐ ‐ 0% Female (2) ‐ 0% ‐ ‐ ‐ ‐ ‐ (2) 100% (1) (1) ‐ ‐ ‐ ‐ 0% Other/Unknown ‐ ‐ 0% ‐ ‐ ‐ ‐ ‐ ‐ 0% ‐ ‐ ‐ ‐ ‐ ‐ 0%
Total Min (1) ‐ 0% ‐ ‐ ‐ ‐ ‐ (1) 50% ‐ (1) ‐ ‐ ‐ ‐ 0%
Asian (1) ‐ 0% ‐ ‐ ‐ ‐ ‐ (1) 50% ‐ (1) ‐ ‐ ‐ ‐ 0% Black ‐ ‐ 0% ‐ ‐ ‐ ‐ ‐ ‐ 0% ‐ ‐ ‐ ‐ ‐ ‐ 0% Hispanic ‐ ‐ 0% ‐ ‐ ‐ ‐ ‐ ‐ 0% ‐ ‐ ‐ ‐ ‐ ‐ 0% Other Minority ‐ ‐ 0% ‐ ‐ ‐ ‐ ‐ ‐ 0% ‐ ‐ ‐ ‐ ‐ ‐ 0%
Italian‐American ‐ ‐ 0% ‐ ‐ ‐ ‐ ‐ ‐ 0% ‐ ‐ ‐ ‐ ‐ ‐ 0%
White (Not Ital) (1) ‐ 0% ‐ ‐ ‐ ‐ ‐ (1) 50% (1) ‐ ‐ ‐ ‐ ‐ 0%
All White (1) ‐ 0% ‐ ‐ ‐ ‐ ‐ (1) 50% (1) ‐ ‐ ‐ ‐ ‐ 0%
Unknown ‐ ‐ 0% ‐ ‐ ‐ ‐ ‐ ‐ 0% ‐ ‐ ‐ ‐ ‐ ‐ 0%
Veterans ‐ ‐ 0% ‐ ‐ ‐ ‐ ‐ ‐ 0% ‐ ‐ ‐ ‐ ‐ ‐ 0%
Individuals w/Disabilities ‐ ‐ 0% ‐ ‐ ‐ ‐ ‐ ‐ 0% ‐ ‐ ‐ ‐ ‐ ‐ 0%
NET SUBTRACTIONSLeft Group ‐ SEPARATION Left Group‐INTERNAL MOVE
TITLE CHANGES WITHIN GROUP
Job Group Summary
CUNY Admin Assistant
CAA
NET ADDITIONS Joined Group ‐
HIRE Joined Group‐INTERNAL MOVE
Personnel Action Summary Page 17 of 26

Net Group Changes Addition #
Additions %
Hire (Outside CUNY and Other CUNY College)
Move from a Higher Group
Move from a Lower Group
Other Change of Group
Return to Faculty from
Other Title Sub. # Sub %
Separation (Left College or Left CUNY)
Move to Higher Group
Move to Lower Group
Other Change of Group
Return to Faculty Title
Title Change Within Group
Title Change %
Total (2) 1 1 ‐ ‐ ‐ ‐ (3) (3) ‐ ‐ ‐ ‐ ‐
Male (2) 1 100% 1 ‐ ‐ ‐ ‐ (3) 100% (3) ‐ ‐ ‐ ‐ ‐ 0% Female ‐ ‐ 0% ‐ ‐ ‐ ‐ ‐ ‐ 0% ‐ ‐ ‐ ‐ ‐ ‐ 0% Other/Unknown ‐ ‐ 0% ‐ ‐ ‐ ‐ ‐ ‐ 0% ‐ ‐ ‐ ‐ ‐ ‐ 0%
Total Min ‐ 1 100% 1 ‐ ‐ ‐ ‐ (1) 33% (1) ‐ ‐ ‐ ‐ ‐ 0%
Asian ‐ ‐ 0% ‐ ‐ ‐ ‐ ‐ ‐ 0% ‐ ‐ ‐ ‐ ‐ ‐ 0% Black 1 1 100% 1 ‐ ‐ ‐ ‐ ‐ 0% ‐ ‐ ‐ ‐ ‐ ‐ 0% Hispanic (1) ‐ 0% ‐ ‐ ‐ ‐ ‐ (1) 33% (1) ‐ ‐ ‐ ‐ ‐ 0% Other Minority ‐ ‐ 0% ‐ ‐ ‐ ‐ ‐ ‐ 0% ‐ ‐ ‐ ‐ ‐ ‐ 0%
Italian‐American ‐ ‐ 0% ‐ ‐ ‐ ‐ ‐ ‐ 0% ‐ ‐ ‐ ‐ ‐ ‐ 0%
White (Not Ital) (2) ‐ 0% ‐ ‐ ‐ ‐ ‐ (2) 67% (2) ‐ ‐ ‐ ‐ ‐ 0%
All White (2) ‐ 0% ‐ ‐ ‐ ‐ ‐ (2) 67% (2) ‐ ‐ ‐ ‐ ‐ 0%
Unknown ‐ ‐ 0% ‐ ‐ ‐ ‐ ‐ ‐ 0% ‐ ‐ ‐ ‐ ‐ ‐ 0%
Veterans ‐ ‐ 0% ‐ ‐ ‐ ‐ ‐ ‐ 0% ‐ ‐ ‐ ‐ ‐ ‐ 0%
Individuals w/Disabilities ‐ ‐ 0% ‐ ‐ ‐ ‐ ‐ ‐ 0% ‐ ‐ ‐ ‐ ‐ ‐ 0%
NET SUBTRACTIONSLeft Group ‐ SEPARATION Left Group‐INTERNAL MOVE
TITLE CHANGES WITHIN GROUP
Job Group Summary
Mail Services Worker
MMSW
NET ADDITIONS Joined Group ‐
HIRE Joined Group‐INTERNAL MOVE
Personnel Action Summary Page 18 of 26

Net Group Changes Addition #
Additions %
Hire (Outside CUNY and Other CUNY College)
Move from a Higher Group
Move from a Lower Group
Other Change of Group
Return to Faculty from
Other Title Sub. # Sub %
Separation (Left College or Left CUNY)
Move to Higher Group
Move to Lower Group
Other Change of Group
Return to Faculty Title
Title Change Within Group
Title Change %
Total ‐ ‐ ‐ ‐ ‐ ‐ ‐ ‐ ‐ ‐ ‐ ‐ ‐ ‐
Male ‐ ‐ 0% ‐ ‐ ‐ ‐ ‐ ‐ 0% ‐ ‐ ‐ ‐ ‐ ‐ 0% Female ‐ ‐ 0% ‐ ‐ ‐ ‐ ‐ ‐ 0% ‐ ‐ ‐ ‐ ‐ ‐ 0% Other/Unknown ‐ ‐ 0% ‐ ‐ ‐ ‐ ‐ ‐ 0% ‐ ‐ ‐ ‐ ‐ ‐ 0%
Total Min ‐ ‐ 0% ‐ ‐ ‐ ‐ ‐ ‐ 0% ‐ ‐ ‐ ‐ ‐ ‐ 0%
Asian ‐ ‐ 0% ‐ ‐ ‐ ‐ ‐ ‐ 0% ‐ ‐ ‐ ‐ ‐ ‐ 0% Black ‐ ‐ 0% ‐ ‐ ‐ ‐ ‐ ‐ 0% ‐ ‐ ‐ ‐ ‐ ‐ 0% Hispanic ‐ ‐ 0% ‐ ‐ ‐ ‐ ‐ ‐ 0% ‐ ‐ ‐ ‐ ‐ ‐ 0% Other Minority ‐ ‐ 0% ‐ ‐ ‐ ‐ ‐ ‐ 0% ‐ ‐ ‐ ‐ ‐ ‐ 0%
Italian‐American ‐ ‐ 0% ‐ ‐ ‐ ‐ ‐ ‐ 0% ‐ ‐ ‐ ‐ ‐ ‐ 0%
White (Not Ital) ‐ ‐ 0% ‐ ‐ ‐ ‐ ‐ ‐ 0% ‐ ‐ ‐ ‐ ‐ ‐ 0%
All White ‐ ‐ 0% ‐ ‐ ‐ ‐ ‐ ‐ 0% ‐ ‐ ‐ ‐ ‐ ‐ 0%
Unknown ‐ ‐ 0% ‐ ‐ ‐ ‐ ‐ ‐ 0% ‐ ‐ ‐ ‐ ‐ ‐ 0%
Veterans ‐ ‐ 0% ‐ ‐ ‐ ‐ ‐ ‐ 0% ‐ ‐ ‐ ‐ ‐ ‐ 0%
Individuals w/Disabilities ‐ ‐ 0% ‐ ‐ ‐ ‐ ‐ ‐ 0% ‐ ‐ ‐ ‐ ‐ ‐ 0%
Note: no actions were reported for any group in this category.
NET SUBTRACTIONSLeft Group ‐ SEPARATION Left Group‐INTERNAL MOVE
TITLE CHANGES WITHIN GROUP
Category Summary
Craft Workers
Craft Workers
NET ADDITIONS Joined Group ‐
HIRE Joined Group‐INTERNAL MOVE
Personnel Action Summary Page 19 of 26

Net Group Changes Addition #
Additions %
Hire (Outside CUNY and Other CUNY College)
Move from a Higher Group
Move from a Lower Group
Other Change of Group
Return to Faculty from
Other Title Sub. # Sub %
Separation (Left College or Left CUNY)
Move to Higher Group
Move to Lower Group
Other Change of Group
Return to Faculty Title
Title Change Within Group
Title Change %
Total (8) 1 1 ‐ ‐ ‐ ‐ (9) (5) (4) ‐ ‐ ‐ ‐
Male (5) 1 100% 1 ‐ ‐ ‐ ‐ (6) 67% (3) (3) ‐ ‐ ‐ ‐ 0% Female (3) ‐ 0% ‐ ‐ ‐ ‐ ‐ (3) 33% (2) (1) ‐ ‐ ‐ ‐ 0% Other/Unknown ‐ ‐ 0% ‐ ‐ ‐ ‐ ‐ ‐ 0% ‐ ‐ ‐ ‐ ‐ ‐ 0%
Total Min (4) ‐ 0% ‐ ‐ ‐ ‐ ‐ (4) 44% (3) (1) ‐ ‐ ‐ ‐ 0%
Asian (1) ‐ 0% ‐ ‐ ‐ ‐ ‐ (1) 11% (1) ‐ ‐ ‐ ‐ ‐ 0% Black (2) ‐ 0% ‐ ‐ ‐ ‐ ‐ (2) 22% (2) ‐ ‐ ‐ ‐ ‐ 0% Hispanic (1) ‐ 0% ‐ ‐ ‐ ‐ ‐ (1) 11% ‐ (1) ‐ ‐ ‐ ‐ 0% Other Minority ‐ ‐ 0% ‐ ‐ ‐ ‐ ‐ ‐ 0% ‐ ‐ ‐ ‐ ‐ ‐ 0%
Italian‐American (1) ‐ 0% ‐ ‐ ‐ ‐ ‐ (1) 11% ‐ (1) ‐ ‐ ‐ ‐ 0%
White (Not Ital) (3) 1 100% 1 ‐ ‐ ‐ ‐ (4) 44% (2) (2) ‐ ‐ ‐ ‐ 0%
All White (4) 1 100% 1 ‐ ‐ ‐ ‐ (5) 56% (2) (3) ‐ ‐ ‐ ‐ 0%
Unknown ‐ ‐ 0% ‐ ‐ ‐ ‐ ‐ ‐ 0% ‐ ‐ ‐ ‐ ‐ ‐ 0%
Veterans ‐ ‐ 0% ‐ ‐ ‐ ‐ ‐ ‐ 0% ‐ ‐ ‐ ‐ ‐ ‐ 0%
Individuals w/Disabilities ‐ ‐ 0% ‐ ‐ ‐ ‐ ‐ ‐ 0% ‐ ‐ ‐ ‐ ‐ ‐ 0%
NET SUBTRACTIONSLeft Group ‐ SEPARATION Left Group‐INTERNAL MOVE
TITLE CHANGES WITHIN GROUP
Category Summary
Technicians
Technicians
NET ADDITIONS Joined Group ‐
HIRE Joined Group‐INTERNAL MOVE
Personnel Action Summary Page 20 of 26

Net Group Changes Addition #
Additions %
Hire (Outside CUNY and Other CUNY College)
Move from a Higher Group
Move from a Lower Group
Other Change of Group
Return to Faculty from
Other Title Sub. # Sub %
Separation (Left College or Left CUNY)
Move to Higher Group
Move to Lower Group
Other Change of Group
Return to Faculty Title
Title Change Within Group
Title Change %
Total (3) 1 1 ‐ ‐ ‐ ‐ (4) (3) (1) ‐ ‐ ‐ ‐
Male ‐ 1 100% 1 ‐ ‐ ‐ ‐ (1) 25% (1) ‐ ‐ ‐ ‐ ‐ 0% Female (3) ‐ 0% ‐ ‐ ‐ ‐ ‐ (3) 75% (2) (1) ‐ ‐ ‐ ‐ 0% Other/Unknown ‐ ‐ 0% ‐ ‐ ‐ ‐ ‐ ‐ 0% ‐ ‐ ‐ ‐ ‐ ‐ 0%
Total Min (1) ‐ 0% ‐ ‐ ‐ ‐ ‐ (1) 25% (1) ‐ ‐ ‐ ‐ ‐ 0%
Asian (1) ‐ 0% ‐ ‐ ‐ ‐ ‐ (1) 25% (1) ‐ ‐ ‐ ‐ ‐ 0% Black ‐ ‐ 0% ‐ ‐ ‐ ‐ ‐ ‐ 0% ‐ ‐ ‐ ‐ ‐ ‐ 0% Hispanic ‐ ‐ 0% ‐ ‐ ‐ ‐ ‐ ‐ 0% ‐ ‐ ‐ ‐ ‐ ‐ 0% Other Minority ‐ ‐ 0% ‐ ‐ ‐ ‐ ‐ ‐ 0% ‐ ‐ ‐ ‐ ‐ ‐ 0%
Italian‐American ‐ ‐ 0% ‐ ‐ ‐ ‐ ‐ ‐ 0% ‐ ‐ ‐ ‐ ‐ ‐ 0%
White (Not Ital) (2) 1 100% 1 ‐ ‐ ‐ ‐ (3) 75% (2) (1) ‐ ‐ ‐ ‐ 0%
All White (2) 1 100% 1 ‐ ‐ ‐ ‐ (3) 75% (2) (1) ‐ ‐ ‐ ‐ 0%
Unknown ‐ ‐ 0% ‐ ‐ ‐ ‐ ‐ ‐ 0% ‐ ‐ ‐ ‐ ‐ ‐ 0%
Veterans ‐ ‐ 0% ‐ ‐ ‐ ‐ ‐ ‐ 0% ‐ ‐ ‐ ‐ ‐ ‐ 0% Individuals w/Disabilities ‐ ‐ 0% ‐ ‐ ‐ ‐ ‐ ‐ 0% ‐ ‐ ‐ ‐ ‐ ‐ 0%
NET SUBTRACTIONSLeft Group ‐ SEPARATION Left Group‐INTERNAL MOVE
TITLE CHANGES WITHIN GROUP
Job Group Summary
Broadcast/Media
BDCAST‐TECH
NET ADDITIONS Joined Group ‐
HIRE Joined Group‐INTERNAL MOVE
Personnel Action Summary Page 21 of 26

Net Group Changes Addition #
Additions %
Hire (Outside CUNY and Other CUNY College)
Move from a Higher Group
Move from a Lower Group
Other Change of Group
Return to Faculty from
Other Title Sub. # Sub %
Separation (Left College or Left CUNY)
Move to Higher Group
Move to Lower Group
Other Change of Group
Return to Faculty Title
Title Change Within Group
Title Change %
Total (3) ‐ ‐ ‐ ‐ ‐ ‐ (3) (1) (2) ‐ ‐ ‐ ‐
Male (3) ‐ 0% ‐ ‐ ‐ ‐ ‐ (3) 100% (1) (2) ‐ ‐ ‐ ‐ 0% Female ‐ ‐ 0% ‐ ‐ ‐ ‐ ‐ ‐ 0% ‐ ‐ ‐ ‐ ‐ ‐ 0% Other/Unknown ‐ ‐ 0% ‐ ‐ ‐ ‐ ‐ ‐ 0% ‐ ‐ ‐ ‐ ‐ ‐ 0%
Total Min (2) ‐ 0% ‐ ‐ ‐ ‐ ‐ (2) 67% (1) (1) ‐ ‐ ‐ ‐ 0%
Asian ‐ ‐ 0% ‐ ‐ ‐ ‐ ‐ ‐ 0% ‐ ‐ ‐ ‐ ‐ ‐ 0% Black (1) ‐ 0% ‐ ‐ ‐ ‐ ‐ (1) 33% (1) ‐ ‐ ‐ ‐ ‐ 0% Hispanic (1) ‐ 0% ‐ ‐ ‐ ‐ ‐ (1) 33% ‐ (1) ‐ ‐ ‐ ‐ 0% Other Minority ‐ ‐ 0% ‐ ‐ ‐ ‐ ‐ ‐ 0% ‐ ‐ ‐ ‐ ‐ ‐ 0%
Italian‐American (1) ‐ 0% ‐ ‐ ‐ ‐ ‐ (1) 33% ‐ (1) ‐ ‐ ‐ ‐ 0%
White (Not Ital) ‐ ‐ 0% ‐ ‐ ‐ ‐ ‐ ‐ 0% ‐ ‐ ‐ ‐ ‐ ‐ 0%
All White (1) ‐ 0% ‐ ‐ ‐ ‐ ‐ (1) 33% ‐ (1) ‐ ‐ ‐ ‐ 0%
Unknown ‐ ‐ 0% ‐ ‐ ‐ ‐ ‐ ‐ 0% ‐ ‐ ‐ ‐ ‐ ‐ 0%
Veterans ‐ ‐ 0% ‐ ‐ ‐ ‐ ‐ ‐ 0% ‐ ‐ ‐ ‐ ‐ ‐ 0% Individuals w/Disabilities ‐ ‐ 0% ‐ ‐ ‐ ‐ ‐ ‐ 0% ‐ ‐ ‐ ‐ ‐ ‐ 0%
NET SUBTRACTIONSLeft Group ‐ SEPARATION Left Group‐INTERNAL MOVE
TITLE CHANGES WITHIN GROUP
Job Group Summary
IT Support Technician
IT‐TECH
NET ADDITIONS Joined Group ‐
HIRE Joined Group‐INTERNAL MOVE
Personnel Action Summary Page 22 of 26

Net Group Changes Addition #
Additions %
Hire (Outside CUNY and Other CUNY College)
Move from a Higher Group
Move from a Lower Group
Other Change of Group
Return to Faculty from
Other Title Sub. # Sub %
Separation (Left College or Left CUNY)
Move to Higher Group
Move to Lower Group
Other Change of Group
Return to Faculty Title
Title Change Within Group
Title Change %
Total (2) ‐ ‐ ‐ ‐ ‐ ‐ (2) (1) (1) ‐ ‐ ‐ ‐
Male (2) ‐ 0% ‐ ‐ ‐ ‐ ‐ (2) 100% (1) (1) ‐ ‐ ‐ ‐ 0% Female ‐ ‐ 0% ‐ ‐ ‐ ‐ ‐ ‐ 0% ‐ ‐ ‐ ‐ ‐ ‐ 0% Other/Unknown ‐ ‐ 0% ‐ ‐ ‐ ‐ ‐ ‐ 0% ‐ ‐ ‐ ‐ ‐ ‐ 0%
Total Min (1) ‐ 0% ‐ ‐ ‐ ‐ ‐ (1) 50% (1) ‐ ‐ ‐ ‐ ‐ 0%
Asian ‐ ‐ 0% ‐ ‐ ‐ ‐ ‐ ‐ 0% ‐ ‐ ‐ ‐ ‐ ‐ 0% Black (1) ‐ 0% ‐ ‐ ‐ ‐ ‐ (1) 50% (1) ‐ ‐ ‐ ‐ ‐ 0% Hispanic ‐ ‐ 0% ‐ ‐ ‐ ‐ ‐ ‐ 0% ‐ ‐ ‐ ‐ ‐ ‐ 0% Other Minority ‐ ‐ 0% ‐ ‐ ‐ ‐ ‐ ‐ 0% ‐ ‐ ‐ ‐ ‐ ‐ 0%
Italian‐American ‐ ‐ 0% ‐ ‐ ‐ ‐ ‐ ‐ 0% ‐ ‐ ‐ ‐ ‐ ‐ 0%
White (Not Ital) (1) ‐ 0% ‐ ‐ ‐ ‐ ‐ (1) 50% ‐ (1) ‐ ‐ ‐ ‐ 0%
All White (1) ‐ 0% ‐ ‐ ‐ ‐ ‐ (1) 50% ‐ (1) ‐ ‐ ‐ ‐ 0%
Unknown ‐ ‐ 0% ‐ ‐ ‐ ‐ ‐ ‐ 0% ‐ ‐ ‐ ‐ ‐ ‐ 0%
Veterans ‐ ‐ 0% ‐ ‐ ‐ ‐ ‐ ‐ 0% ‐ ‐ ‐ ‐ ‐ ‐ 0%
Individuals w/Disabilities ‐ ‐ 0% ‐ ‐ ‐ ‐ ‐ ‐ 0% ‐ ‐ ‐ ‐ ‐ ‐ 0%
NET SUBTRACTIONSLeft Group ‐ SEPARATION Left Group‐INTERNAL MOVE
TITLE CHANGES WITHIN GROUP
Job Group Summary
Print Shop
PRINT‐TECH
NET ADDITIONS Joined Group ‐
HIRE Joined Group‐INTERNAL MOVE
Personnel Action Summary Page 23 of 26

Net Group Changes Addition #
Additions %
Hire (Outside CUNY and Other CUNY College)
Move from a Higher Group
Move from a Lower Group
Other Change of Group
Return to Faculty from
Other Title Sub. # Sub %
Separation (Left College or Left CUNY)
Move to Higher Group
Move to Lower Group
Other Change of Group
Return to Faculty Title
Title Change Within Group
Title Change %
Total ‐ 1 1 ‐ ‐ ‐ ‐ (1) (1) ‐ ‐ ‐ ‐ ‐
Male ‐ 1 100% 1 ‐ ‐ ‐ ‐ (1) 100% (1) ‐ ‐ ‐ ‐ ‐ 0% Female ‐ ‐ 0% ‐ ‐ ‐ ‐ ‐ ‐ 0% ‐ ‐ ‐ ‐ ‐ ‐ 0% Other/Unknown ‐ ‐ 0% ‐ ‐ ‐ ‐ ‐ ‐ 0% ‐ ‐ ‐ ‐ ‐ ‐ 0%
Total Min ‐ 1 100% 1 ‐ ‐ ‐ ‐ (1) 100% (1) ‐ ‐ ‐ ‐ ‐ 0%
Asian ‐ ‐ 0% ‐ ‐ ‐ ‐ ‐ ‐ 0% ‐ ‐ ‐ ‐ ‐ ‐ 0% Black 1 1 100% 1 ‐ ‐ ‐ ‐ ‐ 0% ‐ ‐ ‐ ‐ ‐ ‐ 0% Hispanic (1) ‐ 0% ‐ ‐ ‐ ‐ ‐ (1) 100% (1) ‐ ‐ ‐ ‐ ‐ 0% Other Minority ‐ ‐ 0% ‐ ‐ ‐ ‐ ‐ ‐ 0% ‐ ‐ ‐ ‐ ‐ ‐ 0%
Italian‐American ‐ ‐ 0% ‐ ‐ ‐ ‐ ‐ ‐ 0% ‐ ‐ ‐ ‐ ‐ ‐ 0%
White (Not Ital) ‐ ‐ 0% ‐ ‐ ‐ ‐ ‐ ‐ 0% ‐ ‐ ‐ ‐ ‐ ‐ 0%
All White ‐ ‐ 0% ‐ ‐ ‐ ‐ ‐ ‐ 0% ‐ ‐ ‐ ‐ ‐ ‐ 0%
Unknown ‐ ‐ 0% ‐ ‐ ‐ ‐ ‐ ‐ 0% ‐ ‐ ‐ ‐ ‐ ‐ 0%
Veterans ‐ ‐ 0% ‐ ‐ ‐ ‐ ‐ ‐ 0% ‐ ‐ ‐ ‐ ‐ ‐ 0%
Individuals w/Disabilities ‐ ‐ 0% ‐ ‐ ‐ ‐ ‐ ‐ 0% ‐ ‐ ‐ ‐ ‐ ‐ 0%
NET SUBTRACTIONSLeft Group ‐ SEPARATION Left Group‐INTERNAL MOVE
TITLE CHANGES WITHIN GROUP
Category Summary
Service Workers and Others
Service Workers and Others
NET ADDITIONS Joined Group ‐
HIRE Joined Group‐INTERNAL MOVE
Personnel Action Summary Page 24 of 26

Net Group Changes Addition #
Additions %
Hire (Outside CUNY and Other CUNY College)
Move from a Higher Group
Move from a Lower Group
Other Change of Group
Return to Faculty from
Other Title Sub. # Sub %
Separation (Left College or Left CUNY)
Move to Higher Group
Move to Lower Group
Other Change of Group
Return to Faculty Title
Title Change Within Group
Title Change %
Total (1) ‐ ‐ ‐ ‐ ‐ ‐ (1) (1) ‐ ‐ ‐ ‐ ‐
Male (1) ‐ 0% ‐ ‐ ‐ ‐ ‐ (1) 100% (1) ‐ ‐ ‐ ‐ ‐ 0% Female ‐ ‐ 0% ‐ ‐ ‐ ‐ ‐ ‐ 0% ‐ ‐ ‐ ‐ ‐ ‐ 0% Other/Unknown ‐ ‐ 0% ‐ ‐ ‐ ‐ ‐ ‐ 0% ‐ ‐ ‐ ‐ ‐ ‐ 0%
Total Min (1) ‐ 0% ‐ ‐ ‐ ‐ ‐ (1) 100% (1) ‐ ‐ ‐ ‐ ‐ 0%
Asian ‐ ‐ 0% ‐ ‐ ‐ ‐ ‐ ‐ 0% ‐ ‐ ‐ ‐ ‐ ‐ 0% Black ‐ ‐ 0% ‐ ‐ ‐ ‐ ‐ ‐ 0% ‐ ‐ ‐ ‐ ‐ ‐ 0% Hispanic (1) ‐ 0% ‐ ‐ ‐ ‐ ‐ (1) 100% (1) ‐ ‐ ‐ ‐ ‐ 0% Other Minority ‐ ‐ 0% ‐ ‐ ‐ ‐ ‐ ‐ 0% ‐ ‐ ‐ ‐ ‐ ‐ 0%
Italian‐American ‐ ‐ 0% ‐ ‐ ‐ ‐ ‐ ‐ 0% ‐ ‐ ‐ ‐ ‐ ‐ 0%
White (Not Ital) ‐ ‐ 0% ‐ ‐ ‐ ‐ ‐ ‐ 0% ‐ ‐ ‐ ‐ ‐ ‐ 0%
All White ‐ ‐ 0% ‐ ‐ ‐ ‐ ‐ ‐ 0% ‐ ‐ ‐ ‐ ‐ ‐ 0%
Unknown ‐ ‐ 0% ‐ ‐ ‐ ‐ ‐ ‐ 0% ‐ ‐ ‐ ‐ ‐ ‐ 0%
Veterans ‐ ‐ 0% ‐ ‐ ‐ ‐ ‐ ‐ 0% ‐ ‐ ‐ ‐ ‐ ‐ 0%
Individuals w/Disabilities ‐ ‐ 0% ‐ ‐ ‐ ‐ ‐ ‐ 0% ‐ ‐ ‐ ‐ ‐ ‐ 0%
NET SUBTRACTIONSLeft Group ‐ SEPARATION Left Group‐INTERNAL MOVE
TITLE CHANGES WITHIN GROUP
Job Group Summary
Campus Peace Officer‐Sergeant
CPSS
NET ADDITIONS Joined Group ‐
HIRE Joined Group‐INTERNAL MOVE
Personnel Action Summary Page 25 of 26

Net Group Changes Addition #
Additions %
Hire (Outside CUNY and Other CUNY College)
Move from a Higher Group
Move from a Lower Group
Other Change of Group
Return to Faculty from
Other Title Sub. # Sub %
Separation (Left College or Left CUNY)
Move to Higher Group
Move to Lower Group
Other Change of Group
Return to Faculty Title
Title Change Within Group
Title Change %
Total 1 1 1 ‐ ‐ ‐ ‐ ‐ ‐ ‐ ‐ ‐ ‐ ‐
Male 1 1 100% 1 ‐ ‐ ‐ ‐ ‐ 0% ‐ ‐ ‐ ‐ ‐ ‐ 0% Female ‐ ‐ 0% ‐ ‐ ‐ ‐ ‐ ‐ 0% ‐ ‐ ‐ ‐ ‐ ‐ 0% Other/Unknown ‐ ‐ 0% ‐ ‐ ‐ ‐ ‐ ‐ 0% ‐ ‐ ‐ ‐ ‐ ‐ 0%
Total Min 1 1 100% 1 ‐ ‐ ‐ ‐ ‐ 0% ‐ ‐ ‐ ‐ ‐ ‐ 0%
Asian ‐ ‐ 0% ‐ ‐ ‐ ‐ ‐ ‐ 0% ‐ ‐ ‐ ‐ ‐ ‐ 0% Black 1 1 100% 1 ‐ ‐ ‐ ‐ ‐ 0% ‐ ‐ ‐ ‐ ‐ ‐ 0% Hispanic ‐ ‐ 0% ‐ ‐ ‐ ‐ ‐ ‐ 0% ‐ ‐ ‐ ‐ ‐ ‐ 0% Other Minority ‐ ‐ 0% ‐ ‐ ‐ ‐ ‐ ‐ 0% ‐ ‐ ‐ ‐ ‐ ‐ 0%
Italian‐American ‐ ‐ 0% ‐ ‐ ‐ ‐ ‐ ‐ 0% ‐ ‐ ‐ ‐ ‐ ‐ 0%
White (Not Ital) ‐ ‐ 0% ‐ ‐ ‐ ‐ ‐ ‐ 0% ‐ ‐ ‐ ‐ ‐ ‐ 0%
All White ‐ ‐ 0% ‐ ‐ ‐ ‐ ‐ ‐ 0% ‐ ‐ ‐ ‐ ‐ ‐ 0%
Unknown ‐ ‐ 0% ‐ ‐ ‐ ‐ ‐ ‐ 0% ‐ ‐ ‐ ‐ ‐ ‐ 0%
Veterans ‐ ‐ 0% ‐ ‐ ‐ ‐ ‐ ‐ 0% ‐ ‐ ‐ ‐ ‐ ‐ 0% Individuals w/Disabilities ‐ ‐ 0% ‐ ‐ ‐ ‐ ‐ ‐ 0% ‐ ‐ ‐ ‐ ‐ ‐ 0%
NET SUBTRACTIONSLeft Group ‐ SEPARATION Left Group‐INTERNAL MOVE
TITLE CHANGES WITHIN GROUP
Job Group Summary
Custodial
CUST
NET ADDITIONS Joined Group ‐
HIRE Joined Group‐INTERNAL MOVE
Personnel Action Summary Page 26 of 26

APPENDIX G ‐ SUMMARY OF RECRUITING ACTIVITIES
This appendix provides detail on searches performed by job group, ethnicity, and gender. Detail is provided on applicants, interviews, and offers. The scope of this report includes searches which officially concluded by a job offer during the previous plan year (June 1, 2017 through May 31, 2018).
Central Office
APP G

REVISED RECRUITING‐COSEN (1)
All Searches
Records Applicant Appl% Interview Int% Offer Off% Hire Hire%
Total 9,736 9,653 446 94 92
Male 4,559 4,541 47% 200 45% 40 43% 40 43% Female 3,861 3,800 39% 184 41% 38 40% 36 39% Other 1,313 1,309 14% 62 14% 16 17% 16 17%
Total Min 6,611 6,553 68% 272 61% 60 64% 59 64%
Asian 1,982 1,973 20% 83 19% 15 16% 14 15% Black 2,514 2,489 26% 98 22% 18 19% 18 20% Hispanic 1,793 1,771 18% 80 18% 18 19% 18 20% Two or More 285 283 3% 8 2% 2 2% 2 2%
Italian‐American 236 234 2% 21 5% 7 7% 7 8% White (Not Ital) 2,314 2,298 24% 124 28% 27 29% 26 28%
Unknown 575 568 6% 29 7% ‐ 0% ‐ 0%
Veterans 215 213 2% 11 2% 4 4% 4 4% Indiv. w Disabilities 326 324 3% 17 4% 10 11% 10 11%
Recruiting Summary Page 1 of 18

REVISED RECRUITING‐COSEN (1)
Records Applicant Appl% Interview Int% Offer Off% Hire Hire%
Total 2,788 2,764 190 34 34
Male 1,359 1,353 49% 98 52% 19 56% 19 56%Female 999 981 35% 59 31% 7 21% 7 21%Other 429 429 16% 33 17% 8 24% 8 24%
Total Min 1,582 1,563 57% 88 46% 14 41% 14 41%
Asian 422 422 15% 30 16% 6 18% 6 18%Black 675 666 24% 32 17% 3 9% 3 9%Hispanic/Latino 391 382 14% 23 12% 3 9% 3 9%Two or More 87 86 3% 3 2% 2 6% 2 6%
Italian American 113 113 4% 14 7% 4 12% 4 12%White (Not Ital) 905 902 33% 76 40% 15 44% 15 44%
‐ Unknown 188 186 7% 12 6% 1 3% 1 3%
Executive/Administrative/Managerial
Category Summary
Executive‐Administrative‐Managerial
Recruiting Summary Page 2 of 18

REVISED RECRUITING‐COSEN (1)
Records Applicant Appl% Interview Int% Offer Off% Hire Hire%
Total 899 899 44 7 7
Male 415 415 46% 22 50% 4 57% 4 57%Female 319 319 35% 16 36% 2 29% 2 29%Other 165 165 18% 6 14% 1 14% 1 14%
Total Min 453 453 50% 20 45% 4 57% 4 57%
Asian 113 113 13% 5 11% 2 29% 2 29%Black 197 197 22% 9 20% 1 14% 1 14%Hispanic/Latino 116 116 13% 4 9% ‐ 0% ‐ 0%Two or More 22 22 2% 2 5% 1 14% 1 14%
Italian American 38 38 4% 4 9% 1 14% 1 14%White (Not Ital) 352 352 39% 16 36% 2 29% 2 29%
‐ Unknown 56 56 6% 4 9% ‐ 0% ‐ 0%
ADMIN1‐EXEC
Job Group Summary
Administration 1 (Executive)
Recruiting Summary Page 3 of 18

REVISED RECRUITING‐COSEN (1)
Records Applicant Appl% Interview Int% Offer Off% Hire Hire%
Total 1,106 1,082 83 15 15
Male 442 436 40% 35 42% 8 53% 8 53%Female 524 506 47% 34 41% 5 33% 5 33%Other 139 139 13% 14 17% 2 13% 2 13%
Total Min 617 598 55% 37 45% 5 33% 5 33%
Asian 90 90 8% 5 6% ‐ 0% ‐ 0%Black 326 317 29% 16 19% 2 13% 2 13%Hispanic/Latino 170 161 15% 16 19% 3 20% 3 20%Two or More 30 29 3% ‐ 0% ‐ 0% ‐ 0%
Italian American 52 52 5% 7 8% 2 13% 2 13%White (Not Ital) 361 358 33% 34 41% 7 47% 7 47%
‐ Unknown 76 74 7% 5 6% 1 7% 1 7%
ADMIN2
Job Group Summary
Administration 2 (Managers)
Recruiting Summary Page 4 of 18

REVISED RECRUITING‐COSEN (1)
Records Applicant Appl% Interview Int% Offer Off% Hire Hire%
Total 701 701 55 10 10
Male 450 450 64% 36 65% 6 60% 6 60%Female 135 135 19% 7 13% ‐ 0% ‐ 0%Other 116 116 17% 12 22% 4 40% 4 40%
Total Min 471 471 67% 30 55% 5 50% 5 50%
Asian 217 217 31% 20 36% 4 40% 4 40%Black 134 134 19% 7 13% ‐ 0% ‐ 0%Hispanic/Latino 90 90 13% 2 4% ‐ 0% ‐ 0%Two or More 30 30 4% 1 2% 1 10% 1 10%
Italian American 14 14 2% ‐ 0% ‐ 0% ‐ 0%White (Not Ital) 164 164 23% 22 40% 5 50% 5 50%
‐ Unknown 52 52 7% 3 5% ‐ 0% ‐ 0%
IT‐MGR
Job Group Summary
IT Manager
Recruiting Summary Page 5 of 18

REVISED RECRUITING‐COSEN (1)
Records Applicant Appl% Interview Int% Offer Off% Hire Hire%
Total 82 82 8 2 2
Male 52 52 63% 5 63% 1 50% 1 50%Female 21 21 26% 2 25% ‐ 0% ‐ 0%Other 9 9 11% 1 13% 1 50% 1 50%
Total Min 41 41 50% 1 13% ‐ 0% ‐ 0%
Asian 2 2 2% ‐ 0% ‐ 0% ‐ 0%Black 18 18 22% ‐ 0% ‐ 0% ‐ 0%Hispanic/Latino 15 15 18% 1 13% ‐ 0% ‐ 0%Two or More 5 5 6% ‐ 0% ‐ 0% ‐ 0%
Italian American 9 9 11% 3 38% 1 50% 1 50%White (Not Ital) 28 28 34% 4 50% 1 50% 1 50%
‐ Unknown 4 4 5% ‐ 0% ‐ 0% ‐ 0%
SEC‐MGR
Job Group Summary
Security Manager
Recruiting Summary Page 6 of 18

REVISED RECRUITING‐COSEN (1)
Records Applicant Appl% Interview Int% Offer Off% Hire Hire%
Total 255 255 ‐ ‐ ‐
Male 144 144 56% ‐ 0% ‐ 0% ‐ 0%Female 61 61 24% ‐ 0% ‐ 0% ‐ 0%Other 50 50 20% ‐ 0% ‐ 0% ‐ 0%
Total Min 171 171 67% ‐ 0% ‐ 0% ‐ 0%
Asian 127 127 50% ‐ 0% ‐ 0% ‐ 0%Black 25 25 10% ‐ 0% ‐ 0% ‐ 0%Hispanic/Latino 17 17 7% ‐ 0% ‐ 0% ‐ 0%Two or More 2 2 1% ‐ 0% ‐ 0% ‐ 0%
Italian American 3 3 1% ‐ 0% ‐ 0% ‐ 0%White (Not Ital) 68 68 27% ‐ 0% ‐ 0% ‐ 0%
‐ Unknown 13 13 5% ‐ 0% ‐ 0% ‐ 0%
Category Summary
Professional Faculty
Professional Faculty
Recruiting Summary Page 7 of 18

REVISED RECRUITING‐COSEN (1)
Records Applicant Appl% Interview Int% Offer Off% Hire Hire%
Total 255 255 ‐ ‐ ‐
Male 144 144 56% ‐ 0% ‐ 0% ‐ 0%Female 61 61 24% ‐ 0% ‐ 0% ‐ 0%Other 50 50 20% ‐ 0% ‐ 0% ‐ 0%
Total Min 171 171 67% ‐ 0% ‐ 0% ‐ 0%
Asian 127 127 50% ‐ 0% ‐ 0% ‐ 0%Black 25 25 10% ‐ 0% ‐ 0% ‐ 0%Hispanic/Latino 17 17 7% ‐ 0% ‐ 0% ‐ 0%Two or More 2 2 1% ‐ 0% ‐ 0% ‐ 0%
Italian American 3 3 1% ‐ 0% ‐ 0% ‐ 0%White (Not Ital) 68 68 27% ‐ 0% ‐ 0% ‐ 0%
‐ Unknown 13 13 5% ‐ 0% ‐ 0% ‐ 0%
FAC‐PROF
Job Group Summary
Faculty‐Professorial
Recruiting Summary Page 8 of 18

REVISED RECRUITING‐COSEN (1)
Records Applicant Appl% Interview Int% Offer Off% Hire Hire%
Total 5,882 5,823 235 57 55
Male 2,745 2,733 47% 87 37% 19 33% 19 35%Female 2,399 2,356 40% 122 52% 31 54% 29 53%Other 736 732 13% 26 11% 7 12% 7 13%
Total Min 4,202 4,163 71% 166 71% 38 67% 37 67%
Asian 1,252 1,243 21% 50 21% 8 14% 7 13%Black 1,548 1,532 26% 54 23% 14 25% 14 25%Hispanic/Latino 1,202 1,189 20% 55 23% 15 26% 15 27%Two or More 174 173 3% 4 2% ‐ 0% ‐ 0%
Italian American 110 108 2% 7 3% 3 5% 3 5%White (Not Ital) 1,242 1,229 21% 46 20% 11 19% 10 18%
‐ Unknown 328 323 6% 16 7% 5 9% 5 9%
Category Summary
Professional Non‐Faculty
Professional Non‐Faculty
Recruiting Summary Page 9 of 18

REVISED RECRUITING‐COSEN (1)
Records Applicant Appl% Interview Int% Offer Off% Hire Hire%
Total 3,709 3,650 184 48 46
Male 1,183 1,171 32% 47 26% 14 29% 14 30%Female 2,080 2,037 56% 116 63% 28 58% 26 57%Other 444 440 12% 21 11% 6 13% 6 13%
Total Min 2,542 2,503 69% 126 68% 31 65% 30 65%
Asian 709 700 19% 37 20% 6 13% 5 11%Black 991 975 27% 45 24% 14 29% 14 30%Hispanic/Latino 717 704 19% 43 23% 11 23% 11 24%Two or More 114 113 3% 1 1% ‐ 0% ‐ 0%
Italian American 77 75 2% 6 3% 3 6% 3 7%White (Not Ital) 865 852 23% 39 21% 10 21% 9 20%
‐ Unknown 225 220 6% 13 7% 4 8% 4 9%
ADMIN3
Job Group Summary
Administration 3 (Professional)
Recruiting Summary Page 10 of 18
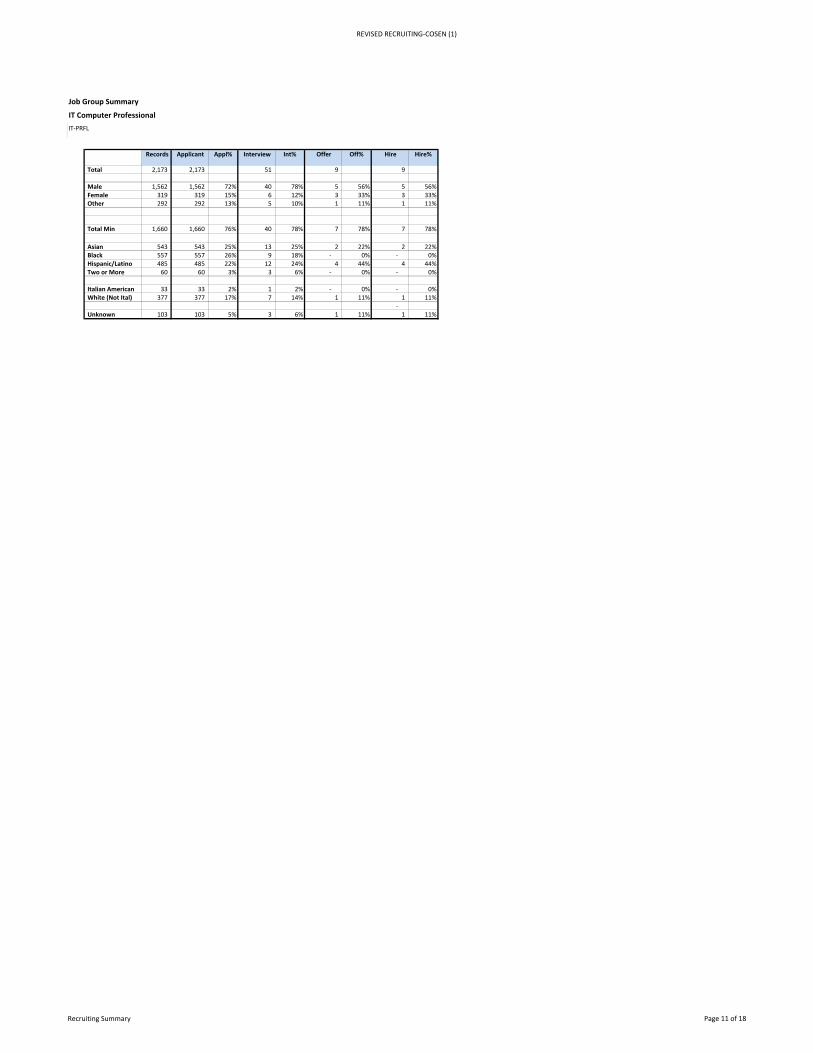
REVISED RECRUITING‐COSEN (1)
Records Applicant Appl% Interview Int% Offer Off% Hire Hire%
Total 2,173 2,173 51 9 9
Male 1,562 1,562 72% 40 78% 5 56% 5 56%Female 319 319 15% 6 12% 3 33% 3 33%Other 292 292 13% 5 10% 1 11% 1 11%
Total Min 1,660 1,660 76% 40 78% 7 78% 7 78%
Asian 543 543 25% 13 25% 2 22% 2 22%Black 557 557 26% 9 18% ‐ 0% ‐ 0%Hispanic/Latino 485 485 22% 12 24% 4 44% 4 44%Two or More 60 60 3% 3 6% ‐ 0% ‐ 0%
Italian American 33 33 2% 1 2% ‐ 0% ‐ 0%White (Not Ital) 377 377 17% 7 14% 1 11% 1 11%
‐ Unknown 103 103 5% 3 6% 1 11% 1 11%
IT‐PRFL
Job Group Summary
IT Computer Professional
Recruiting Summary Page 11 of 18

REVISED RECRUITING‐COSEN (1)
Records Applicant Appl% Interview Int% Offer Off% Hire Hire%
Total 743 743 17 2 2
Male 271 271 36% 12 71% 1 50% 1 50%Female 389 389 52% 2 12% ‐ 0% ‐ 0%Other 83 83 11% 3 18% 1 50% 1 50%
Total Min 612 612 82% 16 94% 2 100% 2 100%
Asian 172 172 23% 2 12% 1 50% 1 50%Black 248 248 33% 12 71% 1 50% 1 50%Hispanic/Latino 168 168 23% 1 6% ‐ 0% ‐ 0%Two or More 20 20 3% 1 6% ‐ 0% ‐ 0%
Italian American 10 10 1% ‐ 0% ‐ 0% ‐ 0%White (Not Ital) 80 80 11% ‐ 0% ‐ 0% ‐ 0%
‐ Unknown 41 41 6% 1 6% ‐ 0% ‐ 0%
Category Summary
Administrative Support Workers
Administrative Support
Recruiting Summary Page 12 of 18

REVISED RECRUITING‐COSEN (1)
Records Applicant Appl% Interview Int% Offer Off% Hire Hire%
Total 635 635 1 1 1
Male 196 196 31% ‐ 0% ‐ 0% ‐ 0%Female 367 367 58% ‐ 0% ‐ 0% ‐ 0%Other 72 72 11% 1 100% 1 100% 1 100%
Total Min 520 520 82% 1 100% 1 100% 1 100%
Asian 165 165 26% 1 100% 1 100% 1 100%Black 192 192 30% ‐ 0% ‐ 0% ‐ 0%Hispanic/Latino 143 143 23% ‐ 0% ‐ 0% ‐ 0%Two or More 16 16 3% ‐ 0% ‐ 0% ‐ 0%
Italian American 9 9 1% ‐ 0% ‐ 0% ‐ 0%White (Not Ital) 75 75 12% ‐ 0% ‐ 0% ‐ 0%
‐ Unknown 31 31 5% ‐ 0% ‐ 0% ‐ 0%
ACCT‐TECH
Job Group Summary
Accountant Assistant
Recruiting Summary Page 13 of 18

REVISED RECRUITING‐COSEN (1)
Records Applicant Appl% Interview Int% Offer Off% Hire Hire%
Total 108 108 16 1 1
Male 75 75 69% 12 75% 1 100% 1 100%Female 22 22 20% 2 13% ‐ 0% ‐ 0%Other 11 11 10% 2 13% ‐ 0% ‐ 0%
Total Min 92 92 85% 15 94% 1 100% 1 100%
Asian 7 7 6% 1 6% ‐ 0% ‐ 0%Black 56 56 52% 12 75% 1 100% 1 100%Hispanic/Latino 25 25 23% 1 6% ‐ 0% ‐ 0%Two or More 4 4 4% 1 6% ‐ 0% ‐ 0%
Italian American 1 1 1% ‐ 0% ‐ 0% ‐ 0%White (Not Ital) 5 5 5% ‐ 0% ‐ 0% ‐ 0%
‐ Unknown 10 10 9% 1 6% ‐ 0% ‐ 0%
MMSW
Job Group Summary
Mail Services Worker
Recruiting Summary Page 14 of 18

REVISED RECRUITING‐COSEN (1)
Records Applicant Appl% Interview Int% Offer Off% Hire Hire%
Total ‐ ‐ ‐ ‐ ‐
Male ‐ ‐ 0% ‐ 0% ‐ 0% ‐ 0%Female ‐ ‐ 0% ‐ 0% ‐ 0% ‐ 0%Other ‐ ‐ 0% ‐ 0% ‐ 0% ‐ 0%
Total Min ‐ ‐ 0% ‐ 0% ‐ 0% ‐ 0%
Asian ‐ ‐ 0% ‐ 0% ‐ 0% ‐ 0%Black ‐ ‐ 0% ‐ 0% ‐ 0% ‐ 0%Hispanic/Latino ‐ ‐ 0% ‐ 0% ‐ 0% ‐ 0%Two or More ‐ ‐ 0% ‐ 0% ‐ 0% ‐ 0%
Italian American ‐ ‐ 0% ‐ 0% ‐ 0% ‐ 0%White (Not Ital) ‐ ‐ 0% ‐ 0% ‐ 0% ‐ 0%
‐ Unknown ‐ ‐ 0% ‐ 0% ‐ 0% ‐ 0%
Category Summary
Craft Workers
Craft Workers
Recruiting Summary Page 15 of 18

REVISED RECRUITING‐COSEN (1)
Records Applicant Appl% Interview Int% Offer Off% Hire Hire%
Total 68 68 4 1 1
Male 40 40 59% 3 75% 1 100% 1 100%Female 13 13 19% 1 25% ‐ 0% ‐ 0%Other 15 15 22% ‐ 0% ‐ 0% ‐ 0%
Total Min 44 44 65% 2 50% ‐ 0% ‐ 0%
Asian 9 9 13% 1 25% ‐ 0% ‐ 0%Black 18 18 26% ‐ 0% ‐ 0% ‐ 0%Hispanic/Latino 15 15 22% 1 25% ‐ 0% ‐ 0%Two or More 2 2 3% ‐ 0% ‐ 0% ‐ 0%
Italian American ‐ ‐ 0% ‐ 0% ‐ 0% ‐ 0%White (Not Ital) 19 19 28% 2 50% 1 100% 1 100%
‐ Unknown 5 5 7% ‐ 0% ‐ 0% ‐ 0%
Category Summary
Technicians
Technicians
Recruiting Summary Page 16 of 18

REVISED RECRUITING‐COSEN (1)
Records Applicant Appl% Interview Int% Offer Off% Hire Hire%
Total 68 68 4 1 1
Male 40 40 59% 3 75% 1 100% 1 100%Female 13 13 19% 1 25% ‐ 0% ‐ 0%Other 15 15 22% ‐ 0% ‐ 0% ‐ 0%
Total Min 44 44 65% 2 50% ‐ 0% ‐ 0%
Asian 9 9 13% 1 25% ‐ 0% ‐ 0%Black 18 18 26% ‐ 0% ‐ 0% ‐ 0%Hispanic/Latino 15 15 22% 1 25% ‐ 0% ‐ 0%Two or More 2 2 3% ‐ 0% ‐ 0% ‐ 0%
Italian American ‐ ‐ 0% ‐ 0% ‐ 0% ‐ 0%White (Not Ital) 19 19 28% 2 50% 1 100% 1 100%
‐ Unknown 5 5 7% ‐ 0% ‐ 0% ‐ 0%
BDCAST‐TECH
Job Group Summary
Broadcast/Media
Recruiting Summary Page 17 of 18

REVISED RECRUITING‐COSEN (1)
Records Applicant Appl% Interview Int% Offer Off% Hire Hire%
Total ‐ ‐ ‐ ‐ ‐
Male ‐ ‐ 0% ‐ 0% ‐ 0% ‐ 0%Female ‐ ‐ 0% ‐ 0% ‐ 0% ‐ 0%Other ‐ ‐ 0% ‐ 0% ‐ 0% ‐ 0%
Total Min ‐ ‐ 0% ‐ 0% ‐ 0% ‐ 0%
Asian ‐ ‐ 0% ‐ 0% ‐ 0% ‐ 0%Black ‐ ‐ 0% ‐ 0% ‐ 0% ‐ 0%Hispanic/Latino ‐ ‐ 0% ‐ 0% ‐ 0% ‐ 0%Two or More ‐ ‐ 0% ‐ 0% ‐ 0% ‐ 0%
Italian American ‐ ‐ 0% ‐ 0% ‐ 0% ‐ 0%White (Not Ital) ‐ ‐ 0% ‐ 0% ‐ 0% ‐ 0%
‐ Unknown ‐ ‐ 0% ‐ 0% ‐ 0% ‐ 0%
Category Summary
Service Workers and Others
Service Workers and Others
Recruiting Summary Page 18 of 18