Embed Size (px)
Citation preview
Objective: The objective was to assess the role of cumulative spine loading measures in the development of a clinically meaningful decline in low-back function.
Background: Cumulative spine loading has been a suspected risk factor for low-back pain for many years, yet the measures that characterize risk have not been well delineated.
Methods: A total of 56 cumulative exposure mea-sures were collected in a prospective field study of distri-bution center workers. An individual’s risk for a clinically meaningful decline in low-back function (true cases) was explored with daily, weekly, and job tenure cumulative exposure measures using univariate and multivariate statistical modeling techniques. True noncases were indi-viduals with no decline in low-back function.
Results: An individual’s risk for a clinically meaning-ful decline in low-back function (true cases) was pre-dicted well versus true noncases (sensitivity/specificity = 72%/73%) using initial low-back function (p(n)), cumulative rest time, cumulative load exposure, job satisfaction, and worker age.
Conclusions: Cumulative rest time was identified as an important component for predicting an individ-ual’s risk for a clinically meaningful decline in low-back function.
Application: This information can be used to assess cumulative spine loading risk and may help estab-lish guidelines to minimize the risk of a clinically mean-ingful decline in low-back function.
Keywords: low-back pain, biomechanics, epidemiology, occupational risk, surveillance
IntroductIonCumulative spine loading has been a sus-
pected risk factor for low-back disorders over the past couple of decades. However, our under-standing of cumulative spine loading and its association with risk is rather poor in that we do not know which cumulative loading mea-sures represent the most predictive indicators of low-back disorder risk. Much of the interest in cumulative loading has been extrapolated from upper extremity field studies that have shown an increased risk of cumulative trauma disor-ders when exposed to repetitive work. In these studies the relationship between job-required hand force and repetition was associated with increased risk of upper extremity disorders such as carpal tunnel syndrome (Silverstein, Fine, & Armstrong, 1986, 1987).
The theory behind cumulative loading sug-gests that repetitive loading of tissues can weaken their tolerance and thereby reduce the ability of a worker to withstand force over time. In the spine, biomechanical studies have estab-lished that repetitive compressive loads could result in spine damage at submaximal levels of force application (Adams & Hutton, 1983; Liu, Njus, Buckwalter, & Wakano, 1983). Employ-ing this logic, one needs to merely understand how much repetition under a variety of loading levels will weaken a structure to the point of fail-ure. However, attempts to establish such limits for the low back have not been successful. In vitro studies of the spinal tissues have attempted to identify the amount of cumulative compres-sive load that would result in tissue disruption (Brinkmann, Biggermann, & Hilweg, 1988; Hansson, Keller, & Spengler, 1987), though attempts to characterize these relationships have not been able to account for much of the data variance (Callaghan, 2002). Further attempts to
496814 HFSXXX10.1177/0018720813496814Human FactorsCumulative Spine Loading2013
Address correspondence to William S. Marras, Integrated Systems Engineering, Biodynamics Laboratory, The Ohio State University, 1971 Neil Avenue, 210 Baker Systems, Columbus, OH 43210, USA; [email protected].
SPECIAL ISSUE: Epidemiological Studies of Workplace Musculoskeletal Disorders
Cumulative Spine Loading and Clinically Meaningful Declines in Low-Back Function
William S. Marras, Sue A. Ferguson, Steven A. Lavender, Riley E. Splittstoesser, and Gang Yang, The Ohio State University, Columbus, OH, USA
HUMAN FACTORSVol. 56, No. 1, February 2014, pp. 29 –43DOI: 10.1177/0018720813496814Copyright © 2013, Human Factors and Ergonomics Society.
at OHIO STATE UNIVERSITY LIBRARY on March 14, 2014hfs.sagepub.comDownloaded from
30 February 2014 - Human Factors
identify the level of repetitive loading that could cause damage have included shear force esti-mates (Yingling & McGill, 1999); however, few have been able to describe this trend using human samples of working age (Gallagher, Mar-ras, Litsky, & Burr, 2005). Once compressive and shear loading combinations are considered along with various repetition rates, the response depiction rapidly becomes complex, and it becomes very difficult to determine thresholds of tolerance. In addition, in vitro studies are unable to account for adaptation that is expected to occur in vivo. Thus, it appears that a simple load-frequency threshold of tolerance for spine loading has been elusive for cumulative spine loading.
Given these challenges associated with labo-ratory-based biomechanical studies, several studies have attempted to better understand cumulative spine loading in vivo based on work-place (field) data collection studies. However, field studies do not permit the degree of control afforded by laboratory studies. Early field stud-ies have used crude indicators of cumulative load exposure, such as hours worked in a par-ticular posture, based on structured interviews and found relationships with radiographic diag-noses of spine problems (Seidler et al., 2001; Seidler et al., 2003). Others have found that crude measures of spine compression at work correlated with lost time (Village et al., 2005). Yet another study used technical experts to esti-mate cumulative spine load and found a dose–response relationship between the cumulative lumbar load and the acceleration of lumbar disc narrowing (Seidler et al., 2011). Kumar (1990), using a two dimensional load model, found that cumulative compression and shear was greater in those with low-back pain. Norman and col-leagues (1998) employed two cumulative load measures (as assessed with a rudimentary bio-mechanical model) to estimate load over a shift. The final multivariate model reported by Nor-man et al. showed that workers in the top 25% of loading were 6 times more likely to report low-back pain than those in the lower 25% of expo-sure. Similarly, Kerr et al. (2001) found that cumulative disc compression as measured over a shift was associated with low-back pain reports. These field-based studies provide insight but
few definitive thresholds to assess how much cumulative spine loading is too much cumula-tive spine loading.
The logic underlying cumulative spine load-ing and spine damage suggests that micro dam-age occurs at a rate that is faster than the tissue can repair or strengthen (Callaghan, 2006). Yet most studies that have attempted to study cumu-lative spine loading tolerance limits have largely ignored the tissue repair time associated with spinal loading. Tissue repair time appears to be an essential element of spine tissue health. Sev-eral efforts have described the nutrition pathway mechanisms by which spine loading relates to degeneration and tissue repair (Buckwalter, 1995; Lotz, 2004; Lotz & Chin, 2000; Urban & Roberts, 2003; Urban, Smith, & Fairbank, 2004); however, it has not been practical to examine these processes in laboratory in vivo studies involving humans. Several animal investigations have shown that inadequate rest time was associated with neuromuscular disor-ders (Courville et al., 2005; Hoops, Zhou, Lu, Solomonow, & Patel, 2007; Lu et al., 2008; Sbriccoli, Solomonow, Zhou, & Lu, 2007). In addition, inadequate rest time during the work cycle can be associated with proinflammatory cytokine reactions (Pinski et al., 2010). Thus, although many studies have examined the cumu-lative loading associated with spine disorders, there appear to be no studies that have explored the role of rest time in combination with cumu-lative spine loading.
Literature reviews have suggested that more quantitative measures of exposure can lead to a better understanding of musculoskeletal risk (National Research Council and Institute of Medicine, 2001). Although previous field stud-ies have shown relationships between cumula-tive spine loading (measured in various ways) and low-back problems, these studies do not necessarily provide quantitative insight as to the characteristics of work exposure that are prob-lematic. This lack of quantitative guidance may be due to several significant challenges associ-ated with previous workplace-based studies. The first challenge in the workplace is to describe the work exposures (loading and timing characteris-tics) with enough fidelity to provide a meaning-ful quantitative understanding of the cumulative
at OHIO STATE UNIVERSITY LIBRARY on March 14, 2014hfs.sagepub.comDownloaded from
Cumulative Spine loading 31
loading profile relative to the risk. Second, the temporal aspects of the work exposure are typi-cally not defined in enough detail for useful analysis. Thus, issues such as rest time have not been adequately investigated. Third, it is extremely difficult to collect comprehensive loading information without interfering with the job, and it is also a challenge to describe the cumulative exposures over extended periods. Finally, low-back disorders have not been classi-fied or described in a meaningful way to under-stand the nature of the low-back disorder and, thus, the risk. Thus, the aim of this study was to objectively quantify low-back disorders among distribution center workers and the associated cumulative spine loading exposures.
Methodexperimental design
This study was a prospective field evaluation that quantitatively monitored low-back health effects (low-back kinematic function) of workers performing materials handling work in distri-bution centers as well as quantitatively docu-mented the physical exposures in the workplace.
Initially, a baseline data collection effort was performed. All workers involved in manual materials handling tasks (i.e., order picking, truck loading/unloading, stock replenishment) in various distribution centers were invited to participate in the study. Workers who agreed to the study signed institutional review board con-sent forms and then were evaluated for health effects status.
Health effect evaluations consisted of a low- back functional assessment to measure low-back impairment status as well as a questionnaire. After the baseline health effects data were col-lected, but before the health effects follow-up physical exposure measures were collected from a subset of workers performing each job cate-gory within the distribution center. The number of workers recruited for work exposure mea-surements depended on the number of workers employed in the particular job. Between three and seven workers were randomly selected for monitoring on each job. Previous studies (Mar-ras, Allread, Burr, & Fathallah, 2000) have determined that a minimum of three workers
was necessary to adequately document the phys-ical characteristics of a workplace.
At least 6 months after the baseline low-back health effects measures were collected; follow-up health effects measures were once again col-lected from all workers who were still assigned to the jobs of interest.
data collection SitesData collections occurred at distribution
centers (DCs) where employees performed repetitive material handling tasks continuously throughout the day. Data were collected from grocery, automotive parts, clothing, and general merchandise DCs. Jobs within the DCs were identified relative to the department (or sec-tion) of work exposure. For example, within a grocery distribution operation there may be three to four jobs, depending on how orders are distributed. Usually employees lift or “select” in dry groceries, produce, frozen foods, or boxed meats. Therefore, a grocery facility with these four areas would potentially contribute four jobs to the database.
Overall, a total of 19 different DCs were included in the database. A total of 48 jobs were identified within these facilities. The types of DCs included grocery, auto parts, clothing, and general merchandise. The number of each type and number of jobs in each type have been reported previously (Marras, Lavender, Fergu-son, Splittstoesser, & Yang, 2010).
Worker databaseDCs are notorious for high rates of dropout
(Min, 2007). This was reflected in our sample. Originally, 888 workers were enrolled in this study. At follow-up 366 of the workers had left the job and were unavailable for follow-up. The job exposures for the dropout group were similar to those for individuals with a clini-cally meaningful decline in low-back function. A detailed description of the dropout group compared to those who remained on the job has been discussed elsewhere (Ferguson, Marras, Lavender, Splittstoesser, & Yang, 2014). Of the 522 remaining workers, 72 were eliminated from consideration because they no longer were assigned to the same job. Consequently,
at OHIO STATE UNIVERSITY LIBRARY on March 14, 2014hfs.sagepub.comDownloaded from
32 February 2014 - Human Factors
450 workers were available for the health effects follow-up analysis, representing a fol-low-up rate of slightly more than 50%.
health history, Work history, and Psychosocial Assessment
All workers were asked to fill out a survey that assessed their job tenure, hours worked per week and experiences as well as their psycho-social impressions of the work. These charac-teristics have been reported elsewhere (Marras, Lavender, Ferguson, Splittstoesser, & Yang, 2010). Employees were given a hat or T-shirt in exchange for participating in each health effect session of the data collections (baseline and follow-up).
Low-Back Functional Impairment evaluation
To quantitatively document the functional status of the low back, workers were asked to participate in kinematic back functional assess-ments. This required workers to interact with a computer while wearing a clinical lumbar motion monitor (LMM) to document kinematic performance in three-dimensional space using the assessment protocol described previously in the literature (Ferguson & Marras, 2004). This low-back functional assessment required approximately 10 minutes. This procedure yields objective data (sagittal range of motion, velocity, and acceleration) describing the work-er’s back kinematic function and represents an independent, performance-based, low-back assessment. The model underlying this analysis has excellent sensitivity (90%) and specificity (92%) in its ability to correctly differentiate those with and without back pain (Marras et al., 1995; Marras et al., 1999). By comparing each employee’s kinematic profile with that of a nor-mative database, the model was able to quantify how that worker’s kinematic function compares to that which would be expected of a person of that age and gender (expected normal kinematic function). The worker’s kinematic back func-tion is scaled relative to the expected normal kinematic function (for an individual) and is defined as the probability of normal or p(n). A probability of less than 0.5 indicates impaired function for an individual’s age and gender,
whereas a probability greater than 0.5 indicates healthy performance. This analysis is also able to identify whether a subject is magnifying their impairment (Marras, Lewis, Ferguson, & Parnianpour, 2000). A decrease in p(n) of at least 0.14 is considered clinically meaningful (Ferguson et al., 2009). This value was used as a minimum benchmark for defining low-back true cases; individual workers whose kinematic functional score decreased by 0.14 between the baseline measure of low-back function and the follow-up measurement were defined as low-back cases.
Physical exposure SamplingWork exposure sampling was performed on
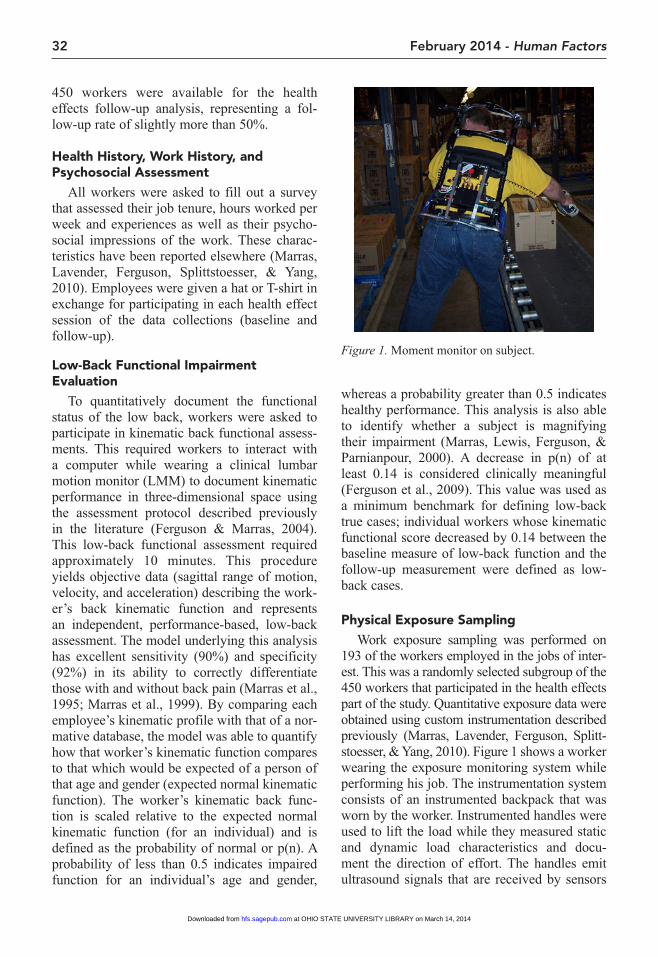
193 of the workers employed in the jobs of inter-est. This was a randomly selected subgroup of the 450 workers that participated in the health effects part of the study. Quantitative exposure data were obtained using custom instrumentation described previously (Marras, Lavender, Ferguson, Splitt-stoesser, & Yang, 2010). Figure 1 shows a worker wearing the exposure monitoring system while performing his job. The instrumentation system consists of an instrumented backpack that was worn by the worker. Instrumented handles were used to lift the load while they measured static and dynamic load characteristics and docu-ment the direction of effort. The handles emit ultrasound signals that are received by sensors
Figure 1. Moment monitor on subject.
at OHIO STATE UNIVERSITY LIBRARY on March 14, 2014hfs.sagepub.comDownloaded from
Cumulative Spine loading 33
positioned around the backpack frame. The ultrasound receivers triangulate the handle loca-tion and thereby enable the backpack to docu-ment the travel path of the load relative to the spine. The backpack also contains accelerom-eters that document trunk motions. The sys-tem software translates the exposures relative to exposures about the L5/S1 disc. Detailed descriptions of the instrumentation and per-formance can be found elsewhere (Marras, Lavender, Ferguson, Splittstoesser, Yang, & Schabo, 2010). Force measurement accuracy was documented within 0.5 Kg (1.1 pounds), and position accuracy (average absolute error) is within 3.0 cm (1.2 inches). These calibra-tions represent accuracies that are 4 times more accurate than taking the measurement manually (Marras, Lavender, Ferguson, Splittstoesser, Yang, & Schabo, 2010). In addition, the system is unique in that it is capable of documenting dynamic load moment exposure at the worksite. This system enables the continuous monitoring and recording of three-dimensional hand loca-tions relative to both the L5/S1 disc and the ground, the instantaneous load weight (static and dynamic), the orientation of the torso, and the timing of lifting events, and a variety of derived measures (e.g., moment arms, static and dynamic load moments, etc.). Data were contin-uously collected using the built-in microproces-sor and stored on memory flash cards for later analysis. The data processing programs used the hand load exposure information to identify lift initiation and termination points and thereby identified the intervals of time during which lift-ing was occurring and the interlift (rest) periods.
Overall, the system collected 390 variables for each lift performed by the worker.
Workers involved in physical exposure sam-pling were randomly chosen from the pool of workers performing the job. The workers were compensated for their participation with gift cards from area merchants. Each employee was monitored for up to 4 hours and was asked to perform his or her job and match his or her nor-mal productivity rates.
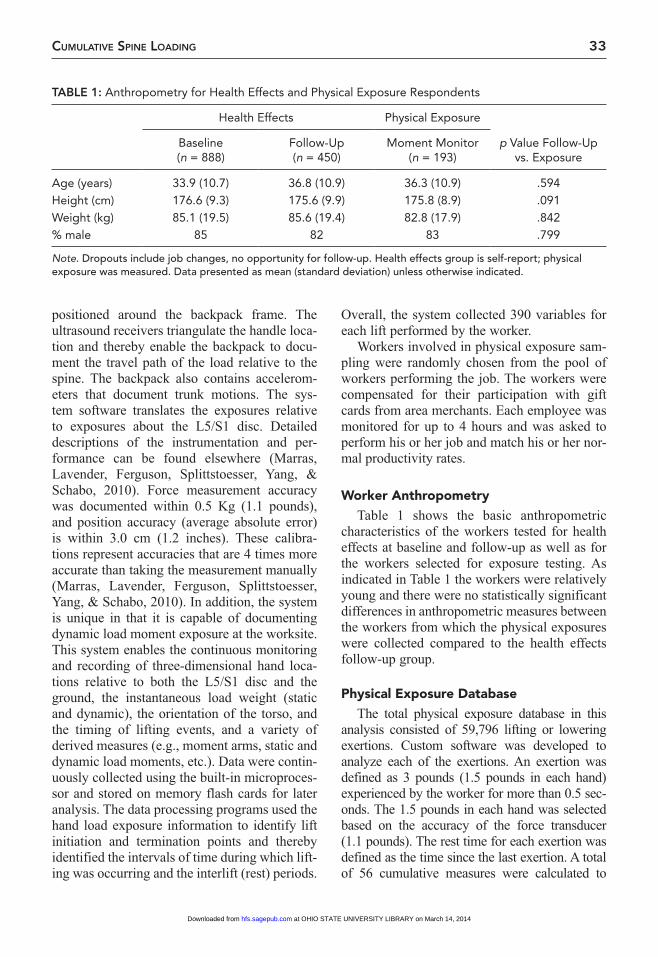
Worker AnthropometryTable 1 shows the basic anthropometric
characteristics of the workers tested for health effects at baseline and follow-up as well as for the workers selected for exposure testing. As indicated in Table 1 the workers were relatively young and there were no statistically significant differences in anthropometric measures between the workers from which the physical exposures were collected compared to the health effects follow-up group.
Physical exposure databaseThe total physical exposure database in this
analysis consisted of 59,796 lifting or lowering exertions. Custom software was developed to analyze each of the exertions. An exertion was defined as 3 pounds (1.5 pounds in each hand) experienced by the worker for more than 0.5 sec-onds. The 1.5 pounds in each hand was selected based on the accuracy of the force transducer (1.1 pounds). The rest time for each exertion was defined as the time since the last exertion. A total of 56 cumulative measures were calculated to
TABLE 1: Anthropometry for Health Effects and Physical Exposure Respondents
Health Effects Physical Exposure
Baseline (n = 888)
Follow-Up (n = 450)
Moment Monitor (n = 193)
p Value Follow-Up vs. Exposure
Age (years) 33.9 (10.7) 36.8 (10.9) 36.3 (10.9) .594Height (cm) 176.6 (9.3) 175.6 (9.9) 175.8 (8.9) .091Weight (kg) 85.1 (19.5) 85.6 (19.4) 82.8 (17.9) .842% male 85 82 83 .799
Note. Dropouts include job changes, no opportunity for follow-up. Health effects group is self-report; physical exposure was measured. Data presented as mean (standard deviation) unless otherwise indicated.
at OHIO STATE UNIVERSITY LIBRARY on March 14, 2014hfs.sagepub.comDownloaded from
34 February 2014 - Human Factors
represent exposures. These measures consisted of 28 cumulative load variables processed in two different ways: (a) integration of the signal over exertion time or (b) signal peak multiplied by the duration of exertion (Callaghan, Salewytsch, & Andrews, 2001). The integrated measures from each exertion were summed across the data col-lection time for that worker. The cumulative measures were multiplied by a scaling factor for that worker to derive an 8-hour day exposure. The data from the workers who wore the moment monitor were averaged together and assigned to each worker who worked that job for the daily exposure measure. The questionnaire data for the number of hours worked per week for each worker were multiplied by the daily exposure and used to define weekly exposure. The weekly exposure was multiplied by the questionnaire data regarding duration of employment on the job to define job tenure exposure. This analysis focuses on the association between cumulative (integrated) physical exposure characteristics and a clinically meaningful decrease in low-back kinematic function.
data Analysis: Individual Low-Back Functional decline definitions
True individual cases were defined as those workers with a decrease in p(n) low-back func-tion score of 0.14 or more (clinically meaning-ful decline or true case; Ferguson et al., 2009). Workers with a decline in p(n) from 0 to –0.14 (a nonmeaningful decline) were separated for analysis as neither cases nor noncases. Non-cases were those with a p(n) change score of zero or more (true noncase).
univariate AnalysesTo test each of the integrated physical expo-
sure measures between true noncases and true cases of a clinically meaningful change in low-back function, t tests were used. Classification and regression tree (CART; Breiman, Friedman, Olshen, & Stone, 1984; Steinberg & Colla, 1997) software was used to dichotomize the continuous dependent measures at one or more points for classification; however, in some cases the clas-sification trend was inconsistent with cumulative loading expectations (trending in wrong direction; i.e., lower exposures resulted in true cases). Each
dependent measure was assessed in CART to determine if the first cut point was in the expected direction. In addition, t tests were used to evaluate exposure differences between true noncases and the nonmeaningful decline in low-back function group as well as true cases versus the nonmean-ingful decline in low-back function group.
Multivariate AnalysesThe individual risk models indicated the
risk of a clinically meaningful decline in low-back function. Three separate risk models were developed for individual risk based on the three definitions of cumulative measures: (a) daily risk model, (b) weekly risk model, and (c) job tenure risk model.
CART software was employed to select and assess the conditional relationship between the physical exposure variables. The CART analysis was offered physical exposure variables from each category of variables (i.e., load, timing, kine-matics, psychosocial, etc.), and the analysis itera-tively chose the variables and identified the value of the variable (cut point) that best distinguished between the true cases and true noncases. The first two or three variables from each category of vari-ables selected by CART were used to build gener-alized linear models with SAS via “proc genmod.” The best multivariate models were selected based on three factors, consisting of (a) statistical significance of each variable entering the model, (b) the Akaike information criterion, and (c) model sensitivity and specificity. Sensitivity and speci-ficity were calculated using the predicted values from the output of the generalized linear models with a cut point of 0.5. Relative risk values are reported for each model parameter. The models were developed and selected using the true non-cases versus true cases (clinical meaningful decline in low-back function). The relative risk was also calculated for the true noncases versus nonmeaningful decline in low-back function as well as the relative risk between nonmeaningful declines versus true cases.
reSuLtSBased on our case definitions, the database
yielded 126 workers with a clinical meaning-ful decline in low-back function (true cases), 115 workers with a nonmeaningful decline in
at OHIO STATE UNIVERSITY LIBRARY on March 14, 2014hfs.sagepub.comDownloaded from
Cumulative Spine loading 35
low-back function, and 205 noncases with no decline in low-back function (true noncases).
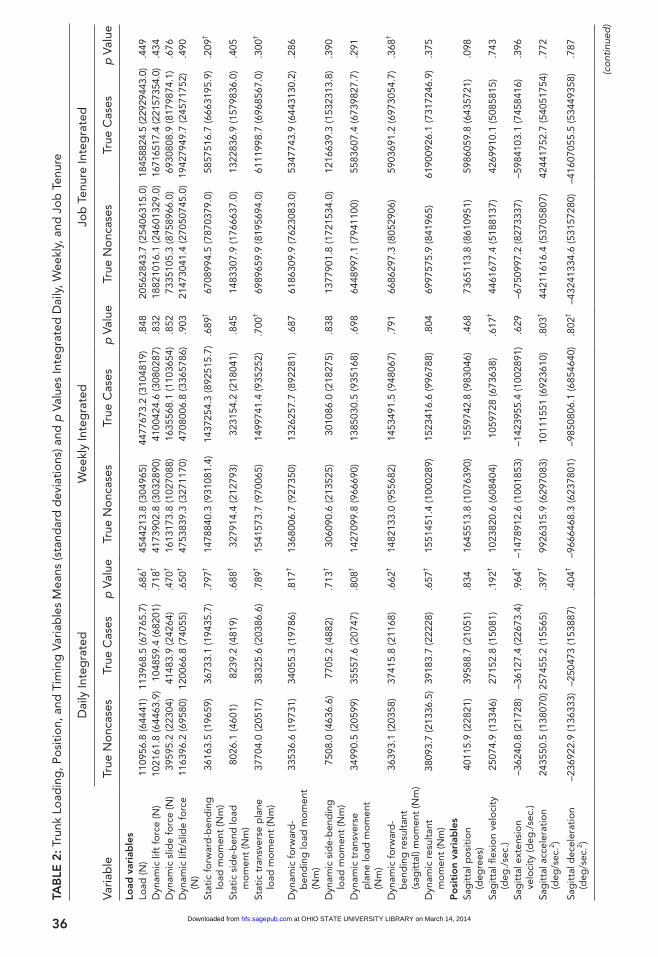
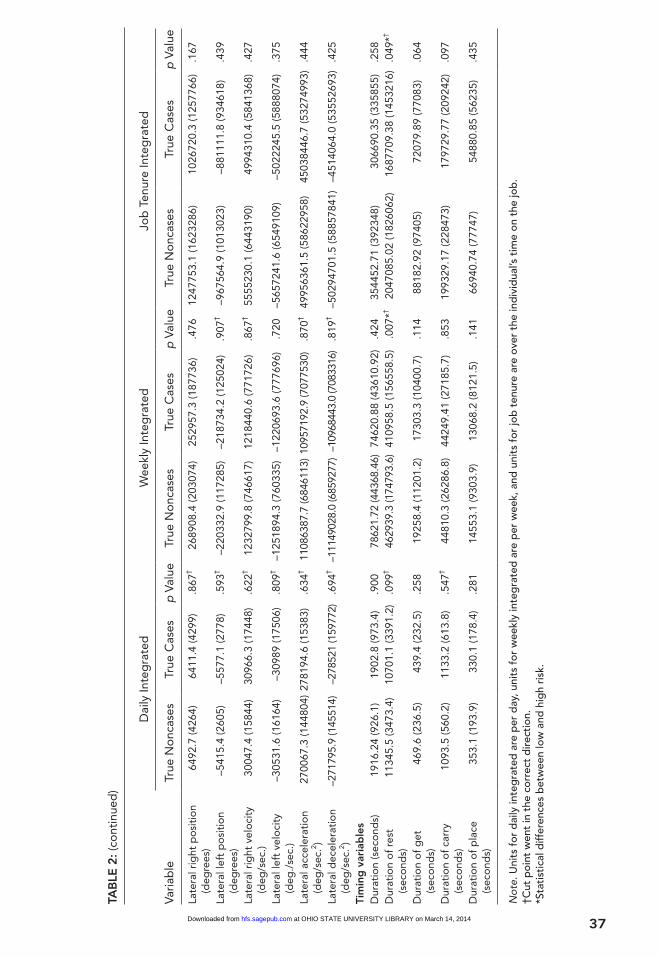
univariate cumulative Individual riskTable 2 shows descriptive statistics (mean and
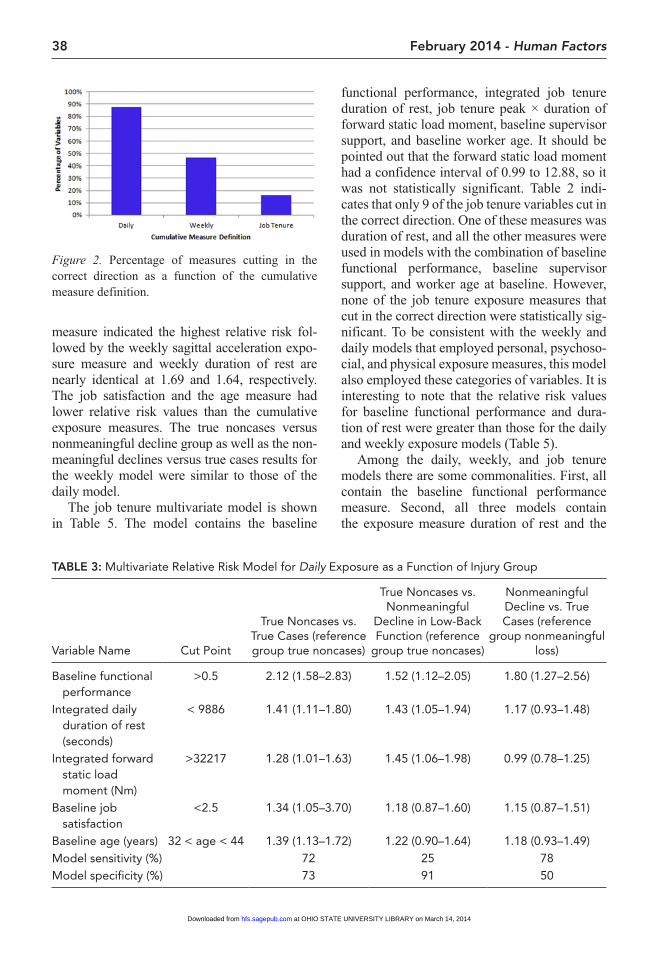
standard deviation) for the 28 integrated variable true cases and true noncases as a function of daily, weekly, and job tenure cumulative exposure metrics examined in this study. The peak times duration measure results were similar to these integrated measures; therefore these measures are not presented here. This table also identifies sta-tistically significant differences between the true cases and true noncases of a clinically meaningful decline in low-back function as well as identi-fies those variables that trend in the expected direction (true cases were associated with greater cumulative exposure) by the various exposure metrics. This table indicates that a large number of univariate cumulative measures of exposure are consistent with the expected trend when the exposure variables are considered as a function of daily exposure, yet progressively fewer cumula-tive exposure variables are associated with the expected trend as metrics are considered for weekly and job tenure exposures, respectively (Figure 2). Of the 56 cumulative measures exam-ined, 49 (88%) of the daily measures trended in a direction consistent with cumulative loading expectations (Figure 2), but only 9 (16%) of the job tenure cumulative measures behaved in this manner. It is notable that the only univariate cumulative exposure variables that both were statistically different between true cases and true noncases as well as trended in the expected direc-tion consisted of the duration of rest measure for both the weekly and job tenure definitions of cumulative exposure. As expected, univariate analyses of true noncases versus the nonmeaning-ful decline in low-back function group found no exposure measures with significant differences. Similarly, there were no univariate significant exposure measure differences between the true cases versus the nonmeaningful decline in low-back function group.
Multivariate cumulative Models: Individual risk Models
Three multivariate cumulative risk models were developed to describe how the combinations of
exposure measures were associated with a mean-ingful decline in low-back function within an individual worker as a function of the various cumulative exposure definitions (daily, weekly, or job tenure). The best performing individual risk models for daily, weekly, and job tenure definitions of exposure time are shown in Tables 3, 4, and 5, respectively.
The daily model contained baseline low-back function (p(n)), integrated daily duration of rest, integrated forward static load moment, baseline job satisfaction, and baseline worker age. Table 3 illustrates that the relative risk measure for each of these factors was statistically significant when examining true noncases versus true cases. Fur-thermore, the model had a sensitivity and speci-ficity of 72% and 73%, respectively. The cut points provide thresholds for how much or how little exposure created increased levels of risk. For example, a worker whose baseline func-tional performance is greater than 0.5 is 2.12 times more likely to have clinically meaningful decline in low-back function compared to a worker with a baseline score < 0.5. Table 3 also lists the relative risk for the model when consid-ering the true noncases and the nonmeaningful declines in low-back function. As expected, the model performance was poorer in this case with most individuals being predicted as true non-cases (i.e., specificity 91%). Finally, the daily model was also used on the nonmeaningful declines versus true cases. In this situation only the baseline functional performance relative risk was statistically significant. The model sensitiv-ity was 78% and specificity was 50%.
Table 4 lists the weekly model relative risk values as well as sensitivity and specificity for the true noncases versus true cases, true noncases versus nonmeaningful declines in low-back function, and nonmeaningful declines versus true cases. As with the daily model, the weekly model contains baseline functional performance, job satisfaction, and baseline worker age. The weekly model also contains integrated weekly duration of rest as well as peak × duration weekly sagittal acceleration. The relative risk values for true noncases versus true cases indicate that all the factors in the model were statistically signifi-cant. The sensitivity was 62% and specificity was 81%. The baseline functional performance
at OHIO STATE UNIVERSITY LIBRARY on March 14, 2014hfs.sagepub.comDownloaded from
36
TAB
LE 2
: Tru
nk L
oad
ing
, Po
siti
on,
and
Tim
ing
Var
iab
les
Mea
ns (s
tand
ard
dev
iati
ons
) and
p V
alue
s In
teg
rate
d D
aily
, Wee
kly,
and
Jo
b T
enur
e
Dai
ly In
teg
rate
dW
eekl
y In
teg
rate
dJo
b T
enur
e In
teg
rate
d
Vari
able
True
No
ncas
esTr
ue C
ases
p V
alue
True
No
ncas
esTr
ue C
ases
p V
alue
True
No
ncas
esTr
ue C
ases
p V
alue
Load
var
iab
les
Load
(N)
1109
56.8
(644
41)
1139
68.5
(677
65.7
).6
86†
4544
213.
8 (3
0496
5)44
7767
3.2
(310
4819
).8
4820
5628
43.7
(254
0631
5.0)
1845
8824
.5 (2
2929
443.
0).4
49D
ynam
ic li
ft f
orc
e (N
)10
2161
.8 (6
4463
.9)
1048
59.4
(682
01)
.718
†41
7390
2.8
(303
2890
)41
0042
4.6
(308
0287
).8
3218
8210
16.1
(246
0132
9.0)
1671
6517
.4 (2
2157
354.
0).4
34D
ynam
ic s
lide
forc
e (N
)39
595.
2 (2
2304
)41
483.
9 (2
4264
).4
70†
1613
173.
8 (1
0270
88)
1635
568.
1 (1
1036
54)
.852
7335
105.
3 (8
7589
66.0
)69
3080
8.9
(817
9874
.1)
.676
Dyn
amic
lift
/slid
e fo
rce
(N)
1163
96.2
(695
80)
1200
66.8
(740
55)
.650
†47
5383
9.3
(327
1170
)47
0800
6.8
(336
5786
).9
0321
4730
41.4
(270
5074
5.0)
1942
7949
.7 (2
4571
752)
.490
Stat
ic f
orw
ard
-ben
din
g
load
mo
men
t (N
m)
3616
3.5
(196
59)
3673
3.1
(194
35.7
).7
97†
1478
840.
3 (9
3108
1.4)
1437
254.
3 (8
9251
5.7)
.689
†67
0899
4.5
(787
0379
.0)
5857
516.
7 (6
6631
95.9
).2
09†
Stat
ic s
ide-
ben
d lo
ad
mo
men
t (N
m)
8026
.1 (4
601)
8239
.2 (4
819)
.688
†32
7914
.4 (2
1279
3)32
3154
.2 (2
1804
1).8
4514
8330
7.9
(176
6637
.0)
1322
836.
9 (1
5798
36.0
).4
05
Stat
ic t
rans
vers
e p
lane
lo
ad m
om
ent
(Nm
)37
704.
0 (2
0517
)38
325.
6 (2
0386
.6)
.789
†15
4157
3.7
(970
065)
1499
741.
4 (9
3525
2).7
00†
6989
659.
9 (8
1956
94.0
)61
1199
8.7
(696
8567
.0)
.300
†
Dyn
amic
fo
rwar
d-
ben
din
g lo
ad m
om
ent
(Nm
)
3353
6.6
(197
31)
3405
5.3
(197
86)
.817
†13
6800
6.7
(927
350)
1326
257.
7 (8
9228
1).6
8761
8630
9.9
(762
3083
.0)
5347
743.
9 (6
4431
30.2
).2
86
Dyn
amic
sid
e-b
end
ing
lo
ad m
om
ent
(Nm
)75
08.0
(463
6.6)
7705
.2 (4
882)
.713
†30
6090
.6 (2
1352
5)30
1086
.0 (2
1827
5).8
3813
7790
1.8
(172
1534
.0)
1216
639.
3 (1
5323
13.8
).3
90
Dyn
amic
tra
nsve
rse
pla
ne lo
ad m
om
ent
(Nm
)
3499
0.5
(205
99)
3555
7.6
(207
47)
.808
†14
2709
9.8
(966
690)
1385
030.
5 (9
3516
8).6
9864
4899
7.1
(794
1100
)55
8360
7.4
(673
9827
.7)
.291
Dyn
amic
fo
rwar
d-
ben
din
g r
esul
tant
(s
agit
tal)
mo
men
t (N
m)
3639
3.1
(203
58)
3741
5.8
(211
68)
.662
†14
8213
3.0
(955
682)
1453
491.
5 (9
4806
7).7
9166
8629
7.3
(805
2906
)59
0369
1.2
(697
3054
.7)
.368
†
Dyn
amic
res
ulta
nt
mo
men
t (N
m)
3809
3.7
(213
36.5
)39
183.
7 (2
2228
).6
57†
1551
451.
4 (1
0002
89)
1523
416.
6 (9
9678
8).8
0469
9757
5.9
(841
965)
6190
0926
.1 (7
3172
46.9
).3
75
Po
siti
on
vari
able
sSa
git
tal p
osi
tio
n (d
egre
es)
4011
5.9
(228
21)
3958
8.7
(210
51)
.834
1645
513.
8 (1
0763
90)
1559
742.
8 (9
8304
6).4
6873
6511
3.8
(861
0951
)59
8605
9.8
(643
5721
).0
98
Sag
itta
l fle
xio
n ve
loci
ty
(deg
./se
c.)
2507
4.9
(133
46)
2715
2.8
(150
81)
.192
†10
2382
0.6
(608
404)
1059
728
(673
638)
.617
†44
6167
7.4
(518
8137
)42
6991
0.1
(508
5815
).7
43
Sag
itta
l ext
ensi
on
velo
city
(deg
./se
c.)
–362
40.8
(217
28)
–361
27.4
(226
73.4
).9
64†
–147
8912
.6 (1
0018
53)
–142
3955
.4 (1
0028
91)
.629
–675
0997
.2 (8
2733
37)
–598
4103
.1 (7
4584
16)
.396
Sag
itta
l acc
eler
atio
n (d
eg/s
ec.2 )
2435
50.5
(138
070)
2574
55.2
(155
65)
.397
†99
2631
5.9
(629
7083
)10
1115
51 (6
9236
10)
.803
†44
2116
16.4
(537
0580
7)42
4417
52.7
(540
5175
4).7
72
Sag
itta
l dec
eler
atio
n (d
eg/s
ec.2 )
–236
922.
9 (1
3633
3)–2
5047
3 (1
5388
7).4
04†
–966
6468
.3 (6
2378
01)
–985
0806
.1 (6
8546
40)
.802
†–4
3241
334.
6 (5
3157
280)
–416
0705
5.5
(534
4935
8).7
87
(con
tinue
d)
at OHIO STATE UNIVERSITY LIBRARY on March 14, 2014hfs.sagepub.comDownloaded from
37
Dai
ly In
teg
rate
dW
eekl
y In
teg
rate
dJo
b T
enur
e In
teg
rate
d
Vari
able
True
No
ncas
esTr
ue C
ases
p V
alue
True
No
ncas
esTr
ue C
ases
p V
alue
True
No
ncas
esTr
ue C
ases
p V
alue
Late
ral r
ight
po
siti
on
(deg
rees
)64
92.7
(426
4)64
11.4
(429
9).8
67†
2689
08.4
(203
074)
2529
57.3
(187
736)
.476
1247
753.
1 (1
6232
86)
1026
720.
3 (1
2577
66)
.167
Late
ral l
eft
po
siti
on
(deg
rees
)–5
415.
4 (2
605)
–557
7.1
(277
8).5
93†
–220
332.
9 (1
1728
5)–2
1873
4.2
(125
024)
.907
†–9
6756
4.9
(101
3023
)–8
8111
1.8
(934
618)
.439
Late
ral r
ight
vel
oci
ty
(deg
/sec
.)30
047.
4 (1
5844
)30
966.
3 (1
7448
).6
22†
1232
799.
8 (7
4661
7)12
1844
0.6
(771
726)
.867
†55
5523
0.1
(644
3190
)49
9431
0.4
(584
1368
).4
27
Late
ral l
eft
velo
city
(d
eg./
sec.
)–3
0531
.6 (1
6164
)–3
0989
(175
06)
.809
†–1
2518
94.3
(760
335)
–122
0693
.6 (7
7769
6).7
20–5
6572
41.6
(654
9109
)–5
0222
45.5
(588
8074
).3
75
Late
ral a
ccel
erat
ion
(deg
/sec
.2 )27
0067
.3 (1
4480
4)27
8194
.6 (1
5383
).6
34†
1108
6387
.7 (6
8461
13)
1095
7192
.9 (7
0775
30)
.870
†49
9563
61.5
(586
2295
8)45
0384
46.7
(532
7499
3).4
44
Late
ral d
ecel
erat
ion
(deg
/sec
.2 )–2
7179
5.9
(145
514)
–278
521
(159
772)
.694
†–1
1149
028.
0 (6
8592
77)
–109
6844
3.0
(708
3316
).8
19†
–502
9470
1.5
(588
5784
1)–4
5140
64.0
(535
5269
3).4
25
Tim
ing
var
iab
les
Dur
atio
n (s
eco
nds)
1916
.24
(926
.1)
1902
.8 (9
73.4
).9
0078
621.
72 (4
4368
.46)
7462
0.88
(436
10.9
2).4
2435
4452
.71
(392
348)
3066
90.3
5 (3
3585
5).2
58D
urat
ion
of
rest
(s
eco
nds)
1134
5.5
(347
3.4)
1070
1.1
(339
1.2)
.099
†46
2939
.3 (1
7479
3.6)
4109
58.5
(156
558.
5)
.007
*†20
4708
5.02
(182
6062
)16
8770
9.38
(145
3216
).0
49*†
Dur
atio
n o
f g
et
(sec
ond
s)46
9.6
(236
.5)
439.
4 (2
32.5
).2
5819
258.
4 (1
1201
.2)
1730
3.3
(104
00.7
).1
1488
182.
92 (9
7405
)72
079.
89 (7
7083
).0
64
Dur
atio
n o
f ca
rry
(sec
ond
s)10
93.5
(560
.2)
1133
.2 (6
13.8
).5
47†
4481
0.3
(262
86.8
)44
249.
41 (2
7185
.7)
.853
1993
29.1
7 (2
2847
3)17
9729
.77
(209
242)
.097
Dur
atio
n o
f p
lace
(s
eco
nds)
353.
1 (1
93.9
)33
0.1
(178
.4)
.281
1455
3.1
(930
3.9)
1306
8.2
(812
1.5)
.141
6694
0.74
(777
47)
5488
0.85
(562
35)
.435
Not
e. U
nits
for
dai
ly in
teg
rate
d a
re p
er d
ay, u
nits
for
wee
kly
inte
gra
ted
are
per
wee
k, a
nd u
nits
for
job
ten
ure
are
over
the
ind
ivid
ual’s
tim
e on
the
job
.†C
ut p
oint
wen
t in
the
cor
rect
dire
ctio
n.*S
tati
stic
al d
iffer
ence
s b
etw
een
low
and
hig
h ri
sk.
TAB
LE 2
: (co
ntin
ued
)
(con
tinue
d)
at OHIO STATE UNIVERSITY LIBRARY on March 14, 2014hfs.sagepub.comDownloaded from
38 February 2014 - Human Factors
measure indicated the highest relative risk fol-lowed by the weekly sagittal acceleration expo-sure measure and weekly duration of rest are nearly identical at 1.69 and 1.64, respectively. The job satisfaction and the age measure had lower relative risk values than the cumulative exposure measures. The true noncases versus nonmeaningful decline group as well as the non-meaningful declines versus true cases results for the weekly model were similar to those of the daily model.
The job tenure multivariate model is shown in Table 5. The model contains the baseline
functional performance, integrated job tenure duration of rest, job tenure peak × duration of forward static load moment, baseline supervisor support, and baseline worker age. It should be pointed out that the forward static load moment had a confidence interval of 0.99 to 12.88, so it was not statistically significant. Table 2 indi-cates that only 9 of the job tenure variables cut in the correct direction. One of these measures was duration of rest, and all the other measures were used in models with the combination of baseline functional performance, baseline supervisor support, and worker age at baseline. However, none of the job tenure exposure measures that cut in the correct direction were statistically sig-nificant. To be consistent with the weekly and daily models that employed personal, psychoso-cial, and physical exposure measures, this model also employed these categories of variables. It is interesting to note that the relative risk values for baseline functional performance and dura-tion of rest were greater than those for the daily and weekly exposure models (Table 5).
Among the daily, weekly, and job tenure models there are some commonalities. First, all contain the baseline functional performance measure. Second, all three models contain the exposure measure duration of rest and the
Figure 2. Percentage of measures cutting in the correct direction as a function of the cumulative measure definition.
TABLE 3: Multivariate Relative Risk Model for Daily Exposure as a Function of Injury Group
Variable Name Cut Point
True Noncases vs. True Cases (reference group true noncases)
True Noncases vs. Nonmeaningful
Decline in Low-Back Function (reference
group true noncases)
Nonmeaningful Decline vs. True Cases (reference
group nonmeaningful loss)
Baseline functional performance
>0.5 2.12 (1.58–2.83) 1.52 (1.12–2.05) 1.80 (1.27–2.56)
Integrated daily duration of rest (seconds)
< 9886 1.41 (1.11–1.80) 1.43 (1.05–1.94) 1.17 (0.93–1.48)
Integrated forward static load moment (Nm)
>32217 1.28 (1.01–1.63) 1.45 (1.06–1.98) 0.99 (0.78–1.25)
Baseline job satisfaction
<2.5 1.34 (1.05–3.70) 1.18 (0.87–1.60) 1.15 (0.87–1.51)
Baseline age (years) 32 < age < 44 1.39 (1.13–1.72) 1.22 (0.90–1.64) 1.18 (0.93–1.49)Model sensitivity (%) 72 25 78Model specificity (%) 73 91 50
at OHIO STATE UNIVERSITY LIBRARY on March 14, 2014hfs.sagepub.comDownloaded from
Cumulative Spine loading 39
personal factor of age. The models differ on the specific psychosocial measure with the daily and weekly models containing job satisfaction variables, whereas the job tenure model con-tained supervisor support. Finally the second job
exposure measure was different for each model. The daily model contained forward static bend-ing moment calculated via the integrated signal, whereas the job tenure model included the for-ward static bending moment (calculated via
TABLE 5: Multivariate Relative Risk Model for Job Tenure as Function of the Injury Group
Variable Name Cut Point
True Noncases vs. True Cases (reference group true noncases)
True Noncases vs. Nonmeaningful
Decline in Low-Back Function (reference
group true noncases)
Nonmeaningful Decline vs. True Cases (reference
group nonmeaningful loss)
Baseline functional performance
>0.5 3.20 (2.17–4.71) 1.55 (1.14–2.09) 1.77 (1.24–2.52)
Integrated job tenure duration of rest (seconds)
<4186846 2.17 (1.14–4.12) 1.21 (0.78–1.87) 1.59 (0.86–2.94)
Peak*duration forward static load moment (Nm)
>1070282 3.56 (0.99–12.88) 1.07 (0.61–1.87) 2.75 (0.80–9.48)
Baseline supervisor support
<2.5 1.64 (1.04–2.60) 2.14 (1.20–3.81) 0.90 (0.62–1.32)
Baseline age (years) 32 < age < 44 1.47 (1.18–1.83) 1.20 (0.89–1.61) 1.17 (0.93–1.48)Model sensitivity (%) 66 18 75Model specificity (%) 76 95 52
TABLE 4: Multivariate Relative Risk Model for Weekly as Function of the Injury Group
Variable Name Cut Point
True Noncases vs. True Cases (reference group true noncases)
True Noncases vs. Nonmeaningful
Decline in Low-Back Function (reference
group true noncases)
Nonmeaningful Decline vs. True Cases (reference
group nonmeaningful loss)
Baseline functional performance
>0.5 2.95 (1.99–4.37) 1.55 (1.14–2.10) 1.68 (1.99–2.36)
Integrated weekly duration of rest (seconds)
<390718 1.64 (1.21–2.24) 1.22 (0.91–1.64) 1.35 (1.02–1.78)
Peak*duration weekly sagittal acceleration (deg/sec2)
>101349760 1.69 (1.16–2.46) 1.02 (0.49–2.13) 1.81 (1.17–2.82)
Baseline job satisfaction
<2.5 1.43 (1.08–1.89) 1.21(0.89–1.63) 1.22 (0.90–1.64)
Baseline age (years) 32 < age < 44 1.45 (1.17–1.81) 1.24 (0.92–1.66) 1.18 (0.95–1.47)Model sensitivity (%) 62 9 70Model specificity (%) 81 98 54
at OHIO STATE UNIVERSITY LIBRARY on March 14, 2014hfs.sagepub.comDownloaded from
40 February 2014 - Human Factors
peak × duration) and the weekly model included the sagittal acceleration (calculated via peak × duration). In comparing sensitivity and speci-ficity of the daily, weekly, and job tenure model, the daily model has the best balance between sensitivity and specificity. In addition, all the relative risk measures were statistically signifi-cant for the true noncases versus true cases. Thus, overall the daily model was selected as the best predictor of individual risk.
As shown in Tables 3 to 5, the most powerful component in these multivariate models of an individual low-back risk was the baseline func-tional performance, with a relative risk of 2.12 (CI = 1.58–2.83) for the daily exposure model, 2.95 (CI = 1.99–4.37) for the weekly model, and 3.20 (CI = 2.17–4.71) for the job tenure model. Most interesting, baseline functional performance was the only measure that was sta-tistically significant in the true noncases versus nonmeaningful decline as well as the nonmean-ingful decline versus true cases for daily, weekly, and the job tenure models. This further illus-trates the importance of baseline functional per-formance for predicting low-back health in the future.
dIScuSSIonThis effort has shed light on several impor-
tant aspects of low-back disorder risk interpre-tation as related to work. First, initial low-back status, as measured by a quantitative low-back
function measure (p(n)), is an important compo-nent of future low-back functional status. This is a measure of the initial condition of the worker’s back and represents a logical start point for risk interpretation. Although many ergonomics stud-ies declare that work risk can be minimized for all, this finding suggests that initial low-back functional status might be an often overlooked component of risk interpretation.
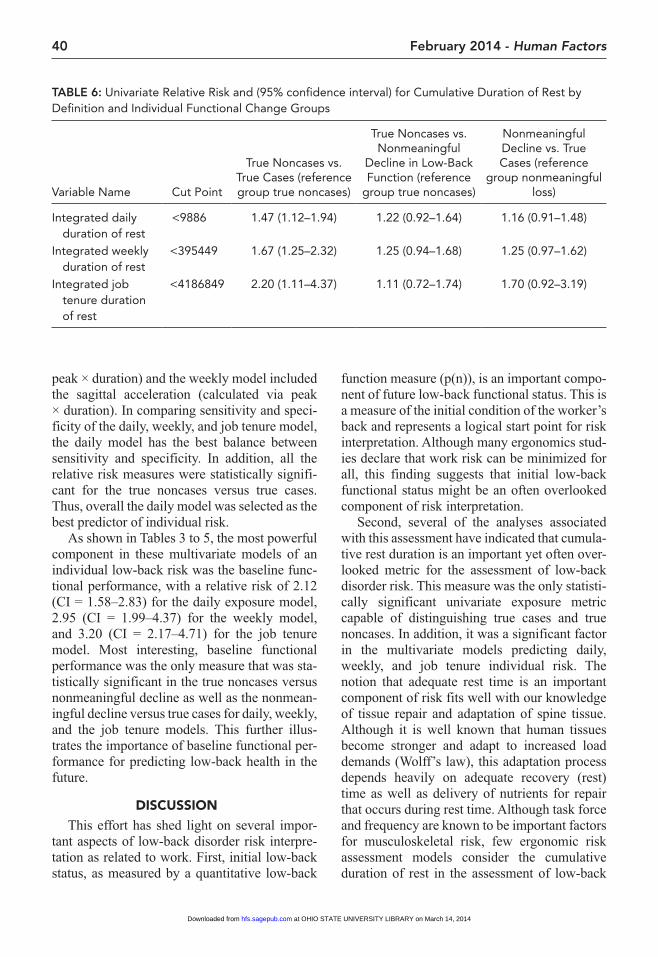
Second, several of the analyses associated with this assessment have indicated that cumula-tive rest duration is an important yet often over-looked metric for the assessment of low-back disorder risk. This measure was the only statisti-cally significant univariate exposure metric capable of distinguishing true cases and true noncases. In addition, it was a significant factor in the multivariate models predicting daily, weekly, and job tenure individual risk. The notion that adequate rest time is an important component of risk fits well with our knowledge of tissue repair and adaptation of spine tissue. Although it is well known that human tissues become stronger and adapt to increased load demands (Wolff’s law), this adaptation process depends heavily on adequate recovery (rest) time as well as delivery of nutrients for repair that occurs during rest time. Although task force and frequency are known to be important factors for musculoskeletal risk, few ergonomic risk assessment models consider the cumulative duration of rest in the assessment of low-back
TABLE 6: Univariate Relative Risk and (95% confidence interval) for Cumulative Duration of Rest by Definition and Individual Functional Change Groups
Variable Name Cut Point
True Noncases vs. True Cases (reference group true noncases)
True Noncases vs. Nonmeaningful
Decline in Low-Back Function (reference
group true noncases)
Nonmeaningful Decline vs. True Cases (reference
group nonmeaningful loss)
Integrated daily duration of rest
<9886 1.47 (1.12–1.94) 1.22 (0.92–1.64) 1.16 (0.91–1.48)
Integrated weekly duration of rest
<395449 1.67 (1.25–2.32) 1.25 (0.94–1.68) 1.25 (0.97–1.62)
Integrated job tenure duration of rest
<4186849 2.20 (1.11–4.37) 1.11 (0.72–1.74) 1.70 (0.92–3.19)
at OHIO STATE UNIVERSITY LIBRARY on March 14, 2014hfs.sagepub.comDownloaded from
Cumulative Spine loading 41
disorder risk. However, the duration of rest makes a great deal of sense from a physiologic standpoint. It may be that task frequency is sim-ply a surrogate for cumulative rest time. Rest time may have more meaning from a duty cycle standpoint than does task frequency. Certainly, this concept provides the underpinning for future investigations.
Third, although some daily, weekly, and job tenure cumulative measures all trended in the expected direction, many more daily exposures were trended in the expected direction than weekly or job tenure exposures. However, only cumulative job tenure and cumulative weekly rest time exposures were statistically different between the true cases and true noncases of a clinically meaningful decline in low-back func-tion in the univariate analyses. Table 6 shows the univariate relative risks associated with these rest duration exposure variables. This table indi-cates that the job tenure rest time had the highest relative risk with workers who are allowed less than 4,186,849 seconds (over their job tenure) being 2.2 times more likely to have a clinically meaningful decline in low-back function. The daily duration of rest had a relative risk of 1.47 for those with less than 9,886 seconds of rest per day. As expected the univariate rest mea-sures were not significant for true noncases ver-sus nonmeaningful declines or nonmeaningful declines versus clinically meaningful declines.
It is not surprising that the nonmeaningful decline in low-back function group did not sepa-rate well from the true noncases or the true cases. This group has shown a functional decline in low-back performance; however the decline has not reached the point of being a clinically mean-ingful decline. As such these individual workers should not be considered cases for this study. These individual workers may be at increased risk for further decline and should be monitored closely for further decline. In an ideal world the research would have captured another follow-up at 1 year to determine if these workers went on to become cases. However, given the high turn-over rates among DC workers it would be highly unlikely that workers would be available for fur-ther evaluation.
Collectively, these results indicate that we need to reconsider the meaning and role that
cumulative loading plays in low-back disorder risk. It appears that cumulative recovery time is equally as important, if not more important, to consider as cumulative loading of the tissue. Ergonomists need to consider the cumulative rest time available to the worker in a given work week.
AcknoWLedgMentSThis project was funded by the National Institute
for Occupational Safety and Health (NIOSH) via Grant No. 1UO1 OHO7313-01.
key PoIntS • A multivariate individual risk model contain-
ing initial low-back impairment (p(n)), cumula-tive rest time, cumulative loads, job satisfaction, and worker age predicted a clinically meaningful decline in low-back function well.
• Cumulative rest time during work was a key uni-variate indicator of a decline in low-back function.
• Daily definition of cumulative exposure typically produced the best risk models.
reFerenceSAdams, M. A., & Hutton, W. C. (1983). The effect of fatigue on the
lumbar intervertebral disc. Journal of Bone and Joint Surgery British, 65, 199–203.
Breiman, L., Friedman, J., Olshen, R., & Stone, C. (1984). Clas-sification and regression trees. Pacific Grove, CA: Wadsworth.
Brinkmann, P., Biggermann, M., & Hilweg, D. (1988). Fatigue fracture of human lumbar vertebrae. Clinical Biomechanics, 3(Suppl. 1), S1–S23.
Buckwalter, J. A. (1995). Aging and degeneration of the human intervertebral disc. Spine, 20, 1307–1314.
Callaghan, J. (2002, August). Cumulative loading as an injury mechanism: Tissue considerations. Paper presented at the fourth World Congress of Biomechanics, Calgary, Canada.
Callaghan, J. P. (2006). Cumulative spine loading. In W. S. Marras & W. Karwowski (Eds.), The occupational ergonomics hand-book: Fundamentals and assessment tools for occupational ergonomics (2nd ed., pp. 13.11–13.25). Boca Raton, FL: CRC-Taylor and Francis.
Callaghan, J. P., Salewytsch, A. M., & Andrews, D. M. (2001). An evaluation of predictive methods for estimating cumulative spinal loading. Ergonomics, 44, 825–837.
Courville, A., Sbriccoli, P., Zhou, B. H., Solomonow, M., Lu, Y., & Burger, E. L. (2005). Short rest periods after static lumbar flex-ion are a risk factor for cumulative low back disorder. Journal of Electromyography and Kinesiology, 15, 37–52.
Ferguson, S. A., & Marras, W. S. (2004). Revised protocol for the kinematic assessment of impairment. Spine Journal, 4, 163–169.
Ferguson, S. A., Marras, W. S., Burr, D. L., Woods, S., Mendel, E., & Gupta, P. (2009). Quantification of a meaningful change in low back functional impairment. Spine, 34, 2060–2065.
at OHIO STATE UNIVERSITY LIBRARY on March 14, 2014hfs.sagepub.comDownloaded from
42 February 2014 - Human Factors
Ferguson, S. A., Marras, W. S., Lavender, S. A., Splittstoesser, R. E., & Yang, G. (2014). Are workers who leave a job exposed to similar physical demands as workers who develop clinically meaningful declines in low back function? Human Factors, 56, 58–72.
Gallagher, S., Marras, W. S., Litsky, A. S., & Burr, D. (2005). Torso flexion loads and the fatigue failure of human lumbosacral motion segments. Spine, 30, 2265–2273.
Hansson, T. H., Keller, T. S., & Spengler, D. M. (1987). Mechani-cal behavior of the human lumbar spine. II. Fatigue strength during dynamic compressive loading. Journal of Orthopaedic Research, 5, 479–487.
Hoops, H., Zhou, B. H., Lu, Y., Solomonow, M., & Patel, V. (2007). Short rest between cyclic flexion periods is a risk factor for a lumbar disorder. Clinical Biomechanics, 22, 745–757.
Kerr, M. S., Frank, J. W., Shannon, H. S., Norman, R. W., Wells, R. P., Neumann, W. P., & Bombardier, C. (2001). Biomechanical and psychosocial risk factors for low back pain at work. Ameri-can Journal of Public Health, 91, 1069–1075.
Kumar, S. (1990). Cumulative load as a risk factor for back pain. Spine, 15, 1311–1316.
Liu, Y. K., Njus, G., Buckwalter, J., & Wakano, K. (1983). Fatigue response of lumbar intervertebral joints under axial cyclic loading. Spine, 8, 857–865.
Lotz, J. C. (2004). Animal models of intervertebral disc degenera-tion: Lessons learned. Spine, 29, 2742–2750.
Lotz, J. C., & Chin, J. R. (2000). Intervertebral disc cell death is dependent on the magnitude and duration of spinal loading. Spine, 25, 1477–1483.
Lu, D., Le, P., Davidson, B., Zhou, B. H., Lu, Y., Patel, V., & Solo-monow, M. (2008). Frequency of cyclic lumbar loading is a risk factor for cumulative trauma disorder. Muscle & Nerve, 38, 867–874.
Marras, W. S., Allread, W. G., Burr, D. L., & Fathallah, F. A. (2000). Prospective validation of a low-back disorder risk model and assessment of ergonomic interventions associated with manual materials handling tasks. Ergonomics, 43, 1866–1886.
Marras, W. S., Ferguson, S. A., Gupta, P., Bose, S., Parnianpour, M., Kim, J. Y., & Crowell, R. R. (1999). The quantification of low back disorder using motion measures: Methodology and validation. Spine, 24, 2091–2100.
Marras, W. S., Lavender, S. A., Ferguson, S. A., Splittstoesser, R. E., & Yang, G. (2010). Quantitative dynamic measures of physical exposure predict low back functional impairment. Spine, 35, 914–923.
Marras, W. S., Lavender, S. A., Ferguson, S. A., Splittstoesser, R. E., Yang, G., & Schabo, P. (2010). Instrumentation for measur-ing dynamic spinal load moment exposures in the workplace. Journal of Electromyography Kinesiology, 20, 1–9.
Marras, W. S., Lewis, K. E., Ferguson, S. A., & Parnianpour, M. (2000). Impairment magnification during dynamic trunk motions. Spine, 25, 587–595.
Marras, W. S., Parnianpour, M., Ferguson, S. A., Kim, J. Y., Crow-ell, R. R., Bose, S., & Simon, S. R. (1995). The classification of anatomic- and symptom-based low back disorders using motion measure models. Spine, 20, 2531–2546.
Min, H. (2007) Examining sources of warehouse employee turn-over. International Journal of Physical Distribution and Logis-tics Management, 37, 375–388.
National Research Council and Institute of Medicine. (2001). Mus-culoskeletal disorders and the workplace: Low back and upper extremity. Washington, DC: National Academy of Sciences, National Research Council, National Academy Press.
Norman, R., Wells, R., Neumann, P., Frank, J., Shannon, H., & Kerr, M. (1998). A comparison of peak vs cumulative physical work exposure risk factors for the reporting of low back pain in the automotive industry. Clinical Biomechanics, 13, 561–573.
Pinski, S. E., King, K. B., Davidson, B. S., Zhou, B. H., Lu, Y., & Solomonow, M. (2010). High-frequency loading of lumbar ligaments increases proinflammatory cytokines expression in a feline model of repetitive musculoskeletal disorder. Spine Journal, 10, 1078–1085.
Sbriccoli, P., Solomonow, M., Zhou, B. H., & Lu, Y. (2007). Work to rest durations ratios exceeding unity are a risk factor for low back disorder: A feline model. Journal of Electromyography and Kinesiology, 17, 142–152.
Seidler, A., Bolm-Audorff, U., Heiskel, H., Henkel, N., Roth-Kuver, B., Kaiser, U., . . . Elsner, G. (2001). The role of cumu-lative physical work load in lumbar spine disease: Risk factors for lumbar osteochondrosis and spondylosis associated with chronic complaints. Occupational and Environmental Medi-cine, 58, 735–746.
Seidler, A., Bolm-Audorff, U., Siol, T., Henkel, N., Fuchs, C., Schug, H., . . . Elsner, G. (2003). Occupational risk factors for symptomatic lumbar disc herniation: A case-control study. Occupational and Environmental Medicine, 60, 821–830.
Seidler, A., Euler, U., Bolm-Audorff, U., Ellegast, R., Grifka, J., Haerting, J., . . . Kuss, O. (2011). Physical workload and accelerated occurrence of lumbar spine diseases: Risk and rate advancement periods in a German multicenter case-control study. Scandinavian Journal of Work, Environment & Health, 37, 30–36.
Silverstein, B. A., Fine, L. J., & Armstrong, T. J. (1986). Hand wrist cumulative trauma disorders in industry. British Journal of Industrial Medicine, 43, 779–784.
Silverstein, B. A., Fine, L. J., & Armstrong, T. J. (1987). Occupa-tional factors and carpal tunnel syndrome. American Journal of Industrial Medicine, 11, 343–358.
Steinberg, D., & Colla, P. (1997). CART—Classification and regression trees. San Diego, CA: Salford Systems.
Urban, J. P., & Roberts, S. (2003). Degeneration of the interverte-bral disc. Arthritis Research and Therapy, 5, 120–130.
Urban, J. P., Smith, S., & Fairbank, J. C. (2004). Nutrition of the intervertebral disc. Spine, 29, 2700–2709.
Village, J., Frazer, M., Cohen, M., Leyland, A., Park, I., & Yassi, A. (2005). Electromyography as a measure of peak and cumula-tive workload in intermediate care and its relationship to mus-culoskeletal injury: An exploratory ergonomic study. Applied Ergonomics, 36, 609–618.
Yingling, V. R., & McGill, S. M. (1999). Anterior shear of spinal motion segments. Kinematics, kinetics, and resultant injuries observed in a porcine model. Spine, 24, 1882–1889.
William S. Marras is the Honda Professor in the Department of Integrated Systems Engineering at The Ohio State University with joint appointment in the Departments of Physical Medicine, Orthopaedic Sur-gery, and Biomedical Engineering. He is the director of the Biodynamics Laboratory and Center for Occupa-tional Health in Automotive Manufacturing (COHAM). He is also the co-executive director of the Ohio State University Institute for Ergonomics. He earned his PhD in bioengineering and ergonomics. He holds
at OHIO STATE UNIVERSITY LIBRARY on March 14, 2014hfs.sagepub.comDownloaded from

Cumulative Spine loading 43
fellow status in six professional societies and is a member of the National Academy of Engineering.
Sue A. Ferguson is a senior research associate engi-neer in the Department of Integrated Systems Engi-neering at The Ohio State University. She earned her PhD in biomechanics and rehabilitation from The Ohio State University in 1998. Her research centers around occupationally related low-back injuries, the risk factors of initial and recurrent episodes, the recovery process, and biomechanical effects of treat-ment. She has performed thousands of dynamic functional assessments on patients and workers using the lumbar motion monitors. She has more than 40 refereed journal articles.
Steven A. Lavender is an associate professor in the Integrated System Engineering Department and the Department of Orthopaedics at The Ohio State Uni-versity. He earned his PhD from The Ohio State Uni-versity in 1990 and took a position as a research sci-entist at Rush University Medical Center. He is the
director of the Orthopaedic Ergonomics Laboratory, where the research focuses on understanding the stresses placed on the body during occupational activities and how these stresses can be moderated through the design of targeted interventions.
Riley E. Splittstoesser is pursuing his PhD in indus-trial ergonomics in the Department of Integrated Systems Engineering at The Ohio State University. His research focuses on ergonomics, occupational biome-chanics, and the biochemical response to injury, with a special interest in the low back.
Gang Yang earned his bachelor’s of medicine and MD degrees from Peking University Health Science Cen-ter. He earned his PhD from The Ohio State Univer-sity. His research interests focus on biomechanics, ergonomics, and biomechanical mechanisms of work-related musculoskeletal disorders.
Date received: January 5, 2013Date accepted: June 17, 2013
at OHIO STATE UNIVERSITY LIBRARY on March 14, 2014hfs.sagepub.comDownloaded from