Embed Size (px)
Citation preview

Knowledge-Based Systems xxx (2013) xxx–xxx
Contents lists available at ScienceDirect
Knowledge-Based Systems
journal homepage: www.elsevier .com/ locate /knosys
Cumulative belief degrees approach for analyzing the competitivenessof the automotive industry
0950-7051/$ - see front matter � 2013 Elsevier B.V. All rights reserved.http://dx.doi.org/10.1016/j.knosys.2013.09.006
⇑ Corresponding author. Tel.: +90 212 2931300x2039.E-mail addresses: [email protected] (Ö. Kabak), [email protected] (F. Ülengin),
[email protected] (S�. Önsel), [email protected] (Ö. Özaydin), [email protected] (E. Aktas�).
Please cite this article in press as: Ö. Kabak et al., Cumulative belief degrees approach for analyzing the competitiveness of the automotive industry,Based Syst. (2013), http://dx.doi.org/10.1016/j.knosys.2013.09.006
Özgür Kabak a,⇑, Füsun Ülengin b, S�ule Önsel c, Özay Özaydin c, Emel Aktas� d
a Industrial Engineering Department, Istanbul Technical University, Macka, Istanbul 34367, Turkeyb Sabanci School of Management, Sabanci University, Orta Mah. Üniversite Cad. No: 27 Orhanli, Tuzla, Istanbul 34956, Turkeyc Industrial Engineering Department, Dogus University, Acibadem Zeamet Sok., Istanbul 34722, Turkeyd Business School, Brunel University, Kingston Lane, Uxbridge UB8 3PH, UK
a r t i c l e i n f o
Article history:Available online xxxx
Keywords:CompetitivenessAutomotive industryCumulative belief degreeCasual relationsPolicy making
a b s t r a c t
As traditional competition becomes global, businesses fail to take, on their own, the measures thatare required to become more competitive. Hence, in a globally competitive environment, nationalimprovement and competitiveness have also become vital. Businesses must utilize and be supportedby the international competitiveness of their nations. This study aims to analyze the competitivenessof the automotive industry from a national competitiveness perspective, using a three-stage methodol-ogy. For this purpose, a novel cumulative belief degrees (CBD) approach is introduced, to quantify thecausal relations among the variables in the system. This methodology is illustrated by the analysis ofthe Turkish automotive industry for developing suggestions to assist policymakers in their decisions toimprove the competitiveness of the industry. Although the findings are country specific, the methodologyis applicable to a wider range of industries in developed and developing countries.
� 2013 Elsevier B.V. All rights reserved.
1. Introduction
Competition at the international level has increased greatly insignificance for all countries since the globalization of the worldeconomy. The basic aim of policymakers is to bring the economyof their countries onto a competitive footing and, thus, to increasethe welfare of their society. Competitiveness is generally defined asthe set of institutions, policies and relevant factors that determinethe level of productivity of a country [3]. Each year, selected orga-nizations, such as the World Economic Forum (WEF) and the Insti-tute for Management Development (IMD), apply several hundredsof objective and subjective indicators to assess the wealth createdby the world’s nations and, subsequently, publish rankings of na-tional competitiveness. These rankings serve as a benchmark forpolicymakers and other interested parties, for judging the compet-itive success of their country within a global context.
As traditional competition becomes global, businesses fail totake the required measures on their own to become more compet-itive. In fact, an increase in competitiveness cannot be realizedbased solely on the effort of a specific industry. Hence, in a globallycompetitive environment, national improvement must also
become vital. Therefore, it is the responsibility of governments toincrease the competitive advantage of industries. To offer a com-petitive edge to firms, governments must take action to increasethe respective industry’s competitiveness, given the currentcompetitiveness level of the nation. According to Sala-i Martin[22], national competitiveness in terms of a macroeconomicenvironment, higher education level, labor market efficiency,financial market development, technological readiness, businesssophistication, and innovation level are very important for thesuccess of an industry.
When working at the industry level, there are a number of fac-tors, such as education, infrastructure, and business sophistication,that can be manipulated by the government to increase the indus-try’s competitiveness. Usually, such factors are interrelated, and itis a scientific problem to quantify the causal relationships amongthem. Initially, it is necessary to produce clarity and insight bymodeling and quantifying the causal relations among the factorsthat affect the competitiveness of an industry. Then, it will bepossible for governments to make informed policy decisions, toimprove the competitiveness of the industry in question.
In parallel with these assertions, this study analyzes the systemof the automotive industry, based on the assessment of thenational competitive advantage. The WEF indicators for thecompetitiveness of nations are considered to be the fundamentalsource of criteria for the competitiveness of the automotiveindustry. The factors that affect the competitiveness of an industry
Knowl.

2 Ö. Kabak et al. / Knowledge-Based Systems xxx (2013) xxx–xxx
are interrelated, and quantification of the causal relations amongthese factors emerges as a challenge that is addressed by thispaper.
This study aims to develop a decision-making tool to supportthe policymakers in their decisions to improve a given industry.The proposed methodology enables them to facilitate the selectionand prioritization of policies to be followed by their respectivegovernments. For the purpose of illustration, the methodology isapplied to the Turkish automotive industry. The main reason forselecting this industry is its locomotive effect on the whole econ-omy of most of the developed and developing countries, includingTurkey. This effect is mainly the result of its close relation withother industries in the economy. The automotive industry is themain buyer for the iron and steel, petrochemical, and tire indus-tries and is the driving force behind technological developmentin these industries. All of the types of motor vehicles that areneeded by the tourism, infrastructure, transport and agricultureindustries are produced by this industry. Therefore, any changein this industry deeply affects the economy as a whole, and hence,its competitiveness plays an important role for the country.
The secondary aim of this study is to propose a novel approach,called the cumulative belief degree (CBD) approach, for the quan-tification of causal relations among variables in a system. By usingthis approach, the competitiveness of the automotive industry canbe analyzed, based on the primary national competitiveness fac-tors that influence the automotive industry’s performance.
Therefore, the main contributions of this study can be listed asfollows:
� a novel approach for the quantification of causal relations;� a three-stage methodology for analyzing the competitiveness of
an industry; and� an application of the proposed methodology to the automotive
industry. For this aspect, the system of the automotive industryis structured, the causal relations in the system are quantifiedusing the CBD approach, and policy suggestions are developed.
This paper is organized as follows. The second section summa-rizes the related literature. The third section introduces the CBDapproach that is developed for the quantification of causalrelations in a system. The fourth section presents the details ofthe proposed methodology and provides its application to theTurkish automotive industry. Finally, the paper concludes withpolicy suggestions in the fifth section.
2. Literature review
2.1. Competitiveness of the automotive industry
There are few studies on assessing the competitiveness in anautomotive industry. Evidence from the Polish automotive indus-try suggests that the knowledge transfer from transnational corpo-rations improves the performance of local suppliers and,subsequently, their ability to compete [23]. Tcha and Kuriyama[27] analyze the effects of government policies on the Australian
Table 1Studies on the competitiveness of the automotive industry.
Determinants of competitive advantage Method
Exchange rate exposure EconomeGovernment policies EconomeQuality, delivery, flexibility, cost Survey, iIndustrial competitive conditions, governmental roles,
managerial resources, technology capabilitiesAnalytic
Knowledge transfer Survey, i
Please cite this article in press as: Ö. Kabak et al., Cumulative belief degrees appBased Syst. (2013), http://dx.doi.org/10.1016/j.knosys.2013.09.006
automotive industry, using a partial equilibrium model. Theauthors warn that the globalization of the world automotivemarket will decrease the prices, and consequently, the expectedwelfare effects of government policies will depend on each coun-try’s tariff rates as well as its manufacturing costs. In a similarstudy, Williamson [30] investigates the relationship betweenexchange rate exposure and competition in the automotive indus-try. Evidence supports the theoretical determinants of foreignexchange rate exposures for firms in the globally competitive auto-motive industry.
Sirikrai and Tang [24] suggest a four-level Analytical HierarchyProcess (AHP) model to analyze the competitiveness of theautomotive components industry in Thailand, where at the baselevel, the sub-elements of competitive conditions—namely, thegovernment roles, managerial resources and technological capabil-ities—are compared. However, owing to the nature of the methodemployed, this study cannot capture the interactions betweenthe variables of the model. A comparable study by Laosirihong-thong and Dangayach [14] presents an empirical analysis of theimplementation of manufacturing strategies in Thai and Indianautomotive manufacturing companies. In these countries, thepriorities of the companies when attempting to be competitiveare improving product and process-related quality and on-timedelivery.
Table 1 provides a summary of previous research that involvesattempting to explain the competitiveness of the automotiveindustry, including the methods used for that purpose.
This literature review shows that the indicators and drivers ofcompetitiveness are multifaceted in nature, with complex relation-ships. Therefore, single or a few aspects will not be sufficient to ex-plain competitiveness thoroughly at the industrial or nationallevel. In general, previous studies analyzed only the impact ofthe technology [8,29] or knowledge transfer [16] on the competi-tiveness. However, the competitiveness level of the industrydepends on the global competitiveness level of the related country.In the literature, this linkage is shown only for some specificindicators of global competitiveness, but this paper attempts toexplain industry level competitiveness, with a comprehensiveholistic approach encompassing all of the factors that constitutethe country-level competitiveness. The automotive industry isselected specifically, as an example to show this linkage, owingto its significant role in the economy. To highlight the relationshipbetween the global competitiveness of a country and the compet-itiveness of the industry of interest, a causal mapping approachcombined with a CBD approach is used in this study.
2.2. Causal mapping approach
Causal knowledge based on causal analysis increases the qualityof decision-making in most real-world situations [33]. Utilizingcausal modeling helps to develop an explanation of relationshipsand to provide a basis for inference [2]. It links strategic thinkingand acting, helps make sense of complex problems, and communi-cates these aspects to others [7]. Causal relationships can be usedeffectively to develop inferences for diagnostic reasoning from
Authors
tric models Williamson [30]tric models Tcha and Kuriyama [27]nferential statistics Laosirihongthong and Dangayach [14]al hierarchy process Sirikrai and Tang [24]
nferential statistics Simona and Axèle [23]
roach for analyzing the competitiveness of the automotive industry, Knowl.

Ö. Kabak et al. / Knowledge-Based Systems xxx (2013) xxx–xxx 3
effects to causes and for the prediction of outcomes that would fol-low from a policy or procedure intervention.
Causal knowledge is concerned with the configuration of agiven system and the way that its components work together toperform a specific task [1]. Causal maps visualize the relationshipsamong concepts by connecting them with labeled arrows. Thedetermination and quantification of the cause and effect relation-ship is not easy because the interaction between the cause andeffect is often complex and understated [15]. There is a variety ofdifferent techniques that are used for causal modeling. Bayesiannetworks and structural equation modeling (SEM) are among themost frequently used techniques for building causal maps [33].Graphical causal models can be used for constructing partial infor-mation, using observational data, even when some of the variablesin the causal graph are not measured [26].
A Bayesian network approach can be used to make inferences incausal maps [17]. There are a number of studies in which Bayesiancausal maps have been used to support policy making. For exam-ple, Bacon et al. [4] use a Bayesian Network approach to developeffective policies for more sustainable rural land use and develop-ment, incorporating several different stakeholder viewpoints anddemonstrating the crucial roles of beliefs and uncertainties indetermining the preferred options.
The SEM is a causal modeling approach that is based on causeand effect reasoning. It allows for simultaneous examination ofrelationships among multiple independent variables and multipledependent variables and estimates model parameters in latentvariables [12]. Thus, it can be used to make evaluations of a net-work of relationships between manifest and latent variables. SEMmodeling is widely used. However, it falls short of incorporatingmissing and fuzzy data, because it is built using available deter-ministic data.
The main difficulty with the models described above concernsthe impossibility of incorporating the uncertainty that is observedin real-life problems, whereas the causal model represents suchproblems. Usually, uncertainties are encountered in the parame-ters, initial conditions, and model structure (i.e., the relationsamong its variables, the functional forms, the causal influences,and delays), as well as the pertinence of the model (i.e., its levelof granularity, selection of variables, closeness, time scale; [6].
In this study, a CBD approach is used to alleviate the quantita-tive uncertainty by allowing fuzzy assessments of model parame-ters and conditions. As is well known, the strength of fuzzy logicis that it can mimic the ability of the human mind and applies thisability to employ modes of effective reasoning that are approxi-mate rather than exact [34]. Building on these ideas, the CBDapproach was developed originally for the evaluation of nuclearsafeguards, based on fuzzy linguistic terms and belief structure[10]. This approach is based on representing any information bya belief structure that uses linguistic terms. The basic strength ofthe approach is that it allows the user to aggregate data whenuncertainty arises. Moreover, it can handle data that are atdifferent scales as well as expert opinions in different formats.The CBD approach can also address values that are missing becauseof a lack of expertise or a scarcity of information. Finally, CBD helpsto perform analysis that uses linguistic terms, and it can providelinguistic results that are more understandable for thepolicymakers.
C
D A B
Fig. 1. An example of a system with four variables.
3. CBD approach for the quantification of causal relations
The CBD approach was developed initially for the evaluation ofnuclear safeguards [10]. This approach also has applications inmultiple-criteria decision-making problems [11,20]. The basic useof CBDs is to enable mathematical operations on belief structures.
Please cite this article in press as: Ö. Kabak et al., Cumulative belief degrees appBased Syst. (2013), http://dx.doi.org/10.1016/j.knosys.2013.09.006
In this research, CBDs are used to quantify the causal relationsamong the variables in the system. For example, suppose that anattempt is made to analyze the relations in a system that is com-posed of four variables, as given in Fig. 1. In the given system, Aand C are inputs and D is the output. The aim here is to quantifythe given relations (i.e., A ? B; B ? D; C ? D) in such a way thatinterpretations about the output can be made when the inputsare changed.
The relations in such a system can be quantified by the use ofpast data and/or expert opinions. In this approach, all of the dataand/or expert opinions that are used to quantify the relations areassumed to be represented by belief structures and linguisticterms. Given the fact that the information in most of the differentformats can be converted to belief structures without loss of infor-mation [10], this assumption is valid.
3.1. CBD defined
In this study, fuzzy linguistic terms [35] are used to representthe information by the belief structure. Let S = {si}, i 2 {0, . . . , m}be a finite and totally ordered term set. Any label, si, represents apossible value for a linguistic variable. The semantics of the finiteterm set S are given by fuzzy numbers, which are defined in the[0,1] interval, and by their membership functions. Linguistic termsets can be defined according to the nature of the problem. For thisstudy, the competitiveness indicators (variables in the system) areevaluated with a five-term set, S = {si}, i 2 {0,. . . , 4}, in which thefollowing meanings are assigned to the terms: s0: very low; s1:low; s2: medium; s3: high; and s4: very high.
The belief structure is used to represent the general belief of thelevel of an indicator, as a result of past data or expert evaluations.Therefore, if the past data of an indicator is available, then the fuz-zy linguistic sets are defined for the data as well as the member-ship degrees of evidence to the fuzzy sets. For example, considerthe instance with 20% to s1 and 80% to s2. In this statement, s1
and s2 are linguistic evaluation grades, and the percentage valuesof 20% and 80% are membership degrees that are referred to asthe degrees of belief, which indicate the extent to which thecorresponding grades are assessed. The above assessment can beexpressed as the following expectation:
BðI1Þ ¼ fð0:2; s1Þ; ð0:8; s2Þg ð1Þ
where B(I1) stands for the state of the level of the first indicator.Note that the belief degrees for linguistic terms s0, s3, and s4 arezero. Therefore, they are not shown in Eq. (1). In general, the beliefstructure can be defined as follows:
BðIkÞ ¼ fðbik; siÞ; i ¼ 0; . . . ;mÞg; 8k;Xm
i¼0
bik 6 1;8k ð2Þ
where k and i are indices for indicators and linguistic terms, respec-tively, and bik is the belief degree for the level of indicator k at thelevel si.
The CBD at certain linguistic term levels can be defined as theaggregated belief degrees with greater or equal terms with respect
roach for analyzing the competitiveness of the automotive industry, Knowl.

4 Ö. Kabak et al. / Knowledge-Based Systems xxx (2013) xxx–xxx
to the related linguistic term. The cumulative belief structure canbe defined as follows:
CðIkÞ ¼ fðcik; siÞ; i ¼ 0; . . . ;mÞg; 8k; cik ¼Xm
j¼i
bjk ð3Þ
where cik is CBD related to indicator k at threshold level i. Forexample, for B(I1) = {(0.2, s1), (0.8, s2)}, the corresponding cumula-tive belief structure is C(I1) = {(1, s0), (1, s1)(0.8, s2), (0, s3), (0, s4)},where c21, which is CBD related to linguistic term s2, is calculatedas follows:
c21 ¼ b21 þ b31 þ b41 ¼ 0:8þ 0þ 0 ¼ 0:8:
3.2. Proposed CBD approach
The proposed approach assumes that there is a system ofinterrelated variables (or indicators). The aim is to quantify therelations, given the past data or expert judgments that arerepresented by or converted to CBDs. Suppose that N is the set ofrelations between the indicators, such that if indicator l affectsindicator k, then (l,k) 2 N. Then, wkl
ij , the importance weight thatis related to the relation (l,k), is found by using the followingequation:
cik ¼X
ljðl;kÞ2N
X
j
cjlwklij 8i; k ð4Þ
where i and j are indices for linguistic terms (i corresponds toindicator k, and j corresponds to indicator l). Here, the CBD of anyindicator at each linguistic term set level is affected by CBDs ofthe affecting indicators at all of the linguistic term set levels.
The importance weights can be derived from the given dataand/or expert opinion as a regression-based model, as follows.
For k, which is an affected indicator; and for l, which is an affect-ing indicator of k.
Find wklij ;8i
By minimizingX
i
X
n
ðenikÞ
2
Subject to enik ¼ cn
ik �X
ljðl;kÞ2N
X
j
cnjlw
jlik
X
l
X
j
wklij ¼ 1 8i
wklij P 0; 8k; 8l; 8i; 8j
ð5Þ
where n is an index for the evident data, and enik is the error that is
related to dataset n for calculating cik. This model can be solved in away that is similar to a classical regression model (see [9], forfinding parameters in regression models) or by any non-linearoptimization method, such as Newton’s method (see [5], for detailsof the method.)
3.3. Illustrative example
For illustration purposes, assume that we have the system givenin Fig. 1, with the belief degrees in Table 2. To analyze the given
Table 2Belief degrees of the past data for the illustrative example.
n A B C D
1 {(s0, .8), (s1, .2)} {(s1, .6), (s2, .4)} {(s1, .9), (s2, .1)} {(s1, .8), (s2, .2)}2 {(s1, .6), (s2, .4)} {(s2, .7), (s3, .3)} {(s2,1)} {(s2, .9), (s3, .1)}3 {(s2, .4), (s3, .6)} {(s3, .5), (s4, .5)} {(s0,1)} {(s0, .3), (s1, .7)}4 {(s3, .5), (s4, .5)} {(s3, .2), (s4, .8)} {(s1, .5), (s2, .5)} {(s1, .1), (s2, .9)}5 {(s1, .4), (s2, .6)} {(s2, .5), (s3, .5)} {(s2, .2), (s3, .8)} {(s2, .2), (s3, .8)}
Please cite this article in press as: Ö. Kabak et al., Cumulative belief degrees appBased Syst. (2013), http://dx.doi.org/10.1016/j.knosys.2013.09.006
system, the proposed model is run for indicators B and D, whichare the affected indicators. As an example, the model is built forindicator D. For this purpose, the belief degrees are first convertedto CBDs, as in Table 3.
Then, the proposed model is formulated as follows:
For k ¼ D; l ¼ B;C;
Find wDBij ;w
DCij 8i; j
By minimizingX4
i¼0
X5
n¼1
ðenikÞ
2
Subject to eniD ¼ cn
iD �X
l¼B;C
X
j
cnjlw
jliD 8i;n
X
l¼B;C
X4
j¼0
wklij ¼ 1 8i
wDlij P 0; l ¼ B;C; 8i; 8j
ð6Þ
When the given model is solved by using the Excel Solver, theweights in Table 4 are found.
According to the results given in Table 4, because the sum ofthe weights related to indicator B and indicator C is 1.576(=.8 + .1 + .5 + .1 + .005 + .71) and 3.423 (=.1 + .099 + .299 + .001+ .001 + .26 + .663 + .079 + .901 + .020 + 1), respectively, indicatorD is mostly affected by C compared to B.
These weights can then be used to find the value of D whenthere are new input values for B and C. For example, if B is{(s3, .5), (s4, .5)} and C is {(s2, .6), (s3, .4)} (i.e., the related CBDsare IB = {(s0,1), (s1,1), (s2,1), (s3,1), (s4, .5)}, IC = {(s0,1), (s1,1), (s2,1),(s3, .4), (s4,0)}), then D is found to be {(s0,1), (s1,1), (s2,1), (s3,0.44),(s4,0)}. For example, c3D is calculated as follows:
c3D ¼X
l¼B;C
X
j
cjlwDl3j ¼ ðc0BwDB
30 þ c1BwDB31 þ c2BwDB
32 þ c3BwDB33
þ c4BwDB34 Þ þ ðc0CwDC
30 þ c1CwDC31 þ c2CwDC
32 þ c3CwDC33 þ c4CwDC
34 Þ¼ ð1 � 0þ 1 � 0þ 1 � 0þ 1 � 0þ :5 � 0Þ þ ð1 � 0þ 1 � 0þ 1 � :079þ :4 � :901þ 0 � :020Þ ¼ :44
When the CBD of D is converted to the belief structure in this exam-ple, the belief structure is found to be {(s2,56), (s3,0.44)}. Finally, thefollowing linguistic conclusion can be derived: if B is between high(s3) and very high (s4) and C is between medium (s2) and high (s3),then D will be between medium (s2) and high (s3).
The CBD approach introduced in this section is used as the sec-ond stage (quantification of causal relations) of the methodologyproposed in this paper. The details of the application process is ex-plained in Section 4.
4. Proposed methodology and its application to the Turkishautomotive industry
In this study, a three-stage methodology is proposed, to assessthe competitiveness of the Turkish automotive industry and toanalyze the impact of possible alternative policies (Fig. 2). In theproblem-structuring stage, WEF indicators related to the
Table 3CBDs for the illustrative example.
n B C D
s0 s1 s2 s3 s4 s0 s1 s2 s3 s4 s0 s1 s2 s3 s4
1 1 1 .4 0 0 1 1 .1 0 0 1 1 .2 0 02 1 1 1 .3 0 1 1 1 0 0 1 1 1 .1 03 1 1 1 1 .5 1 0 0 0 0 1 .7 0 0 04 1 1 1 1 .8 1 1 .5 0 0 1 1 .9 0 05 1 1 1 .5 0 1 1 1 .8 0 1 1 1 .8 0
roach for analyzing the competitiveness of the automotive industry, Knowl.
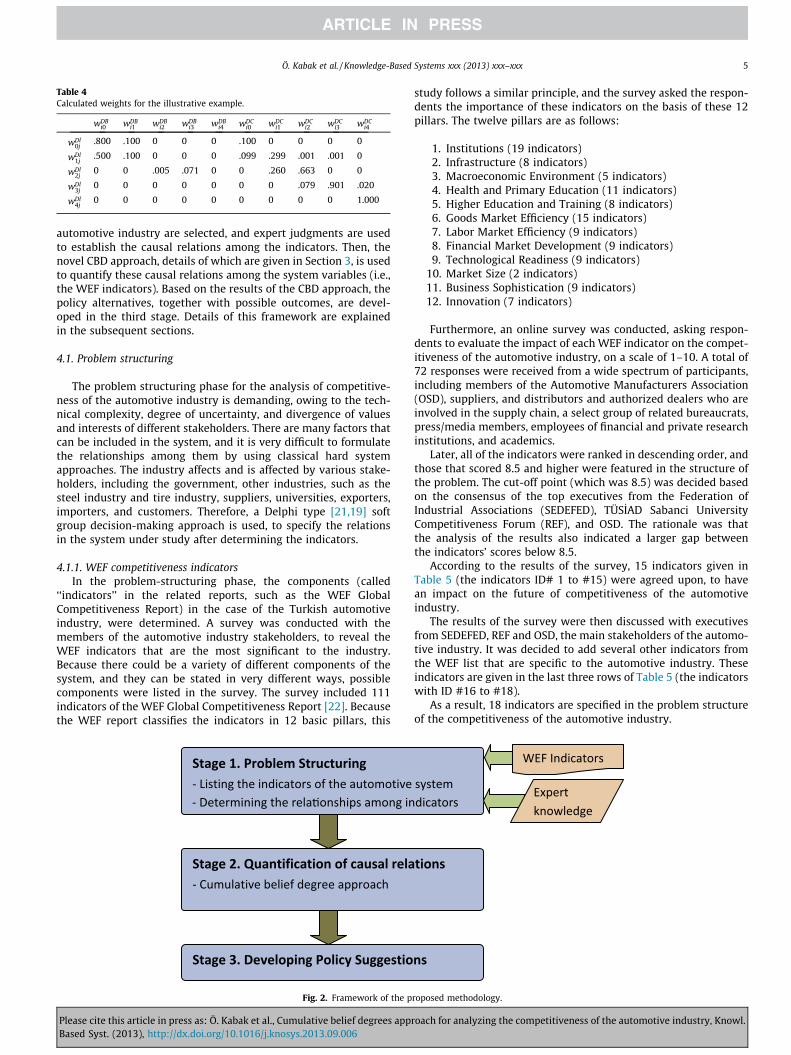
Table 4Calculated weights for the illustrative example.
wDBi0 wDB
i1 wDBi2 wDB
i3 wDBi4 wDC
i0 wDCi1 wDC
i2 wDCi3 wDC
i4
wDl0j
.800 .100 0 0 0 .100 0 0 0 0
wDl1j
.500 .100 0 0 0 .099 .299 .001 .001 0
wDl2j
0 0 .005 .071 0 0 .260 .663 0 0
wDl3j
0 0 0 0 0 0 0 .079 .901 .020
wDl4j
0 0 0 0 0 0 0 0 0 1.000
Ö. Kabak et al. / Knowledge-Based Systems xxx (2013) xxx–xxx 5
automotive industry are selected, and expert judgments are usedto establish the causal relations among the indicators. Then, thenovel CBD approach, details of which are given in Section 3, is usedto quantify these causal relations among the system variables (i.e.,the WEF indicators). Based on the results of the CBD approach, thepolicy alternatives, together with possible outcomes, are devel-oped in the third stage. Details of this framework are explainedin the subsequent sections.
4.1. Problem structuring
The problem structuring phase for the analysis of competitive-ness of the automotive industry is demanding, owing to the tech-nical complexity, degree of uncertainty, and divergence of valuesand interests of different stakeholders. There are many factors thatcan be included in the system, and it is very difficult to formulatethe relationships among them by using classical hard systemapproaches. The industry affects and is affected by various stake-holders, including the government, other industries, such as thesteel industry and tire industry, suppliers, universities, exporters,importers, and customers. Therefore, a Delphi type [21,19] softgroup decision-making approach is used, to specify the relationsin the system under study after determining the indicators.
4.1.1. WEF competitiveness indicatorsIn the problem-structuring phase, the components (called
‘‘indicators’’ in the related reports, such as the WEF GlobalCompetitiveness Report) in the case of the Turkish automotiveindustry, were determined. A survey was conducted with themembers of the automotive industry stakeholders, to reveal theWEF indicators that are the most significant to the industry.Because there could be a variety of different components of thesystem, and they can be stated in very different ways, possiblecomponents were listed in the survey. The survey included 111indicators of the WEF Global Competitiveness Report [22]. Becausethe WEF report classifies the indicators in 12 basic pillars, this
Fig. 2. Framework of the p
Please cite this article in press as: Ö. Kabak et al., Cumulative belief degrees appBased Syst. (2013), http://dx.doi.org/10.1016/j.knosys.2013.09.006
study follows a similar principle, and the survey asked the respon-dents the importance of these indicators on the basis of these 12pillars. The twelve pillars are as follows:
1. Institutions (19 indicators)2. Infrastructure (8 indicators)3. Macroeconomic Environment (5 indicators)4. Health and Primary Education (11 indicators)5. Higher Education and Training (8 indicators)6. Goods Market Efficiency (15 indicators)7. Labor Market Efficiency (9 indicators)8. Financial Market Development (9 indicators)9. Technological Readiness (9 indicators)
10. Market Size (2 indicators)11. Business Sophistication (9 indicators)12. Innovation (7 indicators)
Furthermore, an online survey was conducted, asking respon-dents to evaluate the impact of each WEF indicator on the compet-itiveness of the automotive industry, on a scale of 1–10. A total of72 responses were received from a wide spectrum of participants,including members of the Automotive Manufacturers Association(OSD), suppliers, and distributors and authorized dealers who areinvolved in the supply chain, a select group of related bureaucrats,press/media members, employees of financial and private researchinstitutions, and academics.
Later, all of the indicators were ranked in descending order, andthose that scored 8.5 and higher were featured in the structure ofthe problem. The cut-off point (which was 8.5) was decided basedon the consensus of the top executives from the Federation ofIndustrial Associations (SEDEFED), TÜS_IAD Sabanci UniversityCompetitiveness Forum (REF), and OSD. The rationale was thatthe analysis of the results also indicated a larger gap betweenthe indicators’ scores below 8.5.
According to the results of the survey, 15 indicators given inTable 5 (the indicators ID# 1 to #15) were agreed upon, to havean impact on the future of competitiveness of the automotiveindustry.
The results of the survey were then discussed with executivesfrom SEDEFED, REF and OSD, the main stakeholders of the automo-tive industry. It was decided to add several other indicators fromthe WEF list that are specific to the automotive industry. Theseindicators are given in the last three rows of Table 5 (the indicatorswith ID #16 to #18).
As a result, 18 indicators are specified in the problem structureof the competitiveness of the automotive industry.
roposed methodology.
roach for analyzing the competitiveness of the automotive industry, Knowl.

Table 5Indicators identified based on expert opinions.
ID#
Indicator Explanation Data type
1 Domestic market size index The size of the domestic market is constructed by taking the natural log of the sum of the gross domestic productvalued at the purchased power parity (PPP), plus the total value (PPP estimates) of the imports of goods andservices, minus the total value (PPP estimates) of the exports of goods and services. Data are then normalized on a1–7 scale. PPP estimates of imports and exports are obtained by taking the product of the exports as a percentageof the GDP and taking the GDP valued at the PPP
1–7 scale
2 Foreign market size index The size of the foreign market is estimated as the natural log of the total value (PPP estimates) of exports of goodsand services, which is normalized on a 1–7 scale. PPP estimates of exports are obtained by taking the product ofthe exports as a percentage of the GDP and the GDP valued at the PPP
1–7 scale
3 Capacity of Innovation This indicator is measured through WEF’s annual Executive Opinion Survey. It answers the question: In yourcountry, how do companies obtain technology? [1 = exclusively from licensing or imitating foreign companies;7 = by conducting formal research and pioneering their own new products and processes]
1–7 scale
4 Quality of scientific researchinstitutions
This indicator is measured through WEF’s annual Executive Opinion Survey. It answers the question: How wouldyou assess the quality of scientific research institutions in your country? [1 = very poor; 7 = the best in their fieldinternationally]
1–7 scale
5 Company spending on R&D This indicator is measured through WEF’s annual Executive Opinion Survey. It answers the question: To whatextent do companies in your country spend on R&D? [1 = do not spend on R&D; 7 = spend heavily on R&D]
1–7 scale
6 Availability of scientists andengineers
This indicator is measured through WEF’s annual Executive Opinion Survey. It answers the question: To whatextent are scientists and engineers available in your country? [1 = not at all; 7 = widely available]
1–7 scale
7 University-industrycollaboration in R&D
This indicator is measured through WEF’s annual Executive Opinion Survey. It answers the question: To whatextent do business and universities collaborate on research and development (R&D) in your country? [1 = do notcollaborate at all; 7 = collaborate extensively]
1–7 scale
8 Local supplier quality This indicator is measured through WEF’s annual Executive Opinion Survey. It answers the question: How wouldyou assess the quality of local suppliers in your country? [1 = very poor; 7 = very good]
1–7 scale
9 Production processsophistication
This indicator is measured through WEF’s annual Executive Opinion Survey. It answers the question: In yourcountry, how sophisticated are production processes? [1 = not at all; labor-intensive methods, or previousgenerations of process technology prevail; 7 = very; the world’s best and most efficient process technologyprevails]
1–7 scale
10 Firm-level technologyabsorption
This indicator is measured through WEF’s annual Executive Opinion Survey. It answers the question: To whatextent do businesses in your country absorb new technology? [1 = not at all; 7 = aggressively absorb]
1–7 scale
11 Availability of latesttechnologies
This indicator is measured through WEF’s annual Executive Opinion Survey. It answers the question: To whatextent are the latest technologies available in your country? [1 = not available; 7 = widely available]
1–7 scale
12 Ease of access to loans This indicator is measured through WEF’s annual Executive Opinion Survey. It answers the question: How easy isit to obtain a bank loan in your country with only a good business plan and no collateral? [1 = very difficult;7 = very easy]
1–7 scale
13 Extent and effect of taxation This indicator is measured through WEF’s annual Executive Opinion Survey. It answers the question: What impactdoes the level of taxes In your country, have there been incentives to work or invest? [1 = significantly limitsincentives to work or invest; 7 = has no impact on incentives to work or invest]
1–7 scale
14 Total tax rate This indicator is a combination of profit tax (% of profits), labor tax and contribution (% of profits), and other taxes(% of profits)
Percentage(%)
15 Degree of customerorientation
This indicator is measured through WEF’s annual Executive Opinion Survey. It answers the question: How docompanies in your country treat customers? [1 = generally treat their customers badly; 7 = are highly responsiveto customers and customer retention]
1–7 scale
16 Domestic automotive marketsize
The number passenger cars per 1,000 people. Data is provided by http://data.worldbank.org/. Passenger cars referto road motor vehicles, other than two-wheelers, intended for the carriage of passengers and designed to seat nomore than nine people (including the driver)
Numeric
17 Automotive foreign marketeffectiveness
Revealed Competitiveness Index for automotive industry. Data is provided from REF. It is equal to the logarithmicdifference between the Export Advantage Index and the Import Advantage Index. A positive value reflectscomparative advantage, whereas negative values reflect comparative disadvantage
Numeric
18 Automotive productionprocess sophistication
Revealed Comparative Advantage. This indicator is the ratio of automotive exports to total exports in the country.Data is provided from REF. This indicator is one of 9 parameters suggested by Turkish State Planning Institute. Thisparameter is calculated as: the (export level of a specific industry / the total export of the related country) / (theworld export level of the specific industry /the world total export level
Numeric
6 Ö. Kabak et al. / Knowledge-Based Systems xxx (2013) xxx–xxx
4.1.2. Relationships of the indicatorsAfter the indicators of the automotive industry are specified, it
is crucial to reveal connections among them to conceptualize therelationships among the components in the problem. The connec-tions of the indicators are revealed through a Delphi type [21,19],soft group decision-making approach.
A workshop with 29 participants was organized to obtain theperceptions of the stakeholders, related to the problem structure.Similar to the survey, the participants included a wide range ofacademics, key people from the automotive industry, non-govern-mental organizations/consultants, subsidiary industries, and publicand press figures, to enable different perspectives on the subject.The workshop lasted one full day and took place in four phases.In the first phase, an informative presentation on the study, theprocess and the indicators were given to the participants. In thesecond phase, the participants were grouped randomly, to ensurehomogeneity, and each group was asked whether there was a
Please cite this article in press as: Ö. Kabak et al., Cumulative belief degrees appBased Syst. (2013), http://dx.doi.org/10.1016/j.knosys.2013.09.006
connection among the indicators in a pair-wise manner. They wereinstructed to evaluate the relations on a scale of �3 to +3, wherethese concepts were featured in this relationship (see Table 6 forthe definitions of the scale).
After the second phase, the results of the groups were summa-rized in terms of the first quadrant, second quadrant, median, andamplitudes for every indicator in the survey. In the third phase, theparticipants were again given the previous survey, only this time,the results of all of the groups were provided as extra information.The participants were asked to compare their answers to the groupstatistics and to review their decisions. This stage enabled thegroups to think about different perspectives and to find out a com-promise on the relationships. The resulting causal map is given inFig. 3.
The final result of the workshop (i.e., the causal relations be-tween the indicators) is summarized in Table 7. The third columnof the table shows the relations between indicators. For example,
roach for analyzing the competitiveness of the automotive industry, Knowl.

Table 6Linguistic expressions used in the workshop.
Scale levels Linguistic expression
+3 Strong positive relation+2 Moderate positive relation+1 Weak positive relation
0 No relation�1 Weak negative relation�2 Moderate negative relation�3 Strong negative relation
Table 7Indicators and causal relations determined in Stage 1.
ID # Indicator Affecting indicator(s)
1 Domestic market size index 12, 13, 14, 162 Foreign market size index 1, 173 Capacity of Innovation 44 Quality of scientific research institutions 5, 65 Company spending on R&D 13, 146 Availability of scientists and engineers 137 University–industry collaboration in R&D 3, 4, 5, 148 Local supplier quality 3, 4, 119 Production process sophistication 5, 7, 8
10 Firm-level technology absorption 3, 5, 711 Availability of latest technologies 7, 1012 Ease of access to loans13 Extent and effect of taxation14 Total tax rate
Ö. Kabak et al. / Knowledge-Based Systems xxx (2013) xxx–xxx 7
#2 Foreign market size index is affected by #1 Domestic market sizeindex and #17 Automotive foreign market effectiveness.
15 Degree of customer orientation 916 Domestic automotive market size 8, 12, 13, 1417 Automotive foreign market effectiveness 1518 Automotive production process sophistication 10, 16, 17
Fig. 4. Fuzzy sets for transforming the data into a belief structure.
4.2. Quantification of causal relations
Relations found in the previous stage are quantified by using aCBD approach. For this purpose, the data on 28 countries are pro-vided, as obtained from the WEF [32] report, and are considered asinput. The data were initially normalized in a 0–1 interval (the bestscore is 1 and the worst score is 0), for the purpose of convertingthem to a belief structure. Then, the membership values of the nor-malized scores are calculated, according to the fuzzy sets definedin Fig. 4. These membership values constitute the belief degreesfor each datum. For example, if the normalized score is 0.55, thenthe related belief structure is B(I) = {(s2, .8), (s3, .2)} (see Fig. 4).
The proposed CBD approach is formulated for 15 indicators thatare affected by other indicators (i.e., all of the indicators except for#12, #13, and #14). For example, for indicator #9 productionprocess sophistication, the affecting indicators are #5 companyspending on R&D, #7 university-industry collaboration in R&D, and#8 local supplier quality. The weights are calculated using Eq. (5),as given in Table 8.
The results show that the sum of the weights for the indicators#5, #7, and #8 is 1.245, 1.170, and 2.585, respectively. Therefore,indicator #8 local supplier quality has the highest impact on #9production process sophistication.
Fig. 3. Causal map of th
Please cite this article in press as: Ö. Kabak et al., Cumulative belief degrees appBased Syst. (2013), http://dx.doi.org/10.1016/j.knosys.2013.09.006
In Table 9, the sums of the weights of the affecting indicators forall of the affected indicators are given. The weights given in thistable are used to find out which indicators are more important foran affected indicator. For example, for #1 domestic market size index,#12 ease of access to loans is the most important indicator. There-fore, policymakers should focus on making loans more accessible,
e system analyzed.
roach for analyzing the competitiveness of the automotive industry, Knowl.

Table 8Weight related to indicator #9 Production process sophistication.
w95i0 w95
i1 w95i2 w95
i3 w95i4 w97
i0 w97i1 w97
i2 w97i3 w97
i4 w98i0 w98
i1 w98i2 w98
i3 w98i4
w9l0j
.333 0 0 0 0 .333 0 0 0 0 .333 0 0 0 0
w9l1j
0 .324 0 0 0 0 .399 0 0 0 0 .337 0 0 0
w9l2j
0 0 0 0 0 0 0 0.201 0 0 0 0 .622 .247 0
w9l3j
0 0 0 0.190 0 0 0 0 .297 0 0 0 0 .513 0
w9l4j
0 0 0 0.234 0.164 0 0 0 0 0 0 0 0 0 .603
8 Ö. Kabak et al. / Knowledge-Based Systems xxx (2013) xxx–xxx
to improve the domestic market size. A similar interpretation canbe suggested to policymakers by using the weights in Table 9.
4.3. Validation of the results
Validation is a key issue in model-based research. In operationsresearch, validation has been interpreted differently, depending onthe epoch and context [13]. The validity of the models is an impor-tant concern, because decisions will be taken and resources will becommitted as a result of the models built. There are two ap-proaches to validity: (1) white box validity: the relationships be-tween the factors of the model are correct; and (2) black boxvalidity: the outputs produced by the model are expected giventhe inputs [18]. When the model employed is intended to be usedfor routine decision support, historical data and performance canbe used to achieve black box validity. On the other hand, it is usualto rely on white box validation, in which the assumptions of themodel and its parameters are examined critically when the modelis built and used to explore options for the system configurationthat do not exist. In this research, we employ both white box
Table 9Sums of the weights of the affecting indicators.
ID # Indicator ID #
1 Domestic market size index 12131416
2 Foreign market size index 117
3 Capacity of innovation 44 Quality of scientific research institutions 5
65 Company spending on R&D 13
146 Availability of scientists and engineers 137 University–industry collaboration in R&D 3
45
148 Local supplier quality 3
411
9 Production process sophistication 578
10 Firm-level technology absorption 357
11 Availability of latest technologies 710
15 Degree of customer orientation 916 Domestic automotive market size 8
121314
17 Automotive foreign market effectiveness 1518 Automotive production process sophistication 10
1617
Please cite this article in press as: Ö. Kabak et al., Cumulative belief degrees appBased Syst. (2013), http://dx.doi.org/10.1016/j.knosys.2013.09.006
validity and black box validity, to ensure that the model that wedeveloped serves its purpose and is valid to support the policymak-ers in their decisions. The white box validity is checked by an iter-ative model-building process that involves expert judgments, untilthe causal map of the system is obtained. Then, the black box valid-ity is employed to check that the model’s outputs perform as ex-pected, given the defined inputs of historical data.
To validate the model output performance (i.e., the weightsfound in the previous section), we estimate the level of the indica-tors, based on the recent data for Turkey. We select Turkey in thisanalysis because, first, we develop the policy suggestions for Tur-key in the next section, and second, we could only obtain Turkey’srecent data, especially for the three automotive-related indicators.
The WEF report-based data (i.e., data related on indicators1–15) are supplied by the WEF 2012–2013 Report [31]. Other dataare collected from the REF’s official webpage (http://Ref.sabanciu-niv.edu/databases). The related data and their CBDs are given inTable 10.
Then, we employed the weights found in the previous section toestimate the level of the indicators. For example, the weights
Affecting indicator Sum of the weights
Ease of access to loans 1.907Extent and effect of taxation 1.239Total tax rate 1.576Domestic automotive market size 0.278Domestic market size index 4.420Automotive foreign market effectiveness 0.580Quality of scientific research institutions 5.000Company spending on R&D 2.644Availability of scientists and engineers 2.356Extent and effect of taxation 3.141Total tax rate 1.859Extent and effect of taxation 5.000Capacity of innovation 0.746Quality of scientific research institutions 2.333Company spending on R&D 0.870Total tax rate 1.051Capacity of innovation 2.589Quality of scientific research institutions 0.696Availability of latest technologies 1.716Company spending on R&D 1.245University-industry collaboration in R&D 1.170Local supplier quality 2.585Capacity of innovation 1.505Company spending on R&D 2.019University-industry collaboration in R&D 1.476University-industry collaboration in R&D 1.906Firm-level technology absorption 3.094Production process sophistication 5.000Local supplier quality 2.658Ease of access to loans 0.631Extent and effect of taxation 0.599Total tax rate 1.112Degree of customer orientation 5.000Firm-level technology absorption 0.333Domestic automotive market size 1.487Automotive foreign market effectiveness 3.180
roach for analyzing the competitiveness of the automotive industry, Knowl.

Ö. Kabak et al. / Knowledge-Based Systems xxx (2013) xxx–xxx 9
presented in Table 8 are used to estimate the level of indicator #9.For linguistic term level s3, the following formula is used (note thatthe affecting indicators of #9 are #5, #7, and #8):
cf39 ¼
X
j¼5;7;8
X5
l¼0
w9l3jc
r3j
cf39 ¼ 0:190 � 0þ 0:297 � 0þ 0:513 � 0:47 ¼ 0:24
where f and r are superscripts for estimated (forecasted) and realdata, respectively. The actual and the estimated CBDs are presentedin Table 10.
The mean absolute error (MAE) measure is used to compare realdata and estimated data. Because all of the real data and the esti-mated data are CBDs, which can take on a value between 0 and1, normalization is not required. MAE is calculated for an indicatoras follows:
MAEk ¼1
mþ 1
Xm
i¼0
jcrik � cf
ikj
For example, MAE for the first indicator is found as follows:
MAE1 ¼1
mþ 1
Xm
i¼0
jcri1 � cf
i1j
¼ ð1� 1Þ þ ð1� 0:99Þ þ ð1� 0:76Þ þ ð0:8� 0:55Þ þ ð0� 0:06Þ5
¼ 0:11
MAE measures for all of the indicators are shown in Table 10. As areference, suppose that we have no knowledge about the level of anindicator. Then, all of the linguistic term options can be consideredto be possible. Therefore, the belief degrees for all linguistic termlevels can be assumed to be 1/m [10]. For a specific case, the beliefdegrees are considered to be 0.2. This case will lead to a CBD of {(s0-
,1.0), (s1,0.8), (s2,0.6), (s3,0.4)(s4,0.2)}. We find the MAE for eachindicator, assuming that the estimates are made with no knowl-edge. The results are shown in the last column of Table 10.
Because the errors of the model estimates are much better thanthe errors of the no-knowledge cases (see the last two columns ofTable 10), we can conclude that the model gives satisfactory re-sults. Therefore, we comfortably use the model to develop policysuggestions in the next section.
Table 10Data used for validation.
ID Data Normalizedscore
Turkey’s real data
Cumulative belief degrees
s0 s1 s2 s3 s4
1 5.2 0.700 1.00 1.00 1.00 0.80 0.002 5.4 0.733 1.00 1.00 1.00 0.93 0.003 3.4 0.400 1.00 1.00 0.60 0.00 0.004 3.4 0.400 1.00 1.00 0.60 0.00 0.005 3.2 0.367 1.00 1.00 0.47 0.00 0.006 4.5 0.583 1.00 1.00 1.00 0.33 0.007 3.6 0.433 1.00 1.00 0.73 0.00 0.008 4.7 0.617 1.00 1.00 1.00 0.47 0.009 4.4 0.567 1.00 1.00 1.00 0.27 0.0010 5.3 0.717 1.00 1.00 1.00 0.87 0.0011 5.4 0.733 1.00 1.00 1.00 0.93 0.0012 3.0 0.333 1.00 1.00 0.33 0.00 0.0013 3.0 0.333 1.00 1.00 0.33 0.00 0.0014 41.1 0.413 1.00 1.00 0.65 0.00 0.0015 5.4 0.733 1.00 1.00 1.00 0.93 0.0016 104 0.160 1.00 0.64 0.00 0.00 0.0017 0.53 0.588 1.00 1.00 1.00 0.35 0.0018 1.53 0.509 1.00 1.00 1.00 0.04 0.00
MAE: Mean Absolute Error, NK: no knowledge.
Please cite this article in press as: Ö. Kabak et al., Cumulative belief degrees appBased Syst. (2013), http://dx.doi.org/10.1016/j.knosys.2013.09.006
4.4. Developing policy suggestions
The weights found in the previous stages are used for analyzingthe current situation and possible different scenarios for the Turkishautomotive industry. Turkey’s current situation for the output indi-cators of the automotive industry are between very low and low({(s0, .46), (s1, .54)}) in #16 Domestic automotive market size,between medium and high ({(s2, .44), (s3, .56)}) in #17 Automotiveforeign market effectiveness, and between medium and high({(s2, .64), (s3, .36)}) in #18 Automotive production process sophistica-tion (see Table 8 and Fig. 5). Therefore, the first priority can begiven to improve the domestic automotive market size. Because ofthe fact that the local supplier quality has the highest impact on thisindicator (Fig. 5), the policymakers can focus on improving the qual-ity of local suppliers of the automotive industry. To accomplish thisgoal, further improvements can be considered with regard to thecapacity of innovation and the availability of the latest technologies.Another important criterion for the domestic automotive market isthe total tax rate. Despite the fact that Turkey’s tax rate (44.5%) isnot high compared to other competing countries, if the policymak-ers decrease the taxes, then the positive effect of this change onthe market size will help to improve the industry (see Fig. 5).
To reveal the specific effects of the different criteria, two scenar-ios are considered, based on Ulengin et al. [28]. Optimistic and pes-simistic scenarios are designed to analyze the performance of theautomotive industry in Turkey. In this scenario analysis, the inputindicators, namely #3, #5, #7, #8, #11, and #13, are selected basedon previous analysis of the industry [28]. The output indicators areperformance indicators of the automotive industry, namely, indica-tors #16, #17, and #18.
In the optimistic scenario, each input indicator is set to thenext upper linguistic term level. For example, the current levelof #3 innovation capacity is {(s1, .6), (s2, .4)}, which means that itis between low (s1) and medium (s2). It is assumed that Turkeyimproves its innovation capacity to a high level (s3) in the opti-mistic scenario. On the other hand, each input indicator dropsto a previous lower level in the pessimistic scenario. For example,Turkey’s innovation capacity is assumed to drop to a low level(s1) in the pessimistic scenario. The levels of input indicators inthe scenarios as well as the current levels are presented inTable 11.
Estimated data MAE – modelestimates
MAE – NK
Cumulative belief degrees
s0 s1 s2 s3 s4
1.00 0.99 0.76 0.55 0.06 0.11 0.241.00 1.00 1.00 0.94 0.18 0.04 0.271.00 1.00 0.40 0.00 0.00 0.04 0.161.00 1.00 0.84 0.30 0.01 0.11 0.161.00 1.00 0.67 0.23 0.03 0.09 0.191.00 1.00 0.99 0.43 0.02 0.03 0.171.00 1.00 0.55 0.04 0.00 0.04 0.191.00 1.00 1.00 0.61 0.00 0.03 0.171.00 1.00 0.85 0.24 0.00 0.04 0.191.00 1.00 1.00 0.49 0.00 0.08 0.251.00 1.00 1.00 0.91 0.12 0.03 0.27
1.00 1.00 1.00 0.51 0.00 0.09 0.271.00 0.74 0.56 0.30 0.05 0.20 0.271.00 0.99 0.96 0.20 0.00 0.04 0.171.00 0.86 0.60 0.27 0.02 0.16 0.23
Average MAE 0.07 0.21
roach for analyzing the competitiveness of the automotive industry, Knowl.

Fig. 5. Important criteria for the Turkish automotive industry.
10 Ö. Kabak et al. / Knowledge-Based Systems xxx (2013) xxx–xxx
The resulting levels of the output indicators are given in thelast three rows of Table 11 and in Fig. 6. The results areconsistent with the expectations because of the possibility ofoutput level increases in the optimistic scenario, whereasthere is a possibility of output level decreases in the pessimis-tic scenario.
According to the results, if Turkey shows the improvementdefined in the optimistic scenario, #16 Domestic automotive marketsize will be high (s3), with a value of .72, and very high (s4), with a
Table 11Level of the input and output indicators in the scenarios.
ID#
Type Indicators Current level Lev
3 Input Innovation capacity {(s1, .6), (s2, .4)} {(s3
5 Input Company spending on R&D {(s1, .67), (s2, .33)} {(s3
7 Input University-industry collaboration in R&D {(s1, .4), (s2, .6)} {(s3
8 Input Local supplier quality {(s2, .6), (s3, .4)} {(s4
11 Input Availability of latest technologies {(s3,1.0)} {(s4
12 Input Ease of access to loans {(s1, .93), (s2, .07)} {(s3
13 Input Extent and effect of taxation {(s1, .73), (s2, .27)} {(s3
16 Output Domestic automotive market size {(s0,.46), (s1,.54)} {(s3
17 Output Automotive foreign market effectiveness {(s2, .44), (s3, .56)} {(s1
18 Output Automotive production processsophistication
{(s2, .64), (s3, .36)} {(s0
Fig. 6. Level of output indic
Please cite this article in press as: Ö. Kabak et al., Cumulative belief degrees appBased Syst. (2013), http://dx.doi.org/10.1016/j.knosys.2013.09.006
value of .28, in terms of the belief degrees; #17 Automotive foreignmarket effectiveness will be very high (s4), with a value of .84 interms of the belief degree; and #18 Automotive production processsophistication will be very high (s4), with a value of .82 in termsof the belief degree. However, when the situation worsens (i.e., thepessimistic scenario), #16 Domestic automotive market size will de-crease to very low, with a value of .39, and low (s1), with a value of.41, in terms of the belief degrees. The level of the #17 Automotiveforeign market effectiveness will become very uncertain, but the
el in optimistic scenario Level in pessimistic scenario
,1.0)} {(s1,1.0)},1.0)} {(s1,1.0)},1.0)} {(s1,1.0)},1.0)} {(s2,1.0)},1.0)} {(s2,1.0)},1.0)} {(s1,1.0)},1.0)} {(s1,1.0)}, .72), (s4, .28)} {(s0, .39), (s1, .41), (s2, .17), (s4, .03)}, .01), (s2, .12), (s3, .03), (s4, .84)} {(s0, .19), (s1, .12), (s2, .52), (s3, .18)}, .01), (s1, .03), (s2, .12), (s3, .03), (s4, .82)} {(s0, .34), (s1, .19), (s2, .28), (s3, .17), (s4, .02)}
ators in the scenarios.
roach for analyzing the competitiveness of the automotive industry, Knowl.
Ö. Kabak et al. / Knowledge-Based Systems xxx (2013) xxx–xxx 11
highest belief is calculated for medium (s2), with a value of 0.52. Sim-ilarly, the pessimistic scenario made the #18 Automotive productionprocess sophistication very uncertain, because the possibility is dis-tributed to very low, low, medium, and high, almost evenly.
5. Conclusions
In this study, a three-stage methodology is proposed to analyzethe competitiveness of the automotive industry in Turkey. In thesecond stage of the methodology, a CBD approach is used to quan-tify the relations among the variables in the automotive industry.The results of the CBD approach are then used to make a scenarioanalysis of the Turkish automotive industry.
One of the novel contributions of this study is the use of the CBDapproach to quantify the relations among the variables in a system.The method can be applied to any data, as long as the data aretransformed into belief structures. This property can be usefulwhen different types of data are available in a single problem, suchas expert judgments, numerical values, and linguistic expressions.The applicability of the problem is justified by an illustrative exam-ple as well as by the automotive industry application.
Another important merit of the CBD approach is that what-if orscenario analysis can be conducted using linguistic terms. Most ofthe data-driven systems analysis approaches require exact data tomake what-if analyses. However, policymakers can find it difficultto generate exact data for such a type of analysis. Therefore, usinglinguistic terms will facilitate the analysis by making it easier andunderstandable for policymakers.
The current study uses only hard data, modeled through expertopinions, to find the strength of the relations among the indicators.It could be more reliable if the experts’ judgments were integratedinto the hard data, when making an analysis for a specific countryor industry. The CBD approach can effectively handle a situation inwhich the information comes from different sources.
Although the proposed methodology provided satisfactoryoutputs, its accuracy can be improved further. For example, in itscurrent state, the importance weights are calculated by using aregression-based method, which assumes linear relations.However, artificial intelligence methods, such as artificial neuralnetworks (ANNs), can be used, to omit the linearity assumption.In fact, ANNs form a class of nonparametric models that acquireknowledge under the conditions of noise and uncertainty. In doingso, they perform generalization and abstraction, and they createtheir own knowledge by self-organization [25].
Furthermore, user-friendly software can be developed to facili-tate the calculations of the proposed methodology. In this way, thewidespread usefulness and applicability of the proposed method-ology to other industries as well as to research domains other thancompetitiveness can be increased.
Acknowledgments
This research is supported by SEDEFED (Federation of IndustrialAssociations), REF (TÜS_IAD Sabanci University CompetitivenessForum), and OSD (Automotive Manufacturers Association). Theauthors would also like to mention the late Prof. Da Ruan for hisgreat contribution to developing the CBD approach.
References
[1] H. Al-Tabtabai, A framework for developing an expert analysis and forecastingsystem for construction projects, Expert Systems with Applications 14 (3)(1998) 259–273.
[2] R.D. Anderson, G. Vastag, Causal modeling alternatives in operations research:overview and application, European Journal of Operational Research 156(2004) 92–109.
Please cite this article in press as: Ö. Kabak et al., Cumulative belief degrees appBased Syst. (2013), http://dx.doi.org/10.1016/j.knosys.2013.09.006
[3] E.W. Artto, Relative total costs – an approach to competitiveness measurementof industries, Management International Review 27 (1987) 47–58.
[4] P.J. Bacon, J.D. Cain, M. Kozakiewicz, M. Brzezinski, A. Liro, Promoting moresustainable rural land use and development: a case study in Eastern Europeusing Bayesian network models, Journal of Environmental Assessment Policyand Management 4 (2) (2002) 199–240.
[5] D.P. Bertsekas, Nonlinear Programming, Athena Scientific Press, 1999.[6] P.M. Boulanger, T. Bréchet, Models for policymaking in sustainable
development: the state of the art and perspectives for research, EcologicalEconomics 55 (3) (2005) 337–350.
[7] J.M. Bryson, F. Ackermann, C. Eden, C. Finn, Visible Thinking: Unlocking CausalMapping for Practical Business Results, Wiley, Chichester, 2004.
[8] J.C. Guan, R.C.M. Yam, C.M. Mok, N. Ma, A study of the relationship betweencompetitiveness and technological innovation capability based on DEAmodels, European Journal of Operational Research 170 (2006) 971–986.
[9] J.F. Hair, W.C. Black, B.J. Babin, R.E. Anderson, R.L. Tatham, Multivariate DataAnalysis, sixth ed., Pearson Prentice Hall, USA, 2006.
[10] O. Kabak, D. Ruan, A cumulative belief degree-based approach for missingvalues in nuclear safeguards evaluation, IEEE Transactions on Knowledge andData Engineering 23 (10) (2011) 1441–1454.
[11] O. Kabak, D. Ruan, A comparison study of fuzzy MADM methods innuclear safeguards evaluation, Journal of Global Optimization 51 (2) (2011)209–226.
[12] Kaplan, D., 2000. Structural Equation Modeling: Foundations and Extensions.Advanced Quantitative Techniques in the Social Sciences Series 10. SagePublications, USA.
[13] M. Landry, J.L. Malouin, M. Oral, Model validation in operations research,European Journal of Operational Research 14 (3) (1983) 207–220.
[14] T. Laosirihongthong, G.S. Dangayach, A comparative study of implementationof manufacturing strategies in Thai and Indian automotive manufacturingcompanies, Journal of Manufacturing Systems 24 (2005) 2005.
[15] C.J. Lin, W.W. Wu, A causal analytical method for group decision-makingunder fuzzy environment, Expert Systems with Applications 34 (1) (2008)205–213.
[16] P.-L. Liu, W.-C. Chen, C.H. Tsai, An empirical study on the correlation betweenknowledge management capability and competitiveness in Taiwan’sindustries, Technovation 24 (2004) 971–977.
[17] S. Nadkarni, P. Shenoy, A Bayesian network approach to making inferences incausal maps, European Journal of Operational Research 128 (2001) 479–498.
[18] M. Pidd, Why modelling and model use matter, Journal of the OperationalResearch Society 61 (1) (2010) 14–24.
[19] G. Rowe, G. Wright, The Delphi technique: past, present, and future prospects– introduction to the special issue, Technological Forecasting and SocialChange 78 (2011) 1487–1490.
[20] D. Ruan, O. Kabak, R. Quinones, An ordered weighted averaging operator-basedcumulative belief degree approach for energy policy evaluation, InternationalJournal of Advanced Operations Management 5 (1) (2013) 58–73.
[21] A.E. S�ahin, Delphi technique and its uses in educational research, HacettepeÜniversitesi Egitim Fakültesi Dergisi 20 (2001) 215–220.
[22] X. Sala-i Martin, The Global Competitiveness Report 2011–2012. WorldEconomic Forum, Oxford University Press, New York, 2011.
[23] G.-L. Simona, G. Axèle, Knowledge transfer from TNCs and upgrading ofdomestic firms: the polish automotive sector, World Development 40 (2012)796–807.
[24] S.B. Sirikrai, J.C.S. Tang, Industrial competitiveness analysis: using the analytichierarchy process, Journal of High Technology Management Research 17(2006) 71–83.
[25] K.A. Smith, J.N.D. Gupta, Neural networks in business: techniques andapplications for the operations researcher, Computers & Operations Research27 (2000) 1023–1044.
[26] P. Spirtes, Graphical models, causal inference, and econometric models,Journal of Economic Methodology 12 (1) (2005) 3–34.
[27] M.J. Tcha, T. Kuriyama, Protection policy under economies of scale – thewelfare effects of tariffs on the Australian automotive industry, Journal ofPolicy Modeling 25 (2003) 655–672.
[28] Ulengin, F., Önsel, S�., Aktas�, E., Kabak, Ö., 2010. Automotive Sector Report(in Turkish), SEDEFED, Istanbul. <http://www.sedefed.org/documents/RK_2010_Raporlar_-_Otomotiv_Sektoru_Raporu_2010.pdf>.
[29] T.-Y. Wang, S.C. Chien, C. Kao, The role of technology development in nationalcompetitiveness – evidence from Southeast Asian countries, TechnologicalForecasting & Social Change 74 (2007) 1357–1373.
[30] R. Williamson, Exchange rate exposure and competition: evidence from theautomotive industry, Journal of Financial Economics 59 (2001) 441–475.
[31] World Economic Forum (WEF), 2012. Global Competitiveness, Report 2012–2013.
[32] World Economic Forum (WEF), 2010. Global Competitiveness, Report 2010–2011.
[33] W.W. Wu, Linking Bayesian networks and PLS path modeling for causalanalysis, Expert Systems with Applications 37 (2010) 134–139.
[34] L.A. Zadeh, Fuzzy logic, neural networks, and soft computing, Communicationsof the ACM 37 (3) (1994) 77–84.
[35] L.A. Zadeh, The concept of a linguistic variable and its application toapproximate reasoning, Information Sciences 8 (2) (1975) 301–357.
roach for analyzing the competitiveness of the automotive industry, Knowl.