Embed Size (px)
DESCRIPTION
Citation preview

Gaming Revenue Projections for the
Southeast Gaming Zone of Kansas
Presentation to Lottery Gaming Facility Review Boardby Will Cummings / Cummings Associates
July 24, 2008
1

Will E. Cummings Cummings Associates
2

Questions, Please! ( at any time )
3

OverviewProcess (in brief)Cummings ProjectionsDifferences from Penn National
(Morowitz) ProjectionsKey Difference: Spending vs. DistanceThe Evidence My Conclusion: Distance Matters
4

Gravity Models –
Science?Theory?Facts?
5

Gravity Models –
Science?Theory?Facts?All of the Above
6

“Gravity Models” – Overview
LocationLocationSizeEverything Else
7

Gravity Model(s) Updated
Separate Slot / Table ModelsPrecise LocationsPrecise SizesEverything Else . . .
“Power Ratings”
8

Precise Locations and Sizes
9

10

11

Updated “Power Ratings”
12

“Everything Else” 1
Micro-AccessSpaciousnessSlot MixFit & FinishManagementMarketing / Player Rewards
13

“Everything Else” 2
HotelStructured ParkingVariety of Dining ChoicesRetailEntertainment“Brand”
14

Updated “Power Ratings”
15

16
Exhibit 2: Gaming-Device "Power Ratings"(Total Annual Spending versus benchmark of $700)
Large Smaller CitiesUrban Markets & Misc. Markets Rural Markets
Deadwood, SD 129.9S Dakota Indian avg. (8) 124.7 eUpstate Michigan avg. 120.0 eColorado (2) 120.0Kansas Natives avg. 116.9 e
Mississippi / Louisiana 115.5
Terribles Lakeside. IA 113.4Horseshoe / Bluffs Run, IA 113.0 Diamond Jo Worth, IA 113.0
Iowa Natives average 112.0 eAmeristar Council Bluffs, IA 111.3
Upstate Wisconsin avg. 110.0 eMt. Pleasant, MI 109.9 e
Albuquerque, NM avg. 107.4 Metropolis, IL/KY 107.6 o IOC Marquette, IA 107.1 oHarrahs Council Bluffs, IA 106.6 Dubuque Greyh Park, IA 106.9Harrahs Joliet, IL 106.4 o Emmetsburg, IA 106.3
Other New Mexico avg. 105.7IOC Boonville, MO 105.6 oAtlantic City, NJ 104.3Riverside, IA 104.1
Harrahs NKCMO 103.4Wisconsin Dells 102.1 e
Prairie Meadows, IA 99.6 Mohegan Sun, CT 100.0 oIOC Waterloo, IA 99.6
Ameristar KCMO 98.6Michigan City, IN 97.9 Dubuque Riverboat, IA 97.4 oHarrahs W St Louis 97.1Argosy Riverside, MO 97.1Elgin (Chicago) IL 96.0 o Argosy Sioux City, IA 96.3 oJoliet Empress, IL 95.3 o Foxwoods, CT 95.6 o
Niagara (NY) casino 94.6IOC Bettendorf, IA 94.0 o
East St Louis, IL 93.7 o Southern Delaware 93.7
Midwest Standard +10%
"Midwest Standard"

17
Exhibit 4: Table-Game "Power Ratings"(Total Annual Spending versus benchmark of $95)
Large Smaller CitiesUrban Markets & Misc. Markets Rural Markets
Metropolis, IL/KY 118.9 oHammond, IN 114.7 o
Iowa Natives average 113.7 eAlbuquerque, NM avg. 113.1 ±Resorts, E Chicago IN 112.6 o
Harrahs Joliet, IL 110.5 oElgin (Chicago) IL 110.5 o Kansas Natives avg. 110.5 e
Michigan City, IN 108.4Louisville, KY/IN 108.4 o
Upstate Wisconsin avg. 105.3 eAurora (Chicago), IL 104.2 o Diamond Jo Worth, IA 104.2
Joliet Empress, IL 102.1 o Caruthersville, MO 102.1Cincinnnati (avg), OH/IN 101.8 oMajestic Star, Gary IN 101.1 oDetroit (avg / 3 facils) 100.0 oHorseshoe / Bluffs Run, IA 100.0 Terribles Lakeside. IA 100.0
Riverside, IA 97.9 Wisconsin Dells 97.9 eOther New Mexico avg. 97.4 ± Emmetsburg, IA 97.9
Ameristar Council Bluffs, IA 96.8 French Lick, IN 96.8
Harrahs NKCMO 94.7 b
Harrahs W St Louis 91.6 b IOC Boonville, MO 91.6 b o
E S L i IL 88 4
Midwest Standard +10%
"Midwest Standard"
Midwest Standard -10%

18
Detroit (avg / 3 facils) 100.0 oHorseshoe / Bluffs Run, IA 100.0 Terribles Lakeside. IA 100.0
Riverside, IA 97.9 Wisconsin Dells 97.9 eOther New Mexico avg. 97.4 ± Emmetsburg, IA 97.9
Ameristar Council Bluffs, IA 96.8 French Lick, IN 96.8
Harrahs NKCMO 94.7 b
Harrahs W St Louis 91.6 b IOC Boonville, MO 91.6 b o
East St Louis, IL 88.4 oArgosy Riverside, MO 87.4 b Evansville, IN 87.4 o
Argosy Sioux City, IA 87.4 oAmeristar KCMO 86.3 bHarrahs Council Bluffs, IA 86.3
Dubuque Greyh Park, IA 85.3Prairie Meadows, IA 83.2IOC Waterloo, IA 83.2
IOC Marquette, IA 82.1 oAmeristar St Chas, MO 81.1 b Green Bay, WI 81.1 e
Catfish Bend Burlington, IA 78.9
St Jo MO 72.6 oAdmiral / downtown St Louis 71.6 b oMilwaukee, WI 71.6 e o Peoria, IL 71.6 o
Dubuque Riverboat, IA 70.5 oIOC KCMO 69.5 b o IOC Bettendorf, IA 67.4 o
Mark Twain, MO 67.4 b oClinton, IA 67.4 o
Deadwood, SD 64.2 bJumers Rock Island, IL 58.9 o S Dakota Indian avg. (8) 57.9 e
Rhythm City, IA 48.4 oColorado (2) 35.8 b
e = estimatedo = old boat or capacity-constrained marketb = betting limits
"Midwest Standard"
Midwest Standard -10%

19
Exhibit 5: Assumptions for Kansas Projections
Harrah's Marvel Penn Penn Kansas City Mulvane Wellington Wellington Cherokee Dodge
Slot PerformanceHigh 107.0 110.0 116.0 116.0 107.0 117.0
Baseline 102.0 104.0 110.0 110.0 102.0 112.0
Low 97.0 98.0 104.0 104.0 97.0 107.0
Table PerformanceHigh 107.0 106.0 108.0 103.0 95.0 105.0
Baseline 102.0 98.0 100.0 95.0 90.0 100.0
Low 97.0 90.0 92.0 87.0 85.0 95.0
Note: 100 = "Midwest Standard." Higher slot baseline here typical of new facilities.

Southeast Zone
20

21

Cummings Projections:900 slots
1,400 slots*
“High”
$39.0
x
Baseline $32.0
$45.3
“Low”
$23.2 x
(all in 2007 $ million for Penn National’s Hollywood Casino)* And hotel, etc.
22

Cummings Projections (2007$)900 slots
1,400 slots*
“High”
$39.0
x
Baseline $32.0
$45.3
“Low”
$23.2 x
(all in 2007 $ million for Penn National’s Hollywood Casino)* And hotel, etc.
23

Cummings Projections (2013$)900 slots
1,400 slots*
“High”
$45.3
x
Baseline $37.2
$52.5
“Low”
$27.0 x
(all in 2013 $ million for Penn National’s Hollywood Casino)* And hotel, etc.
24

25
Exhibit 4: Penn's Cherokee Projections vs. Cummings's (2.5% escalation)
$0
$20
$40
$60
$80
$100
$120
2010 2011 2012 2013 2014 2015 2016
Note: Cummings projections for 2011 are for Phase One 900-slot facility -- for 2013 and later years, for Phase N 1400-slot facility (for 2012, intermediate)
Slot
+ T
able
Win
(no
poke
r pl
anne
d) ($
mn)
Penn C
C Low
C Base
C High

26
Exhibit 5: Penn's Cherokee Projections vs. Cummings's (5% escalation)
$0
$20
$40
$60
$80
$100
$120
2010 2011 2012 2013 2014 2015 2016
Note: Cummings projections for 2011 are for Phase One 900-slot facility --for 2013 and later years, for Phase N 1400-slot facility (for 2012, intermediate)
Slot
+ T
able
Win
(no
poke
r pl
anne
d) ($
mn)
Penn C
C Low
C Base
C High

Sources of Difference (2013$)Cummings Morowitz
Diff.
0-100 miles $30.1
$74.3
$44.2
100+ miles
$4.3 $13.2
$8.9
Drive-Bys
$2.8 $2.9 $0.1Area Hotels $0.0
$0.7
$0.7
Total $37.2 $91.0 $53.8(all $ million)
27

“Gravity Models” – Overview
LocationLocationSizeEverything Else
28

“Gravity Models” – Overview
Location ILocation IISizeEverything Else
29

Location II: Reilly’s Law
30

Reilly’s Law:
ms ~ S/d2
Where
ms :
market shareS :
casino size (capacity)
d : distance
31

Newton’s Law:
F = m/d2
Where
F : gravitational force
m : mass (of each body)
d : distance
32

Reilly’s Law:
ms ~ S/d2
Where
ms :
market shareS :
casino size (capacity)
d : distance
33

34
Little Difference in Projections for Market Share
0%
5%
10%
15%
20%
25%
30%
35%
Cheroke
e, KS
Jasp
er, M
OLa
wrence
, MO
Dade, M
OLa
bette
, KS
Barton
, MO
Barry,
MONew
ton, M
ONeo
sho,
KSMcD
onald
, MO
Craig,
OKNow
ata, O
KBento
n, AR
Crawfor
d, KS
Delaware, O
KOtta
wa, OK
Mayes
, OK
Penn
Che
roke
e M
arke
t Sha
re
CummingsMorowitz

Location I: The Closer, the Better
35

36
Substantial Differences in Spending per Adult
$0
$50
$100
$150
$200
$250
0 20 40 60 80 100 120
Distance from Penn Cherokee (miles)
Proj
ecte
d A
nnua
l Spe
ndin
g/A
dult
at P
enn
Che
roke
e
CummingsMorowitz

37
Projected Spending (Oklahoma Counties Omitted)
$0
$50
$100
$150
$200
$250
0 20 40 60 80 100 120
Distance from Penn Cherokee (miles)
Proj
ect A
nnua
l Spe
ndin
g/A
dult
at P
enn
Che
roke
e
CummingsMorowitz

Similar Divergence of Opinion in the South-Central Zone
38

39
Marvel: Modest Difference in Projections for Market Share -- in Kansas
0%
20%
40%
60%
80%
100%
0 20 40 60 80 100 120 140
Distance from Marvel Wellington (miles)
Mar
vel W
ellin
gton
Mar
ket S
hare
CummingsMarvel

40
Marvel: Substantial Differences in Market Share in Oklahoma
0%
20%
40%
60%
80%
100%
20 40 60 80 100 120 140 160
Distance from Marvel Wellington (miles)
Mar
vel W
ellin
gton
Mar
ket S
hare
CummingsMarvel

41
Marvel: More Significant Differences in Projected Spending Per Adult (Kansas)
$0
$100
$200
$300
$400
$500
$600
$700
$800
$900
$1,000
0 20 40 60 80 100 120 140
Distance from Marvel Wellington (miles)
Proj
ecte
d A
nnua
l Spe
ndin
g/A
dult
at M
arve
l Wel
lingt
on
CummingsMarvel

42
Marvel: Very Large Difference in Projected Spending from Oklahoma
$0
$50
$100
$150
$200
$250
$300
$350
$400
20 40 60 80 100 120 140 160
Distance from Marvel Wellington (miles)
Proj
ecte
d A
nnua
l Spe
ndin
g/A
dult
at M
arve
l Wel
lingt
on
CummingsMarvel

43
Harrah's Projected Gaming Revenue by Time/Distance Zone ($ million)
$65
$95
$27
$15$10 $9
$4
$14
$35
$0
$20
$40
$60
$80
$100
$120
0 to 20minutes
21 to 40minutes
41 to 60minutes
61 to 80minutes
81 to 100minutes
101 to 140minutes
(impeded)
101 to 140minutes
Out of market Overnight
Tota
l Gam
ing
Rev
enue
(Yea
r 3)

44
Cummings Projections for Harrah's by Time/Distance Zone ($ million)
$82
$90
$8 $6$2 $5
$9
$0
$20
$40
$60
$80
$100
$120
0 to 20minutes
21 to 40minutes
41 to 60minutes
61 to 80minutes
81 to 100minutes
101 to 140minutes
(impeded)
101 to 140minutes
Out of market Overnight
Tota
l Gam
ing
Rev
enue
(Yea
r 3)

45
Penn Wellington: Differences in Spending per Adult (Kansas only)
$0
$100
$200
$300
$400
$500
$600
$700
$800
$900
$1,000
0 20 40 60 80 100 120 140
Distance from Penn Wellington (miles)
Proj
ecte
d A
nnua
l Spe
ndin
g/A
dult
at P
enn
Wel
lingt
on
CummingsMorowitz

46
Penn Wellington: Differences in Projected Spending per Adult (Kansas only)
$0
$100
$200
$300
$400
$500
$600
$700
$800
$900
$1,000
0 200
( data sorted not by distance but by Cummings projection )
Proj
ecte
d A
nnua
l Spe
ndin
g/A
dult
at P
enn
Wel
lingt
on
CummingsMorowitz

47
Penn Wellington: Differences in Projected Spending per Adult (Oklahoma)
$0
$20
$40
$60
$80
$100
0 25
( data sorted not by distance but by Cummings projection )
Proj
ecte
d A
nnua
l Spe
ndin
g/A
dult
at P
enn
Wel
lingt
on
CummingsMorowitz

Location I: The Closer, the Better
=“Friction”
48

0.0
1.0
2.0
3.0
4.0
5.0
6.0
7.0
5.0 5.5 6.0 6.5 7.0 7.5 8.0 8.5
ln(distance)
ln(L
as V
egas
vis
itors
/000
0)
49
Las Vegas Visitation/Distance

Las Vegas: slope of the curve
y = -1.0082x + 10.75R2 = 0.9631
0.0
1.0
2.0
3.0
4.0
5.0
6.0
7.0
5.0 5.5 6.0 6.5 7.0 7.5 8.0 8.5
ln(distance)
ln(L
as V
egas
vis
itors
/000
0)
50

Mississippi: steeper slope
y = -1.4088x + 11.25R2 = 0.9353
0.0
1.0
2.0
3.0
4.0
5.0
6.0
7.0
3.5 4.0 4.5 5.0 5.5 6.0 6.5 7.0
ln(distance)
ln(M
issi
ssip
pi v
isito
rs/d
ay/0
000)
51

Laughlin: much steeper slope
y = -1.9121x + 16.299R2 = 0.9552
0.0
1.0
2.0
3.0
4.0
5.0
6.0
7.0
5.0 5.5 6.0 6.5 7.0 7.5 8.0 8.5
ln(distance)
ln(L
augh
lin v
isito
rs/0
000)
52

Casino X: isolated market
y = -0.8982x + 7.8944R2 = 0.6804
0.0
1.0
2.0
3.0
4.0
5.0
6.0
7.0
2.0 2.5 3.0 3.5 4.0 4.5 5.0 5.5 6.0 6.5
ln(distance from Casino X)
ln(a
djus
ted
annu
al s
pend
ing/
adul
t
53

Casino Y: competition afar
0.0
1.0
2.0
3.0
4.0
5.0
6.0
7.0
2.0 2.5 3.0 3.5 4.0 4.5 5.0 5.5
ln(distance from Casino Y)
ln(a
nnua
l spe
ndin
g/ad
ult)
54

Casino Y: less competition close
y = -0.886x + 8.0919R2 = 0.8505
0.0
1.0
2.0
3.0
4.0
5.0
6.0
7.0
2.0 2.5 3.0 3.5 4.0 4.5 5.0 5.5
ln(distance from Casino Y)
ln(a
nnua
l spe
ndin
g/ad
ult)
55

0.0
1.0
2.0
3.0
4.0
5.0
6.0
7.0
5.0 5.5 6.0 6.5 7.0 7.5 8.0 8.5
ln(distance)
ln(L
as V
egas
vis
itors
/000
0)
56
Las Vegas Visitation [ log-log ]

Las Vegas Visitation/Distance
0.0
5.0
10.0
15.0
20.0
25.0
0 500 1,000 1,500 2,000 2,500
Distance (miles)
Las
Veg
as V
isito
rs /
000
adul
ts

Mississippi Visitors/Day/000
0.0
4.0
8.0
12.0
16.0
20.0
0 100 200 300 400 500 600 700
Distance (miles)
Mis
siss
ippi
Vis
itors
/Day
/000
adu
lts

Casino X / players’ club data
$0
$200
$400
$600
$800
$1,000
0 50 100 150 200 250 300 350 400
Distance from Casino X (miles)
Ave
rage
Ann
ual S
pend
ing/
Adu
l

Casino Y: players’ club data
$0
$100
$200
$300
$400
$500
0 20 40 60 80 100 120
Distance from Casino Y (miles)
Ave
rage
Ann
ual S
pend
ing/
Adu
l

Casino Y: less competition close
y = -0.886x + 8.0919R2 = 0.8505
0.0
1.0
2.0
3.0
4.0
5.0
6.0
7.0
2.0 2.5 3.0 3.5 4.0 4.5 5.0 5.5
ln(distance from Casino Y)
ln(a
nnua
l spe
ndin
g/ad
ult)
61

Casino Y: players’ club data
$0
$100
$200
$300
$400
$500
0 20 40 60 80 100 120
Distance from Casino Y (miles)
Ave
rage
Ann
ual S
pend
ing/
Adu
l

Model vs. Real World
63
64
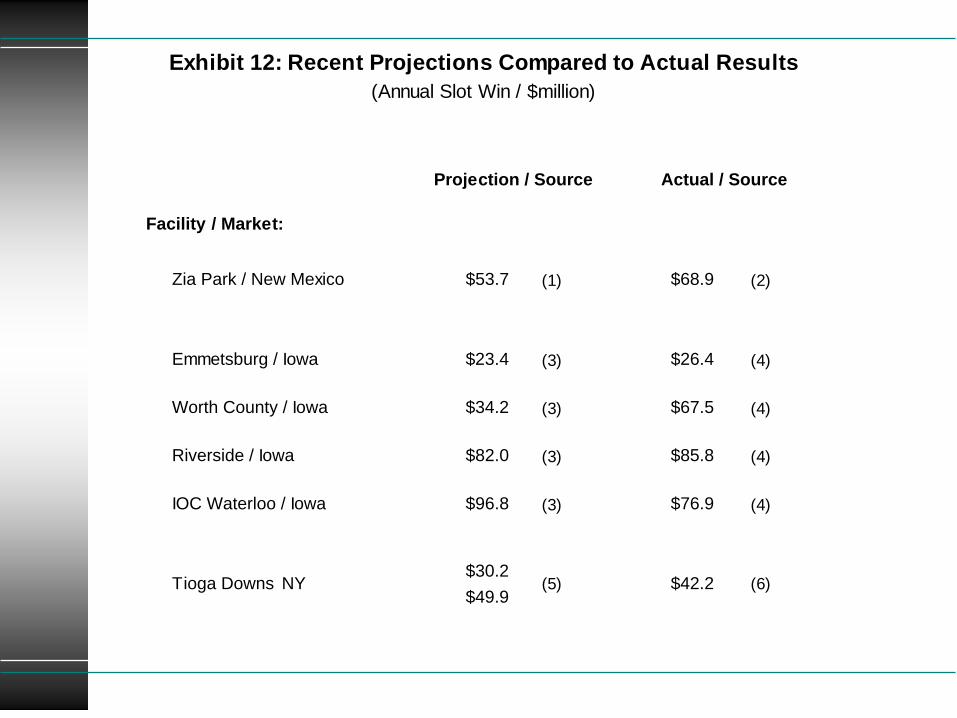
Exhibit 12: Recent Projections Compared to Actual Results(Annual Slot Win / $million)
Projection / Source Actual / Source
Facility / Market:
Zia Park / New Mexico $53.7 (1) $68.9 (2)
Emmetsburg / Iowa $23.4 (3) $26.4 (4)
Worth County / Iowa $34.2 (3) $67.5 (4)
Riverside / Iowa $82.0 (3) $85.8 (4)
IOC Waterloo / Iowa $96.8 (3) $76.9 (4)
$30.2$49.9
Tioga Downs NY (5) (6)$42.2

The Gaming Markets of Iowa:
Analyses and ProjectionsPresentation to the
Iowa Racing and Gaming Commission
Will E. CummingsCummings Associates
April 21, 2005

Testing the Models: What Happens With and Without Tama?
30

Gaming Revenues in 2004
25

68

69

70

With Tama,Market
Projection
Actual Change
Marquette -8.4%
-6.9%
Dubuque -5.3% -9.3%Clinton -4.1% -3.0%
Quad Cities
-3.4% -3.4%Catfish Bend
-5.7% -4.8%Prairie Meadows -9.5% -10.9%*
Lakeside -12.3% -7.0%*Bluffs/Omaha -0.5% +0.8%Sioux City -0.7% +10.4%*
31

If You Build It, They Will Come -- But How Far?
The “Distance Factor” in Regional Gaming Markets
Presentation to the 12th International Conference on Gambling & Risk-Taking
Will E. CummingsCummings Associates
May 30, 2003

Estimation ProceduresImpacts of distance relationships highly nonlinearEstablish reasonable values for “all other” parameters
demographicfacility, etc.
Vary the aggregate distance coefficientMeasure the (absolute) “error”

Results:
$0
$500
$1,000
$1,500
$2,000
$2,500
$3,000
0.3 0.4 0.5 0.6 0.7 0.8 0.9 1 1.1
Aggregate (negative) Distance Coefficient
Sum
of A
bsol
ute
Erro
rs ($
milli
on)

Casinos’ “Gravity” According to Reilly --
Amended
Presentation to the 13th International Conference on Gambling & Risk-Taking
Will E. CummingsCummings Associates
May 25, 2006[ With notes added May 30, 2006 ]

Segmentation by Distance
$106
$26
$79
$424
$0
$100
$200
$300
$400
$500
$600
10 20 30 40 50 60 70 80 90 100 110 120 130 140 150
Distance from Population in New Market (miles)
Ave
rage
Ann
ual S
pend
ing
/ Adu
lt
newdiv.old

Recent Work
77

Hoosier Park & Indiana Downs
78

79

80

Win/Slot/Day:Cummings June 2008Projection* Actual
Hoosier Park $376 $267
Indiana Downs $357 $245
* From “Projections for . . . ,”
September 8, 2007.
81

82

Downstream, Okla.
83

Projections for Downstream:
Cummings
Merrill Lynch *
$60 mn
$140 mn
* For FY09, in Note “Initiating Coverage,”
June 13, 2008.
84

Conclusion:
85

Spending Declines With Distance
12

Casino Y: players’ club data
$0
$100
$200
$300
$400
$500
0 20 40 60 80 100 120
Distance from Casino Y (miles)
Ave
rage
Ann
ual S
pend
ing/
Adu
l

Gaming Revenue Projections for the
Southeast Gaming Zone of Kansas
Presentations to Lottery Gaming Facility Review Boardby Will Cummings / Cummings Associates
July 24, 2008
89