Embed Size (px)
Citation preview
IZA DP No. 4116
Cultures, Clashes and Peace
Erin FletcherMurat Iyigun
DI
SC
US
SI
ON
PA
PE
R S
ER
IE
S
Forschungsinstitutzur Zukunft der ArbeitInstitute for the Studyof Labor
April 2009
Cultures, Clashes and Peace
Erin Fletcher University of Colorado
Murat Iyigun
University of Colorado, CID, Harvard University and IZA
Discussion Paper No. 4116 April 2009
IZA
P.O. Box 7240 53072 Bonn
Germany
Phone: +49-228-3894-0 Fax: +49-228-3894-180
E-mail: [email protected]
Any opinions expressed here are those of the author(s) and not those of IZA. Research published in this series may include views on policy, but the institute itself takes no institutional policy positions. The Institute for the Study of Labor (IZA) in Bonn is a local and virtual international research center and a place of communication between science, politics and business. IZA is an independent nonprofit organization supported by Deutsche Post Foundation. The center is associated with the University of Bonn and offers a stimulating research environment through its international network, workshops and conferences, data service, project support, research visits and doctoral program. IZA engages in (i) original and internationally competitive research in all fields of labor economics, (ii) development of policy concepts, and (iii) dissemination of research results and concepts to the interested public. IZA Discussion Papers often represent preliminary work and are circulated to encourage discussion. Citation of such a paper should account for its provisional character. A revised version may be available directly from the author.
IZA Discussion Paper No. 4116 April 2009
ABSTRACT
Cultures, Clashes and Peace*
Ethnic and religious fractionalization have important effects on economic growth and development, but their role in internal violent conflicts has been found to be negligible and statistically insignificant. These findings have been invoked in refutation of the Huntington hypothesis, according to which differences of ethnic, religious and cultural identities are the ultimate determinants of conflict. However, fractionalization in all its demographic forms is endogenous in the long run. In this paper, we empirically investigate the impact of violent conflicts on ethno-religious fractionalization. The data involve 953 conflicts that took place in 52 countries in Europe, Africa and the Middle East between 1400 CE and 1900 CE. Besides a variety of violent confrontations ranging from riots, revolts and power wars between secular sovereigns, the data cover religiously motivated confrontations. We document that countries in which Muslim on Christian wars unfolded more frequently are significantly more religiously homogenous today. In contrast, those places where Protestant versus Catholic confrontations occurred or Jewish pogroms took place are more fractionalized, both ethnically and religiously. And the longer were the duration of all such conflicts and violence, the less fractionalized countries are today. These results reveal that the demographic structure of countries in Europe, the Middle East and North Africa still bear the traces of a multitude of ecclesiastical and cultural clashes that occurred throughout the course of history. They also suggest that endogeneity could render the relationship between fractionalization and the propensity of internal conflict statistically insignificant. Finally, instrumenting for conflicts with some geographic attributes and accounting for the endogeneity of fractionalization with respect to ecclesiastical conflicts shows that religous fractionalization likely has negative effects on economic growth. JEL Classification: C72, D74, N33, N43, O10 Keywords: conflict, religion, institutions, economic development Corresponding author: Murat Iyigun University of Colorado at Boulder Department of Economics Campus Box 256 Boulder, CO 80309-0256 USA E-mail: [email protected]
* We gratefully acknowledge Rachel McCleary’s detailed comments and critique although, as usual, all errors and speculations are ours alone.
1. Introduction
Religious and ethnic fractionalization play a prominent role in the empirical growth
and development literature and have been repeatedly shown to have a wide array of
effects. In various studies, ethno-linguistic differences have been identified as having had
detrimental effects on sociopolitical cohesion, thereby eroding the quality of institutions,
the commensurate government policies and long-run economic growth.1 Religious frac-
tionalization, in contrast, often exerts a positive if not always statistically significant
effect on economic growth, presumably because such fractionalization is an indicator of
sociopolitical tolerance and religious freedoms.2
While the economic literature has identified that fractionalization has an indirect
influence on economic development and growth, a host of papers has shown that the
standard measures of ethnic or religious fractionalization have a quantitatively and sta-
tistically negligible impact on the propensity of violent conflicts within countries.3 It is
on this basis that economists and political scientists have often refuted the ‘Hunting-
ton hypothesis’ whereby differences of ethnic, religious and cultural identities are the
ultimate determinants of conflict.4
The observed levels of fractionalization are clearly endogenous in the long run.
Thus, the standard approach to estimating the impact of fractionalization on institutional
quality and economic growth has involved maintaining time horizons that are long enough
to isolate the impact of fractionalization on economic outcomes, but are also short enough
that measures of fractionalization remain more or less constant. In practice, this strategy
has yielded studies that cover two or three decades. Still, the extent to which ethnic,
linguistic or religious fractionalization evolves and changes over time is subject to some
debate, although there is more of a consensus that religious fractionalization is the most
malleable and responsive to changes in the external environment.5
In this paper, we examine the long-run determinants of contemporary fractionaliza-
1Easterly and Levine (1997), Alesina et al. (1999, 2003), La Porta (et al., 1999) and Mauro (1995).For a salient theoretical treatment, see Caselli and Coleman (2006).
2For further details, see Alesina et al. (2003).3Fearon and Laitin (2003), Collier and Hoeffler (2005, 2007), Miguel et al. (2004) and Ray (2005).4Huntington (1996).5See, for instance, Alesina et al. (2003). A dissenting view is provided by Campos and Kuzeyev
(2007) who argue that ethnic fractionalization evolved more rapidly than linguistic and religious frac-tionalization in 26 former communist countries over the period between 1989 and 2002.
1
tion across countries along ethnic, linguistic and religious dimensions. We particularly
focus on the impact of violent confrontations over the course of medieval and post-
Industrial Revolution history on religious fractionalization in Europe, the Middle East,
the Near East and North Africa. Covering 953 violent confrontations that took place
in 52 countries in the aforementioned geographies over half a millennium between 1400
and 1900 CE, we document that the frequencies and types of conflict influenced con-
temporary levels of religious and to some extent ethnic and linguistic fractionalization
too.
For example, we find that the frequency of Muslim on Christian wars within a
country’s borders is a statistically significant and positive predictor of its current levels
of religious homogeneity; an additional incidence of violent conflict between Muslim and
Christian players within the borders of a modern country would have been sufficient to
lower its current level of religious fractionalization anywhere between 5 to 10 percent.
In contrast, Protestant and Catholic confrontations within each country between the
15th and 19th centuries–and to some extent the incidence of Jewish pogroms too–
helped produce more modern-day religious fractionalization, with an additional Catholic
on Protestant confrontation accounting for more than 15 percent higher religious frac-
tionalization. In addition, the longer was the duration of all such conflicts and violence,
the less fractionalized are countries now.
These results are robust to the inclusion of various control variables such as geo-
graphic region dummies, distance to the equator and population. For instance, we verify
that distance from the equator is a predictor of ethnic and religious fractionalization,
with equatorial distance reducing both. It is also the case that certain geographic re-
gions that are currently more fractionalized religiously and ethnically than others–such
as the Balkans and Eastern Europe–also typically have been historical buffer zones in
which religious conflicts between Muslims and Christians or Protestants and Catholics
were fought with higher frequency as well as longer duration.
Our conclusions are also robust to incorporating a much longer time lag than
one century between the measurements of fractionalization and conflict data. In fact,
if anything, the empirical results are strengthened using specifications in which 502
observations on violent conflicts that occurred between 1400 to 1600 CE are used as the
2
basis of gauging the impact of historical conflicts on cross-country measures of religious
fractionalization at the turn of the 21st century.
These findings are relevant for assessing the Huntington hypothesis because they
demonstrate that the demographic structure of countries in Europe, the Middle East and
North Africa still bear the traces of a multitude of ‘ecclesiastical and cultural clashes’ that
occurred throughout the course of history. More specifically, those geographies where
clashes took place more often and with a longer duration between Muslim and Christian
‘civilizations’ are likely to be the areas that are more homogenous today. Whereas the
areas with a more frequent history of conflicts within the Judeo-Christian or Muslim ‘civ-
ilizations’ are more likely to be more heterogenous and fractionalized now. Accordingly,
modern-day fractionalization might simply be a manifestation of ethnic and religious
groups that have painfully learned to coexist. In contrast, a fairly homogenized coun-
try is likely to be a geography where the source of that homogeneity is a historically
persistent source of conflict that produced attrition and out-migration. Either way, the
likelihood of internal violence and conflict would be lower now, rendering the relation-
ship between fractionalization and the propensity of conflict within countries statistically
insignificant.
That ethnic, religious and linguistic cleavages within countries could be sources of
violent conflict and internal strife is by now part and parcel of the ubiquitous Huntington
hypothesis: “...conflicts occur between groups from different civilizations within a state
and between groups which are... attempting to create new states out of the wreckage of
the old.” What is relatively obscure, however, is that Huntington himself was, at least
implicitly, cognizant of the attenuating effects of conflicts in the long run:
“Many countries are divided in that the [ethnic, racial and religious] differ-
ences and conflicts among these groups play an important role in the politics
of the country. The depth of this division usually varies over time. Deep
divisions within a country can lead to massive violence or threaten the coun-
try’s existence. This latter threat and movements for autonomy or separation
are most likely to arise when cultural differences coincide with differences in
geographic location. If culture and geography do not coincide, they may be
made to coincide through either genocide or forced migration,” Huntington
3
(1993, p. 137, 208).
Given that the economics literature has long linked the institutional quality of
countries and their sociopolitical as well as economic stability to various forms of frac-
tionalization, a salient issue is whether conflicts and religious confrontations have a direct
impact on institutions and political systems, or if the impact of violence and religious
confrontations solely filters through fractionalization.6 While our analysis confirms that
ethnic and linguistic fractionalization has a detrimental impact on institutions and the
quality of polities across countries, there indeed exists a direct and statistically signifi-
cant impact of the history of violent conflicts–especially those of a religious nature–on
institutions and polities.
The fact that fractionalization is shown to evolve over time and the empirical work
below incorporates time lags of anywhere from one to four centuries between the con-
flict data and fractionalization observations ought to be sufficient to isolate the impact
of the former on the latter. But in interpreting empirical work on the relationship be-
tween fractionalization and economic outcomes, the conventional inclination is to explore
the potential channels of adverse impact via the role of fractionalization in generating
conflict. From this perspective, the direction of causality that we advocate here runs
counter to such traditional approaches. Be that as it may, it is important to acknowl-
edge that, if historical trends did exist over the very long periods we consider here, they
were in the direction of generating higher fractionalization, not less.7 As we shall soon
elaborate, given our main results–especially those involving the Muslim versus Chris-
tian confrontations–such a channel of reverse causality would produce an attenuation
bias. This is on account of the fact the argument of reverse causality establishes a pos-
itive effect, which runs from higher fractionalization to more frequent conflicts and vio-
lence. But in a variety of cases–most notably, regarding the impact of Muslim-Christian
confrontations–we find a negative impact of violent conflicts on fractionalization.
Furthermore, as we shall document in Section 3, the historical evidence suggests
6For the role of social divisions and fractionalization on stability and institutions, see Alesina, Baqirand Easterly (1999), Easterly and Levine (1997), Knack and Keefer (1995).
7Direct supporting evidence for the long term evolution of fractionalization is hard to come by.But for the medium term evolutions of ethnic, religious and linguistic fractionalization following thedisintegration of authoritarian socialist regimes, see Campos and Kuzeyev (2007).
4
that there were fundamental changes in the degree of religious and ethnic fractionalization
of the specific geographies we study below during the last century, let alone the five
centuries preceding it. In the Middle East, Europe, the Near East and parts of northern
Africa, which are subject to our analysis, medieval history reveals that religious pluralism
came mostly on the back of violent confrontations either due to international political
and religious rivalries or as a result of domestic religious splinters.8 This is all in the
way of arguing that, while fractionalization may be an accurate and significant predictor
of social and political conflicts in the short and the medium runs, fractionalization was
influenced by violent confrontations in the very long run.
All the same, violent ecclesiastical confrontations are plausibly endogenous too,
and it is possible that the historical patterns of ecclesiastical conflicts were shaped by
proximity–or lack thereof–to geographic regions that have been pivotal for Judaism,
Christianity and Islam, such as Jerusalem, Mecca and Rome. In that case, countries’
distance to these ecclesiastical centers could be used as instruments based on the premise
that spread and contractions of Judaism, Christianity and Islam historically were pre-
dominantly driven by conflicts, so as to make religious, ethnic and even linguistic frac-
tionalization functions of ecclesiastical conflict but not distance to the ecclesiastically-
pivotal cities. In this spirit, we ran 3-stage least squares IV regressions, in which we first
regressed ecclesiastical conflicts on distance to ecclesiastical centers, we then estimated
the impact of conflicts on fractionalization, and we subsequently identified the impact
of fractionalization on average economic growth rates. Doing so revealed a negative
and statistically significant effect of religious, ethnic and linguistic fractionalization on
economic growth.
2. Some Related Literature
In addition to the literatures referenced above, the work below relates to other strands in
the economics of religion and political economy. First, differences of religion have been
documented as important instigators of violent conflict. As Richardson (1960) has shown,
differences of Christianity and Islam, have been causes of wars and that, to a weaker
extent, “Christianity incited war between its adherents.” Similarly, Wilkinson (1980)
has claimed that “the propensity of any two groups to fight increases as the differences
8Iyigun (2008a, b).
5

between them (in language, religion, race, and cultural style) increase.” And the more
recent political science literature has supplied the view that religion and ethnicity are two
fundamental components of ‘culture capital’, the differences in which that can produce
wholesale ‘clash of civilizations’.9
The corollary of such findings were in fact articulated earlier by the likes of Mon-
tesquieu, Kant and Angell. Their ‘liberal peace’ view emphasized that “mutual economic
interdependence could be a conduit of peace.” Along these lines, Jha (2008) finds some
evidence of the view that differences in the degree to which Hindus and Muslims could
provide complementary, non-replicable services in the medieval maritime ports of India
explain the extent to which religious tolerance could be sustained over the long term. In
particular, he shows that medieval trading ports were 25 percent less likely to experience
a religious riot between 1850-1950, two centuries after Europeans eliminated Muslim ad-
vantages in trade. In a similar vein, Clingingsmith et al. (forthcoming) document that
the Muslim pilgrimage of Hajj increases observance of global Islamic practices while de-
creasing antipathy toward non-Muslims. Their evidence suggests that such changes are
due to the interactions among Hajjis from around the world during the Holy Pilgrimage.
Second, we have the political economy literature that incorporates conflict and
appropriation into models of production. Haavelmo (1954) was the first to articulate the
notion that appropriation and violent conflict over the ownership for resources should
be modeled as an alternative to economic production. Later contributions, such as
Hirshleifer (1991), Grossman (1994), Grossman and Kim (1995), Grossman and Iyigun
(1995, 1997), Skaperdas (1992, 2005), Alesina and Spolaore (2007) and Hafer (2006),
built on Haavelmo’s original ideas. The work below sits at the junction of these two
strands since it is based on the premise that religious, ethnic or more broadly cultural
differences could be driven by conflict and war.
There is also an active related strand in the economics of religion. Some papers in
this line focus on the supply side, emphasizing how religious norms and denominations
evolve (e.g., Barro and McCleary, 2005, Berman, 2000, Ekelund et al., 1996, Ekelund et
al., 2002, Iannaccone, 1992). Other papers, in contrast, discuss the demand side (Glaeser
9The culture capital view of religion has been advocated by, among others, Huntington (1996), Landes(1998), Ingelhart and Baker (2000).
6
and Sacerdote, 2003, Inglehart and Baker, 2000).
Yet another cluster of work on the economics of religion explores how adherence to
different faiths, such as Judaism, Islam or different denominations of Christianity, might
have influenced individual behavior and the evolution of sociopolitical institutions (e.g.,
Greif, 1993, 1994, 2006, Kuran, 2004a, 2005, Becker and Woessmann, 2009, Botticini and
Eckstein, 2005, 2007, Glaeser, 2005, Lewis, 2002, Guiso et al., 2003, 2006, Abramitzky,
2008 and Iyigun, 2007, 2008a, 2008b). More generally, this strand falls within the rubric
of the economics of culture which advocates the importance of cultural differences in
various economic outcomes (Landes, 1998, Temin, 1997, Fernandez et al., 2004, Fernan-
dez, 2007). The work below relates to this strand because it examines the longer-term
demographic ramifications of conflicts related to or driven by religious motives.
The remainder of this paper is organized as follows: In Section 3, we review the
historical background. In Section 4, we present the baseline findings. In Section 5,
we discuss issues of endogeneity as well as robustness, and present some alternative
specifications. In Section 6, we conclude.
3. Historical Background
Our measures of religious and ethnic fractionalization do not extend back in time for
us to control for the dynamics of fractionalization historically. As we have noted above,
however, there is somewhat of a consensus that religious fractionalization is more respon-
sive to the external environment than either ethnic or linguistic fractionalization. In any
case, we shall now provide some evidence that the geographic areas in the current domain
of the 52 countries in our study were most likely to have been uniformly homogenous
throughout the 16th century–if not until much later–than they are today.
To start with, consider Europe, the Middle East and North Africa at the turn
of the 15th century. At the time, Christianity had been split for close to three and
a half centuries along its eastern Orthodox and Roman Catholic denominations. And
the Nestorian as well as the Coptic Churches had already split from Rome close to a
millennium prior to 1400 CE. However, there was little if any geographic overlap in
the domain of each of these Christian denominations at the turn of the 15th century.
Moreover, while the precedents for the Protestant Reformation had been set in western,
northern and central Europe with the Cathar/Albigensian uprisings in 1177 CE as well
7
as the Waldensian movement in the same year, Europe west of the Balkan peninsula was
quite a homogenous ecclesiastical block within the domain–and under the monopoly–
of the Roman Catholic Church. (see Moore, 1994, and Rhodes, 2005). In England, it
was not until 1534 that fractionalization began in earnest with the Church of England
separating from the Roman Catholic Church during the reign of Henry VIII.10
In the east, the Ottoman empire had made significant territorial gains in the late
14th century, yielding the geographic areas within what is now Bulgaria, Romania and
most of eastern Greece to Ottoman control. The Ottomans followed the traditional
Islamic policy of religious tolerance toward the other ‘people of the book’. Jews, Chris-
tians and other believers of the one true God had the right of protection of their lives,
properties and religious freedoms provided that they accepted Ottoman rule and paid
the special head tax, cizye. Hence, there is not much on record to suggest that a large
number of Balkan Christians converted to Islam, with only some small minority groups,
such as the Bogomils of Bosnia, who had been persecuted under Christian rule, having
chosen to do so (Shaw, 1976, p. 19). Nor was there any significant amount of resettle-
ment by the Ottoman Muslims within the newly-acquired eastern European territories.
While the Balkans are currently one of the most religiously fractionalized geographic
regions covered in our study, there is much to suggest that this fractionalization was
fairly low and bounded by our contemporary standards throughout the 16th and the
17th centuries.11
At the turn of the 16th century, Spain looked like a most homogenous Catholic
country. Of course, that was on account of the Spanish Inquisition, under which Monarchs
Isabella I of Castile and Ferdinand II of Aragon had begun in 1478 to purge the Iberian
peninsula of all religions and Christian denominations except Roman Catholicism. While
the inquisition did not officially end until 1834 when Isabel II abolished it, the Muslims
and Jews of the peninsula as well as its Christians of rival denominations had relocated
10MacCulloch (2003, pp. 193, 194).11Along these lines, there is clear consensus that the Ottomans’ deliberate policies of low taxes and
religious toleration generally helped to augment religious and ethnic diversity of the Balkans and easternEurope (Kafadar, 1996, Shaw, 1976, and Karpat, 1974, Faroqhi, 2004, pp. 37 and 64).It is well known that the Ottomans were directly involved in aiding the relocation of Huguenots from
France to Moldavia, then an Ottoman territory. The Ottomans also indirectly supported the SerbianOrthodox immigrants againts the Hapsburgs in some Balkan protectorates.
8
out of the peninsula entirely by the early 16th century.12
All in all, the geographic areas we cover in this paper were much more homogenous
religiously, ethnically and linguistically in the 16th century, and even the 17th century.
There were two primary reasons for this: (i) The Protestant Reformation hadn’t yet oc-
curred and most splinter movements within Christianity had to remain underground until
late-16th century to mid-17th century, when Protestantism was officially recognized by
the Roman Catholic Church. (ii) The Balkans started to come under Ottoman influence
in the early 15th century, but the Ottoman control of the peninsula was not complete
until much later in the early-16th century. Thus, even though the Balkans started to
became religiously and ethnically fractionalized relatively early on, they were fairly ho-
mogenous throughout the 16th century and even much later due to the Ottomans’ fiscal
policies and the decentralized nature of their authority. Moreover, those regions that
were most fractionalized at that time included the Balkans as well as northern and west-
ern Europe, which are the regions that are still some of the most fractionalized today
(more on which below).
In this context, one also needs to bear in mind that fractionalization data are
driven, to some significant extent, by the political regimes in effect. In more repressive
regimes, the measured fractionalization rates are more likely to be lower than the actual
measures.13 Hence, the fact that the time period and geographic areas we investigate
were unambiguously much less democratic and typically much more repressive prior to
1900 and most certainly before 1600 also suggests more homogeneity back in time.
4. The Empirical Analysis
4.1. Data and Descriptive Statistics
The primary data source of violent conflicts is the Conflict Catalog by Brecke (1999).
It is a comprehensive dataset on violent conflicts in all regions of the world between
1400 CE and the present. It contains a listing of all recorded violent conflicts with a
Richardson’s magnitude 1.5 or higher that occurred on five continents.14 These data are
12Landes (1998, p. 139).13Alesina et al. (2003).14Brecke uses the definition of violent conflicts supplied by Cioffi-Revilla (1996): “An occurrence of
purposive and lethal violence among 2+ social groups pursuing conflicting political goals that results infatalities, with at least one belligerent group organized under the command of authoritative leadership.
9
still under construction, but they are virtually complete for Europe, North Africa and
the Near East. We rely on this portion.
For each conflict recorded in the catalog, the primary information covers (i) the
number and identities of the parties involved in the conflict; (ii) the common name for
the confrontation (if it exists); and (iii) the date(s) of the conflict. On the basis of these
data, there also exists derivative information on the duration of the conflict and the
number of fatalities, but the latter are only available for less than a third of the sample.
We worked with two cuts of this dataset: one, which covered the five centuries be-
tween 1400 and 1900 CE, and another that spanned the two hundred years between 1400
and 1600 CE. The broader, half a millennium cut yielded a total of 953 conflicts, while
the narrower dataset resulted in 502 observations. We then identified the geographic lo-
cations of each of these conflicts and assigned them to one of the 52 countries that exist
today in Europe, the Middle East, the Near East or North Africa.15 Then we augmented
this dataset with the fractionalization data constructed by Alesina et al. (2003). For
some other peripheral data, such as population measures, polity and democracy scores
and city distance calculations, we relied on McEvedy and Jones (1978), the Polity IV
Project and City Distance Tool by Geobytes.16
Our final data processing step involved classifying conflicts by the actors involved.
If a violent conflict pitted a predominantly Muslim society against a Christian one (i.e.,
the Ottomans versus the Hapsburgs at various occasions during the 16th and 17th cen-
turies or the Russo-Circassian wars between 1832 and 1864), we labeled that conflict
as one involving Muslims against Christians; if it involved coreligionist groups (such as
the Napoleonic wars in Europe or Russia in the 19th century or the Ottomans against
The state does not have to be an actor. Data can include massacres of unarmed civilians or territorialconflicts between warlords.”Richardson’s index corresponds to 32 or more deaths (log 32 = 1.5) and the five continents covered
are all those that are inhabitable (i.e., Europe, Asia, the Americas, Australia, and Africa).15To be specific, we first identified the theater(s) of conflict for each of the observations in the Brecke
dataset using multiple sources, including, but not limited to Oxford Atlas of World History (2002), theRand McNally Historical Atlas of the World (2005), the Encyclopedia Britannica, Levy (1983) and Shaw(1976). Then, we identified the longitude and latitude of each of the battle or conflict locations. Weused that information to tally the different kinds of conflicts and violent confrontations that occurredbetween 1400 and 1900 CE within the borders of the 52 countries in our sample.16The Polity IV data can be accessed at http://www.systemicpeace.org/polity/polity4.htm and the
city distance calculator can be found at http://www.geobytes.com/CityDistanceTool.htm.
10
the Safavids or Memluks in the 16th century), then we classified them as Christian ver-
sus Christian or Muslim versus Muslim. And for those conflicts which explicitly had
a religious dimension (such as the various Protestant or Huguenot revolts against the
Catholic establishment in Europe during the 14th, 15th or 16th centuries and various
Jewish pogroms that occurred in Europe dating back to the 11th century), we classified
them as Catholic-Protestant confrontations or pogroms.17
Table 1 lists the key underlying data and Table 2 presents some descriptive sta-
tistics. As shown in the first table, countries that are most religiously fractionalized
today include the Eastern European and Balkan countries, such as Bosnia & Herzegov-
ina, Slovakia, Czech Republic, Hungary and Moldova. Interestingly, this is more or less
the set of countries that lay in the buffer zone between Christianity and Islam, as de-
fined by Huntington.18 There are other highly fractionalized countries located in western
and central Europe also, such as the Netherlands, Switzerland, Germany and the United
Kingdom, as well as others in the Middle East, such as Jordan and Lebanon. By contrast,
those countries that are religiously most homogenous typically have Muslim majorities,
such as Algeria, Tunisia, Turkey and Yemen.
While there are a priori reasons to think that the interactions of people with dif-
ferent ethnic or religious backgrounds might have been more frequent in the buffer zones,
they do not necessarily suggest the higher frequency of ethnic and religious interactions
produced a positive or negative net impact on fractionalization in the buffer territories.
On the one hand, it could have been that minority religions were either exterminated or
17Of course, there are various other finer or broader classification criteria we could employ. Forexample, among Muslim versus Muslim conflicts, we could distinguish those confrontations that occurredbetween the Shi’a versus the Sunni. Or, within Christianity, we could identify those confrontations whichpitted eastern Orthodox groups against Catholic societies. In the work below, we have chosen to focusinstead on categories of conflict that had higher frequency or relatively more significance historically,but broadening the scope of our conflict types remains an area of future investigation.18Huntington (1996, p.159) provides an explicit map of the buffer between the ‘Christian’ and ‘Muslim’
civilizations. It is roughly defined by a North-South axis which effectively splits the European continentfrom Asia, running “along what are now the borders between Finland and Russia and the Baltic states(Estonia, Latvia, Lithuania) and Russia, through western Belarus, through Ukraine separating the Uni-ate west from the Orthodox east, through Romania between Transylvania with its Catholic Hungarianpopulation and the rest of the country, and through former Yugoslavia along the border separatingSlovenia and Croatia from the other republics. In the Balkans, of course, this line coincides with thehistorical division between the Austria-Hungarian and Ottoman empires.”In what follows, we shall abide by this demarkation.
11
forced to convert with more frequency by societies which subscribed to majority religions
in the buffer zones, thereby leading to forced conversion to the monotheistic religion or
to a syncretized form of religion (sects) that were marginally tolerated by the dominant
religion. Such dynamics would have produced more religious homogeneity in the buffer
zones. On the other hand, buffer zones could have been areas with more religious porous-
ness, especially if the more intense nature of ecclesiastical competition in the buffer zones
enabled more proselytizing and voluntary conversions. In that case, religious diversity
would have been higher in the buffer zones. For all these reasons, it is incumbent upon
us to acknowledge–and, in what follows, explicitly control for–the special nature of the
buffer zones in the dynamics of ethnic and religious fractionalization.
In terms of the patterns of warfare and conflict, we see that Austria, France, Ger-
many, Italy, Poland, Russia, Spain and Turkey were the theaters of conflict most often.
Adjusting for country size, some of those countries remain high on the list, although
the incidence of violent conflicts in Germany, Russia and Turkey adjusted for their geo-
graphic size is relatively low. Of the 52 countries in the sample, predominantly eastern
European and Balkan countries, such as Albania, Greece, Austria, Bulgaria, Turkey and
Ukraine, saw the most Muslim on Christian conflicts. But in Spain and Russia too there
were relatively more conflicts which pitted Muslim against Christian players. And in
six of the countries in the sample, including France, Germany and Switzerland, there
were violent confrontations between Protestants and Catholics. Although not shown,
our data also cover four countries–Belarus, France, Portugal and Spain–where one or
more pogroms took place between 1400 and 1900 CE. Figure 1 is replicated from Iyi-
gun, Nunn and Qian (in progress); it shows the conflicts in our dataset by century and
geographic location.
[Table 1 and Figure 1 about here.]
Now some salient descriptive data statistics. First, note that countries are more
religiously fractionalized than they are ethnically or linguistically. At the same time,
there is also a higher level of cross-country variance in religious fractionalization. There
were close to 18.3 conflicts within each country in the sample over the 500-year interval
between 1400 and 1900 CE. Among these conflicts, there were on average 3.3 violent
12
confrontations per country that involved Muslim and Christian sides, about .73 which
pitted Catholics against Protestants and .096 of Jewish pogroms per country. Catholic
on Protestant conflicts lasted much longer on average than those between Muslims and
Christians which in turn lasted much longer than Jewish pogroms and other types of
violent confrontations. Conditional on the fact that there was at least one such type
of confrontation within country borders over the interval between 1400 and 1900 CE, a
typical Protestant versus Catholic conflict lasted more than 3.5 years, whereas Muslim
on Christian conflicts lasted roughly three years and Jewish pogroms on average did not
even last half a year.
Using our longer timespan covering the period between 1400 and 1900 CE, the
average year of conflicts was 1644, with Muslim on Christian wars occurring on average
around the year 1626 and Jewish pogroms being dated around the year 1500 CE. By
contrast, when we restrict the time coverage to the two-century interval between 1400
and 1600 CE, those dates are respectively revised as 1512, 1547 and 1451 CE.
Finally, note that there is a positive but relatively low level of positive correla-
tion between religious fractionalization and the two other fractionalization measures,
although that between religious and linguistic fractionalization is the higher of the two
measures. By contrast, the correlation between ethnic and linguistic fractionalization is
still positive but much higher. Religious fractionalization exhibits a negative and rela-
tively low correlation with Christian on Muslim conflicts, but it shows a positive and
modest correlation with Protestant and Catholic wars and a low positive correlation
with Jewish pogroms. The correlation of religious fractionalization with the duration
of different kinds of conflict varies too, with the correlation of religious fractionaliza-
tion and the duration of Muslim versus Christian conflicts being the only one which is
slightly negative. As shown in the second panel of Table 2, the geographic correlations of
the religious fractionalization measure confirm that the Balkans and Eastern Europe are
highly fractionalized whereas the Middle East is not. In our final panel in Table 2, we
document that all three measures of fractionalization rise with distance from the equa-
tor, although ethnic fractionalization does so by a much smaller magnitude. Countries
in which a majority of the population is Christian (Muslim) are religiously more (less)
fractionalized, reflecting in part the higher (lower) extent of denominational plurality
13
within Christianity (Islam).
[Table 2 about here.]
4.2. Main Results
In our baseline estimates, we cover the period 1400 through to 1900 CE and estimate
the following regression equation:
FRACi = λ0 + λ1TOTALCONFLICTS
λ2MUSLIMCHRISTIANWARSi + λ3PROTESTANTCATHOLICWARSi
+ λ4POGROMi + λ5DURCONFLICTSi (1)
+ λ6DURMUSLIMCHRISTi + λ7DURPROTESTCATHi
+ λ8DURPOGROMi + λ9Xi + εi,
where FRACi is one of three alternative dependent variables constructed by Alesina et
al. (2003); TOTALCONFLICTSi is the total number of violent confrontations that oc-
curred within country i’s borders between 1400 CE and 1900 CE;MUSLIMCHRISTI —
ANWARSi is the count of violent confrontations between Muslims and Christians which
took place in country i over the relevant time span; PROTESTANTCATHOLICWARSi
is the count of violent conflicts between Catholics and Protestants that occurred in coun-
try i between 1400 CE to 1900 CE; POGROMi is the number of Jewish pogroms which
took place in country i during the same period; and DURCONFLICTSi, DURMUS
– LIMCHRISTi, DURPROTESTCATHi, DURPOGROMi denote the average du-
ration of the types of conflict we defined above, respectively.19
19For complete details of how the various fractionalization measures are defined and calculated, seeAlesina et al. (2003).
14
In our most parsimonious empirical specifications, the set of control variablesXi in-
cludes nine geographic dummy variables,WESTERNEU , CENTRALEU , EASTERN
— EU , NORTHERNEU , BALKANS, AFRICA, ASIA, MIDEAST and ISLAND.
Note that, taken together, two of those geographic dummies, EASTERNEU and BAL
– KANS, define what turned out to be the historical buffer zone between Christian
and Muslim societies. In other more comprehensive estimates, we also include in Xi the
population level of i in 1994, POPULATION ; the distance from the equator of country
i’s capital, EQUATOR; a dummy for whether or not i is landlocked, LANDLOCK;
country i’s land area in km2, LANDAREA; the population estimates for 1000 CE and
1500 CE, POP1000 and POP1500, respectively; the distance of country i’s capital from
the three ecclesiastical centers of Rome, Jerusalem and Mecca, ROME, JERUSALEM ,
and MECCA; dummies for whether a majority of the population was a Christian or
Muslim majority in 1994, CHRISTIANMAJOR and MUSLIMAJOR; and the years
during which each of the four types of conflict took place on average, Y RCONFLICT ,
Y RMUSLIMCHRIST , Y RPROTESTCATH and Y RPOGROM .
Table 3 displays results from four regressions that employ religious fractionalization
as the dependent variable.20 Column (1) shows results from the most parsimonious of
regressions, with controls only for geographic region as part of Xi. As mentioned earlier,
certain areas of Europe tend to be more homogeneous than others, hence the addition of
geographic dummies controls for regional differences. Column (2) adds a control for land
area, LANDAREA, which is reported, though not significant, a dummy for whether the
country is landlocked, LANDLOCK, and current population, POPULATION , in case
fractionalization is correlated with population size.21 Column (2) also adds variables
for distance to the equator and a dummy for whether a country is landlocked. Column
(3) builds on the specification in (2) with the additional variables of distance to major
religious centers of Mecca, Rome and Jerusalem, as well as a dummies for whether the
country had a Muslim or Christian majority in 1994, and its population in the years 1000
20In all results shown, we report the heteroskedasticity-corrected standard errors.21It is important to control for country size to the extent that country formation is endogenous
and causality runs from violent confrontations to country size, which in turn affects our measures offractionalization. Put differently, to the extent that the impact of conflicts on fractionalization arisesfrom endogenous country formation, controlling for LANDAREA could help to limit omitted variablebiases.
15
and 1500 CE. Of these, only the religious majority coefficients are reported.22 Column
(4) adds variables associated with the average year of the conflict both in general and by
the types of religious conflict, although they are not reported. All in all, these additional
control variables are highly correlated with duration and do not appear to have a large
effect on magnitude or significance of the variables in question.
In all four regressions in Table 3, religious fractionalization depends negatively
and statistically significantly on the frequency of Muslim on Christian wars and typically
positively–though not significantly–on wars between Protestants and Catholics. These
results buoy the thesis that the long-run incidence and patterns of religious conflicts–in
this case, those between Muslims and Christians, in particular–did impact the contem-
poraneous extent of religious fractionalization within countries. The role of historical
conflicts in influencing modern-era fractionalization is quite large. In the simplest re-
gression in Table 3, for instance, one more violent incident in which Muslims fought
against Christians is associated with close to five percent less religious fractionalization,
or a generally more homogenous religious community some 400 years later.23 The result
increases in magnitude as controls are introduced and remains statistically significant.
Additionally, we see that the duration of Muslim versus Christian conflicts enters neg-
atively, decreasing fractionalization by 6 to 9 percent depending on the specification,
though reaching statistical significance only in column (2). The frequency of Jewish
pogroms is also associated with increased religious fractionalization, although the mag-
nitude and significance varies by specification. However, the duration of pogroms is
associated with decreased fractionalization.
While these baseline results show a pattern that will remain at the fore the rest
of the way, they also invite the question of why Muslim on Christian conflicts had an
opposite impact than those between Protestants and Catholics or, for that matter, the
incidence of Jewish pogroms in a region. There is no clear cut answer to this. A plausible
conjecture is that the types of conflict in question also differ from one another in the
extent to which the underlying sources of conflict have been mitigated or resolved in the
22The coefficients not shown typically are statistically insignificant, with occasionally alternating signsacross the different empirical specifications.23The coefficient of MUSLIMCHRISTIAN in the column (1) estimate of Table 3 is −.016. Given
that the average fractionalization rate is .369 in our sample, this corresponds to a 4.3 percent lowerfractionalization rate due to one extra conflict between Muslims and Christians.
16
course of time–however, superficially or fundamentally that may be.
In particular, the process through which the Protestant and Catholic Christian de-
nominations came to terms with their underlying differences was arduous and prolonged.
The seeds of this confrontation lay in centuries past and the ‘heretical’ movements of Lol-
lardy, Huguenots and Hussites. The confrontation spanned more than 130 years between
the official inauguration of the Reformation in 1517, ran through the 1555 Peace of Augs-
burg, when the Holy Roman Empire officially recognized the Lutheranism, culminated
with the Treaty of Westphalia signed at the end of the Thirty Years War in 1648, which
marked the official recognition of Protestantism by the Roman Catholic Church. When
this fundamental ecclesiastical disagreement was eventually settled, religious pluralism
within Christianity started to become the accepted European norm. Such acceptance
and coexistence began to define, to some extent, the relationship between Christianity
and Judaism too, especially in Europe, though this took until the end of the Second
World War.
In contrast, one ought to bear in mind that the era that we are investigating co-
incides with a period when both Christianity and Islam had been established long ago,
but the competition between them had once again intensified with the Ottomans’ domi-
nation of eastern Europe in the 15th and 16th centuries and the Spanish Reconquista in
1492. And, as we alluded to in our introduction, the One God-One True Religion dual-
ity inherent in all three major monotheisms has historically been an important factor in
sustaining violent encounters between Muslim and Christian societies. Hence, these dif-
ferences may be at the core of why the different types of conflicts and violence influenced
differently modern-day religious fractionalization across countries.
The fact that the duration of Jewish pogroms depressed religious fractionalization,
whereas their incidence stimulated it is also puzzling. However, it is important to point
out that the impact of duration is conditional on the incidence of pogroms and vice
versa. Hence, what we are picking up might be the influence of a history of sustained
suppression driving religious homogeneity. Moreover, it is also important to note that the
fractionalization measures are self-reported. A country with a history of religious repres-
sion may also have encouraged Judaism to go underground by making it unacceptable
17
to report being Jewish, thus leading to increased homogeneity.24 Pogroms that lasted
longer might have exerted more influence or simply encouraged out-migration and thus
increased homogeneity.25 On the flip side, pogroms could have invoked the same sort
of mechanism as conflicts within Christian sects discussed above, magnifying internal
differences and subsequently resulting in increased religious fractionalization.
Finally, it is worthwhile to remark that, with the exception of some of the geo-
graphic dummy variables that come in statistically significant, although not robustly
to changes of empirical specification, only a few of the right-hand side variables, which
we singled out above, have explanatory power. Despite this observation, the fit of the
regressions, even of the baseline version, is quite high as indicated by the R2 measures.
[Table 3 about here.]
Tables 4 and 5 employ the same specifications shown in the previous table but with
ethnic and linguistic fractionalization, respectively, as the dependent variables. Though
the direction of the effect of religious conflicts on fractionalization is generally main-
tained, the impact of the latter on ethnic and linguistic fractionalization is overwhelm-
ingly insignificant statistically. This stands in stark contrast to the results we reported
in Table 3. One exception is provided by the statistically significant and negative impact
of the duration of Muslim on Christian wars on ethnic fragmentation in columns (1), (2)
and the negative and significant role of pogroms on ethnic fractionalization in column
(2) of Table 4. Interestingly, the coefficient on the frequency of total confrontations,
TOTALCONFLICTS, now enters negatively in five of the eight specifications in Ta-
bles 4 and 5, with three of the five also being statistically significant. In particular, the
24As it is well known, this was certainly the case in the Iberian peninsula after 1492, but sporadicallyeven before that.In fact, starting in the 9th century, the Spanish Reconquista began to take shape with the Christian
kingdoms up north pushing the frontiers southward into Muslim-held lands. By mid-13th century,Christian kingdoms had regained back most of the peninsula. Although the adherents of the threeAbrahamic traditions coexisted on the peninsula rather peacefully by medieval standards even after theReconquista began, there were on occasion flare ups, such as the movement of the Cordoban Martyrs,a group of al-Andalus Christians “who provoked and achieved martyrdom at Muslim hands in theninth-century Cordoba,” (Constable, 2006, p. 307).25A large number of the Sephardim resettled in the Ottoman Empire during the reign of Sultan Beyazid
II (r. 1481-1512) who dispatched the Ottoman navy for their transfer. The number of Sephardic Jewswho were resettled in various parts of the still-fledgling Ottoman empire – in particular, in Salonica,Avlona, Palestine and Istanbul – is estimated to have totaled 100,000 (Kumrular, 2008, p.24).
18
dampening influence of TOTALCONFLICT on ethnic fractionalization in column (1)
of Table 4 and its similarly negative impact on linguistic fractionalization in columns (1)
and (2) of Table 5 contrast with the insignificant role of conflicts generally in religious
fractionalization.
As shown in Tables 4 and 5, little else provides an evidently strong predictor of
either ethnic or linguistic fractionalization. As discussed above, our data reflect a higher
degree of religious fractionalization than either ethnic or linguistic. Thus, the lower levels
and variance of ethnic and linguistic fractionalization might in part account for our results
not being as strong as those reported in Table 3. Still, the effects of our explanatory
variables on ethnic fractionalization present slightly stronger and more uniform results
over various specifications than linguistic fractionalization. This should again be viewed
in light of the fact that our data reflect less linguistic fractionalization than ethnically.
All in all, the weaker power of our set of right-hand side variables in explaining either
ethnic or linguistic fractionalization vis-a-vis religious fractionalization is manifested in
the fit of the specifications as summarized by the R2 measures in Tables 4 and 5.
[Tables 4 and 5 about here.]
4.3. Alternative Specifications & Robustness
Now we can turn to issues of robustness and a discussion of various alternative specifi-
cations.
First and foremost, and as we alluded to in our introduction, there is rightly a
question of causality. That is, whether or not the long-run history of ecclesiastical
conflicts had a bearing on religious, ethnic and linguistic homogeneity, or whether our
results are merely reflective of a reverse causality channel through which we are picking
up the effects of persistent levels of fractionalization on the propensities of varies sorts
of conflict. In this, we are encouraged by numerous factors already discussed herein,
including the fact that, with very few exceptions, the European continent presented
relatively low levels of fractionalization in the medieval period. Moreover, the addition
of regional controls should account for outliers such as the Balkans and the Iberian
Peninsula before 1492, which represented some of the geographies with above-average
fractionalization.
19
All the same, we decided to rerun our empirical tests using a three hundred-year
time lag between our fractionalization observations and the conflict data. In particular,
instead of tracking the patterns, types and attributes of violent confrontations over the
half millennium between 1400 to 1900 CE, we generated an alternative variant of the
conflict variables which was based on data covering the two centuries between 1400 and
1600 CE. This yielded 502 total conflicts in the 52 countries in our sample–instead of
the 953 over the 500-year interval.26
Tables 6, 7, and 8 provide the results derived using this new sample but other-
wise replicating the empirical specifications shown in Tables 3, 4 and 5, respectively.
By incorporating a longer time lag examining only the period covering the two-century
span between 1400 to 1600 CE, we see in Table 6 that the effect of wars on religious
fractionalization are very much in line with–and in some cases, in fact, stronger–than
using the entire period 1400 to 1900 CE. Not only are the R2 measures comparable if
not better than those shown in Table 3, but the three types of ecclesiastical conflict mea-
sures, MUSLIMCHRISTIAN , PROTESTCATHOLIC and POGROM , are statis-
tically significant in nine out of 12 times and directionally always consistent with Table
3 results:27 Muslim on Christian confrontations that took place between the 15th and
17th centuries depressed the current-day religious fractionalization of countries, although
only in the column (4) regression does the coefficient onMUSLIMCHRISTIAN attain
significance at the 10 percent level. By contrast, the Protestant on Catholic conflicts or
Jewish pogroms that took place four centuries ago or earlier raised religious fractional-
ization, entering the four specifications always positively and statistically significantly.
While other control variables are typically insignificant, the geographic dummies
for the Middle East, eastern Europe and the Balkans in some specifications are signifi-
cant. And in terms of the duration of conflicts we again have some evidence that longer
religious conflicts–in this case, DURPOGROM only–typically reduced religious ho-
mogeneity. In terms of quantitative effects, the results we obtain with this longer-lag data
are still stronger: in column (4) for instance, a ten percent higher incidence of Muslim
26We also examined our main findings using data for the period between 1400 and 1700 CE. Sincethose data yielded results that are analogous to the oned we discuss here, we have chosen not to reportthem.27For contrast, consider that MUSLIMCHRISTIAN , PROTESTCATHOLIC and POGROM ,
are statistically significant in only five out of 12 specifications in Table 3.
20

on Christian wars is associated with close to a ten percent decrease in religious frac-
tionalization, the magnitude of which is larger than the range implied by the regressions
covering the entire 1400 to 1900 CE time period.
[Table 6 about here.]
In Tables 7 and 8 we report the estimates in which ethnic and linguistic fraction-
alization are defined as the dependent variables, respectively. The results using only the
period 1400 to 1600 CE exhibit similar tendencies to those where the entire period was in
use. In particular, our conflict data aren’t as powerful as they are in explaining ethnic or
linguistic fractionalization as they are in religious fractionalization. However, the results
shown in Tables 7 and 8 are still much stronger than those reported in Tables 4 and 5. In
particular, TOTALCONFLICTS has a depressing effect in one specification with eth-
nic fractionalization as the dependent variable and it has such an effect in two regressions
where linguistic fractionalization is the dependent variable. This is in clear contrast to
the results with religious fractionalization, which do not yield any explanatory power to
the overall level of conflicts in fractionalization. The one significant difference between
the results shown in Tables 7 and 8 vis-a-vis those reported in 4 and 5 is that POGROM
has a statistically significant, positive impact on ethnic and linguistic fractionalization
in seven of the eight specifications, whereas DURPOGROM has a negative and sta-
tistically significant impact on ethnic and linguistic fractionalization in 6 of the eight
regressions shown. This effect is in line with those on religious fractionalization reported
in Tables 3 and 6, but they are in strong contrast with those in Tables 4 and 5 where
the impact of conflicts over the longer time horizon of 1400 to 1900 CE on ethnic and
linguistic fractionalization is shown to be typically insignificant.28
[Tables 7 and 8 about here.]
A four-century lag between measures of conflict and fractionalization provides us
some comfort that we are distilling off any impact fractionalization could have on con-
flicts. Nonetheless, even a four century lag would not compensate for omitted variable
28Although none of the results discussed here control for it, we also ran our key regressions with theerror terms being clustered on the basis of the nine geographic regions. Doing so weakened some of thecoefficients on MUSLIMCHRISTIANWARS and made some coefficients statistically insignificant,but the qualitative nature of our results did not change radically.
21
biases inherent in the results above. This is why we controlled for the dates of indepen-
dence in some alternative estimates and substituted more or less aggregated geographic
controls for countries in Europe in various other regressions. Neither of these alter-
ations influenced the essence of our main findings. Furthermore, for an empirical work
whose key explanatory data cover the medieval era, our R2 measures are unusually high,
exceeding .76 in some specifications where religious fractionalization is the dependent
variable. This is another reason why omitted variable biases are probably not exerting
a meaningful bias in the key results.
Of course, employing IV estimates could serve as a compelling alternative to length-
ening our time lags or considering different sets of control variables. Here, we are
somewhat handicapped due to the lack of viable instrumental variables: most avail-
able instruments for conflicts are plausible determinants of ethnic, religious or linguistic
fractionalization too. However, the various measures of distance from Jerusalem, Rome
and Mecca could serve as instruments for religious conflict, to the extent that (i) the
historical patterns of ecclesiastical conflicts were shaped by proximity–or lack thereof–
to geographic regions that have been pivotal for Judaism, Christianity and Islam; and
(ii) the spread and contractions of Judaism, Christianity and Islam historically were
predominantly driven by conflicts instead of peaceful proselytizing, so as to make reli-
gious, ethnic and even linguistic fractionalization functions of ecclesiastical conflict but
not distance to the ecclesiastically-important cities.
With this possibility in mind, we estimated a 3-stage least squares IV regression.
In the first stage of our 3-stage least squares IV estimation, we regressed MUSLIM –
CHRISTIANWARS and PROTESTANTCATHOLICWARS on JERUSALEM ,
ROME,MECCA, the two- and three-way interactions among those three distance mea-
sures as well as the dummies EASTERNEU and BALKANS, which together define
the buffer zone between eastern Europe and the near East. In the second stage, we then
estimated the impact of MUSLIMCHRISTIANWARS and PROTESTANTCATH
– OLICWARS on fractionalization. And in the final stage, we regressed average eco-
nomic growth rates over the period between 1970 and 2002 on fractionalization.29
29Another limitation of this strategy is due to limited sample size: many of the east European, nearAsian and Balkan countries in our sample became independent of the Iron Curtain in the early-1990s.Hence, economic growth data averaged over a relatively meaningful (read: long enough) time interval is
22
Our results are summarized in Tables 9.A through 9.C. As shown in the final panel
of 9.C, all the distance measures help predict the propensity of conflict between Chris-
tians and Muslims. As summarized in 9.B, PROTESTANTCATHOLICWARS in
particular, but MUSLIMCHRISTIANWARS too, have predictive power in estimat-
ing religious and ethnic fractionalization. And as Table 9.A shows, religious fractional-
ization, as instrumented with our conflict variables cum ecclesiastical distance measures,
exerts a statistically significant and negative effect in two regressions, attaining a p-value
of 11 percent in the third. This seems to be the case with ethnic fractionalization too,
with the coefficient estimate for it generating a statistically significant negative impact
in the two estimates ethnic fractionalization is included as a determinant of economic
growth. As shown in the final column, however, linguistic fractionalization yields a sta-
tistically insignificant effect when all fractionalization measures are included, although
all three variables yield negative coefficients.30 On the one hand, these results verify
that ethnic fractionalization is detrimental to long-run economic growth. On the other
hand, they stand in contrast to those in the existing literature that have either not been
able to establish a link between religious fractionalization and economic growth or found
religious fractionalization having a positive effect on it.
[Tables 9.A through 9.C about here.]
As a final line of inquiry, what can we say about the role of the longer-term his-
tory of violent conflicts on development indirectly through their impact on institutions?
As we alluded to in our introduction, there is a strand in the empirical development
literature which has shown that ethnic and linguistic fractionalization has detrimental
available for only 30 of the 52 countries in the original sample.30The first-stage F -statistics for MUSLIMCHRISTIANWARS are high enough that we have no
reason to suspect our ecclesiastical distance measures to be weak instruments for Muslim versus Christianwars. The same is not true for PROTESTANTCATHOLICWARS, with its first-stage F -statisticsbeing less than unity in all three estimates.In any case, to verift the strength of our instruments, we experimented with conditional
likelihood ratio (CLR) confidence intervals for two separate 2SLS specifications in whichMUSLIMCHRISTIANWARS and PROTESTANTCATHOLICWARS were, in turn, instru-mented for in the first stage and religious fractionalization was regressed on either of the two conflictmeasures in the second. Those tests yielded bounded and directionally consistent (i.e., negative) inter-vals for Muslim on Christian wars. Moreover, the Sargan test p-values indicated that our instrumentssatisfy the over-identifying restrictions.
23
effects on economic growth and development, but only indirectly. Since our results thus
far illustrated that the history of religious conflicts especially had effects on modern-
era cross-country differences in fractionalization, we believe it is incumbent upon us to
examine if conflicts alone can help to explain differences in institutional quality.
Table 10 reports our findings with countries’ polity scores as measured with the
POLITY data is the dependent variable, which is regressed on the standard explanatory
variables that we employed as the determinants of fractionalization. As shown, we pickup
a strong impact of the history of conflicts over the period between 1400 to 1900 CE
on the quality of polities in 1994.31 Specifically, whereas the incidence of Muslim on
Christian conflicts had a dampening effect on religious fractionalization, it is shown to
have had positive and, in three of the four specifications, statistically significant effects
on polities. In contrast, the incidence of pogroms yields negative and in two of the four
regressions statistically significant effects on polity scores. The duration of the three
types of religious violence typically produced statistically significant effects on polities,
although the directional impact of conflict duration was ambiguous, especially in the
cases of DURPROTESTCATH and DURPOGROM . In the next section, we will
have more to say on this topic.
[Table 10 about here.]
5. Discussion
The results above show that the long-term history of violent conflicts, in general, and
those of a religious nature, in particular, had a bearing on the contemporary differ-
ences of cross-country religious fractionalization. They suggest that violent conflicts and
religious confrontations influenced ethnic and linguistic fractionalization too, although
to a much lesser extent. Furthermore, religious conflicts seem to have exerted statisti-
cally significant–in some cases adverse but in others favorable–effects on institutional
quality, as measured by countries’ polity scores.
The existing literature on the subject has long established a generally robust ad-
verse impact of fractionalization on measures of institutional quality. In fact, although
31Running the same regressions with the 1400 to 1600 CE conflict data and the four century laginstead of one century produced very similar, if not stronger, results. All results discussed but notshown are, of course, available upon request.
24
we have chosen not to present them here for the sake of brevity, estimating the analogs
of the regressions in Table 10, but replacing all of the various conflict measures which
we controlled for thus far with the three alternative fractionalization measures, we too
were able to verify the statistically significant, detrimental effects of ethnic and linguistic
fractionalization, in particular, on polity scores.
Taken together with the results we have presented thus far, these findings raise an
intriguing question: If fractionalization is influenced in part by violent conflicts and reli-
gious confrontations, which, together with fractionalization, then have a bearing on the
cross-country differences in the quality of polities, do violence and religious confronta-
tions have a direct role in POLITY or do their effects filter only indirectly through
fractionalization?
Given the data at hand, this is a question to which we can provide some an-
swers. In Table 11 we summarize some of our related findings.32 Interestingly, when we
include the three measures of fractionalization along with the standard list of conflict
variables we relied on in the previous tables, we find that neither religious nor linguistic
fractionalization impacts cross-country differences in institutional quality, as proxied by
polity scores. But depending on the specification, some conflict measures continue to
exert statistically significant effects on POLITY . For instance, the frequency of Mus-
lim on Christian violent conflicts has positive coefficients in all four specifications and
it is statistically significant in column (2) at the 5 percent level. Moreover, although
its coefficient estimates aren’t significant in the other regressions, the estimate of the
MUSLIMCHRISTIAN coefficient yield a p-value of 16 in columns (3). These results
are perfectly in line with–albeit somewhat weaker–than those reported in Table 10.33
[Table 11 about here.]
There are at least two not necessarily mutually exclusive observations we can make
on this basis. One, the very long-run histories of conflict, in general, and those that are of
32These results were produced using conflict data covering the period between 1400 and 1900 CE, butan exercise in which we used data for the 1400 to 1600 CE interval instead generated qualitatively quitesimilar findings. Hence, we chose not to report them here.33To see if violent conflicts impacted a narrower measure of polity, we ran regressions similar to the
one we discuss here, using the democracy index score as the dependent variable instead. Doing so wegenerally found conflicts to have insignificant effects on democracy.
25
an ecclesiastical nature, in particular, had some long-lasting and direct effects on cross-
country differences in institutional quality. Two, the long-standing standard arguments
as well as findings that fractionalization impacts institutions seem to be sensitive to
whether or not the direct effects of the history of violence on institutions are controlled
for. As all our earlier results attest, however, this is not tantamount to concluding
that various types of fractionalization have no impact on the evolution of institutions,
although they do indeed suggest that fractionalization is endogenous.
If conflicts and religiously motivated or sustained confrontations do help to explain
the cross-country variations in the quality of polities and the extent of fractionalization,
then what factors influence the historical patterns of conflict? Besides some of the
literature referenced above that puts a premium on cultural differences as a determinant
of violent conflicts historically as well as the 3SLS IV estimates we reviewed above, some
other influential contributions, such as Tilly (1992), have at least implicitly emphasized
the role of technological change and geography. This is an area of ongoing investigation
which we pursue in Iyigun, Nunn and Qian (in progress).
Next, in interpreting our findings, it is important to bear in mind that our data
cover the history of a limited geographic area extending from Europe, the Middle East,
the near East to the Arabian peninsula and North Africa; they cover neither sub-Saharan
Africa, Far East Asia nor the Americas. Thus, while our geographic coverage pertains to
the regions of the world in which major ecclesiastical dynamics and interactions unfolded
historically, one would have to be cautious in the external validity of these conclusions
both in time and space.
We can finally wrap the paper up with the implications of our findings for the role
of ethno-religious fractionalization and divisions in civil wars and internal conflict. We
have shown that the long-run historical record and patterns of violent conflict influenced
the current levels of ethnic and religious fractionalization. We have, in fact, identified
that the modern-era levels of religious fractionalization in particular depend on the type
of conflicts that occurred in a given region. On that basis, then, it is possible that
the contemporary levels of fractionalization are low due to the fact that the underlying
historical sources of conflict have still not been resolved. Or, conversely, fractionalization
might be high now precisely because the sources of conflict have been settled over the
26

course of history.
6. Conclusion
A sizable literature has shown that fractionalization influences economic development
and growth indirectly, without yielding any evidence that the standard measures of ethnic
or religious fractionalization have a quantitatively and statistically significant effect on
violent conflict within countries.
In this paper, we examined the long-run determinants of contemporary fractional-
ization across countries along the ethnic, linguistic and religious dimensions. Relying on
some novel data that cover 953 violent confrontations which took place in 52 countries
over the period between 1400 and 1900 CE, we identified that the frequencies and types
of conflict influenced contemporary levels of religious and to some extent ethnic frac-
tionalization too. Specifically, we have demonstrated that the frequency of Muslim on
Christian wars within a country’s borders is a statistically significant and positive pre-
dictor of its current levels of religious homogeneity. By contrast, Protestant and Catholic
confrontations within each country between the 15th and 19th centuries–and to some
extent the incidence of Jewish pogroms too–produced more religious fractionalization
today. And the longer were the duration of all such conflicts and violence, the less frac-
tionalized countries are now. We have also established that these results are robust to
the inclusion of various control variables.
In sum, the contemporary cross-country variations in religious heterogeneity reflect
the history and type of ecclesiastical conflicts within countries. Those geographies where
clashes took place more often and with a longer duration between Muslim and Christian
‘civilizations’ are likely to be the areas that are more homogenous today. Whereas the
areas with a more frequent history of conflicts within the Judeo-Christian or Muslim
‘civilizations’ are more likely to be more heterogenous and fractionalized now. It is this
sort of endogeneity that would render the relationship between fractionalization and the
propensity of internal conflict statistically insignificant. Whether or not Huntington’s
thesis is an accurate description of the future will continue to be debated and fiercely
contested. All the same, our findings show that the demographic structure of countries
in Europe, the Middle East and North Africa do reflect the effects of a multitude of
ecclesiastical and cultural clashes that occurred throughout the course of history.
27

Finally, once we accounted for the endogeneity of fractionalization with respect to
ecclesiastical conflicts, we found that religious fractionalization, if anything, negatively
effects on economic growth.
28

7. References
Abramitzky, R. (2008). “The Limits of Equality: Insights from the Israeli Kib-butz,”Quarterly Journal of Economics, 123:3, August, 1111—59.
Alesina, A., R. Baqir and W. Easterly. (1999). “Public Goods and Ethnic Divi-sions,” Quarterly Journal of Economics, 114 (4), November, 1243-84.
Alesina, A., A. Devleeschauwer, W. Easterly, S. Kurlat and R. Wacziarg.(2003). “Fractionalization,” Journal of Economic Growth, 8, 155-94.
Alesina, A. and E. Spolaore. (2007). “International Conflict, Defense Spending andthe Size of Countries,” European Economic Review.
Barbieri, K.(1996). “Economic Interdependence: A Path to Peace or a Source of In-terstate Conflict?” Journal of Peace Research, 33(1), 29-49.
Barbieri, K. and G. Schneider. (1999), “Globalization and Peace: Assessing NewDirections in the Study of Trade and Conflict”, Journal of Peace Research, 36(4), 387-404.
Barro, R. and R. McCleary. (2003). “Religion and Economic Growth,” AmericanSociological Review, October.
Barro, R. and R. McCleary. (2005). “Which Countries Have State Religions?,”Quarterly Journal of Economics, November.
Becker, O. S. and L. Woessmann. (2009). “Was Weber Wrong?: A Human CapitalTheory of Protestant Economic History,” Quarterly Journal of Economics, forthcoming.
Berman, E. (2000). “Sect, Subsidy and Sacrifice: An Economist’s View of OrthodoxJews,” Quarterly Journal of Economics, August.
Botticini, M. and Z. Eckstein. (2005). “Jewish Occupational Selection: Education,Restrictions, or Minorities?,” Journal of Economic History, 65:4, December.
Botticini, M. and Z. Eckstein. (2007). “From Farmers to Merchants, VoluntaryConversions and Diaspora: A Human Capital Interpretation of Jewish History,” Journalof the European Economic Association, no. 5, September, 885-926.
Brecke, P. (1999). “Violent Conflicts 1400 A.D. to the Present in Different Regions ofthe World,” 1999 Meeting of the Peace Science Society, unpublished manuscript.
Brecke, P. (in progress). “The Conflict Dataset: 1400 A.D. - Present,” Georgia Insti-tute of Technology.
29
Campos, N, and V. S. Kuzeyev. (2007). “On the Dynamics of Ethnic Fractional-ization,” American Journal of Political Science, 51 (3), July, 620-39.
Canning, D. and M. Fay. (1993). “The Effects of Transportation Networks on Eco-nomic Growth,” Columbia University, unpublished manuscript.
Caselli, F. and J. Coleman. (2006). “On the Theory of Ethnic Conflict,” LondonSchool of Economics, unpublished manuscript.
Cioffi-Revilla, C. (1996). “Origins and Evolution of War and Politics,” InternationalStudies Quarterly, 40 (1), March, 1-22.
Clingingsmith, D., A. I. Kwaja, and M. Kremer. (forthcoming). Estimatingthe Impact of the Hajj: Religion and Tolerance in Islam’s Global Gathering,” QuarerlyJournal of Economics.
Collier, P. and A. Hoeffler. (2005). “Coup Traps: Why does Africa have so manyCoups d’Etat?,” Department of Economics, University of Oxford, unpublished manu-script.
Collier, P. and A. Hoeffler. (2007). “Civil War,” in the Handbook of Defense Eco-nomics 2, eds.Todd Sandler and Keith Hartley, April.
Constable, O. R. (2006). “Judaism, Christanity and Islam in Spain from the Eighthto the Fifteenth Centuries,” in Religious Fondations of Western Civilization: Judaism,Christianity and Islam, in J. Neusner, ed., (Nashville, TN: Abingdon Press).
Easterly, W. and R. Levine. (1997). “Africa’s Growth Tragedy: Policies and EthnicDivisions,” Quarterly Journal of Economics, 111 (4), November, 1203-50.
Ekelund, R., R. D. Tollison, G. M. Anderson, R. F. Hebert and A. B. David-son. (1996). Sacred Trust: The Medieval Church as an Economic Firm, (New York,NY: Oxford University Press).
Ekelund, R., R. F. Hebert, and R. Tollison. (2002). “An Economic Analysis ofthe Protestant Reformation,” Journal of Political Economy, June.
Emmanuel, A. (1972). Unequal Exchange: A Study of the Imperialism of Trade, (NewYork & London: Monthly Review Press).
Fearon, J. and D. Laitin. (2003) “Ethnicity, Insurgency, and Civil War,” AmericanPolitical Science Review, 97:75-90.
Fernandez, R., A. Fogli and C. Olivetti. (2004). “Mothers and Sons: PreferenceFormation and Female Labor Force Dynamics,” Quarterly Journal of Economics, 119(4), 1249-1299, 2004.
30
Fernandez, R. (2007). “Culture and Economics,” in the New Palgrave Dictionary ofEconomics, 2nd edition, edited by Steven N. Durlauf and Lawrence E. Blume, PalgraveMacmillan (Basingstoke and New York).
Glaeser, E. L., and B. I. Sacerdote. (2002). “Education and Religion.” HarvardUniversity, unpublished manuscript.
Glaeser, E. L., R. La Porta, F. Lopez-de-Silanes, and A.Shleifer. (2004). “DoInstitutions Cause Growth?” Journal of Economic Growth 9 (3): 271-303.
Glaeser, E. L. (2005) “The Political Economy of Hatred,” Quarterly Journal of Eco-nomics, 120 (1), January, 45-86.
Greif, A. (1993). ”Contract Enforceability and Economic Institutions in Early Trade:The Maghribi Traders’ Coalition,” American Economic Review, 83 (3), June, pp. 525-48.
Greif, A. (1994). “Cultural Beliefs and the Organization of Society: A Historical andTheoretical Reflection on Collectivist and Individualist Societies,” Journal of PoliticalEconomy, 102 (5), October, pp. 912-50.
Greif, A. (2006). Institutions: Theory and History, (Cambridge: Cambridge UniversityPress).
Grossman, H. I. (1994). “Production, Appropriation, and Land Reform,” AmericanEconomic Review, 84(3), June, 705-12.
Grossman, H. I. and M. Kim. (1995). “Swords or Plowshares? A Theory of theSecurity of Claims to Property,” Journal of Political Economy, 103(6), December, 1275-1288.
Grossman, H. I. and M. Iyigun. (1995).“The Profitability of Colonial Investment,”Economics & Politics, 7:3, November, 229-24.
Grossman, H. I. and M. Iyigun. (1997). “Population Increase and the End of Colo-nialism,” Economica, 64(3), August, 483-493.
Guiso, L., P. Sapienza, and L. Zingales. (2003). “People’s Opium? Religion andEconomic Attitudes.” Journal of Monetary Economics, 50 (1), 225–82.
Guiso, L., P. Sapienza, and L. Zingales. (2006). “Does Culture Affect EconomicOutcomes?” Journal of Economic Perspectives, Spring, 20 (2), 23-48.
Haavelmo, T. (1968). A Study in the Theory of Economic Evolution, (Amsterdam:North-Holland).
31

Hafer, C. (2006).“On the Origins of Property Rights: Conflict and Production in theState of Nature,” Review of Economic Studies, January, 73 (1) 119- 43.
Hirshleifer, J. (1991).“The Paradox of Power,” Economics & Politics, 3:3, November,177-200.
Huntington, S. P., (1993). “The Clash of Civilizations?,” Foreign Affairs, Council onForeign Relations, Summer issue.
Huntington, S. P., (1996). The Clash of Civilizations and the Remaking of WorldOrder, (New York, NY: Simon & Schuster).
Iannaccone, L. R. (1992). “Sacrifices and Stigma: Reducing the Free-Riding in Cults,Communes and Other Collectives.” Journal of Political Economy 100 (2), April, 271–91.
Inglehart, R and W.E. Baker. (2000). “Modernization, Cultural Change, and thePersistence of Traditional Values,” American Sociological Review, 65:19- 51.
Iyigun, M. (2007). “Monotheism (From a Sociopolitical and Economic Perspective),”IZA Working Paper No. 3116, October.
Iyigun, M. (2008a). “Luther and Suleyman,” Quarterly Journal of Economics, 123 (4),November, 1465-94.
Iyigun, M. (2008b). “Lessons from the Ottoman Harem (On Ethnicity, Religion andConflict),” IZA Working Paper No: 3556, July.
Iyigun, M. (forthcoming). Tales of Faith in Socioeconomic Progress, (Chicago, IL: TheUniversity of Chicago Press), book manuscript in progress.
Iyigun, M., N. Nunn and N. Qian (in progress). “Testing Tilly: Evidence from1400-1945 CE Europe,” University of Colorado, mimeo.
Jha, S. (2008). “Trade, Institutions and Religious Tolerance: Evidence from India,”Stanford Business School, unpublished manuscript.
Knack, S. and P. Keefer. (1995). “Institutions and Economic Performance: Cross-Country Tests Using Alternative Institutional Measures,” Economics and Politics 7(3):207-227 (1995).
Kumrular, O. (2008). Turk Korkusu: Avrupa’da Turk Dusmanliginin Kokeni, (Istanbul,Turkiye: Dogan Kitap).
Kuran, T. (2004a). “Why the Middle East Is Economically Underdeveloped: HistoricalMechanisms of Institutional Stagnation,” Journal of Economic Perspectives, 18, Sum-mer, 71-90.
32
Kuran, T. (2004b). “The Economic Ascent of the Middle East’s Religious Minorities:The Role of Islamic Legal Pluralism,” Journal of Legal Studies, 33, June, 2003, 475-515.
Kuran, T. (2005). “The Logic of Financial Westernization in the Middle East,” Journalof Economic Behavior and Organization, 56 (April 2005): 593-615.
La Porta, R., F. Lopez de Silanes, A. Shleifer, and R. W. Vishny. (1999). “TheQuality of Government,” Journal of Law, Economics and Organization, 15 (1), 222-79.
Landes, D. (1998). The Wealth and Poverty of Nations, (New York, NY: W. W. Norton& Co.).
Lee, J. and J. H. Pyun. (2008). “Does Trade Integration Contribute to Peace?,”University of California, Davis, unpublished manuscript.
Levy, J. S. (1983). War in the Modern Great Power System, 1495 - 1975, (Lexington,KY: The University Press of Kentucky).
Lewis, L. D. (2008). God’s Crucible: Islam and the Making of Europe, 570-1215, (NewYork, NY: W. W. Norton).
MacCulloch, D. (2003). The Reformation: A History, (New York, NY: Viking).
Mauro, P. (1995). “Corruption and Growth,” Quarterly Journal of Economics, 110(3), August, 681-712.
McEvedy C. and R. Jones. (1978) Atlas of World Population History. Facts on File,New York.
McNeill, W. (1984). The Pursuit of Power : Technology, Armed Force, and Societysince A.D. 1000, (Chicago, IL: University of Chicago Press).
Miguel, E, S. Satyanath and E. Sergenti. (2004), “Economic Shocks and Civil Con-flict: An Instrumental Variables Approach,” Journal of Political Economy, 112: 725-753.
Moore, R. I. (1994). The Origins of European Dissent, originally published by AllenLane, 1985, (Toronto, ON: University of Toronto Press).
Polachek, S. (1980), “Conflict and Trade”, Journal of Conflict Resolution, 24 (1), 57-78.
Polachek, S., J. Robst and Y-C. Chang. (1999), “Liberalism and Interdependence:Extending the Trade-Conflict Model”, Journal of Peace Research, 36 (4), 405-422.
Ray, D. (2005). “Polarization and Conflict,” BP Lecture, London School of Economics,New York University, mimeo, May.
33
Richardson, L. F. (1960). Statistics of Deadly Quarrels, (Pittsburgh, PA: The Box-wood Press).
Shaw, S. (1976). History of the Ottoman Empire and Modern Turkey, Vol. 1, (Cam-bridge: Cambridge University Press).
Skaperdas, S. (1992). “Cooperation, Conflict, and Power in the Absence of PropertyRights,” American Economic Review, September, 82, 720-39.
Skaperdas, S. (2005). “The Market for Protection and the Origin of the State,” Uni-versity of California at Irvine, unpublished manuscript, May.
Temin, P. (1997). “Is it Kosher to Talk about Culture?” Journal of Economic History,57 (2), June, 267–87.
Tilly, C. (1992). Coercion, Capital and European States: AD 990 - 1992 (Studies inSocial Discontinuity), (New York, NY: Blackwell Publishers).
Wilkinson, D. (1980). Deadly Quarrels: Lewis F. Richardson and the Statistical Studyof War, (Berkeley, CA: University of California Press).
Woods, F. A. and A. Baltzly. (1915). Is War Diminishing? A Study of the Preva-lence of War in Europe from 1450 to the Present Day, (Boston, MA: Houghton MifflinCo.).
34
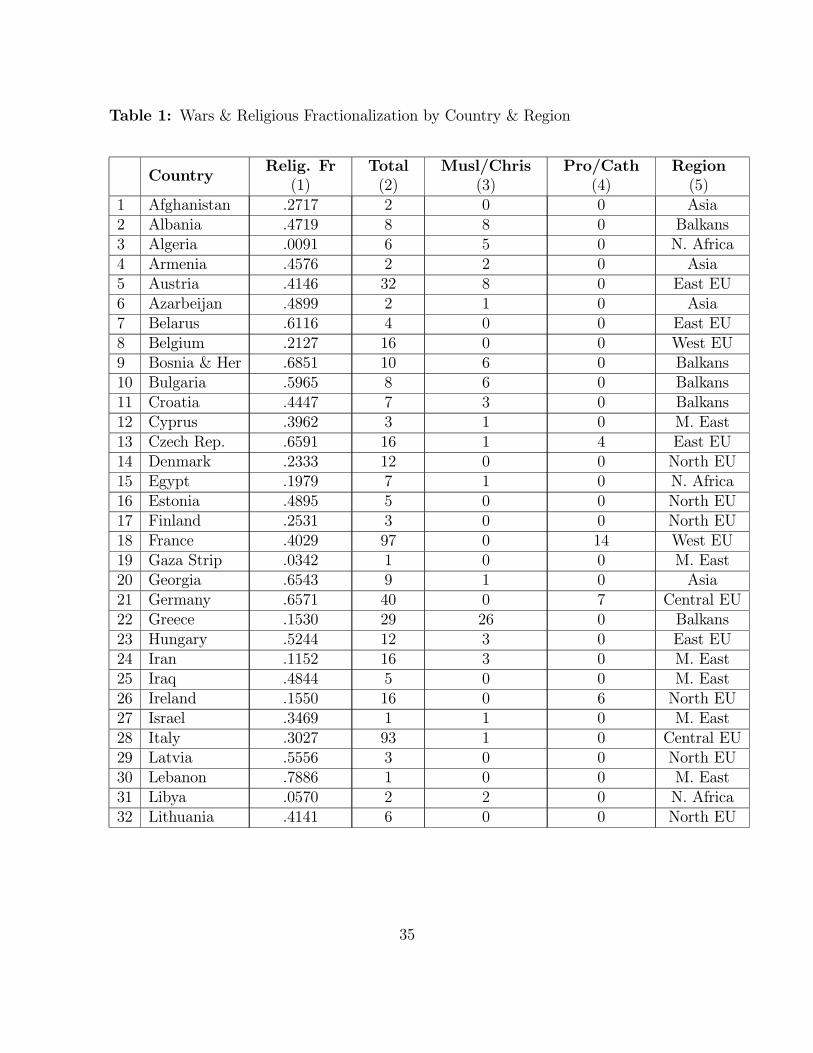
Table 1: Wars & Religious Fractionalization by Country & Region
CountryRelig. Fr
(1)Total(2)
Musl/Chris(3)
Pro/Cath(4)
Region(5)
1 Afghanistan .2717 2 0 0 Asia2 Albania .4719 8 8 0 Balkans3 Algeria .0091 6 5 0 N. Africa4 Armenia .4576 2 2 0 Asia5 Austria .4146 32 8 0 East EU6 Azarbeijan .4899 2 1 0 Asia7 Belarus .6116 4 0 0 East EU8 Belgium .2127 16 0 0 West EU9 Bosnia & Her .6851 10 6 0 Balkans10 Bulgaria .5965 8 6 0 Balkans11 Croatia .4447 7 3 0 Balkans12 Cyprus .3962 3 1 0 M. East13 Czech Rep. .6591 16 1 4 East EU14 Denmark .2333 12 0 0 North EU15 Egypt .1979 7 1 0 N. Africa16 Estonia .4895 5 0 0 North EU17 Finland .2531 3 0 0 North EU18 France .4029 97 0 14 West EU19 Gaza Strip .0342 1 0 0 M. East20 Georgia .6543 9 1 0 Asia21 Germany .6571 40 0 7 Central EU22 Greece .1530 29 26 0 Balkans23 Hungary .5244 12 3 0 East EU24 Iran .1152 16 3 0 M. East25 Iraq .4844 5 0 0 M. East26 Ireland .1550 16 0 6 North EU27 Israel .3469 1 1 0 M. East28 Italy .3027 93 1 0 Central EU29 Latvia .5556 3 0 0 North EU30 Lebanon .7886 1 0 0 M. East31 Libya .0570 2 2 0 N. Africa32 Lithuania .4141 6 0 0 North EU
35
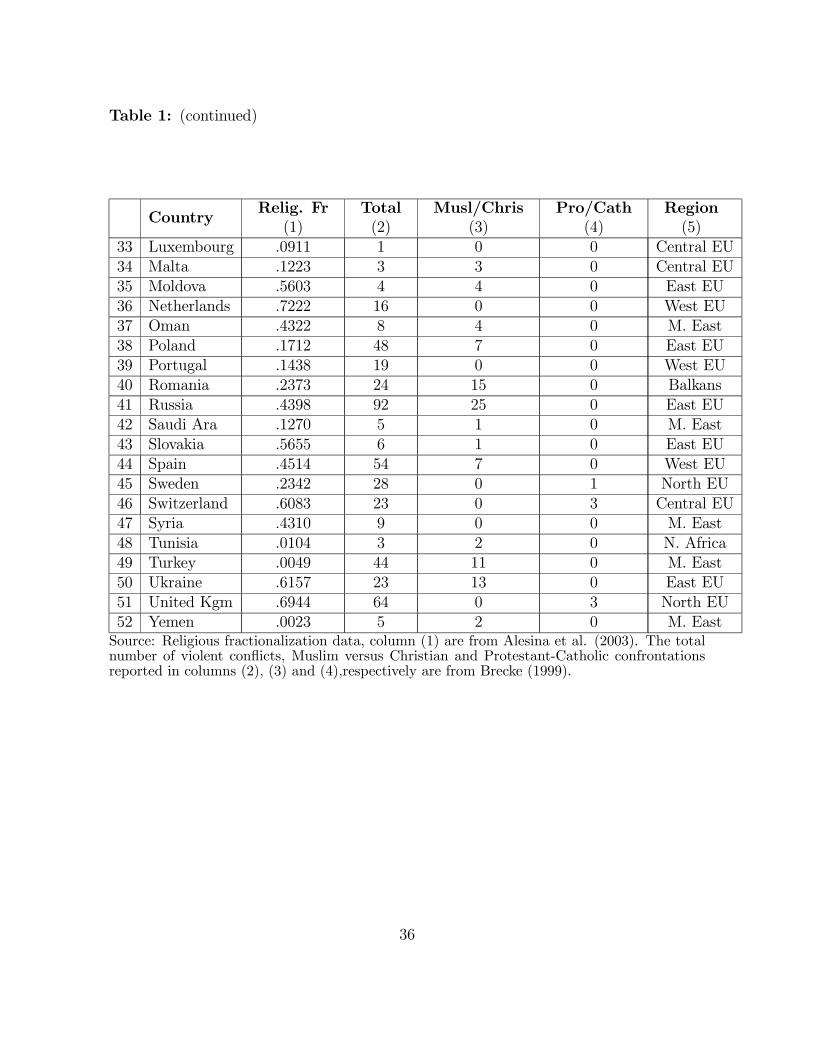
Table 1: (continued)
CountryRelig. Fr
(1)Total(2)
Musl/Chris(3)
Pro/Cath(4)
Region(5)
33 Luxembourg .0911 1 0 0 Central EU34 Malta .1223 3 3 0 Central EU35 Moldova .5603 4 4 0 East EU36 Netherlands .7222 16 0 0 West EU37 Oman .4322 8 4 0 M. East38 Poland .1712 48 7 0 East EU39 Portugal .1438 19 0 0 West EU40 Romania .2373 24 15 0 Balkans41 Russia .4398 92 25 0 East EU42 Saudi Ara .1270 5 1 0 M. East43 Slovakia .5655 6 1 0 East EU44 Spain .4514 54 7 0 West EU45 Sweden .2342 28 0 1 North EU46 Switzerland .6083 23 0 3 Central EU47 Syria .4310 9 0 0 M. East48 Tunisia .0104 3 2 0 N. Africa49 Turkey .0049 44 11 0 M. East50 Ukraine .6157 23 13 0 East EU51 United Kgm .6944 64 0 3 North EU52 Yemen .0023 5 2 0 M. EastSource: Religious fractionalization data, column (1) are from Alesina et al. (2003). The totalnumber of violent conflicts, Muslim versus Christian and Protestant-Catholic confrontationsreported in columns (2), (3) and (4),respectively are from Brecke (1999).
36
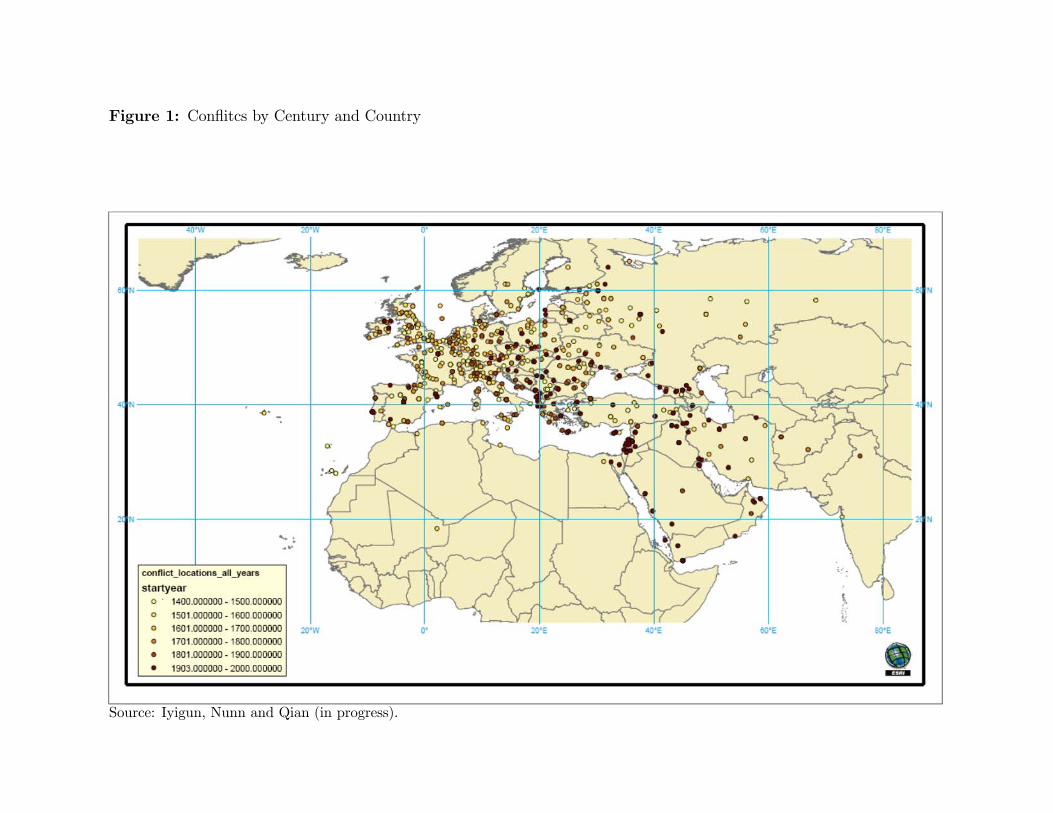
Figure 1: Conflitcs by Century and Country
Source: Iyigun, Nunn and Qian (in progress).
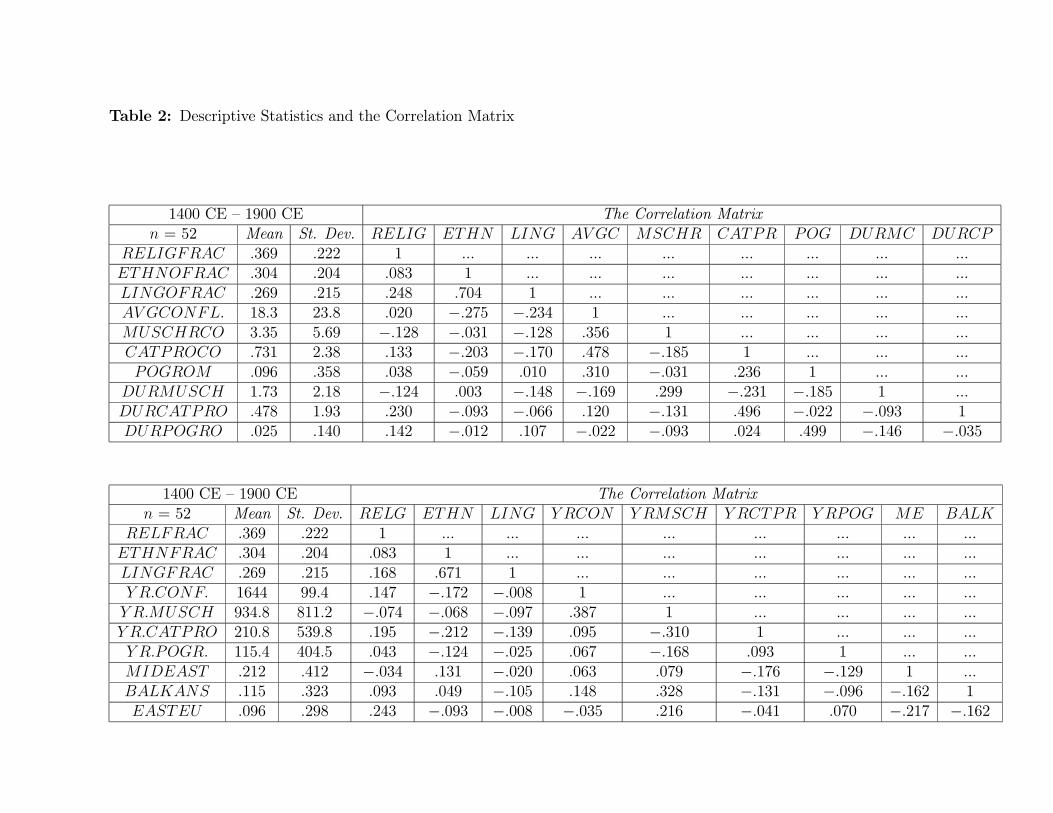
Table 2: Descriptive Statistics and the Correlation Matrix
1400 CE — 1900 CE The Correlation Matrixn = 52 Mean St. Dev. RELIG ETHN LING AVGC MSCHR CATPR POG DURMC DURCP
RELIGFRAC .369 .222 1 ... ... ... ... ... ... ... ...ETHNOFRAC .304 .204 .083 1 ... ... ... ... ... ... ...LINGOFRAC .269 .215 .248 .704 1 ... ... ... ... ... ...AVGCONFL. 18.3 23.8 .020 −.275 −.234 1 ... ... ... ... ...MUSCHRCO 3.35 5.69 −.128 −.031 −.128 .356 1 ... ... ... ...CATPROCO .731 2.38 .133 −.203 −.170 .478 −.185 1 ... ... ...POGROM .096 .358 .038 −.059 .010 .310 −.031 .236 1 ... ...
DURMUSCH 1.73 2.18 −.124 .003 −.148 −.169 .299 −.231 −.185 1 ...DURCATPRO .478 1.93 .230 −.093 −.066 .120 −.131 .496 −.022 −.093 1DURPOGRO .025 .140 .142 −.012 .107 −.022 −.093 .024 .499 −.146 −.035
1400 CE — 1900 CE The Correlation Matrixn = 52 Mean St. Dev. RELG ETHN LING YRCON Y RMSCH Y RCTPR Y RPOG ME BALK
RELFRAC .369 .222 1 ... ... ... ... ... ... ... ...ETHNFRAC .304 .204 .083 1 ... ... ... ... ... ... ...LINGFRAC .269 .215 .168 .671 1 ... ... ... ... ... ...Y R.CONF. 1644 99.4 .147 −.172 −.008 1 ... ... ... ... ...Y R.MUSCH 934.8 811.2 −.074 −.068 −.097 .387 1 ... ... ... ...Y R.CATPRO 210.8 539.8 .195 −.212 −.139 .095 −.310 1 ... ... ...Y R.POGR. 115.4 404.5 .043 −.124 −.025 .067 −.168 .093 1 ... ...MIDEAST .212 .412 −.034 .131 −.020 .063 .079 −.176 −.129 1 ...BALKANS .115 .323 .093 .049 −.105 .148 .328 −.131 −.096 −.162 1EASTEU .096 .298 .243 −.093 −.008 −.035 .216 −.041 .070 −.217 −.162
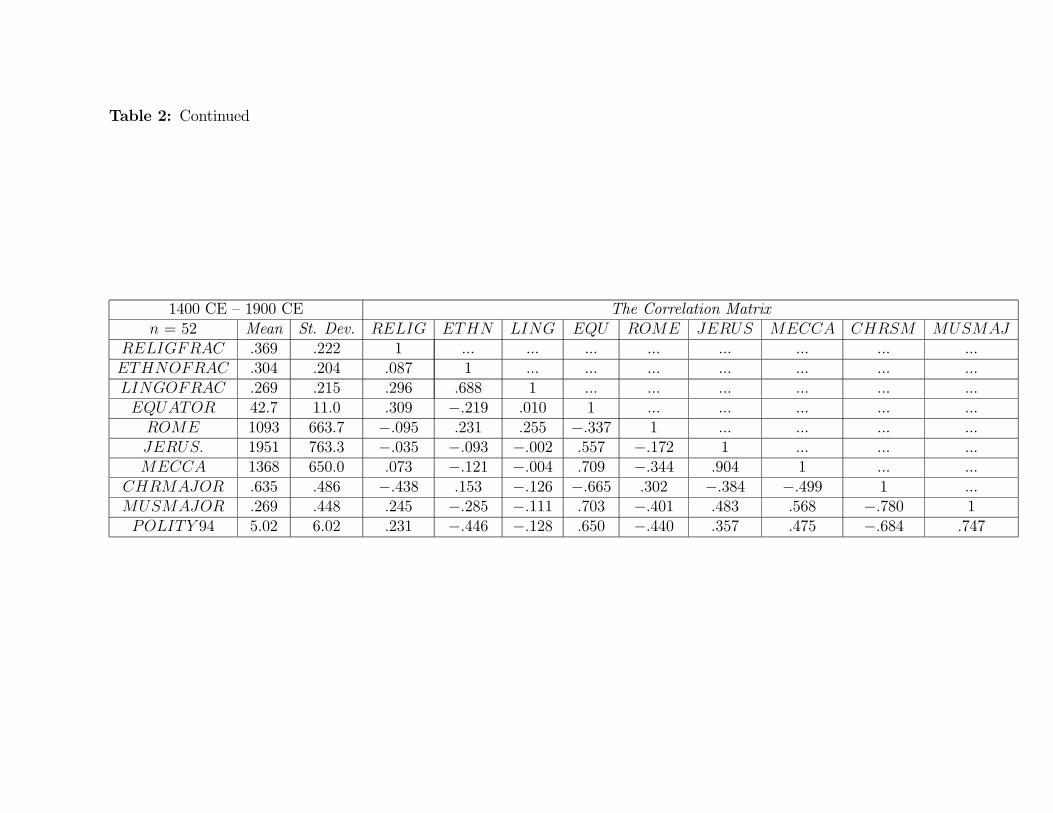
Table 2: Continued
1400 CE — 1900 CE The Correlation Matrixn = 52 Mean St. Dev. RELIG ETHN LING EQU ROME JERUS MECCA CHRSM MUSMAJ
RELIGFRAC .369 .222 1 ... ... ... ... ... ... ... ...ETHNOFRAC .304 .204 .087 1 ... ... ... ... ... ... ...LINGOFRAC .269 .215 .296 .688 1 ... ... ... ... ... ...EQUATOR 42.7 11.0 .309 −.219 .010 1 ... ... ... ... ...ROME 1093 663.7 −.095 .231 .255 −.337 1 ... ... ... ...JERUS. 1951 763.3 −.035 −.093 −.002 .557 −.172 1 ... ... ...MECCA 1368 650.0 .073 −.121 −.004 .709 −.344 .904 1 ... ...
CHRMAJOR .635 .486 −.438 .153 −.126 −.665 .302 −.384 −.499 1 ...MUSMAJOR .269 .448 .245 −.285 −.111 .703 −.401 .483 .568 −.780 1POLITY 94 5.02 6.02 .231 −.446 −.128 .650 −.440 .357 .475 −.684 .747

Table 3: Impact of Conflicts on Religious Fractionalization (1400 — 1900 CE)
Dependent Variable: Religious Fractionalization
(1) (2) (3) (4)TOTALCONFLICTS .0008 −.001 .0002 .003
(.002) (.003) (.006) (.007)MUSLIMCHRISTIAN −.016∗∗ −.020∗ −.019∗∗ −.022∗∗
(.008) (.007) (.010) (.011)PROTESTCATHOLIC .002 −.0005 .002 .028
(.016) (.018) (.035) (.051)POGROM .117 .218 .329 .682∗
(.153) (.161) (.199) (.240)DURCONFLICTS .053∗ .054∗ .062∗∗ .053
(.025) (.026) (.032) (.034)DURMUSLIMCHRIST −.031 −.033∗∗ −.039 −.027
(.021) (.019) (.025) (.029)DURPROTESTCATH .006 .003 .008 .012
(.011) (.010) (.011) (.025)DURPOGROM −.191 −.347 −.623∗ −.136
(.246) (.228) (.285) (.576)BALKANS .532∗ .509∗ .333 .416∗∗
(.075) (.129) (.213) (.232)EASTERNEU .513∗ .422∗∗ .204 .296
(.092) (.239) (.329) (.383)MIDEAST .250∗ .253∗ −.014 .040
(.063) (.070) (.192) (.218)AFRICA .013 −.219 .114 .585
(.067) (.237) (.343) (1.16)LANDAREA ... .00001 .00002 .00003
(.00001) (.00003) (.00003)MUSLIMAJOR ... ... −.130 −.149
(.184) (.251)CHRISTIANMAJOR ... ... −.147 −.122
(.135) (.178)R2 .439 .478 .586 .616No. of obs. 52 52 52 52
Note: * and ** respectively denote significance at the 5 percent and 10 percent levels. Dependent variable: religiousfractionalization in 2001; source: Alesina et al. (2003). Source of conflict data: Brecke (1999). Source of population data:McEvedy and Jones (1978). Geographic dummy variables WESTERNEU, CENTRALEU, ISLAND, NORTHERNEUincluded in all regressions but now shown. POPULATION, EQUATOR, LANDLOCK included in columns (2) through(4) but not shown. POP1000, POP1500, ROME, JERUSALEM, MECCA included in columns (3) and (4) but not shown.YRCONFLICT, YRMUSLIMCHRIST, YRPROTESTCATH and YRPOGROM included in column (4) but not shown.
40
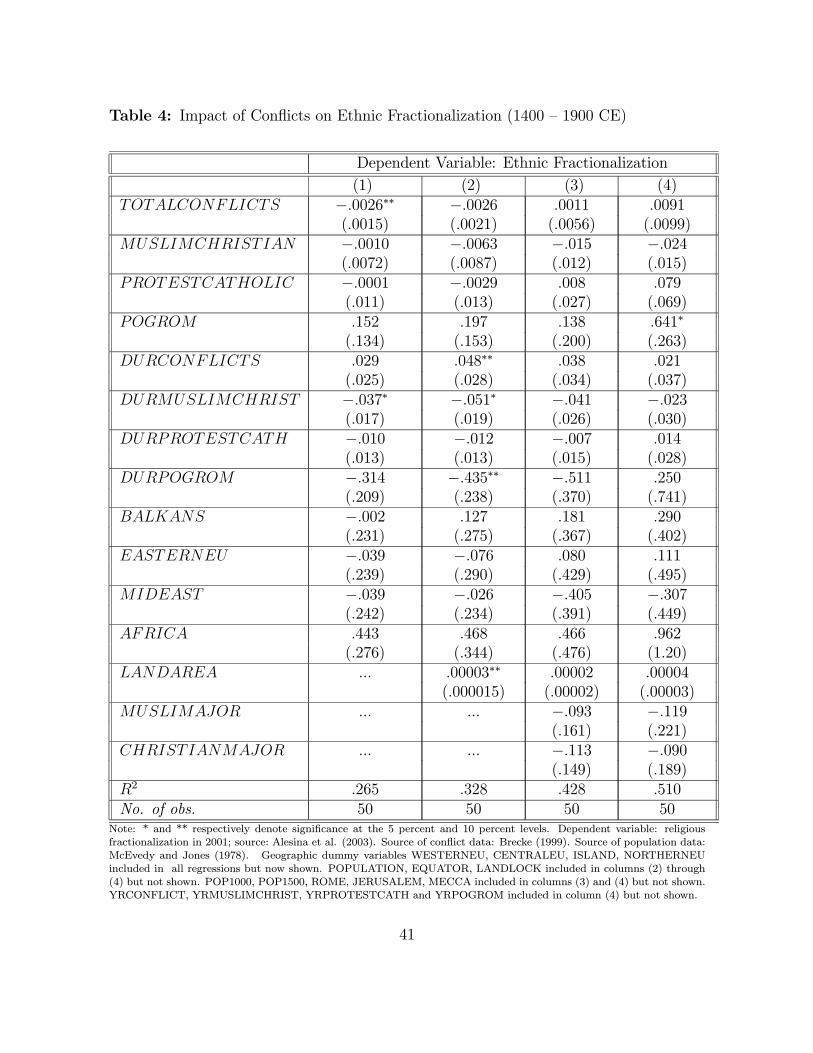
Table 4: Impact of Conflicts on Ethnic Fractionalization (1400 — 1900 CE)
Dependent Variable: Ethnic Fractionalization
(1) (2) (3) (4)TOTALCONFLICTS −.0026∗∗ −.0026 .0011 .0091
(.0015) (.0021) (.0056) (.0099)MUSLIMCHRISTIAN −.0010 −.0063 −.015 −.024
(.0072) (.0087) (.012) (.015)PROTESTCATHOLIC −.0001 −.0029 .008 .079
(.011) (.013) (.027) (.069)POGROM .152 .197 .138 .641∗
(.134) (.153) (.200) (.263)DURCONFLICTS .029 .048∗∗ .038 .021
(.025) (.028) (.034) (.037)DURMUSLIMCHRIST −.037∗ −.051∗ −.041 −.023
(.017) (.019) (.026) (.030)DURPROTESTCATH −.010 −.012 −.007 .014
(.013) (.013) (.015) (.028)DURPOGROM −.314 −.435∗∗ −.511 .250
(.209) (.238) (.370) (.741)BALKANS −.002 .127 .181 .290
(.231) (.275) (.367) (.402)EASTERNEU −.039 −.076 .080 .111
(.239) (.290) (.429) (.495)MIDEAST −.039 −.026 −.405 −.307
(.242) (.234) (.391) (.449)AFRICA .443 .468 .466 .962
(.276) (.344) (.476) (1.20)LANDAREA ... .00003∗∗ .00002 .00004
(.000015) (.00002) (.00003)MUSLIMAJOR ... ... −.093 −.119
(.161) (.221)CHRISTIANMAJOR ... ... −.113 −.090
(.149) (.189)R2 .265 .328 .428 .510No. of obs. 50 50 50 50
Note: * and ** respectively denote significance at the 5 percent and 10 percent levels. Dependent variable: religiousfractionalization in 2001; source: Alesina et al. (2003). Source of conflict data: Brecke (1999). Source of population data:McEvedy and Jones (1978). Geographic dummy variables WESTERNEU, CENTRALEU, ISLAND, NORTHERNEUincluded in all regressions but now shown. POPULATION, EQUATOR, LANDLOCK included in columns (2) through(4) but not shown. POP1000, POP1500, ROME, JERUSALEM, MECCA included in columns (3) and (4) but not shown.YRCONFLICT, YRMUSLIMCHRIST, YRPROTESTCATH and YRPOGROM included in column (4) but not shown.
41
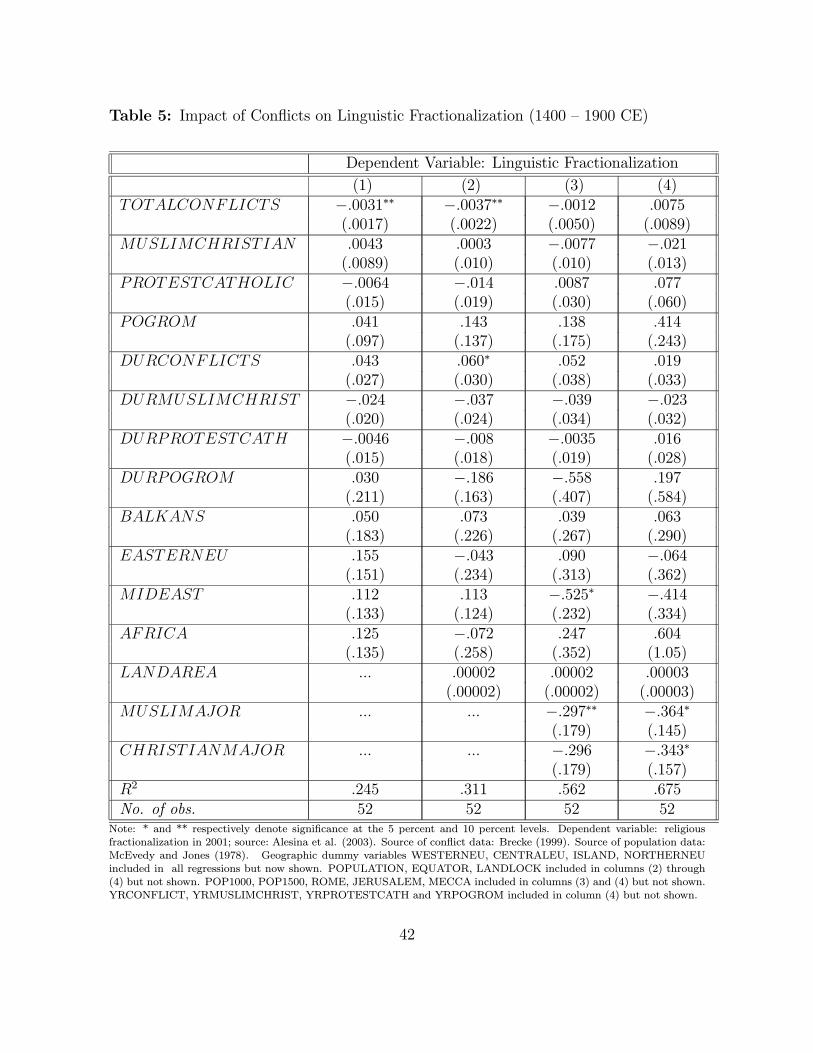
Table 5: Impact of Conflicts on Linguistic Fractionalization (1400 — 1900 CE)
Dependent Variable: Linguistic Fractionalization
(1) (2) (3) (4)TOTALCONFLICTS −.0031∗∗ −.0037∗∗ −.0012 .0075
(.0017) (.0022) (.0050) (.0089)MUSLIMCHRISTIAN .0043 .0003 −.0077 −.021
(.0089) (.010) (.010) (.013)PROTESTCATHOLIC −.0064 −.014 .0087 .077
(.015) (.019) (.030) (.060)POGROM .041 .143 .138 .414
(.097) (.137) (.175) (.243)DURCONFLICTS .043 .060∗ .052 .019
(.027) (.030) (.038) (.033)DURMUSLIMCHRIST −.024 −.037 −.039 −.023
(.020) (.024) (.034) (.032)DURPROTESTCATH −.0046 −.008 −.0035 .016
(.015) (.018) (.019) (.028)DURPOGROM .030 −.186 −.558 .197
(.211) (.163) (.407) (.584)BALKANS .050 .073 .039 .063
(.183) (.226) (.267) (.290)EASTERNEU .155 −.043 .090 −.064
(.151) (.234) (.313) (.362)MIDEAST .112 .113 −.525∗ −.414
(.133) (.124) (.232) (.334)AFRICA .125 −.072 .247 .604
(.135) (.258) (.352) (1.05)LANDAREA ... .00002 .00002 .00003
(.00002) (.00002) (.00003)MUSLIMAJOR ... ... −.297∗∗ −.364∗
(.179) (.145)CHRISTIANMAJOR ... ... −.296 −.343∗
(.179) (.157)R2 .245 .311 .562 .675No. of obs. 52 52 52 52
Note: * and ** respectively denote significance at the 5 percent and 10 percent levels. Dependent variable: religiousfractionalization in 2001; source: Alesina et al. (2003). Source of conflict data: Brecke (1999). Source of population data:McEvedy and Jones (1978). Geographic dummy variables WESTERNEU, CENTRALEU, ISLAND, NORTHERNEUincluded in all regressions but now shown. POPULATION, EQUATOR, LANDLOCK included in columns (2) through(4) but not shown. POP1000, POP1500, ROME, JERUSALEM, MECCA included in columns (3) and (4) but not shown.YRCONFLICT, YRMUSLIMCHRIST, YRPROTESTCATH and YRPOGROM included in column (4) but not shown.
42
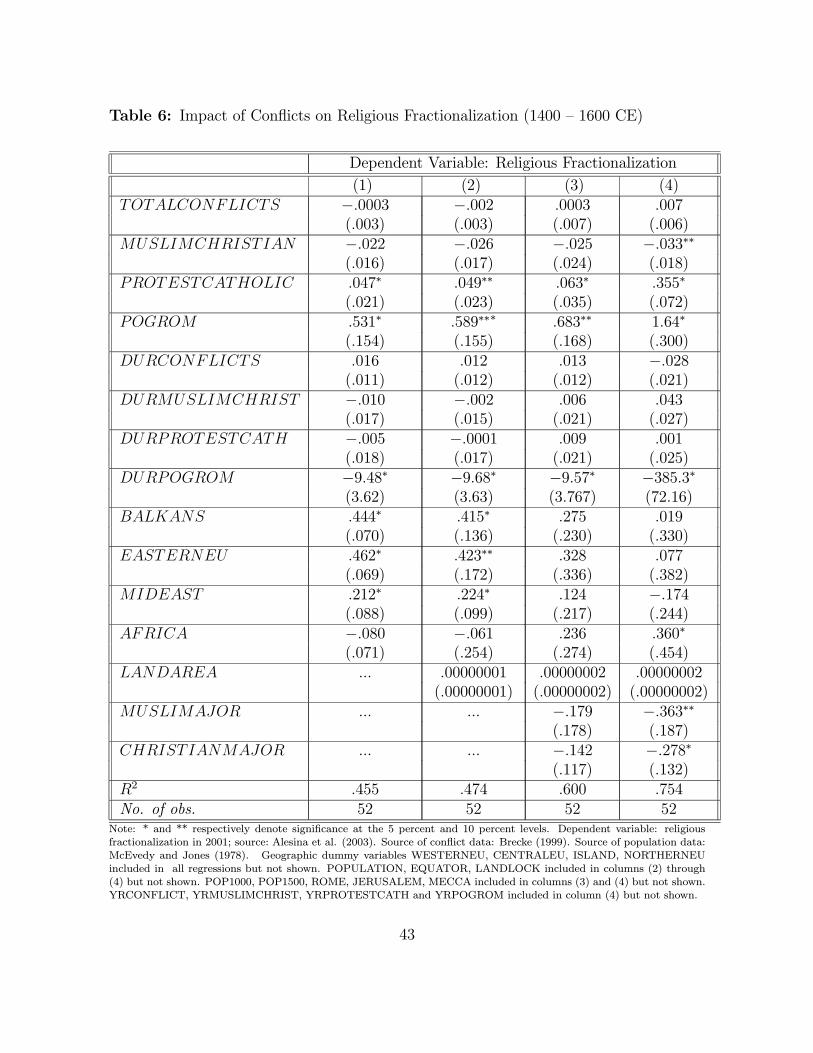
Table 6: Impact of Conflicts on Religious Fractionalization (1400 — 1600 CE)
Dependent Variable: Religious Fractionalization
(1) (2) (3) (4)TOTALCONFLICTS −.0003 −.002 .0003 .007
(.003) (.003) (.007) (.006)MUSLIMCHRISTIAN −.022 −.026 −.025 −.033∗∗
(.016) (.017) (.024) (.018)PROTESTCATHOLIC .047∗ .049∗∗ .063∗ .355∗
(.021) (.023) (.035) (.072)POGROM .531∗ .589∗∗∗ .683∗∗ 1.64∗
(.154) (.155) (.168) (.300)DURCONFLICTS .016 .012 .013 −.028
(.011) (.012) (.012) (.021)DURMUSLIMCHRIST −.010 −.002 .006 .043
(.017) (.015) (.021) (.027)DURPROTESTCATH −.005 −.0001 .009 .001
(.018) (.017) (.021) (.025)DURPOGROM −9.48∗ −9.68∗ −9.57∗ −385.3∗
(3.62) (3.63) (3.767) (72.16)BALKANS .444∗ .415∗ .275 .019
(.070) (.136) (.230) (.330)EASTERNEU .462∗ .423∗∗ .328 .077
(.069) (.172) (.336) (.382)MIDEAST .212∗ .224∗ .124 −.174
(.088) (.099) (.217) (.244)AFRICA −.080 −.061 .236 .360∗
(.071) (.254) (.274) (.454)LANDAREA ... .00000001 .00000002 .00000002
(.00000001) (.00000002) (.00000002)MUSLIMAJOR ... ... −.179 −.363∗∗
(.178) (.187)CHRISTIANMAJOR ... ... −.142 −.278∗
(.117) (.132)R2 .455 .474 .600 .754No. of obs. 52 52 52 52
Note: * and ** respectively denote significance at the 5 percent and 10 percent levels. Dependent variable: religiousfractionalization in 2001; source: Alesina et al. (2003). Source of conflict data: Brecke (1999). Source of population data:McEvedy and Jones (1978). Geographic dummy variables WESTERNEU, CENTRALEU, ISLAND, NORTHERNEUincluded in all regressions but not shown. POPULATION, EQUATOR, LANDLOCK included in columns (2) through(4) but not shown. POP1000, POP1500, ROME, JERUSALEM, MECCA included in columns (3) and (4) but not shown.YRCONFLICT, YRMUSLIMCHRIST, YRPROTESTCATH and YRPOGROM included in column (4) but not shown.
43
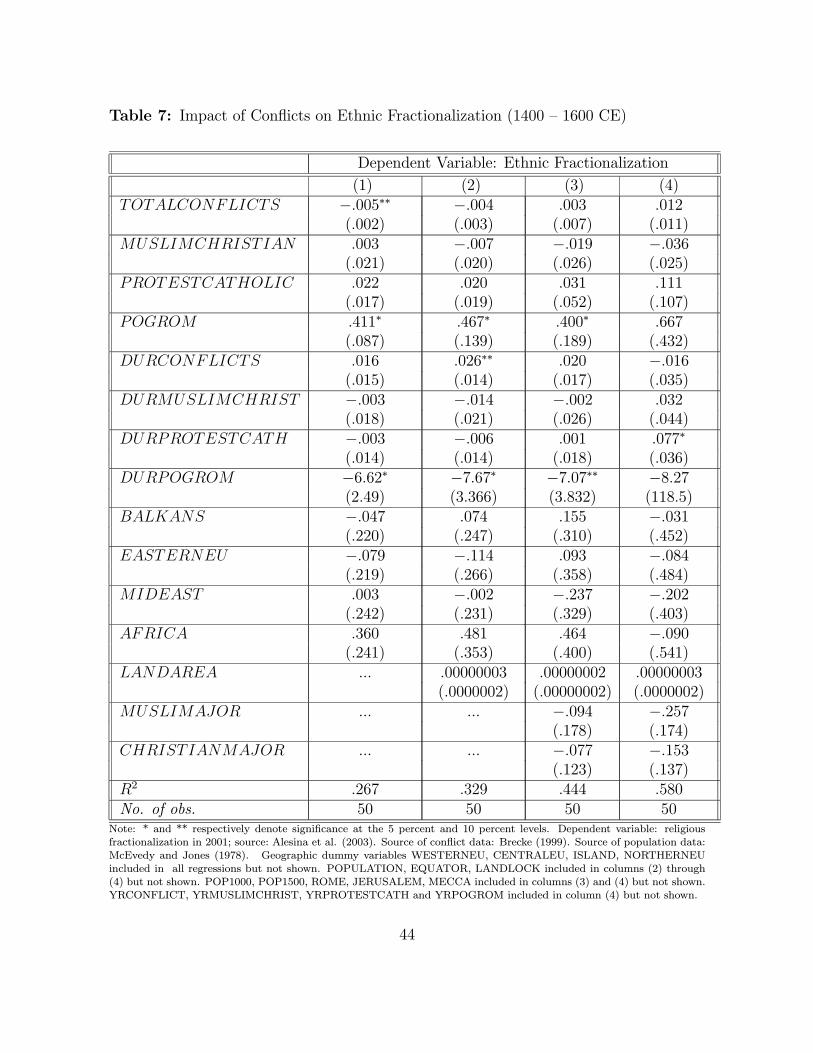
Table 7: Impact of Conflicts on Ethnic Fractionalization (1400 — 1600 CE)
Dependent Variable: Ethnic Fractionalization
(1) (2) (3) (4)TOTALCONFLICTS −.005∗∗ −.004 .003 .012
(.002) (.003) (.007) (.011)MUSLIMCHRISTIAN .003 −.007 −.019 −.036
(.021) (.020) (.026) (.025)PROTESTCATHOLIC .022 .020 .031 .111
(.017) (.019) (.052) (.107)POGROM .411∗ .467∗ .400∗ .667
(.087) (.139) (.189) (.432)DURCONFLICTS .016 .026∗∗ .020 −.016
(.015) (.014) (.017) (.035)DURMUSLIMCHRIST −.003 −.014 −.002 .032
(.018) (.021) (.026) (.044)DURPROTESTCATH −.003 −.006 .001 .077∗
(.014) (.014) (.018) (.036)DURPOGROM −6.62∗ −7.67∗ −7.07∗∗ −8.27
(2.49) (3.366) (3.832) (118.5)BALKANS −.047 .074 .155 −.031
(.220) (.247) (.310) (.452)EASTERNEU −.079 −.114 .093 −.084
(.219) (.266) (.358) (.484)MIDEAST .003 −.002 −.237 −.202
(.242) (.231) (.329) (.403)AFRICA .360 .481 .464 −.090
(.241) (.353) (.400) (.541)LANDAREA ... .00000003 .00000002 .00000003
(.0000002) (.00000002) (.0000002)MUSLIMAJOR ... ... −.094 −.257
(.178) (.174)CHRISTIANMAJOR ... ... −.077 −.153
(.123) (.137)R2 .267 .329 .444 .580No. of obs. 50 50 50 50
Note: * and ** respectively denote significance at the 5 percent and 10 percent levels. Dependent variable: religiousfractionalization in 2001; source: Alesina et al. (2003). Source of conflict data: Brecke (1999). Source of population data:McEvedy and Jones (1978). Geographic dummy variables WESTERNEU, CENTRALEU, ISLAND, NORTHERNEUincluded in all regressions but not shown. POPULATION, EQUATOR, LANDLOCK included in columns (2) through(4) but not shown. POP1000, POP1500, ROME, JERUSALEM, MECCA included in columns (3) and (4) but not shown.YRCONFLICT, YRMUSLIMCHRIST, YRPROTESTCATH and YRPOGROM included in column (4) but not shown.
44
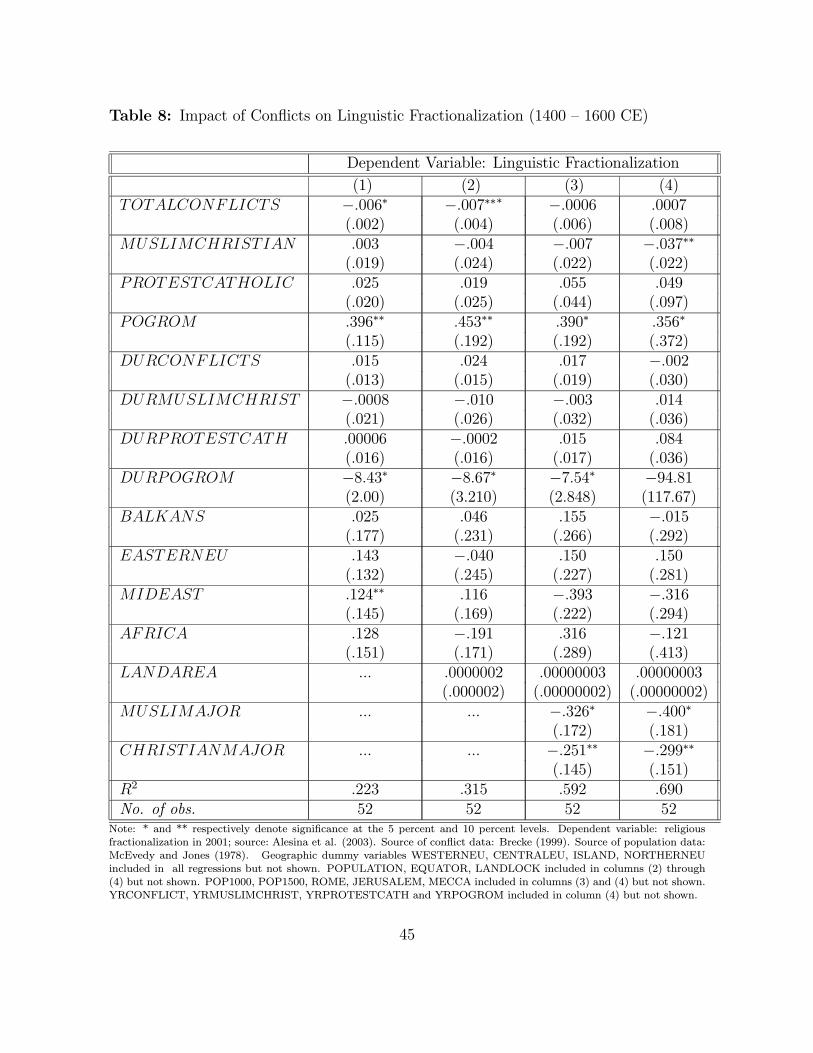
Table 8: Impact of Conflicts on Linguistic Fractionalization (1400 — 1600 CE)
Dependent Variable: Linguistic Fractionalization
(1) (2) (3) (4)TOTALCONFLICTS −.006∗ −.007∗∗∗ −.0006 .0007
(.002) (.004) (.006) (.008)MUSLIMCHRISTIAN .003 −.004 −.007 −.037∗∗
(.019) (.024) (.022) (.022)PROTESTCATHOLIC .025 .019 .055 .049
(.020) (.025) (.044) (.097)POGROM .396∗∗ .453∗∗ .390∗ .356∗
(.115) (.192) (.192) (.372)DURCONFLICTS .015 .024 .017 −.002
(.013) (.015) (.019) (.030)DURMUSLIMCHRIST −.0008 −.010 −.003 .014
(.021) (.026) (.032) (.036)DURPROTESTCATH .00006 −.0002 .015 .084
(.016) (.016) (.017) (.036)DURPOGROM −8.43∗ −8.67∗ −7.54∗ −94.81
(2.00) (3.210) (2.848) (117.67)BALKANS .025 .046 .155 −.015
(.177) (.231) (.266) (.292)EASTERNEU .143 −.040 .150 .150
(.132) (.245) (.227) (.281)MIDEAST .124∗∗ .116 −.393 −.316
(.145) (.169) (.222) (.294)AFRICA .128 −.191 .316 −.121
(.151) (.171) (.289) (.413)LANDAREA ... .0000002 .00000003 .00000003
(.000002) (.00000002) (.00000002)MUSLIMAJOR ... ... −.326∗ −.400∗
(.172) (.181)CHRISTIANMAJOR ... ... −.251∗∗ −.299∗∗
(.145) (.151)R2 .223 .315 .592 .690No. of obs. 52 52 52 52
Note: * and ** respectively denote significance at the 5 percent and 10 percent levels. Dependent variable: religiousfractionalization in 2001; source: Alesina et al. (2003). Source of conflict data: Brecke (1999). Source of population data:McEvedy and Jones (1978). Geographic dummy variables WESTERNEU, CENTRALEU, ISLAND, NORTHERNEUincluded in all regressions but not shown. POPULATION, EQUATOR, LANDLOCK included in columns (2) through(4) but not shown. POP1000, POP1500, ROME, JERUSALEM, MECCA included in columns (3) and (4) but not shown.YRCONFLICT, YRMUSLIMCHRIST, YRPROTESTCATH and YRPOGROM included in column (4) but not shown.
45
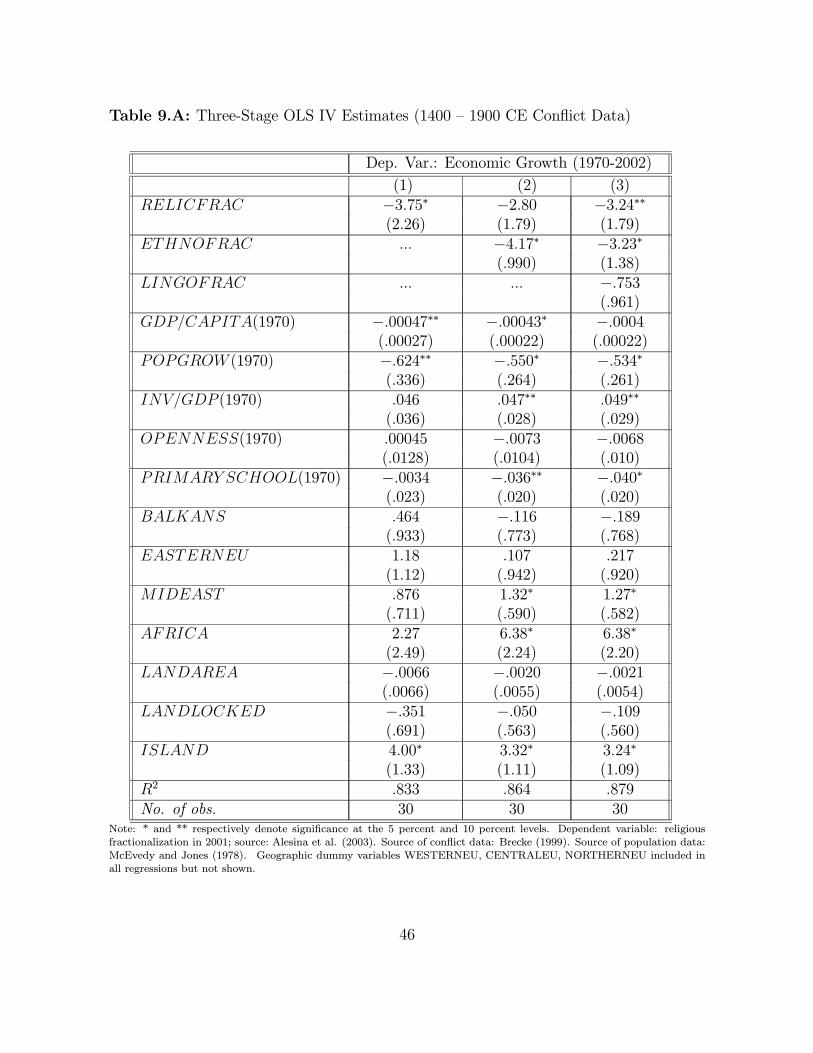
Table 9.A: Three-Stage OLS IV Estimates (1400 — 1900 CE Conflict Data)
Dep. Var.: Economic Growth (1970-2002)
(1) (2) (3)RELICFRAC −3.75∗ −2.80 −3.24∗∗
(2.26) (1.79) (1.79)ETHNOFRAC ... −4.17∗ −3.23∗
(.990) (1.38)LINGOFRAC ... ... −.753
(.961)GDP/CAPITA(1970) −.00047∗∗ −.00043∗ −.0004
(.00027) (.00022) (.00022)POPGROW (1970) −.624∗∗ −.550∗ −.534∗
(.336) (.264) (.261)INV/GDP (1970) .046 .047∗∗ .049∗∗
(.036) (.028) (.029)OPENNESS(1970) .00045 −.0073 −.0068
(.0128) (.0104) (.010)PRIMARY SCHOOL(1970) −.0034 −.036∗∗ −.040∗
(.023) (.020) (.020)BALKANS .464 −.116 −.189
(.933) (.773) (.768)EASTERNEU 1.18 .107 .217
(1.12) (.942) (.920)MIDEAST .876 1.32∗ 1.27∗
(.711) (.590) (.582)AFRICA 2.27 6.38∗ 6.38∗
(2.49) (2.24) (2.20)LANDAREA −.0066 −.0020 −.0021
(.0066) (.0055) (.0054)LANDLOCKED −.351 −.050 −.109
(.691) (.563) (.560)ISLAND 4.00∗ 3.32∗ 3.24∗
(1.33) (1.11) (1.09)R2 .833 .864 .879No. of obs. 30 30 30
Note: * and ** respectively denote significance at the 5 percent and 10 percent levels. Dependent variable: religiousfractionalization in 2001; source: Alesina et al. (2003). Source of conflict data: Brecke (1999). Source of population data:McEvedy and Jones (1978). Geographic dummy variables WESTERNEU, CENTRALEU, NORTHERNEU included inall regressions but not shown.
46
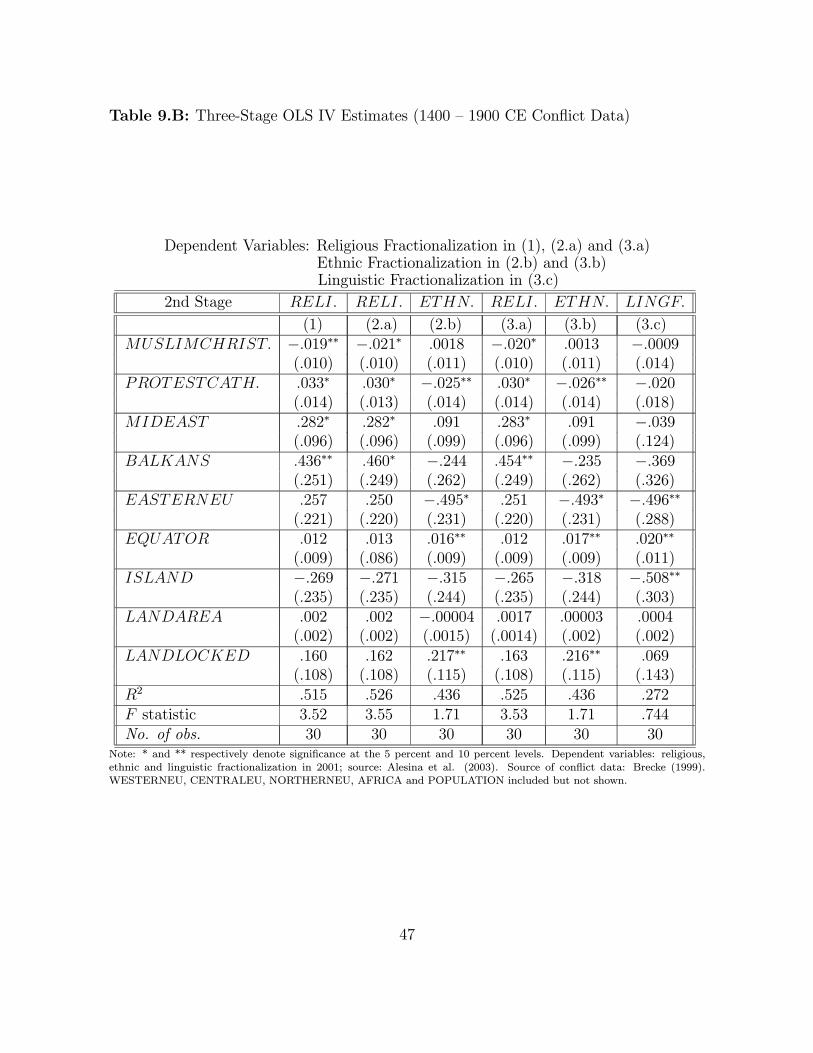
Table 9.B: Three-Stage OLS IV Estimates (1400 — 1900 CE Conflict Data)
Dependent Variables: Religious Fractionalization in (1), (2.a) and (3.a)Ethnic Fractionalization in (2.b) and (3.b)Linguistic Fractionalization in (3.c)
2nd Stage RELI. RELI. ETHN. RELI. ETHN. LINGF.
(1) (2.a) (2.b) (3.a) (3.b) (3.c)MUSLIMCHRIST. −.019∗∗ −.021∗ .0018 −.020∗ .0013 −.0009
(.010) (.010) (.011) (.010) (.011) (.014)PROTESTCATH. .033∗ .030∗ −.025∗∗ .030∗ −.026∗∗ −.020
(.014) (.013) (.014) (.014) (.014) (.018)MIDEAST .282∗ .282∗ .091 .283∗ .091 −.039
(.096) (.096) (.099) (.096) (.099) (.124)BALKANS .436∗∗ .460∗ −.244 .454∗∗ −.235 −.369
(.251) (.249) (.262) (.249) (.262) (.326)EASTERNEU .257 .250 −.495∗ .251 −.493∗ −.496∗∗
(.221) (.220) (.231) (.220) (.231) (.288)EQUATOR .012 .013 .016∗∗ .012 .017∗∗ .020∗∗
(.009) (.086) (.009) (.009) (.009) (.011)ISLAND −.269 −.271 −.315 −.265 −.318 −.508∗∗
(.235) (.235) (.244) (.235) (.244) (.303)LANDAREA .002 .002 −.00004 .0017 .00003 .0004
(.002) (.002) (.0015) (.0014) (.002) (.002)LANDLOCKED .160 .162 .217∗∗ .163 .216∗∗ .069
(.108) (.108) (.115) (.108) (.115) (.143)R2 .515 .526 .436 .525 .436 .272F statistic 3.52 3.55 1.71 3.53 1.71 .744No. of obs. 30 30 30 30 30 30
Note: * and ** respectively denote significance at the 5 percent and 10 percent levels. Dependent variables: religious,ethnic and linguistic fractionalization in 2001; source: Alesina et al. (2003). Source of conflict data: Brecke (1999).WESTERNEU, CENTRALEU, NORTHERNEU, AFRICA and POPULATION included but not shown.
47

Table 9.C: Three-Stage OLS IV Estimates (1400 — 1900 CE Conflict Data)
1st Stage Dep. Var.: MUSLIMCHRISTIAN
(1) (2) (3)ROME −.087∗ −.087∗ −.088∗
(.013) (.013) (.013)JERUSALEM .023∗ .022∗ .022∗
(.0055) (.0055) (.0055)MECCA −.113∗ −.113∗ −.115∗
(.020) (.019) (.019)ROME − JER 90.8∗ 90.3∗ 91.3∗
(16.7) (16.6) (16.6)JER−MECC .000026∗ .000027∗ .000027∗
(.000005) (.000005) (.000005)ROME −MECC .000085∗ .000086∗ .000087∗
(.000013) (.000013) (.000013)RM − JE −ME −.0026∗ −.0026∗ −.0026∗
(.00043) (.00042) (.00042)BALKANS 19.4∗ 19.7∗ 19.6∗
(2.38) (2.37) (2.37)EASTERNEU 10.5∗ 10.5∗ 10.5∗
(1.67) (1.67) (1.67)R2 .877 .877 .877F statistic 9.96 10.05 10.12
Note: * and ** respectively denote significance at the 5 percent and 10 percent levels. Source of conflict data: Brecke(1999). Duration of Muslim-Christian and Protestant-Catholic wars also predicted in the 1st stage, but not shown.
48
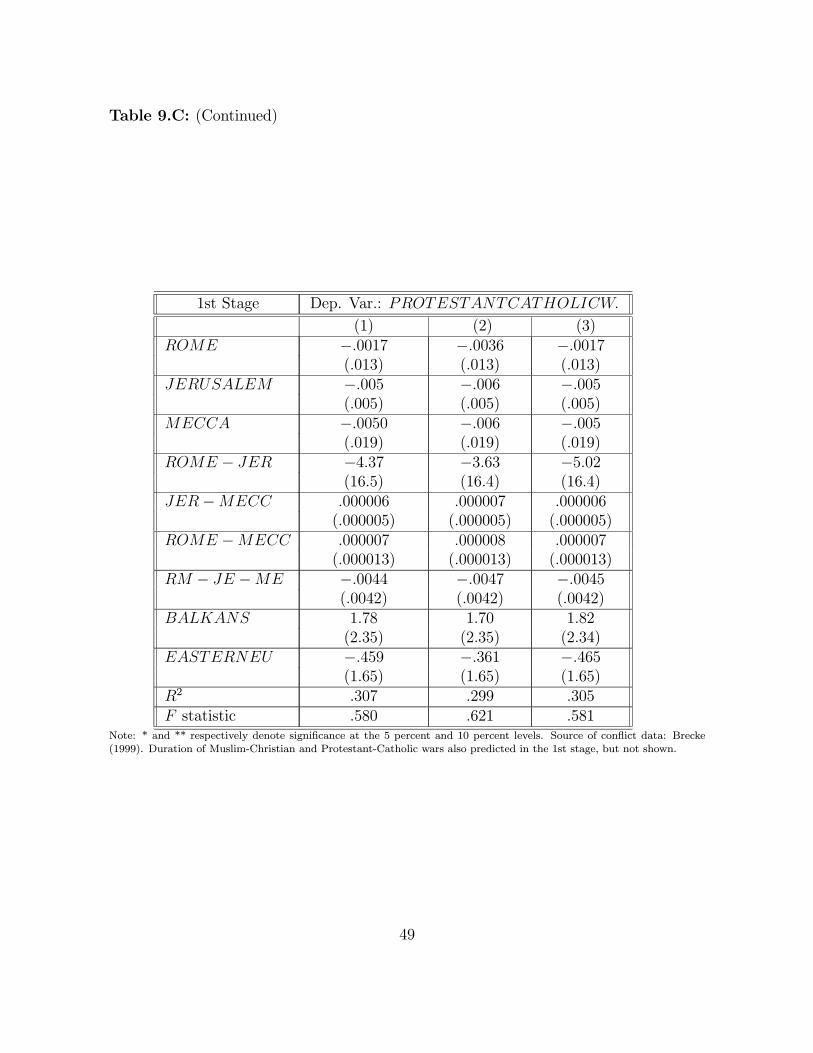
Table 9.C: (Continued)
1st Stage Dep. Var.: PROTESTANTCATHOLICW.
(1) (2) (3)ROME −.0017 −.0036 −.0017
(.013) (.013) (.013)JERUSALEM −.005 −.006 −.005
(.005) (.005) (.005)MECCA −.0050 −.006 −.005
(.019) (.019) (.019)ROME − JER −4.37 −3.63 −5.02
(16.5) (16.4) (16.4)JER−MECC .000006 .000007 .000006
(.000005) (.000005) (.000005)ROME −MECC .000007 .000008 .000007
(.000013) (.000013) (.000013)RM − JE −ME −.0044 −.0047 −.0045
(.0042) (.0042) (.0042)BALKANS 1.78 1.70 1.82
(2.35) (2.35) (2.34)EASTERNEU −.459 −.361 −.465
(1.65) (1.65) (1.65)R2 .307 .299 .305F statistic .580 .621 .581
Note: * and ** respectively denote significance at the 5 percent and 10 percent levels. Source of conflict data: Brecke(1999). Duration of Muslim-Christian and Protestant-Catholic wars also predicted in the 1st stage, but not shown.
49

Table 10: Impact of Conflicts on Polity Scores in 1994 (1400 — 1900 CE)
Dependent Variable: 1994 Polity Scores
(1) (2) (3) (4)TOTALCONFLICTS −.036 .054 −.040 −.334
(.053) (.042) (.126) (.213)MUSLIMCHRISTIAN .414 .913∗ 1.134∗ 1.570∗
(.324) (.227) (.507) (.712)PROTESTCATHOLIC −.085 −.223 −.329 1.550
(.254) (.303) (.737) (1.608)POGROM −1.09 −7.01∗ −5.46 −2.42
(2.11) (1.99) (3.97) (5.61)DURCONFLICTS .188 .095 .135 −.421
(.352) (.354) (.262) (.385)DURMUSLIMCHRIST −.457 −.440 −.474 −.804
(.373) (.350) (.511) (.543)DURPROTESTCATH .491∗ .342∗ −2.40∗∗ −.103
(.239) (.256) (.377) (1.253)DURPOGROM 13.22 95.58∗ 77.21 −4319.2∗∗
(25.12) (35.06) (57.01) (2255.3)BALKANS 7.62 3.369 −.110 −2.22
(3.206) (3.533) (5.186) (6.289)EASTERNEU 12.022∗ 9.822∗ 4.751 6.592
(2.836) (3.851) (5.490) (5.833)MIDEAST 3.891 −1.609 8.553 10.948
(3.547) (3.730) (6.239) (7.312)AFRICA −4.319 −5.547 −.964 4.238
(3.203) (3.920) (6.447) (8.420)LANDAREA ... −.0000009∗ −.0000009∗ −.000001
(.0000002) (.0000004) (.0000004)MUSLIMAJOR ... ... −.826 −3.361
(2.503) (4.681)CHRISTIANMAJOR ... ... 2.957 −1.391
(3.282) (4.524)R2 .660 .767 .826 .873No. of obs. 49 49 49 49
Note: * and ** respectively denote significance at the 5 percent and 10 percent levels. Dependent variable: religiousfractionalization in 2001; source: Alesina et al. (2003). Source of conflict data: Brecke (1999). Source of population data:McEvedy and Jones (1978). Geographic dummy variables WESTERNEU, CENTRALEU, ISLAND, NORTHERNEUincluded in all regressions but not shown. POPULATION, EQUATOR, LANDLOCK included in columns (2) through(4) but not shown. POP1000, POP1500, ROME, JERUSALEM, MECCA included in columns (3) and (4) but not shown.YRCONFLICT, YRMUSLIMCHRIST, YRPROTESTCATH and YRPOGROM included in column (4) but not shown.
50
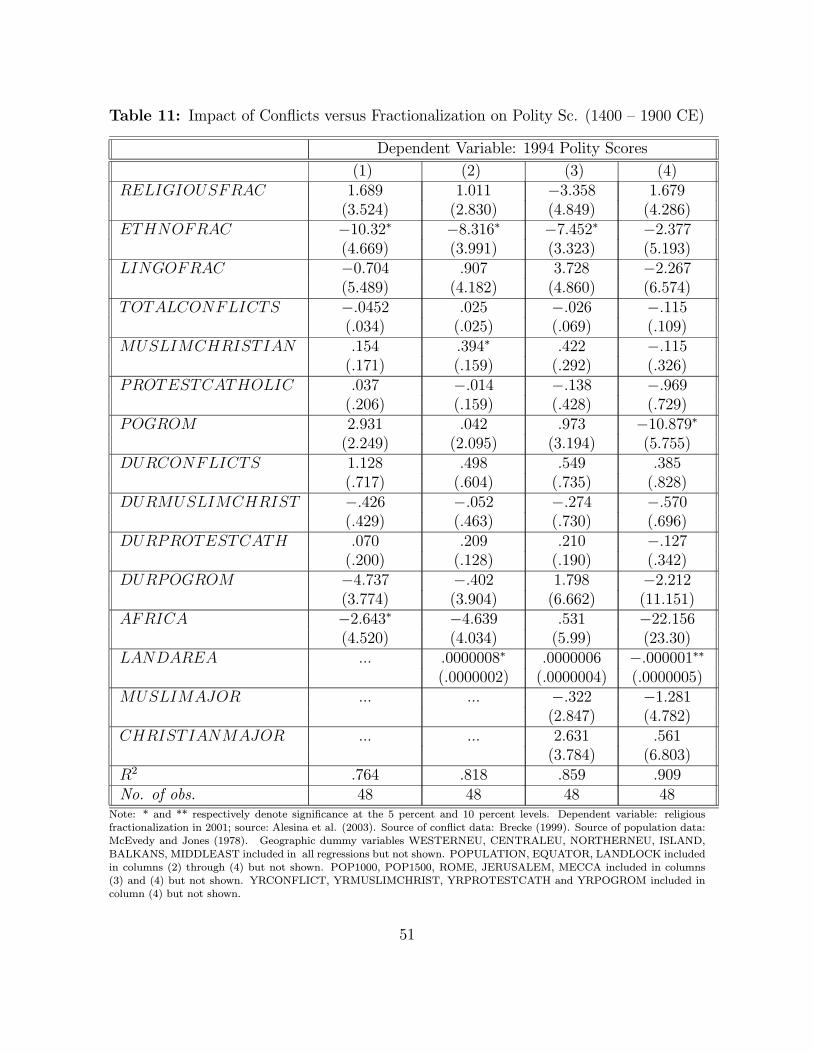
Table 11: Impact of Conflicts versus Fractionalization on Polity Sc. (1400 — 1900 CE)
Dependent Variable: 1994 Polity Scores
(1) (2) (3) (4)RELIGIOUSFRAC 1.689 1.011 −3.358 1.679
(3.524) (2.830) (4.849) (4.286)ETHNOFRAC −10.32∗ −8.316∗ −7.452∗ −2.377
(4.669) (3.991) (3.323) (5.193)LINGOFRAC −0.704 .907 3.728 −2.267
(5.489) (4.182) (4.860) (6.574)TOTALCONFLICTS −.0452 .025 −.026 −.115
(.034) (.025) (.069) (.109)MUSLIMCHRISTIAN .154 .394∗ .422 −.115
(.171) (.159) (.292) (.326)PROTESTCATHOLIC .037 −.014 −.138 −.969
(.206) (.159) (.428) (.729)POGROM 2.931 .042 .973 −10.879∗
(2.249) (2.095) (3.194) (5.755)DURCONFLICTS 1.128 .498 .549 .385
(.717) (.604) (.735) (.828)DURMUSLIMCHRIST −.426 −.052 −.274 −.570
(.429) (.463) (.730) (.696)DURPROTESTCATH .070 .209 .210 −.127
(.200) (.128) (.190) (.342)DURPOGROM −4.737 −.402 1.798 −2.212
(3.774) (3.904) (6.662) (11.151)AFRICA −2.643∗ −4.639 .531 −22.156
(4.520) (4.034) (5.99) (23.30)LANDAREA ... .0000008∗ .0000006 −.000001∗∗
(.0000002) (.0000004) (.0000005)MUSLIMAJOR ... ... −.322 −1.281
(2.847) (4.782)CHRISTIANMAJOR ... ... 2.631 .561
(3.784) (6.803)R2 .764 .818 .859 .909No. of obs. 48 48 48 48
Note: * and ** respectively denote significance at the 5 percent and 10 percent levels. Dependent variable: religiousfractionalization in 2001; source: Alesina et al. (2003). Source of conflict data: Brecke (1999). Source of population data:McEvedy and Jones (1978). Geographic dummy variables WESTERNEU, CENTRALEU, NORTHERNEU, ISLAND,BALKANS, MIDDLEAST included in all regressions but not shown. POPULATION, EQUATOR, LANDLOCK includedin columns (2) through (4) but not shown. POP1000, POP1500, ROME, JERUSALEM, MECCA included in columns(3) and (4) but not shown. YRCONFLICT, YRMUSLIMCHRIST, YRPROTESTCATH and YRPOGROM included incolumn (4) but not shown.
51