Embed Size (px)
Citation preview

Culture-Dependent and -Independent Microbial
Analyses of Petroleum Hydrocarbon Contaminated
Arctic Soil in a Mesocosm System
Michael Reisen Dyen
Master of Science
Department of Natural Resource Sciences
McGill University, Montreal
August, 2007
A thesis submitted to McGill University in partial fulfillment of the
requirements of the degree of Master of Science
©Michael Reisen Dyen 2007
Abstract
Microbial-based strategies were investigated for eventual bioremediation
of petroleum hydrocarbon-contaminated, acidic soils from Resolution
Island (RI), Nunavut. A biotreatability assessment phase one study
determined that supplementation of soil with commercial fertilizer and lime
enhanced hydrocarbon mineralization. Phase two applied these conditions
to large scale mesocosm trials, containing ~150 kg soil, incubated in a
temperature cycle that represented the ambient summer conditions on RI
(10 d of 1°C - 10°C for 60 d). Culture-dependent and –independent
analyses of RI soil microbial communities showed the mesocosm
treatment enhanced hexadecane mineralization, increased the
enumerations of total microbes and viable, cold-adapted hydrocarbon-
degrading microorganisms. DGGE analyses indicated emergence of a
hydrocarbon-degrading community and 16S rRNA gene clone libraries
showed bacterial population shift in mesocosm soils. Potentially novel
isolated strains included those able to grow on hydrocarbons alone while
under acidic or sub-zero conditions. This microbiological study addressed
RI site conditions and presents a potential bioremediation.
iii
Résumé
Des techniques s’appuyant sur la microbiologie ont été utilisée pour
évaluer la biorestauration future de sols acides, contaminés par des
hydocarbures pétroliers, à Resolution Island (RI), Nunavut. Premièrement,
une étude de biotraitabilité a permis de determiner que l’amendement du
sol avec des fertilisants de type commercial et de la chaux améliore la
dégradation des hydrocarbures. La phase deux a consisté en l’application
de ces conditions à des essais de mesocosmes à grande échelle incubés
à des températures représentant les conditions estivales de RI, i.e. cycle
de 10 jrs (1°C-10°C) pendant 60 jrs. Des analyses de microbiologie
classique et de biologie moléculaire des communatés microbiennes du sol
de RI ont démontré que l’amendement des mésocosmes a permis une
augmentaion de la minéralisation de l’hexadécane et un accroîssement du
dénombrement de total de microorganismes ainsi que des
microorganismes viables, adaptés au froid et dégradant les
hydrocarbures. Des analyses par DGGE ont démontré l’apparition d’un
communauté microbienne dégradant les hydrocarbures et une librairie de
clones d’ARNr 16S a souligné un réarrangement des populations
microbiennes présentes dans les sols de mesocosmes. Des nouvelles
souches ont été isolées, incluant certaines pouvant croître sur une source
unique d’hydrocarbures sous des conditions acides ou sous-zéro. Cet
étude microbiologique a été faite sous des conditions respectant celles
présente à RI et présente des procédés pouvant être utilisées pour la
bioremediation du site.

iv
Acknowledgments
I would like to thank my supervisor, Dr. Lyle Whyte, for giving me the
opportunity to conduct this research and study in his laboratory and my
co-supervisor, Dr. Subhasis Ghoshal for his engineering perspective on
this project. I would also like to thank Wonjae Chang, who constructed,
maintained and provided samples from the mesocosm trials, without
which, I would not have had a Master’s project. Dr. Charles Greer at BRI,
was available, helpful and insightful throughout this project, and he also
conducted all soil toxicity tests. I had the good fortune to take courses with
Dr. Donald Niven, an excellent teacher, and also TA for him and learn a
great deal about how to interact and teach students. Another excellent
teacher I had the good fortune of taking courses with was Dr. Brian
Driscoll, who kept me on my toes, really teaching me how to think critically
about a range of subjects. I feel extremely lucky to have been a member
of the Whyte lab; the friends I have made helped with me think about my
project and relax when I could not think about it anymore. Blaire Steven
was a huge help and, usually, a positive influence. Ofelia Ferrera was
always kind and Eric Bottos will always have a place to live on my couch.
Dr. Thomas Niederberger was a great friend, and I really appreciate the
editing. Also, thanks David Meek and Andy Ekins for keeping me on time
for Happy Hour; Elisabeth Lefrançois for translating my abstract; Gitanjali
Arya for sharing lab space; Sophie Charvet for the sub-zero plates; the
NRS people; my friends and family for always supporting me. This work
could not have been conducted without the financial support provided by
Indian and Northern Affairs Canada and Qikiqtaaluk Environmental.

v
Table of Contents
Abstract ..................................................................................................... ii
Résumé .................................................................................................... iii
Acknowledgments ................................................................................... iv
Table of Contents ..................................................................................... v
List of Figures ........................................................................................ viii
List of Tables ........................................................................................... ix
Chapter One. Introduction ..................................................................... 10
1.1. Resolution Island, hydrocarbon contaminated site ........................ 10
1.1.1. Hydrocarbon chemistry and spill/ soil dynamics ...................... 11
1.2. Bioremediation .............................................................................. 14
1.2.1. Bioremediation of hydrocarbon contaminated environments .. 15
1.2.2. Hydrocarbon biodegradation at cold temperatures ................. 17
1.2.3. Hydrocarbon-degrading soil microorganisms .......................... 20
1.2.4. Cold adaptations and hydrocarbon impacts ............................ 22
1.3. Soil microorganisms ...................................................................... 24
1.3.1. Isolation and characterization ................................................. 24
1.3.2. Molecular Analyses ................................................................. 26
1.4. The present study .......................................................................... 29
Chapter Two. Materials and Methods ................................................... 34
2.1. General laboratory practices ......................................................... 34
2.2. Soil samples .................................................................................. 34
2.3. Phase one: Biotreatability assessment .......................................... 35
2.3.1. 14C-Hydrocarbon mineralization microcosm assays ................ 35

vi
2.3.2. Microscopy .............................................................................. 37
2.3.3. DNA extraction and purification ............................................... 38
2.3.4. PCR and agarose gel electrophoresis ..................................... 39
2.3.5. DGGE analyses ...................................................................... 41
2.3.5. DNA sequencing and online databases .................................. 42
2.3.6. Microbial enumeration and isolation ........................................ 42
2.4. Phase two: Mesocosm trials .......................................................... 44
2.4.1. Mesocosm set-up and soil sampling ....................................... 44
2.4.2. Clone library construction from P1 B0 and P1 B60 soils ......... 46
2.4.3. Clone library analyses ............................................................. 48
Chapter Three. Results .......................................................................... 54
3.1. Soil physical – chemical and catabolic gene analyses .................. 54
3.2. Phase one: Biotreatability assessment .......................................... 55
3.2.1. 14C-Hydrocarbon mineralization assays .................................. 55
3.2.2. Microbial enumerations ........................................................... 56
3.2.3. DGGE analyses ...................................................................... 56
3.3. Phase two: Mesocosom trials ........................................................ 57
3.3.1. 14C-Hexadecane mineralization assays with mesocosm soils . 57
3.3.2. Microbial viable plate enumerations ........................................ 58
3.3.3. Total direct microbial microscopic enumerations .................... 58
3.3.4. DGGE analyses of mesocosm soils ........................................ 59
3.3.5. Clone libraries ......................................................................... 60
3.4. Microbial isolates and enrichment cultures .................................... 62
3.4.1. Biotreatability assessment isolates and enrichment cultures .. 62
3.4.2. Mesocosm isolates and enrichment cultures .......................... 63

vii
Chapter Four. Discussion and Conclusions ........................................ 82
4.1. Phase one: Biotreatability assessment .......................................... 82
4.2. Phase two: Mesocosm trials .......................................................... 84
4.2.1. Molecular analyses ................................................................. 86
4.2.2. Culture-based analyses .......................................................... 90
4.3. Major conclusions from this project ............................................... 93
References .............................................................................................. 95
Appendix ............................................................................................... 105
A1. Basic Safety Course Certificate ................................................... 105

viii
List of Figures
Figure 1.1 Resolution Island. ................................................................... 33
Figure 1.2. The Arctic (adapted from AMAP 1998). ................................. 33
Figure 2.1. Variation in mean daily temperature at RI. ............................ 49
Figure 2.2. Mesocosm tank. .................................................................... 50
Figure 2.3. Side view schematic of mesocosm tank. ............................... 51
Figure 2.4. Top view schematic of mesocosm tank. ................................ 52
Figure 3.1. Biotreatability assessment mineralization assays. ................. 66
Figure 3.2. Biotreatability assessment DGGE analysis of HC and PS soils.
................................................................................................................ 68
Figure 3.3. 14C-hexadecane microcosm assays from the P1 and P2
mesocosm trials from the bottom (B) layer. ............................................. 69
Figure 3.4. 14C-hexadecane microcosm assays from the P1 and P2
mesocosm trials from the middle (M) layer. ............................................. 70
Figure 3.5. 14C-hexadecane microcosm mineralization assays from the P1
and P2 mesocosm trials from the top (T) layer. ....................................... 71
Figure 3.6. Microbial viable plate enumerations from mesocosm P1 and
P2. ........................................................................................................... 72
Figure 3.7. Total direct microbial microscope enumerations from
mesocosms P1 and P2. ........................................................................... 73
Figure 3.8. DGGE analysis of P1 and P2 mesocosm soils. ..................... 74
Figure 3.9. DGGE analysis of composite soils sampled from mesocosms
P3, P4 and P5 from sample days 0, 20, 40, 60. ...................................... 75
Figure 3.10. Rarefaction curve of clone libraries from P1 mesocosm. ..... 77
Figure 3.11. Phylotype composition of the two clone libraries from P1
treated mesocosm. .................................................................................. 78
Figure 3.12. Phylogenetic tree of Actinobacteria-related isolated strains. 80
Figure 3.13. Phylogenetic tree of Proteobacteria-related isolated strain. 81

ix
List of Tables
Table 2.1. Mesocosm treatments. ........................................................... 50
Table 2.2. PCR primer sequences, gene targets, references. ................. 53
Table 3.1. Physio-chemical analyses of RI soil. ....................................... 65
Table 3.2. Hydrocarbon constituent analysis of HCB RI soil. .................. 65
Table 3.3. Enumerations of viable aerobic, heterotrophic bacteria from RI
soils. ........................................................................................................ 67
Table 3.4. Sequence information for mesocosm DGGE analyses (Figs.
3.8, 3.9). .................................................................................................. 76
Table 3.5. Statistical tests for the P1 B0 and P2 B60 clone libraries. ...... 76
Table 3.6. Microbial strains isolated during the present study. ................ 79
10
Chapter One. Introduction
1.1. Resolution Island, hydrocarbon contaminated site
Resolution Island (RI; 61°30'N 65°00'W) is located off the southern tip of
Baffin Island, in the Canadian territory of Nunavut, and is part of the
Canadian Arctic Archipelago (Fig. 1.1). The Arctic zone surrounds the
North Pole and can be defined geographically, as north of the Arctic Circle
latitude parallel at 66° 33’N, or by the climate, which would be the zone
with a mean isotherm of 10°C in the month of July (Fig. 1.2). The isotherm
of 10°C closely corresponds to the tree line or the zone of transition from
where fully-crowned forests can grow unimpeded by weather conditions to
where weather inhibits tree growth. Russia, Iceland, Norway, Sweden,
Denmark, the United States and Canada all have regions within the Arctic
Circle. The sub-Arctic, which lies immediately south of the Arctic, is
generally defined as the region between the 50°N and 70°N lines of
latitude, where mean monthly temperatures are above 10°C for one to
three months any given year (Fig. 1.1; AMAP 1998). Geologically, the
Arctic Archipelago has been subjected to repeated glaciation and
deglaciation events, the most recent being ~25,000 years ago (Aiken et al.
2003). The periglaciation of the Precambrian bedrock of the Canadian
Shield, which makes up RI, formed a soil profile consisting of course
sands, gravels and bare rock. The soils of these regions tend to be
nutrient deficient and acidic due to the relatively young or immature age of
the soils, and the texture and physical composition of the soil particles
(Aiken et al. 2003). RI sits ~30 miles long by ~20 miles wide with the
majority of the soil on the island at the edge of the water and is vegetated
mainly by lichens, moss and algae (Aiken et al. 2003). Historical
recordkeeping of RI weather has shown typical sub-Arctic weather
conditions, remaining below 0°C for the majority of the year from about
September to May, while during the summer months of June to August, a

11
cyclical temperature range from ~0°C to ~10°C occur in a 24 h period
(Environment Canada http://www.weatheroffice.ec.gc.ca/).
Human presence on RI can be traced back to the bipeds that crossed the
Bering straight, their decedents the Inuit, and the European explorers who
followed. Since the mid-twentieth century, anthropogenic activity on RI
focused on the construction and operation of a military radar base; part of
the Pinetree Line in the Distant Early Warning system with the United
States Air Force (USAF), in collaboration with the Canadian government,
in charge of and responsible for the construction and maintenance of the
RI base. Construction of the base started in 1951 and lasted three years,
and concluded with more than 20 buildings, an airstrip, radar arrays and
eight dump sites. It was built on the highest point on the island, a bluff on
the Western part of the island overlooking the Atlantic Ocean. The USAF
decommissioned military activities on RI in 1961, but an Air
Communication and Control Squadron remained operational on RI until
1973 (Pinetree line http://www.pinetreeline.org/site8.html). In 1974, the
site was turned completely over to the Canadian government and is
currently administered by Indian and Northern Affairs Canada (INAC)
(INAC: http://www.ainc-inac.gc.ca/nu/nuv/zxca_e.html). Between 1987 and
1990, site investigations on RI uncovered the environmental footprint left
by the military occupants; soils were found to be contaminated with
polychlorinated biphenyls (PCB), asbestos, heavy metals and petroleum
hydrocarbons (INAC http://www.ainc-inac.gc.ca/nu/nuv/zxca_e.html;
Chang et al. 2007).
1.1.1. Hydrocarbon chemistry and spill/ soil dynamics
Hydrocarbons, the major constituent of petroleum, include saturated
alkanes and cycloalkanes, and unsaturated alkenes, alkynes and aromatic
hydrocarbons. The usual composition of light crude oil is 78% saturates,
18% aromatics, 4% resins (pyridines, quinolines) and <2% asphaltenes
(phenols, porphyrins) (Olah and Molnár 2003). Refinement is based on the

12
distillation of hydrocarbon fractions, boiling off smaller, lighter molecules
until the desired carbon content is reached with upgrades or blends of
fractions combined for higher quality or specialty mixtures. The
hydrocarbon fractions in order of decreasing volatility are F1 (C6 - C10); F2
(C10 – C16); F3 (C16 – C34) and F4 (C34 – C50) with Cx referring to the
number of carbon molecules in the alkane backbone.
The spill profile, or spatial area directly contacted with discharged
hydrocarbons, depends on the time of year, amount/ extent, type of
petroleum product and soil particle size of the spill site. Hydrocarbons flow
down through the soil and larger soil particles generally allow greater
migration. The state of the ground on which the spill is discharged affects
the vertical and horizontal spill profile, with diminished oil distribution
concurrent with lower temperatures (Chuvilin et al. 2001). In frozen
ground, like seasonal or permanent ice-layers, hydrocarbon movement is
restricted mostly to small cracks and fissures or unfrozen water films
(Chuvilin et al. 2001). Surface ice will halt the penetration of hydrocarbons
into the soil, but can cause wider horizontal spread of the contamination,
so spills during the winter, when the ground active layer is frozen, tend to
have different profiles than summer spills, where oil can seep vertically
down to the permafrost layer. The hydraulic conductivity of the ice-layer,
permafrost or active layer is the quantitative measure of how water flows
though these layers, and in frozen sections, liquid movement is confined
to microscopic layers of liquid water surrounding minerals or other soil
particles (McCauley et al. 2002). These tiny coatings allow passage of
non-aqueous liquids deep into the otherwise impenetrable frozen ground
levels (McCauley et al. 2002). The type of petroleum product discharged
will also influence the terrestrial migration; in general, the more viscous
the product, the slower it will migrate. Smaller more volatile fractions will
move quickly, or evaporate, while larger fractions will take more time to
flow through soil. The overall viscosity of the spilled petroleum product is
also dependent on the ambient temperature, with colder temperatures

13
effectively increasing the viscosity and slowing the rate of hydrocarbon
movement (Olah and Molnár 2003).
As the hydrocarbons move through the soil, some of the organic carbon
will be removed from the system or become unavailable to microbes by
abiotic processes. In the soil, hydrocarbon degrading microorganisms
must be able to come in physical contact with the hydrocarbon molecules,
so that the molecule can be catabolized. This contact depends on the
concentration of hydrocarbons in soil and the physical interplay between
the hydrocarbons and the soil environment. Some hydrocarbons can be
adsorbed to humic substances (Leahy and Colwell 1990), like polycyclic
aromatic hydrocarbons (PAHs) which adsorb more readily to humic
substances as the pH of the system becomes more acidic and/ or the
temperature is decreased (Lesage et al. 2001; Ping et al. 2006). The
sorption characteristics of hydrocarbons to soil can further depend on the
soil matrix; in a marsh environment with multiple soil types, a greater
reduction of hydrocarbons was observed in sandy soils than in mineral
soils (Lin et al. 1999). Generally, hydrocarbons in soil become less
available to microorganisms with increasing concentration of soil organic
matter and soil clay proportion (Löser et al. 1999). The lipophilic nature of
hydrocarbons can also prevent interaction and possible removal by
microbes. Ghoshal et al. (1996) examined the bioavailability of
naphthalene in coal tar, a non-aqueous phase liquid (NAPL), which can
cause chronic contamination of the surrounding environment due to the
slow PAH dissolution rate. The rate of naphthalene mineralization by
microorganisms was influenced by the naphthalene mass transfer, and
reduction of a large fraction of naphthalene in coal tar was possible if
made bioavailable (Ghoshal et al. 1996).
Abiotic uptake or loss of hydrocarbons in a system is finite, reaching a
saturation point that, unless conditions change, will prevent further
removal (Lesage et al. 2001; Ping et al. 2006). This is apparent in aged

14
spills where the residual hydrocarbons are usually the larger more
recalcitrant molecules and can remain in the soil for long periods of time
without any apparent loss of concentration from either abiotic or biotic
processes (Trindade et al. 2005).Possibly to a greater extent than aged
spills, polar region hydrocarbon contamination can remain unchanged for
very long periods of time. Volitization of hydrocarbons can remove
hydrocarbons, mostly in the F1 fraction, from a system, but the cold
temperatures that characterize polar regions will greatly reduce this
volitization. Polar regions also reduce the exposure of ultraviolet (UV)
radiation, which can break down hydrocarbon molecules (Weissenfels et
al. 1992) due to the long periods of total darkness in winter and the cover
created by snow and ice that can come year-round. Even after oil
contamination is removed, the effect of an oil spill in the Arctic or sub-
Arctic has a great affect on the environment, prolonging the time for
recovery as Arctic flora and fauna tend to recuperate and grow at
relatively slower rates than their counterparts at lower latitudes (Jorgenson
1995). This recovery time would be even longer if not for the presence and
diversity of soil microorganisms able to degrade hydrocarbons.
1.2. Bioremediation
Bioremediation can be defined as any process that uses organisms to
remove contaminants from an environment in an attempt to return the
environment to pre-contaminated conditions. Bioremediation is an
inclusive term that can include bacteria, archaea, fungi and other
eukaryotes. Here, bioremediation refers to mainly bacterial activity, unless
otherwise noted. Bioremediation as a technology and environmental
clean-up strategy has been developing for some 40 years, covering a
diverse range of contaminants and environments. Petroleum hydrocarbon
contamination has affected a wide range of environments, and
approaches for the bioremediation these sites have included the three
major processes; monitored natural attenuation; bioaugmentation and;

15
biostimulation (Head et al. 2003). Environmental conditions determine
which bioremediation approach, or combination, is most appropriate.
1.2.1. Bioremediation of hydrocarbon contaminated environments
Monitored natural attenuation is considered the simplest bioremediation
approach and comprises checking the intrinsic degradation of
contaminants in an environment. Takahata et al. (2006) concluded that
monitored natural attenuation could be a possible remediation strategy for
a BTX-contaminated aquifer. In another monitored natural attenuation
study, Bradley et al. (1995) found higher rates of toluene mineralization in
an hydrocarbon-contaminated aquifer in Adak, AK, USA at 5°C than in a
Hanahan, SC, USA aquifer at 20°C. However, monitored natural
attenuation is not generally considered a feasible option for terrestrial
ecosystems, which do not have a constant nutrient flow. Contaminated
sites that have remained unchanged for long periods of time represent
situations not suited for monitored natural attenuation because there is no
evidence that once monitoring of the site starts, the contamination level
would decrease without anthropogenic intervention, as was found to be
the case with hydrocarbon contamination in Antarctic soils (Aislabie et al.
2004).
Bioaugmentation is the addition to a system of biologically active
organisms known to degrade the target contamination. The increase
number of contaminatnt-degraders in the system would then remove the
pollution faster. Presently, there is some debate as to the success of a
bioaugmentation approach for bioremediation. Whyte et al. (1999, 1998)
increased the rate of hexadecane mineralization by inoculating
hydrocarbon contaminated Arctic soil with a consortium of hydrocarbon
degrading organisms and a single hydrocarbon degrading Rhodococcus
sp. strain. However, the authors concluded that the indigenous microbial
community consisted of hydrocarbonclastic microbes well adapted to the
environmental conditions and the microbial levels were plentiful enough

16
for bioremediation of the soil without additional supplementation with
hydrocarbon degrading microorganisms (Whyte et al. 1999). Another
bioaugmentation study of hydrocarbon contaminated soil used an
excessive inoculum size of 109 CFU g-1 soil of indigenous and non-
indigenous microorganisms and found the lag time of 14C-dodecane
mineralization in microcosm mineralization assays was reduced (Mohn et
al. 2000). Bioaugmentation treatment was found to neither increase the
rate of hydrocarbon degradation nor the extent of total petroleum
hydrocarbon (TPH) removal in small scale biopiles at an Arctic soil site
contaminated with weathered diesel fuel (Thomassin-Lacroix et al. 2002).
Similar conclusions were drawn concerning the bioremediation projects for
the crude oil contaminated shorelines affected by the Exxon Valdez
accident (Atlas et al. 1995; Braddock et al. 1995). Stallwood et al. (2005)
concluded in their study of oil contaminated Antarctic soil that
bioaugmentation with an inoculum of indigenous microorganisms may
speed-up the rate of TPH degradation if applied soon after the initial spill.
Head et al. (2003) stated that bioaugmentation is only an effective
treatment in a contaminated environment when no microorganisms able to
degrade the contamination are naturally present in the environment.
These examples demonstrate the need for investigation into a
contaminated environment before proceeding with a bioremediation
strategy.
Biostimulation addresses the deficiencies of the environment, providing
the “ideal” conditions for microbial growth, activity and thus
biodegradation. Many of the beforehand mentioned studies have also
included successful biostimulation approaches (Atlas et al. 1995; Whyte et
al. 1999; Mohn et al. 2000; Thomassin-Lacroix et al. 2002; Stallwood et al.
2005). Common biostimulation practices include supplementation with
necessary or additional nutrients, water or air. More site-specific
treatments may include chelating agents to detoxify metals or surfactants
to increase hydrocarbon bioavailability. The application of biostimulants to

17
a contaminated environment can be an important a factor that should
account for the environmental conditions and other biodegradation
limitations of the system. Ex situ strategies that dig up, and remove
contaminated soils may not be feasible for widely-spread contaminated
areas or for contaminated areas that are extremely remote, leaving
various in situ strategies more common for polar bioremediation projects
(Aislabie et al. 2006). Biopiles, like the ex situ strategies, depend on
excavation of the contaminated soils, which can then be covered to
increase soil temperature and have air and nutrients piped through them
(Aislabie et al. 2006). Bioventing (pumping of air) and biosparging
(pumping of air and nutrients) are both similar to biopiles, but instead of
the contaminated soil being excavated, the desired pipes are put directly
into the earth and, therefore, the microorganisms are biostimulated below
ground (Aislabie et al. 2006). Landfarming is an above ground approach
where nutrients, water, etc. are spread onto the soil surface and mixed
into the contaminated soil (Aislabie et al. 2006). Additional soil tilling will
promote increased aeration and distribution of microorganisms, nutrients
and contaminants.
1.2.2. Hydrocarbon biodegradation at cold temperatures
The constant cold temperature of the Arctic plays an important role in the
ability of microorganisms to degrade hydrocarbons in vivo. Soil moisture
content affects the bioavailability of hydrocarbons as well, due to the
hydrophobic nature of hydrocarbons and the obligatory use of water by
microorganisms. Soil moisture content also affects the growth
characteristics of soil microorganisms and various studies have
determined different “optimal” soil moisture guidelines (Sommers et al.
1981, King et al. 1992, EPA 1995, Dibble et al. 1979). However, a soil with
high moisture content will have reduced air space in the soil matrix,
increasing the proportion of anaerobic micro-environments in the soil, thus
slowing overall hydrocarbon biodegradation. Linn and Doran (1984) found
that once soil moisture content was raised above 60%, the oxygen
18
available became the limiting factor for microbial growth. Børresen et al.
(2006) investigated different soil moisture levels in an Arctic soil and found
reduced hexadecane mineralization with 20% soil moisture content, the
highest level tested, which they conclude to be because of the oxygen
limited system. Wetting and drying cycles also affect aerobic/ anaerobic
zones in the soil matrix, and White et al. (1998) found wet/ dry cycles help
to remove phenanthrene from test soils.
Wet/ dry cycles play an important role in soil dynamics by changing the
flow and distribution of nutrients used by microorganisms. Soil nutrient
availability can hinder or help microbial growth and metabolism. The in situ
soil carbon:nitrogen:phosphorus (C:N:P) ratio may not be optimal for
microbial growth in a system, and various C:N:P soil optimization studies
have yielded a range of values with favorable results. Alexander (1999)
suggested a C:N:P ratio of 100:3:0.6, while the U.S. Environmental
Protection Agency (EPA) found that a C:N:P range of 100:10:1 to
100:1:0.5 was successful (EPA 1995). At highly contaminated sites, the
high concentration of nitrogen required to achieve these C:N:P ratios can
cause adverse effects on microbial growth. Addition of inorganic salts,
which will dissolve into the aqueous phase of the soil matrix, will
subsequently increase the salinity (Walworth et al. 2001). Different
microorganisms have different optimal osmotic conditions, and a sudden
osmotic change could inhibit microbial activity (Harris 1981), not to
mention the possible deleterious effects a sudden boost in soil nutrient
level would have on organisms adapted to a low nutrient system
(Margesin 2000). Kästner et al. (1998) found a decrease in PAH
biodegradation when soil salinity increased while Rhykerd et al. (1995)
showed that increased soil salinity reduced hydrocarbon mineralization
activity as the hydrocarbon-degrading bacterial population levels remained
constant. Multiple studies tested a range of nitrogen salt concentrations in
hydrocarbon contaminated soil and found greater total hydrocarbon
mineralization from experiments that did not use the highest nitrogen salt

19
concentrations since these levels can be toxic or inhibitory for microbes
(Børresen et al. 2006; Walworth et al. 2001; Mohn et al. 2000; Braddock et
al. 1997). Direct nitrogen-to-soil values from 100 mg N kg-1 soil to 250 mg
N kg-1 soil have been used with success in selected cases (Huesemann
1995; Whyte et al. 1999).
Osmotic pressure can additionally be increased in the aqueous phase of
the soil matrix in sub-zero (<0°C) temperatures. This occurs by salt
exclusion from frozen water into the surrounding aqueous film, which
remains unfrozen due to the freezing-point depression effect of the higher
salinity levels (Torrance et al. 2006). Accordingly, freeze-thaw cycles will
impact the soil microbial community, changing both nutrient availability
and salinity in the liquid section within the soil. Eriksson et al. (2001) found
that freeze-thaw cycles may have been responsible for increased
hydrocarbon biodegradation in microcosm experiments using diesel fuel
contaminated Arctic soil. The authors surmise that the repeated freeze-
thaw cycles could make nutrients more bioavailable. In another
investigation into hydrocarbon biodegradation under freeze-thaw cycles,
Børresen et al. (2007) monitored mineralization of radiolabeled
hexadecane and phenanthrene in Arctic soils. They found that hexacane
mineralization activity increased in the freeze-thaw cycle, when compared
to the constant temperature assays. Conversely, phenanthrene
mineralization activity was reduced in the freeze-thaw cycles (Børresen et
al. 2007). They speculated that differences in the sensitivity of the specific
hydrocarbon degrading populations to cold temperature effected
mineralization ability.
Another environmental factor that may be important for hydrocarbon
biodegradation is soil pH (Aislabie et al. 2006; Margesin et al. 2001; Leahy
et al. 1990), with a neutral pH = 6-8 described as optimal (van Agteren et
al. 1998; Norris et al. 1993). Hamamura et al. (2006) found comparable
amounts of n-alkanes of C12 to C24 mineralization in seven disparate soils

20
with ranges in pH from 5.4 - 8.8. Hydrocarbon biodegradation has been
observed under much more acidic conditions by Stapleton et al. (1998),
who found aromatic hydrocarbon mineralization in soil downstream of a
coal pile with pH = 2.0 and Hamamura et al. (2005) isolated an organism
with an alkane degradation gene homologue (alkB) from natural
hydrocarbon seeps of Rainbow Springs, Yellowstone National Park soils
with pH values of 2.8 – 3.8. Uyttebroek et al. (2007) successfully used
PAH contaminated soils at pH = 2 as inoculums to enrich cultures growing
on phenanthrene and pyrene at pH = 3, 5 and 7. These examples
demonstrate the hydrocarbon-degrading ability of microorganisms even
under acidic conditions. Investigations into hydrocarbon biodegradation in
alkaline conditions have been less extensively published than those in
acidic conditions. However, bacteria optimally degraded monocrotophos
(MCP), an organophosphorus insecticide, in wastewater at pH = 8.0
(Bhadbhade et al. 2002) and Maltseva et al. (1996) isolated an
haloalkaliphilic bacterium able to degrade 2,4-dichlorophenoxyacetic acid
at pH 8.4 – 9.4.
1.2.3. Hydrocarbon-degrading soil microorganisms
Representatives from all three major domains of life have demonstrated
the ability to oxidize and break down hydrocarbon molecules for growth
(van Hamme et al. 2003). The terminal oxidation pathway in Bacteria
sequentially oxidizes of one end of the alkane chain by a monooxygenase
(van Beilen et al. 1994). The resultant primary alcohol can then be further
oxidized by dehydrogenases to aldehydes, then carboxylic acids, which
can subsequently enter the beta-oxidation pathway (van Beilen et al.
1994). The most well characterized genes that encode the catabolic
alkane enzymes are from the OCT plasmid (van Beilen et al. 1994; van
Beilen et al. 2001) A wide range of bacterial and fungal species have been
shown to have homologues to catabolic genes related to those found on
the OCT plasmid (van Beilen et al. 2003). Rhodococcus sp. strains Q15
demonstrated multiple alkane hydroxylase systems (Whyte et al. 2002)

21
that enabled it to metabolize a range of alkane chain lengths (Whyte et al.
1998). The biterminal oxidation pathway is similar to the terminal but both
ends of the chain are oxidized, and the sub-terminal oxidation pathway
does not start at an end of the alkane chain, but in the middle and results
in a secondary alcohol (van Beilen et al. 2003). Multiple aromatic
degradation pathways have been described, though much attention has
been given to the biodegradation of naphthalene in microorganisms, most
notably from Pseudomonas. The first oxidation step of in this pathway is
by the action of dioxygenases and dehydrogenases, which convert the
aromatic hydrocarbon a cis-dihydrodiol and then a catechol (Cerniglia
1992). Different enzymes can then cleave the ring, yielding cis, cis-
muconic acid or 2-hydroxymuconic semialdehyde, depending on the
specific structure of the PAH molecule (Cerniglia 1992). The naphthalene
biodegradation pathway model has shed light on the metabolism of other
related molecules, like phenanthrene (Kiyohara et al. 1994) though some
other pathways have been noted. Instead of dioxygenases, some PAH
degradation pathways involve monooxygenases in the first stage, and
other molecules, like benzoate, are converted to protocatechuate instead
of catechol as the central intermediate (Fritsche W. and Hofrichter M.
2000). As with alkanes, a wide variety of organisms are able to use PAH
as a sole carbon source (Cerniglia 1992; Widada et al. 2002). Foght et al.
(1990) tested hexadecane and phenanthrene degradation of 138 isolates
and found that both were readily biodegraded, but not a single isolate
could degrade both compounds. A later investigation by Whyte et al.
(1997) isolated a cold-adapted Pseudomonas sp. with the ability to
degrade both PAH and alkanes. Alkanindiges illinoisensis, first isolated
and described by Bogan et al. (2003) displayed the ability to degrade a
variety of straight chain and branched alkanes, along with floruene.
Anaerobic hydrocarbon biodegradation has also been observed and
involves nitrate, ferric iron or sulphate as electron acceptors, syntrophic or
anoxygenic photosynthetic growth, or unique mechanisms to replace the
22
action of molecular oxygen in aerobic hydrocarbon biodegradation (Widdel
et al. 2001). Some examples of anaerobic hydrocarbon biodegradion
include Azoarcus sp. strain HxN1, which was shown to degrade short
chain alkanes by denitrification (Ehrenreich et al. 2000). Geobacter
metallireducens reduced ferric iron to metabolize toluene (Lovley et al.
1989), while Desulfobacula toluolica reduced sulfate (Rabus et al. 1993)
and the phototrophic Blastochloris sulfoviridis strain ToP1 used light to
also degrade toluene (Zengler et al. 1999). The processes of anaerobic
hydrocarbon biodegradation share the common trait of being relatively
slow when compared to aerobic processes (Widdel et al. 2001). The
capacity of microorganisms to degrade hydrocarbons depends on other
factors besides the absence or presence of oxygen. The structure of the
hydrocarbon molecule will greatly impact the degradation ability by an
organism. As mentioned, some organisms may not be genetically enabled
to degrade a certain class of hydrocarbon, for example alkanes or will only
be able to degrade specific members of an hydrocarbon class, for
instance only the F2 alkanes. Generally, longer chain alkanes and larger
aromatics are more difficult for biodegradation (Leahy and Colwell 1990;
Huesemann 1995). Microcosm mineralization assays at 5°C of alkanes
with various chain lengths showed Rhodococcus Q15 to more readily
degrade shorter chain length alkanes (Whyte et al. 1998).
1.2.4. Cold adaptations and hydrocarbon impacts
The microbial cold temperature adaptations include various physiological
changes. One example is desaturation of membrane lipids to increase
membrane fluidity, as exemplified by Bacillus subtilis. The des system in
B. subtilis is involved in the formation of unsaturated fatty acids, and is
induced by cold shock (Aguilar et al. 1999). Both the des transcript and
the bulk mRNA were stable longer at cooler test temperatures (Aguilar et
al. 1999). Many other difficulties face cold environment living
microorganisms, from the formation of intracellular ice to reduced catalytic
efficiency and stabilization of nucleic acids (Cavicchioli et al. 2002).

23
Microorganisms have evolved cold-active or anti-freeze proteins to
counteract such problems (reviewed by Cavicchioli et al. 2002). In terms
of hydrocarbon-degrading cold adapted microorganisms, as previously
described, a variety of organisms have displayed the ability to degrade
hydrocarbons at low or sub-zero temperatures. Whyte et al. (1999)
described the physiological adaptations of a Rhodococcus sp. strain Q15
grown at low temperatures on hydrocarbons. Q15 demonstrated an
increased cell surface hydrophobicity with production of biosurfactant(s)
when grown on hydrocarbons compared to growth on glucose-acetate.
This biosurfactant would increase the bioavailibity of naturally hydrophobic
oil constituents. Q15 was also able to adhere to solid and liquid
hydrocarbon phases via the change in cell surface hydrophobicity and a
specialized extracellular polymeric substance which formed during growth
on hydrocarbons caused cells to form clusters (Whyte et al. 1999).
Hydrocarbon contamination in cold environments, where cold-adapted
microorganisms are present, will impact the microbial community as a
whole. Juck et al. (2000) investigated the bacterial communities from two
soils from northern Canada and the Canadian high Arctic, contaminated
with hydrocarbons. Hydrocarbon-impacted soils and, pristine soils from
both sites showed similar plate counts of viable organisms cultured at 5°C
that ranged from ~106 – 108 colony forming units (CFU) g-1 soil (Juck et al.
2000). Conflicting results were observed concerning bacterial diversity of
the sites when the hydrocarbon-impacted and pristine soils were
compared. The northern Canada soil showed hydrocarbon contamination
decreased soil bacterial diversity compared to pristine while the opposite
was found for the high Arcitic soil (Juck et al. 2000), underscoring the
specificity of individual sites. Labbé et al. (2007) examined the
phylogenetic difference between hydrocarbon contaminated and pristine
soil from Alpine soils in Tyrol, Austria. DGGE analyses revealed similar
proportions of Actinobacteria, ranging from 18-20%, and Proteobacteria,
from 73-76%, in the hydrocarbon-contaminated and pristine soils (Labbé

24
et al. 2007). Among the Proteobacteria, the alpha-class was nearly double
(46%) in the pristine soil compared to the contaminated soil (24%) and the
beta- and gamma- classes were only detected in the hydrocarbon-
contaminated soil (Labbé et al. 2007). The authors further note that
pristine soil had greater quantity of potential novel phylotypes.
1.3. Soil microorganisms
1.3.1. Isolation and characterization
Though soil has proved to be an extraordinarily difficult and complex
environment for isolation and classification of microorganisms (Gewin
2006), members from the three major domains of life (Bacteria, Archaea
and Eukarya) can be isolated. To date, various microbiological analytical
tools and techniques have indicated that the most abundant and diverse
soil microorganisms belong to the Bacteria (Killham 1994). Two main
metrics for soil bacterial analyses involve classic isolation and culturing of
pure strains for further physiological and biochemical characterization, and
relatively modern culture-independent molecular classification by direct
sequencing of the small subunit ribosomal RNA gene (16S rRNA gene).
Both have distinct advantages coupled with significant drawbacks and
biases.
Classic microbiology can be traced to the first microscopic observations of
bacteria in the latter half of the 1600’s, by Antony van Leeuwenhoek and
200 years later to the beginnings of bacteriology and microbial taxonomic
classification by Ferdinand Cohn. The subsequent work of Louis Pasteur
and Robert Koch famously disproved the theory of spontaneous
generation, created the burgeoning field of medical microbiology and
focused on isolation and characterization of bacteria in pure cultures. But
it was at the end of the 19th and early part of the 20th century that Martinus
Beijerinck and Sergei Winogradsky revealed the unimaginable breadth of
microbial life in the environment, with the discovery of viruses, the
development of enrichment cultures and the amazing significance

25
microbial metabolic functions have on global geochemical processes.
Isolation of bacteria from the environment, at this point, principally
involved the plating of environmental samples on solid, nutrient rich
media. Recent technological advances involving microscopic
manipulations for individual cell isolation and novel culturing approaches
that mimic the natural environment have improved the power to isolate
pure bacterial cultures but still remain extremely limited in this respect
(Kaeberlein et al. 2002; Zengler et al. 2002; Ferrari et al. 2005).
Soil, though more difficult to work with than the marine environment, is
thought to contain the greatest biodiversity of any environment on Earth
(Roesch et al. 2007). Different investigation strategies into the biodiversity
in soil exist that involve of environmental sampling and extraction of target
molecules and include analysis of key biogenic molecules like membrane
lipid and/ or respiratory quinone profiles. The most commonly used
method for microbial classification is by sequencing the 16S rRNA gene
(Pace 1997; DeLong and Pace 2001). The 16S rRNA gene provides a
highly conserved marker, with a slow and constant mutational rate that
can be used to measure taxonomic distances between species based on
differences in the DNA sequence (Woese and Fox 1977; Woese 1987).
Many molecular phylogenetic environmental studies using 16S gene
analyses have uncovered numerous, potentially new microbial species,
genera and even domains lurking, with no cultured, laboratory strain
representative for comparison (e.g. Barns et al. 1994; Pace 1997;
Hugenholtz et al. 1998; Dojka et al. 2000; Hugenholtz et al. 2001; Sogin et
al. 2006). Speculation of the order of magnitude concerning the total
number of bacterial species is debated by microbiologists (Hong et al.
2006), making it impossible to precisely quantify the significance of the
cultured laboratory stains, which may only represent ~1% of the total
number of species on the planet (Amann et al. 1995). Torsvik et al. (1990)
used culture-independent methods to explore the number of bacterial
species in a gram of soil by using DNA:DNA hybridization from bacterial
26
genomes extracted from cells and calculated the reassociation of these
genomes. This study concluded that ~10,000 different bacterial species
were present in a gram of boreal forest. Gans et al. (2005) followed the
experimental procedure of Torsvik et al. (1990), but used computational
improvements to calculate the number of bacterial species, and estimated
that the actual quantity was nearly three orders of magnitude larger.
Roesch et al. (2007) constructed one of the largest 16S rRNA gene clone
libraries to date, with 25,000 gene fragment sequences from each of four
test soils. The authors used high-throughput pyrosequencing (Margulies et
al. 2005) and estimated a more conservative figure of ~52,000 bacterial
speices per gram soil. Clearly, a comprehensive community profile of any
environmental system based on the organisms cultured alone would be
incomplete and inaccurately represent reality. On the other hand, there
are cases of organisms cultured from an environment that were not
detected by molecular analysis of that same environment (Donachie et al.
2007) underscoring the bias inherent in the molecular techniques used.
1.3.2. Molecular Analyses
16S rRNA gene analysis introduces biases and limits the practicality of
basing community profiles solely on DNA isolation, amplification and
sequencing. The process can be divided into three major stages, each of
which can introduce bias; DNA extraction; polymerase chain reaction
(PCR); DNA sequencing and bioinformatic analyses. Various chemical
and mechanical techniques exist that are designed to extract DNA from
within cells and the surrounding physical matrix, and purify this separated
DNA (Sambrook and Russell 2001). The efficiency for DNA extraction
depends on the methods used, the physical matrix, and the cell type
(Whyte and Greer 2005). Although extraction methods are designed to
deal with distinct matrices and cell types, for instance Gram-positive cells
are generally more resistant than Gram-negative cells to lysis, no method
is considered infallible (Krsek and Wellington 1999; Martin-Laurent et al.
2001).

27
PCR, the powerful technique developed by Kary Mullis in 1983 that
exponentially amplifies specific segments of DNA, is based on a repeating
cycle of different temperatures, the physical reaction of DNA to these
temperatures and the biochemical activity of, most commonly, an enzyme
isolated from Thermus aquaticus, taq DNA polymerase. Although widely
used and authoritative, each step of the PCR cycle can introduce bias and
due to the exponential nature of the PCR, small imprecisions can become
prevalent in the PCR products. The first step is the melting, or denaturing,
of double stranded template DNA, the kinetics of which is determined by
the DNA sequence, and more specifically the percent guanine and
cytosine (%GC). With a higher %GC, less efficient melting occurs,
possibly necessitating higher melting temperatures for different lengths of
time for different samples. Once single stranded, primers can anneal to
target locations allowing the necessary starting point for DNA extension by
taq polyermase. Primer design can be tailored for the level of specificity
desired and is based on known DNA sequences and the variable and
conserved regions of those DNA sequences. Of course, the more
“universal” the primer pair, the more broad the amplification, which can
result in unwanted PCR artifacts, while conversely, more specific primers
may eliminate some artifacts but lose some desired targets. Since the
primers are based on known sequences, along with the previously
mentioned biases, it cannot be assumed that complete coverage of an
environment can be achieved using a singular molecular inquiry.
Additionally, taq polyermase has a known error rate (Saiki et al. 1988) that
will affect the subsequent PCR product sequence. Also, once the DNA
that makes up the rRNA genes is single stranded, it can form the
secondary structures that rRNA is known for, so taq must overcome these
obstacles. Once a reliable PCR product has been obtained, the DNA
sequence can be determined by automated DNA sequencing machines, of
which only very well funded laboratories can maintain in-house, leaving
the majority of researchers to send their DNA products to outside
28
sequencing centers. With reliable sequences, online databases (National
Center for Biotechnology Information, NCBI; Ribosomal Database Project,
RDP) are used to help classify the unknown sequence, though strict
regulation of the online databases is ambiguous. Subsequent phylogenetic
analyses (e.g. dendograms) have no standard protocols making
generation and interpretation somewhat uncertain. PCR can also be used
to target and amplify any section of DNA, including catabolic genes or
genetic regulatory regions (van Beilen et al. 2001) and more recently in
conjunction with other molecular techniques, whole genomes of organisms
or the metagenome of an entire ecosystem (Handelsman 2004).
Discrimination of the different multiple 16S rRNA gene PCR products from
the sampled environment is the next step in molecular microbial ecology.
Two widely used and respected techniques for the discrimination of any
PCR products are denaturing gradient gel electrophoresis (DGGE) and
the clone library, used singularly or in combination by many of the above
mentioned studies. DGGE uses the difference in DNA sequence, more
specifically the unique denaturing kinetics of a DNA fragment that is
determined by %GC in that DNA fragment, and the negative charge of
DNA to separate distinct fragments (Muyzer et al. 1993). PCR products
are separated on a polyacrylamide gel with the denaturants urea and
formamide increasing in concentration along a gradient in the gel. The
PCR products are pulled through the gel by electric current and as the
DNA fragments encounter increasing concentrations of the denaturants,
the molecules separate and migration through the gel is retarded. The
DNA fragment does not fully separate because special DGGE primers are
used during the PCR amplification stage that have a GC-clamp, which is a
DNA sequence of ~40 bp added to the end of the PCR product, consisting
entirely of GC, thus preventing complete denaturation. Because the
unique sequence of each PCR product determines the position in the gel
where migration stops, the DNA bands that form tend to represent
different organisms. The individual bands can subsequently be cut, re-
29
amplified by PCR and sequenced. Muyzer et al. (1993) displayed the
sensitivity of DGGE finding it possible to resolve representatives at only
1% of the total population. Applications for these molecular fingerprints or
DNA community profiles have included comparisons between two different
environmental samples or to mark the community change in one sample
over time, among others (reviewed in Muyzer et al. 1998).
Clone libraries based on 16S rRNA genes are another method for
molecular community investigation, starting again with extraction of DNA
from the organisms in an environmental sample and PCR-amplification of
the 16S rRNA gene. The PCR product is then ligated into a suitable vector
followed by transformation into a suitable host, most commonly
Escherichia coli. Host bacteria are grown and plated on selective media
with the subsequent colonies individually prepared for vector DNA
isolation and PCR-amplification of the ligated section of the vector. The
resultant PCR products can then be sequenced, and the community
representative clone library can be scrutinized with various statistical tools.
Unlike DGGE, which gives a qualitative approximation of the population
proportion of an individual microorganism, clone libraries can quantify the
proportions of each distinct group represented in the community. As
mentioned, both DGGE and clone libraries have been used extensively in
many studies, some of which have employed both (e.g. Perreault et al.
2007), and each having common and unique applications and
shortcomings (Spiegelman et al. 2005).
1.4. The present study
This collaborative project was supported by INAC and Qikiqtaaluk
Environmental (QE) (Montreal, Canada) and involved the Department of
Civil Engineering and Applied Mechanics (CEAM) and the Department of
Natural Resource Sciences (NRS) at McGill University. The analyses of
PhD candidate Wonjae Chang in the laboratory of Dr. Subhasis Ghoshal
of CAEM were used in conjunction with the results presented here to

30
achieve the future on-site bioremediation of petroleum contaminated soils
from a former military radar station located on RI. The overall project
focused on increasing the rate of hydrocarbon mineralization by
landfarming through biostimulation of the indigenous microbial populations
of RI soil under conditions similar to that found naturally on RI. The
microbiological aspects of this research, presented here, included
investigation of the soil bacterial community via culture-dependent and
-independent methods and characterization and monitoring the response
of the community to the various treatments. This microbiology
investigation was divided into two phases; biotreatability assessment and
mesocosm trials. Because the long-term goals of this project are the
eventual bioremediation of the actual RI site, mesocosm scale
investigations are essential to obtain cost and design data (Schmidt and
Scow 2001). The scale-up procedure is also important, as early
identification of potential problems will translate into smooth field-scale
implementation (Battaglia and Morgan 1994).
The first phase of biotreatability assessment was a relatively minor
component of the overall project, but essential to identify possible
treatment strategies for the main component of the project, large scale
mesocosm trials. The biotreatability assessment used small scale
microcosm mineralization assays of ~20 g soil and representative 14C-
labelled hydrocarbons (hexadecane, phenanthrene and naphthalene) to
monitor soil microbial mineralization activity at a constant temperature of
5°C. Different soil treatments were tested to amend the naturally nutrient-
deficient and acidic RI soil. Due to the small scale, many microcosm
assays could be tested to identify the optimal soil treatment. Culture-
dependent analyses were also conducted to enumerate the heterotrophic
and hydrocarbon-degrading microbial populations on solid media plates.
Culture-independent analysis included total soil community DNA extracted
and examined for the presence of bacterial catabolic genes involved in
hydrocarbon degradation. Additionally, the soil bacterial community was

31
investigated by PCR-DGGE analysis. The information gleaned from these
initial investigations was then scaled up and applied in phase two, the
mesocosm trials. This scale up process also served a troubleshooting
role, as it identified unique problems for the actual scale up procedure
under controlled laboratory conditions.
The major component of this project was the mesocosm trial because it
offered a closer representation of the actual on-site conditions found at RI,
thus increasing the likelihood that the data obtained would accurately
reflect the future on-site bioremediation project. The mesocosm tanks,
which were designed, constructed and maintained by W. Chang at CEAM,
contained ~150 kg RI soil and the mesocosm trials were conducted under
conditions that closely mimicked the RI summer, when the indigenous
microbial population is most metabolically active and when the highest
rate of hydrocarbon degradation would be expected to take place. The
mesocom tanks were housed in an unique indoor facility for cold-
temperature remediation research at CEAM, where temperatures can be
programmed to follow a constant cyclical pattern. Following the pattern of
a typical RI summer, the trials lasted 60 days and the temperature was set
to cycle from 1°C to 10°C.
The microbial analyses during the mesocosm trial used soil sampled at
four time points (days 0, 20, 40 and 60) from three layers( top, middle and
bottom). Microbial hydrocarbon mineralization activity, population level
and community were measured. Microbial hydrocarbon mineralization
activity was monitored by spiking the mesocosm soil with 14C-hexadecane.
These activity studies were designed to give a snap-shot measurement of
the microbial mineralization activity of the mesocosm at that specific time
from that specific layer. Microbial population levels were quantified by
direct epifluorescent microscopy, and by plate culturing of cultivatable,
viable, aerobic, hydrocarbon-degrading organisms. DGGE was used to
track the changes in bacterial population due to the mesocosm treatment,

32
and clone libraries were constructed to determine the overall alteration of
the bacterial community from the beginning of the mesocosm experiment
to the end.
Lastly, cultured isolates were purified and identified by 16S rRNA gene
sequencing to further understand the cultivatable proportion of the
community. Growth of isolated strains at different temperatures and on
different media was also investigated, for possible future bioaugmentation
studies. Potentially novel isolates could also improve the general
knowledge concerning biodiversity in soil microbiology from an unique
site.
.

33
Figure 1.1 Resolution Island.
Figure 1.2. The Arctic (adapted from AMAP 1998).

34
Chapter Two. Materials and Methods
2.1. General laboratory practices
All microbiological analyses conducted in NRS were carried out following
rigorous aseptic techniques and procedures. Unless otherwise noted, all
equipment was sterilized by autoclaving at 121°C for at least 15 min at 15
pounds per square inch (103 kPa), or provided sterile by the
manufacturer. All solutions and media were autoclaved or sterilized by
passage through sterile MCE 0.22 μm pore size, 25 mm syringe filters
(Fisher Scientific, Waltham, MA), or guaranteed sterile by the
manufacturer. Metal or glass spatulas, tweezers, spreading sticks,
inoculating loops or other manipulation tools were sterilized in 70 – 90%
ethanol with subsequent flaming, or flaming to a red hot state. All
manipulation tools were cooled before use. All microbiological analyses
were conducted in a Thermo Forma class II A2 biological safety cabinet
under laminar flow (Thermo Forma, Marietta, OH) or under a flame to
maintain a sterile environment. Latex or non-latex gloves were worn in
order to reduce the risk of contamination by microorganisms or enzymes.
All chemical solutions, reagents or other ingredients were of reagent-
grade quality and purity as provided by the manufacturer and prepared
with sterile deionized water (ddH20). All solutions or equipment used for
DNA analyses were subjected to a minimum of 20 min of UV light in either
a Thermo Forma class II A2 biological safety cabinet under laminar flow
(Thermo Forma, Marietta, OH) or a Fisherbrand UV sterilization cabinet
(Fisher Scientific, Waltham, MA).
2.2. Soil samples
RI soil for this project was provided by INAC and QE, and received by
CEAM, who were responsible for transportation and maintenance of the
samples until, delivered for microbiological analyses to NRS. Soil provided
by INAC and QE included samples that were labeled as both pristine
(uncontaminated with hydrocarbons) and hydrocarbon contaminated soil.

35
The first sample bags of pristine and contaminated soils came in summer
of 2005 and designated PS and HC, respectively. The bulk soils used for
all mesocosm assays were received by CEAM in October of 2005 and
designated PSB (for pristine soils-bulk) and HCB (for hydrocarbon
contaminated soils-bulk). All samples for microbiological analyses
received from CEAM were in sterile Whirl-pak sampling bags (Nasco, Fort
Atkinson, WI) having been frozen at -20°C. Samples were transported to
NRS in coolers with ice to maintain low temperatures, and were stored at -
20°C and handled aseptically in NRS. Soil physical – chemical analyses
and hydrocarbon constituent analysis were conducted by Maxxam
Analytique Inc. (Montreal, Canada) and CEAM. Soil lettuce seed
germination (Greene et al. 1989), earthworm lethality (EPA 1989) and
Microtox (Environment Canada 1992) tests were conducted at the
Biotechnology Research Institute (BRI) (Montreal, Canada).
2.3. Phase one: Biotreatability assessment
2.3.1. 14C-Hydrocarbon mineralization microcosm assays
Microcosm assays were set up in 100 mL serum bottles (Fisher Scientific,
Waltham, MA) capped with either gray butyl (Wheaton, Millville, NJ) or
Septa-Teflon (Supelco, Bellefonte, PA) stoppers. Microcosms were
aseptically monitored by wiping the stopper with 70% ethanol before
sampling. To maintain the in situ temperature of each microcosm, all
sampling was conducted on ice in a fume hood and the time each
microcosm was removed from an incubator was minimized. Each
microcosm contained ~20 g (wet weight) of soil and 1 borosilicate glass 12
x 75 mm disposable culture tube (Fisher Scientific, Waltham, MA) that
held 1 mL of CO2 trap solution. All trap solutions consisted of 1 M KOH
plus ethylene glycol (Fisher Scientific, Waltham, MA) at the following
concentrations: 5°C incubation, 10%; -5°C and -10°C incubation, 20%;
-15°C incubation, 30%. Radiolabeled substrates, 9-14C-phenanthrene
(Sigma-Aldrich), 1-14C-naphthalene (Sigma-Aldrich) or 1-14C-hexadecane,

36
(Amersham Piscataway, NJ) were added to a final disintegrations per
minute (dpm) counts of ~80,000 - 100,000, plus 100 ppm cold (not
radiolabelled) hexadecane or 10 ppm cold phenanthrene or naphthalene.
Hexadecane solutions were prepared in hexanes (Fisher Scientific,
Waltham, MA), while naphthalene and phenanthrene solutions were
prepared in methanol and ethanol (Fisher Scientific, Waltham, MA),
respectively. Sterile controls were autoclaved with soil at 121°C for at least
30 min at 15 pounds per square inch (103 kPa) on two consecutive days
prior to the beginning of the experiment. Fertilizer amendments used
either mono-ammonium phosphate fertilizer (MAP; Yunnan Newswift
Company Ltd.) which is guaranteed by the suppler to contain ≥49%
available phosphate and ≥9% total nitrogen (N) or Plantex 20:20:20 All
Purpose Fertilizer (20:20:20; Plant Products Company Ltd.) which is
guaranteed by the manufacturer to contain 20% total N, 20% available
phosphate and 20% soluble potash. Fertilizers were added to have a final
N concentration of 250 g g-1. When added alone, potassium phosphate
was added to a final concentration of 50 g g-1. When added alone,
ammonium nitrate was added to a final concentration of 87.5 g g-1.
CaCO3 was added to a final concentration of 10 mg g-1, which was found
to give a soil pH of 6.5 – 7 (Chang et al. 2007). All amendments and
radiolabeled substrate solutions were added to the soil, vigorously
vortexed to ensure even distribution within the microcosm bottle.
Microcosm assays incubated at 5C were monitored for eight weeks and
were sampled once a week, while those incubated at sub-zero
temperatures were sampled every 2 – 4 weeks. For sampling, the CO2
trap solution was drawn out of the glass test tube and washed with an
additional 1 mL of fresh trap solution, and another 1 mL of trap solution
added. The 2 mL of sampled trap solution was added to 20 mL glass
scintillation vials (Fisher Scientific, Waltham, MA) with 18 mL of
ScintiVerse scintillation fluid (BD, Franklin Lakes, NJ) and counts were
read on a Beckman-Coulter LS 6500 Multi-Purpose Scintillation Counter

37
and the supplied software (Beckman Coulter, Inc., Fullerton, CA) with a
count time of 5 min for each vial. Radioactive counts from the extracted
collection plus scintillation liquid solution represented the proportion of the
radioactive substrate mineralized to 14CO2 and retained in the collection
solution as K214CO3 (no precipitates observed). Ethylene glycol, a
quenching agent, added to the collection solution prevented the collection
solution from freezing and had only minor quenching effects (Steven et al.
submitted for publication). All microcosm assays had three replicates for
each individual assay.
2.3.2. Microscopy
Light microscopy of samples was undertaken using a Nikon Eclipse E600
microscope (Nikon, Canada), with wet and dry mounts for eukaryotic cell
morphology determination (Sambrook and Russell 2001). Epifluorescent
microscopy also used the Nikon Eclipse E600 microscope equipped with a
Nikon super high pressure mercury lamp, for total soil microbial
enumerations. Samples for epifluorescent microscopy were prepared as
follows: 1 g of soil was placed into a sterile test tube with 2.5 g of sterile 3
mm glass beads (Fisher Scientific, Waltham, MA) and 9 mL of 0.1%
Na4P2O7 10 H2O and vortexed for 2 min. Appropriate dilution series were
prepared using 0.1% Na4P2O7 10 H2O and 900 L from the appropriate
dilution was added to 100 L 5-([4,6-Dichlorotriazin-2-yl]amino)fluorescein
hydrochloride solution(DTAF; Sigma-Aldrich). DTAF solution was made
fresh and kept in the dark for each use. The solution consisted of 5 mg
DTAF mL-1 dissolved in 0.05 M Na2PO4. The soil dilution and DTAF
solution mixture was allowed to stain, in the dark, for at least 30 min, then
filtered through a Poretics polycarbonate black 0.22 micron 25 mm filter
(Osmonics Inc., Westborough, MA). The filter was then air dryed, in the
dark, after which a drop of non-drying immersion oil for fluorescence
microscopy type FF (Cargille Laboratories Inc., Cedar Grove, NJ) was
added with a cover slip placed on top and another drop of the same
38
immersion oil on top of the cover slip for oil immersion viewing. DTAF
covalently binds to the primary hydroxyl groups of carbohydrates and N-
termini of proteins with an excitation range in blue light of 450–490 nm and
gives a yellow-green emission in the range of 515–565 nm (Schumann et
al. 1998). Enumeration calculations were generally conducted as
described Kepner and Pratt (1994) by counting ten random fields from the
filter with the mean number from the ten fields reported, and accounts for
the dilution series and field size, resulting in a “cells g-1 soil” value.
2.3.3. DNA extraction and purification
Total community DNA from RI soil was extracted from soil slurries (section
2.3) using an UltraClean Soil DNA Kit (Mo Bio, Solana Beach, CA),
following the manufacturers protocol. Individual isolate DNA was either
extracted using a DNeasy Tissue Kit (Qiagen, Mississauga, ON) following
the manufacturers protocol for Gram-positive bacterial DNA extraction or
via the boiling lysis technique that calls for colonies scraped from a plate
and suspended in 500 L of ddH2O; boiled for 10 min; cooled at -80C for
15 min; boiled for 10 min; cooled on ice and centrifuged for 2 min at
13, 600 x g. Cell debris was discarded and the supernatant stored. Boiling
lysis was also used for DNA extraction of clones. All soil DNA extracts
were stored at -20°C.
Soil DNA extracts from soil was purified by polyvinylpolypyrrolidone
(PVPP) solution spin columns (Berthelet et al. 1996). Briefly, 300 g of
insoluble PVPP was suspended in 4 L of 3 M HCl for 12 to 16 hours at
room temperature. The suspension was filtered, and the captured PVPP
was resuspended in 20 mM KH2PO4 (pH 7.4) and stirred for 1 to 2 hours.
The filtering and resuspension process was repeated until the suspension
reached pH 7.0. The PVPP suspension was stored at 4 °C until used.
Approximately 450 L of PVPP mixture was aliquoted into sterile
microspin columns (Amersham Biosciences, Buckinghamshire, UK) and
these columns with PVPP were placed in sterile microcentrifuge tubes.

39
Columns were centrifuged twice at 800 x g for 3 min at room temperature,
in order to remove all extra PVPP mixture liquid, after which columns were
placed in new, sterile microcentrifuge tubes and DNA extracts were
applied to the centre of columns. Columns were spun at 800 x g for 3 min
at room temperature and the eluted DNA extract was stored at -20°C.
2.3.4. PCR and agarose gel electrophoresis
PCR was performed in 0.2 mL thin walled PCR tubes, thin walled 12 tube
strips, or 96-well PCR plates (Diamed Lab Supplies Inc., Mississauga,
ON) using either a Touchgene Gradient thermocycler machine or TC-312
thermocycler machine (both from Techne Inc., Burlington, NJ). All PCR
reagents were supplied by Invitrogen Canada, Burlington, ON, and stored
at -20°C, unless otherwise noted. Standard PCR reactions contained 1x
PCR buffer, 0.2 mM of each dNTP, 0.75 - 1.5 mM MgCl2, 1 – 4 L
template DNA, 0.5 M each primer (Table 2.2), 2 – 3 units of Taq
polymerase, 10 mg mL-1 bovine serum albumin (BSA; Fisher Scientific,
Waltham, MA), and the final volume was 25 – 50 L in H2O. All H2O for
molecular analyses was pretreated through a Millipore Simplicity 185
(Millipore Corp., Billerica, MA) and UV irradiated for 30 min. Except for the
Taq-polymerase, primers, dNTPs and DNA, all PCR reagents were UV-
treated prior to each reaction. PCR primer sequences, and the specific
DNA target for those primers are listed in Table 2.2. All primers were
purchased from MWG-Biotech (High Point, NC), and stored in 100 mM
stocks at -20°C, unless otherwise noted. Negative PCR controls were
prepared as above but with the template DNA replaced with H2O
pretreated through a Millipore Simplicity 185 (Millipore Corp., Billerica,
MA) and UV irradiated for 30 min to ensure no extraneous DNA
contamination of reagents. Positive controls used DNA known to amplify
under the given PCR conditions, and were used to ensure that proper
reaction conditions were achieved. The PCR protocol for universal
bacterial 16S rRNA gene amplification was as follows: 3 min at 95°C; 30

40
cycles of 1 min at 94°C, 1 min at 55°C, and 1 min at 72°C; and a final
extension of 7 min at 72°C. Amplification of DNA for DGGE analysis
consisted of 5 min at 96°C; 10 cycles of 1 min at 96°C, 45 s at 68°C in the
first cycle touching down 0.9°C per cycle to 59°C in the last cycle, and 1
min 30 s at 72°C; 15 cycles of 96°C for 1 min, 59°C for 45 s and 72°C for
1 min 30 s; and a final extension of 5 min at 72°C. The products of
multiple PCR were pooled in order to obtain the necessary 500 ng DNA
for DGGE analysis. Pooled PCR products were cleaned using the
QIAquick PCR Purification Kit (Qiagen, Mississauga, ON) following the
protocol provided by the manufacturer. The PCR protocols for
amplification of bacterial catabolic genes was as follows: alkane
monooxygenase (alkB); 5 min at 96°C; 25 cycles of 1 min at 94°C, 1 min
10 s at 55°C, 1 min 10 s at 72°C; final extension of 10 min at 72°C:
catechol-2,3-dioxygenase and naphthalene dioxygenase, (xylE and ndoB,
respectively); 96°C for 5 min; 30 cycles of 1 min at 94°C, 1 min at 60°C, 1
min at 72°C; 3 min at 72°C: phenanthrene dioxygenase (phnAc); 96°C for
5 min; 35 cycles of 30 s at 94°C, 30 s at 52°C, 1 min at 72°C; 10 min at
72°C. Amplification of eukaryotic 18S rRNA gene used the following PCR
protocol; 96°C for 5 min; 40 cycles of 1 min at 94°C, 1 min at 55°C 1 min
at 72°C; 10 min at 72°C. The PCR protocol for amplification of eukaryotic
18S rRNA gene for DGGE analysis was 96°C at 5 min; 19 cycles of 1 min
at 94°C, 1 min at 64°C, 1 min at 55°C, 3 min at 72°C; 10 cycles of 1 min at
94°C, 1 min at 55°C, 3 min at 72°C; 5 min at 72°C. DNA in PCR products
was quantified by gel electrophoresis using the Chemi Genius BioImaging
System with the GeneTools software (Syngene, Frederick, MD) or by
measuring absorbance of extracts at 260 nm (Sambrook and Russell
2001) on an Ultrospec 2100 Pro UV/visible spectrophotometer (Biochrome
Corporation, Cambridge, UK).
Gel electrophoresis was performed with horizontal 0.8 - 1.0% agarose
(Fisher Scientific, Waltham, MA) gels buffered with either TAE buffer (40
mM Tris acetate, 1 mM EDTA, pH 8.0) or SB buffer (5 mM Na2B4O4 10

41
H2O, pH adjusted to 8.5 with H3BO3) with gels containing 0.5 g mL-1
ethidium bromide. TAE gels were generally run at 85 volts for 45 min,
while SB gels were run from 100 – 300 volts for 7 – 15 min. DNA samples
were mixed with 5x loading buffer [0.25% (w/v) bromophenol blue, 0.25%
(w/v) xylene cyanol FF, 30% (v/v) glycerol in H2O]. Molecular weight
standards DNA HindIII and 100 bp ladder (Invitrogen Canada,
Burlington, ON) were prepared by addition of 46 L of 500 g mL-1
molecular weight standard stock to 20 L 1 M NaCl, 0.2 L 0.5 M EDTA,
20 L 1 M Tris-Cl pH 7.8 and sterile H2O to a final volume of 900 L and
heated 10 min at 65C then cooled on ice for 10 min and added to 100 L
10x loading buffer. 5 L of the molecular weight standards were loaded
into gels. Gels were visualized on a Chemi Genius BioImaging System
with the GeneSnap software (Syngene, Frederick, MD). DNA extracted
from bands used the QIAquick Gel Extraction Kit (Qiagen Inc.,
Mississauga, ON) following the manufacturers protocol.
2.3.5. DGGE analyses
Primers 341F-GC and 758-R (Table 2.2) were used to amplify a ~400 bp
region of the bacterial 16S rRNA gene, which included a ~40 bp GC
clamp. PCR products were quantified, and pooled to have 500 ng of PCR
product for each sample. DGGE was performed using a BioRad DCode
Universal Mutation Detection Systen (BioRad Hercules, CA), following the
instructions provided by the manufacturer. Samples were loaded onto an
8% (v/v) acrylamide gel with a denaturing gradient generated by urea and
formamide, ranging from 35% - 65%, in TAE buffer with a final volume of
11.5 mL. A 6% (v/v) acrylamide gel with 0% denaturant was used as a
spacer gel, final volume of 10 mL, where the samples were loaded, but
was discarded after the completion of the run. Each DNA sample was
loaded into the wells of the spacer gel, previously having been mixed with
DGGE 2x loading dye (0.05 % bromophenol blue, 0.05 % xylene cyanol,
and 70 % glycerol in deionized water). Electrophoresis was performed for

42
16 h at 60 V and 60C. Gels were stained for at least 1 h in Vistra Green
Nucleic Acid Stain (1:10000 dilution; GE Healthcare Bio-Sciences AB,
Uppsala,Sweden). Gels were visualized on a Bio Rad Molecular Imager
FX equipped with an External Laser Imager FX (Bio-Rad Laboratories
Inc., Hercules, CA). The DGGE procedure, starting with the soil extracted
community DNA, was repeated at least once to ensure that a similar
banding pattern appeared in the DGGE gel. DNA was extracted from
DGGE gels by elution of cut bands in 20 µL of UV-treated ddH2O
overnight, followed by re-amplification of the DGGE-band DNA by PCR.
DGGE analyses were conducted on HC soil set up in parallel to
microcosm mineralization assays, but excluding the radioactive substrate.
After two months of incubation at 5°C, DNA was extracted and purified
and otherwise prepared for DGGE analysis. For mesocosm soils, DNA
prepared for DGGE analyses as above and stored at -20°C until the end
of the mesocosm trials so samples from all mesocosm time points could
be run on the same DGGE gel.
2.3.5. DNA sequencing and online databases
Primers 341-F and 758-R (Table 2.2) were used to amplify a ~400 bp
region of the bacterial 16S rRNA gene from total soil community DNA.
PCR products and primer 341F, were sent for sequencing to either the
McGill University and Genome Quebec Innovation Centre (Montreal, QC),
which uses a 3730XL DNA Analyzer system or the Plate-forme d'analyses
biomoléculaires at the Université Laval (Québec, Canada), which employs
two 16-capillary genetic analyzers: an ABI Prism 3130XL and an ABI
Prism 3100XL. 16S rRNA gene sequences obtained were compared to
the public, online databases of NCBI with BLAST (BLAST; Altschul et al.,
1990) and the Ribosomal Database Project II (RDP; Cole et al. 2007).
2.3.6. Microbial enumeration and isolation
Microorganisms were isolated and enumerated from soil samples on solid
media using the spread plate technique (Sambrook and Russell 2001).

43
Screw-cap test tubes with 2.5 g of 3 mm glass beads (Fisher Scientific,
Waltham, MA) were sterilized by autoclaving and ~5 g soil added to tubes.
Dilution solution (0.1% Na4P2O7 10 H2O) was added to 3-4x v/w of soil to
create a soil slurry. The soil slurry was vortexed for ~2 min after which an
appropriate dilution series was prepared in dilution solution. Aliquots were
plated onto appropriate solid media plates. For solid media, 15% Bacto-
Agar (Difco Laboratories, Detriot, MI) was added, while liquid versions
were the same recipes minus the agar. Incubation of inoculated plates for
viable plate enumerations was conducted at either 5C or ambient room
temperature (~24C). Luria-Bertani (LB) broth contained per litre: tryptone,
10 g; yeast extract, 5 g; NaCl, 5 g. Minimal salts medium (MSM)
contained: 1 M NaH2PO4; 1 M K2HPO4; 1 M (NH4)2SO4; 0.5 M MgSO4 • 7
H2O; 1 mL L-1 of trace mineral solution. Trace mineral solution contained
(mM): Co(NO2)2 • 6 H2O (1); AlK(SO4)2 • 12 H2O (1); CuSO4 (1); ZnSO4 • 7
H2O (10); MnSO4 • H2O (10); FeSO4 • 7 H2O (10); Na2MoO4 2 H2O (2);
Ca(NO3)2 • H2O (10). MSM was amended with 200 L of Arctic diesel
(Shell Canada) or hexadecane (Acros Organics, New Jersey, USA)
soaked onto a sterile 2 cm2 piece of filter paper stuck to the inside lid of
the petri plate. The pH for MSM was either ~7.2 or ~4.5. R2A (Difco,
Detroit, MI), contained 0.5 g yeast extract, 0.5 g proteose peptone No. 3,
0.5 g casamino acids, 0.5 g dextrose, 0.5 g soluble starch, 0.3 g sodium
pyruvate, 0.3 g K2HPO4, 0.05 g MgSO4 • 7 H2O, (pH 7.2 ± 0.2). Media pH
was adjusted with HCl or NaOH and measured with an Accumet basic
AB15 pH meter (Fisher Scientific, Waltham, MA). Colonies were incubated
and counted for two months maximum. Colonies with different morphology
and emergence time were selected and re-streaked at least 3 times before
performing DNA isolation or making stocks prepared in either 10% R2A or
LB supplemented with 20% v/v glycerol, and stored frozen at -80C. All
plate enumerations contained three replicates for each individual dilution.

44
Isolated strains were tested for growth at sub-zero temperatures, -5°C,
-10°C, -15°C. R2A plates were supplemented with one of the following
freezing point depressants: 1%, 2.5%, or 5% v/v ethylene glycol (Fisher
Scientific, Waltham, MA); 7% or 10% w/v sucrose (Fisher Scientific,
Waltham, MA). Sub-zero culturing on MSM - Arctic diesel plates was
supplemented with either 1.35 M or 2.5 M NaCl (Fisher Scientific,
Waltham, MA). Isolated organisms were identified by sequence analyses
(section 2.3.5) of the extracted and PCR amplified (sections 2.3.3 and
2.3.4) 16S rRNA gene or 18S rRNA gene. Primers 27F and Euk20F
(Table 2.2) were supplied to sequencing facilities (section 2.3.5), which
usually yielded ~800 bp region DNA sequence.
Enrichment cultures were conducted in 125 – 250 mL liquid media in
appropriately sized Erlenmeyer flasks (Fisher Scientific, Waltham, MA) on
a rotating shaker at ~150 rpm. Cultures were either maintained at room
temperature (~24°C) or at 4°C. The two basic procedures followed that of
Whyte et al. (1999) or Bogan et al. (2003). The first consisted of 30 g soil
in 100 mL of MSM supplemented with 500 ppm yeast extract (Fisher
Scientific, Waltham, MA) initially, with subsequent addition of 100 ppm
diesel after 1 week of incubation. The second used 4 g soil in 50 mL MSM
(pH 7.2 or pH 4.5) supplemented with 800 µL of either hexadecane (Acros
Organics, New Jersey, USA) or Arctic diesel (Shell, Canada), incubated
for 3 – 7 days, then transferred to new MSM-hydrocarbon media.
2.4. Phase two: Mesocosm trials
2.4.1. Mesocosm set-up and soil sampling
Mesocosm construction, maintenance, control, operation and sampling
were conducted by W. Chang in CEAM, and soil samples for
microbiological analyses were transferred to NRS. The cold-temperature
facility of CAEM, which housed the mesocosm trials, was set to run a
temperature cycle that mimicked the in situ RI summer temperature and
duration. Correspondingly, the temperature was set to oscillate between

45
1°C and 10°C on a ten day cycle (Fig. 2.1) and the mesocosm trials lasted
60 days. The general sampling procedure used by W. Chang was as
follows (as in Chang et al. 2007): soil for mesocosm trials were stored at -
4°C while preparation for mesocosm trials was conducted at -4°C – 4°C.
Approximately 150 kg of soil for each mesocosm tank was sieved through
sterilized sieves with a pore opening size of 4.75 mm. Mesocosm tanks
(Fig. 2.2) were made of stainless steel and the dimensions of the tank
were 1.0 m long, 0.65 m wide and 0.35 m deep. The soil depth inside a
mesocosm tank was ~22 cm. Five separate mesocosm tanks were
prepared, and designated P1, P2, P3, P4 and P5, the different
amendments and tilling regimes for each are as in Table 2.1. Amendment
applications were conducted on two consecutive days and thoroughly
mixed the soil with the given amendment. All mixing/ tilling of mesocosm
soils was conducted with sterilized hand shovels and a pitchfork. Soils
sampled for microbial analyses were removed from the mesocosm tank
prior to the tilling events. Mesocosm soils for microbial analyses was
sampled with a sterilized auger drilled to three specific depth ranges (Fig.
2.3); the top layer (T) was from the surface to a depth of 5 cm; the middle
layer (M) was between 5 cm and 15 cm of depth, and; the bottom layer (B)
was below 15 cm depth to the base of the mesocosm tank. To maximize
the soil sample representation of the mesocosm tank as a whole,
emphasis was placed on evenness of the soil sample from each layer.
Accordingly, composite samples from each sample layer were prepared
from an amalgamation of the soil recovered from 5 - 7 auger-drilled soil
sub-samplings. The auger drill locations were spaced relatively equidistant
across the mesocosm tank (Fig. 2.4). An approximately equal quantity of
soil was recovered from each auger-drilled soil sub-sample totaling ~150 g
soil for each individual sampling. Microbial analyses were completed from
soil samples taken after Day 0, Day 20, Day 40 and Day 60 of the
mesocosm trials. Mesocosm soil samples were placed in sterile Whirl-Pak
bags (Fisher Scientific, Waltham, MA) and stored at -20°C before being

46
transported on ice to NRS where, again, they were stored at -20°C.
Microbial analyses on mesocosm soil samples were conducted no longer
than a week after soil samples were received at NRS.
Comprehensive microbial analyses were only completed on the P1 and P2
mesocosms soil samples from all three layers at all four time points.
Comprehensive analyses included 14C-hexadecane mineralization
microcosm assays (set-up as in section 2.3.1 but without additional
nutrient supplementation), epifluorescent microscopy for total soil
microbial enumerations (section 2.3.2), viable plate enumerations (section
2.3.6); total community DNA extraction (section 2.3.3) for PCR
amplification of 16S rRNA genes (section 2.3.4) and DGGE analyses
(section 2.3.5) and sequencing and database comparison (section 2.3.5).
Microbial analysis of the P3, P4 and P5 mesocosm trials was limited to
DGGE analyses (section 2.3.5) of composite samples made from the
three sampling layers from each of the four time points and subsequent
online comparisons (section 2.3.5). Mesocosm samples are named as
follows: a sample from the middle layer taken at day 20 from P1 would be
labeled P1 M20; in the cases of P3, P4 and P5. For composite samples,
the layer indication is omitted; for example, a sample from day 20 from P3
was labelled P3 D20.
2.4.2. Clone library construction from P1 B0 and P1 B60 soils
Soil community DNA was extracted and prepared (section 2.3.3) for PCR
amplification of the bacterial 16S rRNA gene (section 2.3.4) using primers
27F and 758R. The cloning procedure used the pGEM-T Easy Vector
System I (Promega Corporation, Madison, WI) kit, following the protocol
provided by the manufacturer (or as in Steven et al. 2007). PCR product
volume to vector volume ratios used were 1:1, 2:1, and 3:1 for the ligation
reaction. All control reactions followed the instructions provided by the
manufacturer and the kit included all necessary components. To ensure
successful ligation, a positive control reaction was completed that used a
47
control insert for ligation into the vector. To determine the proportion of
the ligation reaction in which the digested vector re-circularized, a
background control was run that excluded insert DNA. To ensure the
vector was completely digested, a ligation reaction was prepared that
excluded insert DNA and the T4 DNA ligase. Negative controls for each
sample checked possible vector contamination and consisted of a ligation
reaction with 1 µL of PCR product and no vector.
Subcloning efficiency DH5alpha competent cells (Invitrogen Canada,
Burlington, ON), a commercial E. coli strain, were used for the
transformation procedure. All steps during the transformation procedure
were conducted on ice, unless otherwise noted, and the protocol was as
indicated by the manufacturer, with slight modifications. Competent cells
were thawed on ice and divided into 50 µL aliquots. From each ligation
reaction, 2 µL of PCR product was gently added and mixed with
competent cells, and incubated on ice for 25 min. Tubes with competent
cells and ligation reaction products were placed in a 42°C water bath for
30 s and immediately returned to ice for 2 min, after which 950 µL of room
temperature SOC media (ingredients per liter: 20 g tryptone, 5 g yeast
extract, 10 mL of 1 M NaCl, 2.5 mL of 1 M KCl, 10 mL of 2 M dextrose,
and 10 mL of 2 M Mg2+ (prepared as 203.3 g L-1 MgCl2 • 6 H2O and 246.5
g L-1 MgSO4 • 7 H2O) (pH 7.0 ± 0.2) was added and tubes were incubated
at 37°C on a rotating shaker at 150 rpm for 1.25 h. Aliquots of 100 µL from
each transformation reaction were spread plated on LB + ampicillin (100
µg mL-1 final amplicillin concentration) plates spread with 100 µL of 40 mM
isopropyl-beta-D-thiogalactopyranoside (IPTG) and 100 µL 2% w/v 5
bromo 4 chloro 3 indolyl-beta-D-galactopyranoside (X-Gal) prepared in
N,N-dimethyl formamide 30 min prior to inoculation. Plates were incubated
overnight at 37°C, after which recombinants were analyzed by blue/white
screening. White colonies, which should contain vector with 16S rRNA
gene insert, were picked randomly from plates with a sterile toothpick and
inoculated into 50 µL of sterile water, in 96-well plates (Diamed Lab
48
Supplies Inc., Mississauga, ON), for boiling lysis (section 2.), and 160 µL
of sterile LB + amplicillin broth, in 96-well plates (Diamed Lab Supplies
Inc., Mississauga, ON) for storage of clones. After boiling lysis (Section
2.3.3), the DNA was PCR amplified using primers SP6 and T7 (Table 2.2).
The PCR protocol for amplification of cloned inserts consisted of 5 min at
95°C; 30 cycles of 45 s at 94°C, 30 s at 57°C, and 1 min at 72°C; and a
final extension of 5 min at 72°C. Amplification was verified by gel
electrophoresis (section 2.3.4) and sent for sequencing and compared to
online databases (section 2.3.5). Inoculated LB broth cultures were
incubated overnight at 37 °C, sterile glycerol added to a final concentration
of 20 % v/v, and stored at -80 °C.
2.4.3. Clone library analyses
Phylogenetic trees were constructed from the CLUSTALW alignments in
the program MacVector 7.0 (Oxford Molecular Group Ltd., Oxford, UK).
Neighbor joining (Saitou et al. 1987) best trees were constructed using the
Jukes-Cantor (1969) correction and the reliability of the tree branch points
was assessed by bootstrap analysis of 1000 replicates. Distance matrices
of clone sequences were constructed from CLUSTALW alignments using
the DNADIST function, with the Jukes-Cantor (1969) correction, in the
PHYLIP program version 3.65 (Felsenstein 2005) for clone library
analyses in the programs DOTUR (Schloss et al. 2005) and
webLIBSHUFF version 0.96 (Henriksen 2004). The DOTUR program
calculated richness, by the Chao1 richness estimator (Chao 1984) and the
ACE richness estimator (Chao et al. 1993); diversity by the Shannon’s
diversity index (H′) (Shannon et al. 1949) and the reciprocal of the
Simpson’s diversity index (1/D) (Simpson 1949). webLIBSHUFF
compared the statistically significant difference of the compositions of the
two libraries. Library coverage was calculated according to the formula C
= (1-n′/N) x 100, where n′ is the number of phylotypes appearing once in
the library and N is the library size (Good 1953).

49
-5
0
5
10
15
29-Jun 4-Jul 9-Jul 14-Jul 19-Jul 24-Jul 29-Jul
Date
Tem
pera
ture
(°C
)
Daily mean temperature of the site
Programmed temperature
Figure 2.1. Variation in mean daily temperature at RI.
July temperatures for the past 3 years is shown in circles. Solid line shows the
cold room temperature settings employed for the 60 day mesocosm trials
(Chang et al. 2007).

50
Mesocosm soil depth ≈ 0.22 m
1.0 m
0.3
5 m
Figure 2.2. Mesocosm tank.
Tank dimensions are indicated along with the approximate soil depth inside the tank
(dashed line) (Photo courtesy of W. Chang).
Table 2.1. Mesocosm treatments.
Mesocosm Total Nitrogen
(mg N kg-1
)
CaCO3
(mg kg-1
) Tilling Regime
P1 250 2000 1 per 10 days
P2 0 0 N / A
P3 100 2000 1 per 10 days
P4 250 0 1 per 10 days
P5 250 2000 2 per 7 days
Addition of 2000 mg CaCO3 kg-1
RI soil was found to raise the soil pH from ~4.5 to 6.5 –
7.0 (see text).
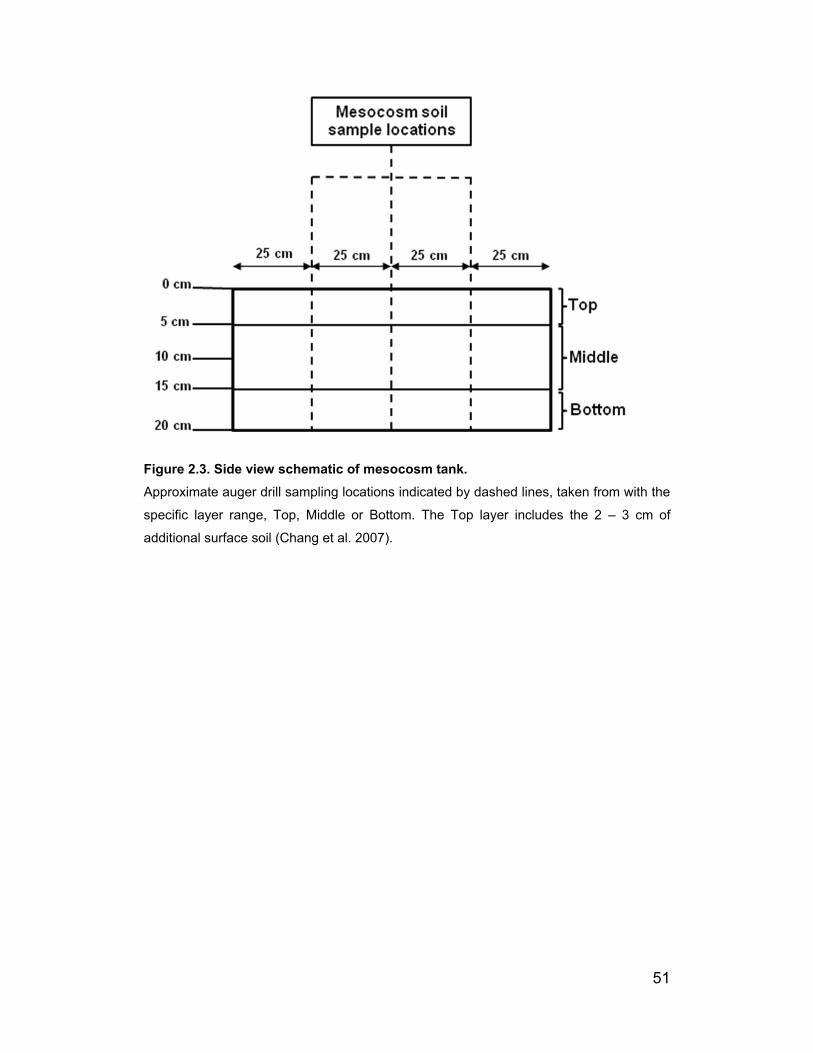
51
Figure 2.3. Side view schematic of mesocosm tank. Approximate auger drill sampling locations indicated by dashed lines, taken from with the
specific layer range, Top, Middle or Bottom. The Top layer includes the 2 – 3 cm of
additional surface soil (Chang et al. 2007).
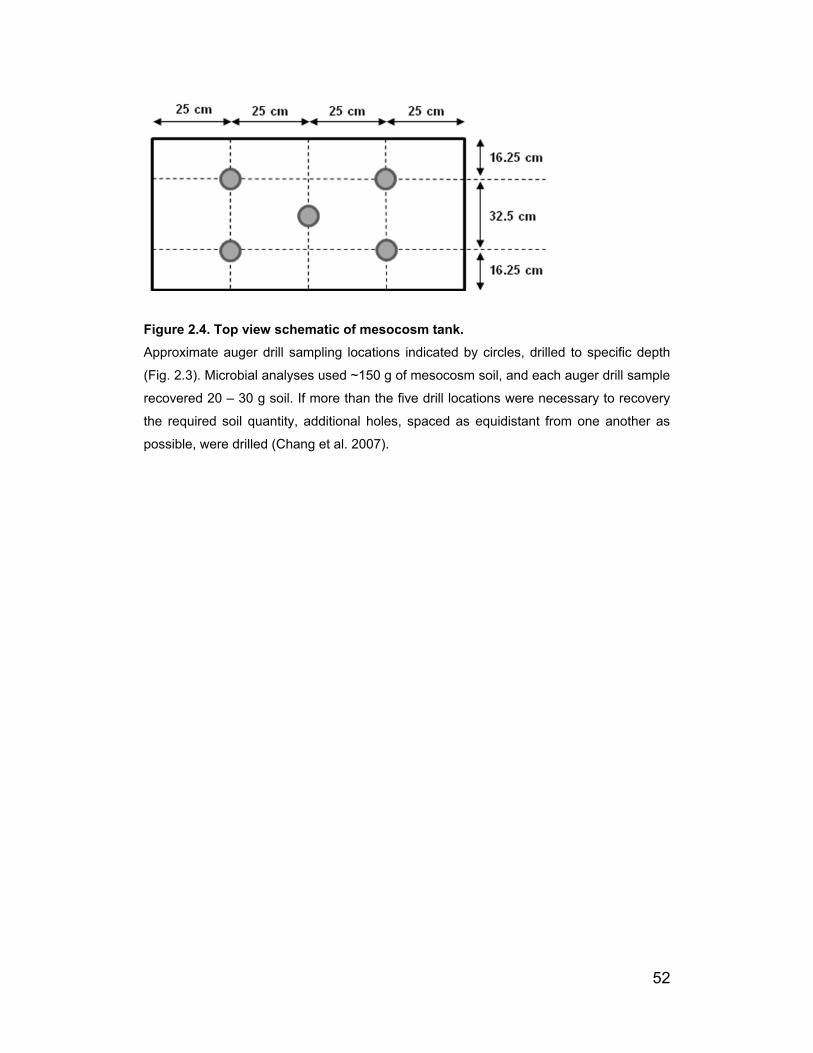
52
Figure 2.4. Top view schematic of mesocosm tank. Approximate auger drill sampling locations indicated by circles, drilled to specific depth
(Fig. 2.3). Microbial analyses used ~150 g of mesocosm soil, and each auger drill sample
recovered 20 – 30 g soil. If more than the five drill locations were necessary to recovery
the required soil quantity, additional holes, spaced as equidistant from one another as
possible, were drilled (Chang et al. 2007).

53
Table 2.2. PCR primer sequences, gene targets, references.
Primer Sequence 5′ to 3′ Target Reference
341F-GC* CCT ACG GGA GGC AGC AG Bacterial 16S rRNA gene Muyzer et al. (1996)
27F AGA GTT TGA TCC TGG CTC AG Bacterial 16S rRNA gene de la Torre et al. (2003)
758R CTA CCA GGG TAT CTA ATC C Bacterial 16S rRNA gene Woese (1987)
1492R GGT TAC CTT GTT ACG ACT T Bacterial 16S rRNA gene de la Torre et al. (2003)
Euk20F GTA GTC ATA TGC TTG TCT C Eukaryotic 18S rRNA gene
Aguilera et al. (2006)
Euk516R-GC* ACC AGA CTT GCC CTC C Eukaryotic 18S rRNA gene
Aguilera et al. (2006)
Euk581F GTG CCA GCA GCC GCG Eukaryotic 18S rRNA gene
Bower et al. (2004)
Euk1134R TTT AAG TTT CAG CCT TGC G Eukaryotic 18S rRNA gene
Bower et al. (2004)
alkB-HIF CIGIICACGAIITIGGICACAAGAAGG Alkane monooxygenase Chénier et al.
(2003)
alk-H3R IGCITGITGATCIIIGTCICGCTGIAG Alkane monooxygenase Chénier et al.
(2003)
ndoBF CAC TCA TGA TAG CCT GAT TCC TGC CCC CGG CG
Naphthalene dioxygenase Whyte et al. (1996)
ndoBR CCG TCC CAC AAC ACA CCC ATG CCG CTG CCG
Naphthalene dioxygenase Whyte et al. (1996)
xylEF GTG CAG CTG CGT GTA CTG GAC ATG AGC AAG
Catachol dioxygenase Whyte et al. (1996)
xylER GCC CAG CTG GTG GGT GGT CCA GGT CAC CGG
Catachol dioxygenase Whyte et al. (1996)
phnAcF CAA TTA CGG TGA TTT CGT GAC C PAH dioxygenase Laurie et al. (1999)
phnAcR ACA AAA TTC TCT GAC GGC GC PAH dioxygenase Laurie et al. (1999)
SP6 CAT TTA GGT GAC ACT ATA G Cloning vector Promega**
T7 TAA TAC GAC TCA CTA TAG GG Cloning vector Promega**
-GC refers to GC-clamp, with sequence GCG GGC GGG GCG GGG GCA CGC GGG
GCG CGG CGG GCG attached on 5′ end only for primers denoted.

54
Chapter Three. Results
3.1. Soil physical – chemical and catabolic gene analyses
The hydrocarbon contaminated and pristine (uncontaminated) RI soils
were found to be mainly sand based, as defined by USDA classification.
The particle size distribution percentage of the RI soils was 24% gravel,
75% sand and 1.6% silt/ clay (Chang et al. 2007). The complete physical
and chemical analyses for soils received summer 2005 (HC), pristine soil
received Oct. 2005 (PSB) and replicate samples of soil received Oct. 2005
(HCB1 and HCB2) are presented in Table 3.1. Initial gravimetric water
contents of the site soils ranged from 6% to 11%. Nutrient deficiency,
typical of Arctic soils (Tarnocai and Campbell 2002) was seen in the site
soils, which had only trace amounts of inorganic nitrogen as nitrate, nitrite
and ammonia and phosphorus. Heavy metals, sodium, chloride and total
organic carbon were measured, the latter of which was found to be 11000
mg kg-1 in pristine soil and more than double that amount in hydrocarbon
contaminated soils. The soil pH of the RI soils was found to be naturally
acidic, with pristine soil pH ~4.8, and contaminated soil pH ~4.6 (Chang et
al. 2007). TPH fractions were determined for the hydrocarbon
contaminated soils and are presented in Table 3.2. Volatile fractions (F1),
ranging from nC6 to nC10, were not detected in the petroleum
hydrocarbon contaminated soils. The most abundant fraction in the
contaminated site soil was F2 (nC10 to nC16) of which the concentration
ranged from 800 to 1400 mg kg-1. The F3 (nC16 – nC34) and F4 (nC34 –
nC50) concentrations ranged from 650 to 840 mg kg-1 and from 12 to 43
mg kg-1, respectively. The measured TPH, therefore, ranged from 1464 to
2303 mg kg-1. The results from the lettuce seed germination test,
earthworm lethality, and microtox test, conducted at BRI, were negative
for the presence of toxic components in the RI soil.
Total community DNA was extracted from HC, HCB and PS soils and
amplified by PCR for the presence of four hydrocarbon catabolic genes.
55
alkB, phnAc, ndoB and xylE were detected in HC soil, while HCB was only
positive for alkB and phnAc and PS was negative for all four.
3.2. Phase one: Biotreatability assessment
3.2.1. 14C-Hydrocarbon mineralization assays
The results of the mineralization assays at 5°C of hexadecane,
naphthalene and phenanthrene in the HC, PS and HCB soils are
presented in Fig. 3.1. The sterile control microcosms never showed
greater %14CO2 recovery levels, or 14C-mineralization activity, than the
unsterile, experimental microcosm in all mineralization assays. Overall,
phenanthrene showed the lowest amount of mineralization activity, with
the maximum levels of ~3.5% and ~3.6%, observed from HC soil
supplemented with potassium phosphate and HCB soil supplemented with
20:20:20, respectively. Hexadecane mineralization assays showed ~8.0%
14C-mineralization activity from HC and PS soils, both supplemented with
20:20:20. Slightly lower 14C-mineralization activity levels were observed in
assays with hexadecane from HCB soil supplemented with 20:20:20 at
~7.0%, MAP supplemented HC soil at ~6.8%, and CaCO3 supplemented
HC and HCB soils, both at ~6.8%. Maximum 14C-mineralization activity
levels from the assays with naphthalene were observed from the HCB soil,
supplemented with 20:20:20 alone, or 20:20:20 and CaCO3, both reaching
levels of ~26.1%. The naphthalene mineralization assays also displayed
two results not seen in any other assays. The first were the higher %14CO2
recovery levels seen from both the untreated HC soil at ~20.0% and
untreated HCB soil at ~8.0%, and second, the relatively high %14CO2
levels of the sterilized controls, both at ~2.5%. Mineralization assays, at
-5°C, -10°C and -15°C, with radiolabeled hexadecane and naphthalene
showed activity levels barely above that of the background sterilized
control microcosm mineralization assays, after three months (data not
shown). These sub-zero microcosm assays were then spiked with 250

56
ppm 20:20:20 and after three additional months still showed no increase in
activity (data not shown).
3.2.2. Microbial enumerations
Microbial viable plate enumerations from phase one (biotreatability
assessment) used two different types of media to test for aerobic cells
from HC, HCB and PS soils. At 5°C, cell counts ranged from 102 to 104
CFU g-1 soil while at ambient room temperature (~24°C) cell counts
ranged from 103 to 105 CFU g-1 soil (Table 3.3). Hydrocarbon degrading
microorganisms, cultured on MSM + Arctic diesel fuel, resulted with cell
counts of 102 to 105, while heterotrophic organisms, cultured on R2A,
ranged from 103 to 104 CFU g-1 soil (Table 3.3). Additionally, at each
temperature, each media was adjusted to pH ~7.0 and pH ~4.5. Cell
counts ranged from 102 – 105 CFU g-1 soil (Table 3.3). Extensive
investigation into the PS soil was not conducted because focus was
directed to the contaminated soils.
The membrane binding DTAF dye was used for direct epifluorescent
microscopic total microbial enumerations, the result of which, for the HCB
soil, was 5.1 x 10⁸ cells g-1 soil.
3.2.3. DGGE analyses
Initial DGGE analyses of the DNA extracted from the RI soil and PCR-
amplified for the bacterial 16S rRNA gene resulted in multiple DGGE gels
with different banding patterns that allowed some bands to be cut for
subsequent sequencing analysis. Visualization limitations prevented all
bands that could be viewed digitally from being physically cut and the
success of sequencing analysis of individually cut bands depended on the
precision of band cuts, productive re-amplification and the sequencing
center employed. As a result of these multiple variables, not all bands that
appear in gel photos were cut and not all cut bands returned reliable
sequence information. Attempts were made to construct DGGE profiles of

57
the eukaryotic soil community, using 18S rRNA gene primers with a GC-
clamp, but sufficient quantities of PCR-product could not be obtained.
HC and PS soils were analyzed by DGGE before any treatment addition
or incubation time (T0) and after two months at 5°C without treatment
(N/T) or with 20:20:20 commercial fertilizer (20) or potassium phosphate
(PO4) supplementation, as in Fig. 3.2. In the HC soil, after the two month
incubation period, fewer bands were observed in comparison to the
sample before any treatment (Fig. 3.2). Additionally, one band (indicated
in box in Fig. 3.2) that appeared in time 0 enhanced after the two month
incubation period, in all treatments. This common band was cut, purified
and after successful sequencing analysis, compared to online databases
and showed a 94 - 97% homology with the hydrocarbonoclastic genus
Alkanindiges. After the two month incubation period, the banding patterns
from the PS soil were more complex than was observed at time 0, and
more complex than any of the HC banding patterns (Fig. 3.2.). A single,
clear predominant band did not appear in the PS soil bands, like the one
observed in the HC soil, and unfortunately sequencing of cut bands was
unsuccessful.
3.3. Phase two: Mesocosom trials
3.3.1. 14C-Hexadecane mineralization assays with mesocosm soils
Microcosm mineralization assays were conducted at 5°C with radiolabeled
hexadecane to detect and monitor the hydrocarbon mineralization
capacity of the P1 and P2 mesocosm soils. Soils samples tested included
all three layers (top, middle and bottom) at all four time points (days 0, 20,
40 and 60) from the P1-treated and P2-untreated mesocosm trials.
Hexadecane was chosen over the other radiolabeled substrates because
the physical-chemical analyses showed that mid-length alkanes to be the
greatest hydrocarbon contingent present in the contaminated RI soil
(Table 3.2). The consistent results from these assays indicated, as in the
biotreatability assessment mineralization assays (section 3.2.1) that the

58
sterilized controls had the lowest %14CO2 recovery, not reaching above
1% (Figs. 3.3, 3.4, 3.5). 14C-hexadecane mineralization in P1 soils from all
depths at sample Day 0 and from the P2 soils at all depths and all sample
days, remained at less than 1% (Figs. 3.3, 3.4, 3.5). Soils from P1 showed
higher levels of mineralization activity as the mesocosm trial progressed,
with mild variations between depths (Figs. 3.3, 3.4, 3.5). In the bottom
depth, both day 20 and 40 showed ~18.0% 14C-hexadecane
mineralization, then increasing to ~52.0% 14C-hexadecane mineralization
in the day 60 soil sample (Fig. 3.3). The soils from the middle depth
showed 14C-hexadecane mineralization levels of ~25.0% and 18.0% from
day 20 and 40, respectively, while the day 60 sample showed ~50.0% 14C-
hexadecane mineralization (Fig. 3.4). Soils sampled from the top depth on
days 20 and 40 showed ~18.0% 14C-hexadecane mineralization, which
increased to about 62.0% from the day 60 soil sample (Fig. 3.5).
3.3.2. Microbial viable plate enumerations
Microbial enumerations for the P1 and P2 mesocosm soils were monitored
on MSM-hexadecane plates incubated at 5°C, for all three soil layers at
days 0, 20, 40 and 60, as presented in Fig. 3.6. Soil sampled from top,
middle and bottom depths, at day 0 from the P1-treated mesocosm
resulted in 2.63 x 10⁵ – 3.83 x 10⁵ CFU g-1 soil for all three layers.
Additionally, all three layers from P1 from the successive sampling days,
20, 40 and 60 showed counts from 8.92 x 10⁶ - 1.49 x 10⁷ CFU g-1 soil.
The exception was P1 M40, which resulted in 5.5 x 10⁵ CFU g-1 soil,
similar to that of day 0. Samples from the P2-untreated mesocosm
samples displayed similar results from the top, middle and bottom layers,
throughout the 60 day mesocosm trial period, with a range of ~1.0 x 10⁵
CFU g-1 soil to ~6.0 x 10⁵ CFU g-1 soil.
3.3.3. Total direct microbial microscopic enumerations
A summary of the results for the direct microscopic enumerations for the
mesocosm soils is presented in Fig. 3.7. Day 0 samples from both P1 and

59
P2 mesocosms, at all three sample depths, showed a range of 1 x 10⁸ -
2 x 10⁸ cells g-1 soil from all three sample depths. At day 20, the counts for
P1 had increased to 3.7 – 6.2 x 10⁸ cells g-1 soil for the three layers, while
the P2 soils showed a range of 1.8 – 3.8 x 10⁸ cells g-1 soil. The samples
from P1 day 40 ranged from 2.7 – 4.0 x10⁸ cells g-1 soil and those of P2
ranged from 5.6 x 10⁷ – 2.3 x 10⁸ cells g-1 soil. The results from day 60
were similar to those of day 20 and 40, with an overall higher P1 range of
4.9 – 5.8 x 10⁸ cells g-1 soil than that of the P2 range of 1.2 – 2.3 x 10⁸
cells g-1 soil.
3.3.4. DGGE analyses of mesocosm soils
The DGGE results from DNA extracted from the P1 and P2 mesocosms
consisted of lanes from all three layers and at days 0, 20, 40 and 60 (Fig.
3.8). The P2 DGGE gel displayed no noticeable change in banding
pattern; that is, no bands were observed to appear or disappear for all
three layers for the duration of the mesocosm trial. This “P2 banding
pattern” was similar to that observed from the P1 top, middle and bottom
samples from day 0 (Fig. 3.8). Of note was the appearance of a constant
band (labeled B in Fig. 3.8) after day 0 in all layers in the P1-treated gel.
Subsequent sequence analysis revealed this band to be 94 – 97%
homologous to the genus Alkanindiges. Sequencing results from various
other bands from the P1 gel were homologous to the genera
Aeromicrobium (band A), at 95-100%, and Paenibacillus (band C), at
98%. Sequenced band D was found to be 95% homologous to the genus
Blastococcus in both the P1 and P2 DGGE lanes (Fig. 3.8).
The DGGE results from DNA extracted from the composite P3, P4 and P5
mesocosm soils are presented in Fig. 3.9. Overall, it seemed that the level
of banding pattern complexity for the P3, P4 and P5 gel decreased after
day 0. Again, sequence results from isolated bands produced 95 – 100%
homologous matches to the genus Aeromicrobium (band A in Fig. 3.9).
Sequence results from other bands (labelled E in Fig. 3.9) produced 95%

60
homologous matches to the genus Rhodanobacter. The P4 gel also
contained a band (labelled F in Fig. 3.9) that sequence analysis showed to
be 95% homologous to the genus Acidobacteria. Complete sequence
results for all DGGE analyses from all five mesocosms are presented in
Table 3.4. Direct comparisons of the P1 and P2 DGGE gel and the P3,
P4, P5 DGGE gel could not be reliably analyzed due to poor migration of
reference samples in the gels.
3.3.5. Clone libraries
To further investigate the bacterial biodiversity and change in community
structure due to mesocosm treatments, bacterial 16S rRNA gene clone
libraries were constructed from P1 B0 soil and P1 B60 soil and compared.
The P1 B0 soil clone library, which consisted of 74 clones, represented
the bacterial community initially present in the untreated RI soil, while the
P1 B60 soil clone library, which consisted of 72 clones, represented the
shift in bacterial community structure after P1 mesocosm treatment.
Sequences were grouped into operational taxonomic units (OTUs) of
greater than 97% sequence similarity, the generally accepted cutoff for
bacterial species differentiation (Stackebrandt & Goebel 1994); the
complete results are listed in Table 3.5. The coverage (Good 1953) and
the number of OTUs for the P1 B0 and P1 B60 soil clone libraries were
similar in size (Table 3.5). Also calculated for each library were the Chao1
and ACE species richness estimates, and the Shannon-Weaver and
Simpson diversity indices (Table 3.5). The richness estimates are also
presented as a rarefaction curve in Fig. 3.10. Analysis of the two libraries
using the computer program webLIBSHUFF showed the P1 B0 and P1
B60 libraries to be significantly different (p<0.025).
Library sequences were compared and closest matches determined by
the online databases that showed both libraries were dominated by
Proteobacteria, which increased 13% from the initial soil library to make
up 63% of the mesocosm treated soil library (Fig. 3.11). Added to the
61
proportional increase of this phylum from one library to the next, was the
change of the classes within it. Both the alpha- and gamma-
Proteobacteria proportions were reduced after mesocosm treatment, from
30% and 46% in the P1 B0 library to 11% and 29% in the P1 B60 library,
respectively (Fig. 3.11). However, the proportion of beta-Proteobacteria
increased from 24% initially to 60% after treatment (Fig. 3.11).
Furthermore, the libraries displayed a reduction in the proportions from the
phyla Actinobacteria, Firmicutes and Acidobacteria, from 27% - 18%, 20%
- 4%, and 3% - 1% respectively. The phylum Bacteroidetes, which was not
present in the P1 B0 library, did emerge to constitute 14% of the P1 B60
library (Fig. 3.11).
Analysis of the closest BLAST (Altschul et al., 1990) matches for individual
sequences from the clone libraries mostly resulted in matches related to
uncultured bacterial clones. Of interest were sequences related to
hydrocarbon-degrading, cold adapted and acid-tolerant organisms. Also,
sequences similar to those from DGGE analyses (Aeromicrobium,
Alkanindiges, Paenibacillus, Blastococcus, Rhodanobacter, or
Acidobacterium) were of interest. The P1 B0 library (74 sequences) had,
in total, three sequences with BLAST matches from hydrocarbon
contaminated environments including a Nocardioides sp. 43/14 that was
from an investigation into hydrocarbon contaminated soil at Scott Base in
the Antarctic (Saul et al. 2005), an alpha-proteobacterium from Michigan,
USA (Allen et al. 2007) and an unclassified bacterial clone from Rancho
La Brea Tar Pits, California, USA (Kim and Crowley 2007). Nine
sequences were related to an Aeromicrobium from Spitsbergen high Arctic
permafrost soil (unpublished) and four were related to uncultured alpha-
proteobacterial clones from Antarctic terrestrial habitats (Yergeau et al.
2007). Four sequences were related to matches from acidic environments;
two uncultured Acidobacterium from Southern Piedmont, USA (Kamlesh
et al. 2006), an uncultured gamma-proteobacterial clone from an acidic
uranium contaminated aquifer (Reardon et al. 2004) and an unclassified

62
bacterial clone from forest wetland impacted with acidic, metal rich, saline
runoff (Brofft et al. 2002). Twelve P1 B0 sequences were related to
Paenibacillus; 10 from marine sediments (Zhao et al. 2007) and one from
Mediterranean sapropels (Süß et al. 2004). and one was related to a
Rhodanobacter isolated from ginseng fields (unpublished).
The P1 B60 library (72 sequences) had one sequence related to an
uncultured soil bacterium from Romanian oil-polluted soil (unpublished)
and four (all Sphingobacterium sp. 44/35) from the hydrocarbon
contaminated soil of the Scott Base study (Saul et al. 2005). As for other
sequences related to matches from cold environments, three were related
to unclassified bacterioplankton from Antarctic freshwater (unpublished),
one to an unclassified cold tolerant bacterial clone from Finnish Lapland
soil (Männistö and Häggblom 2006), one to an unclassified bacterial clone
from Arctic saline springs (Perreault et al. 2007), one to an alpha-
proteobacterial clone from glacial meltwaters of Mount Everest (Liu et al.
2006), a psychrophilic Arthrobacter from a cyanobacterial mat in Lake
Vestal located near the Miers and Adams glaciers in Antarctica (Loveland-
Curtze et al. 1999), a Spingobacterium from the clouds of Puy de Dôme,
France (Amato et al. 2007). The 13 clones related to sequences from
acidic environments were from acid mine drainage systems from China,
England; Sweden and the USA. Aeromicrobium or Rhodanobacter –
related sequences were not found in the P1 B60 library and the numbers
of Paenibacillus and Acidobacteria –related sequences were reduced from
12 and two to three and one, respectively.
3.4. Microbial isolates and enrichment cultures
3.4.1. Biotreatability assessment isolates and enrichment cultures
To gain a basic understanding of the aerobic, viable and culturable
microbial population, morphologically distinct colonies from the viable
plates were isolated and subjected to DNA extraction and PCR
amplification of the 16S or 18S rRNA gene, as previously described. The

63
ten bacterial and three eukaryotic strains isolated were simply identified by
comparison of the 16S or 18S rRNA gene fragments to online databases,
the results of which are presented in Table 3.5. Biotreatability assessment
DGGE analysis (Fig. 3.2) indicated an organism present in the RI soil with
high 16S rRNA gene sequence homology to the hydrocarbonclastic genus
Alkanindiges and enrichment cultures were started in an attempt to isolate
this organism. The single bacterial strain, designated LB.1, isolated from
these enrichment cultures had a 96% 16S rRNA gene homology to the
genus Pseudomonas (Table 3.5). Isolated strains were also not
represented in the clone libraries.
3.4.2. Mesocosm isolates and enrichment cultures
Bacterial isolation and enrichment cultures from the mesocosm soil were
conducted to attempt recovery of an organism with high 16S rRNA gene
homology to the genus Alkanindiges, due to molecular evidence of a
highly related organism in mesocosm soil (Fig. 3.8). Results indicated that
the P1 B20 soil sample was best suited for both isolation and enrichment
because of the possible dominance of the Alkanindiges-like organism in
this sample. In total, eight bacterial isolates were recovered, based on the
criteria previously mentioned. The enrichment cultures initially yielded six
bacterial isolates, but DGGE analysis showed a single band from these
isolates that migrated to the same position in the DGGE gel (not shown),
and subsequent sequencing and analysis of these six bands revealed
identical DNA sequences. A single representative isolate was designated
MD.1. The seven additional isolates, designated MD.2, MD.3, MD.4,
MD.5, MD.6, MD.7 and MD.9, were isolated from spread plating of diluted
P1 B20 soil sample onto MSM-Arctic diesel plates, as previously
described. These isolates were additionally tested for sub-zero growth,
using modified media (section 2.5). All isolates grew on all media types at
room temperature (~24°C). Isolate MD.2 displayed growth at -5°C on
MSM-Arctic diesel (1.35 M NaCl). Unfortunately all plates incubated at -
10°C and -15°C froze, and growth could not be scored. Isolates MD.1,

64
MD.2, MD.3, MD.7 and MD.9 grew on MSM pH 4.5-Arctic diesel plates at
room temperature. Approximately 800 bp of 16S rRNA gene sequence
were recovered from each isolate and used to determine the closest
BLAST match results (Table 3.6), and these sequences were not
represented in the clone libraries. Phylogenetic relationships show isolates
MD.1, MD.2 and MD.9 to cluster closely together with R. erythropolis, R.
erythreus type strains and the cold-adapted hydrocarbon degrader
Rhodococcus Q15 (Whyte et al. 1998) (Fig 3.12). Isolate MD.4 clustered
closely with R. corynebacteriodes type strain and isolates MD.6 and MD.7
clustered with Arthrobacter globiformis type strain and Mycobacterium
cosmeticum type strain, respectively. Isolate MD.5 did not branch closely
with any type strain, but clustered with type strains from the genera Afipia,
Rhodopseudomonas, Agromonas, Bradyrhizobium, and Nitrobacter, all
members of the Bradyrhizobiaceae family (Fig. 3.13).

65
Table 3.1. Physio-chemical analyses of RI soil.
Test Unit HC PSB HCB1 HCB2 DL
Moisture % 11 6 10 10 N/A
pH pH 4.59 4.83 4.63 4.62 N/A
Cadmium (Cd) mg/kg ND ND ND ND 0.5
Chrome (Cr) mg/kg 27 22 23 24 2
Copper (Cu) mg/kg 67 80 62 64 2
Lead (Pb) mg/kg ND ND 6 6 5
Nickel (Ni) mg/kg 72 74 54 56 1
Zinc (Zn) mg/kg 43 50 32 33 10
Nitrate & Nitrite mg/kg ND 0.5 ND ND 0.2
Ammonia (NH3) mg/kg ND ND ND ND 5
Organic Carbon mg/kg 23000 11000 27000 24000 500
Phosphorus (P) mg/kg 200 170 210 210 10
Sodium (Na) mg/kg 180 170 120 130 10
Chlorine (Cl) mg/kg 15 5.3 5 5.2 0.5
Soil received summer 2005 (HC), pristine RI soil received Oct. 2005 (PSB), hydrocarbon
contaminated soil received Oct. 2005 (HCB1 and HCB2 are replicate samples). DL =
Detection limit; N/A = Not applicable; ND = Not detected. (Chang et al. 2007).
Table 3.2. Hydrocarbon constituent analysis of HCB RI soil.
TPH Fractions mg kg-1
F1 (C6 – C10) ND
F2 (C10 – C16) 800 - 1400
F3 (C16 – C34) 650 - 860
F4 (C34 – C50) 12 – 43
PAH 2- and 3-ring Less than 0.1
Total petroleum hydrocarbons (TPH) divided into four fractions (F1, F2, F3, F4) and
corresponding alkane chain lengths indicated. Polycyclic aromatic hydrocarbons (PAH).
ND = Not detected. (Chang et al. 2007.).
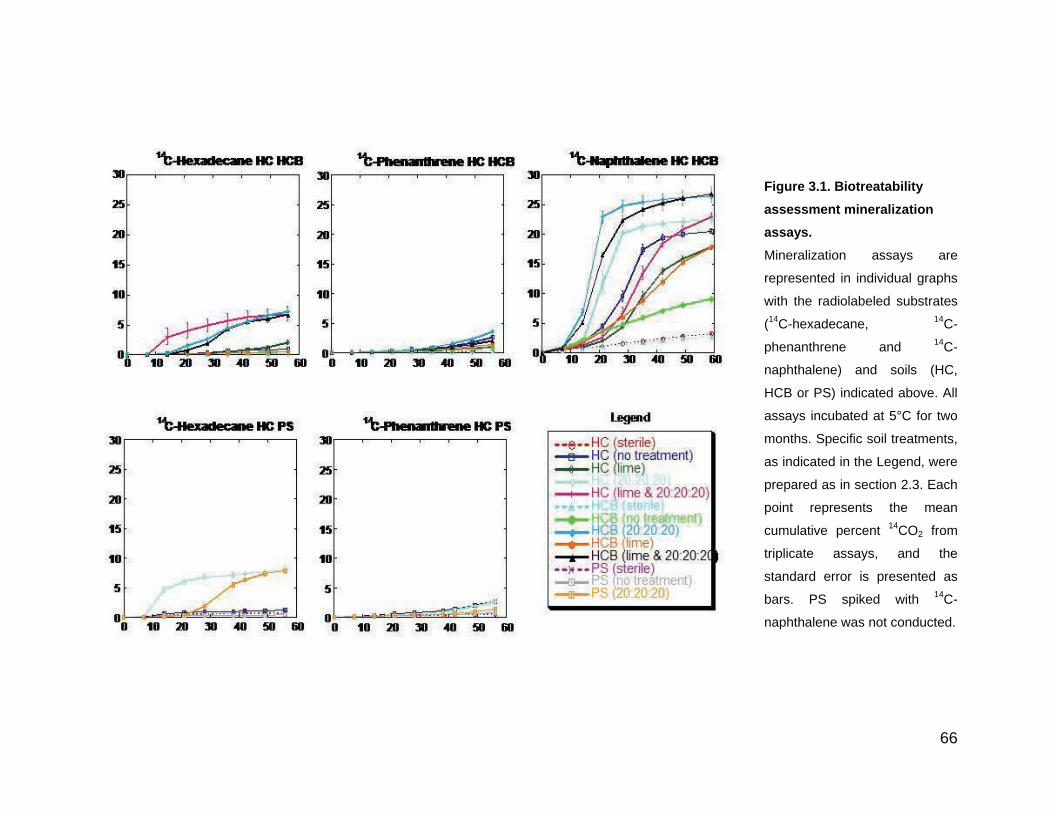
66
Figure 3.1. Biotreatability
assessment mineralization
assays.
Mineralization assays are
represented in individual graphs
with the radiolabeled substrates
(14
C-hexadecane, 14
C-
phenanthrene and 14
C-
naphthalene) and soils (HC,
HCB or PS) indicated above. All
assays incubated at 5°C for two
months. Specific soil treatments,
as indicated in the Legend, were
prepared as in section 2.3. Each
point represents the mean
cumulative percent 14
CO2 from
triplicate assays, and the
standard error is presented as
bars. PS spiked with 14
C-
naphthalene was not conducted.

67
Table 3.3. Enumerations of viable aerobic, heterotrophic bacteria from RI soils.
Media (Temp.) HCB HC PS
MSM + diesel (5C) 1.1 x 10⁴ 9.5 x 10
3 2.1 x 10
2
MSM + diesel (24C) 5.3 x 10⁴ 2.7 x 10
4 -
MSM pH 4.5 + diesel (5C) 7.3 x 10³ 2.4 x 10
2 -
MSM pH 4.5 + diesel (24C) 1.0 x 10⁵ 4.1 x 10
4 -
R2A (5C) 5.0 x 10⁴ 1.2 x 10
4 7.0 x 10
3
R2A (24C) 9.8 x 10⁴ 7.3 x 10
4 -
R2A pH 4.5 (5C) 2.4 x 10³ 1.6 x 10
3 -
R2A pH 4.5 (24C) 8.6 x 10⁴ 4.1 x 10
3 -
Soil received summer 2005 (HC), pristine RI soil received summer 2005 (PS), and
hydrocarbon contaminated soil received Oct. 2005 (HCB). All enumeration values are
presented in CFU g-1
soil. After appropriate dilution series, cells were plated on mineral
salts medium with neutral pH (MSM) or pH ≈ 4.5 (MSM pH 4.5) and supplemented with
Arctic diesel as the sole carbon source. R2A culturing media at neutral pH or pH ≈ 4.5
were also used. Incubation temperature as indicated (Temp.).
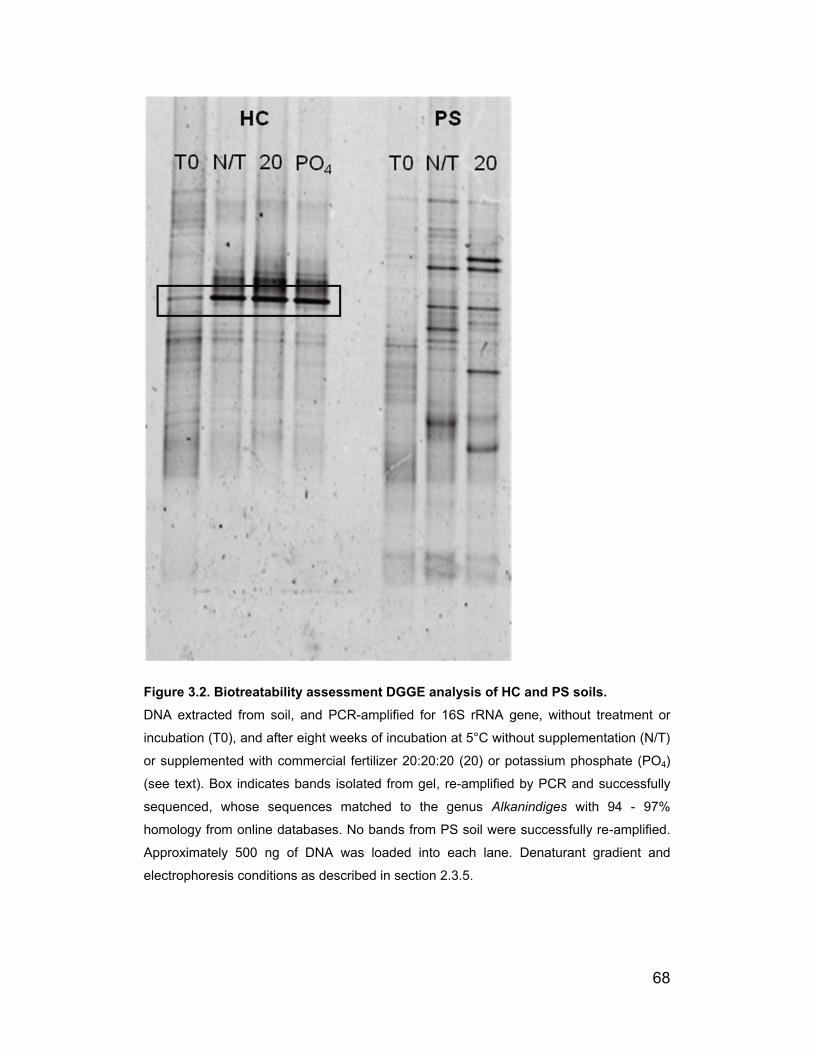
68
Figure 3.2. Biotreatability assessment DGGE analysis of HC and PS soils. DNA extracted from soil, and PCR-amplified for 16S rRNA gene, without treatment or
incubation (T0), and after eight weeks of incubation at 5°C without supplementation (N/T)
or supplemented with commercial fertilizer 20:20:20 (20) or potassium phosphate (PO4)
(see text). Box indicates bands isolated from gel, re-amplified by PCR and successfully
sequenced, whose sequences matched to the genus Alkanindiges with 94 - 97%
homology from online databases. No bands from PS soil were successfully re-amplified.
Approximately 500 ng of DNA was loaded into each lane. Denaturant gradient and
electrophoresis conditions as described in section 2.3.5.
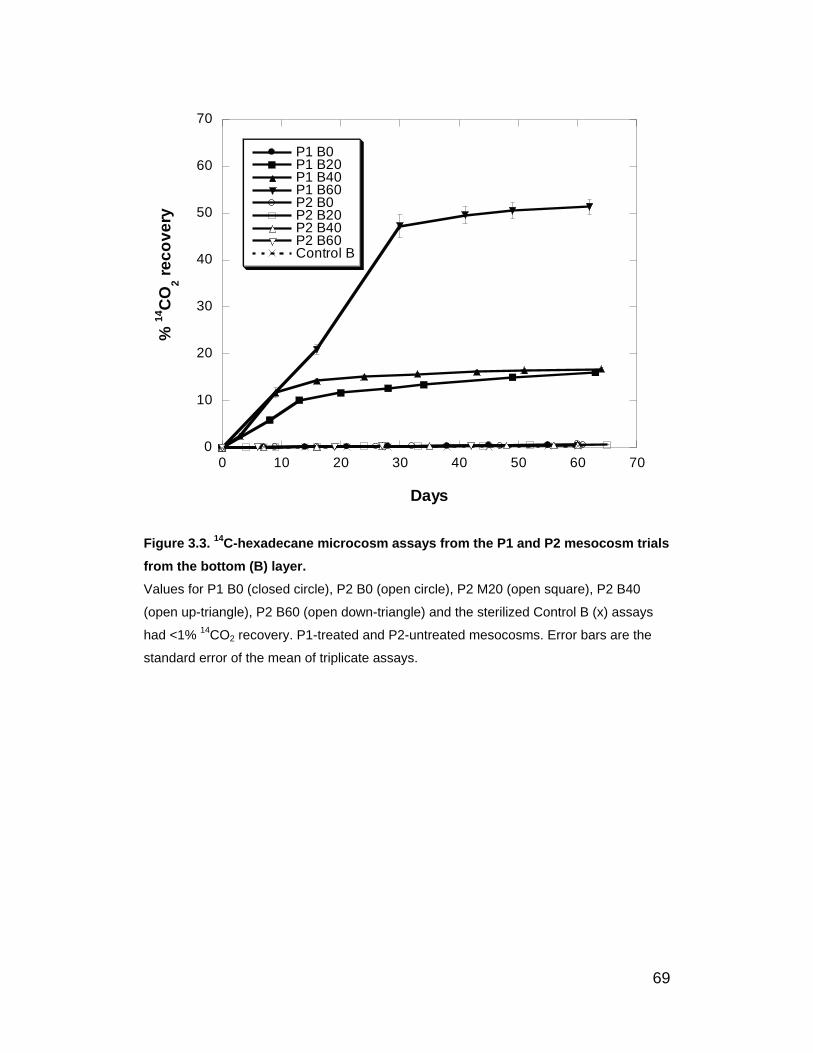
69
0
10
20
30
40
50
60
70
0 10 20 30 40 50 60 70
P1 B0P1 B20P1 B40P1 B60P2 B0P2 B20P2 B40P2 B60Control B
% 1
4C
O2 r
ec
ov
ery
Days
Figure 3.3. 14
C-hexadecane microcosm assays from the P1 and P2 mesocosm trials
from the bottom (B) layer.
Values for P1 B0 (closed circle), P2 B0 (open circle), P2 M20 (open square), P2 B40
(open up-triangle), P2 B60 (open down-triangle) and the sterilized Control B (x) assays
had <1% 14
CO2 recovery. P1-treated and P2-untreated mesocosms. Error bars are the
standard error of the mean of triplicate assays.
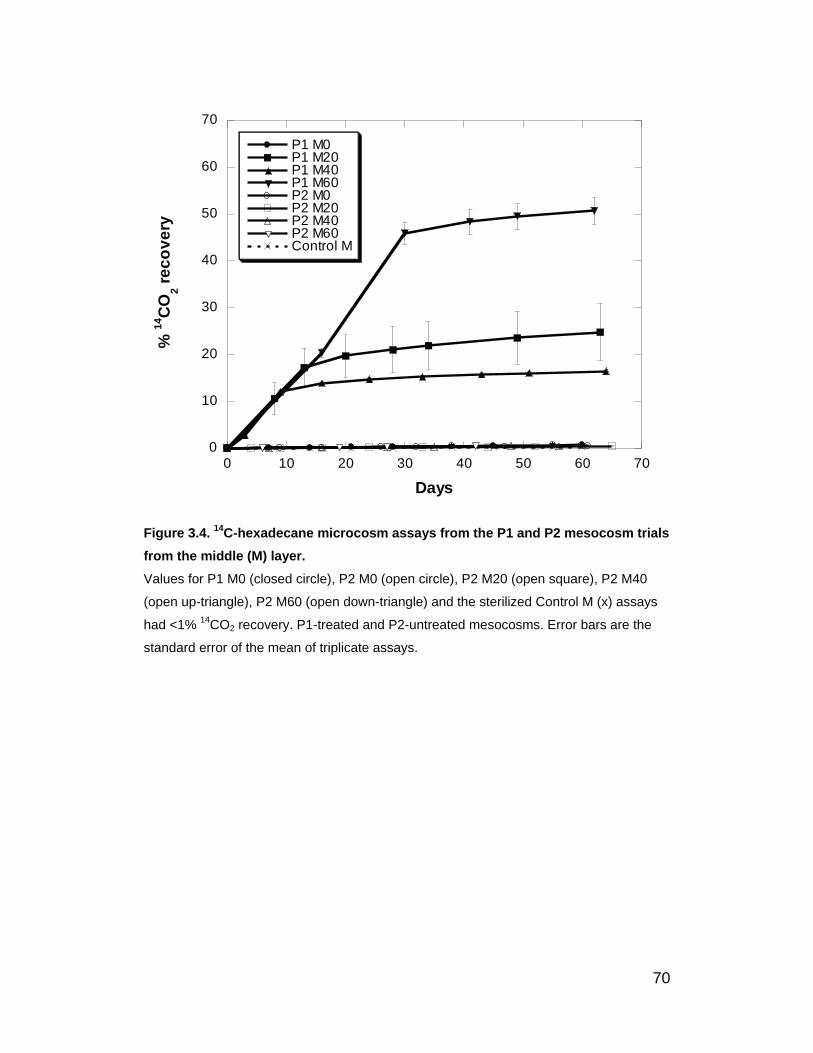
70
0
10
20
30
40
50
60
70
0 10 20 30 40 50 60 70
P1 M0P1 M20P1 M40P1 M60P2 M0P2 M20P2 M40P2 M60Control M
% 1
4C
O2 r
ec
ov
ery
Days
Figure 3.4. 14
C-hexadecane microcosm assays from the P1 and P2 mesocosm trials
from the middle (M) layer.
Values for P1 M0 (closed circle), P2 M0 (open circle), P2 M20 (open square), P2 M40
(open up-triangle), P2 M60 (open down-triangle) and the sterilized Control M (x) assays
had <1% 14
CO2 recovery. P1-treated and P2-untreated mesocosms. Error bars are the
standard error of the mean of triplicate assays.

71
0
10
20
30
40
50
60
70
0 10 20 30 40 50 60 70
P1 T0P1 T20P1 T40P1 T60P2 T0P2 T20P2 T40P2 T60Control T%
14C
O2 r
ec
ov
ery
Days
Figure 3.5. 14
C-hexadecane microcosm mineralization assays from the P1 and P2
mesocosm trials from the top (T) layer.
Values for P1 T0 (closed circle), P2 T0 (open circle), P2 T20 (open square), P2 T40
(open up-triangle), P2 T60 (open down-triangle) and the sterilized Control T (x) assays
had <1% 14
CO2 recovery. P1-treated and P2-untreated mesocosms. Error bars are the
standard error of the mean of triplicate assays.
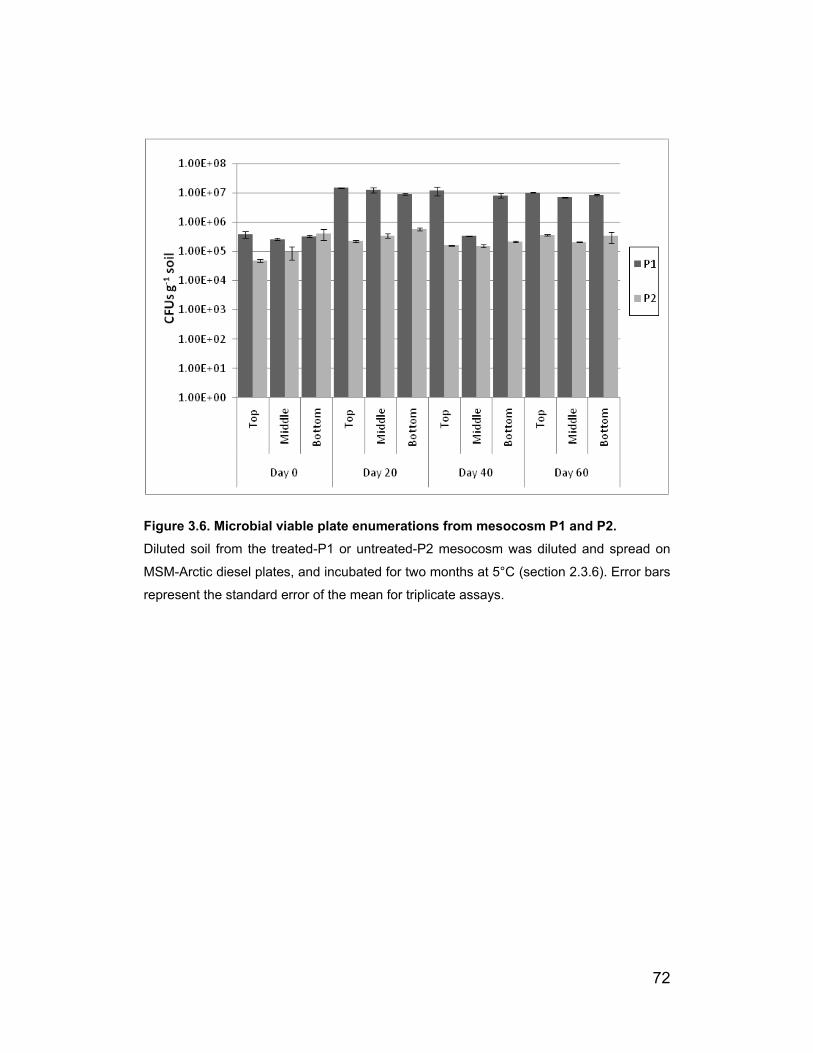
72
Figure 3.6. Microbial viable plate enumerations from mesocosm P1 and P2. Diluted soil from the treated-P1 or untreated-P2 mesocosm was diluted and spread on
MSM-Arctic diesel plates, and incubated for two months at 5°C (section 2.3.6). Error bars
represent the standard error of the mean for triplicate assays.

73
Figure 3.7. Total direct microbial microscope enumerations from mesocosms P1 and P2. The membrane binding dye DTAF was used for staining of live and dead microbial cells
in soil samples (section 2.3.2). Error bars represent the standard error of the mean of 10
microscope fields counted. No value for P2 B20 is presented due to technical difficulties
encountered with that sample.
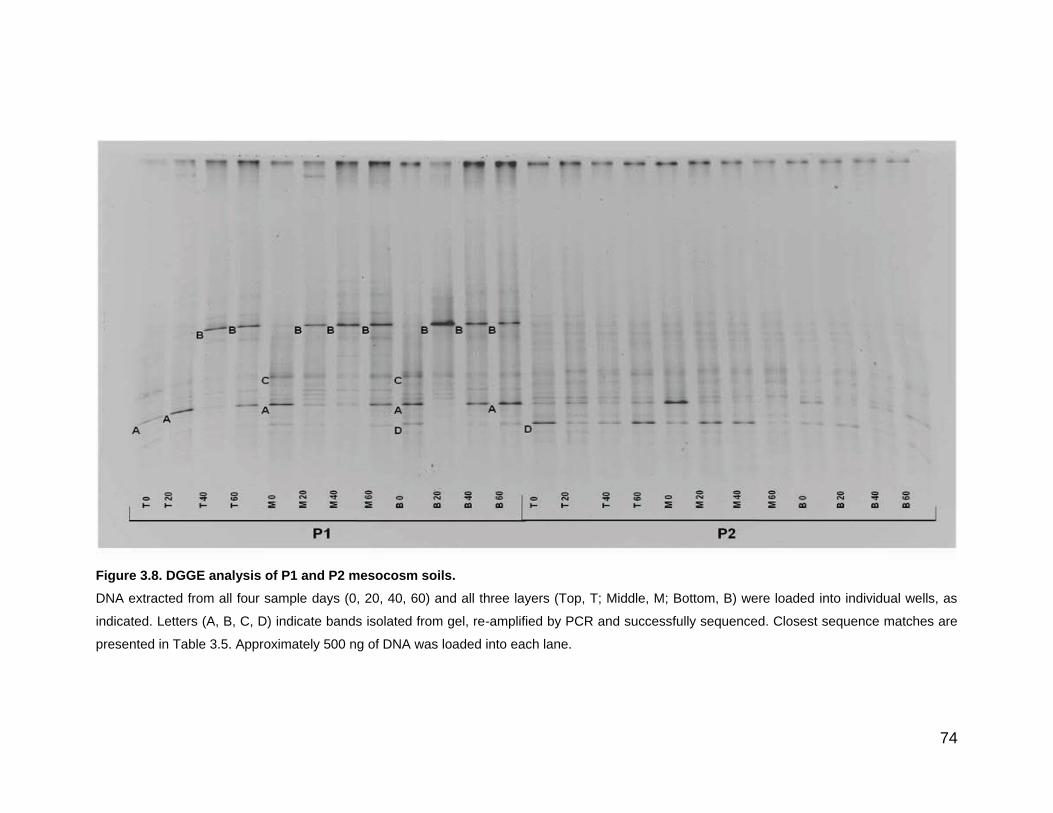
74
Figure 3.8. DGGE analysis of P1 and P2 mesocosm soils.
DNA extracted from all four sample days (0, 20, 40, 60) and all three layers (Top, T; Middle, M; Bottom, B) were loaded into individual wells, as
indicated. Letters (A, B, C, D) indicate bands isolated from gel, re-amplified by PCR and successfully sequenced. Closest sequence matches are
presented in Table 3.5. Approximately 500 ng of DNA was loaded into each lane.

75
Figure 3.9. DGGE analysis of composite soils sampled from mesocosms P3, P4
and P5 from sample days 0, 20, 40, 60.
Composite samples composed of 4 g of soil from each layer (Top, Middle and Bottom),
from which DNA extraction was conducted. Letters (A, E, F) indicate bands isolated from
gel, re-amplified by PCR and successfully sequenced. Closest sequence matches are
presented in Table 3.5. Approximately 500 ng of DNA were loaded into each lane.

76
Table 3.4. Sequence information for mesocosm DGGE analyses (Figs. 3.8, 3.9).
DGGE Band Closest Match
(% similarity) Hydrocarbon Substrates References
A Aeromicrobium
(95% -100%) crude oil Chaillan et al. (2004)
B Alkanindiges
(94 – 97%)
hexadecane, heptadecane,
pristane, squalane Bogan et al. (2003)
C Paenibacillus (98%) naphthalene, phenanthrene Daane et al. (2002)
D Blastococcus (95%) - -
E Rhodanobacter
(95%)
concomitant growth in
consortium grown on diesel Kanaly et al. (2002)
F Acidobacteria (95%) - -
Successfully sequenced DGGE bands, labelled A – F from Figs. 3.8 & 3.9, and the
closest genus level match from online databases. Hydrocarbons substrates listed
correspond to information from the listed references as those utilized by the respective
organism.
Table 3.5. Statistical tests for the P1 B0 and P2 B60 clone libraries.
Test P1 B0 P1 B60
Library Coverage (%) 85.14 86.11
OTUs
Chao1 Richness Estimate
24
54.33
22
29.00
ACE Richness Estimate 52.11 29.57
Shannon’s Diversity Index (H′) 2.72 2.76
Simpson’s Diversity Index (1/D) 13.18 14.12
Library coverage calculated as defined by Good et al. (1953). OTUs, Chao1, ACE,
Shannon and Simpson tests calculated by the DOTUR computer program. All values
presented were calculated for greater than 97% homology between sequences.

77
Figure 3.10. Rarefaction curve of clone libraries from P1 mesocosm. Operational taxonomic units (OTUs) were defined as having ≥97% DNA sequence
homology and rarefaction curves calculated by the computer program DOTUR (section
2.4.3).

78
Figure 3.11. Phylotype composition of the two clone libraries from P1 treated
mesocosm.
For each library, the larger circle represents the proportion of phylotypes as a percentage
of the total library while the smaller inset circle represents the proportion of
Proteobacteria classes as a percentage of Proteobacteria related clones.

79
Table 3.6. Microbial strains isolated during the present study.
Isolate Closest BLAST matches (% homology; class) BLAST Match Notes Accession
MD.1 Rhodococcus erythropolis strain 5 (100%; Actinobacteria) petroleum-degrading strain EF362636
MD.2 Rhodococcus erythropolis strain 5 (96%; Actinobacteria) petroleum-degrading strain EF362636
MD.3 Rhodococcus sp. OS-20 (99%; Actinobacteria) Isolated from lead-zinc mine tailings site EF612316
MD.4 Rhodococcus sp. OS-11 (97%; Actinobacteria) Isolated from lead-zinc mine tailings site EF612310
MD.5 Rhodopseudomonas sp. ORS 1416ri (98%; alpha-proteobacteria) Isolated from root nodule of O. natrix subsp. Falcata AJ968691
MD.6 Arthrobacter sp. KFC-78 (99%; Actinobacteria) Isolated from soil sample from Kafni Glacier in the Himalayas EF459540
MD.7 Mycobacterium sp. RODSPM7 (99%; Actinobacteria) Isolated from high Arctic permafrost soil in Spitsbergen, Norway EF451723
MD.9 Rhodococcus erythropolis strain 5 (100%; Actinobacteria) petroleum-degrading strain EF362636
isoHC1 Arthrobacter sp. OS-31 (100%; Actinobacteria) Isolated from lead-zinc mine tailings site EF612321
isoHC2 Cryobacterium sp. RODSPM5 (98%; Actinobacteria) Isolated from high Arctic permafrost soil in Spitsbergen, Norway EF451721
isoHC3 Burkholderia glathei isolate Hg 5 (98%; beta-proteobacteria) Naphthalene-degrader isolated from soil AY154370
isoHCB1 Pseudomonas sp. WR7#2 (86%; gamma-proteobacteria) Isolated from alpine tundra soil, CO, USA AY263480
isoPS1.1 Oxalobacter sp. HI-D2 (96%; beta-proteobacteria) Isolated from limestone cave rock surface, AZ, USA DQ196473
isoPS1.2 Oxalobacter sp. HI-D2 (98%; beta-proteobacteria) Isolated from limestone cave rock surface, AZ, USA DQ196473
isoPS4.2 Beta proteobacterium KIT2S2K (97%; beta-proteobacteria) Isolated from alpine stream water, Lapland Finland DQ234470
isoPS6 Streptomyces sp. A00099 (97%; Actinobacteria) Endophyte from pharmaceutical plants EF690224
isoPS7 Polaromonas sp. P6E3 (97%; beta-proteobacteria) Isolated from wheat rhizosphere AM492164
isoPS8 Sphingomonas sp. P5-21 (100%; alpha-proteobacteria) Isolated from acid mine drainage, Keumsan, Korea AB288314
LB.1 Pseudomonas sp. CL16 (96%; gamma-proteobacteria) strain can produce cold active lipase AY342005
HCB1pH Cystofilobasidium infirmominiatum isolate AFTOL-ID 1888 (100%; Dikarya) Yeast DQ645524
HCB2pH Cryptococcus gastricus isolate AFTOL-ID 1887 (98%; Dikarya) Yeast DQ645513
HCB3pH Uncultured Tremellaceae clone Amb_18S_1097 (97%; Dikarya) Yeast EF023503
Isolated strains were subjected to DNA sequencing for bacterial 16S or eukaryal 18S partial genes and compared to online databases (see text). Closest BLAST matches are
presented and available information provided by NCBI GenBank on the closest matches, and the GenBank accession numbers are presented.

80
Figure 3.12. Phylogenetic tree of Actinobacteria-related isolated strains.
Isolates MD.1, MD.2, MD.3, MD.4, MD.6, MD.7 and MD.9 are presented with sequences
from the RDP database. Type species (T) and GenBank accession numbers are
indicated. Trees constructed by neighbor joining, best fit trees with Jukes-Cantor
correction and bootstrap values, of >50, from 1000 replicates, are indicated at nodes.
The scale bar represents the expected number of changes per nucleotide position.

81
Figure 3.13. Phylogenetic tree of Proteobacteria-related isolated strain.
Isolates MD.5 is presented with sequences from the RDP database. Type species (T)
and GenBank accession numbers are indicated. Trees constructed by neighbor joining,
best fit trees with Jukes-Cantor correction and bootstrap values, of >50, from 1000
replicates, are indicated at nodes. The scale bar represents the expected number of
changes per nucleotide position.

82
Chapter Four. Discussion and Conclusions
This research shows the potential for the bioremediation of petroleum
hydrocarbon contaminated soil around the former military radar base on
RI, Nunavut. Different soil treatments were tested at the microcosm scale
and, the most favorable conditions were then successfully used at the
mesocosm scale. This scale up process yielded practical information that
can later be translated for more efficient and effective field implementation
at RI. Additionally, insight into the contaminated RI soil microbial
community was gained through culture-dependent and –independent
analyses.
4.1. Phase one: Biotreatability assessment
The initial small scale experiments were conducted to test the
biotreatability potential of the RI soil at 5°C. The physical and chemical
characteristics of the RI soil indicated two areas of concern for
biodegradation; the low nutrient level and the acidic pH of the RI soil. TPH
fraction analysis of the RI soil showed that it was contaminated with F2
and F3 alkanes, and an absence of detectable PAH in the system. The
total community DNA extracted from the RI soils was analyzed for
bacterial genes known to be involved in hydrocarbon biodegradation.
However, the catabolic gene detection results did not completely predict
mineralization ability as some genes were not amplified from soils that
showed mineralization in the microcosm assays. This could have been
due to one, or a combination of the reasons mentioned in section 1.3.1,
and could include insufficient DNA extraction and purification from soil,
primer bias or sub-optimal PCR conditions. Also, the four catabolic genes
tested in this study represent a small sample of the numerous
hydrocarbon degradation genetic pathways that exist in the environment,
as mentioned in section 1.3.2. Ultimately, it was the end mineralization
results that would predict bioremediation potential.

83
The mineralization assays with HC, HCB and PS soils, that addressed the
nutrient level and pH, showed enhanced 14C-hydrocarbon mineralization
activity, when compared to the sterilized control assays. Additionally,
these treated mineralization assays showed enhanced 14C-hydrocarbon
mineralization activity when compared to non-treated assays, with %14CO2
levels similar to the sterilized control assays. 14C-Phenanthrene
mineralization activity was the lowest of the radiolabeled substrates
tested, roughly half of the maximum 14C-hexadecane mineralization
activity, from all three soils after addition of 20:20:20, lime or both.
Microcosms spiked with 14C-naphthalene showed the greatest
mineralization activity of any of the substrates, reaching >20% for multiple
treatments in HC and HCB soils. These results were all relatively
encouraging; soil treated with fertilizer and lime improved the hydrocarbon
biodegradation activity of the RI soils. However, these results were overall
less than expected in comparison to similar studies that have found
greater hydrocarbon mineralization activity, especially for hexadecane and
naphthalene (Whyte et al. 1999; Børresen et al. 2003; Børresen et al.
2007). For example, in a mineralization assay with three hydrocarbon
contaminated Arctic soils, each amended with 20:20:20 fertilizer and
incubated at 5°C for ~45 days, 14C-hexadecane mineralization activity
levels ranged from ~15 - 30% and 14C-naphthalene mineralization levels
ranged from ~50 - 65% (Whyte et al. 2001). The low mineralization levels
of 14C-phenanthrene may have been due to the increasing difficulty
microorganisms generally have with breaking down larger PAH molecules
(Huesemann 1995) or some hindrance in the bioavailability of
phenanthrene in the soil matrix (Ping et al. 2006).
An explanation for the relatively low hydrocarbon mineralization activities
for the small scale biotreatability assays, even when amended with
nutrients, could have been because of the relatively low viable microbial
populations, ranging from 102 – 105 CFU g-1 soil. Other studies of
microbial viable counts from hydrocarbon impacted Arctic soils have

84
shown a range of 105 – 108 CFU g-1 soil (Berthelet et al. 1996; Braddock
et al. 1997; Juck et al. 2000). Additionally, investigation of the possible
presence of toxins in the RI soils, which could inhibit microbial growth or
metabolism, was conducted. The soil toxicity results showed an absence
of toxicity in the RI soil. This may be due to the high total organic carbon
(TOC) content (>20,000 ppm) in the hydrocarbon impacted soils where the
TPH concentration was only 10% of the TOC. Humic acids are likely a
large constituent of the soil TOC and could be inhibitory for microbes, as
Loffredo et al. (2007) found with two fungal strains. Anesio et al. (2005)
observed inhibition of bacterial growth in lake water due to
photodegradation of humic substances into H2O2, though it remains
unclear if this would occur in a soil system. Nonetheless, these assays
established that nutrient and lime addition stimulated a cold-adapted
microbial population in the RI soils capable of hydrocarbon
biodegradation.
4.2. Phase two: Mesocosm trials
The information gleaned from the biotreatablity assessment studies was
then applied to the large scale tanks and the microbiology with the system
was analyzed. The mesocosm mineralization assays represented a snap-
shot of the alkane biodegradation potential for the P1-treated and P2-
untreated mesocosm trials as treatment progressed. As in the
biotreatablity assays, mesocosm mineralization assays showed a clear
improvement in 14C-hexadecane mineralization from the untreated to the
treated system. Moreover, the %14CO2 recovered increased as the P1
mesocosm trial progressed, therefore, not only did the nutrient and lime
amendments have positive impacts on microbial activity, but the
mesocosm system also enhanced hydrocarbon mineralization activity.
This “enhancement” was lost in the biotreatablity assessment
mineralization assays, and was encouraging because the mesocosms
were designed to be more representative of the natural RI site. Also, by
the end of the P1 mesocosm trial, the %14CO2 recovered was much

85
greater than levels seen in the biotreatability mineralization assays, and
more akin to other bioremediation studies already mentioned. The shift
from the low-mineralization activity phase one results to the high-
mineralization activity results from phase two was contrary to other soil
hydrocarbon bioremediation studies, in which the rates and extent of
contaminant biodegradation decreased with increasing scale of the test
system (Korus et al. 2001; Davies et al. 2003). Interconnected with the
mesocosm hexadecane mineralization results were the results from the
microbial enumerations and DGGE molecular fingerprinting. During the
P1-treated mesocosm trial, greater numbers of viable hydrocarbon-
degrading microorganisms and total microorganisms were observed, the
former increasing ~27x - 48x, and the latter increasing ~2.5x – 3.5x.
DGGE profiles and the nucleotide sequences of the bands therein,
indicated the emergence of a synergistic hydrocarbon-degrading
community during the mesocosm trials. Also, results obtained at CEAM by
W. Chang showed steady TPH reduction in the P1-treated mesocosm,
from >2000 ppm TPH at day 0 to <1000 ppm TPH at day 60, while no
such reduction was observed in the P2-untreated mesocosm (Chang et al.
2007). Similarly in P1, the concentration of the F2 and F3 hydrocarbon
fractions were reduced from ~1000 – 1200 ppm at day 0 to ~300 – 500
ppm at day 60 (Chang et al. 2007). Cumulative net CO2 production and O2
consumption also increased by the end of the P1 trial, but not in the P2
(Chang et al. 2007).
The specific reason for the difference between the %14CO2 recoveries
from the biotreatability mineralization assays, and those that used the
mesocosm soil remains unclear. One possible explanation may concern
the addition of essential nutrients to the RI soil. Both the viable
enumerations and total direct microscopic enumerations increased after
the beginning of the P1 trial, but did not continue to increase, or
accelerate. Instead, the levels remained relatively similar from sample
days 20, 40 and 60, which is contrary to the accelerating 14C-hexadecane

86
mineralization activity results. The added nutrients may have enabled the
microbial community to metabolize other preferred carbon sources in the
soil matrix besides hydrocarbons, switching to hydrocarbons after other
sources had become less abundant. This could partly explain the time
difference between the population increase and hexadecane
mineralization, since, for example, the alkane catabolic pathway of P.
oleovorans is subject to carbon catabolite repression (Staijen et al. 1999).
It is also possible that the tilling of the soil, while eliminating micro-
anaerobic environments, volatilized inhibitory compounds from the soil
(though no distinct smells were detected during the tilling process) or the
fluctuating temperature stimulated biodegradation, as has been noted in
other temperature fluctuation experiments (Eriksson et al. 2001, Børresen
et al. 2007).
4.2.1. Molecular analyses
The DGGE bands only consisted of a ~400 bp section of the bacterial 16S
rRNA gene thus prudence must be observed when discussing closest
BLAST matches. That being acknowledged, the DGGE results for the four
treated mesocosms did indicate changes in community structure and
sequence analysis did imply the presence and emergence of bacteria
related to known hydrocarbon degraders. The P2 DGGE results showed
no change in banding pattern at all, which coincided with the lack of 14C-
hexadecane mineralization and static microbial population results of this
untreated mesocosm. DGGE bands isolated and sequenced from all four
of the treated mesocosms contained sequences related to known
members of the hydrocarbon-degrading bacterial community (Chaillan et
al. 2004; Daane et al. 2002; Kanaly et al. 2002; Bogan et al. 2003). This
indicated that the community was sufficiently stimulated in the treated
mesocosm systems to become detectable. Further evidence that the
hydrocarbon degrading community was especially being stimulated were
the repeated sequence results from bands extracted from the different soil
samples related to known hydrocarbon degraders; for example the

87
Aeromicrobium-related bands from all four treated mesocosms and the
Alkanindiges-related bands from the P1 soils and the HC soils.
Since DGGE is considered, at best, semi-quatitative, the specific nature of
band intensification could not be determined. For example, whether band
B (Fig. 3.9), which corresponded to the Alkanindiges-related 16S rRNA
gene sequence in the P1 DGGE gel, increased as the cell enumerations
did, initially after the beginning of the mesocosm trial and subsequently
stabilizing, or in an accelerating fashion resembling the mineralization
assay results, remains unclear. Correlation between when, and what
members of the hydrocarbon degrading community commenced
hydrocarbon biodegradation activity could be useful for designing a
specific regime of nutrient supplementation tailored for active members of
the community. Though the nature of DGGE band intensification could not
be determined, the DGGE analyses did indicate important members of the
bacterial hydrocarbon degrading community.
To add further depth to the RI bacterial community findings and the
change in community structure due to mesocosm treatment, 16S rRNA
gene clone libraries were constructed, using different PCR primers than
those used for DGGE analysis to alleviate the possible inherent primer
bias of a single primer pair. To directly discern the effect of the mesocosm
treatment on the soil bacterial community, the two clone libraries were
constructed from the P1 B0 soil and the P1 B60 soil, thus the initial
bacterial community could be compared to the post-mesocosm treated
bacterial community. Clone libraries were not constructed for samples
from the P2-untreated mesocosm because DGGE analyses did not
indicated a shift in bacterial community. The libraries were comparable in
size and coverage (Good 1953); P1 B0 consisted of 74 clone sequences,
which gave coverage of ~85% (at 97% homology cutoff), and P1 B60
consisted of 72 clone sequences, which gave coverage of ~86% (at 97%
homology cutoff). Statistical analysis determined the libraries to have a
88
significant difference (p<0.025), when compared using the program
webLIBSHUFF, making it clear that a change in the bacterial population
had occurred. This difference is also evident from the Chao1 and ACE
richness estimators, which both simply count the number of different
OTUs in a given library. Chao1 and ACE showed a 46.62% and 43.25%
reduction, respectively, from the P1 B0 to P1 B60 libraries. The reduction
of the richness estimators could be a result of the mesocosm optimizing
conditions for a select sub-population of the initial soil bacteria. The
diversity indices of Shannon (1949) and Simpson (1949), which account
for abundance and evenness of the OTUs present in a given library, were
also calculated. The Shannon values of 2.72 and 2.76 and Simpson
values of 13.18 and 14.12 were similar to diversity values from an
investigation by Perreault et al. (2007) of two unrelated Arctic bacterial
communities, which found Shannon’s diversity index of 2.16 and 3.17 and
Simpson’s diversity index of 4.25 and 14.82. As the two libraries in this
study were fundamentally coupled, direct comparison of the Shannon and
Simpson indices showed an increase of 1.45% and 6.66%, respectively,
from the P1 B0 to P1 B60 library. DGGE results of Hamamura et al.
(2006) showed an associated increase in soil bacterial community
diversity after reduction of oil contamination during a bioremediation study.
Röling et al. (2002) found that after oiling and nutrient amendment of test
soils, an initial decrease in biodiversity occurred, followed by recovery to
nearly the original levels of soil biodiversity. The authors did note,
however, that though the soil biodiversity nearly reached the same
Shannon diversity value after bioremediation, the bacterial community
structure that had initially been 73.1% gamma-proteobacteria changed to
63.3% alpha-proteobacteria (Röling et al. 2002). The individual BLAST
matches for the clone sequences revealed some relatedness to other
known hydrocarbon degraders, cold adapted bacteria or acid tolerant
organisms. There was also some overlap between the sequences
recovered in the clone libraries and those of the DGGEs, though not of the

89
cultured organisms, simply reiterating the need for a multifaceted
approach to community characterization.
It seems reasonable to assume that given the results from the mesocosm
mineralization assays and hydrocarbon-degrading viable cell
enumerations, that there is a general increase in the hydrocarbon-
degrading microbial community in the P1 soil at the conclusion of the trial.
The change in phyla representation from the two clone libraries would
then suggest the predominant composition of the hydrocarbon-degrading
bacterial community. The change in bacterial community structure from
the P1 B0 to P1 B60 clone libraries showed the representation of
Actinobacteria and Firmicutes drop 80.00% and 33.33%, respectively,
signifying they were less important in hydrocarbon biodegradation. The
Bacteroidetes, on the other hand, were not detected in the first clone
library but came to represent 14% of the P1 B60 library, while the
Proteobacteria increased representation by 20.63%. Within the
Proteobacteria, there is a marked shift in the proportionality of the classes;
alpha- and beta- classes combined to make up 76% in the P1 B0 library,
but were reduced to 40% in the second library. Different members of the
beta-proteobacteria have been shown capable of hydrocarbon
degradation (Viñas et al. 2005) and it may be that the indigenous RI soil
members of this class are important constituents in the bioremediation of
hydrocarbon contaminated RI soil. Likewise, members from the
Bacteroidetes class have been shown to degrade hydrocarbons at low
temperatures (Margesin et al. 2003) and are seemingly central
hydrocarbon degraders in the RI system. Culture dependent analyses,
however, failed to cultivate members from the beta-proteobacteria or
Bacteroidetes, though the organisms isolated were an interesting facet to
information on the general microbial community structure.

90
4.2.2. Culture-based analyses
It is not too surprising that the indigenous soil microbial community from
an island of the Canadian Arctic archipelago would contain cold-adapted
microorganisms. The viable aerobes isolated at 5°C on MSM-Arctic diesel
plates from the different soils, HC, PS and HCB, represent a diverse
group, including bacteria and eukarya. Virtually no information was
available specifically for the closest eukaryal BLAST matches; however
Brizzio et al. (2007) isolated members of the Cystofilobasidium and
Cryptococcus from glacial and sub-glacial waters in search of cold-
adapted yeasts as sources of cold-adapted enzymes for biotechnological
applications. The closest BLAST match to isolate HCB3pH was an
uncultured Tremellaceae clone and the Tremellaceae are part of the same
class as Cystofilobasidium and Cryptococcus. An ecological study of
fungal populations by López-Archilla et al. (2004) isolated members from
the Cryptococcus and Tremellaceae families from the acidic Tinto River in
Spain. Because the identification of the isolates from the HC, PS and PCB
soils was monophasic, commenting extensively on the closest BLAST
matches would be imprudent. However, it can be said without doubt that
three of the thirteen isolates were eukayotes and these were the only
strains recovered on acidic media, at ~4.5. The two bacterial phyla
represented were the Actinobacteria and Proteobacteria, both common
soil microorganisms with cold-adapted hydrocarbon-degrading
representatives (Whyte et al. 1997; Whyte et al. 1998). The information
available by GenBank about the closest BLAST matches to these isolates
showed many to have demonstrated hydrocarbon-degrading capability or
isolated from cold-temperature environments (Table 3.6). Strains related
to Rhodococcus were the most represented in of the cultured isolates,
accounting for ~26% of all isolates, indicating the importance of
Rhodococcus-like organisms in hydrocarbon biodegradation. The isolated
strains from this study were not represented in the DGGE analysis, most
likely due to one of the factors previously mentioned. The reoccurrence
91
and apparent dominance of the Alkanindiges related DGGE band led to
more directed cultivation attempts, discussed in greater detail below.
Two enrichment cultures were conducted; the first used HC soil because
of the strong Alkanindiges related band in the DGGE gel of DNA extracted
and PCR amplified for the 16S rRNA gene from the HC soil. The method
of Whyte et al. (1999) resulted in isolate LB.1, which had high 16S rRNA
gene sequence homology to a Pseudomonas strain. This may have been
a result of the yeast extract used in the first stage of this method selecting
for faster growing heterotrophs; the doubling time of Pseudomonas is ~2-3
times that of Alkanindiges (Bogan et al. 2003; Palleroni 2005). The second
enrichment culture prepared started with P1 B20 soil, which had in
essence been prescreened for presence of the desired organism by
DGGE analysis. The protocol for the original isolation of the type strain for
the Alkanindiges genus (Bogan et al. 2003) was followed, but, as before
the target organism was not selected. The isolated strain, MD.1, had high
16S rRNA gene sequence homology to the genus Rhodococcus.
Additionally, P1 B20 soil was plated directly with the idea that less
manipulation might increase the chance of recovering the desired
organisms. However, none of the seven strains recovered had close
sequence homology to Alkanindiges. In a study by Stach and Burns
(2002) that investigated the microbial PAH degrading community from a
PAH impacted soil, the authors found that use of enrichment cultures
reduced biodiversity, thereby possibly eliminating organisms of interest.
The authors also noted the inherent bias of solid media for isolation of
target organisms (Stach and Burns 2002). As previously discussed,
organisms detected in molecular analysis often prove to be beyond the
ability of researchers to culture even if it appears to dominate a community
(Hugenholtz et al. 2001), as was the case here. This simply reiterated the
necessity for a multifaceted approach to community analysis for best
coverage and reliability, even for a bioremediation project where

92
examination of the microbial community responsible or effected by the
bioremediation treatments was of auxiliary interest.
The isolates cultivated by direct spread plating that started with the P1
B20 soil also did not have high 16S rRNA gene homology to Alkanindiges.
Seven of the eight strains had partial 16S rRNA gene sequences related
to Actinobacteria and the eighth was related to the alpha-proteobacteria.
These isolates could prove interesting in their own right as well. Isolate
MD.2, which had 96% 16S rRNA gene sequence homology with a
Rhodococcus strain and branched closely to the type strain of R.
erythropolis and the known hydrocarbon-degrader Rhodococcus sp. Q15
(Whyte et al. 1999), was able to grow on MSM-Arctic diesel plates at -5°C.
This suggests the presence of a population of sub-zero, hydrocarbon-
degrading microorganisms and such a population could theoretically
expand the season for hydrocarbon biodegradation beyond the summer
months. However, no hydrocarbon mineralization activity was observed at
sub-zero temperatures, indicating the potential use of isolate MD.2 in
bioaugmentation experiments with RI soil. Børresen et al. (2007) noted
sub-zero mineralization of hydrocarbons in soil microcosm assays, but did
not culture individual sub-zero hydrocarbon degrading organisms.
Isolate MD.5, the only strain isolated whose partial 16S rRNA gene
sequence was not closely related to the phylum Actinobacteria, branched
separately from other genera of alpha-proteobacteria. Supplementary
phylogenetic analysis showed the only other organism that branched with
MD.5 was an environmental isolate, designated Rhodopseudomonas sp.
ORS 1416ri, which showed only 97% similarity to the type species R.
rhenobacensis (Zakhia et al. 2006). According to the RDP database (Cole
et al. 2007), the MD.5 partial 16S rRNA gene sequence was only 87%
similar to this type species, and showed closer homology (89%) to Afipia
massiliensis, also a type species. The preliminary results indicate that
MD.5 may be a novel species or even genus of bacteria.

93
Detailed identification of the hydrocarbon degrading microbial community
in RI soil would, of course require more in-depth molecular and culture
dependent analyses, but it is clear from this study that the indigenous
microbial RI soil community has hydrocarbon biodegradation potential.
4.3. Major conclusions from this project
Biostimulation positively affected the hydrocarbon biodegradation
potential where otherwise, very little biodegradation activity was
observed. The mineralization assays clearly displayed the
difference between treated and untreated soils, which became
more pronounced in the mesocosm trials. This was, perhaps, the
most promising result of this study given that this project was
designed as a precursor for eventual implementation of selected
bioremediation treatments on RI, and the mesocosm trials
mimicked the natural environment of RI.
Culture-dependent and –independent analyses indicated the
presence of a diverse indigenous microbial community capable of
hydrocarbon biodegradation at cold temperatures.
DGGE analyses imply proliferation of the hydrocarbon degrading
bacterial community and while the clone libraries indicate a loss of
bacterial richness due to mesocosm treatment, they also show a
slight increase in bacterial diversity.
Isolated strains, which included bacteria and yeast, showed
hydrocarbon-degrading sub-populations able to use hydrocarbons
as the sole carbon source while growing under acidic or sub-zero
conditions. The initial identification and classification of some of
these isolates hinted at possible novelty, and may warrant further
characterization conceivably for use in prospective
bioaugmentation treatments.

94
Overall, this study addressed the unique conditions of the RI
hydrocarbon contaminated soil, and provided and supported a feasible
procedure for the bioremediation of hydrocarbon contaminated RI soil.
95
References
Aguilar PS, Lopez P, de Mendoza D. 1999. Transcriptional Control of the Low-Temperature-Inducible des Gene, Encoding the Delta 5 Desaturase of Bacillus subtilis. J. Bacteriol. 181: 7028-33
Aguilera A, Gomez F, Lospitao E, Amils R. 2006. A molecular approach to the characterization of
the eukaryotic communities of an extreme acidic environment: Methods for DNA extraction and denaturing gradient gel electrophoresis analysis. Systematic and Applied Microbiology 29: 593-605
Aiken SG, Dallwitz MJ, Consaul LLM, C.L. Gillespie, L.J. Boles, R.L. Argus, G.W. Gillett, J.M. Scott,
P.J. Elven, R. LeBlanc, M.C. Brysting A.K. Solstad H. (1999 onwards). Version: 29th April 2003. Flora of the Canadian Arctic Archipelago: Descriptions, Illustrations, Identification, and Information Retrieval. In http://www.mun.ca/biology/delta/arcticf/’
Aislabie J, Saul D, Foght J. 2006. Bioremediation of hydrocarbon-contaminated polar soils.
Extremophiles 10: 171-9 Aislabie JM, Balks MR, Foght JM, Waterhouse EJ. 2004. Hydrocarbon Spills on Antarctic Soils:
Effects and Management. Environ. Sci. Technol. 38: 1265-74 Allen JP, Atekwana EA, Atekwana EA, Duris JW, Werkema DD, Rossbach S. 2007. The Microbial
Community Structure in Petroleum-Contaminated Sediments Corresponds to Geophysical Signatures. Appl. Environ. Microbiol. 73: 2860-70
Amann RI, Ludwig W, Schleifer KH. 1995. Phylogenetic identification and in situ detection of
individual microbial cells without cultivation. Microbiol. Rev. 59: 143-69 AMAP. 1998. AMAP Assessment Report: Arctic Pollution Issues. Arctic Monitoring and
Assessment Programme (AMAP). Oslo, Norway Amato P, Parazols M, Sancelme M, Laj P, Mailhot G, Delort A-M. 2007. Microorganisms isolated
from the water phase of tropospheric clouds at the Puy de Dôme: major groups and growth abilities at low temperatures. FEMS Microbiology Ecology 59: 242-54
Anesio AM, Graneli W, Aiken GR, Kieber DJ, Mopper K. 2005. Effect of Humic Substance
Photodegradation on Bacterial Growth and Respiration in Lake Water. Appl. Environ. Microbiol. 71: 6267-75
Atlas RM. 1995. Petroleum biodegradation and oil spill bioremediation. Marine Pollution Bulletin 31:
178-82 Barns SM, Fundyga RE, Jeffries MW, Pace NR. 1994. Remarkable Archaeal Diversity Detected in
a Yellostone National Park Hot Spring Environment. PNAS 91: 1609-13 Battaglia A, Morgan DJ. 1994. Ex Situ forced aeration of soil piles: A physical model.
Environmental Progress 13: 178-87 Berthelet M, Whyte LG, Greer CW. 1996. Rapid, direct extraction of DNA from soils for PCR
analysis using polyvinylpolypyrrolidone spin columns. FEMS Microbiology Letters 138: 17-22
Bhadbhade BJ, Sarnaik SS, Kanekar PP. 2002. Bioremediation of an Industrial Effluent Containing
Monocrotophos. Current Microbiology 45: 346-9 Bogan BW, Sullivan WR, Kayser KJ, Derr KD, Aldrich HC, Paterek JR. 2003. Alkanindiges
illinoisensis gen. nov., sp. nov., an obligately hydrocarbonoclastic, aerobic squalane-degrading bacterium isolated from oilfield soils. Int J Syst Evol Microbiol 53: 1389-95

96
Børresen M, Breedveld GD, Rike AG. 2003. Assessment of the biodegradation potential of hydrocarbons in contaminated soil from a permafrost site. Cold Regions Science and Technology 37: 137-49
Børresen MH, Barnes DL, Rike AG. 2007. Repeated freeze-thaw cycles and their effects on
mineralization of hexadecane and phenanthrene in cold climate soils. Cold Regions Science and Technology 49: 215-25
Børresen MH, Rike AG. 2007. Effects of nutrient content, moisture content and salinity on
mineralization of hexadecane in an Arctic soil. Cold Regions Science and Technology 48: 129-38
Bower SM, Carnegie RB, Goh B, Jones SRM, Lowe GJ, Mak MWS. 2004. Preferential PCR
Amplification of Parasitic Protistan Small Subunit rDNA from Metazoan Tissues. The Journal of Eukaryotic Microbiology 51: 325-32
Braddock JF, Lindstrom JE, Brown EJ. 1995. Distribution of hydrocarbon-degrading
microorganisms in sediments from Prince William Sound, Alaska, following the Exxon Valdez oil spill. Marine Pollution Bulletin 30: 125-32
Braddock JF, Ruth ML, Catterall PH, Walworth JL, McCarthy KA. 1997. Enhancement and
Inhibition of Microbial Activity in Hydrocarbon-Contaminated Arctic Soils: Implications for Nutrient-Amended Bioremediation. Environ. Sci. Technol. 31: 2078-84
Bradley PM, Chapelle FH. 1995. Rapid Toluene Mineralization by Aquifer Microorganisms at Adak,
Alaska: Implications for Intrinsic Bioremediation in Cold Environments. Environ. Sci. Technol. 29: 2778-81
Brizzio S TB, de García V, Libkind D, Buzzini P, van Broock M. 2007. Extracellular enzymatic
activities of basidiomycetous yeasts isolated from glacial and subglacial waters of northwest Patagonia (Argentina). Can J Microbiol 53: 519-25
Brofft JE, McArthur JV, Shimkets LJ. 2002. Recovery of novel bacterial diversity from a forested
wetland impacted by reject coal. Environmental Microbiology 4: 764-9 Button DK, Schut F, Quang P, Martin R, Robertson BR. 1993. Viability and Isolation of Marine
Bacteria by Dilution Culture: Theory, Procedures, and Initial Results. Appl. Environ. Microbiol. 59: 881-91
Cavicchioli R, Thomas T, Curmi PMG. 2000. Cold stress response in Archaea. Extremophiles 4:
321-31 Cerniglia CE. 1992. Biodegradation of polycyclic aromatic hydrocarbons. Biodegradation 3: 351-68 Chaillan F, Le Fleche A, Bury E, Phantavong Yh, Grimont P, et al. 2004. Identification and
biodegradation potential of tropical aerobic hydrocarbon-degrading microorganisms. Research in Microbiology 155: 587-95
Chang WJ, Dyen M, Spagnuolo L, Simon P, Flaherty H, et al. 2007. Pilot-scale landfarming of
petroleum hydrocarbon contaminated from Resolution Island, Nunavut. Presented at Proceedings of the Fifth Biennial Workshop on Assessment and Remediation of Contaminated Sites in Arctic and Cold Climates, Edmonton, AB.
Chao A. 1984. Non-parametric estimation of the number of classes in a population. Scand J Stat.
11: 265-70 Chao A, Ma MC, Yang MCK. 1993. Stopping rules and estimation for recapture debugging with
unequal failure rates. Biometrics. 43: 783-91 Chénier, M.R., D. Beaumier, R. Roy, B.T. Driscoll, J.R. Lawrence and C.W. Greer. 2003. Impact of
seasonal variations and nutrient inputs on nitrogen cycling and degradation of
97
hexadecane by replicated river biofilms, Applied and Environmental Microbiology 69 (2003), pp. 5170–5177.
Chuvilin EN, NS; Miklyaeva, EC; Kozlova, EV; Instanes, A. 2001. Factors affecting spreadability
and transportation of oil in regions of frozen ground Polar Record 37: 229-38 Cole JR, Chai B, Farris RJ, Wang Q, Kulam-Syed-Mohideen AS, et al. 2007. The ribosomal
database project (RDP-II): introducing myRDP space and quality controlled public data. Nucl. Acids Res. 35: D169-72
Daane LL, Harjono I, Barns SM, Launen LA, Palleroni NJ, Haggblom MM. 2002. PAH-degradation
by Paenibacillus spp. and description of Paenibacillus naphthalenovorans sp. nov., a naphthalene-degrading bacterium from the rhizosphere of salt marsh plants. Int J Syst Evol Microbiol 52: 131-9
Davis C, Cort T, Dai D, Illangasekare TH, Munakata-Marr J. 2003. Effects of Heterogeneity and
Experimental Scale on the Biodegradation of Diesel. Biodegradation 14: 373-84 de la Torre JR, Goebel BM, Friedmann EI, Pace NR. 2003. Microbial Diversity of Cryptoendolithic
Communities from the McMurdo Dry Valleys, Antarctica. Appl. Environ. Microbiol. 69: 3858-67
DeLong EF, Pace NR. 2001. Environmental Diversity of Bacteria and Archaea. Systematic Biology
50: 470 – 8 Dibble JT, Bartha R. 1979. Effect of environmental parameters on the biodegradation of oil sludge.
Appl. Environ. Microbiol. 37: 729-39 Dojka MA, Harris JK, Pace NR. 2000. Expanding the Known Diversity and Environmental
Distribution of an Uncultured Phylogenetic Division of Bacteria. Appl. Environ. Microbiol. 66: 1617-21
Eaton RW, Chapman PJ. 1992. Bacterial metabolism of naphthalene: construction and use of
recombinant bacteria to study ring cleavage of 1,2-dihydroxynaphthalene and subsequent reactions. J. Bacteriol. 174: 7542-54
Environment Canada. 1992. Biological test method: toxicity test using luminescent bacteria
(Photobacterium phosphoreum). Ottawa, Canada: Environmental Protection Series. Environment Canada home page: Weather Office http://www.weatheroffice.ec.gc.ca/. EPA. 1989. Protocols for Short Term Toxicity Screening of Hazardous Waste Sites. EPA. 600/3-
88/029. US Environmental Protection Agency. Washington, DC. EPA. 1995. How to evaluate alternative cleanup technologies for underground storage tank sites: A
guide for corrective action plan reviewers. EPA 510-B-95-007. United States Environmental Protection Agency, Washington, DC.
Eriksson M, Ka J-O, Mohn WW. 2001. Effects of Low Temperature and Freeze-Thaw Cycles on
Hydrocarbon Biodegradation in Arctic Tundra Soil. Appl. Environ. Microbiol. 67: 5107-12 Felsenstein J. 2005. PHYLIP (Phylogeny Inference Package) version 3.6. Distributed by the author.
Department of Genome Sciences, University of Washington, Seattle. Ferrari BC, Binnerup SJ, Gillings M. 2005. Microcolony Cultivation on a Soil Substrate Membrane
System Selects for Previously Uncultured Soil Bacteria. Appl. Environ. Microbiol. 71: 8714-20
Foght JM, Fedorak PM, Westlake DWS. 1990. Mineralization of
14C-hexadecane and
14C-
phenanthrene in crude oil: specificity among bacterial isolates. Can J Microbiol 36: 169-75

98
Fritsche W. and Hofichter M. 2000. Aerobic degradation by microorganisms. In Biotechnology, 2nd
edition; Environmental Processes II – Soil decontamination. Vol. 11b. pp 146-64. Ed. Klein J.
Wiley-VCH Press.
Gans J, Wolinsky M, Dunbar J. 2005. Computational Improvements Reveal Great Bacterial Diversity and High Metal Toxicity in Soil. Science 309: 1387-90
Gewin V. 2006. Genomics: Discovery in the dirt. Nature 439: 384-6 Ghoshal S, Luthy RG. 1996. Bioavailability of Hydrophobic Organic Compounds from Nonaqueous
Phase Liquids: The Biodegradation of Naphthalene from Coal Tar. Environmental Toxicology and Chemistry 15: 1894-900
Good I. 1953. The population frequencies of species and the estimation of population parameters.
Biometrika. 40: 237-64 Greene JC, Bartels, C. L., Warren-Hicks, W. J., Parkhurst, B. R.,, Linder GL, Peterson, S. A. and
Miller, W. E. 1989. Protocols for short term toxicity screening of hazardous waste sites. Corvallis, OR, U.S.: Environmental Protection Agency.
Hamamura N, Olson SH, Ward DM, Inskeep WP. 2005. Diversity and Functional Analysis of
Bacterial Communities Associated with Natural Hydrocarbon Seeps in Acidic Soils at Rainbow Springs, Yellowstone National Park. Appl. Environ. Microbiol. 71: 5943-50
Hamamura N, Olson SH, Ward DM, Inskeep WP. 2006. Microbial Population Dynamics Associated
with Crude-Oil Biodegradation in Diverse Soils. Appl. Environ. Microbiol. 72: 6316-24 Handelsman J. 2004. Metagenomics: Application of Genomics to Uncultured Microorganisms.
Microbiol. Mol. Biol. Rev. 68: 669-85 Harbhajan S. 2006. Fungal Metabolism of Petroleum Hydrocarbons. In Mycoremediation, pp. 115-
48 Head IM, Saunders JR, Pickup RW. 1998. Microbial Evolution, Diversity, and Ecology: A Decade of
Ribosomal RNA Analysis of Uncultivated Microorganisms. Microb Ecol 35: 1-21 Henriksen JR. 2004. webLIBSHUFF (http://libshuff.mib.uga.edu). Hong S-H, Bunge J, Jeon S-O, Epstein SS. 2006. Predicting microbial species richness. PNAS
103: 117-22 Huesemann MH. 1995. Predictive Model for Estimating the Extent of Petroleum Hydrocarbon
Biodegradation in Contaminated Soils. Environ. Sci. Technol. 29: 7-18 Hugenholtz P, Goebel BM, Pace NR. 1998. Impact of Culture-Independent Studies on the
Emerging Phylogenetic View of Bacterial Diversity. J. Bacteriol. 180: 4765-74 Hugenholtz P, Tyson GW, Webb RI, Wagner AM, Blackall LL. 2001. Investigation of Candidate
Division TM7, a Recently Recognized Major Lineage of the Domain Bacteria with No Known Pure-Culture Representatives. Appl. Environ. Microbiol. 67: 411-9
Indian and Northern Affairs Canada (INAC) website: Resolution Island Remediation Project
http://www.ainc-inac.gc.ca/nu/nuv/zxca_e.html. Jorgenson MT. 1995. Clean-up, bioremediation and tundra restoration after a crude-oil spill, S.E.
Eileen exploratory well site, Prudhoe Bay, Alaska,1993. Alaska Biological Research Fairbanks.
Juck D, Charles T, Whyte LG, Greer CW. 2000. Polyphasic microbial community analysis of
petroleum hydrocarbon-contaminated soils from two northern Canadian communities. FEMS Microbiology Ecology 33: 241-9

99
Jukes TH, Cantor RR. 1969. Evolution of protein molecules. New York: Academic Press. Kaeberlein T, Lewis K, Epstein SS. 2002. Isolating "Uncultivable" Microorganisms in Pure Culture
in a Simulated Natural Environment. Science 296: 1127-9 Kamlesh J, Williams, M., Franzluebbers, A.J., Jenkins, M., Endale, D.M., Coleman, D.C., Whitman,
W.B. 2006. Soil bacterial community composition and diversity as affected by animal manure application in pasture and cropping systems of the Southern Piedmont USA [abstract]. . In Academy of the Environment Conference. January 28-February 1, 2007: Savannah, Georgia.
Kanaly RA, Harayama S, Watanabe K. 2002. Rhodanobacter sp. Strain BPC1 in a Benzo[a]pyrene-
Mineralizing Bacterial Consortium. Appl. Environ. Microbiol. 68: 5826-33 Kastner M, Breuer-Jammali M, Mahro B. 1998. Impact of Inoculation Protocols, Salinity, and pH on
the Degradation of Polycyclic Aromatic Hydrocarbons (PAHs) and Survival of PAH-Degrading Bacteria Introduced into Soil. Appl. Environ. Microbiol. 64: 359-62
Kepner RL, Jr., Pratt JR. 1994. Use of fluorochromes for direct enumeration of total bacteria in
environmental samples: past and present. Microbiol. Mol. Biol. Rev. 58: 603-15 Killham K. 1994. Soil Ecology. Cambridge University Press, Cambridge. Kim J-S, Crowley DE. 2007. Microbial Diversity in Natural Asphalts of the Rancho La Brea Tar Pits.
Appl. Environ. Microbiol. 73: 4579-91 Kiyohara H, Torigoe S, Kaida N, Asaki T, Iida T, et al. 1994. Cloning and characterization of a
chromosomal gene cluster, pah, that encodes the upper pathway for phenanthrene and naphthalene utilization by Pseudomonas putida OUS82. J. Bacteriol. 176: 2439-43
Korus RA. 2001. Scale-up of processes for bioremediation. In Manual of environmental
microbiology, 2nd ed. Washington D.C.: ASM Press Krsek M, Wellington EMH. 1999. Comparison of different methods for the isolation and purification
of total community DNA from soil. Journal of Microbiological Methods 39: 1-16 Labbé D, Margesin R, Schinner F, Whyte LG, Greer CW. 2007. Comparative phylogenetic analysis
of microbial communities in pristine and hydrocarbon-contaminated Alpine soils. FEMS Microbiology Ecology 59: 466-75
Larsen KS, Jonasson S, Michelsen A. 2002. Repeated freeze-thaw cycles and their effects on
biological processes in two arctic ecosystem types. Applied Soil Ecology 21: 187-95 Laurie AD, Lloyd-Jones G. 1999. The phn Genes of Burkholderia sp. Strain RP007 Constitute a
Divergent Gene Cluster for Polycyclic Aromatic Hydrocarbon Catabolism. J. Bacteriol. 181: 531-40
Leahy JG, Colwell RR. 1990. Microbial degradation of hydrocarbons in the environment. Microbiol.
Mol. Biol. Rev. 54: 305-15 Lesage S, Brown S, Millar K, Novakowski K. 2001. Humic Acids Enhanced Removal of Aromatic
Hydrocarbons from Contaminated Aquifers: Developing a Sustainable Technology. Journal of Environmental Science and Health, Part A 36: 1515 – 33
Lin Q, Mendelssohn IA, Henry CB, Roberts PO, Walsh MM, et al. 1999. Effects of Bioremediation
Agents on Oil Degradation in Mineral and Sandy Salt Marsh Sediments. Environmental Technology 20: 825-37
Liu Y, Yao T, Jiao N, Kang S, Zeng Y, Huang S. 2006. Microbial community structure in moraine
lakes and glacial meltwaters, Mount Everest. FEMS Microbiology Letters 265: 98-105
100
Loffredo E, Berloco M, Casulli F, Senesi N. 2007. In vitro assessment of the inhibition of humic substances on the growth of two strains of Fusarium oxysporum. Biology and Fertility of Soils 43: 759-69
López-Archilla AI GA, Terrón MC, Amils R. 2004. Ecological study of the fungal populations of the
acidic Tinto River in southwestern Spain. Can J Microbiol 50: 923-34 Löser C, Seidel H, Hoffmann P, Zehnsdorf A. 1999. Bioavailability of hydrocarbons during microbial
remediation of a sandy soil. Applied Microbiology and Biotechnology 51: 105-11 Loveland-Curtze J, Sheridan PP, Gutshall KR, Brenchley JE. 1999. Biochemical and phylogenetic
analyses of psychrophilic isolates belonging to the Arthrobacter subgroup and description of Arthrobacter psychrolactophilus, sp. nov. Archives of Microbiology 171: 355-63
Luo P, Hu C, Zhang L, Ren C, Shen Q. 2007. Effects of DNA extraction and universal primers on
16S rRNA gene-based DGGE analysis of a bacterial community from fish farming water. Chinese Journal of Oceanology and Limnology 25: 310-6
Maltseva O, McGowan C, Fulthorpe R, Oriel P. 1996. Degradation of 2,4-dichlorophenoxyacetic
acid by haloalkaliphilic bacteria. Microbiology 142: 1115-22 Männistö MK, Häggblom MM. 2006. Characterization of psychrotolerant heterotrophic bacteria from
Finnish Lapland. Systematic and Applied Microbiology 29: 229-43 Margesin R, Schinner F. 2001. Biodegradation and bioremediation of hydrocarbons in extreme
environments. Appl Microbiol Biotechnol 56: 650-63 Margesin R, Sproer C, Schumann P, Schinner F. 2003. Pedobacter cryoconitis sp. nov., a
facultative psychrophile from alpine glacier cryoconite. Int J Syst Evol Microbiol 53: 1291-6 Margulies M, Egholm M, Altman WE, Attiya S, Bader JS, et al. 2005. Genome sequencing in
microfabricated high-density picolitre reactors. Nature 437: 376-80 Martin-Laurent F, Philippot L, Hallet S, Chaussod R, Germon JC, et al. 2001. DNA Extraction from
Soils: Old Bias for New Microbial Diversity Analysis Methods. Appl. Environ. Microbiol. 67: 2354-9
McCauley CA, White DM, Lilly MR, Nyman DM. 2002. A comparison of hydraulic conductivities,
permeabilities and infiltration rates in frozen and unfrozen soils. Cold Regions Science and Technology 34: 117-25
Mohn WW, Stewart GR. 2000. Limiting factors for hydrocarbon biodegradation at low temperature
in Arctic soils. Soil Biology and Biochemistry 32: 1161-72 Muyzer G, S. Hottentrager, A. Teske, and C. Wawer. 1996. Denaturing gradient gel electrophoresis
of PCR-amplified 16S rDNA. A new molecular approach to analyze the genetic diversity of mixed microbial communities. In A. D. L. Akkermans, J. D. van Elsas, and F. J. de Bruijn (ed.), Molecular Microbial Ecology Manual. Kluwer Academic Publishing, Dordrecht.: p. 3.4..1-3.4..22
Muyzer G, Smalla, K. 1998. Application of denaturing gradient gel electrophoresis (DGGE) and
temperature gradient gel electrophoresis (TGGE) in microbial ecology. Antonie van Leeuwenhoek 73: 127-41
Muyzer G, de Waal EC, Uitterlinden AG. 1993. Profiling of complex microbial populations by
denaturing gradient gel electrophoresis analysis of polymerase chain reaction-amplified genes coding for 16S rRNA. Appl. Environ. Microbiol. 59: 695-700
Neufeld JD, Mohn WW. 2005. Unexpectedly High Bacterial Diversity in Arctic Tundra Relative to
Boreal Forest Soils, Revealed by Serial Analysis of Ribosomal Sequence Tags. Appl. Environ. Microbiol. 71: 5710-8

101
Olah GA, Molnár Á. 2003. General Aspects. In Hydrocarbon Chemistry (Second Edition), pp. 1-29 Pace NR. 1997. A Molecular View of Microbial Diversity and the Biosphere. Science 276: 734-40 Palleroni NJ. 2005. Genus I. Pseudomonas. In Bergey's Manual of Systematic Bacteriology 2nd
edn, ed. DJK Brenner, N. R. Staley J. T. GarrityG. M. , pp. 323-79. East Lansing: Springer Perreault NN, Andersen DT, Pollard WH, Greer CW, Whyte LG. 2007. Characterization of the
Prokaryotic Diversity in Cold Saline Perennial Springs of the Canadian High Arctic. Appl. Environ. Microbiol. 73: 1532-43
Pinetreeline website: http://www.pinetreeline.org/site8.html. Ping L, Luo Y, Wu L, Qian W, Song J, Christie P. 2006. Phenanthrene adsorption by soils treated
with humic substances under different pH and temperature conditions. Environmental Geochemistry and Health 28: 189-95
Reardon CL, Cummings DE, Petzke LM, Kinsall BL, Watson DB, et al. 2004. Composition and
Diversity of Microbial Communities Recovered from Surrogate Minerals Incubated in an Acidic Uranium-Contaminated Aquifer. Appl. Environ. Microbiol. 70: 6037-46
Rhykerd RL, Weaver RW, McInnes KJ. 1995. Influence of salinity on bioremediation of oil in soil.
Environmental Pollution 90: 127-30 Rike AG, Haugen KB, Borresen M, Engene B, Kolstad P. 2003. In situ biodegradation of petroleum
hydrocarbons in frozen arctic soils. Cold Regions Science and Technology 37: 97-120 Rike AG, Haugen KB, Engene B. 2005. In situ biodegradation of hydrocarbons in arctic soil at sub-
zero temperatures-field monitoring and theoretical. Cold Regions Science and Technology 41: 189-209
Roesch LFW, Fulthorpe RR, Riva A, Casella G, Hadwin AKM, et al. 2007. Pyrosequencing
enumerates and contrasts soil microbial diversity. ISME J 1: 283-90 Röling WFM, Milner MG, Jones DM, Lee K, Daniel F, et al. 2002. Robust Hydrocarbon Degradation
and Dynamics of Bacterial Communities during Nutrient-Enhanced Oil Spill Bioremediation. Appl. Environ. Microbiol. 68: 5537-48
Saiki RK, Gelfand DH, Stoffel S, Scharf SJ, Higuchi R, et al. 1988. Primer-directed enzymatic
amplification of DNA with a thermostable DNA polymerase. Science 239: 487-91 Saitou N, Nei M. 1987. The neighbor joining method: a new method for reconstructing phylogenetic
trees. Mol Biol. Evol. 4: 406-25 Sambrook J, Russell DW. 2001. Molecular Cloning: A Laboratory Manual. 3rd Edition. Cold Spring
Harbor, New York: Cold Spring Harbor Press. Saul DJ, Aislabie JM, Brown CE, Harris L, Foght JM. 2005. Hydrocarbon contamination changes
the bacterial diversity of soil from around Scott Base, Antarctica. FEMS Microbiology Ecology 53: 141-55
Schloss PD, Handelsman J. 2005. Introducing DOTUR, a Computer Program for Defining
Operational Taxonomic Units and Estimating Species Richness. Appl. Environ. Microbiol. 71: 1501-6
Schmidt SK, Scow KM. 2001. Use of soil bioreactors and microcosms in bioremediation research.
In Manual of environmental microbiology, 2nd ed. Washington D.C.: ASM Press. Schumann R, Rentsch D. 1998. Staining particulate organic matter with DTAF--a fluorescence dye
for carbohydrates and protein: a new approach and application of a 2D image analysis system. Mar. Ecol. Progr. Ser. 163: 77-88

102
Shannon CE, Weaver W. 1949. The mathematical theory of communication. Illinois Press, Urbana, Illinois.
Simpson EH. 1949. Measurement of diversity. Nature 163: 688 Singleton DR, Furlong MA, Rathbun SL, Whitman WB. 2001. Quantitative Comparisons of 16S
rRNA Gene Sequence Libraries from Environmental Samples. Appl. Environ. Microbiol. 67: 4374-6
Sogin ML, Morrison HG, Huber JA, Welch DM, Huse SM, et al. 2006. Microbial diversity in the deep
sea and the underexplored "rare biosphere". PNAS 103: 12115-20 Spiegelman D, Whissell G, Greer CW. 2005. A survey of the methods for the characterization of
microbial consortia and communities. Can. J. Microbiol. 51: 355–86 Stach JEM, Burns RG. 2002. Enrichment versus biofilm culture: a functional and phylogenetic
comparison of polycyclic aromatic hydrocarbon-degrading microbial communities. Environmental Microbiology 4: 169-82
Stackebrandt E, Goebel BM. 1994. Taxonomic note: a place for DNA-DNA reassociation and 16S
rRNA sequence analysis in the present species definition in bacteriology. Int J Syst Bacteriol 44: 846-9
Staijen IE, Marcionelli R, Witholt B. 1999. The PalkBFGHJKL Promoter Is under Carbon Catabolite
Repression Control in Pseudomonas oleovorans but Not in Escherichia coli alk+ Recombinants. J. Bacteriol. 181: 1610-6
Stallwood B, Shears J, Williams PA, Hughes KA. 2005. Low temperature bioremediation of oil-
contaminated soil using biostimulation and bioaugmentation with a Pseudomonas sp. from maritime Antarctica. Journal of Applied Microbiology 99: 794-802
Stapleton RD, Savage DC, Sayler GS, Stacey G. 1998. Biodegradation of Aromatic Hydrocarbons
in an Extremely Acidic Environment. Appl. Environ. Microbiol. 64: 4180-4 Steven B, Briggs G, McKay CP, Pollard WH, Greer CW, Whyte LG. 2007. Characterization of the
microbial diversity in a permafrost sample from the Canadian high Arctic using culture-dependent and culture-independent methods. FEMS Microbiology Ecology 59: 513-23
Steven B, Niederberger TD, Bottos EM, Dyen MR, Whyte LG. July 2007. Development of a
Sensitive Radiorespiration Method for Detecting Microbial Activity at Subzero Temperatures. Submitted for publication in the Journal of Microbiological Methods.
Süß J, Engelen B, Cypionka H, Sass H. 2004. Quantitative analysis of bacterial communities from
Mediterranean sapropels based on cultivation-dependent methods. FEMS Microbiology Ecology 51: 109-21
Takahata Y, Kasai Y, Hoaki T, Watanabe K. 2006. Rapid intrinsic biodegradation of benzene,
toluene, and xylenes at the boundary of a gasoline-contaminated plume under natural attenuation. Applied Microbiology and Biotechnology 73: 713-22
Tarnocai C, Campbell IB. 2002. Soils of the polar regions. In Lal R (ed) Encyclopedia of soil
science, pp. 1018–21. New York: Marcel Dekker Thomassin L, Thomassin-Lacroix E, Eriksson, Eriksson M, Reimer, et al. 2002. Biostimulation and
bioaugmentation for on-site treatment of weathered diesel fuel in Arctic soil. Applied Microbiology and Biotechnology 59: 551-6
Thompson IP, van der Gast CJ, Ciric L, Singer AC. 2005. Bioaugmentation for bioremediation: the
challenge of strain selection. Environmental Microbiology 7: 909-15 Torrance JK, Schellekens FJ. 2006. Chemical factors in soil freezing and frost heave. Polar Record
42: 33-42

103
Torsvik V, Goksoyr J, Daae FL. 1990. High diversity in DNA of soil bacteria. Appl. Environ.
Microbiol. 56: 782-7 Trindade PVO, Sobral LG, Rizzo ACL, Leite SGF, Soriano AU. 2005. Bioremediation of a
weathered and a recently oil-contaminated soils from Brazil: a comparison study. Chemosphere 58: 515-22
Uyttebroek M, Vermeir S, Wattiau P, Ryngaert A, Springael D. 2007. Characterization of Cultures
Enriched from Acidic Polycyclic Aromatic Hydrocarbon-Contaminated Soil for Growth on Pyrene at Low pH. Appl. Environ. Microbiol. 73: 3159-64
van Beilen J, Li Z, Duetz W, Smits T, Witholt B. 2003. Diversity of alkane hydroxylase systems in
the environment. Oil & Gas Science and Technol. 58: 427-40 van Beilen J, Wubbolts M, Witholt B. 1994. Genetics of alkane oxidation by Pseudomonas
oleovorans. Biodegradation 5: 161-74. van Beilen JB, Panke S, Lucchini S, Franchini AG, Rothlisberger M, Witholt B. 2001. Analysis of
Pseudomonas putida alkane-degradation gene clusters and flanking insertion sequences: evolution and regulation of the alk genes. Microbiology 147: 1621-30
Van Hamme JD, Singh A, Ward OP. 2003. Recent Advances in Petroleum Microbiology. Microbiol.
Mol. Biol. Rev. 67: 503-49 Viñas M, Sabate J, Espuny MJ, Solanas AM. 2005. Bacterial Community Dynamics and Polycyclic
Aromatic Hydrocarbon Degradation during Bioremediation of Heavily Creosote-Contaminated Soil. Appl. Environ. Microbiol. 71: 7008-18
Walworth J, Braddock JF, Woolard C. 2001. Nutrient and temperature interactions in
bioremediation of cryic soils. Cold Regions Science and Technology 32: 85-91 Weissenfels WD, Klewer H-J, Langhoff J. 1992. Adsorption of polycyclic aromatic hydrocarbons
(PAHs) by soil particles: influence on biodegradability and biotoxicity. Applied Microbiology and Biotechnology 36: 689-96
White JC, Qui, ones-Rivera A, Alexander M. 1998. Effect of Wetting and Drying on the
Bioavailability of Organic Compounds Sequestered in Soil. Environmental Toxicology and Chemistry 17: 2378-82
Whyte LG, Bourbonniere L, Bellerose C, Greer CW. 1999. Bioremediation Assessment of
Hydrocarbon-Contaminated Soils from the High Arctic. Bioremediation Journal 3: 69 – 80 Whyte LG, Bourbonniere L, Greer CW. 1997. Biodegradation of petroleum hydrocarbons by
psychrotrophic Pseudomonas strains possessing both alkane (alk) and naphthalene (nah) catabolic pathways. Appl. Environ. Microbiol. 63: 3719-23
Whyte LG, Goalen B, Hawari J, Labbe D, Greer CW, Nahir M. 2001. Bioremediation treatability
assessment of hydrocarbon-contaminated soils from Eureka, Nunavut. Cold Regions Science and Technology 32: 121-32
Whyte LG, Greer CW. 2005. Molecular Techniques for Monitoring and Assessing Soil
Bioremediation. In Soil Biology, ed. R Margesin, F Schinner. Berlin Heidelberg: Springer-Verlag.
Whyte LG, Greer CW, Inniss WE. 1996. Assessment of the biodegradation potential of
psychrotrophic microorganisms. Can J Microbiol 42: 99-106 Whyte LG, Hawari J, Zhou E, Bourbonniere L, Inniss WE, Greer CW. 1998. Biodegradation of
Variable-Chain-Length Alkanes at Low Temperatures by a Psychrotrophic Rhodococcus sp. Appl. Environ. Microbiol. 64: 2578-84

104
Whyte LG, Slagman SJ, Pietrantonio F, Bourbonniere L, Koval SF, et al. 1999. Physiological Adaptations Involved in Alkane Assimilation at a Low Temperature by Rhodococcus sp. Strain Q15. Appl. Environ. Microbiol. 65: 2961-8
Whyte LG, Smits THM, Labbe D, Witholt B, Greer CW, van Beilen JB. 2002. Gene Cloning and
Characterization of Multiple Alkane Hydroxylase Systems in Rhodococcus Strains Q15 and NRRL B-16531. Appl. Environ. Microbiol. 68: 5933-42
Widada J, Nojiri H, Kasuga K, Yoshida T, Habe H, Omori T. 2002. Molecular detection and diversity
of polycyclic aromatic hydrocarbon-degrading bacteria isolated from geographically diverse sites. Applied Microbiology and Biotechnology 58: 202-9
Widdel F, Rabus R. 2001. Anaerobic biodegradation of saturated and aromatic hydrocarbons.
Current Opinion in Biotechnology 12: 259-76 Woese CR. 1987. Bacterial evolution. Microbiol. Rev. 51: 221-71 Woese CR, Fox GE. 1977. Phylogenetic structure of the prokaryotic domain: the primary kingdoms.
Proc Natl Acad Sci 74: 5088–90 Woese CR, Kandler O, Wheelis ML. 1990. Towards a Natural System of Organisms: Proposal for
the Domains Archaea, Bacteria, and Eucarya. PNAS 87: 4576-9 Yergeau E, Newsham KK, Pearce DA, Kowalchuk GA. Patterns of bacterial diversity across a
range of Antarctic terrestrial habitats. Environmental Microbiology (OnlineEarly Articles). doi:10.1111/j.1462-2920.2007.01379.x
Zakhia F, Jeder H, Willems A, Gillis M, Dreyfus B, de Lajudie P. 2006. Diverse Bacteria Associated
with Root Nodules of Spontaneous Legumes in Tunisia and First Report for nifH-like Gene within the Genera Microbacterium and Starkeya. Microbial Ecology 51: 375-93
Zengler K, Toledo G, Rappé M, Elkins J, Mathur EJ, et al. 2002. Cultivating the uncultured. PNAS
99: 15681-6 Zhao J-S, Manno D, Hawari J. 2007. Abundance and diversity of octahydro-1,3,5,7-tetranitro-
1,3,5,7-tetrazocine (HMX)-metabolizing bacteria in UXO-contaminated marine sediments. FEMS Microbiology Ecology 59: 706-17
Zucchi M, Angiolini L, Borin S, Brusetti L, Dietrich N, et al. 2003. Response of bacterial community
during bioremediation of an oil-polluted soil. Journal of Applied Microbiology 94: 248-57

105
Appendix
A1. Basic Safety Course Certificate
(on following page)