Embed Size (px)
Citation preview

Cultural Geography
Fundamentals of the Human MosaicTerry Jordan, et. al,
Chapter 3(Move to next slide.)

Prep: Preset the Population Video
Population Video name:
Backup population video link:
Pre-set any handouts.

Ch. 3: Population…Prep. Display or write on board or overhead:
Write:
1.Add codes (after class) OR No add codes.
2.Paper 1due date
3.Concepts: (Did you read the text? I test these concepts.)• CBR: (ask)• CDR: (ask)• NIR: (ask)• TFR: (ask)• Population Pyramids: growth, costs, workers, dependents• Children: benefit or cost? (Traditional vs. Popular Culture)• Demographic transition and Epidemiological stages• Malthusianism, Neomalthusianism, criticisms
Get population video, Population Connection, “World Population” (online) http://www.alsagerschool.co.uk/subjects/sub_content/geography/Gpop/HTMLENH/media/video.htm
Write on other board: info on slide 3
Advance slide.

Prep: Review, or Write on board or Overhead:
Review:
1) Questions?
2) You should have scanned Chapter 2• (10 minutes)
3) After Class: Review your notes: • (10 minutes)
4) Tonight: Review my notes:• (10 minutes)
5) read chapter 2 to reinforce key details.
6) Move from passive to active learning, proactive learning.• It is your life. Take charge!• Attach personal interest, look for relevance, value.

Cultural Geography
Fundamentals of the Human Mosaic
Terry Jordan, et. al,
Chapter 3

World Population
Patterns: • A climate influence is observable (rainy vs. desert, hot vs. cold).• River valleys, coastlines, & historical cores have more people.
Image: World map of population distribution Source URL: http://media.maps.com/magellan/images/k3worldpop.gif

Key point: Birth rates are large in LDCs (less developed countries)
World map of live births per 1000 people per year
Source URL: http://www.globalgeografia.com/world/birth_rate.gif
Birth Rates

Death Rates
Key points: • High death rates are found in LDCs.
• (Also in MDCs with aging populations and low birth rates)• High death rates are found MDCs with aging populations
• (MDC = More Developed Country)
World map of deaths per 1000 people per year Source URL: http://www.globalgeografia.com/world/death_rate.gif

Key point: High death rates in LDCs often lead to high birth rates.
Birth rate map (http://www.globalgeografia.com/world/birth_rate.gif)
Death Rate map (http://www.globalgeografia.com/world/death_rate.gif)
Countries with aging populations also have higher death rates (and costs).

Children: Asset vs. Cost(This is not the only cause, but it is a big one.)
• Agriculture: child labor is an asset.• Feed them• Low /no education costs• Low medical care (causes what?)
• Industrial: large costs associated with• Support: food clothes, toys, activities, &• education, • medicine, • More education: college $$$
(Question: Does this help you make sense of the world population distribution, including birth and death rates?)

Annual Population Growth Rates
Key points: • Low MDC growth, high LDC growth, Transitional in between.• Population growth is a response to risks, and it drives migration.
Map of annual population growth ratesSource URL: http://images.encarta.msn.com/xrefmedia/aencmed/targets/maps/map/T620076A.gif

Population Growth Projection • Very hard to estimate.• Why does population
increase with medium fertility?
• Replacement >2.0, varies with death rates
• Are medium and low fertility projections likely?
• Why / Why not?
Estimates reflect changing norms, economics, and social pressures. Children entering reproductive age drive growth even when NIR < replacement
Image: Graph of projected global population over time using different fertility estimatesSource URL: http://www.prb.org/images/e-05(future_world).gif

Prediction is difficult.
Many variables can (and do) change a lot over time • Famine• War• Disease• Available contraception• Available safe abortion• Societal norms• Employment • Education• Education• (What? Educate? Educate who?)

Fertility Rate and Female Literacy
Key point: There is a strong inverse correlation between education and fertility. (More education contributes to fewer children)
Image: figure showing fertility rates and literacy rates for selected LDCs and transitional countries
Source URL: http://www.aag.org/Education/center/cgge-aag%20site/Population/images/lesson3_pg2_fig1.jpg

Correlation vs. Causality• Multiple contributions:
• Culture (ethnicity, religion, norms, etc.)• Education (women, men, children, college, etc.)• Stability (economic, political, etc.)• Job future (economy, access to jobs)• Structural change (cultural, economic, political)• Job migration to developing countries• Medicine (health care, contraceptives, abortion access)
• Education is one among many tools. • Also, remember that correlation does not prove causality.

Where is Burkina Fasso?
Key point: countries are more interesting if you know where they are and what that means for its citizens and neighboring countries.
Example: Burkina Fasso is landlocked, in the Sahel, and peripheral to African economic cores.
Image: map of Burkina Fasso and surrounding countriesSource URL: http://www.una-uk.org/archive/environment/burkina.html
• This map and the map of Africa (later) remind you of the map-ID in the test.

What does this mean to us?
• It is in the Sahel (What is that?)• Food insecurity is extreme• In a good year, they can barely support themselves.• The society is agrarian, with some migration to work.• How does this tie to core-periphery? (Ch.1)
• Physical, economic, and social influences on reproduction.• How does this tie to migration?

Want more help or info?
• Practice with an interactive learning map for country names (a good way to learn).
• Interactive Africa map: http://www.nd.edu/~pkollman/africa/Maps/africa_map_full2.html
• Info reference: the CIA World Factbook: http://www.cia.gov/cia/publications/factbook/geos/uv.html
Image: Interactive map of Africa Source URL: http://www.indiana.edu/~origins/images/africa.jpg

Population Pyramid
Foci:
• Working population
• Child-bearing
• Young dependents
• Old dependents
Key points:• The labor force supports old and young dependents.• Approximately 2/3 of the female labor force is fertile.• Children contribute to society if they do not die.
Image: population pyramid with labels for labor force, old, and young dependentsSource URL: http://www.sasked.gov.sk.ca/docs/actss20/images/pg2-54.gif

Key points: • This is a classical LDC population pyramid, with an exponential shape, • The population is mostly young, so a large population growth is possible• (Notice that ~1/5 to 1/6 of each cadre is dead 4 years later!)• There is also a large dependency ratio (keywords… learn their meanings.)
Source URL: http://www.hewett.norfolk.sch.uk/curric/NEWGEOG/Africa/Eth_py~1.gifMore info on Ethiopia: http://www.cia.gov/cia/publications/factbook/geos/et.html
Ethiopian Population
Pyramid, (1995)

Sweden
Key points: • Developed country, not affected by WW II• Slightly below replacement (Total fertility rate <~2.1)
• Demographic stage 5.
Image: population pyramid of Sweden, using US Census Bureau data
Source URL: http://www.rsg-sneek.nl/files/h2a/simonette%20de%20kruijff/verslag%20ak_bestanden/image011.gif

USA, 1997
Key points:• Baby Boomers• Becoming more vertical, (like Sweden)• higher older population distribution expected• Food, sanitation, and health care reduces the death rate.• (Almost at replacement rate.)
Image Description: Population pyramid using US Census Bureau dataSource URL: http://alliance.la.asu.edu/azga/lesson_file/atrid/19USA1987.gif

Russia
Key Points:• Wars, pogroms, & Soviet policies decimated older populations.• Economic downturn and uncertainty seriously reduces fertility.
Image: 1999 population pyramid of RussiaSource URL: http://www.rand.org/pubs/research_briefs/RB5054/RB5054.fig.4.jpgSource Document: Rand Corporation: “Dire Demographic Trends Cast a Shadow on Russia's Future” Report URL: http://www.rand.org/pubs/research_briefs/RB5054/index1.html
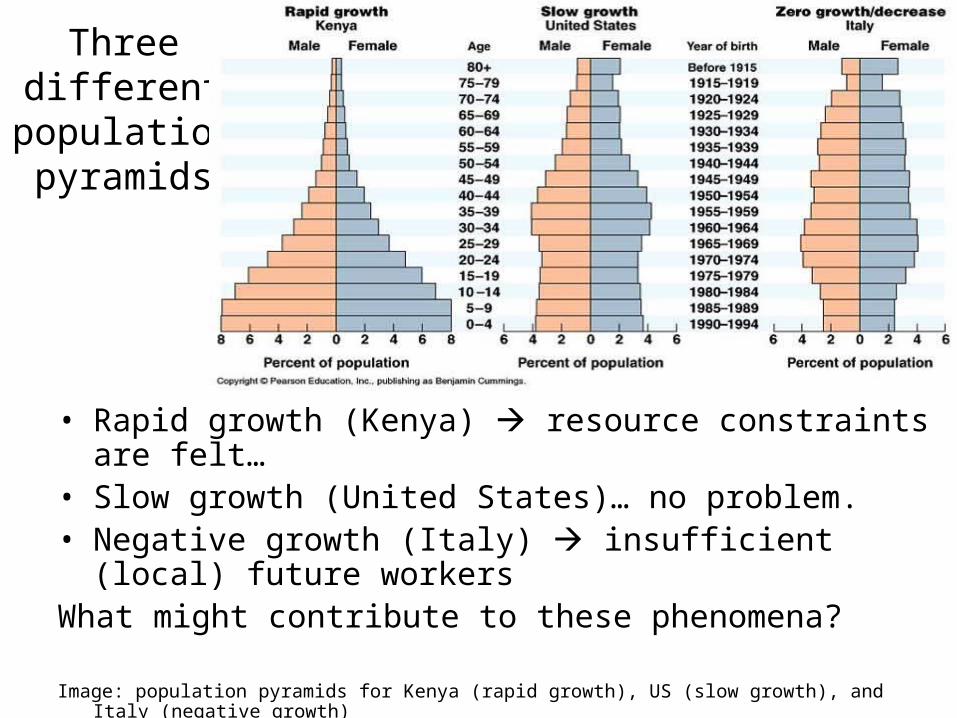
Three different
population pyramids
• Rapid growth (Kenya) resource constraints are felt…• Slow growth (United States)… no problem.• Negative growth (Italy) insufficient (local) future workersWhat might contribute to these phenomena?
Image: population pyramids for Kenya (rapid growth), US (slow growth), and Italy (negative growth)Source Pearson Education Inc. (see copyright) URL: Pending.

• High death rates drop first, then high birth rates drop.• Later, both become low. (Response is delayed generations.)• The area between the two is population growth.Image: Demographic transition curve. Source URL: http://www.globalchange.umich.edu/globalchange2/current/lectures/human_pop/
demotran.gif
The Demographic Transition

Population and consumption pressures: How do population and consumption combine?
• First, answer the question: Who Cares?• (Where is it a problem?)
• Then, answer the question: Why?
Basic inquiry rubric: When you see an activity, you can ask…1. What is it?2. Who cares?3. Why do they care?4. Can we estimate the effects?
1.Later…5. Are there solutions?6. What are the consequences of the

(Another population growth estimate chart)
Key points: • MDC populations are stable flat or declining. • LDC populations are experiencing exponential growth• LDC population growth will hopefully taper off.
Image: World Population Growth Estimates: 1750 to 2050Source URL: http://www.uwsp.edu/business/economicswisconsin/e_lecture/pop_images/pop_growth.jpg

Malthusianism: • Population growth is exponential, food supply grows linearly.• Without social constraints, we will run out of food.• Starvation and disease curb population growth.
• Neo-malthusianism
• Neo (new) malthusianism• Neomalthusianism= Malthusianism + health care + resource exploitation
– Health care increases the population growth rate.– You will also run out of other crucial resources.
• Some countries have both Malthusian and Neo-malthusian components.• Others have both major Neo-malthusian components.

Population and Consumption
• Industrial Nations (First world)• 20% of population• 80% of consumption
• All others• 80% of population• 20% of consumption
Given these rough estimates…

Calculate relative resource use.
20% of population (in MDCs) use 80% of resources.• 0.2 * R1 = 0.8• R1 = 0.8 / 0.2 = 4
(We use about 4 times the average.)
80% of population (in LDCs) use 20% of resources.• 0.8 * R2 = 0.2• R2 = 0.2 / 0.8 = 0.25
(LDCs use about ¼ of the average.)

What if the world consumed like us?
Today’s total consumption:• MDC consumption + LDC consumption = today’s use.• 80% + 20% = 100%• MDC pop. * MDC per cap use + • 20% * 4 times average + 80% * ¼ times average = 100%
Fully industrialized total consumption: • 100% * 4 = 400% (!)
• China is becoming a major consumer, and India is following.• What if LDC population doubles? (Food vs. resource consumption)

Is this supportable?
• We would run out of oil approx. 4 times as fast.• We would have 4 * the demand for raw materials.• We would have 4 * the demand for steel and other industrial
products.• The third world would in theory eat a similar calorie and meat
diet in this scenario.
• They also would adopt our approach wholesale.
Is this estimate realistic?
• The diet may be less due to cost. (Good up to a point)• The population is still going up, so the % increase must be
considered.• New technologies are important to reducing consumption.
• This president might have a positive impact.• (The US Government has been in denial for 8 yrs.)
• Recycling and reuse, combined with better technological choices using present knowledge would go far.

Malthusian and Neo-Malthusian Perspectives:
Historical• LDCs: Malthusian (population growth)• MDCs: Neo-Malthusian (resource demands)• Transitional Countries: Neo-Malthusian (population growth + resources)
• The “fix” for Malthusianism is Neo-Malthusian as presently practiced.• Some say technology and human change can overcome this.• Present starvation is structural. We have enough food, in other places.• Stimulate the economy, and more food will be grown… (Sometimes not.)
• Tragedy of the commons: overfishing, overgrazing• global warming effects (land and ocean)• Local subsistence vs. profit motive
• NOW, many of BOTH are neo-malthusian (health care)

• Overpopulation in LDCs• Overconsumption in MDCs• Both in transitional countries.
Image: World natural increase rate (population growth rate) Source URL: ttp://images.encarta.msn.com/xrefmedia/aencmed/targets/maps/map/T620076A.gif
(Goal: reinforce the concept presented in the previous slide.)
Population and Consumption

One conversation going quite badly…
(Look at it from one among many traditional views. Imagine they are yours.)• “You want to educate our women? They stay home. Why do you want
this?”• (Strike 1. Try something different… birth control methods)
• “You are telling us what to do in bed?!!”• (All kinds of cultural taboos!)• (Strike 2. Try offering them security.)
• “Oh, you are going to take care of all our problems, food insecurity, job insecurity, diseases, droughts, floods, and wars. Just like last time…(““Colonial, post-colonial, cold war...)• (Strike 3, you’re out!)
• Go away. Wait… give us what we want, and then go away.• (They may really not trust us based on past painful experience.)• ((Don’t tell others what they must do to satisfy your concerns…))• (((You have no leverage, and are not working on their problems.)))
• Others have different perspectives, and these should be respected.

Glass houses and throwing stones….
Work the problems that affect you where you are.• Traditional societies are transitioning into popular cultures,
and this leads to increased consumption. • We are a model of consumption that is not supportable
without change.• Rather than telling others to curb population while we are
over-consuming, we can locally develop better consumption practices. (Get your own house in order first.)
If you are working in other regions, work on locally acceptable solutions that minimize negative consequences and make sense in local context. (More on this in later chapters.)

What do you think?
•
•
•
•
•
•
•
•

What does the world think? (Which world?)
• IPCC reference URL: http://www.ipcc.ch/• Intergovernmental Panel on Climate Change• US has so far rejected the Kyoto Protocol
• Protocol• We continue increasing GHG emission rates.• Much of the world will see less incentive…
• Now, they are working on the next phase…• And it is just as difficult, if not more so.
• LDCs don’t want limits on development.• We did it before, we do it now, so… why can’t they?

A matter of risk…
• Calculated risk? Belief? Part both?• Discounting future costs
• (common economic activity, risk)• Assuming they are right, what do they get?• If wrong, what happens next?• (Causes and effects: Chapter 9-12)

Epidemiological Stages explain death rate changes.• Stage 1: Disease, Pandemics, (Malthusian checks on population growth)• Stage 2: Receding Pandemics: Health care, sanitation (Neomalthusian)• Stage 3: Infectious disease control, further population growth.
• Longevity leads to increased diseases of aging (degenerative diseases).
• Stage 4: Delayed degenerative diseases (diseases of aging) Also, better diet and exercise, less smoking, alcohol.
• Stage 5: Resurgence of pandemics: (Link: Globalization of travel & trade)
Image: Demographic transition curve. (Previously presented) Epidemiological stages 1-4 are tied to the death rate changes.Source URL: http://www.globalchange.umich.edu/globalchange2/current/lectures/human_pop/demotran.gif

Demographic Transition: Growth
(The model helps us understand growth)
Stage 1: Low Growth: high birth and death rates
Stage 2 & 3: High Growth: high birth rate, low death rate
Stage 4: Low Growth: low birth low death rate• Demographic stages 2 and 3 are migration sources.

Population Stages and Development
• The demographic transition assumes an economic transition from traditional agrarian to popular consumer societies.
• What happens if this does not happen?• You stall in demographic stage 2 or 3.• Overpopulation occurs.• Migrate or suffer (or both.)

Review the short film clip• Perspective:• Level of detail:
• Is migration accounted for?• Target Audience:
• Target message• Take-home messages:
• This is one part of the problem.• Add cultural variation, in its varied dimensions.

Questions?
Comments?

On Definitions:First, I showed you that definitions are considered
important.Then, I simplified some, keeping core parts of the
definitions. (shorter words, same meaning)
Then I broke long definitions into cause and effect. (I was showing you ways to think about them.)Specific cultural aspects have consequences.
Now, you have to remember to learn them.I use almost all key definitions in discussion.You don’t need for me to write them down anymore.
You didn’t need this in the first place… It was a good reminder though.

Demographic Regions
Formal regions compare issues of life death, quality of life.Population Density,
Births: Crude Birth rate
Deaths: Crude Death Rate
Growth: Natural Increase Rate
Births per woman: Total Fertility Rate
Change: Demographic Transition

Demographic Regions
Other Measures (Ex: detailed census)
Sex Ratio
Infant Mortality Rate
Standards of Living
Demographic Pyramids

Demographic Diffusion
MigrationPush-Pull Factors (3 push, ~ 3 pull)
Refugees

Population Ecology
Environmental InfluenceDiseases
Environmental support of disease vectors
Populations altering the environmentPopulations
Activities

Cultural Interaction
Ethnic biases“Good” / ”bad” workers
Economic pressuresWant workers vs. job competition
Religion and populationRestrictions on abortion
State controls on populationSanctions against large families
State funded, or forced sterilizations, abortions

Settlement Landscapes
Population density + land use + preferenceTown shapes
Irregular: (organic)Town: Buy land, add house, add road
connection.
Country: farm, add new (e.g. related) families close in.
Linear: (either organic or planned)Parcels are square, put housing is on the parcel.
Long-lot: benefit of road, farming behind house
Grid: (structured, planning)Farming: dispersed, farm on farmland
Housing: denser
Central Commons: (either organic or planned)Serves common good, (markets, religious, civic)

Housing vs. Agriculture
We often choose one over the other.
Traditionally: good agricultural land agriculture
Hilly dry uplands housingExamples
Modern:Build housing where it is convenient.
Agricultural land housingExamples

Urban Systems: Old and New
Older: (both popular and traditional)More traditional transportation systems
More traditional land use norms
More traditional housing styles
Newer:Different cultures?
Newer transportation modes, new networks
Renovation, razing: higher (or lower) density
Population growth vs. increasing affluence
Urban renewal,
sometimes with different institutions.

Land Use Impacts: Population * Activity
Two factors: population and activity.Larger populations have larger effects.
What we do matters in aggregate.
Technological advances make change easier.
Now, we should be more selective.High population regions
Advanced technologies
Unintended consequences
Short and long term effects
Direct and indirect effectsIncluding a large and varied waste stream

Summary:Populations change among societies over time.
Population changes often lead to migration.
Increased and immigrant populations change the cultural situation and interactions.
Increased populations affect the environment
These populations and their activities affect the landscapes they live within.
Change = ∫∫effects(population, activity) d(time), d(area)


![URBAN MORPHOLOGY some (very general) geometrical regularities [graphics from The Human Mosaic by Terry Jordan-Bychkov and Mona Domosh]](https://img.dokumen.tips/doc/110x75/56649dbb5503460f94aacaf0/urban-morphology-some-very-general-geometrical-regularities-graphics-from.jpg)