Embed Size (px)
Citation preview

ORIGINAL RESEARCH ARTICLEpublished: 07 November 2011doi: 10.3389/fpsyg.2011.00313
Cultural differences in affect intensity perception in thecontext of advertisingMarianna Pogosyan1 and Jan B. Engelmann2,3*
1 Division of Public Administration, International Christian University, Tokyo, Japan2 Laboratory for Social and Neural Systems Research, University of Zurich, Zurich, Switzerland3 Department of Economics, University of Zurich, Zurich, Switzerland
Edited by:
Debi Roberson , University of Essex,UK
Reviewed by:
Ljubica Damjanovic, University ofChester, UKTakeshi Hamamura, ChineseUniverisity of Hong Kong, Hong Kong
*Correspondence:
Jan B. Engelmann, Department ofEconomics and Social NeuralSystems Laboratory, University ofZurich, CH-8006 Zurich, Switzerland.e-mail: [email protected]
Cultural differences in the perception of positive affect intensity within an advertising con-text were investigated among American, Japanese, and Russian participants. Participantswere asked to rate the intensity of facial expressions of positive emotions, which displayedeither subtle, low intensity, or salient, high intensity expressions of positive affect. In agree-ment with previous findings from cross-cultural psychological research, current resultsdemonstrate both cross-cultural agreement and differences in the perception of positiveaffect intensity across the three cultures. Specifically, American participants perceived higharousal (HA) images as significantly less calm than participants from the other two cultures,while the Japanese participants perceived low arousal (LA) images as significantly moreexcited than participants from the other cultures. The underlying mechanisms of thesecultural differences were further investigated through difference scores that probed forcultural differences in perception and categorization of positive emotions. Findings indi-cate that rating differences are due to (1) perceptual differences in the extent to whichHA images were discriminated from LA images, and (2) categorization differences in theextent to which facial expressions were grouped into affect intensity categories. Specifi-cally, American participants revealed significantly higher perceptual differentiation betweenarousal levels of facial expressions in high and intermediate intensity categories. Japaneseparticipants, on the other hand, did not discriminate between high and low arousal affectcategories to the same extent as did the American and Russian participants.These findingsindicate the presence of cultural differences in underlying decoding mechanisms of facialexpressions of positive affect intensity. Implications of these results for global advertisingare discussed.
Keywords: cross-cultural differences, emotion perception, affect intensity, positive affect, Japan, USA, Russia
INTRODUCTIONBeginning from Darwinian assertions about the biological basisof emotions, the past century has witnessed a wealth of psycho-logical research revealing universal tendencies in the mechanismof production and expression of emotions (e.g., Ekman et al.,1972; LeDoux, 1987; Buck, 1988; Grammer and Eibl-Eibesfeldt,1993). Classical studies of emotion perception from the 1960and 1970s known as the universality studies, have consistentlydocumented universality of recognition of various emotionalexpressions including happiness, anger, disgust, fear, sadness, andsurprise (e.g., Ekman and Friesen, 1969; Izard, 1971; Ekman et al.,1972). Subsequently, extensive research has revealed universality inthe recognition of facial expressions among judges from a varietyof cultural backgrounds, including American and Japanese judges(e.g., Matsumoto and Ekman, 1989; Matsumoto, 1990, 1992; Mat-sumoto et al., 1999) Hong Kong Chinese (e.g., Chan, 1985; Leungand Singh, 1998); Estonians, Germans, Greeks, Italians, Scottish,Sumatrans, Turks (e.g., Ekman et al., 1987), Indians (e.g., Man-dal et al., 1986), and Australians (e.g., Toner and Gates, 1985;for a review, see Matsumoto, 2001). Furthermore, a number ofstudies have drawn attention to the possibility of adding contempt
(e.g., Ekman and Heider, 1988) and embarrassment (e.g., Haidtand Keltner, 1999) to the list of universally recognizable facialexpressions. Taken together, these findings provide evidence forthe existence of universal processes in emotion recognition acrosscultures.
Recently,however,much attention has been given to the culturalcontexts surrounding emotions and the possibility of a culture-dependency of certain aspects of the affective mechanism (Russell,1991). For instance, Matsumoto (1992) found that while Amer-ican and Japanese judges showed cross-cultural convergence inthe recognition of happiness and surprise, American judges werebetter at recognizing anger, disgust, fear, and sadness than theirJapanese counterparts (see also Izard, 1971; Ekman et al., 1987;Matsumoto and Ekman, 1989). Furthermore, cross-cultural dif-ferences have also been reported in intensity ratings of emotionsand their facial expressions (e.g., Ekman et al., 1987; Matsumoto,1990; Biehl et al., 1997; Yrizarry et al., 1998; Matsumoto et al.,2002). Specifically, Japanese judges have repeatedly been found torate facial expressions of various emotions, including happiness,sadness, and surprise, less intensely compared to American judges(e.g., Ekman et al., 1987; Matsumoto and Ekman, 1989; Biehl et al.,
www.frontiersin.org November 2011 | Volume 2 | Article 313 | 1

Pogosyan and Engelmann Cultural differences in affect intensity perception
1997). Interestingly, these differences in intensity ratings persistedregardless of (a) culture or gender of the face judged, (b) emotionjudged, and (c) whether intensity was judged on a particular emo-tion or an affect-neutral intensity scale (Matsumoto and Ekman,1989).
Such cross-cultural variability of emotion perception has beenattributed to culturally imposed emotion display rules (Ekmanand Friesen, 1969; Buck, 1988; Matsumoto et al., 2002). Displayrules are learned naturally during childhood through socializa-tion and subsequently determine the appropriateness of emotionalbehavior in various settings within given cultural contexts (Safdaret al., 2009). Prior research has demonstrated that the expressionof feelings is encouraged in Western cultures, which typically scorehigh on individualistic values, while in Asian cultures that are onaverage more collectivistic, the control of emotion is encouraged tomaintain group harmony (e.g., Markus and Kitayama, 1991; Heineet al., 1999). Accordingly, the Japanese are tuned to avoid express-ing intense emotions, since such emotions may pose a threat togroup harmony and conformity (Matsumoto, 1992). Similarly,Russian nationals have been shown to engage in greater levelsof affect expression control relative to South Koreans, Japanese,and Americans (Matsumoto et al., 1998). This result is qualifiedby high levels of affect control toward in-group members, such asfamily, friends, and colleagues, and relatively low levels of controltoward out-group members (Matsumoto et al., 1998), underlin-ing Russia’s generally collectivistic attitudes. On the other hand, inindividualistic cultural contexts, such as that of the United States,the suppression of emotions is viewed negatively (e.g., Markus andKitayama, 1991; Heine et al., 1999) and the expression of not onlypositive but also negative emotions is encouraged (Matsumoto,1992). Recent results have confirmed this initial finding by demon-strating significantly lower levels of self-reported affect controlamong Americans, compared to Russian and Japanese nationals(Matsumoto et al., 1998, 2005) and higher levels of expressivity ofaffect (Matsumoto et al., 2005).
Cultural display rules can have a significant impact on affectperception, as demonstrated in two recent studies (Yuki et al.,2007; Damjanovic et al., 2010). In their study, Yuki et al. (2007)tested the hypothesis that, when interpreting emotions of oth-ers, people from cultures with display rules requiring high levelsof affect control focus more on areas of the face that are relativelydifficult to control and thereby carry more information about trueemotional states, such as the eyes, while people from cultures withless strict display rules focus on the mouth. Using cartoons andactual faces in which eye and mouth regions were independentlymanipulated, the authors showed that for conflicting stimuli (e.g.,sad eyes together with happy mouth) Japanese participants gavemore weight to the eyes, while American participants gave moreweight to the mouth. These results provide strong evidence for thenotion that cultural display rules can have a significant impact onthe types of facial cues employed to interpret emotion. Furthersupport for this notion is provided by more recent results fromDamjanovic et al. (2010). Employing an affective visual searchtask with same and other race targets, the authors showed a facil-itatory effect of the previously established happiness advantage(e.g., Calvo and Nummenmaa, 2008) when the visual search dis-play consisted of other race targets. This result is in agreement
with two prior findings on affective visual search, namely (1) thatother race targets are processed featurally (Levin, 2000) while samerace faces are processed holistically (e.g., Michel et al., 2006), and(2) that featural processing strategies facilitate the detection ofhappy facial expressions (Calvo and Nummenmaa, 2008). There-fore, results from Damjanovic et al. (2010) are consistent with theview that detection of discordant happy targets is improved in thecontext of other race faces via emphasizing feature-based searchstrategies. While this effect was obtained for English participantsunder various conditions, for Japanese participants such facilita-tory effects only occurred during task instructions that specificallyencouraged perceptual based strategies. The authors argue thatJapanese participants did not show a happy face advantage forother race targets under conditions that emphasize emotion detec-tion, while English participants did, due to differences in culturaldisplay rules. Specifically, a perceptually salient smile that is incon-gruent with Japanese display rules can lead to interference duringthe detection of affect, as it might not match the prototype emotionduring visual search (e.g., Roberson et al., 2007). Taken together,these results support the notion that cultural display rules can havesignificant modulatory effects on affect perception by modifyingfeatural salience (Yuki et al., 2007), as well as perceptual processingstrategies (Damjanovic et al., 2010).
To date, relatively little research has been conducted on culturaldifferences in affect intensity perception (see however Matsumotoand Ekman, 1989; Matsumoto, 1993; Yrizarry et al., 1998; Mat-sumoto et al., 1999, 2002). The present study aimed at extendingexisting findings on cross-cultural differences in affect inten-sity perception by addressing various shortcomings of previousresearch. Specifically, we investigated perception of emotion inten-sity across cultures within a particular context. The significance ofcontext in the study of emotion has been emphasized in a series ofrecent studies that have revealed the modulatory effects that socialand situational context has on emotion perception across differentcultures (e.g., Masuda et al., 2008). The differences in contextualinfluences on the interpretations of emotions among Asians andAmericans (e.g., Masuda et al., 2008; Ko et al., 2011) have beenattributed to “analytic” versus “holistic” patterns of attention dis-tribution among Western Europeans and East Asians (Nisbett et al.,2001). As such, Japanese and Korean participants have been shownto be influenced to a larger degree by contextual information wheninterpreting emotions compared to their North American peers.
Previous studies investigating affect intensity perception haveasked participants to rate affect intensity within a contextual vac-uum. In a typical setting of affect intensity rating studies, full-face,high intensity prototypical expressions are presented as stimuli,which participants are asked to judge categorically, as well as onintensity levels (Matsumoto, 2001; Matsumoto et al., 2002). Twoimportant shortcomings of this standard approach come to mind:(1) the lack of interpretative context removes such experimen-tal settings from real life situations, and (2) in everyday contexts,full-face and high intensity prototypical expressions such as thoseemployed in prior experiments rarely occur and are thus morelikely to reflect a controlled and weighted version of the portrayedemotions (e.g., Matsumoto et al., 2002). These shortcomings wereaddressed in the present study by employing stimuli with bothhigh and low intensity expressions of affect and embedding the
Frontiers in Psychology | Cultural Psychology November 2011 | Volume 2 | Article 313 | 2

Pogosyan and Engelmann Cultural differences in affect intensity perception
stimuli used in the present experiment in a situational context ofadvertising, thereby increasing the ecological validity of the study.
Advertising was chosen as the contextual platform for the inves-tigation of affect intensity perception across cultures for a num-ber of reasons. Firstly, print advertisements presented a settingthat is ubiquitous within all three cultures included in the cur-rent study, thus providing a more naturalistic setting for judgingfacial expressions. Secondly, the ads featured professional modelswith significant practice in controlling facial expressions, whichmade the portrayed emotions seem more genuine and disposedof the artificiality that may occur with unpracticed posers. Finally,since standardization of print advertising has become an increas-ingly attractive option in international marketing due to financialand executive advantages, an in-depth examination of consumers’interpretation of affective messages used in ads could lend insightinto the cross-cultural effectiveness of standardized ad campaigns.
The present study furthermore offers a different approach frompast research of emotion perception by investigating cross-culturaldifferences in the perception of positive affect only, instead ofexamining the perception of multiple emotions of varying valence.By doing so, a more focused investigation of facial expressionsof positive affect allowed us to include a wider range of emo-tion adjectives as response alternatives (Yrizarry et al., 1998). Thisapproach yielded finer grained intensity ratings compared to pre-vious studies that use simple categorical judgments, while at thesame time avoiding the pitfalls of open-ended response formats,such as potential difficulties in classifying responses (Russell et al.,1993). Secondly, specific intensity ratings for different arousal cat-egories of positive affect were collected simultaneously, whichallowed us to measure perception of multiple arousal dimen-sions in response to viewing each image. Thirdly, the currentstudy explored the perception of varying levels of positive affectamong three cultures: the United States, Russia, and Japan, thusincluding participants from two well-studied cultures for com-parison with previous research (United States and Japan) andparticipants from one relatively underrepresented culture in cross-cultural research (Russia) to extend previous findings. Finally,only female participants were included in the current study, thusallowing us to use advertisements from the beauty industry, whichprovided an optimal pool of stimuli for the study of positive affectperception.
OVERVIEW OF THE STUDYAmerican, Japanese, and Russian female participants completed anonline questionnaire in which they viewed beauty advertisementsdepicting models with positive emotional expressions. Each modelwas presented in two conditions, portraying either high arousal(HA; i.e., highly salient positive facial expressions) or low arousal(LA; i.e., more subtle positive facial expressions) positive emo-tions. Images from real advertisements were employed in order tocontrol for attractiveness, familiarity, and authenticity of the por-trayed affective expressions. Participants were asked to rate eachadvertisement on a novel rating scale based on the Affect ValuationIndex (Tsai et al., 2006).
The main goal of the current investigation was to test thehypothesis that cultural differences exist in the perception of pos-itive affect intensity and to explore the underlying mechanisms
leading to those cultural differences. Due to previously reporteddifferences in cultural display rules (e.g., Matsumoto and Ekman,1989; Matsumoto et al., 1998, 2005) and their suggested influ-ence on perception (e.g., Yuki et al., 2007; Damjanovic et al.,2010), we expected cross-cultural differences in intensity ratingsfor highly salient facial expressions, as well as subtle, LA facialexpressions of positive affect. Specifically, due to higher levels ofexpressivity endorsement for happiness compared to other cul-tures (Matsumoto et al., 2005, 2008), we expected Americans todiffer from Japanese and Russians in their ratings of high and lowarousal positive (LAP) affect. Japanese and Russian nationals, onthe other hand, have been shown to exert significantly higher levelsof control over their displays of happiness compared to Americans(Matsumoto et al., 1998, 2005; Matsumoto, 2001) and additionally,are located in close proximity on the Individualism–Collectivismcontinuum (Matsumoto et al., 2008). Given these similarities, weexpected participants from these cultures to have comparable per-cepts of LA affect. However, Japanese and Russian nationals havealso been shown to differ in the way that affect is controlled, withRussians qualifying their emotions to a greater degree than Japan-ese and Americans, while Japanese deamplifying their emotionsmore than other cultures (Matsumoto et al., 2005). Such differ-ences in display rules lead to disparate modifications of HA affectdisplays, with reductions of HA expressions in the case of deam-plification and blended emotion in the case of qualification. Wetherefore expected differences in affect intensity perception for HAemotions between Japanese and Russian participants.
MATERIALS AND METHODSPARTICIPANTSA total of 61 female participants were included in the currentstudy: 22 participants from the United States, 18 from Japan, and21 from Russia. Participants reported their age, nationality, cur-rent country of residence, years of education, and employmentstatus. Demographic data for age and education (see Table 1) wereentered into separate one-way Analyses of Variance (ANOVA) totest for cultural differences. Participants were well matched in thenumber of years of education [F(2,58) = 1.198, p = 0.309], andage [F(2,58) = 1.091, p = 0.343].
STIMULIEleven pairs of fictitious beauty advertisements were created thatfeatured the same model portraying high arousal positive (HAP)and LAP emotions (see Figure 1). To increase the applicabilityof the findings, ads were selected from existing real print adver-tisements for cosmetics featured in global marketing campaignsbetween the years 2006 and 2008 and were slightly manipulated tocreate novel advertisements (e.g., Thorson, 1990). From a larger
Table 1 | Sample characteristics of participants from America, Russia,
and Japan.
Variable Americans Russians Japanese
N 22 21 18
Mean age (years) 26.5 25.14 24.44
Mean education (years) 16.68 15.95 16.11
www.frontiersin.org November 2011 | Volume 2 | Article 313 | 3
Pogosyan and Engelmann Cultural differences in affect intensity perception
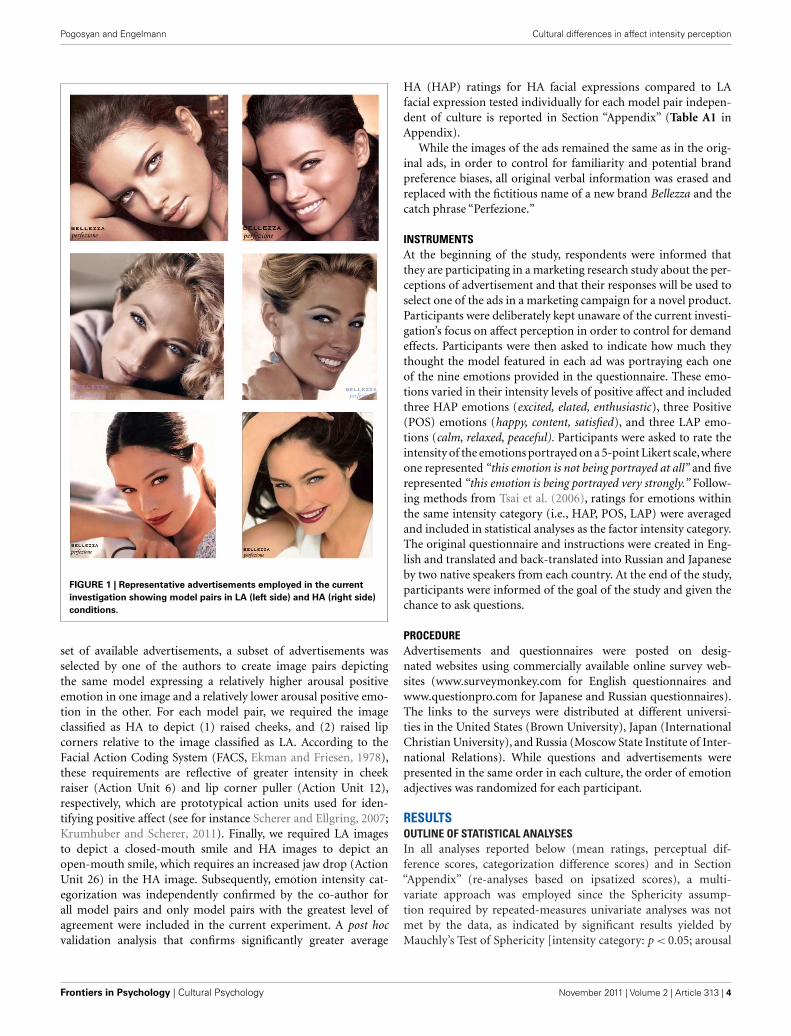
FIGURE 1 | Representative advertisements employed in the current
investigation showing model pairs in LA (left side) and HA (right side)
conditions.
set of available advertisements, a subset of advertisements wasselected by one of the authors to create image pairs depictingthe same model expressing a relatively higher arousal positiveemotion in one image and a relatively lower arousal positive emo-tion in the other. For each model pair, we required the imageclassified as HA to depict (1) raised cheeks, and (2) raised lipcorners relative to the image classified as LA. According to theFacial Action Coding System (FACS, Ekman and Friesen, 1978),these requirements are reflective of greater intensity in cheekraiser (Action Unit 6) and lip corner puller (Action Unit 12),respectively, which are prototypical action units used for iden-tifying positive affect (see for instance Scherer and Ellgring, 2007;Krumhuber and Scherer, 2011). Finally, we required LA imagesto depict a closed-mouth smile and HA images to depict anopen-mouth smile, which requires an increased jaw drop (ActionUnit 26) in the HA image. Subsequently, emotion intensity cat-egorization was independently confirmed by the co-author forall model pairs and only model pairs with the greatest level ofagreement were included in the current experiment. A post hocvalidation analysis that confirms significantly greater average
HA (HAP) ratings for HA facial expressions compared to LAfacial expression tested individually for each model pair indepen-dent of culture is reported in Section “Appendix” (Table A1 inAppendix).
While the images of the ads remained the same as in the orig-inal ads, in order to control for familiarity and potential brandpreference biases, all original verbal information was erased andreplaced with the fictitious name of a new brand Bellezza and thecatch phrase “Perfezione.”
INSTRUMENTSAt the beginning of the study, respondents were informed thatthey are participating in a marketing research study about the per-ceptions of advertisement and that their responses will be used toselect one of the ads in a marketing campaign for a novel product.Participants were deliberately kept unaware of the current investi-gation’s focus on affect perception in order to control for demandeffects. Participants were then asked to indicate how much theythought the model featured in each ad was portraying each oneof the nine emotions provided in the questionnaire. These emo-tions varied in their intensity levels of positive affect and includedthree HAP emotions (excited, elated, enthusiastic), three Positive(POS) emotions (happy, content, satisfied), and three LAP emo-tions (calm, relaxed, peaceful). Participants were asked to rate theintensity of the emotions portrayed on a 5-point Likert scale,whereone represented “this emotion is not being portrayed at all” and fiverepresented “this emotion is being portrayed very strongly.” Follow-ing methods from Tsai et al. (2006), ratings for emotions withinthe same intensity category (i.e., HAP, POS, LAP) were averagedand included in statistical analyses as the factor intensity category.The original questionnaire and instructions were created in Eng-lish and translated and back-translated into Russian and Japaneseby two native speakers from each country. At the end of the study,participants were informed of the goal of the study and given thechance to ask questions.
PROCEDUREAdvertisements and questionnaires were posted on desig-nated websites using commercially available online survey web-sites (www.surveymonkey.com for English questionnaires andwww.questionpro.com for Japanese and Russian questionnaires).The links to the surveys were distributed at different universi-ties in the United States (Brown University), Japan (InternationalChristian University), and Russia (Moscow State Institute of Inter-national Relations). While questions and advertisements werepresented in the same order in each culture, the order of emotionadjectives was randomized for each participant.
RESULTSOUTLINE OF STATISTICAL ANALYSESIn all analyses reported below (mean ratings, perceptual dif-ference scores, categorization difference scores) and in Section“Appendix” (re-analyses based on ipsatized scores), a multi-variate approach was employed since the Sphericity assump-tion required by repeated-measures univariate analyses was notmet by the data, as indicated by significant results yielded byMauchly’s Test of Sphericity [intensity category: p < 0.05; arousal
Frontiers in Psychology | Cultural Psychology November 2011 | Volume 2 | Article 313 | 4

Pogosyan and Engelmann Cultural differences in affect intensity perception
level × intensity category: p < 0.001]. In such cases, the multivari-ate approach is preferable to univariate analyses with correction,as it does not rely as heavily on assumptions (e.g., Maxwell andDelaney, 2000). Test statistics reported below, therefore, repre-sent exact statistics obtained via Wilk’s lambda and reportedeffect size reflects partial η2. Marginally non-significant effects(0.05 < p ≤ 0.1) are reported, and p-values for post hoc tests con-ducted for between-subjects factors reflect results from Fisher’sLSD test.
The following analysis sequence was employed to investigatedifferential effects of culture on affect intensity perception andcategorization: (1) a mixed omnibus MANOVA was conductedto probe for higher-order interactions with the factor culture,indicating that cultural background differentially impacted affectintensity perception and categorization, and (2) follow-up testswere conducted to further explore the nature of significant inter-actions. Given our hypothesis that culture differentially affectsemotion intensity perception, a particular emphasis was placedon understanding the highest-order interaction, which qualifieslower-order interactions and main effects. The focus of follow-uptests was on the effects of culture on mean ratings or mean rat-ing differences across relevant factor combinations. To this end,we first tested general effects of culture via a between-subjectsMANOVA with culture as predictor variable and multiple depen-dent variables reflective of all factor combinations for a givenanalysis. Furthermore, provided that all previous multivariate testswere significant, univariate tests of simple effects were conductedto isolate mean ratings or rating differences that were signifi-cantly affected by culture, followed by post hoc tests (Fischer’sLSD) to identify the exact cultural differences for significant simpleeffects.
In order to control for potential cultural differences in rat-ing styles and response set bias (e.g., Hofstede, 1980; Chen et al.,1995), all data were standardized and reanalyzed (see Appendixfor details). Specifically, to control for two types of bias that couldsystematically affect emotion ratings across cultures, namely (a)an extreme response style that is characterized by a tendencyto use the endpoints of a scale, and (b) acquiescence responsebias that is characterized by a shift to either end of a scale, weemployed ipsatization as our method of standardizing raw scores.Results from additional analyses of the data support the trendsreported in the analyses of the raw data and are reported inSection “Appendix” (see Tables A2–A11 and Figures A1–A3 inAppendix).
CULTURAL DIFFERENCES IN EMOTION PERCEPTIONTo investigate cultural differences in the perception of positiveaffect intensity, mean ratings in each emotion intensity cate-gory were entered into a three-way mixed Multivariate Analysisof Variance (MANOVA), with arousal level (HA vs. LA facialexpression) and intensity category (HAP, POS, LAP) as within-subjects factors as well as culture (American, Russian, Japanese)as between-subjects factor. A significant main effect of intensitycategory was obtained [F(2,57) = 74.747, p < 0.001, η2 = 0.725],with highest ratings in the POS (3.291) intensity category com-pared to HAP (2.775) and LAP (2.887). There was also a signif-icant main effect of arousal level [F(1,58) = 107.337, p < 0.001,
η2 = 0.649], with larger mean ratings for advertisements depict-ing HA (3.279) compared to LA (2.691) facial expressions. Themain effect of culture did not reach significance [F(2,58) = 1.646,p = 0.202, η2 = 0.054], but interacted significantly with the fac-tors (1) arousal level [F(2,58) = 5.306, p < 0.01, η2 = 0.155], and(2) intensity category [F(4,116) = 3.614, p < 0.01, η2 = 0.113].Follow-up tests of the culture by arousal level interaction indi-cated that, for LA faces,American participants showed significantlylower mean ratings across all rating categories than both Japan-ese (Fisher’s LSD mean difference was significant at p < 0.01)and Russian participants (p < 0.05). The culture by intensitycategory interaction was driven by cultural differences in theHAP domain, such that American participants showed signifi-cantly lower mean ratings across both arousal levels than Japanese[p < 0.05] and Russian [p < 0.01] participants. A further two-wayinteraction was obtained between arousal level and intensity cate-gory [F(2,57) = 67.529, p < 0.001, η2 = 0.703]. Post hoc pairwisecomparisons investigating differences between intensity categoriesfor a given arousal level, as well as comparisons within a givenintensity category, but across arousal levels, were significant atp < 0.001, except when comparing mean LAP ratings in responseto high vs. LA faces, for which a marginally non-significant p-value [p = 0.091] was obtained. Finally, in agreement with thehypothesis of the present study, a significant three-way interactionwas found between the factors arousal level, intensity category,and culture [F(4,114) = 6.641, p < 0.001, η2 = 0.189; Figure 2].Because lower-order interactions are best described in terms ofsignificant higher-order interactions, the nature of the three-wayinteractions was investigated in detail in two ways: (a) by meansof tests of simple effects in combination with post hoc pairwisecomparisons testing the effects of culture on ratings within eachintensity category as a function of arousal level, and (b) by meansof difference scores comparing (1) differences between mean rat-ings for each arousal level within each intensity category, and(2) differences between mean ratings for each emotion intensitycategory within each arousal level. Difference scores not only sum-marize the three-way interaction between culture, arousal level,and intensity category, but also allow for investigating the effectsof culture on emotion intensity perception and emotion intensitycategorization.
Tests of simple effectsBecause the focus of the current study is the effect of cul-ture on intensity ratings of facial expressions of positive affect,we examined the three-way interaction between arousal level,intensity category, and culture more closely by investigatinghow culture affected mean ratings. We first probed for gen-eral effects of culture on ratings within each intensity categoryas a function of arousal level. To this end, a between-subjectsMANOVA was performed with culture as predictor variable andratings across intensity category and arousal level as multipledependent variables (mean ratings within the following fac-tor combinations between intensity category and arousal levelwere included as dependent variables: mean ratings in the HAPdomain for LA facial expressions = HAP_LA, as well as POS_LA,LAP_LA, HAP_HA, POS_HA, LAP_HA). A significant effect ofculture [F(12,106) = 5.396, p < 0.001, η2 = 0.379] was obtained,
www.frontiersin.org November 2011 | Volume 2 | Article 313 | 5

Pogosyan and Engelmann Cultural differences in affect intensity perception
FIGURE 2 | Average ratings within each intensity category for
advertisements showing LA and HA facial expressions across
cultures. The figure shows mean ratings across cultures (Russian,Japanese, American) and emotion intensity categories (HAP, POS, LAP)
for low and HA facial expressions. Significant cultural differences wereobtained in the HAP intensity category for LA facial expressions and theLAP intensity category for HA facial expressions. ** = p < 0.01;* = p < 0.05.
indicating the presence of cultural differences in one or moreof the rating categories. To identify exactly which cultural dif-ferences occurred, we conducted univariate follow-up tests ofsimple effects. These revealed significant cultural differences inmean ratings for the HAP intensity category after viewing LAadvertisements [F(2,58) = 16.889, p < 0.001, η2 = 0.368]. Post hocpairwise comparisons (Fisher’s LSD) revealed that American par-ticipants perceived advertisements with LA facial expressionsas significantly less excited (HAP: 1.741) compared to Russian(2.446) and Japanese (2.535) participants (mean differences weresignificant at p < 0.001). Furthermore, a near-significant effectwas obtained for mean ratings within the LAP intensity cate-gory after viewing HA advertisements [F(2,58) = 2.77, p = 0.071,η2 = 0.087]. Results from post hoc pairwise comparisons indi-cate that Japanese participants perceived HA images as signifi-cantly calmer (LAP: 3.101) compared to American (2.708) andRussian (2.658) participants [mean differences were significantat p < 0.05 (JP vs. RU) and near-significant at p = 0.056 (JPvs. US)]. All of these results were confirmed and extended byanalyses of the ipsatized scores, with one minor exception inthe post hoc comparisons (see Tables A2–A5 and Figure A1 inAppendix).
DIFFERENCE SCORESResults from simple effects analyses indicate that cultures differin their ratings of high and LA facial expressions. These resultscan be interpreted in two ways: they may indicate that (1) cul-tures perceive emotion intensity differentially, and (2) cultureshave different ways of categorizing and labeling the perceived emo-tion. In order to investigate whether and to what extent thesemechanisms contributed to the observed cross-cultural differencesin affect intensity ratings, two independent types of difference
scores were created. First, to address whether cultures perceiveemotion intensity differently, difference scores between mean rat-ings for each arousal level within each intensity category wereobtained. These scores reflect the degree to which participantsfrom each culture were able to differentiate between differingintensity levels of facial expressions across intensity categories.For instance, we expected that participants from all cultureswould rate HA facial expressions as more HAP than LA facialexpressions (see also validation analysis in Table A1 in Stimu-lus Validation Analysis in Appendix), but that there would besignificant cultural differences in the extent of such rating dif-ferences. Secondly, difference scores between mean ratings foreach emotion intensity category within each arousal level wereobtained. These difference scores reflect the degree to whichparticipants from each culture differentiated between intensitycategories, i.e., whether the observed emotion intensity (high orLA) was clearly classified into an intensity category across cul-tures. For instance, we expected that all cultures would rate HAfacial expressions as more HAP than LAP, but that there wouldbe significant cultural differences in the extent of such rating dif-ferences. Difference scores were created for each participant andentered into respective mixed Multivariate Analyses of Variance(MANOVA).
Cultural differences in intensity perceptionTo investigate the degree to which participants from each culturedifferentiated between the intensity of positive affect expressedby the model within each emotion intensity category, differ-ence scores were obtained for each participant by subtractingmean ratings for LA from mean ratings for HA facial expres-sions of positive affect within each intensity category. Intensitydifference scores reflecting the difference between ratings for HA
Frontiers in Psychology | Cultural Psychology November 2011 | Volume 2 | Article 313 | 6

Pogosyan and Engelmann Cultural differences in affect intensity perception
compared to LA facial expressions were entered into a mixedtwo-way MANOVA with intensity category (HA–LA in HAP rat-ing category, HA–LA in POS, HA–LA in LAP) as within-subjectsfactor and culture (American, Japanese, Russian) as between-subjects factor. We observed a significant main effect of inten-sity category [F(2,57) = 67.529, p < 0.001, η2 = 0.703], indicat-ing that rating categories, averaged over culture, showed sig-nificantly different mean scores from each other, with highestdifference scores observed in the HAP rating category (1.068),followed by POS (0.826) and LAP (−0.13) (all post hoc pair-wise comparisons were significant at p < 0.001). There was fur-thermore a significant main effect of culture [F(2,58) = 5.306,p < 0.01, η2 = 0.155], indicating significantly greater differencescores, averaged over intensity categories, for American (0.831)compared to Japanese (0.403) and Russian (0.530) participants(post hoc pairwise comparisons were significant at p < 0.005for the contrast US vs. JP, and p < 0.05 for the contrast USvs. RU). There was also an interaction between intensity cat-egory and culture [F(4,114) = 6.641, p < 0.001, η2 = 0.189].Because this interaction indicates that participants from thecultures included in the current study differentiated betweenhigh and LAP emotions expressed by the models to differingdegrees (Figure 3), further analyses were conducted to exam-ine this interaction and identify cultural differences in intensityperception.
To investigate general effects of culture on intensity differencescores, a between-subjects MANOVA was performed with cultureas predictor variable and intensity difference scores in each inten-sity category as dependent variables (rating differences between
high vs. LA facial expression across intensity categories wereincluded as dependent variables: HA–LA_HAP, HA–LA_POS,HA–LA_LAP). Because the MANOVA indicated a significanteffect of culture [F(6,112) = 6.443, p < 0.001, η2 = 0.257], indi-cating the presence of cultural differences for one or more ofthe intensity difference scores, we conducted univariate follow-up tests of simple effects to identify exactly for which intensitydifference scores cultural differences occurred. Tests of simpleeffects indicated the presence of significant cultural differencesin the HAP [F(2,58) = 13.842, p < 0.001, η2 = 0.323] and POS[F(2,58) = 3.204, p < 0.05, η2 = 0.099] intensity categories, aswell as a marginally non-significant effect in the LAP inten-sity category [F(2,58) = 2.448, p = 0.095, η2 = 0.078]. Pairwisecomparisons (Fisher’s LSD) revealed that in the HAP intensitycategory, US participants (1.602) differentiated between HA andLA images to a significantly larger degree compared to Russ-ian (0.957) and Japanese (0.646) participants [mean differenceswere significant at p < 0.005 (US vs. RU) and p < 0.001 (US vs.JP)]. Difference scores for American participants (1.019) werealso significantly different from those of Russian (0.599) butnot Japanese (0.859) participants in the POS intensity category(mean differences were significant at p < 0.05). In the LAP inten-sity category, difference scores for Russian participants (0.189)were significantly smaller than those of Japanese (−0.262), butnot American (−0.021) participants (mean differences were sig-nificant at p < 0.05; Figure 3). These results were fully con-firmed by analyses of intensity difference scores based on ipsatizeddata, which are reported in Tables A6–A9 and Figure A2 inAppendix.
FIGURE 3 | Perceptual difference scores representing mean differences
between ratings for high compared to LA facial expressions in each
intensity category across cultures. American participants showedsignificantly greater differentiation between high and LA facial expressions inthe HAP intensity category compared to Russian and Japanese participants.
In the POS intensity category, American participants differentiated betweenhigh and LA images to a significantly greater extent than Russian, but notJapanese participants. Finally, Russian participants perceived LA facialexpressions as significantly lower arousal (LAP) compared to Japaneseparticipants. **** = p < 0.001; *** = p < 0.005; ** = p < 0.01; * = p < 0.05.
www.frontiersin.org November 2011 | Volume 2 | Article 313 | 7

Pogosyan and Engelmann Cultural differences in affect intensity perception
Cultural differences in rating styles within each intensity categoryTo investigate the degree to which participants from each cul-ture differentiated between intensity categories for faces with thesame arousal level, category difference scores were obtained foreach participant by subtracting mean ratings within the LAPintensity category from both HAP and POS intensity categories(HAP–LAP; POS–LAP) and mean ratings in the POS intensity cat-egory from the HAP intensity category (HAP–POS) within eacharousal level. These difference scores were entered into a mixedthree-way MANOVA with category difference (HAP–LAP, HAP–POS, POS–LAP) and arousal level (high, low) as within-subjectsfactors and culture (American, Japanese, Russian) as between-subjects factor. A significant main effect of category difference[F(2,57) = 74.747, p < 0.001, η2 = 0.724] was obtained, indicat-ing that when averaged over the factors culture and arousal level,the greatest absolute difference was observed between HAP andPOS ratings (−0.516), followed by POS vs. LAP (0.404) andHAP vs. LAP (−0.112) (all category differences were signifi-cantly different from each other at p < 0.001). A main effect ofarousal level [F(1,58) = 118.301, p < 0.001, η2 = 0.671] was alsoobserved, indicating that mean difference scores for HA faces(0.325) were greater than for LA faces (−0.474) (post hoc com-parisons showed significant differences at p < 0.001). There wasalso a near-significant main effect of culture [F(2,58) = 3.005,p = 0.057, η2 = 0.094], indicating that mean difference scores ofJapanese participants (0.062) were significantly different fromthose of US participants (−0.154; p < 0.05), while a marginallynon-significant difference was observed between Japanese andRussian participants (−0.133; p = 0.058). Culture interacted withthe factors arousal level [F(2,58) = 9.322, p < 0.001, η2 = 0.243],indicating that for LA images, US participants’ mean differencescores (−0.731) were significantly smaller than those of Japan-ese (−0.372; p < 0.001) and Russian (−0.320; p < 0.05) partici-pants, while for HA images, Russian participants’ mean differencescores (0.054) were significantly smaller than those of Japan-ese (0.496; p < 0.001) and American (0.423; p < 0.005) partici-pants. A further interaction between culture and category dif-ference [F(4,116) = 3.614, p < 0.01, η2 = 0.113] was observed,indicating significant cultural differences for category differencesaveraged over arousal level, such that, for the contrast betweenHAP and LAP, Japanese participants’ absolute mean differencescores (0.93) were significantly smaller than those of US partici-pants (−0.231; p < 0.05) and marginally non-significantly smallercompared to those of Russian participants (−0.199, p = 0.058).Furthermore, for the contrast between HAP and POS, Japan-ese participants’ absolute mean difference scores (−0.289) weresignificantly smaller than those of US (−0.725; p < 0.001) andRU (−0.535; p < 0.05) participants. A further two-way interac-tion was obtained between arousal level and category difference[F(2,57) = 67.529, p < 0.001, η2 = 0.703], indicating that all cat-egory differences for HA faces were significantly greater thancategory differences for LA faces (all post hoc pairwise compar-isons were significant at p < 0.001). Importantly, there was asignificant three-way interaction between culture, category differ-ence, and arousal level [F(4,114) = 6.641, p < 0.001, η2 = 0.186].This interaction indicates that participants from different cul-tures differentiated between intensity categories as a function of
arousal intensity of the facial expression of the models to differentdegrees.
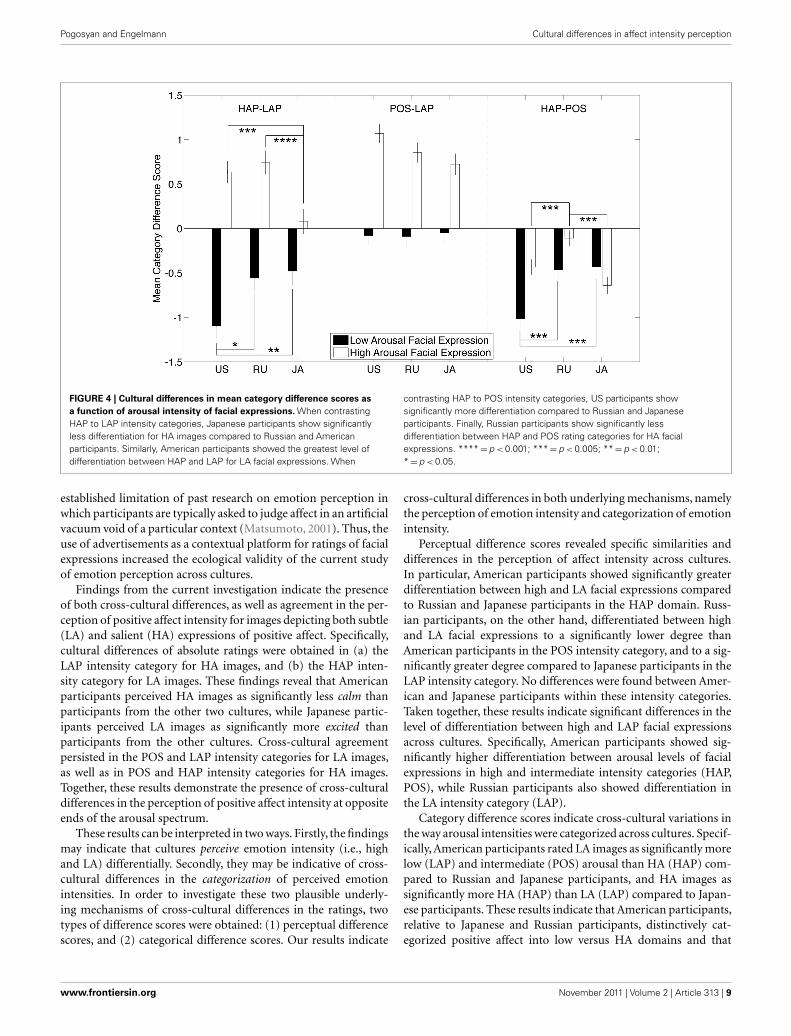
To investigate general effect of culture on category differencescores as a function of arousal level, a between-subjects MANOVAwas performed with culture as predictor variable and category dif-ference scores in each arousal level as multiple dependent variables(rating differences between intensity category across arousal levelswere included as dependent variables: rating differences betweenHAP and LAP ratings for LA facial expressions = HAP-LAP_LA,as well as HAP-POS_LA, POS–LAP_LA, HAP–LAP_HA, HAP–POS_HA, HAP–LAP_HA). Because the omnibus MANOVA indi-cated a significant effect of culture [F(8,110) = 5.214, p < 0.001,η2 = 0.275], indicating the presence of significant cultural differ-ences within at least one intensity category, we conducted uni-variate follow-up tests of simple effects to identify exactly forwhich category difference scores cultural differences occurred.Tests of simple effects indicate that cultural differences werepresent for LA facial expressions when contrasting (a) HAP toLAP ratings [F(2,58) = 5.066, p < 0.01, η2 = 0.149], and (b) HAPto POS ratings [F(2,58) = 9.115, p < 0.001, η2 = 0.239]. Further-more, cultural differences were present for HA facial expressionswhen contrasting (a) HAP and LAP [F(2,58) = 6.944, p < 0.005],and (b) HAP and POS [F(2,58) = 9.165, p < 0.001]. Post hoctests (Fisher’s LSD) were conducted to investigate these culturaldifferences. Post hoc tests revealed that American participants(−1.096) differentiated between LAP and HAP affective dimen-sions to a much larger degree than Russian (−0.558) and Japan-ese (−0.480) participants when rating LA images [mean differ-ences were significant at p < 0.05 (US vs. RU) and p < 0.01 (USvs. JP); Figure 4]. When rating HA facial expressions, Japan-ese participants (0.081) differentiated between HAP and LAPaffective dimensions significantly less than American (0.635)and Russian (0.745) participants [mean differences were signif-icant at p < 0.005 (JP vs. US) and p < 0.001 (JP vs. RU)]. Infact, Japanese participants rated HA images equally on HAPand LAP dimensions, as indicated by a one sample t -test thattested whether difference scores were significantly different from0 [t (17) = 0.65, p = 0.523] (Figure 4). Further significant differ-ences were obtained for US participants’difference scores (−1.017)between HAP and POS when rating LA images compared to Russ-ian (−0.468) and Japanese (−0.429) participants (mean differ-ences were significant at p < 0.005). Finally, Russian participants(−0.110) differentiated between HAP and POS to a smaller degreethan Japanese (−0.641) and American (−0.434) participants whenrating HA images (mean differences were significant at p < 0.005).In fact, Russian participants rated HA images equally on HAPand POS dimensions, as indicated by a one sample t -test thattested whether difference scores were significantly different from0 [t (20) = −1.868, p = 0.08]. These results were fully confirmedby analyses of categorization difference scores based on ipsatizeddata, which are reported in Tables A10–A12 and Figure A3 inAppendix.
DISCUSSIONThe present study investigated cultural differences in the percep-tion of positive affect intensity in the context of advertisements forbeauty products. As such, the present study addressed a previously
Frontiers in Psychology | Cultural Psychology November 2011 | Volume 2 | Article 313 | 8
Pogosyan and Engelmann Cultural differences in affect intensity perception
FIGURE 4 | Cultural differences in mean category difference scores as
a function of arousal intensity of facial expressions. When contrastingHAP to LAP intensity categories, Japanese participants show significantlyless differentiation for HA images compared to Russian and Americanparticipants. Similarly, American participants showed the greatest level ofdifferentiation between HAP and LAP for LA facial expressions. When
contrasting HAP to POS intensity categories, US participants showsignificantly more differentiation compared to Russian and Japaneseparticipants. Finally, Russian participants show significantly lessdifferentiation between HAP and POS rating categories for HA facialexpressions. **** = p < 0.001; *** = p < 0.005; ** = p < 0.01;* = p < 0.05.
established limitation of past research on emotion perception inwhich participants are typically asked to judge affect in an artificialvacuum void of a particular context (Matsumoto, 2001). Thus, theuse of advertisements as a contextual platform for ratings of facialexpressions increased the ecological validity of the current studyof emotion perception across cultures.
Findings from the current investigation indicate the presenceof both cross-cultural differences, as well as agreement in the per-ception of positive affect intensity for images depicting both subtle(LA) and salient (HA) expressions of positive affect. Specifically,cultural differences of absolute ratings were obtained in (a) theLAP intensity category for HA images, and (b) the HAP inten-sity category for LA images. These findings reveal that Americanparticipants perceived HA images as significantly less calm thanparticipants from the other two cultures, while Japanese partic-ipants perceived LA images as significantly more excited thanparticipants from the other cultures. Cross-cultural agreementpersisted in the POS and LAP intensity categories for LA images,as well as in POS and HAP intensity categories for HA images.Together, these results demonstrate the presence of cross-culturaldifferences in the perception of positive affect intensity at oppositeends of the arousal spectrum.
These results can be interpreted in two ways. Firstly, the findingsmay indicate that cultures perceive emotion intensity (i.e., highand LA) differentially. Secondly, they may be indicative of cross-cultural differences in the categorization of perceived emotionintensities. In order to investigate these two plausible underly-ing mechanisms of cross-cultural differences in the ratings, twotypes of difference scores were obtained: (1) perceptual differencescores, and (2) categorical difference scores. Our results indicate
cross-cultural differences in both underlying mechanisms, namelythe perception of emotion intensity and categorization of emotionintensity.
Perceptual difference scores revealed specific similarities anddifferences in the perception of affect intensity across cultures.In particular, American participants showed significantly greaterdifferentiation between high and LA facial expressions comparedto Russian and Japanese participants in the HAP domain. Russ-ian participants, on the other hand, differentiated between highand LA facial expressions to a significantly lower degree thanAmerican participants in the POS intensity category, and to a sig-nificantly greater degree compared to Japanese participants in theLAP intensity category. No differences were found between Amer-ican and Japanese participants within these intensity categories.Taken together, these results indicate significant differences in thelevel of differentiation between high and LAP facial expressionsacross cultures. Specifically, American participants showed sig-nificantly higher differentiation between arousal levels of facialexpressions in high and intermediate intensity categories (HAP,POS), while Russian participants also showed differentiation inthe LA intensity category (LAP).
Category difference scores indicate cross-cultural variations inthe way arousal intensities were categorized across cultures. Specif-ically, American participants rated LA images as significantly morelow (LAP) and intermediate (POS) arousal than HA (HAP) com-pared to Russian and Japanese participants, and HA images assignificantly more HA (HAP) than LA (LAP) compared to Japan-ese participants. These results indicate that American participants,relative to Japanese and Russian participants, distinctively cat-egorized positive affect into low versus HA domains and that
www.frontiersin.org November 2011 | Volume 2 | Article 313 | 9

Pogosyan and Engelmann Cultural differences in affect intensity perception
these domains are perceptually separate. Furthermore, the dif-ferences in ratings between HAP and LAP intensity categorieswere significantly smaller for Japanese compared to American andRussian participants, particularly for HA facial expressions. Theseresults demonstrate that Japanese participants did not discrimi-nate between high and LAP emotions to the same extent as did theAmerican and Russian participants. Finally, Russian participantsdiscriminated to a significantly lower degree between HAP andPOS intensity categories than both Japanese and American partic-ipants, particularly for HA images. Our findings thus indicate that,while Americans showed the clearest differentiation between highand LA images across all intensity categories, Japanese and Russianparticipants deviated from such clear distinctions between affectintensity levels, such that the Japanese did not judge HA faces to bedifferent in the HAP and LAP dimensions, while the Russians didnot judge HA faces to be different in the HAP and POS dimensions.Taken together, these results indicate significant cross-cultural dif-ferences in the extent to which facial expressions are categorizedinto intensity categories.
Previous findings of cross-cultural differences in emotionvalence perception may be applied to provide possible explana-tions for the present findings of differences in the perception ofpositive affect intensity. As previously suggested, cross-culturaldifferences in emotion perception may be due to cultural displayrules imposed by cultural contexts (Matsumoto and Ekman, 1989),which can affect perception via modulating featural salience (Yukiet al., 2007) and emotion detection strategies (Damjanovic et al.,2010). For instance, while some cultures (e.g., American), mayencourage the display of HAP emotions, display rules in othercultures (e.g., Japanese and Russian) may call for the inhibitionof exaggerated display of affective expressions (Matsumoto et al.,1998, 2005; Matsumoto, 2001). Following this theory, individu-als within the American cultural context are exposed to displaysof affect with greater intensity and may therefore be able to rec-ognize and categorize these emotions more readily compared toindividuals from the Japanese cultural context. Recent findingsfrom Damjanovic et al. (2010) lend support to this notion. Theauthors demonstrated cross-cultural difference in the expressionof a facilitatory effect of other race targets for the detection ofhappy faces in the context of an affective visual search paradigm.In contrast to English participants, Japanese participants demon-strated such facilitatory effect of other race targets only wheninstructions specifically encouraged perceptual based rather thanverbal labeling strategies. These results indicate that perceptuallysalient, HA smiles can lead to interference during the detectionof affect for Japanese participants, as these are incongruent withJapanese display rules and therefore may not match the Japan-ese prototype emotion employed during visual search (see alsoRoberson et al., 2007). Findings from the present study indicatean analogous pattern in the domain of affect intensity perceptionfor the Japanese participants, who showed the lowest level of dif-ferentiation between high and LAP emotions compared to othercultures (Figure 3) and, surprisingly, did not categorize HA facialexpressions as either high or LA (Figure 4). This observation maybe due to the fact that HA expressions do not match Japaneseprototypical expressions, due to display rules that endorse deam-plification and masking of positive emotional states (Matsumoto
et al., 1998, 2008; Yuki et al., 2007) and therefore lead to percep-tual interference as suggested previously (Damjanovic et al., 2010).Results from Japanese participants differ significantly from thoseof American and Russian participants. Specifically, compared toJapanese participants, American participants showed greater per-ceptual discrimination in the HA intensity domain, while Russianparticipants discriminated to a greater extent in the LA domain.Similarly, American participants categorized HA facial expres-sions as significantly more high and intermediate than LA whenviewing HAP facial expressions. The current results, thus, extendpreviously established cross-cultural differences in the interpreta-tion of affect valence among individuals from different culturalbackgrounds by demonstrating a similar behavioral pattern in theperception of positive affect intensity.
Interestingly, in the present study, the pattern of resultsobtained from Russian participants fell between the American andJapanese participants for both perceptual difference scores andcategorization difference scores. Specifically, Russian perceptualdifference scores were different from American, but not Japaneseparticipants in high and intermediate intensity categories. In thelow intensity category, differences were obtained between Russ-ian and Japanese, but not American, perceptual difference scores.Furthermore, when categorizing LAP images, Russian and Japan-ese participants had similar scores, while when categorizing HAPimages, Russian participants scored more similar to the Amer-ican participants. These results largely confirm our hypothesesabout cultural agreement and differences between the three cul-tures included in the current investigation. Specifically, they showthat Russian and Japanese participants perceive LA facial expres-sions similarly, as indicated by an absence of significant differencesin mean ratings,as well as perceptual and category difference scoresbetween these two cultures. For HA facial expressions, however,significant differences between Russian and Japanese participantswere obtained in categorization difference scores.
The current results may be explained by previous findings indi-cating that emotion judgment is regulated not only by a universaland innate ability to recognize facial affect, but can also be mod-ulated by certain culturally bestowed rules that vary accordingto sociocultural dimensions, such as Individualism/Collectivism(Matsumoto, 2001). Following this reasoning, we suggest that, dueto cultural display rules, individuals within different cultural con-texts are exposed to high intensity displays of positive affect todiffering degrees, leading to differences in intensities of emotionprototypes. In the context of the current investigation, Ameri-cans are, on average, exposed to the highest intensity displays ofpositive affect relative to the other two cultures. While Russianand Japanese participants exert similar levels of control over emo-tional expressions, these cultures have also been shown to differ intheir preferred method of controlling high intensity affect (Mat-sumoto et al., 2005). Specifically, Russians qualify their emotionsto a greater degree than Japanese and Americans, while Japan-ese deamplify their emotions more than other cultures, leadingto heterogeneous modifications of HA affect displays across thesecultures (Matsumoto et al., 2005). Such exposure to different levelsof high compared to low intensity emotion, as well as differentiallymodified affect, may affect prototype emotions for a given emo-tion category, as well as expected levels of deviation from such
Frontiers in Psychology | Cultural Psychology November 2011 | Volume 2 | Article 313 | 10

Pogosyan and Engelmann Cultural differences in affect intensity perception
prototypes. Thus, one potential mechanism underlying the cross-cultural differences in the perception of affect intensity observedin the current investigation can be attributed to cultural displayrules. As such, these display rules lead to varying levels of exposureto high intensity positive affect, which, in turn, may create cul-turally biased prototype affect intensities and expected deviationlevels.
The question of whether individuals from different culturalbackgrounds interpret expressions of positive emotions in ananalogous or dissimilar manner carries direct implications notonly for psychological science, but for all aspects of intercul-tural communication. Interpersonal communication, particularlyin an intercultural framework, draws extensively on non-verbalinformation, such as facial expressions, by providing valuableclues in navigating the interaction between interlocutors throughtheir conveyance of emotional states (e.g., LaFrance and Mayo,1978; Elfenbein and Ambady, 2002). However, variations in therecognition and, consequently, interpretation patterns of affectiveexpressions across different cultural contexts may present obsta-cles in the process of intercultural communication. For example,in the present experiment the explicit distinction that the Amer-ican participants showed between arousal intensities of positiveaffect differed from the rather vague discrimination of intensitylevels among the Japanese. Specifically, while for Americans, LAPfacial expressions were indicative of LAP emotions (e.g., calm-ness), the Japanese associated LAP facial expressions with HAPemotions (e.g., excitement ) to a significantly greater degree thanthe other cultures (Figure 4). That is, the Japanese viewed high andLAP emotions as complementary, whereas the Americans viewedthem as contradictory. These findings on affect intensity catego-rization parallel previously established patterns of cross-culturaldifferences in the interpretation of emotion valence (Uchida et al.,2004). As such, within the context of intercultural communication,a LA facial expression among the Japanese may be susceptible toa more inclusive and ambiguous interpretation than a LA facialexpression among Americans.
Implications of findings of cross-cultural differences in affectperception and recognition that were revealed in the present studycan also be observed in the field of advertising. For instance, eventhe slightest variations in the interpretation of emotional expres-sions featured in print advertisements could be detrimental tothe delivery of affective messages that the marketers are tryingto convey to consumers. Consequently, the interpretation of thead content will influence the affective reactions of the consumersto the ads, which in turn, may affect the consumer response tothe brand (Holbrook and Batra, 1987). This effect is particularlysalient with advertisements for beauty products, since such adver-tisements typically involve close-ups of faces that are conveyingpositive affect of varying intensity levels. Thus, advertisers need tobe aware of the variability of emotion perception in their inter-national advertising campaigns that may be present among theiraudiences with different cultural backgrounds.
The main limitation of the current study is the exclusive useof Caucasian models as stimuli. The in-group advantage hypoth-esis, which was first proposed by Elfenbein and Ambady (2002)based on an extensive meta-analysis of cross-cultural data, sug-gests increased affect recognition accuracy when judge and poser
are from the same cultural group. This raises the possibility thatcultural differences in positive affect intensity perception obtainedin the current study can, in part, be explained by an in-groupadvantage in emotion intensity recognition. While it is possiblethat the in-group advantage hypothesis extends to affect intensityperception, at least three factors mitigate the extent of potentialin-group effects on emotion intensity ratings in the current inves-tigation: (1) an in-group advantage only applies to differencesbetween Asian and Western cultures, but does not extend to dif-ferences observed between Russian and American participants;(2) only expressions of positive affect were used in the currentexperiment. It has repeatedly been demonstrated that happinessis the most easily recognized basic emotion across both Asianand Western cultures (e.g., Matsumoto, 1992; Russell et al., 1993,for review see Russell, 1994). Furthermore, various studies havedemonstrated a lack of an in-group advantage for happy faces.For instance, in a re-analysis of previously published data basedon experiments with categorical emotion judgments (Matsumoto,1992) and affect intensity ratings (Matsumoto and Ekman, 1989),Matsumoto (2002) showed that, for facial expressions of happi-ness, no differences between American and Japanese raters couldbe observed regardless of poser culture. Using a more conservativefree-response method, Russell et al. (1993) found high recogni-tion scores (>80%) for happy facial expressions for raters fromboth Western and Asian cultures (Canadian, Greek, and Japan-ese), despite the fact that only Caucasian faces were used as stimuliin their study. Furthermore, a more recent experiment investigat-ing cross-cultural differences in emotion recognition confidence(Beaupre and Hess, 2006), demonstrated an increased confi-dence when individuals judged emotion expressions of culturalin-group members, thereby confirming an in-group advantagefor confidence. On the other hand, however, a general increasein emotion judgment-related confidence across all cultures wasobserved when judging happiness compared to other emotions.Taken together, these findings demonstrate a weakening of an in-group advantage in recognition and confidence when positivelyvalenced facial expressions are judged. One explanation for theseresults can be found in Matsumoto et al. (2005), who showedthat across American, Japanese, and Russian nationals, the emo-tion that is least affected by display rules is happiness, suggestingan increased familiarity across cultures with relatively unmodifieddisplays of happiness compared to other emotions. (3) Familiaritywith the poser culture has been demonstrated to reduce an in-group advantage in emotion recognition (Elfenbein and Ambady,2002, 2003; see also O’Toole et al., 1994; O’Toole et al., 1996). Inthe present study, ratings of affect intensity were conducted in thecontext of beauty advertisements. Within this context, Japanese aswell as Russian and American participants are highly accustomedto viewing Western models due to a strong prevalence of Caucasianmodels in international and national marketing campaigns in thebeauty industry (e.g., Mueller, 1992; Cutler et al., 1995; Moeran,2002; Barnes and Yamamoto, 2008). Therefore, a weakening ofthe cultural in-group advantage can be assumed within the con-text of advertising. Taken together, these points mitigate potentialinfluences of an in-group advantage in the current investigation.
The above discussion raises interesting questions as to whetherand to what extent the in-group advantage hypothesis generalizes
www.frontiersin.org November 2011 | Volume 2 | Article 313 | 11

Pogosyan and Engelmann Cultural differences in affect intensity perception
to the perception of affect intensity, which may be addressed infuture research endeavors. Foremost among those is an investi-gation of an in-group advantage in affect intensity perceptionin both positive and negative valence domains. To this end,posers and raters from each culture would need to be includedin one study, ideally using a fully balanced design (Matsumoto,2002).
CONCLUSIONIn the past few decades, psychological research has attested tothe existence of subtle differences in the perception of emotionsacross cultures, thus solidifying the significance of culture in allaspects of the emotional mechanism (Matsumoto, 1992). Thepresent study supported and extended previous findings by reveal-ing cross-cultural differences in the perception of positive affectintensity among American, Japanese, and Russian female partic-ipants within the context of advertising. Findings indicated thatAmerican participants discriminated between high and LAP facialexpressions to a greater extent than the Russians and the Japanesein the HA domain, and categorized high and LA facial expressionsdifferently compared to the other cultures. The Japanese partic-ipants, on the other hand, showed the lowest discrimination ofpositive affect intensities, particularly for HA facial expressions.The Russian participants demonstrated similar affect perceptionpatterns to both Americans (for HA facial expressions) and theJapanese (for LA facial expressions). The findings of cross-culturaldifferences within the positive affect intensity continuum obtainedby the present study are intriguing, because they parallel previ-ously established cross-cultural differences in the interpretationof positive and negative emotions. In other words, the previ-ously established comprehensive model of cultural variabilityof emotion perception has now also been observed within thepositive affect intensity continuum. The observed cross-cultural
differences were attributed to variations in display rules that reg-ulate exposure to different intensity levels of positive affect acrosscultures and thereby modulate emotion prototypes and expecteddeviations from these.
Furthermore, the present study addressed a previous limitationof perception research in two ways. Firstly, perception of emotionwas investigated within a context ubiquitous in all three cultures,namely that of beauty advertising, thus providing a more natu-ralistic setting for the study of affect perception. Secondly, a novelinstrument was employed to study the perception of positive affectin the context of beauty ads, which allowed participants to rankperceived affect in various intensity domains, rather than in thevalence domains alone.
The current findings underline differences in emotion percep-tion and categorization across cultures, which carry direct impli-cations for all facets of communication, including advertising. Akeen awareness of variations in sociocultural rules and their influ-ences on affective mechanisms therefore becomes imperative forsuccessful communication within a multicultural framework in awide variety of situations that range from interpersonal settings tothe effective execution of global advertising campaigns.
ACKNOWLEDGMENTSWe would like to thank Jacqueline Wasilewski for helpful com-ments on an earlier version of this manuscript. We also thankNatalia Meliksiatova and Nahoko Hirano for help with translat-ing the questionnaires. Marianna Pogosyan was supported by theCenter of Excellence (COE) Grant from the Japanese Ministry ofEducation for Peace, Security, and Conviviality. Jan B. Engelmanngratefully acknowledges support from the Mercator FoundationSwitzerland, the NCCR Affective Sciences, and the Neurochoiceproject of SystemsX, as well as the research priority program at theUniversity of Zurich “Foundations of Human Social Behavior.”
REFERENCESBarnes, B. R., andYamamoto, M. (2008).
Exploring international cosmeticsadvertising in Japan. J. Mark. Man-age. 24, 299–316.
Beaupre, M. G., and Hess, U. (2006). Aningroup advantage for confidencein emotion recognition judgments:The moderating effect of familiar-ity with the expression of outgroupmembers. Pers. Soc. Psychol. Bull. 32,16–26.
Biehl, M., Matsumoto, D., Ekman, P.,Hearn, V., Heider, K., and Kudoh,T. (1997). Matsumoto and Ekman’sJapanese and Caucasian facialexpressions of emotion (JACFEE):reliability data and cross-nationaldifferences. J. Nonverb. Behav. 21,3–21.
Buck, R. (1988). Human Motivation andEmotion, 2nd Edn. New York: Wiley.
Calvo, M. G., and Nummenmaa, L.(2008). Detection of EmotionalFaces: Salient physical features guideeffective visual search. J. Exp. Psy-chol. Gen. 137, 471–494.
Chan, D. W. (1985). Perception andjudgment of facial expressionsamong the Chinese. Int. J. Psychol.20, 681–692.
Chan, W. (2003). Analyzing ipsativedata in psychological research.Behaviormetrika 40, 99–121.
Chen, C., Lee, S. Y., and Stevenson,H. W. (1995). Response style andcross-cultural comparisons of ratingscales among east Asian and northAmerican students. Psychol. Sci. 6,170–175.
Cutler, B. D., Javalgi, R. G., and White,D. S. (1995). The westernization ofAsian print advertising. J. Int. Con-sum. Mark. 7, 23–37.
Damjanovic, L., Roberson, D., Athana-sopoulos, P., Kasai, C., and Dyson,M. (2010). Searching for happinessacross cultures. J. Cogn. Cult. 10,85–107.
Ekman, P., and Friesen, W. V. (1969).The repertoire of non-verbalbehavior: categories, origins,usage, and coding. Semiotica 1,49–98.
Ekman,P., and Friesen,W.V. (1978). TheFacial Action Coding System: A Tech-nique for the Measurement of FacialMovement. Palo Alto, CA: Consult-ing Psychologists Press.
Ekman, P., Friesen, W. V., andEllsworth, P. (1972). Emotionin the Human Face: Guidelinesfor Research and an Integrationof Findings. New York: PergamonPress.
Ekman, P., Friesen, W. V., O’Sullivan,M., Chan, A., Diacoyanni-Tarlatzis,I., and Heider, K. (1987). Univer-sals and cultural differences in thejudgments of facial expressions ofemotion. J. Pers. Soc. Psychol. 53,712–717.
Ekman, P., and Heider, K. G. (1988). Theuniversality of a contempt expres-sion: A replication. Motiv. Emot. 12,303–308.
Elfenbein, H. A., and Ambady, N.(2002). On the universality and cul-tural specificity of emotion recogni-tion: a meta-analysis. Psychol. Bull.128, 203–235.
Elfenbein, H. A., and Ambady, N.(2003). When familiarity breedsaccuracy: cultural exposure andfacial emotion recognition. J. Pers.Soc. Psychol. 85, 276–290.
Fischer, R. (2004). Standardization toaccount for cross-cultural responsebias. a classification of score adjust-ment procedures and review ofresearch in JCCP. J. Cross Cult. Psy-chol. 35, 263–282.
Grammer, K., and Eibl-Eibesfeldt, I.(1993). “Emotionpsychologie imKulturenvergleich [emotion psy-chology in cultural comparisons],”in Kulturvergleichende PsychologieEine Eifuhrung ed A. Thomas (Got-tingen: Hogrefe), 289–322.
Haidt, J., and Keltner, D. (1999). Cul-ture and facial expression: open-ended methods find more expres-sions and a gradient of recognition.Cogn. Emot. 13, 225–266.
Heine, S. J., Lehman, D. R., Markus, H.R., and Kitayama, S. (1999). Is therea universal need for positive self-regard? Psychol. Rev. 106, 766–794.
Frontiers in Psychology | Cultural Psychology November 2011 | Volume 2 | Article 313 | 12

Pogosyan and Engelmann Cultural differences in affect intensity perception
Hicks, L. E. (1970). Some propertiesof ipsative, normative and forced-choice normative measures. Psychol.Bull. 74, 167–184.
Hofstede, G. (1980). Cultures’ Conse-quences: International Differences inWork-Related Values. Beverly-Hills,CA: Sage.
Holbrook, M. B., and Batra, R. (1987).Assessing the role of emotions asmediators of consumer responsesto advertising. J. Consum. Res. 14,404–420.
Izard, C. E. (1971). The Face of Emo-tion. New York: Appleton-Century-Crofts.
Ko, S.-G., Lee, T.-H., Yoon, H.-Y., Kwon,J.-H., and Mather, M. (2011). Howdoes context affect assessments offacial emotion? The role of cultureand age. Psychol. Aging 26, 48–59.
Krumhuber, E. G., and Scherer, K. R.(2011). Affect bursts: dynamic pat-terns of facial expression. Emotion11, 826–841.
LaFrance, M., and Mayo, C. (1978). Cul-tural aspects of non-verbal commu-nication. Int. J. Intercult. Relat. 2,71–89.
LeDoux, J. E. (1987). “Emotion,” inHandbook of physiology, Vol. 1, Thenervous system, ed V. Mount Castle(Bethesda, MD: American Physio-logical Society), 419–459.
Leung, J. P., and Singh, N. N. (1998).Recognition of facial expressions ofemotion by Chinese adults withmental retardation. Behav. Modif. 22,205–216.
Levin, D. T. (2000). Race as a visual fea-ture: using visual search and percep-tual discrimination tasks to under-stand face categories and the cross-race recognition deficit. J. Exp. Psy-chol. Gen. 129, 559–574.
Mandal, M. K., Saha, G. B., andPalchoudhury, S. (1986). A cross-cultural study on facial affect. J.Psychol. Res. 30, 140–143.
Markus, H. R., and Kitayama, S. (1991).Culture and the self: implications forcognition, emotion, and motivation.Psychol. Rev. 98, 224–253.
Masuda, T., Ellsworth, P., Mesquita, B.,Leu, J., Tanida, S., and Van de Veer-donk, E. (2008). Placing the face incontext: cultural differences in theperception of facial emotion. J. Pers.Soc. Psychol. 94, 365–381.
Matsumoto, D. (1990). Cultural similar-ities and differences in display rules.Motiv. Emot. 14, 195–214.
Matsumoto, D. (1992). American-Japanese cultural differences inthe recognition of universal facialexpressions. J. Cross Cult. Psychol. 23,72–84.
Matsumoto, D. (1993). Ethnic dif-ferences in affect intensity, emo-tion judgments, display rules, andself-reported emotional expression.Motiv. Emot. 17, 107–123.
Matsumoto, D. (2001). Culture andEmotion. Oxford: Oxford UniversityPress.
Matsumoto, D. (2002). Methodologi-cal requirements to test a possi-ble ingroup advantage in judgingemotions across cultures: commentson Elfenbein and Ambady and evi-dence. Psychol. Bull. 128, 236–242.
Matsumoto, D., Consolacion, T.,Yamada, H., Suzuki, R., Franklin,B., Paul, S., Ray, R., and Uchida,H. (2002). American-Japanesecultural differences in judgments ofemotional expressions of differentintensities. Cogn. Emot. 16, 721–747.
Matsumoto, D., and Ekman, P. (1989).American-Japanese cultural differ-ences in intensity ratings of facialexpressions of emotion. Motiv.Emot. 13, 143–157.
Matsumoto, D., Kasri, F., and Kooken, K.(1999). American-Japanese culturaldifferences in judgments of expres-sion intensity and subjective experi-ence. Cogn. Emot. 13, 201–218.
Matsumoto, D., Takeuchi, S., Andayani,S., Kouznetsova, N., and Krupp, D.(1998). The contribution of indi-vidualism vs. collectivism to cross-national differences in display rules.Asian J. Soc. Psychol. 1, 147–165.
Matsumoto, D., Yoo, S. H., Fontaine, J.,Anguas-Wong, A. M., Arriola, M.,Ataca, B., Bond, M. H., Boratav, H.B., Breugelmans, S. M., Cabecinhas,R., Chae, J., Chin, W. H., Comun-ian, A. L., DeGere, D. N., Dju-naidi, A., Fok, H. K., Friedlmeier,W., Ghosh, A., Glamcevski, M.,Granskaya, J. V., Groenvynck, H.,Harb, C., Haron, F., Joshi, R., Kakai,H., Kashima, E., Khan, W., Kurman,J., Kwantes, C. T., Mahmud, S. H.,Mandaric, M., Nizharadze, G., Odu-sanya, J. O. T., Ostrosky-Solis, F.,Palaniappan, A. K., Papastylianou,D., Safdar, S., Setiono, K., Shige-masu, E., Singelis, T. M., PolackovaSolcova, Iva, Spieß, E., Sterkowicz,S., Sunar, D., Szarota, P., Vishnivetz,B., Vohra, N., Ward, C., Wong, S.,Wu, R., Zebian, S., and Zengeya, A.(2008). Mapping expressive differ-ences around the world: The rela-tionship between emotional displayrules and Individualism vs. Collec-tivism. J. Cross Cult. Psychology 39,55–74.
Matsumoto, D., Yoo, S. H., Hirayama,S., and Petrova, G. (2005). Devel-opment and initial validation of a
measure of display rules: the displayrule assessment inventory (DRAI).Emotion 5, 23–40.
Maxwell, S. E., and Delaney, H. D.(2000). Designing Experiments andAnalyzing Data: A Model Com-parison Perspective. Mahwah, NJ:Lawrence Erlbaum Associates.
Michel, C., Rossion, B., Han, J., Chung,C.S., and Caldara, R. (2006). Holis-tic processing is finely tuned for facesof one’s own race. Psychol. Sci. 17,608–615.
Moeran, B. (2002). “Japanese adver-tising discourse: reconstructingimages,” in Exploring Japaneseness:On Japanese Enactments of Cultureand Consciousness, Civic Discoursefor the Third Millennium series, ed R.T. Donahue (London: GreenwoodPublishing Group), 386–398.
Mueller, B. (1992). Standardisation vs.specialisation: an examination ofwesternisation in cJapanese advertis-ing. J. Advert. Res. 32, 15–24.
Nisbett, R. E., Peng, K. P., Choi, I., andNorenzayan, A. (2001). Culture andsystems of thought: holistic versusanalytic cognition. Psychol. Rev. 108,291–310.
O’Toole, A. J., Deffenbacher, K. A.,Valentin, D., and Abdi, H. (1994).Structural aspects of face recogni-tion and the other-race effect. Mem.Cognit. 22, 208–224.
O’Toole, A. J., Peterson, J., and Deffen-bacher, K. A. (1996). An ‘other-raceeffect’ for categorizing faces by sex.Perception 25, 669–676.
Roberson, D., Damjanovic, L., andPilling, M. (2007). Categorical per-ception of facial expressions: evi-dence for a ‘category adjustment’model. Mem. Cognit. 35, 1814–1829.
Russell, J. A. (1991). Culture and thecategorization of emotions. Psychol.Bull. 110, 426–450.
Russell, J. A. (1994). Is there universalrecognition of emotion from facialexpression? A review of the cross-cultural studies. Psychol. Bull. 115,102–141.
Russell, J. A., Suzuki, N., and Ishida, N.(1993). Canadian, Greek, and Japan-ese freely produced emotion labelsfor facial expressions. Motiv. Emot.17, 337–351.
Safdar, S., Friedlmeier, W., Matsumoto,D., Yoo, S. H., Kwantes, C., Kakai, H.,and Shigemasu, E. (2009). Variationsof emotional display rules withinand across cultures: a comparisonbetween Canada, USA, and Japan.Can. J. Behav. Sci. 41, 1–10.
Scherer, K. R., and Ellgring, H. (2007).Are facial expressions of emo-tion produced by categorical affect
programs or dynamically driven byappraisal. Emotion 7, 113–130.
Thorson, E. (1990). “Consumer pro-cessing of advertising in currentissues and research in advertising,”in Current Research and Issues inAdvertising, eds J. H. Leigh and C.Martin (Ann Arbor, MI: Universityof Michigan School of Business),197–230.
Toner, H. L., and Gates, G. R. (1985).Emotional traits and recognition offacial expression of emotion. J. Non-verb. Behav. 9, 48–66.
Tsai, J. L., Knutson, B., and Fung, H. H.(2006). Cultural variation in affectvaluation. J. Pers. Soc. Psychol. 90,288–307.
Uchida, Y., Norasakkunkit, V., andKitayama, S. (2004). Cultural con-structions of happiness: theory andempirical evidence. J. HappinessStud. 5, 223–239.
Yik, M., and Russell, J. A. (2003). Chi-nese affect circumplex: I. Structureof recalled momentary affect. AsianJ. Soc. Psychol. 6, 185-200
Yrizarry, N., Matsumoto, D., and Wil-son Cohn, C. (1998). American andJapanese multi-scalar intensity rat-ings of universal facial expressions ofemotion. Motiv. Emot. 22, 315–327.
Yuki, M., Maddux, W. W., and Masuda,T. (2007). Are the windows to thesoul the same in the East and West?Cultural differences in using theeyes and mouth as cues to rec-ognize emotions in Japan and theUnited States. J. Exp. Soc. Psychol. 43,303–311.
Conflict of Interest Statement: Theauthors declare that the research wasconducted in the absence of anycommercial or financial relationshipsthat could be construed as a potentialconflict of interest.
Received: 28 July 2011; accepted: 16 Octo-ber 2011; published online: 07 November2011.Citation: Pogosyan M and EngelmannJB (2011) Cultural differences in affectintensity perception in the context ofadvertising. Front. Psychology 2:313. doi:10.3389/fpsyg.2011.00313This article was submitted to Frontiersin Cultural Psychology, a specialty ofFrontiers in Psychology.Copyright © 2011 Pogosyan and Engel-mann. This is an open-access article sub-ject to a non-exclusive license between theauthors and Frontiers Media SA, whichpermits use, distribution and reproduc-tion in other forums, provided the originalauthors and source are credited and otherFrontiers conditions are complied with.
www.frontiersin.org November 2011 | Volume 2 | Article 313 | 13

Pogosyan and Engelmann Cultural differences in affect intensity perception
APPENDIXSTIMULUS VALIDATION ANALYSIS
Table A1 | Results from post hoc stimulus validation analysis.
Model pairs Mean difference SEM difference t df p-Value
2-Tailed 1-Tailed
Pair 1: HAP_H_1 – HAP_L_1 1.147540983672 0.147128885461 7.800 60 0.000* 0.000**
Pair 2: HAP_H_2 – HAP_L_2 0.311475409803 0.126094203572 2.470 60 0.016* 0.008**
Pair 3: HAP_H_3 – HAP_L_3 1.644808743230 0.154446118991 10.650 60 0.000* 0.000**
Pair 4: HAP_H_4 – HAP_L_4 1.207650273262 0.154504109990 7.816 60 0.000* 0.000**
Pair 5: HAP_H_5 – HAP_L_5 1.437158469885 0.145263402838 9.893 60 0.000* 0.000**
Pair 6: HAP_H_6 – HAP_L_6 1.125683060098 0.141155766739 7.975 60 0.000* 0.000**
Pair 7: HAP_H_7 – HAP_L_7 0.841530054672 0.161129618446 5.223 60 0.000* 0.000**
Pair 8: HAP_H_8 – HAP_L_8 1.273224043689 0.130504647686 9.756 60 0.000* 0.000**
Pair 9: HAP_H_9 – HAP_L_9 0.612021857967 0.173569323714 3.526 60 0.001* 0.000**
Pair 10: HAP_H_10 – HAP_L_10 1.562841530066 0.133501938860 11.707 60 0.000* 0.000**
Pair 11: HAP_H_11 – HAP_L_11 0.912568306016 0.166921779134 5.467 60 0.000* 0.000**
*All tests survived a FDR corrected (-level of 0.05, **all tests survived a FDR corrected (-level of 0.01. Paired differences between HAP ratings for high compared to
LA facial expressions for each model pair across all participants independent of culture are shown. Analyses tested the directional hypothesis that images classified
as HA facial expressions were indeed perceived as significantly higher arousal (HAP) than LA facial expressions for each model pair. In order not to bias the current
validation analysis toward one culture, we included results from all participants, independent of culture. Results show significantly higher HAP ratings for HA faces
compared to LA faces for all model pairs included in the current investigation. Results survived corrections for multiple comparisons (Ntests = 11) using false discovery
rate (FDR) correction at an ( level of 0.01 for one-tailed tests (although the tests were directional, two-tailed results are also reported, which survived an FDR correction
at an ( level of 0.05).
ANALYSES OF IPSATIZED DATAIn order to control for potential cultural differences in rating style and response set bias (e.g., Hofstede, 1980; Chen et al., 1995),all data were standardized and reanalyzed. Specifically, to control for two types of bias that could systematically affect emotion rat-ings across culture, namely (a) an extreme response style that is characterized by a tendency to use the endpoints of a scale and (b)acquiescence response bias that is characterized by a shift to either end of a scale, we employed ipsatization as our method of stan-dardizing raw scores. Ipsatization was implemented within-subject by subtracting each participant’s grand mean for all 198 items (22images × 9 ratings) from his or her raw scores for each item and dividing this difference by the standard deviation across all items[y ips = (x − (individual)/(individual] (e.g., Yik and Russell, 2003; see also Hicks, 1970; Hofstede, 1980; Chan, 2003; Fischer, 2004). Ipsatizedindividual scores were then averaged across models to create mean scores in each rating category (HAP, POS, LAP). Results from thisre-analysis of the data supported findings obtained in analyses of the raw data reported in the main paper. Since the logic of there-analysis of the data follows that outlined in the main paper, each analysis step is only briefly summarized in the header of the tablesummarizing each model.
Table A2 | Omnibus MANOVA for mean ipsatized scores.
Effect Wilk’s lambda F Hypothesis df Error df p-Value η2p
Arousal level 0.318 124.381a 1.000 58.000 0.000 *** 0.682
Arousal level × culture 0.853 5.008a 2.000 58.000 0.010 ** 0.147
Intensity category 0.263 79.830a 2.000 57.000 0.000 *** 0.737
Intensity category × culture 0.793 3.497a 4.000 114.000 0.010 ** 0.106
Arousal level × intensity category 0.264 79.362a 2.000 57.000 0.000 *** 0.736
Arousal level × intensity category × culture 0.667 6.385a 4.000 114.000 0.000 *** 0.166
aExact statistic. *p < 0.05; **p < 0.01; ***p < 0.001. Mean ipsatized scores in each emotion intensity category were entered into a three-way mixed multivariate
analysis of variance (MANOVA), with arousal level (HA vs. LA facial expression) and intensity category (HAP, POS, LAP) as within-subjects factors, as well as culture
(American, Russian, Japanese) as between-subjects factor. The table shows significant main effects for all factors included in the model, including intensity category
and arousal level. In contrast to the main paper, a main effect of culture [F(2,58) = 9.152, p < 0.001, η2 = 0.24] was also observed. Furthermore, all two- and three-way
interactions were significant.
Frontiers in Psychology | Cultural Psychology November 2011 | Volume 2 | Article 313 | 14

Pogosyan and Engelmann Cultural differences in affect intensity perception
Table A3 | Between-subjects MANOVA testing the effect of culture on mean ipsatized ratings.
Effect Wilk’s lambda F Hypothesis df Error df p-Value η2p
Culture 0.360 5.885a 12.000 106.000 0.000 *** 0.400
aExact statistic.*p < 0.05; **p < 0.01; ***p < 0.001. Investigations of the nature of the three-way interaction obtained in the omnibus MANOVA focused on identifying
the effects of culture on mean ipsatized ratings and followed the following sequence: first, to investigate general effects of culture on ratings within each intensity
category as a function of arousal level, a between-subjects MANOVA was performed with culture as predictor variable and ratings across intensity category and
arousal level as multiple dependent variables [HAP_LA, POS_LA, LAP_LA, HAP_HA, POS_HA, LAP_HA]. As shown in the table, a significant effect of culture was
obtained.
Table A4 | Univariate tests of simple effects.
Source Dependent variable Hypothesis df Error df Mean square (error) F p-Value η2p
Corrected model, culture HAP_L 2 58 1.420 (0.114) 12.407 0.000*** 0.300
POS_L 2 58 0.026 (0.090) 0.294 0.747 0.010
LAP_L 2 58 0.034 (0.109) 0.315 0.731 0.011
HAP_H 2 58 0.565 (0.097) 5.841 0.005** 0.168
POS_H 2 58 0.491 (0.058) 8.519 0.001** 0.227
LAP_H 2 58 0.403 (0.119) 3.393 0.040* 0.105
*p < 0.05; **p < 0.01; ***p < 0.001. Given the significant effect of culture obtained in the between-subjects MANOVA reported inTable A3, indicating the presence
of cultural differences in at least one of the rating categories, univariate tests of simple effects were conducted to identify rating categories that show a significant
effect of culture. Results that confirm those reported in the main paper are shown in bold, but additional significant effects were also obtained after ipsatization and
include effects of culture on ratings of HA images in the HAP and POS rating categories.
www.frontiersin.org November 2011 | Volume 2 | Article 313 | 15

Pogosyan and Engelmann Cultural differences in affect intensity perception
Table A5 | Post hoc comparisons of ipsatized scores were conducted following the logic outlined in the main paper.
Dependent variable (I) Culture (J) Culture Mean difference (I–J) SE p-Value
HAP_L JP RU −0.01734912601 0.108655681689 0.874
US 0.43972486946* 0.107509895556 0.000 ***
RU JP 0.01734912601 0.108655681689 0.874
US 0.45707399547* 0.103199900190 0.000***
US JP −0.43972486946* 0.107509895556 0.000***
RU −0.45707399547* 0.103199900190 0.000***
HAP_H JP RU −0.28008737204* 0.099884685858 0.007**
US −0.31286846172* 0.098831390842 0.002**
RU JP 0.28008737204* 0.099884685858 0.007**
US −0.03278108968 0.094869310566 0.731
US JP 0.31286846172* 0.098831390842 0.002**
RU 0.03278108968 0.094869310566 0.731
POS_H JP RU 0.14499554188 0.077100687125 0.065
US −0.15709977785* 0.076287651886 0.044*
RU JP −0.14499554188 0.077100687125 0.065
US −0.30209531973* 0.073229334096 0.000***
US JP 0.15709977785* 0.076287651886 0.044*
RU 0.30209531973* 0.073229334096 0.000***
LAP_H JP RU 0.28551301603* 0.110708936201 0.012*
US 0.11993161801 0.109541498273 0.278
RU JP −0.28551301603* 0.110708936201 0.012*
US −0.16558139802 0.105150057396 0.121
US JP −0.11993161801 0.109541498273 0.278
RU 0.16558139802 0.105150057396 0.121
*p < 0.05; **p < 0.01; ***p < 0.001. Results largely confirmed those reported in the main paper as shown in bold, except for removing a significant difference between
Japanese and American participants when rating HA images in the LAP domain. Ipsatization also led to a number of additional findings, indicating cultural differences
in further rating categories for HA faces compared to the main paper.These include significant cultural differences when HA images were rated in (1) the HAP domain,
showing that Japanese participants rated HA images as significantly less HAP than Russian and American participants, and (2) in the POS domain, such that US
participants rated HA images as significantly more POS than Japanese and Russian participants.
ANALYSES OF INTENSITY DIFFERENCES SCORES BASED ON IPSATIZED DATA
Table A6 | Omnibus MANOVA for intensity difference scores of ipsatized data.
Effect Wilk’s lambda F Hypothesis df Error df p-Value η2p
Intensity_Category 0.264 79.362a 2.000 57.000 0.000*** 0.736
Intensity_Category * Culture 0.667 6.385a 4.000 114.000 0.000*** 0.183
aExact statistic. *p < 0.05; **p < 0.01; ***p < 0.001. Intensity difference scores of ipsatized data were entered into a mixed two-way MANOVA with intensity category
(HA–LA) facial expression in HAP rating category, HA–LA_POS, HA-LA_LAP) as within-subjects factor and culture (American, Japanese, Russian) as between-subjects
factor. Similar to results reported in the main paper, results based on ipsatized data yielded significant main effects of intensity category and culture [F(2,58) = 5.008,
p = 0.01, η2 = 0.147], as well as an interaction between intensity category and culture.
Frontiers in Psychology | Cultural Psychology November 2011 | Volume 2 | Article 313 | 16

Pogosyan and Engelmann Cultural differences in affect intensity perception
Table A7 | Between-subjects MANOVA to investigate the effects of culture on intensity difference scores from ipsatized data.
Effect Wilk’s lambda F Hypothesis df Error df p-Value η2p
Culture 0.562 6.244a 6.000 112.000 0.000*** 0.251
aExact statistic.*p < 0.05; **p < 0.01; ***p < 0.001. Investigations of the nature of the two-way interaction obtained in the omnibus MANOVA focused on identifying
the effects of culture on ipsatized difference scores and followed the following sequence: first, to investigate general effects of culture on intensity difference scores
within each intensity category, a between-subjects MANOVA was performed with culture as predictor variable and difference scores across intensity category as
multiple dependent variables [HA–LA_HAP (Rating differences in the HAP domain for high vs. LA facial expression), HA–LA_POS, HA–LA_LAP]. As shown in the
table, a significant effect of culture was obtained.
Table A8 | Univariate tests of simple effects of intensity difference scores from ipsatized data.
Source Dependent variable Hypothesis df Error df Mean square (error) F p-Value η2p
Corrected model, culture HAP_HvL 2 58 2.961 (0.223) 13.277 0.000*** 0.314
POS_HvL 2 58 0.542 (0.191) 2.841 0.067 0.089
LAP_HvL 2 58 0.667 (0.269) 2.484 0.092 0.079
*p < 0.05; **p < 0.01; ***p < 0.001. Given the significant effect of culture obtained in the between-subjects MANOVA reported inTable A7, indicating the presence
of cultural differences for intensity difference scores in at least one of the intensity categories, univariate tests of simple effects were conducted to identify those
rating categories that show a significant effect of culture. Results show a significant effect of culture on intensity difference scores in the HAP domain, confirming
those reported in the main paper, as shown in bold.
Table A9 | Post hoc comparisons of intensity difference scores from ipsatized data.
Dependent variable (I) Culture (J) Culture Mean difference (I–J) SE p-Value
HAP H–L JP RU −0.2627 0.15169 0.089
US −0.7526* 0.15009 0.000***
RU JP 0.2627 0.15169 0.089
US −0.4899* 0.14408 0.001***
US JP 0.7526* 0.15009 0.000***
RU 0.4899* 0.14408 0.001***
POS H–L JP RU 0.2139 0.14028 0.133
US −0.0982 0.13880 0.482
RU JP −0.2139 0.14028 0.133
US −0.3121* 0.13324 0.023*
US JP 0.0982 0.13880 0.482
RU 0.3121* 0.13324 0.023*
LAP H–L JP RU 0.3694* 0.16645 0.030*
US 0.1704 0.16469 0.305
RU JP −0.3694* 0.16645 0.030*
US −0.1990 0.15809 0.213
US JP −0.1704 0.16469 0.305
RU 0.1990 0.15809 0.213
*p < 0.05; **p < 0.01; ***p < 0.001. Post hoc tests were performed to identify the effects of culture on intensity difference scores within each intensity category that
showed significant or marginally non-significant effects. All results confirm those reported in the main paper as shown in bold. One additional marginally non-significant
effect was observed, indicating that in the HAP domain, intensity difference scores between high and LA facial expressions of Japanese participants also differed
from those of Russian participants.
www.frontiersin.org November 2011 | Volume 2 | Article 313 | 17
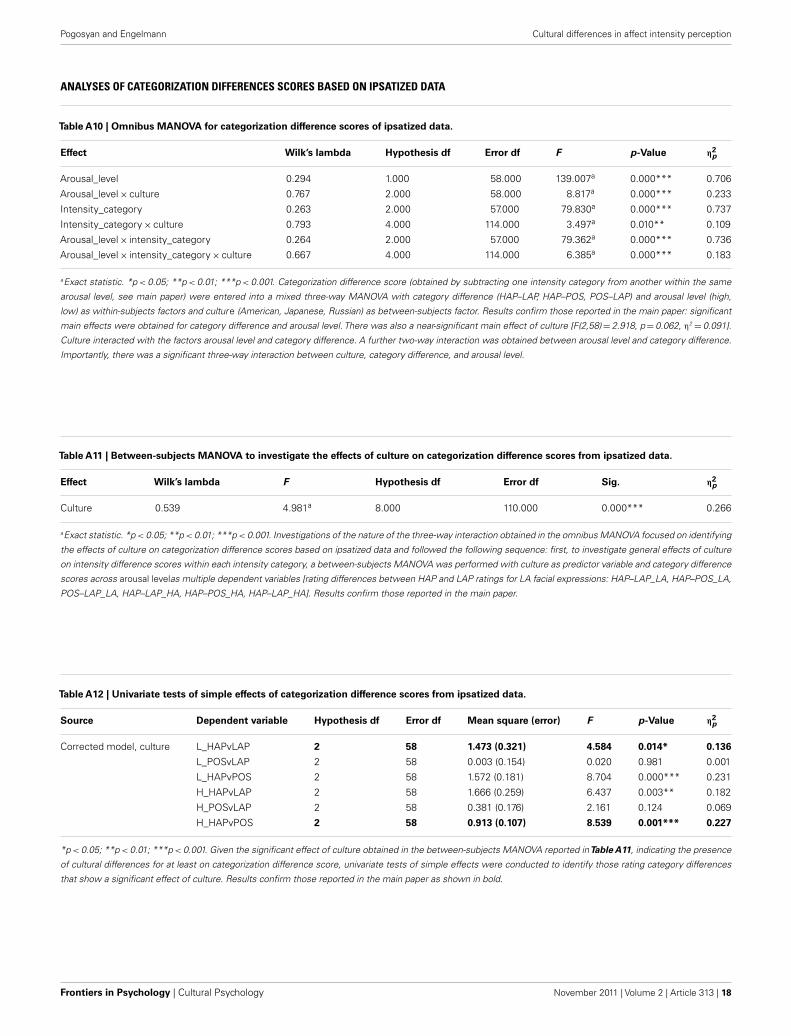
Pogosyan and Engelmann Cultural differences in affect intensity perception
ANALYSES OF CATEGORIZATION DIFFERENCES SCORES BASED ON IPSATIZED DATA
Table A10 | Omnibus MANOVA for categorization difference scores of ipsatized data.
Effect Wilk’s lambda Hypothesis df Error df F p-Value η2p
Arousal_level 0.294 1.000 58.000 139.007a 0.000*** 0.706
Arousal_level × culture 0.767 2.000 58.000 8.817a 0.000*** 0.233
Intensity_category 0.263 2.000 57.000 79.830a 0.000*** 0.737
Intensity_category × culture 0.793 4.000 114.000 3.497a 0.010** 0.109
Arousal_level × intensity_category 0.264 2.000 57.000 79.362a 0.000*** 0.736
Arousal_level × intensity_category × culture 0.667 4.000 114.000 6.385a 0.000*** 0.183
aExact statistic. *p < 0.05; **p < 0.01; ***p < 0.001. Categorization difference score (obtained by subtracting one intensity category from another within the same
arousal level, see main paper) were entered into a mixed three-way MANOVA with category difference (HAP–LAP, HAP–POS, POS–LAP) and arousal level (high,
low) as within-subjects factors and culture (American, Japanese, Russian) as between-subjects factor. Results confirm those reported in the main paper: significant
main effects were obtained for category difference and arousal level. There was also a near-significant main effect of culture [F(2,58) = 2.918, p = 0.062, η2 = 0.091].
Culture interacted with the factors arousal level and category difference. A further two-way interaction was obtained between arousal level and category difference.
Importantly, there was a significant three-way interaction between culture, category difference, and arousal level.
Table A11 | Between-subjects MANOVA to investigate the effects of culture on categorization difference scores from ipsatized data.
Effect Wilk’s lambda F Hypothesis df Error df Sig. η2p
Culture 0.539 4.981a 8.000 110.000 0.000*** 0.266
aExact statistic. *p < 0.05; **p < 0.01; ***p < 0.001. Investigations of the nature of the three-way interaction obtained in the omnibus MANOVA focused on identifying
the effects of culture on categorization difference scores based on ipsatized data and followed the following sequence: first, to investigate general effects of culture
on intensity difference scores within each intensity category, a between-subjects MANOVA was performed with culture as predictor variable and category difference
scores across arousal levelas multiple dependent variables [rating differences between HAP and LAP ratings for LA facial expressions: HAP–LAP_LA, HAP–POS_LA,
POS–LAP_LA, HAP–LAP_HA, HAP–POS_HA, HAP–LAP_HA]. Results confirm those reported in the main paper.
Table A12 | Univariate tests of simple effects of categorization difference scores from ipsatized data.
Source Dependent variable Hypothesis df Error df Mean square (error) F p-Value η2p
Corrected model, culture L_HAPvLAP 2 58 1.473 (0.321) 4.584 0.014* 0.136
L_POSvLAP 2 58 0.003 (0.154) 0.020 0.981 0.001
L_HAPvPOS 2 58 1.572 (0.181) 8.704 0.000*** 0.231
H_HAPvLAP 2 58 1.666 (0.259) 6.437 0.003** 0.182
H_POSvLAP 2 58 0.381 (0.176) 2.161 0.124 0.069
H_HAPvPOS 2 58 0.913 (0.107) 8.539 0.001*** 0.227
*p < 0.05; **p < 0.01; ***p < 0.001. Given the significant effect of culture obtained in the between-subjects MANOVA reported inTable A11, indicating the presence
of cultural differences for at least on categorization difference score, univariate tests of simple effects were conducted to identify those rating category differences
that show a significant effect of culture. Results confirm those reported in the main paper as shown in bold.
Frontiers in Psychology | Cultural Psychology November 2011 | Volume 2 | Article 313 | 18
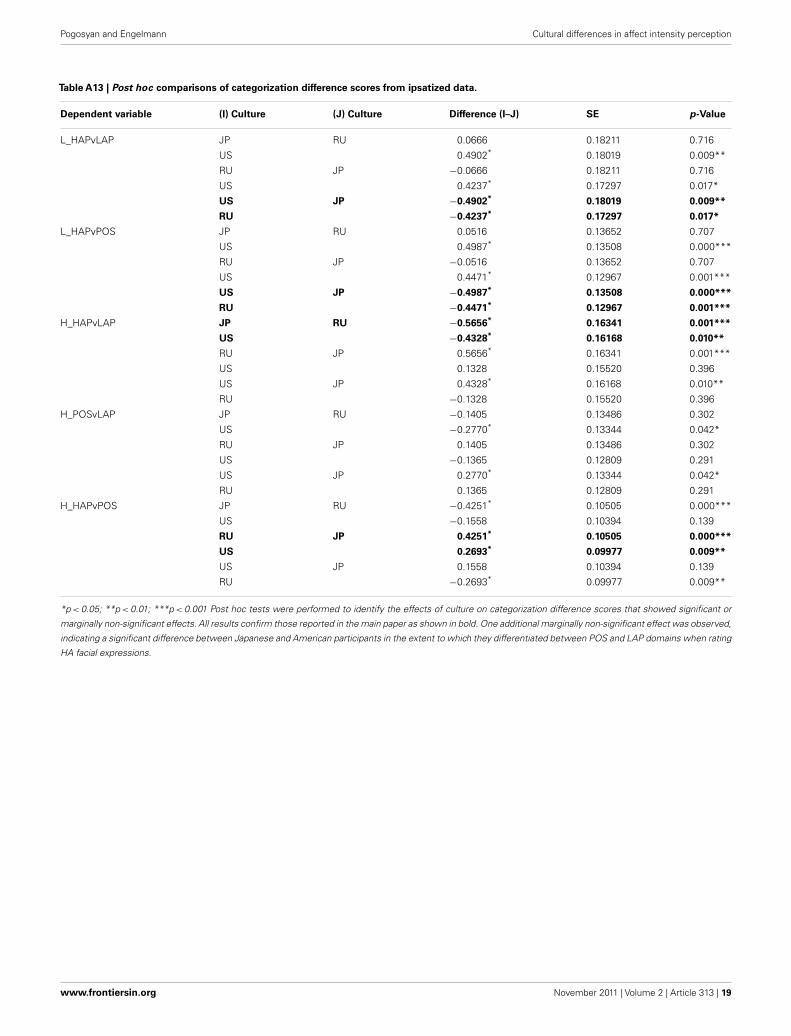
Pogosyan and Engelmann Cultural differences in affect intensity perception
Table A13 | Post hoc comparisons of categorization difference scores from ipsatized data.
Dependent variable (I) Culture (J) Culture Difference (I–J) SE p-Value
L_HAPvLAP JP RU 0.0666 0.18211 0.716
US 0.4902* 0.18019 0.009**
RU JP −0.0666 0.18211 0.716
US 0.4237* 0.17297 0.017*
US JP −0.4902* 0.18019 0.009**
RU −0.4237* 0.17297 0.017*
L_HAPvPOS JP RU 0.0516 0.13652 0.707
US 0.4987* 0.13508 0.000***
RU JP −0.0516 0.13652 0.707
US 0.4471* 0.12967 0.001***
US JP −0.4987* 0.13508 0.000***
RU −0.4471* 0.12967 0.001***
H_HAPvLAP JP RU −0.5656* 0.16341 0.001***
US −0.4328* 0.16168 0.010**
RU JP 0.5656* 0.16341 0.001***
US 0.1328 0.15520 0.396
US JP 0.4328* 0.16168 0.010**
RU −0.1328 0.15520 0.396
H_POSvLAP JP RU −0.1405 0.13486 0.302
US −0.2770* 0.13344 0.042*
RU JP 0.1405 0.13486 0.302
US −0.1365 0.12809 0.291
US JP 0.2770* 0.13344 0.042*
RU 0.1365 0.12809 0.291
H_HAPvPOS JP RU −0.4251* 0.10505 0.000***
US −0.1558 0.10394 0.139
RU JP 0.4251* 0.10505 0.000***
US 0.2693* 0.09977 0.009**
US JP 0.1558 0.10394 0.139
RU −0.2693* 0.09977 0.009**
*p < 0.05; **p < 0.01; ***p < 0.001 Post hoc tests were performed to identify the effects of culture on categorization difference scores that showed significant or
marginally non-significant effects. All results confirm those reported in the main paper as shown in bold. One additional marginally non-significant effect was observed,
indicating a significant difference between Japanese and American participants in the extent to which they differentiated between POS and LAP domains when rating
HA facial expressions.
www.frontiersin.org November 2011 | Volume 2 | Article 313 | 19

Pogosyan and Engelmann Cultural differences in affect intensity perception
FIGURE A1 | Average ratings based on ipsatized data within each
intensity category for advertisements showing LA and HA facial
expressions across cultures. Figure A1 shows mean ratings based onipsatized data across cultures (Russian, Japanese, American) and emotion
intensity categories (HAP, POS, LAP) for low and HA facial expressions.Significant cultural differences obtained from this additional analysisconfirm those reported in the main paper and are listed in detail inTable A5 above.
Frontiers in Psychology | Cultural Psychology November 2011 | Volume 2 | Article 313 | 20

Pogosyan and Engelmann Cultural differences in affect intensity perception
FIGURE A2 | Perceptual difference scores representing mean differences between ipsatized ratings for high compared to LA facial expressions in each
intensity category across cultures. Significant cultural differences obtained from this additional analysis confirm those reported in the main paper and arelisted in detail inTable A9 above.
FIGURE A3 | Cultural differences in mean category difference scores based on ipsatized data as a function of arousal intensity of facial expressions.
Significant cultural differences obtained from this additional analysis confirm those reported in the main paper and are listed in detail inTable A13 above.
www.frontiersin.org November 2011 | Volume 2 | Article 313 | 21