Embed Size (px)
Citation preview


TABLE OFCONTENTS
Corporate Profile
CEO’s Statement
CFO’s Statement
Corporate Milestones
Selected Financial Data
Management Discussion and Analysis
Report of Independent Registered Public Accounting Firm
Consolidated Statements of Income and Comprehensive Income
for the years ended December 31, 2002, 2003 and 2004
Consolidated Balance Sheets as of December 31, 2003 and 2004
Consolidated Statements of Shareholders’ Equity for the years ended
December 31, 2002, 2003 and 2004
Consolidated Statements of Cash Flows for the years ended
December 31, 2002, 2003 and 2004
Notes to the Consolidated Financial Statements
Corporate Information
02
04
07
09
11
15
33
34
36
37
39
41
68

Ctrip.com International, Ltd. is a leading
consolidator of hotel accommodations and airline tickets
in China. Ctrip aggregates information
on hotels and flights and enable
customers to make informed and cost-
effective hotel and flight bookings. Ctrip
targets primarily business and leisure
travelers in China who do not travel in
group. These travelers form a traditionally under-served
yet fast-growing segment of the China travel industry.
Since its inception in 1999, Ctrip has experienced
substantial growth and become one of the best-known
travel brands in China.
The company is incorporated in the Cayman Islands and
conducts substantially all of its operations in China. With
its operational headquarter in Shanghai, it has branch
offices in Hong Kong, Beijing, Guangzhou and Shenzhen.
The company also maintains a network of sales offices in
about 37 cities in China.
CORPORATEPROFILE
02

Ctrip.com International, Ltd. Annual Report 2004Ctrip.com International, Ltd. Annual Report 2004 03
We strive tocreate
long-termshareholder
value byenhancing ourunique industy
position.

CEO’SSTATEMENT
In 2004, business and leisure travel in China
flourished, reflecting the Chinese economy’s
continued expansion. Ctrip’s record results over
the past year demonstrate our remarkable
achievements in this vibrant environment. We
have focused on our commitment to providing
independent travelers in China with superb
services, thereby providing shareholders with
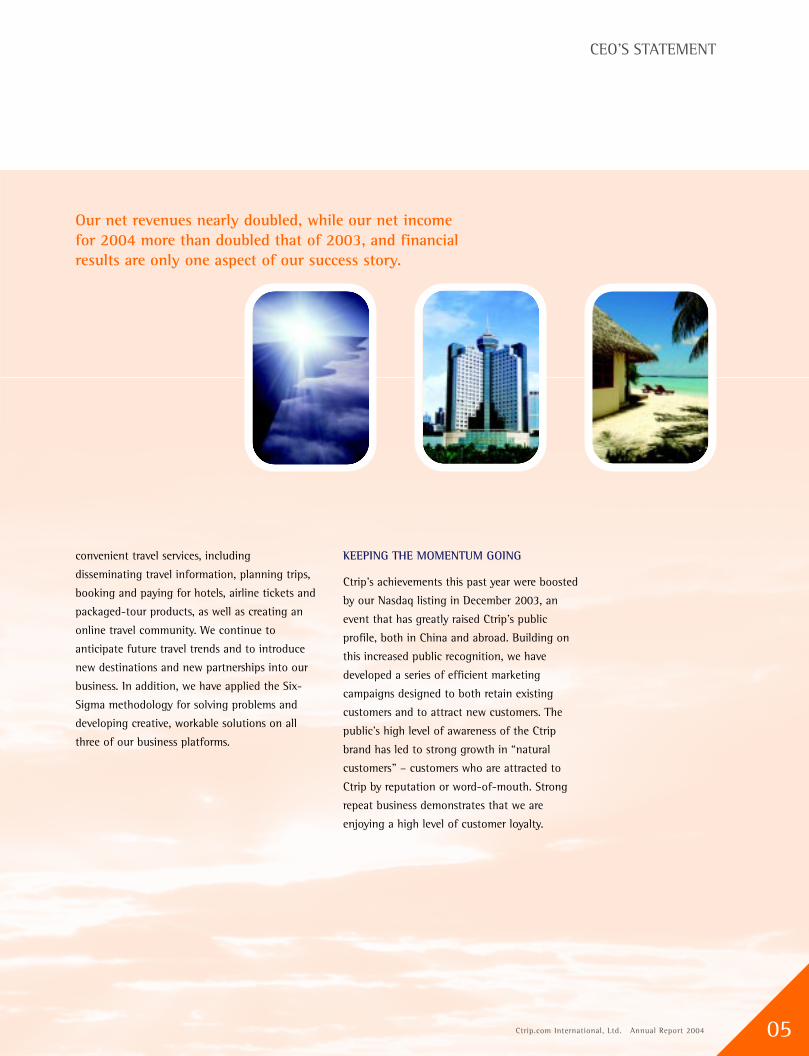
strong financial returns. Our net revenues nearly
doubled, while our net income for 2004 more
than doubled that of 2003, and financial results
are only one aspect of our success story.
TURNING VISION INTO REALITY
Ctrip was founded to cater to the emerging
independent travel market in China, one that has
been significantly underserved in the past. Ctrip
has come to dominate this market by providing
customers with a user-friendly and dependable
service that has prompted them to come back to
Ctrip repeatedly.
This past year, we spent considerable time and
effort in improving and fine-tuning Ctrip’s
systems and platforms to guarantee an
outstanding user experience. We have strived to
create a seamless flow of intuitive and
James Jianzhang Liang
Chairman and CEOCtrip.com International, Ltd.
04
Ctrip.com International, Ltd. Annual Report 2004
CEO’S STATEMENT
convenient travel services, including
disseminating travel information, planning trips,
booking and paying for hotels, airline tickets and
packaged-tour products, as well as creating an
online travel community. We continue to
anticipate future travel trends and to introduce
new destinations and new partnerships into our
business. In addition, we have applied the Six-
Sigma methodology for solving problems and
developing creative, workable solutions on all
three of our business platforms.
KEEPING THE MOMENTUM GOING
Ctrip’s achievements this past year were boosted
by our Nasdaq listing in December 2003, an
event that has greatly raised Ctrip’s public
profile, both in China and abroad. Building on
this increased public recognition, we have
developed a series of efficient marketing
campaigns designed to both retain existing
customers and to attract new customers. The
public’s high level of awareness of the Ctrip
brand has led to strong growth in “natural
customers” – customers who are attracted to
Ctrip by reputation or word-of-mouth. Strong
repeat business demonstrates that we are
enjoying a high level of customer loyalty.
Ctrip.com International, Ltd. Annual Report 2004 05
Our net revenues nearly doubled, while our net incomefor 2004 more than doubled that of 2003, and financialresults are only one aspect of our success story.

06We have expanded marketing alliances with
leading consumer brands in China over the
course of the past year. For example, in
September 2004, Ctrip and China Merchants
Bank jointly launched China’s first dual-currency
(RMB and USD) travel credit card. Designed as a
tailor-made solution for business travelers, the
card makes paying for travel services fast, easy
and convenient. For Ctrip, this alliance with
China Merchants Bank has become a highly
effective channel for reaching new customers.
Besides broadening our domestic supplier
network and increasing our proportion of
guaranteed inventory at many domestic hotels,
we have also entered into alliances with
prominent international players like Pegasus
Solutions and CNG Travel Group. These alliances
enable us to offer our fast-growing customer
base wider global product choices, and have
positioned us well for further growth in our
outbound travel business. In the coming year, we
will be exploring new destinations, both
domestic and overseas, that we believe will be
popular with independent travelers. In Hong
Kong, we are establishing a distribution
relationship with Hong Kong Disneyland, a
much-awaited destination for many mainland
China travelers. We will also start to offer a
variety of European tour packages in the second
half of 2005.
I would like to thank all of our customers,
suppliers and partners for their continued
support over the past year. I would also like to
thank our board of directors for the guidance it
has provided. Finally, special thanks are due to
Ctrip’s committed and hard-working staff, who
contributed in large part to our success. With
these high levels of continuing support, I am
confident that Ctrip’s achievements in the
coming year will outstrip even the past year’s
excellent results.
James Jianzhang Liang
Chairman and CEO
Ctrip.com International, Ltd.
CEO’S STATEMENT
Going forward, we will be exploringnew destinations, both domestic andoverseas, that we believe will bepopular with independent travalers.

Ctrip.com International, Ltd. Annual Report 2004
Ctrip enjoyed a particularly successful year in
2004, benefiting from immense demand for
business and leisure travel across China. We
experienced strong growth in all three main
businesses – hotel reservations, air-ticketing and
packaged tours – and we were able to
outperform our competitors to a greater extent.
We increased our market share significantly,
building on the advantages offered by advanced
technology, an extensive supplier network and
infrastructure that provides nationwide coverage.
Our scalable platform has also proved its
effectiveness, enabling us to maximize
profitability while never compromising on
service quality.
Our net revenue for 2004 rose to US$40.3
million from US$20.9 million for 2003, a strong
result even taking into account the effects of the
2003 SARS outbreak. Meanwhile, net income
rose to US$16.1 million from US$6.5 million in
2003, demonstrating the scalabity of our
CFO’SSTATEMENT
business. While our gross margin remained stable
at around 85%, our operating margin rose again
year-on-year, reaching 41% from 34% in 2003.
Ctrip’s rise in business volume led to the
generation of strong cash flow, with cash flow
from operating activities amounting to US$19.5
million over the year and resulting in an end-of-
year cash balance of US$74.4 million. As a result
of this strong financial performance, the
shareholders and directors have approved
distribution of 30% of Ctrip’s 2004 net income
as dividends to shareholders.
HOTEL RESERVATION BUSINESS
Our hotel booking business continued to enjoy
very strong growth throughout the year.
Revenues from hotel reservations rose by 80%
over 2003, to US$33.4 million, reflecting
approximately 4.2 million hotel room nights
booked through Ctrip.
Ctrip.com International, Ltd. Annual Report 2004 07
Ctrip experiencedstrong growth in allits three mainbusinesses,benefiting fromimmense demandfor business andleisure travel acrossChina.
Neil Nanpeng Shen
President and CFOCtrip.com International, Ltd.

08AIR-TICKETING BUSINESS
We began investing in the air-ticketing business
significantly in early 2002 and have since reaped
strong returns – air-ticketing revenues as a
percentage of Ctrip’s total revenues increased
from 11% in 2003 to 18% in 2004. The 2004
air-ticketing revenue of US$7.6 million
represented a 210% increase over the 2003
revenue, and the actual number of air tickets
sold nearly tripled from approximately 600,000
in 2003 to approximately 1.7 million in 2004.
PACKAGED-TOUR BUSINESS
Ctrip’s packaged-tour business, our most recently
launched business line, has become a key
contributor to growth since beginning operation
in 2003. Although there are many packaged-tour
operators in China, almost all of them focus
exclusively on traditional guided tours. Our
packaged-tour business is one of the few in the
country catering to independent travelers,
especially middle- and high-end clientele. This
business showed promising development in
2004, and it is now the fastest-growing segment
amongst our businesses. Revenues from our
packaged-tour business for 2004 amounted to
US$1.3 million, a 119% increase over 2003,
representing 3% of Ctrip’s total 2004 revenues.
PROSPECTS
I am confident that the travel industry in China
will continue to perform well in the coming year,
and I believe that we are in a unique position to
benefit from this trend by leveraging the Ctrip
brand. To manage our expected growth in years
to come and to further enhance our transaction
platform and service infrastructure, we plan to
build a new information and technology center
in Shanghai’s Hong Qiao Lin Kong Economic
Development Park. We estimate that our total
aggregate investment in this project will range
between approximately US$19 million and
US$20 million from 2005 until completion of
construction around mid-2007.
We will also continue to run efficient sales and
marketing campaigns to enhance our brand
recognition and augment our customer base.
These campaigns will benefit from our ongoing
drive to expand our supply networks, especially
for our fast-growing packaged-tour business.
Ctrip is thus strategically positioning itself to tap
the potential of the dynamic and fast-growing
independent travel industry in China. By doing
this, I am confident that Ctrip will continue to
generate shareholder value, both next year and in
years to come.
Neil Nanpeng Shen
President and CFO
Ctrip.com International, Ltd.
CEO’S STATEMENT
We are in aunique position totap the potentialof the dynamicand fast-growingindependent travelindustry in China.

Ctrip.com International, Ltd. Annual Report 2004Ctrip.com International, Ltd. Annual Report 2004
CORPORATEMILESTONES
Ctrip.com International, Ltd. Annual Report 2004 09
YEAR ACHIEVEMENTS
June 1999 � Company founded with headquarter
in Shanghai
October 1999 � Official launch of Website:
www.ctrip.com
October 2000 � Acquired Beijing Modern Express Business Travel Services Co. Ltd.
February 2002 � Acquired the air-ticketing business of Beijing Hai’an Air-ticketing Service
Company Ltd.
March 2002 � First profitable quarter
� Monthly room night bookings exceeded 100,000
August 2003 � Spun off Home Inns & Hotel Management (Hong Kong) Limited, a former
hotel management subsidiary of Ctrip
December 2003 � IPO on NASDAQ
� Monthly air ticket bookings of nearly 100,000
June 2004 � Rakuten, Inc., a leading Japanese e-commerce company listed on the
JASDAQ market, purchased approximately 20% of Ctrip’s outstanding
shares on a fully diluted basis from existing
ordinary shareholders in a private transaction
November 2004 � Approved the first dividend as a public company
(30% of annual earnings)
December 2004 � Cumulative effective customers exceeded 1 million
� Monthly room night bookings of approximately 400,000
� Monthly air ticket bookings of approximately 180,000
www.ctrip.com

1010
We targetprimarily
business andleisure travelersin China who
do not travel ingroup.

Ctrip.com International, Ltd. Annual Report 2004 11Ctrip.com International, Ltd. Annual Report 2004 11
SELECTEDFINANCIAL
DATA
The following table presents the selected
consolidated financial information for our
business. You should read the following
information in conjunction with “Management
Discussion and Analysis” included in this report.
The selected consolidated statement of
operations data for the years ended December
31, 2002, 2003 and 2004 and the selected
consolidated balance sheet data as of December
31, 2003 and 2004 have been derived from our
audited consolidated financial statements and
should be read in conjunction with those
statements, which are included in this annual
report beginning on page 34. The selected
consolidated statement of operations data for
the year ended December 31, 2001 and the
selected consolidated balance sheet data as of
December 31, 2001 and 2002 have been derived
from our audited consolidated financial
statements, which are not included in this
annual report. The selected consolidated
statement of operations data for the year ended
and the selected consolidated balance sheet data
as of December 31, 2000 are derived from our
unaudited consolidated financial statements. We
have prepared the unaudited information on the
same basis as the audited consolidated financial
statements, and have included, in our opinion,
all adjustments, consisting only of normal and
recurring adjustments that we
consider necessary for a fair
presentation of the financial
information set forth in those
statements.

1212For the Year Ended December 31,
2000 2001 2002 2003 2004 2004
RMB RMB RMB RMB RMB US$(2)
(unaudited)(in thousands, except for per share and per ADS data)
Consolidated Statement of Operation Data:Net revenues 6,453 43,984 100,049 173,147 333,820 40,333Cost of services (1,950) (7,940) (13,673) (25,654) (48,475) (5,857)
Gross profit 4,503 36,044 86,376 147,492 285,345 34,477Operating expenses
Product development (6,817) (7,759) (13,365) (20,684) (37,959) (4,586)Sales and marketing (17,378) (30,359) (32,308) (47,571) (72,863) (8,803)General and administrative (11,677) (14,814) (15,702) (19,191) (36,401) (4,398)Share-based compensation(1) — (22) (462) (1,583) (1,958) (237)Amortization of goodwill and other
intangible assets (371) (1,807) (353) (388) (493) (60)Other expenses incurred for joint
venture companies — (935) (915) — — —
Total operating expenses (36,243) (55,696) (63,105) (89,417) (149,675) (18,084)Income (loss) from operations (31,740) (19,652) 23,270 58,075 135,670 16,392Net interest income and other income 675 2,049 1,293 5,494 10,012 1,210Income (loss) before income tax benefit (expense),
minority interests and share of income(loss) of joint venture companies (31,065) (17,603) 24,563 63,569 145,682 17,602
Income tax benefit (expense) 7,088 2,342 (10,043) (10,249) (12,517) (1,512)Minority interests — — 71 (79) (39) (5)Share of income (loss) of joint venture companies — — (398) 573 — —
Net income (loss) for the year (23,977) (15,261) 14,194 53,814 133,126 16,085
Earnings Per Share and Per ADS Data:Accretion for Series B preferred shares (2,196) (14,316) (16,493) (12,366) — —Dividends to holders of preferred shares — — (16,762) — — —Deemed dividends to holders of Series A
and Series B preferred shares for spin-offof joint venture companies(3) — — — (2,829) — —
Deemed dividends upon repurchase ofpreferred shares — — — (35,336) — —
Net income (loss) attributable toordinary shareholders (26,173) (29,577) (19,061) 3,283 133,126 16,085
Earnings (loss) per share, basic (3.03) (3.26) (2.00) 0.13 4.33 0.52Earnings (loss) per share, diluted (3.03) (3.26) (2.00) 0.11 4.23 0.51Earnings (loss) per ADS(4), basic (6.06) (6.52) (4.00) 0.26 8.66 1.05Earnings (loss) per ADS(4), diluted (6.06) (6.52) (4.00) 0.22 8.46 1.02Cash dividends per share(5) — — 1.11 — — —
SELECTED FINANCIAL DATA
NET REVENUES
2000 2001 2002 2003 2004
6,45343,984
100,049
173,147
RMB, in thousands
333,820
INCOME (LOSS)FROM OPERATIONS
31,740
RMB, in thousands
2000 2001 2002 2003 2004
19,652
23,27058,075
135,670
NET INCOME (LOSS)FOR THE YEAR
RMB, in thousands
23,97715,261
14,194
53,814
133,126
2000 2001 2002 2003 2004

Ctrip.com International, Ltd. Annual Report 2004 13Ctrip.com International, Ltd. Annual Report 2004 13
As of December 31,2000 2001 2002 2003 2004 2004
RMB RMB RMB RMB RMB US$(unaudited)
(in thousands)
Consolidated Balance Sheet Data:Cash 88,908 42,464 38,931 471,969 615,875 74,413Other current assets 3,343 45,932 20,580 37,223 54,991 6,644Non-current assets 25,639 20,529 37,744 48,013 69,851 8,440Total assets 117,890 108,925 97,255 557,205 740,718 89,496Current liabilities 9,736 12,962 13,093 63,917 138,744 16,764Minority interests — — 828 564 603 73Series B preferred shares(6) 94,154 108,470 124,963 — — —Total shareholders’ equity (deficit) 14,000 (12,507) (41,629) 492,724 601,371 72,660
(1) Share-based compensation was related to the associated operating expense categories as follows:
For the Year Ended December 31,
2000 2001 2002 2003 2004 2004
RMB RMB RMB RMB RMB US$
(unaudited)
(in thousands)
Product development — 5 131 411 550 67
Sales and marketing — 1 27 136 188 23
General and administrative — 16 304 1,036 1,220 147
— 22 462 1,583 1,958 237
(2) Translation from RMB amounts into U.S. dollars was made at a rate of RMB8.2765 to US$1.00. See “Exchange Rate Information.”
(3) On August 27, 2003, we resolved to distribute all of our equity interest in Home Inns and Hotels Management (Hong Kong) Limited to the
then existing holders of our ordinary shares and Series A and Series B preferred shares on a pro rata as-converted basis based on the
carrying value of the equity interest in the amounts of RMB1,782,559, RMB808,827 and RMB2,020,237, respectively.
(4) Each ADS represents two ordinary shares.
(5) The dividends recognized represent dividends totaling RMB27.3 million distributed out of our reserves in December 2002 to holders of
ordinary shares, Series A preferred shares and Series B preferred shares on a pro rata as-converted basis. Dividends per share were
calculated on the basis of 24,630,891 ordinary shares on an as-converted basis.
(6) Prior to the forfeiture of the redemption feature in September 2003, Series B preferred shares were not included as part of shareholders’
equity as such shares were redeemable at the option of the holder.
SELECTED FINANCIAL DATA

1414EXCHANGE RATE INFORMATION
We have published our financial statements in
RMB. Our business is primarily conducted in
China in RMB. The conversion of RMB into U.S.
dollars in this annual report is based on the noon
buying rate in The City of New York for cable
transfers of RMB as certified for customs
purposes by the Federal Reserve Bank of New
York. For your convenience, this annual report
contains translations of some RMB or U.S. dollar
amounts for 2004 at US$1.00 : RMB8.2765,
which was the noon buying rate in effect as of
December 31, 2004. The prevailing rate at June
17, 2005 was US$1.00 : RMB8.2765. We make
no representation that any RMB or U.S. dollar
amounts could have been, or could be, converted
into U.S. dollars or RMB, as the case may be, at
any particular rate, the rates stated below, or at
all. The Chinese government imposes control
over its foreign currency reserves in part through
direct regulation of the conversion of RMB into
foreign exchange and through restrictions on
foreign trade.
The following table sets forth information
concerning exchange rates between the RMB
and the U.S. dollar for the periods indicated.
These rates are provided solely for your
convenience and are not necessarily the
exchange rates that we used in this annual
report or will use in the preparation of our
periodic reports or any other information to be
provided to you. The source of these rates is the
Federal Reserve Bank of New York.
SELECTED FINANCIAL DATA
Noon Buying RatePeriod Period End Average(1) Low High
(RMB per US$1.00)
2000 8.2774 8.2784 8.2799 8.27682001 8.2766 8.2770 8.2786 8.26762002 8.2800 8.2770 8.2800 8.26692003 8.2767 8.2772 8.2800 8.27652004 8.2765 8.2768 8.2771 8.2765
December 8.2765 8.2765 8.2767 8.27652005
January 8.2765 8.2765 8.2765 8.2765February 8.2765 8.2765 8.2765 8.2765March 8.2765 8.2765 8.2765 8.2765April 8.2765 8.2765 8.2765 8.2765May 8.2765 8.2765 8.2765 8.2765June (through June 17) 8.2765 8.2765 8.2765 8.2765
(1) Annual averages are calculated from month-end rates. Monthly averages are calculated using the average of the daily rates
during the relevant period.
Our business isprimarilyconducted in Chinain RMB.

Ctrip.com International, Ltd. Annual Report 2004 15
The following discussion of our financial
condition and results of operations is based upon
and should be read in conjunction with our
consolidated financial statements and their
related notes included in this annual report. This
report contains forward-looking statements.
These forward-looking statements can be
identified by terminology such as “will”,
“expects”, “anticipates”, “future”, “intends”,
“plans”, “believes”, “estimates” and similar
statements, statements that are not historical
facts, including statement about Ctrip’s beliefs
and expectations, are forward-looking
statements. Forward-looking statements involve
inherent risks and uncertainties and the
company’s actual results could differ materially
from those contained in any forward-looking
statement. In evaluating our business, you
should carefully consider the risks outlined in our
filings with the U.S. Securities and Exchange
Commission (“SEC”), including our annual report
on Form 20-F, and registration statements on
Form F-1 and F-2, as amended. We do not
undertake any obligation to update any forward-
looking statements, except as required under
applicable law.
A. OVERVIEW
We are a leading consolidator of hotel
accommodations and airline tickets in China. We
aggregate information on hotels and flights and
enable our customers to make informed and
cost-effective hotel and flight bookings. We also
offer packaged-tour products and other products
and services.
In 2004, we derived 78.0%, 17.8% and 3.0% of
our revenues from our hotel reservation, air-
ticketing and packaged-tour businesses,
respectively.
MANAGEMENTDISCUSSION AND
ANALYSIS
Major Factors Affecting the Travel Industry
A variety of factors affect the travel industry in
China, and hence our results of operations and
financial condition, including:
Growth in the Overall Economy and Demand for
Travel Services in China. We expect that our
financial results will continue to be affected by
the overall growth of the economy and demand
for travel services in China. According to the
2004 China Statistical Yearbook and the 2004
National Economic and Social Development
Statistical Communiqué published by the
National Bureau of Statistics, the gross domestic
product, or GDP, of China grew from RMB8.9
trillion (US$1.1 trillion) in 2000 to RMB13.7
trillion (US$1.7 trillion) in 2004, representing a
compound annual growth rate of 11.4%. GDP
per capita in the same period rose from
RMB7,086 (US$856) to RMB10,561 (US$1,276),
representing a 10.5% compound annual growth
rate. This growth led to a significant increase in
the demand for travel services. According to the
2004 China Statistical Yearbook and the 2004
National Economic and Social Development
Statistical Communiqué published by the
National Bureau of Statistics, domestic tourism
spending grew from RMB317.5 billion (US$38.4
billion) in 2000 to RMB471.1 billion (US$56.9
billion) in 2004, representing a compound
annual growth of 10.4%. We anticipate that
demand for travel services in China will continue
to increase substantially in the foreseeable future
as the economy in China continues to grow.
Seasonality in the Travel Service Industry. The
travel service industry is characterized by
seasonal fluctuations and accordingly our
revenues may vary from quarter to quarter. To
date, the third quarter of each year generally
contributes the highest portion of our total
We expect that ourfinancial resultswill continue to beaffected by theoverall growth ofthe economy anddemand for travelservices in China.

16revenues for the year, mainly because it coincides
with the peak business and leisure travel season.
The first quarter of each year generally
contributes the smallest portion of our total
revenues for the year due to reduced business
activity during the Chinese New Year holiday.
These seasonality trends are difficult to discern
in our historical results because our revenues
have grown substantially since inception.
However, our future results may be affected by
seasonal fluctuations in the use of our services
by our customers.
Disruptions in the Travel Industry. Individual
travelers tend to modify their travel plans based
on the occurrence of events such as:
• the outbreak of serious epidemics;
• travel-related accidents;
• bad weather;
• natural disasters;
• threats of war or incidents of terrorism;
• general economic downturns; and
• increased prices in the hotel, airline or other
travel-related industries.
Year Ended December 31,
2002 2003 2004
Revenues:
Hotel reservation 91.9% 84.0% 78.0%
Air-ticketing 5.3 11.1 17.8
Packaged-tour* 0.4 2.6 3.0
Others 2.4 2.3 1.2
Total revenues 100.0% 100.0% 100.0%
* Certain of our packaged-tour revenues in 2003 and 2004 were recorded on a gross basis. See “ – Major Factors Affecting Our
Results of Operations – Revenues – Packaged-tour.”
During the period from March 2003 through
June 2003, the economies of several countries in
Asia, including China, were severely affected by
the outbreak of SARS. Our business and our
operating results during that period were also
adversely affected.
Major Factors Affecting
Our Results of Operations
Revenues
Revenue Composition and Sources of Revenue
Growth. We have experienced significant
revenue growth since we commenced operations
in 1999. Our revenues grew from RMB6.9
million in 2000 to RMB354.0 million (US$42.8
million) in 2004, representing a compound
annual growth rate of 167.6%.
We generate our revenues primarily from the
hotel reservation and air-ticketing businesses.
The table below sets forth the revenues from our
principal lines of business as a percentage of our
revenues for the periods indicated.
MANAGEMENT DISCUSSION AND ANALYSIS
We generate ourrevenues primarilyfrom the hotelreservation and air-ticketingbusinesses.
TOTAL REVENUESYear ended December 31,2004
17.8%AIR-TICKETING 3.0%
PACKAGED-TOUR
1.2% OTHERS
78.0%HOTELRESERVATION

Ctrip.com International, Ltd. Annual Report 2004 17
month if we sell in excess of a pre-agreed
number of room nights with such hotel within
the month.
Air-Ticketing. Since early 2002, the air-ticketing
business has been growing rapidly. In 2002,
2003 and 2004, revenues from our air-ticketing
business accounted for RMB5.6 million, RMB20.3
million and RMB63.0 million (US$7.6 million),
respectively, or 5.3%, 11.1% and 17.8%,
respectively, of our revenues.
We conduct our air-ticketing business through
Beijing Ctrip, Shanghai Huacheng, Guangzhou
Guangcheng and Shenzhen Shencheng, all of
which are our affiliated entities, as well as a
network of independent air-ticketing service
companies. Currently, we recognize revenue
when a ticket is issued and delivered by one of
our affiliated entities. Prior to July 1, 2003,
when we charged Beijing Ctrip and Shanghai
Huacheng in accordance with our contractual
arrangements with them, we recognized the
amount of such charge as revenue from our air-
ticketing business. We generally receive a higher
commission rate per ticket as the total number
of tickets we sell for an airline increases, subject
to any applicable regulatory restrictions.
Packaged-tour. Our packaged-tour business has
grown rapidly in the past three years. In 2002,
2003 and 2004, revenues from our packaged-
tour business accounted for RMB0.4 million,
RMB4.8 million and RMB10.5 million (US$1.3
million). We conduct our packaged-tour business
mainly through Shanghai Huacheng and
Shanghai Ctrip Charming, an entity we acquired
in the fourth quarter of 2003. Currently,
Shanghai Huacheng and Shanghai Ctrip
Charming receive referral fees from travel
suppliers for packaged-tour products and
services sold through our transaction and service
MANAGEMENT DISCUSSION AND ANALYSIS
As we generally do not take ownership of the
products and services being sold and act as
agent in substantially all of our transactions, our
risk of loss due to obligations for cancelled hotel
and airline ticket reservations is minimal.
Accordingly, we recognize revenues primarily
based on commissions earned rather than
transaction value.
Because current PRC laws and regulations
impose substantial restrictions on foreign
ownership of air-ticketing, travel agency,
advertising and Internet content provision
businesses in China, we conduct part of our air-
ticketing and packaged-tour businesses through
our affiliated Chinese entities. Historically, we
generated a portion of our revenues from fees
charged to these entities. See “ – Affiliated
Chinese Entities” for a description of our
relationship with these entities.
Hotel Reservation. Revenues from our hotel
reservation business have been our primary
source of revenue since our inception. In 2002,
2003 and 2004, revenues from our hotel
reservation business accounted for RMB96.8
million, RMB153.4 million and RMB276.0
million (US$33.4 million), respectively, or 91.9%,
84.0% and 78.0%, respectively, of our revenues.
We derive our hotel reservation revenues through
commissions from hotels, primarily based on the
room rates paid by our customers. We recognize
revenue when we receive confirmation from a
hotel that a customer who booked the hotel
through us has checked into the hotel. While we
generally agree in advance on fixed commissions
with a particular hotel, we also enter into a
commission arrangement with many of our hotel
suppliers that we refer to as the “ratchet system.”
Under the ratchet system, our commission per
room night for a given hotel increases for the
GROWTH OF HOTELRESERVATION REVENUE
Year ended December 31
2002 2003 2004
96.8153.4
RMB, in millions
276.0
GROWTH OFAIR-TICKETING REVENUE
Year ended December 31
2002 2003 2004
5.6
20.3
RMB, in millions
63.0
GROWTH OFPACKAGED-TOUR
REVENUEYear ended December 31
2002 2003 2004
0.4
4.8
RMB, in millions
10.5

18
MANAGEMENT DISCUSSION AND ANALYSIS
platform. Referral fees are recognized as net
revenues after the packaged-tour services are
rendered. Shanghai Huacheng and Shanghai
Ctrip Charming also, from time to time, act as
principal in connection with the packaged-tour
services provided by them. When Shanghai
Huacheng and Shanghai Ctrip Charming act as
principal, they recognize gross amounts received
from customers as revenues after the packaged-
tour services are rendered. Prior to July 1, 2003,
however, when we charged Shanghai Huacheng
in accordance with our contractual
arrangements with it, we recognized the
amount of such charge as revenue from our
packaged-tour business.
Other Businesses. Our other business lines
primarily consist of advertising services and sales
of our VIP membership cards. We place our
customers’ advertisements on our websites and
in our introductory brochures. We sell VIP
membership cards that allow cardholders to
enjoy certain priority in obtaining our services
and receive discounts from many restaurants,
clubs and bars in many cities in China. We
currently conduct the advertising business
through Ctrip Commerce, and we recognize
revenue when Ctrip Commerce renders
advertising services. Prior to July 1, 2003,
however, we recognized our advertising
revenue when we charged Ctrip Commerce in
accordance with our contractual arrangements
with it. We recognize revenue from sales of
our VIP membership cards when they are sold
to customers.
Cost of Services
Cost of services are costs directly attributable to
rendering our revenues, which consist primarily
of payroll compensation, telecommunication
expenses and other direct expenses incurred in
connection with our transaction and service
platform. Payroll compensation accounted for
57.0%, 61.1% and 63.4% of our cost of services
in 2002, 2003 and 2004, respectively.
Telecommunication expenses accounted for 30.5%,
26.5% and 19.8% of our cost of services in
2002, 2003 and 2004, respectively.
Cost of services accounted for 13.7%, 14.8%
and 14.5% of our net revenues in 2002, 2003
and 2004, respectively. We believe our relatively
low ratio of cost of services to revenues is
primarily due to competitive labor costs in
China and relatively high efficiency of our
customer service system. Our cost efficiency was
further enhanced by our website operations,
which require significantly fewer service staff to
operate and maintain.
We believe ourrelatively low ratioof cost of servicesto revenues isprimarily due tocompetitive laborcosts in China andrelatively highefficiency of ourcustomer servicesystem.

Ctrip.com International, Ltd. Annual Report 2004 19
MANAGEMENT DISCUSSION AND ANALYSIS
Operating Expenses
Operating expenses consist primarily of product
development expenses, sales and marketing
expenses, general and administrative expenses
and share-based compensation.
Product development expenses primarily include
expenses we incur to develop our travel suppliers
network and expenses we incur to develop,
maintain and monitor our transaction and
service platform.
Sales and marketing expenses primarily comprise
payroll compensation and benefits for our sales
and marketing personnel, advertising expenses,
commissions for our marketing partners for
referring customers to us, production costs of
marketing materials and membership cards and
expenses associated with our membership reward
program. Our sales and marketing expenses as a
percentage of net revenues have declined over
the past three years due to our more effective
and focused marketing efforts.
General and administrative expenses consist
primarily of payroll compensation, benefits
and travel expenses for our administrative
staff, administrative office expenses, as well
as professional service fees. General and
administrative expenses as a percentage of
net revenues have decreased over the past
three years.
Share-based compensation is the difference, if
any, between the estimated fair value of our
ordinary shares and the amount an employee is
required to pay to acquire the shares, as
determined on the date the share option is
granted. We amortize share-based compensation
and charge it to expense over the three-year
vesting period of the underlying options. We will
adopt SFAS 123R beginning from January 1,
2006, and could have ongoing accounting
charges significantly greater than those we
would have recorded under our current method
of accounting for share options.
Income Taxes and Financial Subsidies
Income Taxes. Pursuant to the applicable tax laws
in China, companies established in China are
generally subject to the state enterprise income
tax, or EIT, at a statutory rate of 33%. Our
subsidiary Ctrip Computer Technology is
currently entitled to a 15% EIT rate because it
has been classified as a “new and high
technology enterprise.” Ctrip Computer
Technology’s qualification as a “new and high
technology enterprise” is subject to annual re-
assessment by relevant government authorities.
In addition, our subsidiary Ctrip Travel
Information is currently entitled to a 15% EIT
rate due to its registration in the Pudong
Economic Development Zone, which rate is
further reduced by 50% for each of the years
from 2005 to 2007 because it has been classified
as a “software enterprise.” Ctrip Travel
Information’s qualification as a “software
enterprise” is subject to annual re-assessment by
relevant government authorities.
Financial Subsidies. In 2002, 2003 and 2004, our
subsidiaries in China received business tax
rebates in the form of financial subsidies from
the government authorities in Shanghai in the
amount of RMB783,900, RMB4,991,204 and
RMB6,165,086 (US$744,890), respectively, which
we recorded as other income. We cannot assure
you, however, that our subsidiaries will continue
to receive such business tax rebates or other
financial subsidies in the future.

20
MANAGEMENT DISCUSSION AND ANALYSIS
Critical Accounting Policies
We prepare financial statements in conformity
with U.S. GAAP, which require us to make
estimates and assumptions that affect the
reported amounts of assets and liabilities,
disclosure of contingent assets and liabilities on
the date of the financial statements and the
reported amounts of revenues and expenses
during the financial reporting period. We
continually evaluate these estimates and
assumptions based on the most recently available
information, our own historical experience and
on various other assumptions that are believed to
be reasonable under the circumstances, the
results of which form the basis for making
judgments about the carrying values of assets
and liabilities that are not readily apparent from
other sources. Since the use of estimates is an
integral component of the financial reporting
process, actual results could differ from those
estimates. Some of our accounting policies
require higher degrees of judgment than others
in their application. We consider the policies
discussed below to be critical to an
understanding of our financial statements as
their application places the most significant
demands on management’s judgment.
Revenue Recognition. We describe our revenue
recognition policies in Note 2l to our
consolidated financial statements. In considering
Staff Accounting Bulletin No. 104, “Revenue
Recognition in Financial Statements” and
Emerging Issues Task Force 99-19 “Reporting
Revenue Gross as a Principal versus Net as an
Agent,” we believe that our policies for revenue
recognition and presentation of statement of
operations are appropriate. The factors we have
considered include whether we are able to
achieve the pre-determined specific performance
targets by travel suppliers for recognition of the
incentive commissions in addition to the fixed-
rate and our risk of loss due to obligations for
cancelled hotel and airline ticket reservations. As
we operate primarily as agent to the travel
suppliers and our risk of loss due to obligations
for cancelled hotel and airline ticket
reservations is minimal, we recognize
commissions on a net basis.

Ctrip.com International, Ltd. Annual Report 2004 21
MANAGEMENT DISCUSSION AND ANALYSIS
Goodwill, Intangible Assets and Long-Lived Assets.
In addition to the original cost of goodwill,
intangible assets and long-lived assets, the
recorded value of these assets is impacted by a
number of policy elections, including estimated
useful lives, residual values and impairment
charges. Statement of Financial Accounting
Standards No. 142 provides that intangible assets
that have indefinite useful lives and goodwill will
not be amortized but rather will be tested at
least annually for impairment. Statement of
Financial Accounting Standards No. 144,
“Accounting for the Impairment or Disposal of
Long-lived Assets” requires that long-lived assets
be reviewed for impairment whenever events or
changes in circumstances indicate that the
carrying amount of an asset may not be
recoverable from its undiscounted future cash
flow. For each of 2002, 2003 and 2004, we did
not recognize any impairment charges for
goodwill, intangible assets or long-lived assets.
If different judgments or estimates had been
utilized, material differences could have
resulted in the amount and timing of the
impairment charge.
Customer Reward Program. We have a customer
reward program as described in Note 2k to our
consolidated financial statements included
elsewhere in this annual report. Provisions of the
customer reward program allow customers to
receive travel awards and other gifts based on
accumulated membership points that vary
depending on the products and services
purchased by the customers. Because we have an
obligation to provide such travel awards and
other gifts, we recognize a liability and
corresponding expense for the related future
obligations. As of December 31, 2003 and 2004,
our provisions for the customer reward program
were RMB4,708,670 and RMB10,462,103
(US$1,264,073), respectively. We estimate our
liabilities under our customer reward program
based on accumulated membership points and
our estimate of probability of redemption. If
actual redemption differs significantly from our
estimate, it will result in an adjustment to our
liability and the corresponding expense.
We work withleading brands inChina to reach newcustomers.

22
MANAGEMENT DISCUSSION AND ANALYSIS
Share-Based Compensation. We have share option
plans to grant share options to officers, directors,
and employees of our company. We account for
these plans under Accounting Principles Board
Opinion No. 25, the intrinsic value approach,
with the required disclosures under the related
accounting guidance described in Note 2p to our
consolidated financial statements included
elsewhere in this annual report. For 2002, 2003
and 2004, we recognized share-based
compensation under the share option plans in
the amounts of RMB462,140, RMB1,583,409
and RMB1,958,022 (US$236,576), respectively.
While we believe that the share-based
compensation we recognized for the plans under
Accounting Principles Board Opinion No. 25 is
appropriate, changes in our assumptions,
including estimated fair value of our ordinary
shares, will result in an adjustment to our
deferred share-based compensation and the
corresponding share-based compensation. In
December 2004, FASB issued FASB Statement
No. 123(R), Share-Based Payment, which requires
a public company to recognize, as an expense,
the fair value of share options and other share-
based compensation to employees at the
beginning of the first annual period after June
15, 2005 based on the vesting terms of the
share-based awards. Currently, we record share-
based compensation to the extent that the fair
value of the shares on the date of grant exceeds
the exercise price of the option. We recognize
compensation expense over the related vesting
periods. Beginning in 2006, we could have
ongoing accounting charges significantly greater
than those we would have recorded under our
current method of accounting for share options.
Loans to Directors and Officers. We make certain
long-term loans to a director and two senior
executives of our company for the purpose of
establishing and/or acquiring several affiliated
Chinese entities, which are used to facilitate our
air-ticketing, packaged-tour, Internet content
provision and advertising services, where foreign
ownership is restricted. To the extent losses are
incurred by these affiliated entities, we accrue for
such losses by recording valuation allowances
against the long-term loans to the director and
senior executives. For 2002, 2003 and 2004, we
did not record any valuation allowances for
losses incurred by our affiliated Chinese entities.
To the extent that the Chinese regulations
change or the business conditions of these
affiliated entities deteriorate, valuation
allowances may be required. For more
information about these loans, see “Major
Shareholders and Related Party Transactions.”
Deferred Tax Valuation Allowances. We have not
recorded any valuation allowances to reduce our
deferred tax assets, as we believe that our
deferred tax asset amounts are more than likely
to be realized based on our estimate of future
taxable income and prudent and feasible tax
planning strategies. As of December 31, 2003
and 2004, we recorded deferred tax assets of
RMB541,300 and RMB1,009,403 (US$121,960),
respectively. In 2002, we utilized deferred tax
assets of RMB9,244,836, accumulated from our
operations during prior years, primarily
relating to net operating losses carry-
forwards. If, however, unexpected events
occur in the future that would prevent us
from realizing all or a portion of our net
deferred tax assets, an adjustment would
result in a charge to income in the period in
which such determination was made.

Ctrip.com International, Ltd. Annual Report 2004 23
MANAGEMENT DISCUSSION AND ANALYSIS
Results of Operations
The following table sets forth a summary of our consolidated statements of operations for the periods
indicated both in RMB and as a percentage of net revenues.
Year Ended December 31,2002 2003 2004
RMB RMB RMB(in thousands) % (in thousands) % (in thousands) %
Revenues:Hotel reservation 96,763 96.7 153,389 88.6 276,043 82.7Airline ticketing 5,600 5.6 20,323 11.7 63,006 18.9Packaged-tour* 432 0.4 4,789 2.8 10,480 3.1Others 2,517 2.5 4,178 2.4 4,501 1.3Less: Business tax and related surcharges (5,264) (5.2) (9,532) (5.5) (20,209) (6.1)
Net revenues 100,049 100.0 173,147 100.0 333,820 100.0
Cost of services (13,673) (13.7) (25,654) (14.8) (48,475) (14.5)
Gross profit 86,376 86.3 147,492 85.2 285,345 85.5
Operating expenses:Product development (13,365) (13.4) (20,684) (11.9) (37,959) (11.4)Sales and marketing (32,308) (32.2) (47,571) (27.5) (72,863) (21.8)General and administrative (15,702) (15.7) (19,191) (11.1) (36,401) (10.9)Share-based compensation (462) (0.5) (1,583) (0.9) (1,958) (0.6)Amortization of goodwill and
other intangible assets (353) (0.3) (388) (0.2) (493) (0.1)Other expenses incurred
for joint venture companies (915) (0.9) — — — —Total operating expenses (63,105) (63.0) (89,417) (51.6) (149,675) (44.8)
Income (Loss) from operations 23,270 23.3 58,075 33.5 135,670 40.6
Interest income 319 0.3 401 0.2 5,543 1.7Interest expense on short-term bank loan (41) (0.0) — — — —Other income (expense) 1,015 1.0 5,093 2.9 4,470 1.3
Income (Loss) before income tax benefit (expense),minority interests and share of loss injoint venture companies 24,563 24.6 63,569 36.7 145,682 43.6
Income tax benefit (expense) (10,043) (10.0) (10,249) (5.9) (12,517) (3.7)Minority interests 71 0.0 (79) (0.0) (39) (0.0)Share of income (loss) of
joint venture companies (398) (0.4) 573 0.3 — —
Net income (loss) for the period 14,194 14.2 53,814 31.1 133,126 39.9
* Certain of our packaged-tour revenues in 2003 and 2004 were booked on a gross basis. See “—Major Factors Affecting Our Results of
Operations – Revenues – Packaged-tour.”

24
MANAGEMENT DISCUSSION AND ANALYSIS
2004 compared to 2003
Revenues
We had revenues of 354.0 million (US$42.8
million) in 2004, an increase of 93.8% over
RMB182.7 million. This revenue growth was
principally driven by the substantial volume
growth in hotel room nights booked and air
tickets sold in 2004.
Hotel Reservation. Revenues from our hotel
reservation business increased by 79.9% to
RMB276.0 million (US$33.4 million) in 2004
from RMB153.4 million in 2003, primarily as a
result of the continued rapid growth in our hotel
room nights sales volume, and to a lesser extent,
the negative impact of SARS to our hotel
reservation business in the first half of 2003. The
total number of hotel room nights booked in
2004 was above 4.2 million compared to above
2.4 million in 2003.
Air Ticketing. Revenues from our air ticketing
business increased substantially by 210.3% to 63.0
million (US$7.6 million) in 2004 from RMB20.3
million (US$2.5 million) in 2003, primarily due
to strong growth of air tickets sales volume as
we continued to expand our air ticketing
capabilities significantly, and to a lesser extent,
the negative impact of SARS to our air ticketing
business in the first half of 2003. The total
number of air tickets sold in 2004 was about 1.7
million, compared to about 610,000 in 2003.
Packaged-tour. Packaged-tour revenues increased
substantially from RMB4.8 million in 2003 to
RMB 10.5 million (US$1.3 million) in 2004, an
increase of 118.8% as we continued growing our
packaged-tour business. See “ – Recognition of
Packaged-tour Revenues.”
Other businesses. Revenues from other businesses
increased by 7.7% from RMB4.2 million in 2003
to RMB4.5 million (US$543,792) in 2004,
primarily due to increased sales of our
advertising service and special marketing alliance
projects in 2004.
Net Revenues
Our net revenues increased by 92.8% from
RMB173.1 million in 2003 to RMB333.8 million
(US$40.3 million) in 2004 as a result of our
increased revenues in all of our businesses,
partially offset by the resulting increase in
business tax and related surcharges.
Cost of Services
Cost of services in 2004 increased by 88.8% to
RMB48.5 million (US$5.9 million) from RMB25.7
million in 2003. This increase was primarily
attributable to the hiring of additional customer
service representatives and increased
telecommunication expenses resulting from the
overall expansion of our hotel reservation and air
ticketing businesses.
Operating Expenses
Operating expenses in 2004 increased by 67.4%
to RMB149.7 million (US$18.1 million) from
RMB89.4 million in 2003, primarily due to a
significant increase in product development
expenses as well as sales and marketing and
general and administrative expenses. However,
operating expenses as a percentage of net
revenues decreased from 51.6% in 2003 to 44.8%
in 2004 as a result of our scalable and profitable
business platform.
TOTAL NUMBER OFHOTEL ROOM
NIGHTS BOOKING
2003 2004
2.4
in millions
4.2
TOTAL NUMBER OFAIR TICKETS SOLD
2003 2004
610,000
1,700.000

Ctrip.com International, Ltd. Annual Report 2004 25
MANAGEMENT DISCUSSION AND ANALYSIS
Product Development. Product development
expenses increased by 83.6% to RMB38.0 million
(US$4.6 million) in 2004 from RMB20.7 million
in 2003, primarily due to increased salary and
benefit expenses for the increased number of
product development staff mainly in the air-
ticketing and packaged-tour departments.
Sales and Marketing. Sales and marketing
expenses increased by 53.2% to RMB72.9 million
(US$8.8 million) in 2004 from RMB47.6 million
in 2003, primarily because of increased salary
and benefit expenses for the increased number
of sales and marketing staff, increased expenses
in connection with our customer reward
program, advertisements and commission
payments to our marketing partners.
General and Administrative. General and
administrative expenses increased by 89.6% to
RMB36.4 million (US$4.4 million) in 2004 from
RMB19.2 million in 2003, primarily due to
increased salary and benefits for the increased
number of general and administrative staff and
increased professional service fees.
Share-based Compensation. Share-based
compensation increased by 25.0% to RMB2.0
million (US$236,576) in 2004 from RMB1.6
million in 2003, primarily due to the effect of
amortization of share-based compensation
expenses associated with share options issued
in 2003.
Amortization of Goodwill and Other Intangible
Assets. Amortization expenses increased by 27.0%
to RMB0.49 million (US$59,554) in 2004 from
RMB0.39 million in 2003, primarily due to
amortization expenses related to our acquisition
of Shanghai Ctrip Charming in September 2003.
Interest Income. Interest income increased
tremendously to RMB5.5 million (US$669,670) in
2004 from RMB400,557 in 2003 because of the
increase in our cash balance and the increase in
the interests rates of our bank deposits.
Other Income. Other income decreased by 11.8%
to RMB4.5 million (US$540,080) in 2004 from
RMB5.1 million in 2003, primarily due to an
increase in other expenses, offset in part by the
higher amount of financial subsidies we received
in 2004.
Income Tax Expense. Income tax expense was
RMB12.5 million (US$1.5 million) in 2004, an
increase of 22.5% over RMB10.2 million in 2003,
primarily because of the increase of our taxable
income in 2004. Our effective income tax rate in
2004 was lower than 2003 because a substantial
portion of our income was generated by Ctrip
Travel Information, which was exempted from
paying EIT in 2004.
Net Income
Net income increased by 147.4% to RMB133.1
million (US$16.0 million) in 2004 from RMB53.8
million in 2003, as a result of the factors
discussed above.
Our VIP membershipcards allow card holdersto enjoy certain priorityin obtaining our servicesand receive discountsfrom various restaurantsand shops.

26
MANAGEMENT DISCUSSION AND ANALYSIS
2003 compared to 2002
Revenues
We had revenues of RMB182.7 million in 2003,
an increase of 73.5% over RMB105.3 million in
2002. This revenue growth was principally driven
by the substantial volume growth in hotel room
nights booked and air tickets sold in 2003.
Hotel Reservation. Revenues from our hotel
reservation business increased by 58.5% to
RMB153.4 million in 2003 from RMB96.8
million in 2002, primarily as a result of the
continued rapid growth in our hotel room nights
sales volume. The total number of hotel room
nights booked in 2003 was above 2.4 million,
compared to above 1.6 million in 2002.
Air Ticketing. Revenues from our air ticketing
business increased substantially by 262.9% to
RMB20.3 million in 2003 from RMB5.6 million
in 2002, primarily due to strong growth of air
tickets sales volume as we expand our air
ticketing capabilities significantly and an
increase in the average commission per air ticket
sold between these two years. The total number
of air tickets sold in 2003 was about 610,000,
compared to about 80,000 in 2002.
Packaged-tour. Packaged-tour revenues increased
substantially from RMB0.4 million in 2002 to
RMB4.8 million in 2003 as we started to make
inroads into the packaged-tour business and
some of the packaged-tour revenues in 2003 in
the amount of RMB 3.9 million were booked on
a gross basis as a result of our packaged-tour
services provided by Shanghai Ctrip Charming
and Shanghai Huacheng in 2003. See “ – Major
Factors Affecting Our Results of Operations –
Revenues – Packaged-tour.”
Other businesses. Revenues from other
businesses increased by 66.0% from RMB2.5
million in 2002 to RMB4.2 million in 2003,
primarily due to the increased sales of our
advertising services and VIP membership cards
in 2003.
Net Revenues
Our net revenues increased from RMB100.0
million in 2002 to RMB173.1 million in 2003 as
a result of our increased revenues in all of our
business lines, partially offset by the resulting
increase in business tax and related surcharges.
Cost of Services
Cost of services in 2003 increased by 87.6% to
RMB25.7 million from RMB13.7 million in 2002.
This increase was primarily attributable to the
hiring of additional customer service
representatives and increased telecommunication
expenses resulting from the overall expansion of
our hotel reservation and air ticketing businesses.
Operating Expenses
Operating expenses in 2003 increased by 41.7%
to RMB89.4 million from RMB63.1 million in
2002, primarily due to a significant increase in
product development expenses as well as sales
and marketing expenses. However, operating
expenses as a percentage of net revenues
decreased from 63.0% in 2002 to 51.6% in 2003
as a result of our scalable and profitable business
platform. This business platform provides us with
a high degree of operational leverage, which
enhances our profitability and makes us more
resilient in managing industry downturns. Even
during the SARS period in the second quarter of
2003, despite revenues being down by 42% from
the first quarter of 2003, we still managed to
have almost breakeven operating income.

Ctrip.com International, Ltd. Annual Report 2004 27
MANAGEMENT DISCUSSION AND ANALYSIS
Product Development. Product development
expenses increased by 54.8% to RMB20.7 million
in 2003 from RMB13.4 million in 2002, primarily
due to the hiring of additional staff to expand
our travel supplier network.
Sales and Marketing. Sales and marketing
expenses increased by 47.2% to RMB47.6 million
in 2003 from RMB32.3 million in 2002, primarily
because of increased expenses in connection
with our increased salary and benefit expenses
for sales and marketing staff, our customer
reward program, production of marketing
material, as well as commission expenses paid to
our business partners.
General and Administrative. General and
administrative expenses increased by 22.2% to
RMB19.2 million in 2003 from RMB15.7 million
in 2002, primarily due to increased salary and
benefits associated with hiring of additional
general and administrative staff.
Share-based Compensation. Share-based
compensation increased substantially to RMB1.6
million in 2003 from RMB0.5 million in 2002,
due to the issuance of additional share options
in 2003.
Amortization of Goodwill and Other Intangible
Assets. Amortization expenses increased by 9.9%
to RMB388,156 in 2003 from RMB353,241 in
2002. This increase was mainly due to
amortization expenses of intangible assets in
connection with our acquisition of Shanghai
Ctrip Charming in September 2003.
Interest Income and Expenses. Interest income
increased to RMB400,557 in 2003 from
RMB319,230 in 2002 because of the increase in
our bank deposits. We incurred no interest
expenses in 2003 as we did not have any bank
loan in 2003.
Other Income. Other income increased
substantially to RMB5.1 million in 2003 from
RMB1.0 million in 2002, because we received
more financial subsidies including certain
special subsidies granted for entities impacted
by SARS from the government authorities in
Shanghai in 2003.
Income Tax Expense. Income tax expense was
RMB10.2 million in 2003, which was nearly
unchanged from 2002, primarily because Ctrip
Computer Technology received approval from the
relevant government authorities in Shanghai to
enjoy a preferential EIT rate of 15% for 2003.
Ctrip Travel Information, which was established
in early 2003, is also entitled to a preferential
EIT rate of 15%.
Net Income
Net income increased by 279.1% to RMB53.8
million in 2003 from RMB14.2 million in 2002,
primarily due to an increase in income from
operations, supplemented by a more favorable
EIT rate in 2003.

28
MANAGEMENT DISCUSSION AND ANALYSIS
B. LIQUIDITY AND CAPITAL RESOURCES
Liquidity. The following table sets forth the summary of our cash flows for the periods indicated:
Year ended December 31,
2002 2003 2004 2004
RMB RMB RMB US$
(in thousands)
Net cash provided by (used in) operating activities 23,427 74,143 161,500 19,513
Net cash provided by (used in) investing activities 3,427 (12,188) (13,089) (1,582)
Net cash provided by (used in) financing activities (30,425) 369,609 (4,311) (521)
Net increase (decrease) in cash and cash equivalents (3,532) 433,038 143,907 17,387
Cash and cash equivalents at beginning of year 42,464 38,931 471,969 57,025
Cash and cash equivalents at end of year 38,931 471,969 615,875 74,413
Net cash provided by operating activities was
RMB161.5 million (US$19.5 million) in 2004
compared to RMB74.1 million in 2003, primarily
due to the increase in our net revenue resulting
from our increased transaction volume, coupled
with the increased operating margin.
Net cash used in investing activities amounted to
RMB13.1 million (US$1.6 million) in 2004,
compared to net cash used in investing activities
of RMB12.2 million in 2003. This change was
due to our purchase of additional servers,
workstations, computers, computer software and
other items related to our network infrastructure
in 2004.
Net cash used in financing activities amounted
to RMB4.3 million (US$0.5 million) in 2004,
compared to net cash provided by financing
activities of RMB 369.6 million in 2003. This
change is primarily attributable to the facts that
we received RMB368.7 million net proceeds from
our initial public offering in 2003 and paid the
expenses related thereto in 2004, partly offset by
the proceeds we received in connection with
employee share option exercises in 2004.
Capital Resources. We have financed our capital
expenditure requirements with cash flows from
operations and through the sale of our Series A
preferred shares and Series B preferred shares and
our initial public offering in 2003.
Our principal capital expenditures for 2002, 2003
and 2004 consisted of purchases of servers,
workstations, computers, computer software, and
other items related to our network infrastructure
for a total of approximately RMB13.2 million,
RMB9.4 million and RMB14.9million (US$1.8
million), respectively. Our capital expenditures in
2002 included RMB7.2 million we spent to
purchase part of our premises in Shanghai.
Our capital expenditure plans for 2005 have not
yet been fixed, but we expect to spend
approximately RMB66.2 million (US$8.0 million),
primarily for purchases of additional information
technology-related equipment and software and
also in connection with our February 2005
acquisition of land use rights for approximately
16,670 square meters of land in the Shanghai
Hong Qiao Lin Kong Economic Development
Park. We plan to build a new information and
CAPITALEXPENDITURES
2002 2003 2004
13.2
RMB, in millions
14.9
9.4

Ctrip.com International, Ltd. Annual Report 2004 29
MANAGEMENT DISCUSSION AND ANALYSIS
technology center on the premises and move our
principal executive offices, 24-hour customer
service center, product development center and
administrative and support facilities to the new
premises. The aggregate investment for the new
premises is estimated to range from
approximately US$19 million to US$20 million to
be paid over the period from 2005 until the
completion of the construction of the new
premises, which is expected to be around mid-
2007. Capital expenditures in 2005 have been,
and are expected to continue to be, funded
through operating cash flows and through our
existing capital resources.
As of December 31, 2004, our primary source of
liquidity was RMB615.9 million (US$74.4 million)
of cash. We have no outstanding bank loans or
financial guarantees or similar commitments to
guarantee the payment obligations of third
parties. We believe that our current cash and
cash equivalents and cash flow from operations
will be sufficient to meet our anticipated cash
needs, including our cash needs for working
capital and capital expenditures, for the
foreseeable future. We may, however, require
additional cash resources due to changing
business conditions or other future
developments, including any investments or
acquisitions we may decide to pursue.
C. RESEARCH AND DEVELOPMENT
Our research and development efforts consist of
continuing to develop our proprietary technology
as well as incorporating new technologies from
third parties. We intend to continue to upgrade
our proprietary booking, customer relationship
management and yield management software to
keep up with the continued growth in our
transaction volume and the rapidly evolving
technological conditions. We will also seek to
continue to enhance our electronic confirmation
system and promote such system with more
hotel suppliers, as we believe that the electronic
confirmation system is a cost-effective and
convenient way for hotels to interface with us. In
addition, we have utilized and will continue to
utilize the products and services of third parties
to support our technology platform.
D. TREND INFORMATION
Other than as disclosed elsewhere in this
annual report, we are not aware of any trends,
uncertainties, demands, commitments or
events for the period from January 1, 2002 to
December 31, 2004 that are reasonably likely
to have a material adverse effect on our net
revenues, income, profitability, liquidity or
capital resources, or that caused the disclosed
financial information to be not necessarily
indicative of future operating results or
financial conditions.
E. OFF-BALANCE SHEET ARRANGEMENTS
We do not have any outstanding derivative
financial instruments, off-balance sheet
guarantees, interest rate swap transactions or
foreign currency forward contracts. We do not
engage in trading activities involving non-
exchange traded contracts.
Capitalexpenditures in2005 have been,and are expected tocontinue to be,funded throughoperating cashflows and throughour existing capitalresources.

30
MANAGEMENT DISCUSSION AND ANALYSIS
F. CONTRACTUAL OBLIGATIONS
We have entered into leasing arrangements relating to office premises, equipment and others that are
classified as operating leases. The following sets forth our commitments under operating leases as of
December 31, 2004:
Office Premises Equipment and Others Total
(in RMB thousands)
Less than 1 year 4,306 9,418 13,724
1 – 3 years 3,624 1,553 5,177
3 – 5 years — 676 676
More than 5 years — — —
Other than the leasing obligations set forth above, we do not have any long-term commitments.
G. QUANTITATIVE AND QUALITATIVE
DISCLOSURES ABOUT MARKET RISK
Interest Rate Risk. Our exposure to interest rate
risk for changes in interest rates relates primarily
to the interest income generated by excess cash
deposited in banks. We have not used any
derivative financial instruments to hedge interest
rate risk. We have not been exposed nor do we
anticipate being exposed to material risks due to
changes in interest rates. Our future interest
income may fluctuate in line with changes in
interest rates. However, the risk associated
with fluctuating interest rates is principally
confined to our interest-bearing cash deposits,
and, therefore, our exposure to interest rate
risk is limited.
Foreign Exchange Risk. We are exposed to foreign
exchange risk arising from various currency
exposures. Some of our expenses, including rent
for our Hong Kong office and salaries of
employees located in Hong Kong, are
denominated in foreign currencies while almost
all of our revenue is denominated in RMB. As we
hold assets dominated in U.S. dollars, including
our bank deposits, any appreciation of the RMB
against the U.S. dollar could result in a charge to
our income statement and a reduction in the
value of our U.S. dollar denominated assets. We
have not used any forward contracts or currency
borrowings to hedge our exposure to foreign
currency risk.

Ctrip.com International, Ltd. Annual Report 2004 31
MANAGEMENT DISCUSSION AND ANALYSIS
H. RECENT ACCOUNTING PRONOUNCEMENTS
In March 2004, the Emerging Issues Task Force
(“EITF”) reached a consensus on Issue No. 03-06,
“Participating Securities and the Two-Class
Method under FASB Statement No. 128” (“EITF
No. 03-06”). EITF No. 03-06 provides guidance
regarding the computation of earnings per share
by companies that have issued securities other
than common shares that entitle the holder to
participate in dividends and earnings of the
company. In addition, EITF No. 03-06 provides
further guidance on what constitutes a
participating security and requires the
application of the two-class method in
determining earnings per share. EITF No. 03-06
is effective for the quarter ending June 30,
2004. The Company has adopted EITF No.
03-06 for the year ended December 31, 2004
and has retroactively applied the consensus
in determining the earnings per share for
year ended December 31, 2002 and 2003
(see Note 18).
In March 2004, the EITF reached a consensus on
Issue No. 03-01 “The Meaning of Other-Than-
Temporary Impairment and Its Application to
Certain Investments” (“EITF No. 03-01”). EITF
No. 03-01 provides recognition and
measurement guidance on the meaning of other-
than-temporary impairment and its application
to certain investments carried at cost, including
investments in marketable securities accounted
for under SFAS No. 115, “Accounting for Certain
Investments in Debt and Equity Securities.”
Additionally, EITF No. 03-01 provides disclosure
requirements of the investor when determining if
an investment is impaired. The recognition and
measurement guidance in EITF No. 03-01 has
been postponed but the disclosure requirement
under the EITF are effective for financial
statements for 2004. The adoption of the
recognition and measurement requirements of
EITF No. 03-01 will not have a material effect on
the Company’s financial position or results of
operations.
In June 2004, the EITF reached a consensus on
Issue No. 02-14 “Whether the Equity Method of
Accounting Applies When an Investor Does Not
Have an Investment in Voting Stock of an
Investee but Exercises Significant Influence
through Other Means” (“EITF No. 02-14”). EITF
No. 02-14 provides guidance that an investor
should only apply the equity method of
accounting when it has investments in either
common stock or in-substance common stock of
a corporation, provided that the investor has the
ability to exercise significant influence over the
operating and financial policies of the investee.
The EITF defined in-substance common stock as
an investment that has risk and reward
characteristics that are substantially similar to
common stock. EITF No. 02-14 is effective for
reporting periods beginning after September 15,
2004. The adoption of EITF No. 02-14 will not
have a material effect on the Company’s
historical financial position or results of
operations.
In September 2004, the EITF reached a
consensus on Issue No. 04-01 “Accounting for
Pre-existing Relationships between the Parties to
a Business Combination” (“EITF No. 04-01”) and
states that the consummation of a business
combination between two parties that have a
pre-existing contractual relationship should be
evaluated to determine if a settlement of the
pre-existing contractual relationship occurred.
Additionally, the EITF provides guidance on the
measurement and recognition of the pre-existing
relationship. The provisions of EITF No. 04-01

32
MANAGEMENT DISCUSSION AND ANALYSIS
are applicable to business combinations
completed in reporting periods after October 13,
2004. The adoption of EITF No. 04-01 did not
have a material effect on the Company’s
financial position or results of operations.
On December 15, 2004, the FASB issued
Statement No. 153, “Exchanges of Non
monetary Assets, an amendment of APB Opinion
No. 29” (SFAS No. 153). SFAS No. 153 requires
exchanges of productive assets to be accounted
for at fair value, rather than at carryover basis,
unless (1) neither the asset received nor the asset
surrendered has a fair value that is determinable
within reasonable limits or (2) the transactions
lack commercial substance. SFAS No. 153 is
effective for non monetary asset exchanges
occurring in fiscal periods beginning after June
15, 2005. The Company does not expect the
adoption of SFAS No. 153 to have a material
impact on the Company’s financial position or
results of operation.
In December 2004, the FASB issued its final
standard on “Accounting for Share-Based
Compensation”, FASB Statement No. 123R
(revised 2004), Share-Based Compensation
(“SFAS 123R”), which requires public companies
to expense the value of employee share options
and similar awards. This Statement supersedes
APB No. 25. Under SFAS123R, share-based
compensation will be measured at fair value on
the awards’ grant date, based on the estimated
number of awards that are expected to vest.
SFAS 123R is effective for public companies for
annual periods beginning after June 15, 2005
and applies to all outstanding and unvested
share-based payment awards at a company’s
adoption date. Under SFAS 123R, the Company
could select from three transition methods: (1)
The modified prospective method, where the
expenses related to unvested but still
outstanding options as calculated under the
original SFAS 123 be charged to expense without
any change in measurement (2) A variation of
the modified prospective method, where in
addition to (1), it allow restatement for prior
interim periods using its prior SFAS 123 pro
forma disclosure amounts; and (3) The modified
retrospective method, where all prior period
financial statements are retroactively restated
based on pro forma disclosures as calculated
under the original SFAS 123R. All options issued
after adoption of SFAS 123R should be
accounted for under that standard. The
Company plans to adopt SFAS 123R beginning
January 1, 2006, with no restatement of interim
periods or annual periods prior to the effective
date. Upon adoption, the Company will
recognize share-based compensation relating to
the unvested portion of the outstanding grants
based on the fair value of the options as
determined under SFAS No. 123 as disclosed in
Note 2(19). New options to be issued after the
effective date will be recognized based on the
provisions of SFAS 123R.

Ctrip.com International, Ltd. Annual Report 2004 33
REPORT OF INDEPENDENTREGISTERED PUBLICACCOUNTING FIRM
TO THE BOARD OF DIRECTORS AND SHAREHOLDERS OFCTRIP.COM INTERNATIONAL, LTD.:
In our opinion, the accompanying consolidated balance sheets and the related consolidated statements of incomeand comprehensive income, of shareholders’ equity and of cash flows present fairly, in all material respects, thefinancial position of Ctrip.com International, Ltd. and its subsidiaries as of December 31, 2004 and 2003, and theresults of their operations and their cash flows for each of the three years in the period ended December 31, 2004in conformity with accounting principles generally accepted in the United States of America. These financialstatements are the responsibility of the Company’s management. Our responsibility is to express an opinion onthese financial statements based on our audits. We conducted our audits of these statements in accordance withthe standards of the Public Company Accounting Oversight Board (United States). Those standards require that weplan and perform the audit to obtain reasonable assurance about whether the financial statements are free ofmaterial misstatement. An audit includes examining, on a test basis, evidence supporting the amounts anddisclosures in the financial statements, assessing the accounting principles used and significant estimates made bymanagement, and evaluating the overall financial statement presentation. We believe that our audits provide areasonable basis for our opinion.
PricewaterhouseCoopers Zhong TianCertified Public Accountants Ltd. Co.
Shanghai, People’s Republic of ChinaFebruary 21, 2005

34
CONSOLIDATED STATEMENTSOF INCOME ANDCOMPREHENSIVE INCOMEFor the years ended December 31, 2002, 2003 and 2004
Note 2002 2003 2004 2004
RMB RMB RMB US$(Note 2d)
Revenues:Hotel reservation 96,762,837 153,388,686 276,042,944 33,352,618Air-ticketing 5,600,241 20,322,986 63,005,651 7,612,596Packaged tour 432,295 4,788,727 10,479,780 1,266,209Others 2,517,316 4,178,419 4,500,698 543,792
Total revenues 105,312,689 182,678,818 354,029,073 42,775,215
Less: business tax and related surcharges (5,264,035) (9,532,290) (20,208,996) (2,441,732)
Net revenues 100,048,654 173,146,528 333,820,077 40,333,483
Cost of services (13,673,013) (25,654,057) (48,475,283) (5,856,979)
Gross profit 86,375,641 147,492,471 285,344,794 34,476,504
Operating expenses:Product development (13,364,920) (20,683,821) (37,959,208) (4,586,384)Sales and marketing (32,308,004) (47,571,050) (72,863,325) (8,803,640)General and administrative (15,702,137) (19,190,803) (36,401,461) (4,398,171)Share-based compensation* 11 (462,140) (1,583,409) (1,958,022) (236,576)Amortization of other intangible assets (353,241) (388,156) (492,900) (59,554)Other expenses incurred for joint
venture companies (915,056) – – –
Total operating expenses (63,105,498) (89,417,239) (149,674,916) (18,084,325)
Income from operations 23,270,143 58,075,232 135,669,878 16,392,179
Interest income 319,230 400,557 5,542,520 669,670Interest expense (41,261) – – –Other income 1,014,872 5,093,203 4,469,974 540,080
Income before income tax expense,minority interests and share of income(loss) of joint venture companies 24,562,984 63,568,992 145,682,372 17,601,929
Income tax expense 7 (10,042,624) (10,249,404) (12,517,121) (1,512,369)Minority interests 70,997 (79,496) (38,961) (4,707)Share of income (loss) of joint venture
companies (397,824) 573,423 – –
Net income for the year 14,193,533 53,813,515 133,126,290 16,084,853

Ctrip.com International, Ltd. Annual Report 2004 35
CONSOLIDATED STATEMENTS OF INCOME AND COMPREHENSIVE INCOMEFor the years ended December 31, 2002, 2003 and 2004
Note 2002 2003 2004 2004
RMB RMB RMB US$(Note 2d)
Accretion for Series B RedeemableConvertible Preferred Shares (16,492,526) (12,365,534) – –
Dividends to holders of Series A andSeries B Preferred Shares (16,762,322) – – –
Deemed dividends to holders of Series Aand Series B Preferred Sharesfor spin-off of joint venture companies 2u – (2,829,064) – –
Deemed dividends upon repurchaseof Preferred Shares 10 – (35,336,150) – –
Amount allocated to participatingpreference shareholders – (1,909,600) – –
Net income (loss) attributable toordinary shareholders 15 (19,061,315) 1,373,167 133,126,290 16,084,853
Other comprehensive income:Translation adjustments 38,904 1,474,545 193,673 23,400
Comprehensive income 14,232,437 55,288,060 133,319,963 16,108,253
Earnings (loss) per share 15– Basic (2.00) 0.13 4.33 0.52
– Diluted (2.00) 0.11 4.23 0.51
Earnings (loss) per ADS– Basic (4.00) 0.26 8.66 1.05
– Diluted (4.00) 0.22 8.46 1.02
Weighted average ordinary sharesoutstanding 15– Basic 9,520,698 10,605,957 30,712,466 30,712,466
– Diluted 9,520,698 12,312,207 31,504,702 31,504,702
* Share-based compensation was relatedto the associated operating expensecategories as follows: Product development (131,163) (411,359) (550,573) (66,522) Sales and marketing (27,109) (136,189) (187,850) (22,697) General and administrative (303,868) (1,035,861) (1,219,599) (147,357)
(462,140) (1,583,409) (1,958,022) (236,576)
The accompanying notes are an integral part of these consolidated financial statements.

36
CONSOLIDATEDBALANCE SHEETSAs of December 31, 2003 and 2004
Note 2003 2004 2004RMB RMB US$
(Note 2d)
ASSETSCurrent assets:
Cash 2e 471,968,850 615,875,363 74,412,537Accounts receivable 28,939,700 35,418,477 4,279,403Due from related parties 13 611,640 59,252 7,159Prepayments and other current assets 4 7,130,947 18,503,778 2,235,701Deferred tax assets, current 7 541,300 1,009,403 121,960
Total current assets 509,192,437 670,866,273 81,056,760
Long-term loans to related parties 13 2,310,000 500,000 60,412Long-term deposits 11,192,277 26,715,547 3,227,880Property, equipment and software 5 23,279,247 31,897,651 3,854,002Goodwill 6 9,515,849 9,515,849 1,149,743Other intangible assets 6 1,715,253 1,222,353 147,690
Total assets 557,205,063 740,717,673 89,496,487
LIABILITIESCurrent liabilities:
Accounts payable 14,694,057 30,150,303 3,642,881Due to a related party 13 4,018,284 3,378,980 408,262Salary and welfare payable 9,799,711 14,110,730 1,704,915Taxes payable 9,270,024 23,421,257 2,829,850Advances from customers 3,839,843 6,526,639 788,575Provisions for customer reward program 2k 4,708,670 10,462,103 1,264,073Dividend payable 2u – 39,937,887 4,825,456Other payables and accruals 14 17,586,657 10,755,790 1,299,559
Total current liabilities 63,917,246 138,743,689 16,763,571
Minority interests 563,655 602,616 72,810Commitments and contingencies 16 – – –Shareholders’ equity
Share capital (US$0.01 par value; 40,000,000 sharesauthorized, 30,174,891 shares issued andoutstanding as of December 31, 2003;31,565,040 shares issued and outstanding as ofDecember 31, 2004) 2,498,484 2,613,542 315,779
Additional paid-in capital 498,566,368 511,367,287 61,785,451Statutory reserves 2t 5,531,309 19,256,862 2,326,691Deferred share-based compensation 11 (4,995,407) (2,258,908) (272,930)Cumulative translation adjustments 1,575,733 1,382,060 166,986Retained earnings (accumulated deficit) (10,452,325) 69,010,525 8,338,129
Total shareholders’ equity 492,724,162 601,371,368 72,660,106
Total liabilities and shareholders’ equity 557,205,063 740,717,673 89,496,487
The accompanying notes are an integral part of these consolidated financial statements.

Ctrip.com International, Ltd. Annual Report 2004 37
CONSOLIDATED STATEMENTS OFSHAREHOLDERS’ EQUITY
For the years ended December 31, 2002, 2003 and 2004
Series B RedeemableSeries A Convertible Convertible Series C Convertible
Ordinary shares Preferred Share Preferred Share Preferred Share(US$0.01 par value) (US$0.01 par value) (US$0.01 par value) (US$0.01 par value)
Retained TotalAdditional Deferred Cumulative earnings shareholders’
Number Par Number Par Number Par Number Par paid-in Statutory share-based translation (accumulated equityof shares value of shares value of shares value of shares value capital reserves compensation adjustments Deficit) (deficit)
RMB RMB RMB RMB RMB RMB RMB RMB RMB RMB
Balance as ofJanuary 1, 2002 9,520,698 788,314 4,320,000 357,696 – – – – 26,621,353 – (96,263 ) 62,284 (40,240,574 ) (12,507,190 )
Accretion for Series BRedeemable ConvertiblePreferred Shares – – – – – – – – (16,492,526 ) – – – – (16,492,526 )
Deferred share-basedcompensation – – – – – – – – 1,443,337 – (981,197 ) – – 462,140
Dividends to shareholders – – – – – – – – (11,572,164 ) – – – (15,751,832 ) (27,323,996 )Translation adjustments – – – – – – – – – – – 38,904 – 38,904Net income – – – – – – – – – – – – 14,193,533 14,193,533
Balance as ofDecember 31, 2002 9,520,698 788,314 4,320,000 357,696 – – – – – – (1,077,460 ) 101,188 (41,798,873 ) (41,629,135 )
Accretion for Series BRedeemable ConvertiblePreferred Shares – – – – – – – – – – – – (12,365,534 ) (12,365,534 )
Spin-off of joint venturecompanies – – – – – – – – – – – – (4,611,623 ) (4,611,623 )
Reclassification uponremoval of redemptionrights for Series BConvertible PreferredShares – – – – 7,193,464 595,621 – – 136,732,417 – – – – 137,328,038
Issuance of Series CConvertible PreferredShares – – – – – – 2,180,755 180,570 82,619,430 – – – – 82,800,000
Repurchase of shares uponissuance of Series CConvertible Preferred
Shares (842,938 ) (69,792 ) (382,482 ) (31,671 ) (636,891 ) (52,735 ) – – (82,645,802 ) – – – – (82,800,000 )Conversion of PreferredShares into ordinary
shares upon initialpublic offering 15,953,131 1,320,919 (3,937,518 ) (326,025 ) (6,556,573 ) (542,886 ) (2,180,755 ) (180,570 ) (271,438 ) – – – – –
Issuance of ordinary shares 5,400,000 447,120 – – – – – – 355,722,337 – – – – 356,169,457Exercise of share option 144,000 11,923 – – – – – – 908,068 – – – – 919,991Deferred share-based
compensation – – – – – – – – 5,501,356 – (3,917,947 ) – – 1,583,409Appropriations to statutory
reserves – – – – – – – – – 5,531,309 – – (5,489,810 ) 41,499Translation adjustments – – – – – – – – – – – 1,474,545 – 1,474,545Net income – – – – – – – – – – – – 53,813,515 53,813,515
Balance as ofDecember 31, 2003 30,174,891 2,498,484 – – – – – – 498,566,368 5,531,309 (4,995,407 ) 1,575,733 (10,452,325 ) 492,724,162

38
CONSOLIDATED STATEMENTS OF SHAREHOLDERS’ EQUITYFor the years ended December 31, 2002, 2003 and 2004
The accompanying notes are an integral part of these consolidated financial statements.
Series B RedeemableSeries A Convertible Convertible Series C Convertible
Ordinary shares Preferred Share Preferred Share Preferred Share(US$0.01 par value) (US$0.01 par value) (US$0.01 par value) (US$0.01 par value)
Retained TotalAdditional Deferred Cumulative earnings shareholders’
Number Par Number Par Number Par Number Par paid-in Statutory share-based translation (accumulated equityof shares value of shares value of shares value of shares value capital reserves compensation adjustments Deficit) (deficit)
RMB RMB RMB RMB RMB RMB RMB RMB RMB RMB
Exercise of share option 1,390,149 115,058 – – – – – – 13,579,396 – – – – 13,694,454
Deferred share-based
compensation – – – – – – – – (778,477 ) – 2,736,499 – – 1,958,022
Appropriations to
statutory reserves – – – – – – – – – 13,725,553 – – (13,725,553 ) –
Dividends – – – – – – – – – – – – (39,937,887 ) (39,937,887 )
Translation adjustments – – – – – – – – – – – (193,673 ) – (193,673 )
Net income – – – – – – – – – – – – 133,126,290 133,126,290
Balance as of
December 31, 2004 31,565,040 2,613,542 – – – – – – 511,367,287 19,256,862 (2,258,908 ) 1,382,060 69,010,525 601,371,368

Ctrip.com International, Ltd. Annual Report 2004 39
CONSOLIDATED STATEMENTS OF CASH FLOWSFor the years ended December 31, 2002, 2003 and 2004
CONSOLIDATED STATEMENTSOF CASH FLOWS
For the years ended December 31, 2002, 2003 and 2004
2002 2003 2004 2004
RMB RMB RMB US$(Note 2d)
Cash flows from operating activities:Net income for the year 14,193,533 53,813,515 133,126,290 16,084,853Adjustments for:
Share-based compensation costs 462,140 1,583,409 1,958,022 236,576Depreciation and amortization of property,
equipment and software 3,233,381 5,132,258 6,280,931 758,887Minority interests (70,997) 79,496 38,961 4,707Amortization of other intangible assets 353,241 388,156 492,900 59,554Share of loss of joint venture companies 397,824 (573,423) – –Appropriations to statutory reserves – 41,499 – –
Increase in accounts receivable (6,600,241) (14,970,300) (6,478,777) (782,792)(Increase) decrease in due from related parties (2,610,807) 3,612,838 552,388 66,742(Increase) decrease in prepayments and other
current assets 489,415 (3,460,993) (5,676,788) (685,893)(Increase) decrease in long-term deposits (630,929) (9,859,821) (15,523,270) (1,875,584)(Increase) decrease in deferred tax assets 9,244,836 51,843 (468,103) (56,558)Increase in accounts payable 1,245,705 13,692,698 15,456,246 1,867,487Increase (decrease) in due to related parties (556,705) 2,767,422 (639,304) (77,243)Increase (decrease) in salary and welfare payable (397,500) 7,417,997 4,311,020 520,875Increase in taxes payable 1,231,439 7,332,438 14,092,163 1,702,672Increase in advances from customers 1,633,100 1,948,349 2,686,796 324,629Increase in provisions for customer
reward program 1,385,877 2,411,267 5,753,433 695,153Increase in other payables and accruals 423,510 2,734,001 5,537,317 669,041
Net cash provided by operating activities 23,426,822 74,142,649 161,500,225 19,513,106
Cash flows from investing activities:Proceeds from disposal of equity interest
in a former subsidiary – 199,962 – –Purchase of property, equipment and software (13,202,907) (9,378,182) (14,899,334) (1,800,198)Purchase of intangible assets – (1,010,638) – –(Increase) Decrease in long-term loans to
related parties (100,000) (210,000) 1,810,000 218,692(Increase) decrease in restricted short-term
investment 24,829,800 – – –Decrease in cash arising from deconsolidation
of a former subsidiary – (1,789,594) – –Purchase of a business (2,600,000) – – –Investments in joint venture companies (5,500,000) – – –
Net cash provided by (used in) investing activities 3,426,893 (12,188,452) (13,089,334) (1,581,506)

40
CONSOLIDATED STATEMENTS OF CASH FLOWSFor the years ended December 31, 2002, 2003 and 2004
The accompanying notes are an integral part of these consolidated financial statements.
2002 2003 2004 2004
RMB RMB RMB US$(Note 2d)
Cash flows from financing activities:Repayment of short-term bank loan (4,000,000) – – –Proceeds from issuance of Series C Convertible
Preferred Shares – 82,800,000 – –Proceeds from initial public offering, net of
issuance costs of RMB33,719,000 paid – 368,688,999 – –Payment of issuance costs of initial public
offering – – (12,309,120) –Proceeds from exercise of share option – 919,991 7,998,415 966,401Repurchase of ordinary and Series A and B
Convertible Preferred Shares – (82,800,000) – (1,487,238)Cash received by a subsidiary on issuance
of ordinary shares from minority shareholders 898,958 – – –Dividends paid (27,323,996) – – –
Net cash provided by (used in) financingactivities (30,425,038) 369,608,990 (4,310,705) (520,837)
Effect of foreign exchange rate changes on cash 38,904 1,474,545 193,673 23,400Net (decrease) increase in cash (3,532,419) 433,037,732 143,906,513 17,387,363Cash, beginning of year 42,463,537 38,931,118 471,968,850 57,025,174
Cash, end of year 38,931,118 471,968,850 615,875,363 74,412,537
Supplemental disclosure of cash flowinformation
Cash paid during the year for income taxes – 5,903,981 12,757,167 1,541,372Cash paid during the year for interest expense 41,261 – – –Supplemental schedule of non-cash investing
and financing activities: – (12,309,120) – –

Ctrip.com International, Ltd. Annual Report 2004 41
NOTES TO THE CONSOLIDATED FINANCIAL STATEMENTS(Amounts expressed in RMB unless otherwise stated)
NOTES TO THECONSOLIDATED
FINANCIAL STATEMENTS (Amounts expressed in RMB unless otherwise stated)
1. ORGANIZATION AND NATURE OF OPERATIONS
The accompanying consolidated financial statements include the financial statements of Ctrip.com International,Ltd. (the “Company”), its subsidiaries and certain variable interest entities (“VIE” or “VIEs”). The Company, itssubsidiaries and the consolidated VIEs are collectively referred to as the “Group”.
The Group is principally engaged in the provision of travel related services including hotel reservation, air-ticketing,packaged tour services, as well as, to a lesser extent, internet-related advertising and other related services. TheGroup had also been engaged in hotel management operations in the People’s Republic of China (“PRC”) throughHome Inns & Hotels Management (Hong Kong) Limited (“Home Inns Hong Kong”).
Home Inns Hong Kong was incorporated in Hong Kong as a wholly-owned subsidiary of the Company onMay 8, 2001. Subsequent to the issuance of convertible preferred shares by Home Inns Hong Kong onFebruary 28, 2003, the Company ceased to have control over Home Inns Hong Kong. Accordingly, investment inHome Inns Hong Kong was accounted for by equity method until August 27, 2003 when all equity interest of theCompany in Home Inns Hong Kong was distributed to the then existing holders of Series A and Series BConvertible Preferred Shares and ordinary shares as share dividends on a pro rata as-converted basis (Note 2u).
On December 9, 2003, the Company registered its prospectus with the Securities and Exchange Commission in theUnited States and was listed on the NASDAQ National Market in the United States of America by offering2,700,000 American Depositary Shares (“ADS”), each ADS represents two ordinary shares, at US$18 per ADS to thepublic. The net proceeds to the Company from the offering amounted to RMB356,169,457, net of issuancecosts paid.
2. PRINCIPAL ACCOUNTING POLICIES
a. Basis of presentation
The accompanying consolidated financial statements have been prepared in accordance with generally acceptedaccounting principles in the United States of America (“US GAAP”).
The preparation of financial statements in conformity with US GAAP requires management to make estimates andassumptions that affect the reported amounts of assets and liabilities, disclosures of contingent assets and liabilitiesat the balance sheet dates and the reported amounts of revenues and expenses during the reporting periods. Actualresults could materially differ from those estimates.
b. Consolidation
The consolidated financial statements include the financial statements of the Company, its subsidiaries and certainVIEs. All significant transactions and balances between the Company, its subsidiaries and certain VIEs have beeneliminated upon consolidation. Investments in joint venture companies are accounted for by the equity method.The Company’s share of income (loss) of the joint venture companies is included in the consolidated statements ofincome and comprehensive income.
A subsidiary is an entity in which the Company, directly or indirectly, controls more than one half of the votingpower; has the power to appoint or remove the majority of the members of the board of directors; to cast amajority of votes at the meeting of the board of directors or to govern the financial and operating policies of theinvestee under a statue or agreement among the shareholders or equity holders.

42
NOTES TO THE CONSOLIDATED FINANCIAL STATEMENTS(Amounts expressed in RMB unless otherwise stated)
2. PRINCIPAL ACCOUNTING POLICIES (Continued)
b. Consolidation (Continued)
The Company has adopted Financial Accounting Standards Board (“FASB”) Interpretation No. 46 – “Consolidationof Variable Interest Entities, an Interpretation of ARB No. 51” (“FIN 46”) in July 2003. FIN 46 requires certain VIEsto be consolidated by the primary beneficiary of the entity if the equity investors in the entity do not have thecharacteristics of a controlling financial interest or do not have sufficient equity at risk for the entity to finance itsactivities without additional subordinated financial support from other parties. Accordingly, the financialstatements of the following VIEs are consolidated into the Company’s financial statements since July 1, 2003 ortheir respective date of establishment/acquisition, whichever is later:
Name of VIE Date of establishment/acquisition
Beijing Chenhao Xingye Air Ticketing Acquired on January 15, 2002Service Co., Ltd. (“Beijing Chenhao”)
Shanghai Ctrip Commerce Co., Ltd. Established on July 18, 2000(“Shanghai Ctrip Commerce”)
Shanghai Huacheng Southwest Travel Agency Established on March 13, 2001Co., Ltd. (“Shanghai Huacheng”)
Guangzhou Guangcheng Commercial Established on April 28, 2003Service Co., Ltd. (“Guangzhou Guangcheng”)
Shanghai Ctrip Charming International Acquired on September 23, 2003Travel Service Co., Ltd. (“Shanghai Ctrip Charming”)
Shenzhen Shencheng Information Consulting Established on April 13, 2004Service Co., Ltd. (“Shenzhen Shencheng”)
The Company has voting control over the above VIEs based on the irrevocable powers of attorney and other relatedagreements between the Company and the principal shareholders of the VIEs, which consist of a director and twosenior executives of the Company (Note 2c). Such director and officers collectively own a 100% equity interest inall of the VIEs except for Shanghai Huacheng and Shanghai Ctrip Charming which are 1.67% and 34% owned bythird parties, respectively. The Company has consolidated the assets and liabilities of the above VIEs in accordancewith transition guidance under FIN 46. Upon consolidation, there were no material differences between thecarrying value (as defined in FIN 46) added to the balance sheet and the previously recognized long-term loanbalances.

Ctrip.com International, Ltd. Annual Report 2004 43
NOTES TO THE CONSOLIDATED FINANCIAL STATEMENTS(Amounts expressed in RMB unless otherwise stated)
2. PRINCIPAL ACCOUNTING POLICIES (Continued)
c. Variable interest entities
As of December 31, 2004, the Company conducts a part of its operations through a series of agreements withcertain VIEs as stated in Note 2b above. These VIEs are used solely to facilitate the Group’s participation in internetcontent provision, advertising business, travel agency and air-ticketing services in the PRC where foreign ownershipin these areas are restricted.
Shanghai Ctrip Commerce is a domestic company incorporated in Shanghai, the PRC. Shanghai Ctrip Commerceholds an internet content provider (“ICP”) license and advertising license and is primarily engaged in the provisionof advertising business on the internet website. A director and a senior executive of the Company collectively hold100% of the equity interest in Shanghai Ctrip Commerce. The registered capital of Shanghai Ctrip Commerce as ofDecember 31, 2004 is RMB6,100,000.
Shanghai Huacheng is a domestic company incorporated in Shanghai, the PRC. Shanghai Huacheng holds adomestic travel agency license and an air transport sales agency license and mainly provides domestic tour servicesand air-ticketing services. Shanghai Ctrip Commerce and a director of the Company collectively hold 98.33% of theequity interest in Shanghai Huacheng. The registered capital of Shanghai Huacheng as of December 31, 2004 isRMB3,000,000.
Beijing Chenhao is a domestic company incorporated in Beijing, the PRC. Beijing Chenhao holds an air transportsales agency license and is mainly engaged in the provision of air-ticketing services. A director of the Company andShanghai Ctrip Commerce collectively hold 100% of the equity interest in Beijing Chenhao. The registered capital ofBeijing Chenhao as of December 31, 2004 is RMB2,000,000.
Guangzhou Guangcheng is a domestic company incorporated in Guangzhou, the PRC. Guangzhou Guangchengholds air transport sales agency license and is mainly engaged in the provision of air-ticketing services. Two seniorexecutives of the Company collectively hold 100% of the equity interest in Guangzhou Guangcheng. The registeredcapital of Guangzhou Guangcheng as of December 31, 2004 is RMB2,000,000.
Shanghai Ctrip Charming is a domestic company incorporated in Shanghai, the PRC. Shanghai Ctrip Charmingholds domestic and cross-border travel agency licenses and mainly provides domestic and cross-border tourservices. A senior executive of the Company holds 66% of the equity interest in Shanghai Ctrip Charming. Theregistered capital of Shanghai Ctrip Charming as of December 31, 2004 is RMB1,500,000.
Shenzhen Shencheng is a domestic company incorporated in Shenzhen, the PRC. Shenzhen Shencheng holds airtransport sales agency license and is engaged in the provision of air-ticketing service. Two senior executives of theCompany collectively hold 100% of the equity interest in Shenzhen Shencheng. The registered capital of ShenzhenShencheng as of December 31, 2004 is RMB1,500,000.
The capital injected by the director or senior executives are funded by the Company and were recorded as long-term loans to related parties prior to the adoption of FIN 46. The Company does not have any ownership interest inthese VIEs.
As of December 31, 2004, the Company has various agreements with its consolidated VIEs, including loanagreements, exclusive technical consulting and services agreements, share pledge agreements, exclusive optionagreements and other operating agreements.

44
NOTES TO THE CONSOLIDATED FINANCIAL STATEMENTS(Amounts expressed in RMB unless otherwise stated)
2. PRINCIPAL ACCOUNTING POLICIES (Continued)
c. Variable interest entities (Continued)
Details of certain key agreements with the VIEs are as follows:
Powers of Attorney: The equity owners of the VIEs irrevocably appointed the Company’s officers to vote on theirbehalf on all matters they are entitled to vote on, including matters relating to the transfer of any or all of theirrespective equity interests in VIEs and the appointment of the chief executive officer of the VIEs.
Share Pledge Agreements: The equity owners pledge their respective equity interests in the VIEs as a guarantee forthe payment by the VIEs of technical and consulting services fees under the exclusive technical consulting andservices agreements described above.
Exclusive Technical Consulting and Services Agreements: The Company provides the VIEs with technicalconsulting and related services and information services. The Company is the exclusive provider of these services.The initial term of these agreements is ten years. In consideration for those services, the VIEs agree to pay theCompany service fees. Those service fees are recognized as revenues prior to adoption of FIN 46. Upon adoption ofFIN 46, the service fees are eliminated upon consolidation.
Loan Agreement: Loans were granted to certain directors and officers with the sole and exclusive purpose ofproviding funds necessary for the capitalization and acquisition of the VIEs. As soon as the Chinese governmentlifts its substantial restrictions on foreign ownership of the air-ticketing, travel agency, advertising, or Internetcontent provision business in the PRC, as applicable, the Company will exercise its exclusive option to purchase alloutstanding equity interest of the VIEs and the Loan Agreements will be cancelled.
d. Foreign currencies
The Company’s functional currency is Renminbi (“RMB”). Transactions denominated in currencies other than RMBare translated into RMB at the exchange rates quoted by the People’s Bank of China (the “PBOC”) prevailing at thedates of the transactions. Gains and losses resulting from foreign currency transactions are included in theconsolidated statements of income and comprehensive income. Monetary assets and liabilities denominated inforeign currencies are translated into RMB using the applicable exchange rates quoted by the PBOC at the balancesheet dates. All such exchange gains and losses are included in the statements of income and comprehensiveincome. The exchange differences for the translation of group companies balances where RMB is not theirfunctional currency are included in translation adjustments, which is a separate component of shareholders’ equityon the consolidated financial statements.
Translations of amounts from RMB into United States dollars (“US$”) are solely for the convenience of the readerand were calculated at the rate of US$1.00 = RMB8.2765, on December 31, 2004, representing the noon buyingrate in the City of New York for cable transfers of RMB, as certified for customs purposes by the Federal ReserveBank of New York. No representation is intended to imply that the RMB amounts could have been, or could be,converted, realized or settled into US$ at that rate on December 31, 2004, or at any other rate.

Ctrip.com International, Ltd. Annual Report 2004 45
NOTES TO THE CONSOLIDATED FINANCIAL STATEMENTS(Amounts expressed in RMB unless otherwise stated)
2. PRINCIPAL ACCOUNTING POLICIES (Continued)
e. Cash
Cash represents cash on hand and demand deposits placed with banks or other financial institutions. Included inthe cash balance as of December 31, 2003 and 2004 are amounts denominated in US$ amounted toUS$46,165,668 and US$47,011,358, respectively (equivalent to approximately RMB382, 099,384 andRMB389,089,504, respectively).
f. Property, equipment and software
Property, equipment and software are stated at cost less accumulated depreciation and amortization. Depreciationand amortization are computed using the straight-line method over the following estimated useful lives, takinginto account any estimated residual value:
Building 20 yearsLeasehold improvements Lesser of the term of the lease or the estimated useful lives of the assetsWebsite-related equipment 5 yearsComputer equipment 5 yearsFurniture and fixtures 3-5 yearsSoftware 5 years
g. Goodwill and other intangible assets
In June 2001, the FASB issued Statement of Financial Accounting Standards No. 141 – “Business Combination”(“SFAS No. 141”) and SFAS No. 142 – “Goodwill and Other Intangible Assets” (“SFAS No. 142”). SFAS No. 141requires that all business combinations be accounted for under the purchase method and that certain acquiredintangible assets in a business combination be recognized as assets apart from goodwill. SFAS No. 142 requiresthat ratable amortization of goodwill be replaced with tests of the goodwill’s impairment performed at leastannually and that identifiable intangible assets other than goodwill be amortized over their estimated useful lives.The Group adopted SFAS No. 142 in 2002 and performed the initial steps of the transitional impairment tests asrequired.
Separately identifiable intangible assets that have determinable lives continue to be amortized, and consistprimarily of a customer list, a travel supplier agreement and a domestic and cross-border travel agency license. Asrequired under SFAS No. 142, the Group continues to amortize intangible assets on a straight-line basis over theirestimated useful lives, which range from one to eight years. The Group has prospectively ceased the amortization ofgoodwill upon the adoption of SFAS No. 142.
No impairment on goodwill and other intangible assets was recognized for the years ended December 31, 2002,2003 and 2004.

46
NOTES TO THE CONSOLIDATED FINANCIAL STATEMENTS(Amounts expressed in RMB unless otherwise stated)
2. PRINCIPAL ACCOUNTING POLICIES (Continued)
h. Impairment of long-lived assets
Prior to January 1, 2002, the Group evaluated the recoverability of long-lived assets in accordance with SFAS No.121 – “Accounting for the Impairment of Long-Lived Assets and for Long-Lived Assets to be Disposed of ”. As ofJanuary 1, 2002, the Group has adopted SFAS No. 144 – “Accounting for the Impairment or Disposal of Long-LivedAssets”, which addresses the financial accounting and reporting for the recognition and measurement ofimpairment losses for long-lived assets. In accordance with these standards, long-lived assets are reviewed forimpairment whenever events or changes in circumstances indicate that the carrying amount of an asset may not berecoverable. The Group recognizes impairment of long-lived assets in the event that the net book value of suchassets exceeds the future undiscounted cash flows attributable to such assets.
No impairment of long-lived assets was recognized for the years ended December 31, 2002, 2003 and 2004.
i. Long-term loans to related parties
Long-term loans to related parties were made to a director and senior executives of the Company to fund theiracquisition or establishment of certain VIEs that are used solely to facilitate the Group’s participation in Internetcontent provision, advertising business, travel agency and air-ticketing services in the PRC where foreign ownershipis restricted. The Group expects that it will continue to be involved in, and provide financial support to, the VIEs.Accordingly, to the extent losses not recoverable are incurred by the VIEs, the Group will accrue for such losses byrecording a valuation allowance against long-term loans to related parties. Upon adoption of FIN 46, the VIEs areconsolidated and our long-term loans to the related parties are eliminated upon consolidation.
j. Financial instruments
Financial instruments of the Group primarily comprise of cash, accounts receivable, due from related parties, long-term loans to related parties, accounts payable, due to related parties, advances from customers and other payables.As of December 31, 2003 and 2004, their carrying value approximated their fair value.
k. Provisions for customer reward program
The Group invites its customers to participate in a reward program, which provides travel awards and other gifts tomembers based on accumulated membership points that vary depending on the services rendered and fees paid.The estimated incremental costs to provide free travel and other gifts are recognized as sales and marketingexpense in the statements of income and comprehensive income and accrued for as a current liability as membersaccumulate points. As members redeem awards or their entitlements expire, the provision is reducedcorrespondingly. As of December 31, 2003 and 2004, the Group made provisions of RMB4,708,670 andRMB10,462,103, respectively, based on the estimated liabilities under the customer reward program.

Ctrip.com International, Ltd. Annual Report 2004 47
NOTES TO THE CONSOLIDATED FINANCIAL STATEMENTS(Amounts expressed in RMB unless otherwise stated)
2. PRINCIPAL ACCOUNTING POLICIES (Continued)
l. Revenue recognition
The Group conducts its principal businesses primarily through Ctrip Computer Technology and Ctrip TravelInformation. Some of the operations of Ctrip Computer Technology are conducted through a series of services andother agreements with the VIEs.
Ctrip Computer Technology, Ctrip Travel Information and the VIEs are subject to business tax and relatedsurcharges on the services provided in the PRC. Such tax is levied based on gross revenues at the applicable rate ofapproximately 5.5%. In the statements of income and comprehensive income, business tax and related surchargesare deducted from gross revenues to arrive at net revenues.
Hotel reservation services
The Group receives commissions from travel suppliers for hotel room reservations through the Group’s transactionand service platform. Commissions from hotel reservation services rendered are recognized after hotel customershave completed their stay at the applicable hotel and upon confirmation of pending payment of the commissionsby the hotel. Contracts with certain travel suppliers contain incentive commissions typically subject to achievingspecific performance targets and such incentive commissions are recognized when it is reasonably assured that theGroup is entitled to such incentive commissions. The Group generally receives incentive commissions from monthlyarrangements with hotels based on the number of hotel room reservations where customers have completed theirstay. The Group presents revenues from such transactions on a net basis in the statements of income andcomprehensive income as the Group does not assume any inventory risks and generally has no obligations forcancelled hotel reservations.
Air-ticketing services
The Group receives commissions from travel suppliers for air-ticketing services through the Group’s transaction andservice platform under various services agreements. Commissions from air-ticketing services rendered are recognizedafter air tickets are issued and delivered to customers. The Group presents revenues from such transactions on a netbasis in the statements of income and comprehensive income as the Group does not assume any inventory risksand generally has no obligations for cancelled airline ticket reservations.
Packaged tour
The Group receives referral fees from travel product providers for packaged tour products and services through theGroup’s transaction and service platform. Referral fees are recognized at net commission after the packaged-tourproducts and services are sold and rendered.
Shanghai Huacheng and Shanghai Ctrip Charming conduct domestic and cross-border travel tour services.Revenues, mainly referral fees, are recognized at net commission after the services are rendered. In case if ShanghaiHuacheng and Shanghai Ctrip Charming undertake the majority of the business risks and acts as principal related tothe travel tour services provided, revenues are recognized at gross amounts receive from customers after the servicesare rendered.

48
NOTES TO THE CONSOLIDATED FINANCIAL STATEMENTS(Amounts expressed in RMB unless otherwise stated)
2. PRINCIPAL ACCOUNTING POLICIES (Continued)
l. Revenue recognition (Continued)
Other businesses
Other businesses comprise primarily internet-related advertising services and the sale of VIP membership cards.
Shanghai Ctrip Commerce receives advertising revenue, which principally represent the sale of banners orsponsorship on the website from customers. Advertising revenues are recognized ratably over the fixed term of theagreement as services are provided.
Revenue from the sale of VIP membership cards is recognized when the products are sold, provided that nosignificant obligations remain for the Group.
m. Cost of services
Cost of services consists primarily of payroll compensation, telecommunication expenses, depreciation, rentals andrelated expenses incurred by the Group’s transaction and service platform which are directly attributable to therendering of the Group’s travel related services and other businesses.
n. Product development
Product development costs include expenses incurred by the Group to develop the Group’s travel supplier networksas well as to maintain, monitor and manage the Group’s transaction and service platforms. The Group recognizeswebsite and software development costs in accordance with Statement of Position (“SOP”) No. 98-1 – “Accountingfor the Costs of Computer Software Developed or Obtained for Internal Use”. As such, the Group expenses all coststhat are incurred in connection with the planning and implementation phases of development and costs that areassociated with repair or maintenance of the existing websites or the development of software and websitescontent. Costs incurred in the development phase are capitalized and amortized over the estimated product life.Since the inception of the Group, the amount of costs qualifying for capitalization has been immaterial and as aresult, all website and software development costs have been expensed as incurred.
o. Sales and marketing
Sales and marketing costs consist primarily of costs of advertising expenses, commission fees, production costs ofmarketing materials, expenses associated with the Company’s customer reward program and payroll and relatedcompensation for the Company’s sales and marketing personnel. Advertising expenses, amounted toRMB4,949,206, RMB5,245,937 and RMB10,648,334 for the years ended December 31, 2002, 2003 and 2004,respectively, are charged to the statements of income and comprehensive income when incurred.

Ctrip.com International, Ltd. Annual Report 2004 49
NOTES TO THE CONSOLIDATED FINANCIAL STATEMENTS(Amounts expressed in RMB unless otherwise stated)
2. PRINCIPAL ACCOUNTING POLICIES (Continued)
p. Share-based compensation
The Company accounts for share-based compensation arrangements in accordance with Accounting PrinciplesBoard (“APB”) Opinion No. 25 – “Accounting for Stock Issued to Employees” (“APB No. 25”), and complies with thedisclosure provisions of SFAS No. 123 – “Accounting for Stock-Based Compensation” (“SFAS No. 123”). In general,compensation cost under APB No. 25 is recognized based on the difference, if any, between the estimated fairvalue of the Company’s ordinary shares and the amount an employee is required to pay to acquire the ordinaryshares, as determined on the date the option is granted. Total compensation cost as determined at the grant dateof option is recorded in shareholders’ equity as additional paid-in-capital with an offsetting entry recorded todeferred share-based compensation. Deferred share-based compensation is amortized on a straight-line basis andcharged to expense over the vesting period of the underlying options.
If the compensation cost for the Company’s share-based compensation plan had been determined based on theestimated fair value at the grant dates for the share option awards as prescribed by SFAS No. 123, the Company’snet income (loss) attributable to ordinary shareholders and earnings (loss) per share would have resulted in the proforma amounts disclosed below:
2002 2003 2004
RMB RMB RMB
Net income (loss) attributable to ordinaryshareholders as reported (19,061,315) 1,373,167 133,126,290
Add: Compensation expense under APB No. 25 462,140 1,583,409 1,958,022Less: Compensation expense under SFAS No. 123 (528,074) (2,172,399) (5,720,437)
Pro forma net income (loss) attributableto ordinary shareholders (19,127,249) 784,177 129,363,875
Basic earnings (loss) per share– As reported (2.00) 0.13 4.33
– Pro forma (2.01) 0.07 4.21
Diluted earnings (loss) per share– As reported (2.00) 0.11 4.23
– Pro forma (2.01) 0.06 4.11
The effects of applying SFAS No. 123 methodology in this pro forma disclosure are not indicative of futureamounts. Additional share option awards in future years are expected.

50
NOTES TO THE CONSOLIDATED FINANCIAL STATEMENTS(Amounts expressed in RMB unless otherwise stated)
2. PRINCIPAL ACCOUNTING POLICIES (Continued)
q. Operating leases
Leases where substantially all the rewards and risks of ownership of assets remain with the leasing company areaccounted for as operating leases. Payments made under operating leases net of any incentives received by theGroup from the leasing company are charged to the statements of income and comprehensive income on astraight-line basis over the lease periods.
r. Taxation
Deferred income taxes are provided using the balance sheet liability method. Under this method, deferred incometaxes are recognized for the tax consequences of significant temporary differences by applying enacted statutoryrates applicable to future years to differences between the financial statement carrying amounts and the tax basesof existing assets and liabilities. The tax base of an asset or liability is the amount attributed to that asset orliability for tax purposes. The effect on deferred taxes of a change in tax rates is recognized in income in the periodthat includes the enactment date. A valuation allowance is provided to reduce the amount of deferred tax assets ifit is considered more likely than not that some portion of, or all of, the deferred tax assets will not be realized.
s. Other income
Other income primarily consists of financial subsidies insurance sales income and credit card processing fee. Duringthe year ended December 31, 2002, 2003 and 2004, the Group received financial subsidies amounted toRMB783,900, RMB4,991,204 and RMB6,165,086, respective, from local PRC government authority. Such amountswere recorded as other income in the statement of income and comprehensive income. There are no defined rulesand regulations to govern the criteria necessary for companies to enjoy such benefits and the amount of financialsubsidy are determined at the discretion of the relevant government authority. Financial subsidies are recognized asother income when received.
t. Statutory reserves
The Company’s PRC subsidiaries and the VIEs are required to allocate at least 10% of their after-tax profitaccording to the general reserve in accordance with the PRC accounting standards and regulations. The allocationto the general reserve can be stopped if such reserve has reached 50% of the registered capital of each company.Appropriations to the enterprise expansion fund and staff welfare and bonus fund are at the discretion of the boardof directors of Ctrip Computer Technology and Ctrip Travel Information, the subsidiaries of the Company. Inaddition, the VIEs are required to allocate at least 5% of its after-tax profit to the statutory welfare fund. Thesereserves can only be used for specific purposes and are not transferable to the Company in form of loans, advances,or cash dividends. During the years ended December 31, 2002, 2003 and 2004, appropriations to statutory reserveshave been made of nil, RMB5,531,309 and RMB13,725,553, respectively.

Ctrip.com International, Ltd. Annual Report 2004 51
NOTES TO THE CONSOLIDATED FINANCIAL STATEMENTS(Amounts expressed in RMB unless otherwise stated)
2. PRINCIPAL ACCOUNTING POLICIES (Continued)
u. Dividends
Dividends are recognized when declared.
PRC regulations currently permit payment of dividends only out of accumulated profits as determined inaccordance with PRC accounting standards and regulations. The Company’s PRC subsidiaries and the VIEsubsidiaries can only distribute dividends after they have met the PRC requirements for appropriation to statutoryreserves (Note 2(t)). Additionally, as the Company does not have any direct ownership in the VIE subsidiaries, theVIE subsidiaries cannot directly distribute dividend to the Company.
Aggregate net assets of all of the Group’s PRC subsidiaries and VIE subsidiaries not distributable in the form ofdividends to the parent as a result of the aforesaid PRC regulation and the Company’s organizational structure wereRMB128 million and 261 million as of December 31, 2003 and 2004, respectively. However, the Group’s PRCsubsidiaries or VIE subsidiaries may transfer such net assets to the Company or its shareholders by other means,including through royalty and trademark license agreements or certain other contractual arrangements, at thediscretion of the Company without third party consent.
On August 27, 2003, the Company’s Board of Directors resolved to distribute all equity interest of the Company inHome Inns Hong Kong to the then existing holders of Series A and Series B Convertible Preferred Shares andordinary shares respectively as dividends on a pro rata as-converted basis, based on the carrying value of the equityinterest which was RMB4,611,623. The allocation for the dividends to the then existing holders of Series A andSeries B Convertible Preferred Shares and ordinary shares were RMB808,827, RMB2,020,237 and RMB1,782,559,respectively. The number of shares of Home Inns Hong Kong distributed to the holders of Series A and Series BConvertible Preferred Shares and ordinary shares were 1,543,427 shares, 3,855,067 shares and 3,401,506 shares,respectively.
On November 5, 2004, the Company announced that the shareholders have adopted a resolution to approve theCompany’s proposed distribution of 30% of its net income for 2004 (as reported in the audited consolidatedfinancial statements of the Company for the year ended December 31, 2004) to the shareholders of record as ofDecember 31, 2004 as dividend provided that the Company’s net income for 2004 exceeds US$10 million. TheCompany’s Board of Directors has also approved such proposed dividend distribution. The Company has accruedRMB39,937,887 dividend payable for the year ended December 31, 2004.
v. Earnings (loss) per share
In accordance with SFAS No. 128, “Computation of Earnings Per Share” (“SFAS No. 128”) and EITF Issue 03-6,“Participating Securities and the Two-Class Method under FASB Statement No. 128”, basic earnings (loss) per shareis computed by dividing net income (loss) attributable to common shareholders by the weighted average number ofunrestricted ordinary shares outstanding during the year using the two-class method. Under the two class method,net income is allocated between ordinary shares and other participating securities based on their participatingrights. The Company’s Series A, B and C Preferred Shares (Note 8 – 10) are participating securities. Diluted earnings(loss) per share is calculated by dividing net income (loss) attributable to common shareholders as adjusted for theeffect of dilutive ordinary equivalent shares, if any, by the weighted average number of ordinary and dilutiveordinary equivalent shares outstanding during the year. Ordinary equivalent shares consist of the ordinary sharesissuable upon the conversion of the convertible Preferred shares (using the if-converted method) and ordinaryshares issuable upon the exercise of outstanding share options (using the treasury stock method).

52
NOTES TO THE CONSOLIDATED FINANCIAL STATEMENTS(Amounts expressed in RMB unless otherwise stated)
2. PRINCIPAL ACCOUNTING POLICIES (Continued)
w. Segment reporting
The Company follows SFAS No. 131 – “Disclosures about Segment of an Enterprise and Related Information”.
The Company operates and manages its business as a single segment. The Company primarily generates itsrevenues from customers in China. Accordingly, no geographical segments are presented.
x. Recent accounting pronouncements
In March 2004, the Emerging Issues Task Force (“EITF”) reached a consensus on Issue No. 03-06, “ParticipatingSecurities and the Two-Class Method under FASB Statement No. 128” (“EITF No. 03-06”). EITF No. 03-06 providesguidance regarding the computation of earnings per share by companies that have issued securities other thancommon shares that entitle the holder to participate in dividends and earnings of the company. In addition, EITFNo. 03-06 provides further guidance on what constitutes a participating security and requires the application ofthe two-class method in determining earnings per share. EITF No. 03-06 is effective for the quarter ending June30, 2004. The Company has adopted EITF No. 03-06 for the year ended December 31, 2004 and has retroactivelyapplied the consensus in determining the earnings per share for years ended December 31, 2002 and 2003(see Note 15).
In March 2004, the EITF reached a consensus on Issue No. 03-01 “The Meaning of Other-Than-TemporaryImpairment and Its Application to Certain Investments” (“EITF No. 03-01”). EITF No. 03-01 provides recognitionand measurement guidance on the meaning of other-than-temporary impairment and its application to certaininvestments carried at cost, including investments in marketable securities accounted for under SFAS No. 115,“Accounting for Certain Investments in Debt and Equity Securities”. Additionally, EITF No. 03-01 provides disclosurerequirements of the investor when determining if an investment is impaired. The recognition and measurementguidance in EITF No. 03-01 has been postponed but the disclosure requirement under the EITF are effective forfinancial statements for 2004. The adoption of the recognition and measurement requirements of EITF No. 03-01will not have a material effect on the Company’s financial position or results of operations.
In June 2004, the EITF reached a consensus on Issue No. 02-14 “Whether the Equity Method of Accounting AppliesWhen an Investor Does Not Have an Investment in Voting Stock of an Investee but Exercises Significant Influencethrough Other Means” (“EITF No. 02-14”). EITF No. 02-14 provides guidance that an investor should only applythe equity method of accounting when it has investments in either common stock or in-substance common stockof a corporation, provided that the investor has the ability to exercise significant influence over the operating andfinancial policies of the investee. The EITF defined in-substance common stock as an investment that has risk andreward characteristics that are substantially similar to common stock. EITF No. 02-14 is effective for reportingperiods beginning after September 15, 2004. The adoption of EITF No. 02-14 will not have a material effect on theCompany’s historical financial position or results of operations.

Ctrip.com International, Ltd. Annual Report 2004 53
NOTES TO THE CONSOLIDATED FINANCIAL STATEMENTS(Amounts expressed in RMB unless otherwise stated)
2. PRINCIPAL ACCOUNTING POLICIES (Continued)
x. Recent accounting pronouncements (Continued)
In September 2004, the EITF reached a consensus on Issue No. 04-01 “Accounting for Pre-existing Relationshipsbetween the Parties to a Business Combination” (“EITF No. 04-01”) and states that the consummation of a businesscombination between two parties that have a pre-existing contractual relationship should be evaluated todetermine if a settlement of the pre-existing contractual relationship occurred. Additionally, the EITF providesguidance on the measurement and recognition of the pre-existing relationship. The provisions of EITF No. 04-01are applicable to business combinations completed in reporting periods after October 13, 2004. The adoption ofEITF No. 04-01 did not have a material effect on the Company’s financial position or results of operations.
On December 15, 2004, the FASB issued Statement No. 153, “Exchanges of Non monetary Assets, an amendment ofAPB Opinion No. 29” (SFAS No. 153). SFAS No. 153 requires exchanges of productive assets to be accounted for atfair value, rather than at carryover basis, unless (1) neither the asset received nor the asset surrendered has a fairvalue that is determinable within reasonable limits or (2) the transactions lack commercial substance. SFAS No. 153is effective for non monetary asset exchanges occurring in fiscal periods beginning after June 15, 2005. TheCompany does not expect the adoption of SFAS No. 153 to have a material impact on the Company’s financialposition or results of operation.
In December 2004, the FASB issued its final standard on “Accounting for Share-Based Compensation”, FASBStatement No. 123R (revised 2004), Share-Based Compensation (“SFAS 123R”), that requires companies to expensethe value of employee stock options and similar awards. This Statement supersedes APB No. 25. Under SFAS 123R,share-based compensation will be measured at fair value on the awards’ grant date, based on the estimated numberof awards that are expected to vest. SFAS 123R is effective for public companies for annual periods beginning afterJune 15, 2005 and applies to all outstanding and unvested share-based payment awards at a company’s adoptiondate. Under SFAS 123R, the Company could select from three transition methods: (1) The modified prospectivemethod, where the expenses related to unvested but still outstanding options as calculated under the originalSFAS 123 be charged to expense without any change in measurement (2) A variation of the modified prospectivemethod, where in addition to (1), it allow restatement for prior interim periods using its prior SFAS 123 pro formadisclosure amounts; and (3) The modified retrospective method, where all prior period financial statements areretroactively restated based on pro forma disclosures as calculated under the original SFAS 123R. All options issuedafter adoption of SFAS 123R should be accounted for under that standard.
The Company plans to adopt SFAS 123R beginning January 1, 2006 and select the modified prospectivetransitional method of application of SFAS 123R, with no restatement of interim periods or annual periods prior tothe effective date. Upon adoption, the Company will recognize share-based compensation relating to the unvestedportion of the outstanding grants based on the fair value of the options as determined under SFAS No. 123 asdisclosed in Note 2(P). New options to be issued after the effective date will be recognized based on the provisionsof SFAS 123R.

54
NOTES TO THE CONSOLIDATED FINANCIAL STATEMENTS(Amounts expressed in RMB unless otherwise stated)
2. PRINCIPAL ACCOUNTING POLICIES (Continued)
y. Certain risks and concentration
Financial instruments that potentially subject the Company to significant concentrations of credit risk consistprimarily of cash, accounts receivable, due from related parties and prepayments and other current assets. As ofDecember 31, 2003 and 2004, substantially all of the Company’s cash was held in major financial institutionslocated in the PRC and in Hong Kong, which management considers to be of high credit quality. Accountsreceivable are typically unsecured and denominated in RMB, and are derived from revenues earned from operationsarising in the PRC.
No individual customer accounted for more than 10% of net revenues for the years ended December 31, 2002,2003 and 2004. No individual customer accounted for more than 10% of accounts receivable as ofDecember 31, 2003 and 2004.
3. INVESTMENTS IN JOINT VENTURE COMPANIES
In 2002, Home Inns Hong Kong, an investment holding company, together with a Chinese joint venture partner,established joint venture companies engaged in hotel investment, management and franchise operations in thePRC.
The operations of the joint venture companies have not been included in the consolidated financial statements asthe Group does not exercise effective control over these companies due to certain substantive participating rightsheld by the minority shareholders.
On August 27, 2003, all the equity interest in Home Inns Hong Kong and its interest in the joint venturecompanies were distributed to the then existing holders of Series A and Series B Convertible Preferred Shares andordinary shares as share dividends on a pro rata as-converted basis.
Combined financial information of the joint venture companies as of and for the years ended December 31, 2002and 2003, based on their management accounts, are as follows:
2002 2003
RMB RMB(unaudited) (unaudited)
Balance sheet:Current assets 5,448,470 –Less: current liabilities (2,331,894) –Non-current assets 6,160,108 –
Net assets 9,276,684 –
Statement of operations:Revenues 4,414,845 21,138,389*Net loss (723,316) 715,479*
* Comprised result of operations of the joint venture companies up to August 27, 2003.

Ctrip.com International, Ltd. Annual Report 2004 55
NOTES TO THE CONSOLIDATED FINANCIAL STATEMENTS(Amounts expressed in RMB unless otherwise stated)
4. PREPAYMENTS AND OTHER CURRENT ASSETS
Components of prepayments and other current assets as of December 31 are as follows:
2003 2004
RMB RMB
Prepayments for hotel, air-ticketing reservation andpackaged tour business 2,065,640 5,445,810
Employee advances 200,904 295,181Inventory for resale 80,825 675,629Rental and other deposits 1,417,783 1,152,178Prepayments for acquisition of property, equipment and software 1,401,810 291,359Prepayments for rental and advertisement 1,083,020 2,970,890Receivables from financial institution – 5,696,045Interest receivable 76,950 449,970Others 804,015 1,526,716
Total 7,130,947 18,503,778
5. PROPERTY, EQUIPMENT AND SOFTWARE
Property, equipment and software and its related accumulated depreciation and amortization as of December 31are as follows:
2003 2004
RMB RMB
Building 7,189,803 7,569,600Leasehold improvements 3,786,031 6,424,504Website-related equipment 4,883,843 8,870,806Computer equipment 11,400,715 14,988,961Furniture and fixtures 5,621,811 9,542,627Software 621,363 621,363Less: accumulated depreciation and amortization (10,224,319) (16,120,210)
Net book value 23,279,247 31,897,651

56
NOTES TO THE CONSOLIDATED FINANCIAL STATEMENTS(Amounts expressed in RMB unless otherwise stated)
6. OTHER INTANGIBLE ASSETS
Gross carrying amount, accumulated amortization and net book value of other intangible assets as of December 31are as follows:
2003 2004
RMB RMB
Other intangible assets –Customer list 1,766,206 1,766,206Travel supplier agreement 800,000 800,000Cross-border travel agency license 1,117,277 1,117,277
3,683,483 3,683,483
Less: accumulated amortization –Customer list (1,133,315) (1,486,555)Travel supplier agreement (800,000) (800,000)Cross-border travel agency license (34,915) (174,575)
(1,968,230) (2,461,130)
Net book value 1,715,253 1,222,353
The annual estimated amortization expense for the acquired intangible assets for the following years is as follows:
Amortization
RMB
2005 419,3102006 139,6602007 139,6602008 139,6602009 and thereafter 384,063
1,222,353

Ctrip.com International, Ltd. Annual Report 2004 57
NOTES TO THE CONSOLIDATED FINANCIAL STATEMENTS(Amounts expressed in RMB unless otherwise stated)
7. TAXATION
Cayman Islands
Under the current laws of Cayman Islands, the Company is not subject to tax on income or capital gain. Inaddition, upon payments of dividends by the Company to its shareholders, no Cayman Islands withholding tax willbe imposed.
Hong Kong
The Company’s subsidiaries did not have assessable profits that were earned in or derived from Hong Kong duringthe years ended December 31, 2002, 2003 and 2004. Accordingly, no Hong Kong profit tax has been provided for.
China
The Company’s subsidiaries, its VIEs and joint venture companies registered in the PRC are subject to PRCEnterprise Income Tax (“EIT”) on the taxable income as reported in their respective statutory financial statementsadjusted in accordance with relevant PRC income tax laws. Normally, in accordance with “Income Tax Law of Chinafor Enterprises with Foreign Investment and Foreign Enterprises”, the applicable EIT rates are 30% plus a localincome tax of 3% except for Ctrip Computer Technology, Ctrip Travel Information and Shenzhen Shencheng.
Ctrip Computer Technology received approval from relevant PRC government authorities to be classified as a “HighNew Technology Development Enterprise” in September 2003 and subsequently received an approval from therelevant tax bureau to enjoy a preferential EIT rate of 15% for the year ended December 31, 2003. Accordingly, EITpreviously accrued on a rate of 33% of approximately RMB5 million during the period from January 1, 2003 toSeptember 30, 2003 was reversed to reflect the preferential EIT rate of 15% in the fourth quarter of 2003. CtripComputer Technology’s fulfillment of the qualification for the preferential EIT rate will be reassessed on an annualbasis. Ctrip Computer Technology has passed the reassessment for the year ended December 31, 2004.
Ctrip Travel Information historically enjoyed a preferential income tax rate of 15% as it is registered in Pudong NewDistrict, Shanghai. During the fourth quarter of 2004, Ctrip Travel Information obtained approval from the relevanttax bureau for full exemption of income tax for 2004 and a 50% reduction of the income tax statutory rate for theperiod from 2005 to 2007 as it obtained the status of “software development company”. Accordingly, income taxpreviously paid for 2004 at the 15% rate of approximately RMB8 million was refunded and the amount has beenreflected as a tax benefit for the fourth quarter of 2004. Ctrip Travel Information’s fulfillment of the qualificationfor the preferential EIT rate will be reassessed on an annual basis. Ctrip Travel Information has passed thereassessment for the year ended December 31, 2004.
Shenzhen Shencheng which is registered in Shenzhen City, the PRC, is entitled to a preferential tax rate of 15%granted by the local PRC tax bureau.

58
NOTES TO THE CONSOLIDATED FINANCIAL STATEMENTS(Amounts expressed in RMB unless otherwise stated)
7. TAXATION (Continued)
Composition of income tax expense
The current and deferred portion of income tax expense included in the consolidated statements of income andcomprehensive income for the years ended December 31 are as follows:
2002 2003 2004
RMB RMB RMB
Current income tax expense (797,788) (10,197,561) (12,985,224)Recognition (utilization) of deferred tax assets (9,244,836) (51,843) 468,103
Income tax expense (10,042,624) (10,249,404) (12,517,121)
Reconciliation of the differences between statutory tax rate and the effective tax rate
A reconciliation between the statutory EIT rate and the Group’s effective tax rate for the years ended December 31is as follows:
2002 2003 2004
Statutory EIT rate 33% 33% 33%Tax differential from statutory rate applicable to
subsidiaries in the PRC – (20)% (25)%Non-deductible expenses incurred outside the PRC 7% 3% 1%Other non-deductible expenses 1% – –
Effective EIT rate 41% 16% 9%
Significant components of deferred tax assets
2003 2004
RMB RMB
Temporary differences 541,300 1,009,403Less: valuation allowance – –
Deferred tax assets 541,300 1,009,403

Ctrip.com International, Ltd. Annual Report 2004 59
NOTES TO THE CONSOLIDATED FINANCIAL STATEMENTS(Amounts expressed in RMB unless otherwise stated)
8. SERIES A CONVERTIBLE PREFERRED SHARES
In March 2000, the Company entered into a Series A Preferred Share Subscription Agreement, whereby theCompany authorized and issued 432,000 shares of the Company’s Series A Convertible Preferred Shares (“Series APreferred Shares”) at an issue price of $10.4167 per share. In June 6, 2000, the Company increased the number ofSeries A Preferred Shares from 432,000 shares to 4,320,000 shares by decreasing the par value from US$0.10 eachto US$0.01 each. The authorized and issued Series A Preferred Shares was increased to 4,320,000 sharesaccordingly.
A holder of Series A Preferred Shares could convert all but not part at any time after issuance date into suchnumber of fully paid and non-assessable ordinary shares at a conversion price of US$1.04167 (each Series AConvertible Preferred Share is convertible into one ordinary share). No beneficial conversion feature charge wasrecognized for the issuance of Series A Preferred Shares as the estimated fair value of the ordinary shares is lessthan the conversion price on the date of issuance.
Each Series A Preferred Share is automatically converted into ordinary shares at the then effective conversion priceupon the closing of a qualified underwritten public offering of the ordinary shares of the Company. Upon thecompletion of the Company’s initial public offering on December 9, 2003, all of the issued and outstanding SeriesA Preferred Shares were converted into ordinary shares.
9. SERIES B REDEEMABLE CONVERTIBLE PREFERRED SHARES
In November 2000, the Company entered into a Series B Preferred Shares Subscription Agreement, whereby theCompany authorized and issued 7,193,464 shares of the Company’s Series B Mandatory Redeemable ConvertiblePreferred Shares (“Series B Preferred Shares”) at an issue price of US$1.5667 per share.
Prior to the issuance of Series C Convertible Preferred Shares, each Series B Preferred Share were redeemable at theoption of the holders of a majority of the then outstanding shares of Series B Preferred Shares at any timecommencing five calendar years after the Series B Preferred Shares issue date, at a redemption price equal toUS$3.13334 per share plus all declared but unpaid dividends.
A holder of Series B Preferred Shares could convert all but not part at any time after issuance date into suchnumber of fully paid and non-assessable ordinary shares at an initial conversion price of US$1.04445 (each Series BConvertible Preferred Share is convertible into 1.5 ordinary shares). Upon the issuance of Series C ConvertiblePreferred Shares, holders of Series B Preferred Shares agreed to forfeit its redemption rights for no consideration.
No beneficial conversion feature charge was recognized for the issuance of Series B Preferred Shares as theestimated fair value of the ordinary shares is less than the conversion price on the date of issuance.
Each Series B Preferred Share is automatically converted into ordinary shares at the then effective conversion priceupon the closing of a qualified underwritten public offering of the ordinary shares of the Company. Upon thecompletion of the Company’s initial public offering on December 9, 2003, all of the issued and outstanding SeriesB Preferred Shares were converted into ordinary shares.

60
NOTES TO THE CONSOLIDATED FINANCIAL STATEMENTS(Amounts expressed in RMB unless otherwise stated)
10. SERIES C CONVERTIBLE PREFERRED SHARES
In September 2003, the Company entered into a Series C Preferred Share Subscription Agreement, whereby theCompany authorized and issued 2,180,755 shares of the Company’s Series C Convertible Preferred Shares (“Series CPreferred Shares”) at an issue price of $4.5856 per share.
In September 2003, immediately after the issuance of Series C Preferred Shares, the net proceeds received frominvestors were fully utilized to repurchase 842,938, 382,482 and 636,891 shares of Company’s ordinary shares,Series A and Series B Preferred Shares at US$4.5282, US$4.5282 and US$6.7924, respectively, on a pro-rata as-converted basis. The repurchase price per share for each class of shares was determined based on the issuance priceof Series C Preferred Shares adjusted for the legal and professional fees and conversion features, where applicable.
As the purchase price of the Series A and Series B Preferred Shares were higher than the carrying value on the dateof the repurchase, the excess of the purchase price over the carrying value were recognized as deemed dividends tothe holders of Preferred Shares upon repurchase. The amount of deemed dividend was RMB11,223,324 andRMB24,112,826 for Series A and Series B Preferred Shares, respectively.
A holder of Series C Preferred Shares could convert all but not part at any time after issuance date into suchnumber of fully paid and non-assessable ordinary shares at a conversion price of US$4.5856 (each Series CConvertible Preferred Share is convertible into one ordinary share).
No beneficial conversion feature charge was recognized for the issuance of Series C Preferred Shares as theestimated fair value of the ordinary shares is less than the conversion price on the date of issuance.
Each Series C Preferred Share is automatically converted into ordinary shares at the then effective conversion priceupon the closing of a qualified underwritten public offering of the ordinary shares of the Company. Upon thecompletion of the Company’s initial public offering on December 9, 2003, all of the issued and outstanding SeriesC Preferred Shares were converted into ordinary shares.
11. SHARE OPTION PLAN
On April 15, 2000, the Company adopted a share option plan that provides for the issuance of up to 144,000ordinary shares in effect for a term of 10 years unless terminated earlier by shareholders and Board of Directors(“2000 Option Plan”). Under this share option plan, the directors may, at their discretion, grant any seniorexecutives (including directors) and employees of the Company and/or its subsidiaries to take up share options tosubscribe for shares. These share options are vested over a period of 3 years and can be exercised within 5 yearsfrom the date of grant. On June 6, 2000, the Company increased the number of ordinary shares from 2,000,000shares to 20,000,000 shares by decreasing the par value from US$0.10 each to US$0.01 each. The total number ofordinary shares reserved for the share option plan increased from 144,000 to 1,440,000 accordingly. OnJuly 1, 2001, the total number of ordinary shares reserved for the share option plan was further increased to1,728,000 shares. All share options granted under the 2000 Option Plan have an exercise price of US$0.7716. As ofDecember 31, 2004, 190,956 options were outstanding under the 2000 Option Plan.

Ctrip.com International, Ltd. Annual Report 2004 61
NOTES TO THE CONSOLIDATED FINANCIAL STATEMENTS(Amounts expressed in RMB unless otherwise stated)
11. SHARE OPTION PLAN (Continued)
The following table summarizes the Company’s share option activity under the 2000 Option Plan as of and for theyears ended December 31:
2002 2003 2004
Outstanding at beginning of year 1,330,100 1,448,720 1,389,880Granted 253,440 113,200 –Exercised – (144,000) (1,160,044)Forfeited (134,820) (28,040) (38,880)
Outstanding at end of year 1,448,720 1,389,880 190,956
Vested and exercisable at end of year 803,425 1,114,680 66,529
Subsequent to December 31, 2004, 2,320 options under the 2000 Option Plan were exercised as atFebruary 21, 2005.
On April 15, 2003, the Company adopted a new share option plan that provides for the issuance of up to 1,187,510ordinary shares (“2003 Option Plan”). Under this share option plan, the directors may, at their discretion, grant anysenior executives (including directors) and employees of the Company and/or its subsidiaries to take up shareoptions to subscribe for shares. These share options are vested over a period of 3 years and can be exercised within5 years from the date of grant. As of December 31, 2004, 933,047 options were outstanding under the 2003Option Plan.
The following table summarizes the Company’s share option activity under the 2003 Option Plan as of and for theyears ended December 31:
2003 2004
Outstanding at beginning of year – 977,440Granted 980,640 257,600Exercised – (234,177)Forfeited (3,200) (67,816)
Outstanding at end of year 977,440 933,047
Vested and exercisable at end of year – 90,303
On November 5, 2004, the board of directors adopted a 2005 Employee’s Stock Option Plan (“2005 Option Plan”),which will cover the Company’s option issuances during the period from 2005 to 2009. The Company has reserved3,000,000 ordinary shares for future issuances of options under the 2005 Option Plan. The terms of the 2005Option Plan are substantially similar to the Company’s 2003 Option Plan. The 2005 Option Plan is subject toshareholders’ approval within 12 months after November 2004.

62
NOTES TO THE CONSOLIDATED FINANCIAL STATEMENTS(Amounts expressed in RMB unless otherwise stated)
11. SHARE OPTION PLAN (Continued)
The following is additional information relating to options outstanding as of December 31, 2004:
Outstanding ExercisableWeighted- Weighted-
average averageWeighted- Remaining Weighted- Remaining
Range of Number of Average Contractual Number of Average ContractualExercise Prices shares Exercise Price Life (Years) shares Exercise Price Life (Years)
$0-$4.99 724,201 1.7571 3.0706 132,182 1.4364 1.4387$5.00-$7.49 138,858 6.4059 3.9167 22,653 6.2679 3.9167$7.50-$9.99 25,330 7.6500 3.9583 1,997 7.6500 3.9583$10.00-$16.99 235,614 13.2177 4.5538 – – –
1,124,003 156,832
In connection with the share options granted during the years ended December 31, 2002, 2003 and 2004, theCompany recognized deferred share-based compensation amounted to RMB981,197, RMB3,917,947 and nil,respectively, which is being amortized over the vesting period of three years. Share-based compensation expenserecognized during the years ended December 31, 2002, 2003 and 2004, amounted to RMB462,140, RMB1,583,409and RMB1,958,022, respectively.
The Company calculated the estimated fair value of share options on the date of grant using the Black-Scholespricing method with the following assumptions:
2002 2003 2004
Risk-free interest rate 2.65% 2.65% 2.65%Expected life (years) 5 5 5Expected dividend yield 0 0 0Volatility 0 0 65% ~ 76%Fair value of options at grant date from US$0.8628 from US$0.6701 from US$7.5838
To US$1.1311 to US$2.8505 to US$9.4613
If compensation cost for the Company’s share-based compensation plan been determined based on the estimatedfair value at the grant dates for the share option awards as prescribed by SFAS No. 123, the Company’s net income(loss) attributable to ordinary shareholders during the years ended December 31, 2002, 2003 and 2004 will beRMB(19,127,249), RMB784,177 and RMB129,363,875, respectively (Note 2p).

Ctrip.com International, Ltd. Annual Report 2004 63
NOTES TO THE CONSOLIDATED FINANCIAL STATEMENTS(Amounts expressed in RMB unless otherwise stated)
12. EMPLOYEE BENEFITS
The full-time employees of Ctrip Computer Technology, Ctrip Travel Information and the VIEs, which wereestablished in the PRC, are entitled to staff welfare benefits including medical care, welfare subsidies,unemployment insurance and pension benefits. Ctrip Computer Technology, Ctrip Travel Information and the VIEsare required to accrue for these benefits based on certain percentages of the employees’ salaries in accordance withthe relevant PRC regulations and make contributions to the state-sponsored pension and medical plans out of theamounts accrued for medical and pension benefits. The total provision accrued for such employee benefitsamounted to RMB3,458,859, RMB4,973,561 and RMB11,818,432 for the years ended December 31, 2002, 2003and 2004, respectively. The PRC government is responsible for the medical benefits and ultimate pension liability tothese employees.
13. RELATED PARTY TRANSACTIONS
During the years ended December 31, significant related party transactions are as follows:
2002 2003 2004
RMB RMB RMB
Air-ticketing service fees from Beijing Chenhao (Note a) 1,208,673 1,358,612 –Packaged tour service fees from Shanghai Huacheng
(Note a) 217,530 140,000 –Advertising service fees from Shanghai Ctrip
Commerce (Note a) 684,675 678,502 –Commission income from joint venture companies of
Home Inns Hong Kong 163,548 622,452 489,432Sales and marketing expense to joint venture companies
of Home Inns Hong Kong – 160,000 –Rental expense to a related party – 500,000 500,000
(Note a) Prior to the adoption of FIN 46 in July 2003, Beijing Chenhao, Shanghai Huacheng and Shanghai Ctrip Commerce wereconsidered related parties as these VIEs were owned by directors and senior executives of the Company. Upon theadoption of FIN 46, these VIEs are included in the consolidated financial statements of the Company.

64
NOTES TO THE CONSOLIDATED FINANCIAL STATEMENTS(Amounts expressed in RMB unless otherwise stated)
13. RELATED PARTY TRANSACTIONS (Continued)
As of December 31, significant balances with related parties are as follows:
2003 2004
RMB RMB
Due from related parties:Due from joint venture companies of Home Inns Hong Kong 611,640 59,252
Long-term loans to related parties:– Senior executives 2,310,000 500,000
Due to related parties:Advance from a director for stock option 4,018,284 2,677,668Due to other related parties – 701,312
4,018,284 3,378,980
The amounts due from and due to related parties as of December 31, 2003 and 2004, mainly arose from thetransactions disclosed above and revenue received and expenses paid on behalf on each other. They are unsecured,interest-free and have no fixed repayment terms.
The long-term loans to related parties as of December 31, 2003 represented loan granted to a senior executive forthe purpose of making further capital contribution into Shanghai Ctrip Charming. However, the additional capitalcontribution to Shanghai Ctrip Charming was delayed due to certain administrative reasons and accordingly the fullamount was subsequently repaid to the Group. The long-term loans to related parties as of December 31, 2004represented loan granted to two senior executives for the purpose of establishing a VIE. However, the VIE wassubsequently deregistered and the full amount was subsequently repaid to the Group.
In 2003, a director made payment of RMB4,018,284 to the Company for early exercise of his options issued underthe 2003 Option Plan to purchase 230,000 ordinary shares. In connection with the early exercise, the Company hasa call option to repurchase the shares that are not yet vested if the employee terminates prior to the option’svesting at the original exercise price. As the early exercise of the options is not considered a substantial exercise foraccounting purposes, the cash paid for the exercise price is recognized as a liability and such ordinary shares arenot considered issued.

Ctrip.com International, Ltd. Annual Report 2004 65
NOTES TO THE CONSOLIDATED FINANCIAL STATEMENTS(Amounts expressed in RMB unless otherwise stated)
14. OTHER PAYABLES AND ACCRUALS
Components of other payables and accruals as of December 31 are as follows:
2003 2004
RMB RMB
Deposits received from suppliers 647,456 1,349,962Accrued operating expenses 3,495,541 8,376,133Accrued share issuance costs 12,519,542 –Others 924,118 1,029,695
Total 17,586,657 10,755,790
15. EARNINGS (LOSS) PER SHARE
Basic earnings (loss) per share and diluted earnings (loss) per share have been calculated in accordance with SFASNo. 128 as follows:
2002 2003 2004
RMB RMB RMB
Numerator:Net income for the year 14,193,533 53,813,515 133,126,290Accretion for Series B Redeemable Convertible
Preferred Shares (16,492,526) (12,365,534) –Dividends to holders of Series A and Series B
Preferred Shares (16,762,322) – –Dividends to holders of Series A and Series B
Convertible Preferred Shares for spin-off ofjoint venture companies – (2,829,064) –
Deemed dividends upon repurchase of Preferred Shares – (35,336,150) –Amount allocated to participating preference
shareholders – (1,909,600) –
Numerator for basic earnings (loss) per share (19,061,315) 1,373,167 133,126,290
Effect of dilutive securities – – –Numerator for diluted earnings (loss) per share (19,061,315) 1,373,167 133,126,290
Denominator:Denominator for basic earnings (loss) per share
– weighted average ordinary shares outstanding 9,520,698 10,605,957 30,712,466Dilutive effect of share options – 1,706,250 792,236
Denominator for diluted earnings (loss) per share 9,520,698 12,312,207 31,504,702
Basic earnings (loss) per share (2.00) 0.13 4.33
Diluted earnings (loss) per share (2.00) 0.11 4.23

66
NOTES TO THE CONSOLIDATED FINANCIAL STATEMENTS(Amounts expressed in RMB unless otherwise stated)
15. EARNINGS (LOSS) PER SHARE (Continued)
Potentially dilutive securities that were not included in the computation of diluted loss per share because of theiranti-dilutive effects include the Series A Preferred Shares, the Series B Preferred Shares and share options granted toemployees for the year ended December 31, 2002. Potentially dilutive securities that were not included in thecomputation of diluted earnings per share because of their anti-dilutive effects include the Series A, Series B andSeries C Preferred Shares for the year ended December 31, 2003. There were no potentially dilutive securities thatwere not included in the computation of diluted earnings per share because of their anti-dilutive effects for theyear ended December 31, 2004.
In March 2004, the Emerging Issues Task Force reached a consensus on Issue No. 03-06 – “Participating Securitiesand the Two-Class Method under FASB Statement No. 128” (“EITF No. 03-06”). EITF No. 03-06 provides guidanceregarding the computation of earnings (loss) per share by companies that have issued securities other than commonshare that entitle the holder to participate in dividends and earnings (loss) of the company. In addition, EITF No.03-06 provides guidance on what constitutes a participating security and requires the application of the two-classmethod in determining earnings (loss) per share. EITF No. 03-06 is effective for the quarter ended June 30, 2004.EITF No. 03-06 requires prior period earnings (loss) per share amounts to be restated to conform to the consensusto ensure comparability on a period-over-period basis. Accordingly, the Group has applied EITF No. 03-06 to allyears presented in the consolidated financial statements and adjusted the earnings (loss) per share as previouslystated. Basic earnings (loss) per share reported in the Company 2003 annual report were (2.00) and 0.31 for 2002and 2003 respectively. Diluted earnings (loss) per share reported in the Company 2003 annual report were (2.00)and 0.23 for 2002 and 2003 respectively.
16. COMMITMENTS AND CONTINGENCIES
Operating lease commitments
The Company has entered into leasing arrangements relating to office premises, equipment and others that areclassified as operating leases. Future minimum lease payments for non-cancelable operating leases at December 31are as follows:
Office Equipmentpremises and others Total
RMB RMB RMB
2005 4,306,369 9,418,340 13,724,7092006 2,955,553 1,084,490 4,040,0432007 668,783 468,806 1,137,5892008 – 426,806 426,8062009 – 248,970 248,970
7,930,705 11,647,412 19,578,117
Rental expense amounted to RMB4,687,822, RMB3,505,259 and RMB6,269,028 during the years ended December31, 2002, 2003 and 2004, respectively, and is charged to the statements of income and comprehensive incomewhen incurred.

Ctrip.com International, Ltd. Annual Report 2004 67
NOTES TO THE CONSOLIDATED FINANCIAL STATEMENTS(Amounts expressed in RMB unless otherwise stated)
16. COMMITMENTS AND CONTINGENCIES (Continued)
Capital commitments
As of December 31, 2004, capital commitments for office decoration and call center equipment amounted toRMB1,356,806.
Contingencies
The Company is incorporated in Cayman Islands and is considered as a foreign entity under PRC laws. Due to therestrictions on foreign ownership of the air-ticketing, travel agency, advertising and internet content provisionbusinesses, the Company conducts these businesses partly through various VIEs. These VIEs hold the licenses andapprovals that are essential for the Company’s business operations. In the opinion of the Company’s PRC legalcounsel, the current ownership structures and the contractual arrangements with these VIEs and their shareholdersas well as the operations of these VIEs are in compliance with all existing PRC laws, rules and regulations. However,there may be changes and other developments in PRC laws and regulations. Accordingly, the Company cannot beassured that PRC government authorities will not take a view in the future contrary to the opinion of theCompany’s legal counsel. If the current ownership structures of the Company and its contractual arrangements withVIEs were found to be in violation of any existing or future PRC laws or regulations, the Company may be requiredto restructure its ownership structure and operations in China to comply with changing and new Chinese laws andregulations.
17. SUBSEQUENT EVENTS
On February 4, 2005, the Company signed an agreement to acquire land use rights for approximately 16,670square meters of land in the Shanghai Hong Qiao Lin Kong Economic Development Park for a total considerationof approximately RMB62.5 million (equivalent to approximately US$7.6 million). The agreement is subject to theapproval of relevant municipal government authorities of Shanghai. The Company plans to build a new informationand technology center and move its principal executive offices, 24-hour customer service center, productdevelopment center and administrative and support facilities to the new premises. The aggregate investment for thenew premises is estimated to range from approximately RMB157 million to RMB166 million (equivalently toapproximately US$19 million to US$20 million) over the period from 2005 until the completion of the constructionof the new premises, which is expected to be around mid-2007.

68
CORPORATEINFORMATION
CORPORATE OFFICERS
• Mr. James Jianzhang Liang, Co-founder, Chairman and CEO• Mr. Neil Nanpeng Shen, Co-founder, President and CFO• Mr. Min Fan, Co-founder and COO
DIRECTORS
• Mr. JP Gan• Mr. Qi Ji• Mr. Gabriel Li• Mr. James Jianzhang Liang• Mr. Neil Nanpeng Shen• Mr. Robert Stein• Mr. Yoshihisa Yamada• Mr. Suyang Zhang
CORPORATE HEADQUARTER
3F, Building 63-64, No.421 Hong Cao RoadShanghai 200233, People’s Republic of China
BRANCH OFFICES
•Hong KongUnit 2001, The Centrium, 60 Wyndham StreetCentral, Hong Kong
•Beijing6F-G, Office Tower A, East Gate PlazaNo.9, Dongzhong Street, Dongcheng DistrictBeijing 100027, People’s Republic of China
•GuangzhouRoom1702, West Tower, Fortune Plaza116-118 Ti Yu East Rd, Guangzhou 510620, People’s Republic of China
•ShenzhenRoom 4210A-B, SEG Plaza, Shennan Zhong RoadShenzhen 518031, People’s Republic of China
•ChengduRoom B6, 20/F, Times Digital Plaza, No. 1, Renmin South Road Section 4,Chengdu, Sichuan, 600041, People’s Republic of China
THE DEPOSITARY OF ADS
The Bank of New York
U.S. LEGAL COUNSEL
Latham & Watkins LLP – Hong Kong
CAYMAN ISLANDS LEGAL COUNSEL
Maples and Calder Asia – Hong Kong
INDEPENDENT ACCOUNTANT
PricewaterhouseCoopers Zhong Tian CPAs Limited CompanyShanghai, People’s Republic of China
INVESTOR RELATIONS
Unit 2001, The Centrium, 60 Wyndham StreetCentral, Hong KongTel (852) 2169 0915