Embed Size (px)
Citation preview

UNITED STATES SECURITIES AND EXCHANGE COMMISSION
WASHINGTON, D.C. 20549
FORM 40-F
BCE INC. (Exact name of Registrant as specified in its charter)
Canada (Province or other jurisdiction of incorporation or organization)
4813 (Primary Standard Industrial Classification Code Number (if applicable))
98-0134477 (I.R.S. Employer Identification Number (if applicable))
1, carrefour Alexander-Graham-Bell, Building A, 8th Floor,
Verdun, Québec, Canada H3E 3B3, (514) 870-8777 (Address and telephone number of Registrant’s principal executive offices)
CT Corporation System, 111 Eighth Avenue, 13th Floor, New York, N.Y. 10011, (212) 894-8940 (Name, address (including zip code) and telephone number (including area code) of agent for service in the United States)
Copies of all correspondence should be sent to:
Securities registered pursuant to Section 12(b) of the Act:
Securities registered pursuant to Section 12(g) of the Act: None
Securities for which there is a reporting obligation pursuant to Section 15(d) of the Act: None
For annual reports, indicate by check mark the information filed with this form:
Indicate the number of outstanding shares of each of the issuer’s classes of capital or common stock as of the close of the period covered by the annual report:
Indicate by check mark whether the registrant: (1) has filed all reports required to be filed by Section 13 or 15(d) of the Exchange Act during the preceding 12 months (or for such shorter period that the registrant was required to file such reports); and (2) has been subject to such filing requirements for the past 90 days.
2
REGISTRATION STATEMENT PURSUANT TO SECTION 12 OF THE SECURITIES EXCHANGE ACT OF 1934
OR
X ANNUAL REPORT PURSUANT TO SECTION 13(A) OR 15(D) OF THE SECURITIES EXCHANGE ACT OF 1934
For the fiscal year ended: December 31, 2009 Commission File Number: 1-8481
Ildo Ricciuto Assistant General Counsel, Financings and Compliance BCE Inc. 1, carrefour Alexander-Graham-Bell Building A, 7th Floor Verdun, Québec H3E 3B3 Canada Tel: (514) 786-3931
Donald R. Crawshaw Sullivan & Cromwell LLP 125 Broad Street New York, New York 10004-2498 Tel: (212) 558-4000
Title of each class Common shares
Name of each exchange on which registered New York Stock Exchange
X Annual Information Form X Audited Annual Financial Statements
Common Shares 767,180,429 First Preferred Shares
Series R 8,000,000 Series S 2,279,791 Series T 5,720,209 Series Y 8,126,330 Series Z 1,873,670 Series AA 10,081,586 Series AB 9,918,414 Series AC 9,244,555 Series AD 10,755,445 Series AE 1,914,218 Series AF 14,085,782 Series AG 10,051,751 Series AH 3,948,249 Series AI 14,000,000
Total First Preferred Shares 110,000,000
YES: X NO:

PRIOR FILINGS MODIFIED AND SUPERSEDED
The annual report on Form 40-F of BCE Inc. (“BCE”) for the year ended December 31, 2009, at the time of filing with the U.S. Securities and Exchange Commission (the “SEC” or “Commission”), modifies and supersedes all prior documents filed pursuant to Sections 13, 14 and 15(d) of the Exchange Act for purposes of any offers or sales of any securities after the date of such filing pursuant to any registration statement or prospectus filed pursuant to the Securities Act of 1933 which incorporates by reference such annual report on Form 40-F.
ANNUAL AUDITED CONSOLIDATED FINANCIAL STATEMENTS AND MANAGEMENT’S DISCUSSION AND ANALYSIS
A. Annual Audited Consolidated Financial Statements
For the BCE annual audited consolidated financial statements for the year ended December 31, 2009 (the “BCE 2009 Financial Statements”), see pages 82 to 122 of the BCE 2009 Annual Report to Shareholders (the “BCE 2009 Annual Report”), which BCE 2009 Financial Statements are contained in Exhibit 99.2 and are incorporated herein by reference.
B. Management’s Discussion and Analysis
For the BCE management’s discussion and analysis of financial condition and results of operations for the year ended December 31, 2009 (the “BCE 2009 MD&A”), see pages 18 to 79 and page 123 of the BCE 2009 Annual Report, which BCE 2009 MD&A is contained in Exhibit 99.2 and is incorporated herein by reference.
RECONCILIATION OF CANADIAN GAAP TO UNITED STATES GAAP
Refer to the document entitled “Reconciliation of Canadian GAAP to United States GAAP” reconciling the significant differences between Canadian and United States generally accepted accounting principles attached hereto as Exhibit 99.5, which is incorporated herein by reference, and to the external auditors’ report with respect thereto attached hereto as Exhibit 99.6, which is also incorporated herein by reference.
DISCLOSURE CONTROLS AND PROCEDURES
Our disclosure controls and procedures are designed to provide reasonable assurance that information required to be disclosed by us is recorded, processed, summarized and reported within the time periods specified under Canadian and U.S. securities laws and include controls and procedures that are designed to ensure that the information is accumulated and communicated to management, including BCE Inc.’s President and Chief Executive Officer (CEO) and Executive Vice-President and Chief Financial Officer (CFO), to allow timely decisions regarding required disclosure.
As of December 31, 2009, management evaluated, under the supervision and with the participation of the CEO and the CFO, the effectiveness of our disclosure controls and procedures, as defined in Rule 13a-15(e) under the U.S. Securities Exchange Act of 1934 and under National Instrument 52-109 – Certification of Disclosure in Issuers’ Annual and Interim Filings. The CEO and CFO have limited the scope of their design and evaluation of our disclosure controls and procedures to exclude the disclosure controls and procedures of BCE Inc.’s wholly-owned subsidiary The Source (Bell) Electronics Inc. (The Source). We acquired the assets held by The Source on July 1, 2009. The Source’s contribution to our consolidated financial statements for the year ended December 31, 2009 was less than 2% of consolidated revenues and less than 1% of consolidated earnings. Additionally, at December 31, 2009, The Source’s current assets and current liabilities were 7% and 2% of consolidated current assets and current liabilities, respectively, and its long-term assets and long-term liabilities were both less than 1% of consolidated long-term assets and long-term liabilities. Further details related to acquisitions are disclosed in Note 13 entitled “Goodwill” of the BCE 2009 Financial
3
Statements contained in Exhibit 99.2 (which Note is incorporated by reference in this annual report on Form 40-F).
Based on that evaluation, which excluded The Source’s disclosure controls and procedures, the CEO and CFO concluded that our disclosure controls and procedures were effective as of December 31, 2009.
INTERNAL CONTROL OVER FINANCIAL REPORTING
A. Management’s report on internal control over financial reporting
The report of BCE’s management entitled “Management’s Report On Internal Control Over Financial Reporting” appearing at page 80 of the BCE 2009 Annual Report, which report is contained in Exhibit 99.3, is incorporated herein by reference.
B. Auditors’ report on internal control over financial reporting
The report of BCE’s external auditors concerning BCE’s internal control over financial reporting appearing at page 81 of the BCE 2009 Annual Report, which report is contained in Exhibit 99.3, is incorporated herein by reference.
C. Changes in internal control over financial reporting
No changes were made in our internal control over financial reporting during the year ended December 31, 2009 that have materially affected, or are reasonably likely to materially affect, our internal control over financial reporting.
STATEMENT REGARDING CONTROLS AND PROCEDURES
There can be no assurance that our disclosure controls and procedures will detect or uncover all failures to disclose all material information otherwise required to be set forth in our disclosure. Furthermore, a control system, no matter how well designed and operated, can provide only reasonable, not absolute, assurance with respect to the reliability of financial reporting and financial statement preparation. Accordingly, BCE does not expect that BCE’s internal control over financial reporting will prevent or detect all errors and all fraud. BCE willcontinue to periodically review its disclosure controls and procedures and internal control over financial reporting and may make modifications from time to time as considered necessary or desirable.
AUDIT COMMITTEE FINANCIAL EXPERT
In respect of the current members of the Audit Committee, the board determined that at least one of the members, being the current Chair of the Audit Committee, Mr. P.R. Weiss, is qualified as an “audit committee financial expert”, and that all members of the audit committee are independent under the listing standards of the New York Stock Exchange.
CODE OF ETHICS
All employees, directors and officers must follow Bell Canada’s Code of Business Conduct (the “Code of Conduct”), which provides guidelines for ethical behaviour. The Code of Conduct includes additional guidelines for executive officers, including the CEO, CFO, Controller and Treasurer. The Code of Conduct is available in the governance section of BCE’s website at www.bce.ca.
4
PRINCIPAL ACCOUNTANT FEES AND SERVICES
External auditors’ fees
The table below shows the fees that BCE’s external auditors, Deloitte & Touche LLP, billed to BCE and its subsidiaries for various services in each of the past two fiscal years. Audit fees increased in 2009 due to services related to the changeover to International Financial Reporting Standards and the review of securities offering documents. All other fees relate to BCE’s program for compliance with the Payment Card Industry Data Security Standard.

Auditor Independence Policy
BCE’s Auditor Independence Policy is a comprehensive policy governing all aspects of BCE’s relationship with the external auditors, including:
establishing a process for determining whether various audit and other services provided by the external auditors affect their independence; identifying the services that the external auditors may and may not provide to BCE and its subsidiaries; pre-approving all services to be provided by the external auditors of BCE and its subsidiaries; and establishing a process outlining procedures when hiring current or former personnel of the external auditors in a financial oversight role to ensure auditor independence is maintained.
5
In particular, the policy specifies that:
the external auditors cannot be hired to provide any services falling within the prohibited services category, such as bookkeeping, financial information system design and implementation and legal services; for all audit or non-audit services falling within the permitted services category (such as prospectus work, due diligence and non-statutory audits), a request for approval must be submitted to the audit committee prior to engaging the external auditors; specific permitted services however are pre-approved annually and quarterly by the audit committee and consequently only require approval by the CFO prior to engaging the external auditors; and at each regularly scheduled audit committee meeting, a consolidated summary of all fees paid to the external auditors by service type is presented. This summary includes a breakout of fees incurred within the pre-approved amounts.
The Auditor Independence Policy is available in the governance section of BCE’s website at www.bce.ca.
In 2008 and 2009, BCE’s audit committee did not approve any audit-related, tax or other services pursuant to paragraph (c) (7) (i) (C) of Rule 2-01 of Regulation S-X.
OFF-BALANCE SHEET ARRANGEMENTS
Please see the section entitled “Off-Balance Sheet Arrangements” at page 54 of the BCE 2009 MD&A contained in Exhibit 99.2 (which section is incorporated by reference in this annual report on Form 40-F), and Note 9 entitled “Accounts Receivable” and Note 25 entitled “Guarantees” of the BCE 2009 Financial Statements contained in Exhibit 99.2 (which Notes are incorporated by reference in this annual report on Form 40-F), for a discussion of off-balance sheet arrangements.
TABULAR DISCLOSURE OF CONTRACTUAL OBLIGATIONS
Please see the section entitled “Contractual Obligations” at page 54 of the BCE 2009 MD&A contained in Exhibit 99.2 (which section is incorporated by reference in this annual report on Form 40-F), for a tabular disclosure and discussion of contractual obligations.
IDENTIFICATION OF THE AUDIT COMMITTEE
BCE has a separately designated standing audit committee established in accordance with section 3(a)(58) (A) of the Exchange Act. BCE’s audit committee is comprised of four independent members: Mr. P.R. Weiss (Chair), Mr. A. Bérard, Mr. A.S. Fell, and Mr. V.L. Young.
UNDERTAKING
BCE undertakes to make available, in person or by telephone, representatives to respond to inquiries made by the Commission staff, and to furnish promptly, when requested to do so by the Commission staff, information relating to: the securities in relation to which the obligation to file this annual report on Form 40-F arises; or transactions in said securities.
6
WEBSITE INFORMATION
Notwithstanding any reference to BCE’s website or other websites on the World Wide Web in this annual report on Form 40-F or in the documents attached as Exhibits hereto, the information contained in BCE’s website or any other site on the World Wide Web referred to in this annual report on Form 40-F or in the documents attached as Exhibits hereto, or referred to in BCE’s website, is not a part of this annual report on Form 40-F and, therefore, is not filed with the Commission.
STATEMENT REGARDING FORWARD-LOOKING STATEMENTS
BCE has made in the documents filed as part of this annual report on Form 40-F, and from time to time may otherwise make, forward-looking statements and related assumptions concerning its operations, economic performance and financial matters. Except as may be required by Canadian securities laws, BCE does not undertake any obligation to update or revise any of these forward-looking statements or related assumptions whether as a result of new information, future events or otherwise. Actual results or events could differ materially from those set forth in, or implied by, the forward-looking statements and the related assumptions due to a variety of risk factors. Reference is made to the various risk factors discussed throughout the BCE 2009 MD&A, contained in Exhibit 99.2, including, in particular, to the risk factors discussed in the sections of the BCE 2009 MD&A entitled “About Forward-Looking Statements”, “Our Competitive Environment”, “Our Regulatory Environment” and “Risks that Could Affect Our Business and Results”. Reference is also hereby made to the various assumptions discussed throughout the BCE 2009 MD&A, including, in particular, to the assumptions discussed in the section of the BCE 2009 MD&A entitled “Business Outlook and Assumptions”.
SUMMARY OF SIGNIFICANT DIFFERENCES FROM NYSE CORPORATE GOVERNANCE RULES
A summary of significant differences between corporate governance practices followed by BCE and corporate governance practices required to be followed by U.S. domestic companies
2009
(in $ millions) 2008
(in $ millions)
Audit fees(1) $9.2 $8.4
Audit-related fees(2) $3.0 $3.2
Tax fees(3) $0.7 $0.8 All other fees(4) $1.0 $0.3
Total $13.9(5) $12.7(5)
(1) These fees include professional services provided by the external auditors for statutory audits of the annual financial statements, the audit of the effectiveness of internal control over financial reporting, the review of interim financial statements, the review of financial accounting and reporting matters, the review of securities offering documents, other regulatory audits and filings and translation services.
(2) These fees relate to non-statutory audits, due diligence and the review of financial accounting and reporting matters.
(3) These fees include professional services for tax compliance, tax advice and assistance with tax audits and appeals.
(4) These fees include any other fees for permitted services not included in any of the above-stated categories. In 2009 and 2008, the fees are solely for services related to compliance with the Payment Card Industry Data Security Standard.
(5) The amounts of $13.9 million for 2009 and $12.7 million for 2008 reflect fees billed in those fiscal years without taking into account the year to which those services relate. Total fees for services provided for each fiscal year amounted to $12.8 million in 2009 and $11.8 million in 2008.

under the New York Stock Exchange’s Listing Standards (disclosure required by section 303A.11 of the NYSE Listed Company Manual) is available in the governance section of BCE’s website at www.bce.ca.
7
SIGNATURES
Pursuant to the requirements of the Exchange Act, the registrant certifies that it meets all of the requirements for filing on Form 40-F and has duly caused this annual report to be signed on its behalf by the undersigned, thereto duly authorized.
8
LIST OF EXHIBITS TO FORM 40-F
9
BCE Inc. By: (signed) Siim A. Vanaselja
Siim A. Vanaselja Executive Vice-President and Chief Financial Officer
Date: March 17, 2010
Annual Information Form of BCE Inc. for the year ended December 31, 2009
Exhibit 99.1
Annual audited consolidated financial statements of BCE Inc. for the year ended December 31, 2009 and the related management’s discussion and analysis of financial condition and results of operations
Exhibit 99.2
Reports of BCE Inc.’s management and of BCE Inc.’s external auditors concerning internal control over financial reporting
Exhibit 99.3
Consent of Independent Registered Chartered Accountants
Exhibit 99.4
Reconciliation of Canadian GAAP to United States GAAP
Exhibit 99.5
Report of Independent Registered Chartered Accountants on Reconciliation of Canadian GAAP to United States GAAP
Exhibit 99.6
Certifications of the Chief Executive Officer and the Chief Financial Officer pursuant to Section 302 of the Sarbanes-Oxley Act of 2002
Exhibit 99.31
Certification of the Chief Executive Officer and the Chief Financial Officer pursuant to 18 U.S.C. Section 1350, as adopted pursuant to Section 906 of the Sarbanes-Oxley Act of 2002
Exhibit 99.32
Exhibit 99.1
BCE INC.
For the year ended December 31, 2009 March 11, 2010
In this annual information form, we, us, our, company and BCE mean BCE Inc., its subsidiaries and joint ventures. Bell Canada is, unless otherwise indicated, referred to herein as Bell, and comprises our Bell Wireline and Bell Wireless segments. Bell Aliant means Bell Aliant Regional Communications Income Fund and its subsidiaries.
All dollar figures are in Canadian dollars, unless stated otherwise. The information in this annual information form is as of March 11, 2010, unless stated otherwise, and except for information in documents incorporated by reference that have a different date.
Table of Contents
ANNUAL
INFORMATIONFORM
PARTS OF MANAGEMENT’S DISCUSSION& ANALYSIS AND FINANCIAL STATEMENTS
INCORPORATED BY REFERENCE(REFERENCE TO PAGES OF BCE INC.
2009 ANNUAL REPORT)
Caution Regarding Forward-Looking Statements 4 28-30; 55-69Corporate Structure 6
Incorporation and Registered Offices 6 Subsidiaries 6
Description of Our Business 7 General Summary 7 19-24; 30-31Strategic Imperatives 7 24-27Our Competitive Strengths 8 Marketing and Distribution Channels 9 Our Networks 10 28-30; 55-69Our Employees 12 24Corporate Responsibility 13 Competitive Environment 15 55-58Regulatory Environment 15 58-63
General Development of Our Business 16 Three-Year History 16 Key Transactions 17
Our Capital Structure 19 BCE Inc. Securities 19 58-63; 109-111 Bell Canada Debt Securities 19 Ratings for BCE Inc. and Bell Canada Securities 20 Ratings for Bell Canada Debt Securities 20 Ratings for BCE Inc. Preferred Shares 20 Outlook 21 51-52General Explanation 21 Explanation of Rating Categories Received for our Securities 22 Market for our Securities 23 Trading of our Securities 23
Our Dividend Policy 26 Our Directors and Executive Officers 27
Directors 27 Executive Officers 29 Directors’ and Executive Officers’ Share Ownership 30
Legal Proceedings 31 Lawsuits Related to BCE Inc. 31 Lawsuits Related to Bell Canada 32 Lawsuits Related to Teleglobe Inc. 35 Other 37
Interest of Management and Others in Material Transactions 38 Experts 38 Transfer Agent and Registrar 38

BCE INC. 2009 ANNUAL INFORMATION FORM 3
Certain statements made in this annual information form including, but not limited to, statements relating to BCE Inc.’s dividend policy, our fibre-optic deployment plans, our plan to introduce Internet protocol television (IPTV) in the course of 2010, and other statements that are not historical facts, such as our objectives, plans and strategic priorities, are forward-looking statements. A statement we make is forward-looking when it uses what we know and expect today to make a statement about the future. Forward-looking statements may include words such as aim, anticipate, assumption, believe, could, expect, goal, guidance, intend, may, objective, outlook, plan, project, seek, should, strategy, strive, target and will. All such forward-looking statements are made pursuant to the ‘safe harbour’ provisions of applicable Canadian securities laws and of the United States Private Securities Litigation Reform Act of 1995.
Unless otherwise indicated by us, forward-looking statements in this annual information form describe our expectations at March 11, 2010 and, accordingly, are subject to change after such date. Except as may be required by Canadian securities laws, we do not undertake any obligation to update or revise any forward-looking statements, whether as a result of new information, future events or otherwise.
Forward-looking statements, by their very nature, are subject to inherent risks and uncertainties and are based on several assumptions which give rise to the possibility that actual results or events could differ materially from our expectations expressed in or implied by such forward-looking statements. As a result, we cannot guarantee that any forward-looking statement will materialize and you are cautioned not to place undue reliance on these forward-looking statements. Forward-looking statements are provided in this annual information form for the purpose of giving information about management’s current strategic priorities, expectations and plans and allowing investors and others to get a better understanding of our operating environment. Readers are cautioned, however, that such information may not be appropriate for other purposes.
Forward-looking statements made in this annual information form are based on a number of assumptions that we believed were reasonable on March 11, 2010. Refer, in particular, to the section of BCE Inc.’s 2009 management’s discussion and analysis (BCE 2009 MD&A) entitled Business Outlook and Assumptions at pages 28 to 30 of the BCE Inc. 2009 annual report (BCE 2009 Annual Report), for a discussion of certain key economic, market and operational assumptions we have used in making forward-looking statements, which section is incorporated by reference herein.
Important factors that could cause actual results or events to differ materially from those expressed in or implied by the above-mentioned forward-looking statements and other forward-looking statements contained in this annual information form include, but are not limited to: the intensity of competitive activity, including the increase in wireless competitive activity that is expected to result from Industry Canada’s licensing of advanced wireless services (AWS) spectrum to new wireless entrants, and the resulting impact on our ability to retain existing, and attract new, customers, and on our pricing strategies and financial results; general economic and financial market conditions, the level of consumer confidence and spending, and the demand for, and prices of, our products and services; our ability to implement our strategies and plans in order to produce the expected benefits; our ability to continue to implement our cost reduction initiatives and contain capital intensity while seeking to improve customer service; our ability to respond to technological changes and rapidly offer new products and services; increased contributions to employee benefit plans; events affecting the functionality of, and our ability to protect, maintain and replace, our networks, information technology systems and software; events affecting the ability of third-party suppliers to provide to us essential products and services; the quality of our network and customer equipment and the extent to which they may be subject to manufacturing defects; labour disruptions; the potential adverse effects on our Internet and wireless businesses of the significant increase in broadband demand; our ability to raise the capital we need to implement our business plan, including for BCE Inc.’s share buy-back program and dividend payments and to fund capital and other expenditures and generally meet our financial obligations; our ability to discontinue certain traditional services as necessary to improve capital and operating efficiencies; regulatory initiatives or proceedings, litigation and changes in laws or regulations; launch and in-orbit risks of satellites used by Bell ExpressVu Limited Partnership (Bell TV); competition from unregulated U.S. direct-to-home (DTH) satellite television services sold illegally in Canada and the theft of our satellite television services; BCE Inc.’s dependence on the ability of its subsidiaries, joint ventures and other companies in which it has an interest to pay dividends and make other distributions; there can be no certainty that dividends will be declared by BCE Inc.’s board of directors or that BCE Inc.’s dividend policy will be maintained; stock market volatility; our ability to maintain customer service and our networks operational in the event of the occurrence of epidemics, pandemics and other health risks; health concerns about radio frequency emissions from wireless devices; and loss of key employees.
4 BCE INC. 2009 ANNUAL INFORMATION FORM
These and other risk factors that could cause actual results or events to differ materially from our expectations expressed in or implied by our forward-looking statements are discussed throughout this annual information form and the BCE 2009 MD&A and, in particular, in the sections entitled Our Competitive Environment, Our Regulatory Environment and Risks that Could Affect Our Business and Results, in the BCE 2009 MD&A, at pages 55 to 58, pages 58 to 63 and pages 63 to 69, respectively, of the BCE 2009 Annual Report, which sections are incorporated by reference herein.
We caution readers that the risks described above are not the only ones that could impact us. Additional risks and uncertainties not currently known to us or that we currently deem to be immaterial may also have a material adverse effect on our business, financial condition or results of operations.
Except as otherwise indicated by us, forward-looking statements do not reflect the potential impact of any non-recurring or other special items or of any dispositions, monetizations, mergers, acquisitions, other business combinations or other transactions that may be announced or that may occur after March 11, 2010. The financial impact of these transactions and non-recurring and other special items can be complex and depends on the facts particular to each of them. We therefore cannot describe the expected impact in a meaningful way or in the same way we present known risks affecting our business.
BCE INC. 2009 ANNUAL INFORMATION FORM 5
INCORPORATION AND REGISTERED OFFICES
BCE Inc. was incorporated in 1970 and was continued under the Canada Business Corporations Act in 1979. It is governed by a certificate and articles of amalgamation dated August 1, 2004, by a certificate and articles of arrangement dated July 10, 2006 and by a certificate and articles of amendment dated January 25, 2007. BCE Inc.’s head and registered offices are at 1 Carrefour Alexander-Graham-Bell, Building A, 8th Floor, Verdun, Québec H3E 3B3.
SUBSIDIARIES
The table below shows BCE Inc.’s main subsidiaries, where they are incorporated or registered, and the percentage of voting and non-voting securities that BCE Inc. beneficially owns or directly or indirectly exercises control or direction over. BCE Inc. has other subsidiaries, but they have not been included in the table because each represents 10% or less of our total consolidated assets and 10% or less of our total consolidated operating revenues. These other subsidiaries together represented 20% or less of our total consolidated assets and 20% or less of our total consolidated operating revenues at December 31, 2009.
As at December 31, 2009, BCE Inc. also owned 44.1% of the voting securities of Bell Aliant on a fully-diluted basis. For so long as BCE Inc. owns a 30% or greater
For More Information 39 Documents You Can Request 39 Other Information About BCE Inc. 39
Schedule 1 – Audit Committee Information 40 Schedule 1A – Audit Committee Charter 43 Schedule 2 – Glossary 48 Schedule 3 – Trademarks 50
Caution Regarding Forward-Looking Statements
Corporate Structure
SUBSIDIARY WHERE IS IT INCORPORATED
OR REGISTERED PERCENTAGE OF VOTING SECURITIES THAT
BCE INC. HELD AT DECEMBER 31, 2009(1)
Bell Canada Canada 100 % Bell Mobility Inc. (Bell Mobility) Canada 100 %
(1) BCE Inc. does not own any outstanding non-voting securities issued by these subsidiaries.
interest in Bell Aliant and provided that certain major commercial agreements are in place, BCE Inc. has the right to appoint a majority of the directors and to nominate a majority of the trustees of Bell Aliant. For so long as BCE Inc. owns a 20% or greater interest in Bell Aliant, BCE Inc. also has the ability to veto certain actions of Bell Aliant (business plans, significant corporate transactions, material changes in business, leverage in excess of 2.5 times debt to earnings before interest, taxes, depreciation and amortization, appointment and change of chief executive officer and entering into material commercial agreements with our competitors).
6 BCE INC. 2009 ANNUAL INFORMATION FORM
GENERAL SUMMARY
BCE is Canada’s largest communications company. We are a comprehensive provider of wireline voice and wireless communications services, Internet access, data services and video services to residential, business and wholesale customers. In 2009, we reported the results of our operations in three segments: Bell Wireline, Bell Wireless and Bell Aliant. Bell, which encompasses our core operations, is the largest local exchange carrier in Ontario and Québec, and is comprised of our Bell Wireline and Bell Wireless segments. We also own a 44.1% interest in, and control, Bell Aliant, the incumbent carrier in Canada’s Atlantic Provinces and in rural and regional areas of Ontario and Québec.
In addition to our operating segments we also hold minority equity interests in CTVglobemedia Inc. (CTVglobemedia), Skyterra Communications Inc. (DTC:SKYT.OB) and entities that operate the Montréal Canadiens Hockey Club and the Bell Centre.
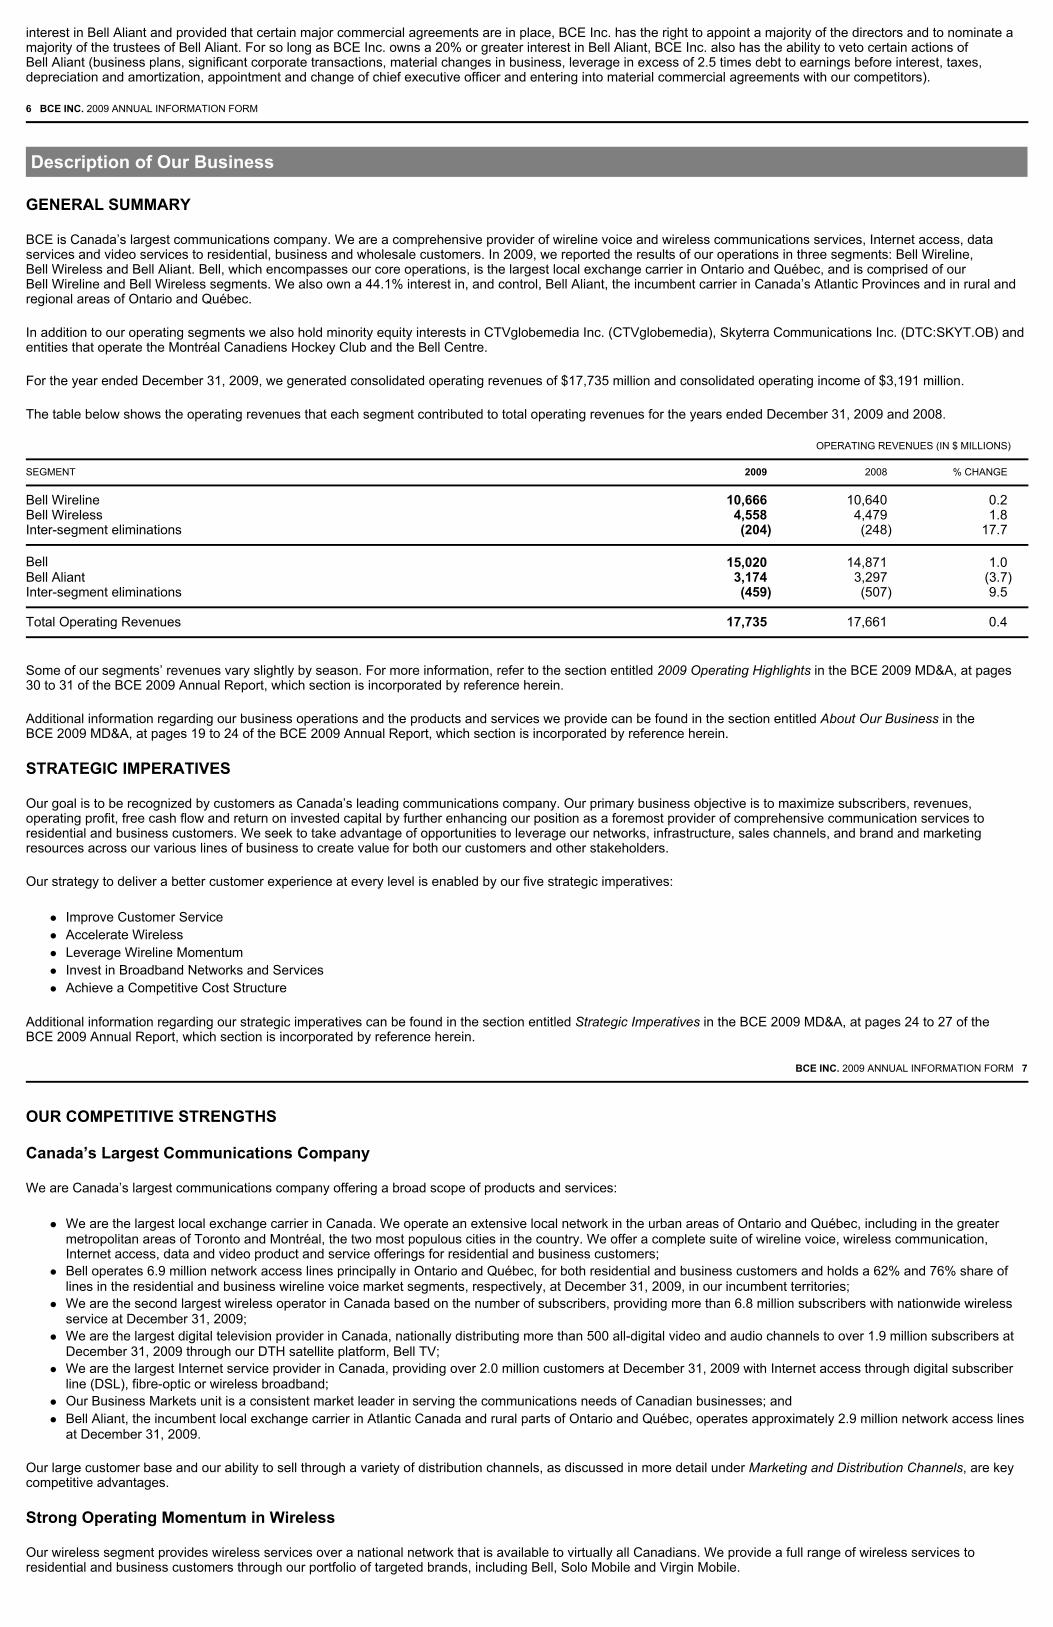
For the year ended December 31, 2009, we generated consolidated operating revenues of $17,735 million and consolidated operating income of $3,191 million.
The table below shows the operating revenues that each segment contributed to total operating revenues for the years ended December 31, 2009 and 2008.
Some of our segments’ revenues vary slightly by season. For more information, refer to the section entitled 2009 Operating Highlights in the BCE 2009 MD&A, at pages 30 to 31 of the BCE 2009 Annual Report, which section is incorporated by reference herein.
Additional information regarding our business operations and the products and services we provide can be found in the section entitled About Our Business in the BCE 2009 MD&A, at pages 19 to 24 of the BCE 2009 Annual Report, which section is incorporated by reference herein.
STRATEGIC IMPERATIVES
Our goal is to be recognized by customers as Canada’s leading communications company. Our primary business objective is to maximize subscribers, revenues, operating profit, free cash flow and return on invested capital by further enhancing our position as a foremost provider of comprehensive communication services to residential and business customers. We seek to take advantage of opportunities to leverage our networks, infrastructure, sales channels, and brand and marketing resources across our various lines of business to create value for both our customers and other stakeholders.
Our strategy to deliver a better customer experience at every level is enabled by our five strategic imperatives:
Improve Customer Service Accelerate Wireless Leverage Wireline Momentum Invest in Broadband Networks and Services Achieve a Competitive Cost Structure
Additional information regarding our strategic imperatives can be found in the section entitled Strategic Imperatives in the BCE 2009 MD&A, at pages 24 to 27 of the BCE 2009 Annual Report, which section is incorporated by reference herein.
BCE INC. 2009 ANNUAL INFORMATION FORM 7
OUR COMPETITIVE STRENGTHS
Canada’s Largest Communications Company
We are Canada’s largest communications company offering a broad scope of products and services:
We are the largest local exchange carrier in Canada. We operate an extensive local network in the urban areas of Ontario and Québec, including in the greater metropolitan areas of Toronto and Montréal, the two most populous cities in the country. We offer a complete suite of wireline voice, wireless communication, Internet access, data and video product and service offerings for residential and business customers; Bell operates 6.9 million network access lines principally in Ontario and Québec, for both residential and business customers and holds a 62% and 76% share of lines in the residential and business wireline voice market segments, respectively, at December 31, 2009, in our incumbent territories; We are the second largest wireless operator in Canada based on the number of subscribers, providing more than 6.8 million subscribers with nationwide wireless service at December 31, 2009; We are the largest digital television provider in Canada, nationally distributing more than 500 all-digital video and audio channels to over 1.9 million subscribers at December 31, 2009 through our DTH satellite platform, Bell TV; We are the largest Internet service provider in Canada, providing over 2.0 million customers at December 31, 2009 with Internet access through digital subscriber line (DSL), fibre-optic or wireless broadband; Our Business Markets unit is a consistent market leader in serving the communications needs of Canadian businesses; and Bell Aliant, the incumbent local exchange carrier in Atlantic Canada and rural parts of Ontario and Québec, operates approximately 2.9 million network access lines at December 31, 2009.
Our large customer base and our ability to sell through a variety of distribution channels, as discussed in more detail under Marketing and Distribution Channels, are key competitive advantages.
Strong Operating Momentum in Wireless
Our wireless segment provides wireless services over a national network that is available to virtually all Canadians. We provide a full range of wireless services to residential and business customers through our portfolio of targeted brands, including Bell, Solo Mobile and Virgin Mobile.
Description of Our Business
OPERATING REVENUES (IN $ MILLIONS )
SEGMENT 2009 2008 % CHANGE
Bell Wireline 10,666 10,640 0.2 Bell Wireless 4,558 4,479 1.8 Inter-segment eliminations (204) (248 ) 17.7
Bell 15,020 14,871 1.0 Bell Aliant 3,174 3,297 (3.7 ) Inter-segment eliminations (459) (507 ) 9.5
Total Operating Revenues 17,735 17,661 0.4

Wireless is a key growth segment for Bell Canada and we have established strategic priorities seeking to further enhance our offerings. Bell is focused on capturing an increasing share of new wireless customers through growing points of presence, improved sales execution and increased value-added service offerings. We also believe our priorities for improved customer experience at all touch points, enhanced network quality and data speeds, and an expanded handset offering should improve our ability to attract and maintain wireless customers. With the launch of a national high-speed packet access (HSPA)/HSPA+ network (the HSPA/HSPA+ network) in November 2009, we have confirmed our position as the Canadian wireless provider delivering the broadest range of choice in wireless smartphones and North American and international coverage. Furthermore, our acquisition of substantially all of the assets of national electronics retailer The Source by Circuit City and its 750 retail stores nationally, gives us an increased presence in Canada’s highest-traffic mall locations and effectively increases the number of places where customers can buy Bell products and services. We also believe that full ownership of Virgin Mobile Canada (Virgin) enhances our competitive market position by allowing us to compete more effectively with the Canadian industry’s other flanker brands.
Incumbent Service Provider with Market Leadership Position
We are the largest local exchange carrier in Canada, with a 62% and 76% share of lines in the residential and business wireline voice market segments, respectively, in Ontario and Québec at December 31, 2009. Our market leadership position represents the foundation for the other products and services we offer, providing us with a significant number of established customer connections that we can leverage to drive uptake of new products and services, either through bundled offerings or on a stand-alone basis, and to improve customer retention.
Our long-standing ownership of our DTH satellite TV business sets us apart from other incumbent Canadian telecom providers that largely rely on resale agreements to provide video service. Our Business Markets unit is also a consistent market-leading performer having established relationships with a majority of Canada’s 800 largest corporations. Our Business Markets unit has demonstrated growth and improving profitability and, when combined with the success of our Internet and video services, helps drive overall performance for Bell.
8 BCE INC. 2009 ANNUAL INFORMATION FORM
In the last few years, the number of residential line losses has slowed, year over year, due in part to regulatory changes that have substantially improved our ability to compete, on-going retention efforts, increased penetration of service bundles and better overall service execution.
MARKETING AND DISTRIBUTION CHANNELS
The guiding principle driving our marketing strategy is to offer our clients the ultimate in reliable, simple and accessible telecommunications services. In doing so, our objective is to enhance customer retention and loyalty through multiple service offerings.
Through the Bell Bundle, which combines wireline local voice and long distance, high-speed Internet, TV and wireless services, our goal is to use a quadruple play product offering to achieve competitive differentiation by offering a premium, integrated set of services that provides customers more freedom, flexibility and choice. We also make use of limited-time promotional offers featuring discounted rate plans, special rates on wireless handsets and video receivers, as well as other incentives, to stimulate customer acquisition and winbacks or to respond to competitive pressures in our markets. Very often, our promotional offers are structured around particular events, including the residential moving season, the back-to-school period, and the December holiday season. Another key component of our pricing strategy is to minimize re-price, particularly in our legacy business, in order to preserve margins and optimize cash flow. We also look for opportunities within our various product lines to implement price changes to reflect the value of the services we offer to our customers.
We focus our marketing efforts on a coordinated program of television, print, radio, Internet, outdoor signage, direct mail and point-of-sale media promotions. We engage in mass-market advertising in order to maintain our brand and support direct and indirect distribution channels. Coordinated marketing efforts throughout our service area ensure that our marketing message is presented consistently across all of our markets. Promoting the Bell brand is complemented by the company’s other brand marketing efforts, reinforcing the awareness of all our services and capitalizing on the size and breadth of our customer base across all product lines.
The Bell brand plays a key role in product positioning. Our branding is straightforward and benefit-focused, and directly supports our strategy of delivering a better customer experience at every level.
Specifically for wireless, acquiring and retaining high-value postpaid subscribers is a key marketing focus, as we leverage our network advantage and suite of leading-edge devices and services to drive higher usage and increased adoption of data services. We subsidize the sale of wireless handsets – a practice also used by other Canadian wireless operators. Research has shown that a key driver of customer acquisition is handset selection and style. This factor is important as handset life cycles shorten. Our current wireless device portfolio includes many leading-edge handsets, some launched as exclusive to Bell. As the Canadian wireless market further matures and competition intensifies as a result of Industry Canada’s licensing of AWS spectrum to new entrants, customer retention is becoming increasingly important. Accordingly, we employ customer retention initiatives aimed at increasing our customers’ level of satisfaction and loyalty.
Our acquisition on July 1, 2009, of substantially all of the assets of national electronics retailer The Source by Circuit City, which are now held by Bell Canada’s wholly-owned subsidiary The Source (Bell) Electronics Inc. (The Source), is adding 750 retail stores, most of them in high-traffic mall locations, increasing Bell’s national distribution footprint.
Bell delivers its products and services to residential customers through:
a network of corporate and dealer-owned Bell, Bell Mobility, Solo Mobile and Virgin Mobile retail locations; The Source’s 750 retail locations; national retailers such as Future Shop, Best Buy, Wal-Mart, Wireless Wave, T-Booth, Wireless Etc., Loblaws and a network of regional and independent retailers in all regions; call centre representatives; and the bell.ca website.
Residential customers can buy all or some of Bell’s products and services through the call centres, retail stores, sales representatives and our web portals.
Bell also offers customers the convenience of “One Bill” for Home Phone, Internet, video and wireless services with a single point of contact.
BCE INC. 2009 ANNUAL INFORMATION FORM 9
Communications products and services, other than wireless, for Bell’s business customers are delivered by the Bell Business Markets unit. Products and solutions are sold to mass and mid-sized business customers through web portals, call centres, dedicated sales representatives, as well as select value-added resellers. We intend to continue to differentiate ourselves in the marketplace by enhancing our customer service levels and our offer breadth by introducing unique fee-based service offerings in the market.
Communications products and services, other than wireless, for Bell’s large business customers are also delivered by the Bell Business Markets unit. Products and solutions are sold through our call centres and dedicated sales representatives. Much of the procurement of our customers in this segment is completed through competitive bids that we win. In addition to basic communications services, the large enterprise group bundles products, services and professional services into fully managed, end-to-end, information and technology business solutions for its customers. It also partners with third parties to bid on and sell complex business solutions. We are focusing on increasing the number of customers and the breadth of business solutions sold to these customers. The solutions offer more value and strengthen relationships with customers, thus helping to reduce churn.
Bell’s wireless products and services are delivered to business customers by Bell Mobility through the same channels as those previously described for Bell Mobility services with respect to residential customers. In addition, Bell’s business customers are served by Bell’s nationwide sales team responsible for the sale of wireless products and services to business customers as well as the execution of sales contracts.
Communications products and services for Bell’s wholesale business are delivered by Bell’s Wholesale unit. They are sold through our dedicated sales representatives, web portals and call centres.
Bell Aliant sells its products and services through call centre representatives, independent dealer stores (certain of which are full service and certain of which sell small and medium-sized business products), value-added resellers and the Bell Aliant website, www.bell.aliant.ca. In addition to these channels, Bell Aliant sells products and services to larger business customers through dedicated sales representatives and competitive bids. As well, Bell Aliant facilitates customer payments through numerous payment agencies in New Brunswick, Nova Scotia, Prince Edward Island and Newfoundland and Labrador. During 2009, Bell Aliant continued to implement measures to

simplify and improve various types of customer interactions.
OUR NETWORKS
The telecommunications industry is evolving rapidly as the industry continues to move from multiple service-specific networks to Internet protocol (IP)-based integrated communications networks where voice, data and video traffic all travel on a single network. Bell and Bell Aliant continue to work with key vendor partners to expand their national multi-services IP-enabled networks.
Bell’s communications networks provide wireline and wireless, voice, data and video services to customers across Canada.
Bell’s infrastructure includes:
national transport networks for voice, data and video traffic, including Internet traffic; urban and rural access networks and infrastructures for delivering services to customers (for example, very high-speed digital subscriber line (VDSL) access networks for the delivery of video services); and national wireless networks that provide voice, data and video services.
Wireline
Our national voice and data network consists of an optical fibre network, with built-in redundancy and fault protection. It reaches all major Canadian metropolitan centres, as well as New York, Chicago, Washington/Ashburn, Buffalo, San Francisco/Palo Alto and Seattle in the United States.
Bell’s networks in major Canadian cities provide state-of-the-art high-speed access at gigabit speeds based on IP technology. Bell and Bell Aliant operate a national IP/multi-protocol label switching (MPLS) network with international gateways to the rest of the world. This network delivers next generation, business grade Internet protocol virtual private network (IPVPN) services that connect our customers’ offices and data centres throughout Canada and around the world. The IPVPN service is the foundation platform required for the delivery of information and communications technology solutions that add value and efficiencies to customers’ businesses. These technology solutions include voice over Internet protocol (VoIP)/IP Telephony, IP videoconferencing, IP call centre applications and other future IP-based applications. In addition, Bell and Bell Aliant maintain extensive copper and voice-switching networks that provide traditional local and interexchange voice and data services to all business and residential customers in Ontario, Québec and the Atlantic provinces.
10 BCE INC. 2009 ANNUAL INFORMATION FORM
Since 2004, Bell has been upgrading the access infrastructure by deploying fibre closer to its residential customers using fibre-to-the-node (FTTN) technology. In parallel, Bell has also been deploying high-speed fibre access directly to new condominiums and other multiple-dwelling units (MDUs), throughout the Québec-Windsor corridor under a fibre-to-the-building (FTTB) initiative.
On February 4, 2010, Bell Canada announced several initiatives supporting its strategic imperative to invest in broadband networks and services.
First, Bell Canada announced a three-year plan to deploy high-speed fibre-to-the-home (FTTH) technology across the Québec City region. FTTH, in which optical fibre cables are used to connect each and every home, is the ideal network architecture to address the growing needs of our customers, and to support future bandwidth-demanding IP services and applications. One of the first FTTH deployments in Canada, Bell Canada’s Québec City region initiative is the largest city-wide FTTH rollout in the country to-date. Since the Québec City region is served largely by “aerial” infrastructure, above-ground wiring on utility poles, these extensive fibre deployments can be accomplished much faster and more economically than in centres with underground infrastructure.
Bell Canada also announced that it intends to deploy FTTH in all new urban and suburban housing developments in Ontario and Québec beginning in the second half of 2010. This is in addition to Bell Canada’s deployment of FTTB already under way to approximately 1,600 MDUs in Ontario and Québec, which is expected to be complete by the end of 2012.
On February 4, 2010, Bell Canada announced that its new Bell Fibe Internet service was available in the Montréal and Greater Toronto areas, providing customers access to increased upload speeds of up to 7 megabits per second (Mbps) and download speeds of up to 25 Mbps. Fibe Internet employs advanced tools to proactively monitor and optimize speed and offers comprehensive security features including parental controls, pop-up blocker, privacy control, Wi-Fi protection, fraud protection and online storage.
Bell Canada currently offers IPTV service on a limited basis. On February 4, 2010, Bell Canada also announced that, using Bell Canada’s advanced FTTN network, it intends to start offering IPTV service on a broader basis during the course of 2010, starting with the cities of Toronto and Montréal. Bell Canada’s IPTV service will be used as an urban complement to Bell TV’s existing DTH service.
In 2005, Bell Aliant launched an IPTV service in the Halifax, Nova Scotia market, and in 2006 continued to expand this service in St. John’s, Newfoundland and Labrador, and in Moncton and Saint John, New Brunswick. This expansion continued in 2007 in Fredericton, New Brunswick. In 2008, Bell Aliant continued to expand the IPTV footprint in these cities and introduced high definition (HD) capability to its IPTV service. In 2009, Bell Aliant launched its personal video recorder (PVR) service and added more HD channels.
On July 6, 2009, Bell Aliant, with the support of the Government of New Brunswick, announced a $60 million investment to fully deploy FTTH technology in Fredericton and Saint John by mid-2010. This investment will deploy an advanced broadband network, delivered through 100% fibre-optic technology, directly to 70,000 homes and businesses, allowing Bell Aliant to deliver its new “FibreOP” branded FTTH broadband services. On February 8, 2010, Bell Aliant announced its 2010 FibreOP expansion plan, reporting that its FTTH network in New Brunswick would be extended to Bathurst, Miramichi, the Greater Moncton area (including Dieppe and Riverview), and the Greater Saint John area (including Rothesay, Quispamsis and Grand Bay-Westfield). The virtually 100% aerial nature of Bell Aliant’s network infrastructure and the relatively low population densities of these areas make the cost of FTTH and FTTN very similar in these markets.
As of the end of 2009, Bell Aliant’s IPTV service and other high-speed products were available to 262,000 homes in Atlantic Canada.
Our forward-looking statements referred to in this section relating to plans to deploy FTTH and FTTB and the anticipated launch of Bell’s IPTV service assume, in particular, the availability of the required capital which, in turn, is based on our ability to either generate cash flows from operations or raise financing. Our ability to generate cash flows from operations depends on our business performance which, in turn, is based on certain key economic, market and operational assumptions that are discussed in the section entitled Business Outlook and Assumptions in the BCE 2009 MD&A, at pages 28 to 30 of the BCE 2009 Annual Report, which section is incorporated by reference herein. Our ability to generate cash flows from operations is also subject to various risks, which could affect our business, including general economic, market, competitive, technological and regulatory risks. Our ability to raise financing depends on our ability to access the public equity and debt capital markets and the bank credit market which, in turn, is based on prevailing market conditions and the outlook for our business and credit ratings at the time the capital is raised. Refer to the sections entitled Our Competitive Environment, Our Regulatory Environment and Risks that Could Affect Our Business and Results in the BCE MD&A, at pages 55 to 58, pages 58 to 63 and pages 63 to 69, respectively, of the BCE 2009 Annual Report, which sections are incorporated by reference herein, for a description of risks that could affect our business and
BCE INC. 2009 ANNUAL INFORMATION FORM 11
our ability to generate cash flows from operations, and to the risk entitled If we are unable to raise the capital we need, we may need to limit our capital expenditures or our investments in new businesses, or try to raise capital by disposing of assets for a description of risks that could affect our ability to raise financing.
Wireless
Bell’s wireless network consists of Bell’s own wireless facilities as well as the facilities of other wireless carriers that Bell may access through contractual arrangements.
On November 4, 2009, we participated in the launch of the HSPA/HSPA+ network capable of delivering high-speed mobile access of up to 21 Mbps to 93% of the Canadian population and covering thousands of cities and towns in both urban and rural locations. The HSPA/HSPA+ network supports full global roaming, as well as a wide range of new smartphones, wireless Internet sticks, and other leading-edge mobile devices. The HSPA/HSPA+ network also supports international roaming in more than 200 countries, including a preferred roaming agreement with AT&T Inc., the largest HSPA operator in the United States. The vast majority of the site connectivity for the new HSPA/HSPA+ network was built with high-speed fibre and an all-IP architecture for enhanced reliability. The HSPA/HSPA+ buildout leveraged our network sharing agreement with TELUS Communications Company. Each company built half of the new network’s coverage across Canada, which reduced our overall

deployment cost and accelerated the launch of the new network. Moreover, our deployment of the new network well positions us to move to global Fourth Generation, or 4G (long-term evolution – LTE), wireless in the coming years. The HSPA/HSPA+ network joins our existing national 3G code division multiple access (CDMA)/evolution, data optimized (EVDO) network, which Bell currently plans to continue to operate alongside the HSPA/HSPA+ network.
In total, our CDMA/EVDO wireless network covers 99% of Ontario’s and Québec’s population and approximately 97% of Atlantic Canada’s population at December 31, 2009. Our wireless CDMA network also covers major cities in the provinces of Alberta and British Columbia. In response to the proliferation of wireless data service, we continue to enhance our high-speed data, or EVDO network, launched in October 2005. At December 31, 2009, Bell’s EVDO network covered approximately 90% of the Canadian population. EVDO delivers high-speed mobile services with data-rich content such as e-mail, video messaging, gaming, video conferencing, telematics and streaming entertainment.
In order to provide an expansion path for next-generation technologies and future services, we purchased new wireless licences in the AWS spectrum auction that concluded on July 21, 2008. We acquired 20 megahertz of spectrum in Ontario (including Toronto and surrounding areas), in Canada’s Atlantic Provinces, and in Northern Canada, as well as 10 megahertz in Québec and in Western Canada, for a total investment of $741 million. This AWS spectrum will be utilized for 4G LTE technology trial activities over the course of 2010.
OUR EMPLOYEES
The table below shows the number of our employees as at December 31, 2009, 2008 and 2007.
12 BCE INC. 2009 ANNUAL INFORMATION FORM
Approximately 45% of BCE employees are represented by unions and are covered by collective agreements.
The following collective agreements were signed in 2009 or 2010:
The Communications, Energy and Paperworkers’ Union of Canada (CEP) and Bell Canada signed a new collective agreement on April 24, 2009, covering approximately 190 operators. The new collective agreement will expire on November 14, 2013. The CEP and Bell Technical Solutions Inc. signed a new collective agreement on July 20, 2009, covering approximately 1,040 craft and services employees in Québec. The new collective agreement will expire on May 6, 2014. The CEP and Bell Technical Solutions Inc. signed a new collective agreement on July 21, 2009, covering approximately 1,720 craft and services employees in Ontario. The new collective agreement will expire on May 6, 2014. The CEP and Bell Canada signed a new collective agreement on January 19, 2010 covering approximately 7,900 clerical and associated employees. The new collective agreement will expire on May 31, 2013. The CEP and Bell Technical Solutions Inc. signed a new collective agreement on February 24, 2010 covering approximately 48 clerical and associated employees in Québec. The new collective agreement will expire on July 6, 2014.
Bell Mobility was formally notified on October 28, 2009 that the CEP filed an application for certification to represent approximately 1,570 Bell Mobility client care employees working in the Mississauga region in Ontario. A Canada Labour Board vote was conducted on December 16 and 17, 2009 where a majority of employees chose not to be represented by the CEP.
The following collective agreements will expire in 2010:
The collective agreement between the CEP and Bell Canada covering approximately 115 craft employees located in Western Canada will expire on May 10, 2010. Bargaining is scheduled to commence in May 2010. The collective agreement between the CEP and Expertech Network Installation Inc. covering approximately 165 clerical employees will expire on November 30, 2010. The collective agreement between the CEP and Bell Canada covering approximately 770 communications sales employees will expire on December 31, 2010.
In addition, negotiations with respect to a first collective agreement between the CEP and Bell Canada covering approximately 50 clerical employees located in Western Canada are scheduled to commence later this year.
Additional information regarding our employees can be found in the section entitled About Our Business – Employees in the BCE 2009 MD&A, at page 24 of the BCE 2009 Annual Report, which section is incorporated by reference herein.
CORPORATE RESPONSIBILITY
We are committed to the highest standards of corporate responsibility and we seek to integrate environmental, social and economic considerations into our business decisions. We engage with stakeholders to identify opportunities to create benefits for both society and BCE while minimizing, where we can, any negative impact our activities may generate. In line with this commitment, in 2006, we adopted a resolution to support the United Nations Global Compact, a set of universal principles addressing human rights, labour, environmental and anti-corruption issues.
BCE’s corporate responsibility strategy and environmental risks and opportunities are overseen by the Corporate Responsibility Oversight Committee, an officer level committee chaired by the Executive Vice-President and Chief Legal and Regulatory Officer. The committee’s role is to ensure that BCE’s corporate responsibility strategy is well integrated and aligned across all parts of its business, with the intent of minimizing financial and reputational risks and maximizing business opportunities.
BCE has implemented a range of social and environmental policies which are supported by various programs and initiatives. The policies include:
Code of Business Conduct (signed by all employees) Bell Privacy Statement Bell Code of Fair Information Practices Environmental Policy Supplier Code of Conduct
BCE Inc. is part of socially responsible investment indices such as the Dow Jones Sustainability Index, the FTSE4 GOOD Index and the Jantzi Social Index.
BCE INC. 2009 ANNUAL INFORMATION FORM 13
Bell Canada is an active member of the Global e-Sustainability Initiative (www.gesi.org), an international organization that promotes sustainable development in the information and communications technology (ICT) industry. Part of its involvement includes the promotion of ICT as a solution to climate change by enabling travel reduction and dematerialization. Monitoring and reducing energy consumption is a key priority at Bell Canada because of its positive impact on the environment and the economy. BCE was recognized in 2009, and for a third year in a row, as a Climate Disclosure Leader by the Carbon Disclosure Project and The Conference Board of Canada.
NUMBER OF EMPLOYEES AT DECEMBER 31 2009 2008 2007
Bell Wireline segment 34,599 32,357 35,748 Bell Wireless segment 7,998 8,422 7,892 Bell Aliant Segment 8,065 8,757 9,184
Total 50,662 49,536(1) 52,824
(1) On July 28, 2008, we announced a reduction in the size of our Bell Canada management team as part of an organizational restructuring focused on achieving a competitive cost structure. The number of management departures at Bell Canada totalled approximately 2,500, representing approximately 6% of the total workforce or about 15% of management.

Details of these policies, and performance of our programs and initiatives, can be found under the heading Responsibility on BCE Inc.’s website at www.bce.ca.
Environment
On November 2, 2004, BCE Inc. adopted an environmental policy that affirms:
our commitment to environmental protection; our belief that environmental protection is an integral part of doing business, and needs to be managed systematically under a continuous improvement process.
The policy contains principles that support our goal, varying from exercising due diligence to meet or exceed the environmental legislation that applies to us, to prevent pollution and promote cost-effective initiatives that minimize resources and waste.
We have instructed subsidiaries subject to this policy to support these principles, and have established a management-level committee to oversee the implementation of the policy.
Bell Canada monitors its operations to seek to ensure that it complies with environmental requirements and standards, and takes action to prevent and correct problems, when needed. It has had an environmental management and review system in place since 1993, that:
provides early warning of potential problems; identifies management and cost-saving opportunities; establishes a course of action; ensures ongoing improvement through regular monitoring and reporting.
On April 14, 2009, Bell Canada obtained the ISO 14001 certification for its environmental management system (Registration number: EMS 545955). The certification covers all of Bell Canada’s businesses including landline, wireless, television and Internet services in addition to related administrative functions.
One of its key tools is the corporate environmental action plan, which outlines the environmental activities of Bell Canada’s various business units. The plan identifies funding requirements, accountabilities and deliverables, and monitors Bell Canada’s progress in meeting its objectives.
For the year ended December 31, 2009, Bell Canada spent $15.7 million on environmental activities, 51% of this was expensed and 49% was for capital expenditures. For 2010, Bell Canada has budgeted $17.6 million (42.3% for expenses and 57.7% for capital expenditures) to seek to ensure that its environmental policy is applied properly and its environmental risks are minimized.
Bell Aliant adopted a comprehensive environmental policy for Atlantic Canada that was updated in 2006 which affirms its goal to work to create a sustainable future by integrating long-term economic, environmental and social considerations into the way the business is operated. The policy provides for the identification of activities and situations which may have potential to harm the environment, and the implementation of environmentally positive practices and preventive measures. Bell Aliant’s program seeks to ensure that it complies with all environmental regulatory requirements and that its activities are carried out in a manner that minimizes risk to the environment through a continuous improvement process.
Bell Aliant manages its environment program through processes similar to those employed by Bell Canada, and collaborates on many levels to seek harmonization with Bell Canada’s environment program. Bell Aliant has adopted an environment action plan which sets out specific environmental goals for 2010.
14 BCE INC. 2009 ANNUAL INFORMATION FORM
Community
Bell invests in the local communities where our employees work and live. We support many youth focused charities like Kids Help Phone, the Canadian Centre for Child Protection and children’s hospitals. Together with our employees, we have helped raise over $18 million in eight years through the Walk for Kids Help Phone, providing critical funding for Canada’s only toll-free, 24-hour bilingual phone and web counseling, referral and information service for young people.
In 2009, Bell Canada and Bell Aliant together contributed over $13 million in donations and local community sponsorships and their employees and pensioners committed over $2.1 million in charitable gifts and logged nearly 430,000 hours in volunteer time.
COMPETITIVE ENVIRONMENT
A discussion of BCE’s competitive environment can be found in the section entitled Our Competitive Environment in the BCE 2009 MD&A, at pages 55 to 58 of the BCE 2009 Annual Report, which section is incorporated by reference herein.
See also Description of Our Business – Our Competitive Strengths in this annual information form for more information concerning BCE’s competitive position.
REGULATORY ENVIRONMENT
A discussion of the legislation that governs our business as well as government consultations and recent regulatory initiatives and proceedings affecting us can be found in the section entitled Our Regulatory Environment in the BCE 2009 MD&A, at pages 58 to 63 of the BCE 2009 Annual Report, which section is incorporated by reference herein.
BCE INC. 2009 ANNUAL INFORMATION FORM 15
THREE-YEAR HISTORY
Divestiture of Non-Core Assets and Other Key Transactions
Beginning in 2005, we announced a series of transactions to achieve the strategic objective of focusing BCE Inc. solely on Bell Canada and enhancing shareholder value. These actions included divesting BCE Inc.’s interest in non-core businesses. As part of this initiative, BCE Inc. sold its interest in its subsidiary Telesat Canada (Telesat) in October 2007. More information with respect to this transaction can be found under General Development of Our Business – Key Transactions. All other significant dispositions carried out as part of this initiative took place prior to 2007 and, accordingly, are not reported in this annual information form.
In line with our strategic imperatives stated under Description of Our Business – Strategic Imperatives, during the course of 2008 and 2009, we have entered into certain other transactions that have influenced the general development of our business. More information with respect to these transactions can be found under General Development of Our Business – Key Transactions.
Proposed Privatization
Over the course of several months beginning in November 2006, BCE Inc. was approached by Teachers’ Private Capital, the private investment arm of the Ontario Teachers’ Pension Plan (Teachers’), and Providence Equity Partners Inc. and certain of its affiliates, as well as certain other third parties, wishing to pursue the acquisition and privatization of BCE Inc.
In light of this activity, BCE Inc.’s board of directors recognized that there was a real prospect of a privatization transaction involving BCE Inc., including a potential unsolicited offer and, in April 2007, BCE Inc. announced that it was reviewing its strategic alternatives with a view to further enhancing shareholder value. This strategic review process culminated in the announcement on June 30, 2007 that BCE Inc. had entered into a definitive agreement relating to its privatization (the Privatization) through the proposed acquisition of all of BCE Inc.’s outstanding common and preferred shares by a corporation (the Purchaser) owned by an investor group at that time
General Development of Our Business

led by Teachers’ and affiliates of Providence Equity Partners Inc. and Madison Dearborn Partners, LLC and which, subsequently, also included Merrill Lynch Global Private Equity. The transaction was to be completed through a plan of arrangement (the Arrangement).
On July 4, 2008, BCE Inc. and the Purchaser entered into a final amending agreement (the Final Amending Agreement) further amending the definitive agreement of June 29, 2007, as amended (together with the Final Amending Agreement, the Definitive Agreement). As a result of the execution of the Final Amending Agreement: (i) the purchase price remained $42.75 per common share; (ii) the Purchaser and a group of lenders delivered fully negotiated and executed credit documents for the purpose of funding the proposed acquisition of BCE Inc., including an executed credit agreement and certain other key financing documents; (iii) the reverse break fee payable by the Purchaser in the circumstances contemplated by the Definitive Agreement was increased to $1.2 billion; (iv) closing was to occur on or before December 11, 2008; and (v) prior to closing, BCE Inc. would not pay dividends on its common shares but would continue to pay dividends on its preferred shares. On December 12, 2008, BCE Inc. terminated the Definitive Agreement in accordance with its terms. See Legal Proceedings – Lawsuits Related to BCE Inc. – Privatization Transaction Lawsuit for more information concerning the termination of the Definitive Agreement and the related legal proceedings.
Under the terms of the Definitive Agreement, BCE Inc. agreed that prior to the consummation of the Privatization, it would conduct its business, and cause its subsidiaries to conduct their business, in the ordinary course consistent with past practice and specifically agreed to restrict certain of its activities, including the entering into of certain transactions such as mergers, asset dispositions and acquisitions. As such, subject to limited exceptions, no such transactions were entered into in the second half of 2007 and in 2008.
16 BCE INC. 2009 ANNUAL INFORMATION FORM
Returning Value to Shareholders
Following the termination of the Definitive Agreement by BCE Inc. in accordance with its terms, BCE Inc. announced, on December 12, 2008, plans to return value to BCE Inc.’s shareholders with a reinstated common share dividend and a new normal course issuer bid common share buyback program (2008/2009 NCIB). Under the 2008/2009 NCIB, BCE Inc. was entitled to repurchase for cancellation up to 40,000,000 common shares over the 12-month period starting on December 23, 2008 and ending on December 22, 2009, representing approximately 5% of BCE Inc.’s 807,049,958 issued and outstanding common shares as of December 5, 2008. On May 5, 2009, BCE Inc. completed the 2008/2009 NICB ahead of schedule at an average price of $24.65 per share, including 10.3 million common shares that BCE Inc. purchased for cancellation pursuant to private agreements with arm’s length third-party sellers.
On December 17, 2009, BCE Inc. announced that the Toronto Stock Exchange approved a new normal course issuer bid common share buyback program (2010 NCIB). Under the 2010 NCIB, BCE Inc. is entitled to repurchase for cancellation up to 20,000,000 common shares (subject to a maximum aggregate purchase price of $500 million) over the 12-month period starting on December 29, 2009 and ending on December 28, 2010, representing approximately 2.6% of BCE Inc.’s 767,166,281 issued and outstanding common shares as of December 11, 2009.
Bell Canada Plan of Arrangement
On January 31, 2007, we implemented a plan of arrangement approved by holders of Bell Canada preferred shares pursuant to which all such shares were exchanged for BCE Inc. preferred shares and, on February 1, 2007, BCE Inc. entered into agreements to guarantee all of Bell Canada’s public debt securities. As a result of such transactions, Bell Canada no longer prepares and files public disclosure documents separate from those of BCE Inc.
KEY TRANSACTIONS
The transactions that have influenced the general development of our business over the past three years are summarized in the following table:
BCE INC. 2009 ANNUAL INFORMATION FORM 17
18 BCE INC. 2009 ANNUAL INFORMATION FORM
This section describes BCE Inc.’s securities, the trading of certain of such securities on the Toronto Stock Exchange and the ratings that certain rating agencies have attributed to BCE Inc.’s preferred shares and Bell Canada’s public debt securities.
BCE INC. SECURITIES
BCE Inc. Preferred Shares, Common Shares and Class B Shares
BCE Inc.’s articles of amalgamation, as amended, provide for an unlimited number of common shares, an unlimited number of first preferred shares issuable in series, an
TRANSACTION KEY CHARACTERISTICSAcquisition of minority interest in the Montréal Canadiens Hockey Club and the Bell Centre as part of a consortium led by the Molson Family (2009)
$50 million
On December 1, 2009, Bell Canada, as part of a consortium led by the Molson Family, acquired a minority participation in the Montréal Canadiens Hockey Club and the Bell Centre. Bell Canada’s investment was approximately $50 million. Such investment is expected to enhance Bell Canada’s marketing and promotional relationship with the Canadiens.
Acquisition of substantially all of the assets of The Source by Circuit City (2009)
$161 million
On July 1, 2009, we acquired substantially all of the assets of national electronics retailer The Source by Circuit City. These assets are now held by our wholly-owned subsidiary, The Source. The Source began selling Bell TV services at the end of the second quarter of 2009 and Bell Internet services in November 2009. It offers Bell Mobility and Virgin Mobile wireless products since January 2010. Other Bell services, such as Bell Home Phone, will be available at The Source at a later date.
Acquisition of the remaining 50% of the equity of Virgin (2009)
$161 million
On July 1, 2009, we acquired the remaining 50% of the equity of Virgin not already owned. As part of this transaction, we entered into a long-term brand licensing agreement with the Virgin Group.
TRANSACTION KEY CHARACTERISTICSAdvanced Wireless Services Spectrum Auction (2008)
$741 million
In order to provide an expansion path for next-generation technologies and future services, we purchased new wireless licences in the AWS spectrum auction that concluded on July 21, 2008. BCE acquired 20 megahertz of spectrum in Ontario (including Toronto and surrounding areas), in Canada’s Atlantic Provinces, and in Northern Canada, as well as 10 megahertz in Québec and in Western Canada, for a total investment of $741 million.
Sale of Telesat (2007)
$3.42 billion
Telesat is Canada’s leading satellite services provider. Following a strategic review of Telesat, we concluded in early 2006 that BCE Inc.’s public market valuation was not capturing Telesat’s full value. After an extensive auction process, we agreed to divest Telesat to a consortium including the Public Service Pension Fund and Loral Space Systems for a transaction value of $3.42 billion. The transaction closed in October 2007. As part of this transaction, Bell TV executed commercial agreements with Telesat assuring Bell TV with continued access to satellite capacity.
Our Capital Structure

unlimited number of second preferred shares also issuable in series and an unlimited number of Class B shares.
Each common share entitles its holder to one vote at any meeting of shareholders. Additional information about the terms and conditions of the BCE Inc. preferred shares, common shares and Class B Shares can be found under note 20 – Share Capital of the BCE Inc. 2009 financial statements on pages 109 to 111 of the BCE 2009 Annual Report, which note is incorporated by reference herein.
There are ownership constraints on BCE Inc.’s common shares. A discussion of these ownership constraints can be found in the section entitled Our Regulatory Environment in the BCE 2009 MD&A, on pages 58 to 63 of the BCE 2009 Annual Report, which section is incorporated by reference herein.
BCE Inc. Debt Securities
On June 8, 2009, BCE Inc. redeemed, prior to maturity, all of its outstanding $650 million principal amount of 7.35% Series C notes due October 30, 2009. Accordingly, as of March 11, 2010, BCE Inc. no longer had any debt securities outstanding.
BELL CANADA DEBT SECURITIES
Bell Canada has issued long-term debt securities as summarized in the table below.
The Bell Canada debentures are unsecured and have been guaranteed by BCE Inc. They include US$200 million maturing in 2010, which has been swapped into Canadian dollars.
Bell Canada filed a shelf prospectus on September 3, 2009 and a prospectus supplement on September 4, 2009 providing for the issuance of up to $3.0 billion of unsecured medium-term debentures from time to time over a 25-month period. As of March 11, 2010, Bell Canada had no debt securities issued under such shelf prospectus.
Bell Canada may issue notes under its commercial paper program up to the amount of its supporting committed lines of credit. The total amount of its supporting committed lines of credit available at March 11, 2010 was $1,132 million. Bell Canada had no commercial paper outstanding at March 11, 2010.
Certain of Bell Canada’s trust indentures impose covenants which place limitations on the issuance of additional debt with a maturity date exceeding one year based on certain tests related to interest and asset coverage. In addition, Bell Canada is required, under certain conditions, to make an offer to repurchase all or, at the option of the holder thereof, any part of certain series of its debentures, upon the occurrence of both a “Change of Control” of BCE Inc. or Bell Canada and a “Rating Event” relating to the relevant series of debentures. “Change of Control” and “Rating Event” are defined in the terms and conditions attaching to the relevant series of debentures. Bell Canada is in compliance with all conditions and restrictions attaching to its debt securities.
BCE INC. 2009 ANNUAL INFORMATION FORM 19
RATINGS FOR BCE INC. AND BELL CANADA SECURITIES
Ratings generally address the ability of a company to repay principal and interest or dividends on issued and outstanding securities.
As of March 11, 2010, BCE Inc.’s preferred shares and Bell Canada’s debt securities are rated by the following rating agencies:
DBRS Limited (DBRS) Moody’s Investors Service, Inc. (Moody’s) Standard & Poor’s Financial Services LLC, a subsidiary of The McGraw-Hill Companies, Inc. (S&P).
This section describes the credit ratings, as of March 11, 2010, that BCE Inc. and Bell Canada have requested for certain of their securities. These ratings provide investors with an independent measure of credit quality of an issue of securities. Each rating should be evaluated independently.
These credit ratings are not recommendations to purchase, hold or sell any of the securities discussed above, or a comment on the market price or suitability for a particular investor. There is no assurance that any rating will remain in effect for any given period of time or that any rating will not be revised or withdrawn in the future by a rating agency.
RATINGS FOR BELL CANADA DEBT SECURITIES
Short-Term Debt Securities
Long-Term Debt Securities
RATINGS FOR BCE INC. PREFERRED SHARES
20 BCE INC. 2009 ANNUAL INFORMATION FORM
WEIGHTEDAVERAGE
INTEREST RATE MATURITY
ATDECEMBER 31, 2009
(IN $ MILLIONS)
Debentures 1997 trust indenture 5.91% 2011-2035 4,100 1976 trust indenture 9.73% 2010-2054 1,584 Subordinated debentures 8.21% 2026-2031 275
Total 5,959
SHORT-TERM DEBT SECURITIES RATING AGENCY RATING RANK
Bell Canada commercial paper DBRS R-1 (low) 3 out of 10 Moody’s P-2 2 out of 3 S&P A-2 4 out of 8
LONG-TERM DEBT SECURITIES RATING AGENCY RATING RANK
Bell Canada unsubordinated long-term debt DBRS A (low) 7 out of 26 Moody’s Baa1 8 out of 21 S&P BBB+ 8 out of 22 Bell Canada subordinated long-term debt DBRS BBB 9 out of 26 Moody’s Baa2 9 out of 21 S&P BBB 9 out of 22
PREFERRED SHARES RATING AGENCY RATING RANK
BCE Inc. preferred shares DBRS Pfd-3 (high) 7 out of 16 S&P P-2 (low) 6 out of 18
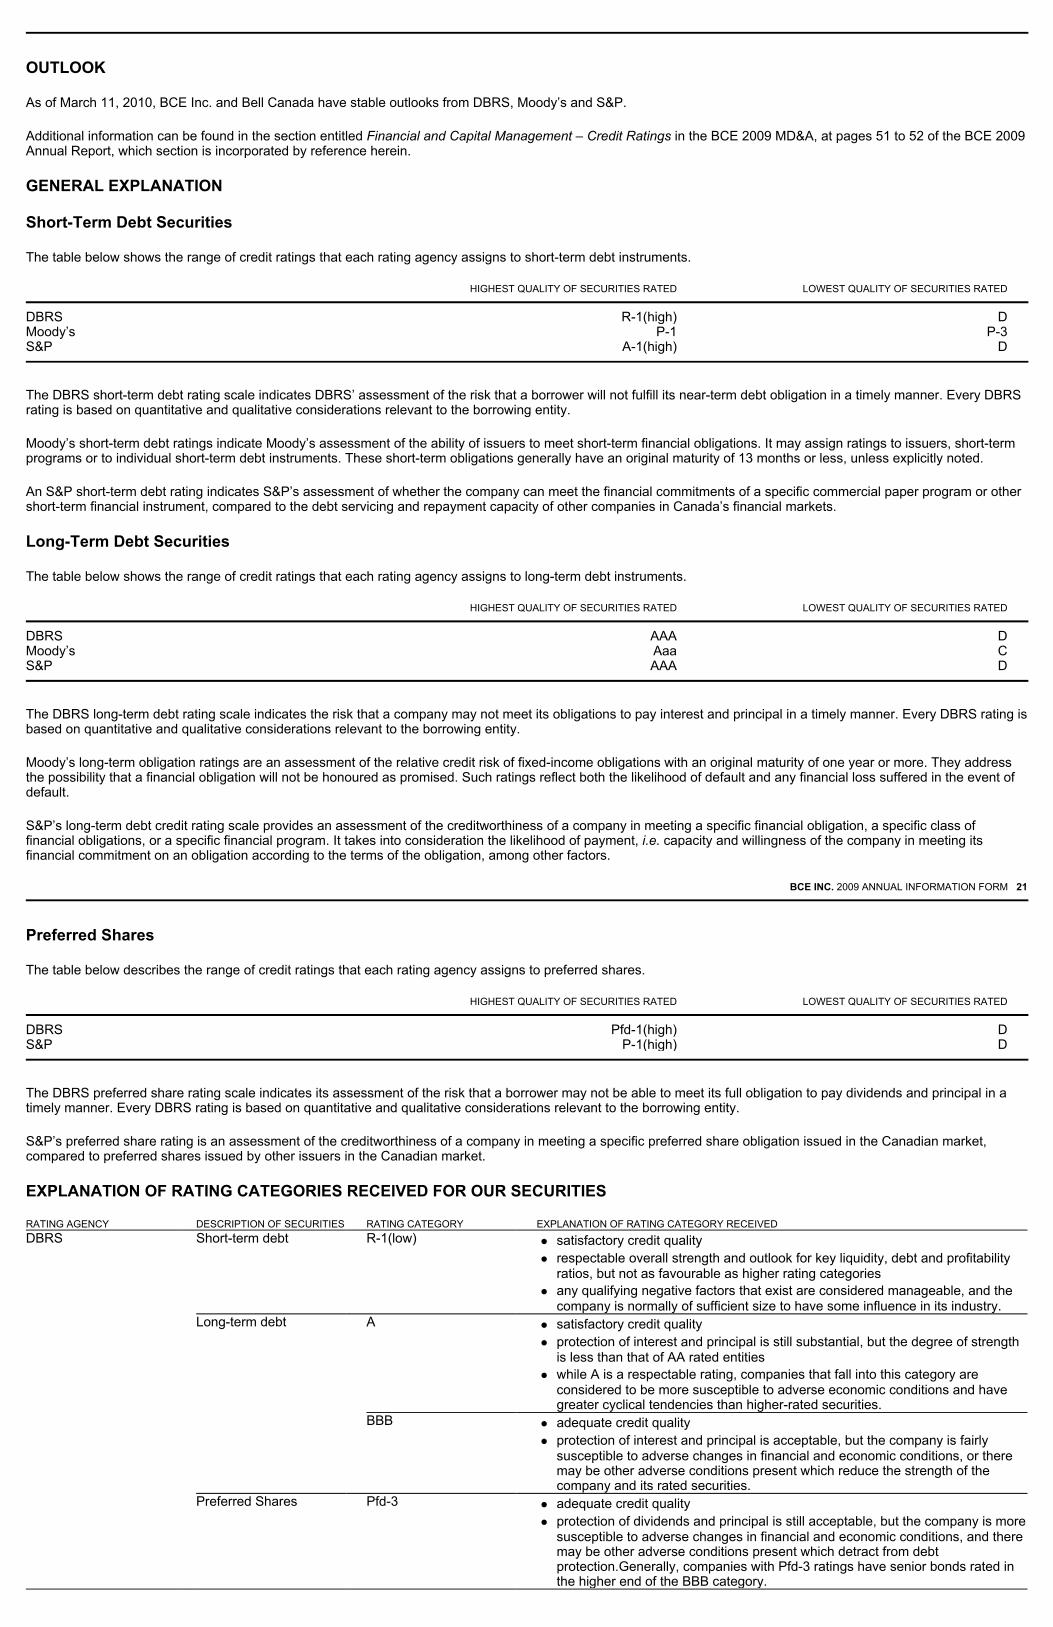
OUTLOOK
As of March 11, 2010, BCE Inc. and Bell Canada have stable outlooks from DBRS, Moody’s and S&P.
Additional information can be found in the section entitled Financial and Capital Management – Credit Ratings in the BCE 2009 MD&A, at pages 51 to 52 of the BCE 2009 Annual Report, which section is incorporated by reference herein.
GENERAL EXPLANATION
Short-Term Debt Securities
The table below shows the range of credit ratings that each rating agency assigns to short-term debt instruments.
The DBRS short-term debt rating scale indicates DBRS’ assessment of the risk that a borrower will not fulfill its near-term debt obligation in a timely manner. Every DBRS rating is based on quantitative and qualitative considerations relevant to the borrowing entity.
Moody’s short-term debt ratings indicate Moody’s assessment of the ability of issuers to meet short-term financial obligations. It may assign ratings to issuers, short-term programs or to individual short-term debt instruments. These short-term obligations generally have an original maturity of 13 months or less, unless explicitly noted.
An S&P short-term debt rating indicates S&P’s assessment of whether the company can meet the financial commitments of a specific commercial paper program or other short-term financial instrument, compared to the debt servicing and repayment capacity of other companies in Canada’s financial markets.
Long-Term Debt Securities
The table below shows the range of credit ratings that each rating agency assigns to long-term debt instruments.
The DBRS long-term debt rating scale indicates the risk that a company may not meet its obligations to pay interest and principal in a timely manner. Every DBRS rating is based on quantitative and qualitative considerations relevant to the borrowing entity.
Moody’s long-term obligation ratings are an assessment of the relative credit risk of fixed-income obligations with an original maturity of one year or more. They address the possibility that a financial obligation will not be honoured as promised. Such ratings reflect both the likelihood of default and any financial loss suffered in the event of default.
S&P’s long-term debt credit rating scale provides an assessment of the creditworthiness of a company in meeting a specific financial obligation, a specific class of financial obligations, or a specific financial program. It takes into consideration the likelihood of payment, i.e. capacity and willingness of the company in meeting its financial commitment on an obligation according to the terms of the obligation, among other factors.
BCE INC. 2009 ANNUAL INFORMATION FORM 21
Preferred Shares
The table below describes the range of credit ratings that each rating agency assigns to preferred shares.
The DBRS preferred share rating scale indicates its assessment of the risk that a borrower may not be able to meet its full obligation to pay dividends and principal in a timely manner. Every DBRS rating is based on quantitative and qualitative considerations relevant to the borrowing entity.
S&P’s preferred share rating is an assessment of the creditworthiness of a company in meeting a specific preferred share obligation issued in the Canadian market, compared to preferred shares issued by other issuers in the Canadian market.
EXPLANATION OF RATING CATEGORIES RECEIVED FOR OUR SECURITIES
HIGHEST QUALITY OF SECURITIES RATED LOWEST QUALITY OF SECURITIES RATED
DBRS R-1(high) D Moody’s P-1 P-3 S&P A-1(high) D
HIGHEST QUALITY OF SECURITIES RATED LOWEST QUALITY OF SECURITIES RATED
DBRS AAA D Moody’s Aaa C S&P AAA D
HIGHEST QUALITY OF SECURITIES RATED LOWEST QUALITY OF SECURITIES RATED
DBRS Pfd-1(high) D S&P P-1(high) D
RATING AGENCY DESCRIPTION OF SECURITIES RATING CATEGORY EXPLANATION OF RATING CATEGORY RECEIVEDDBRS Short-term debt R-1(low) satisfactory credit quality
respectable overall strength and outlook for key liquidity, debt and profitability ratios, but not as favourable as higher rating categories any qualifying negative factors that exist are considered manageable, and the company is normally of sufficient size to have some influence in its industry.
Long-term debt
A satisfactory credit qualityprotection of interest and principal is still substantial, but the degree of strength is less than that of AA rated entities while A is a respectable rating, companies that fall into this category are considered to be more susceptible to adverse economic conditions and have greater cyclical tendencies than higher-rated securities.
BBB adequate credit qualityprotection of interest and principal is acceptable, but the company is fairly susceptible to adverse changes in financial and economic conditions, or there may be other adverse conditions present which reduce the strength of the company and its rated securities.
Preferred Shares Pfd-3 adequate credit qualityprotection of dividends and principal is still acceptable, but the company is more susceptible to adverse changes in financial and economic conditions, and there may be other adverse conditions present which detract from debt protection.Generally, companies with Pfd-3 ratings have senior bonds rated in the higher end of the BBB category.

22 BCE INC. 2009 ANNUAL INFORMATION FORM
MARKET FOR OUR SECURITIES
The common and preferred shares of BCE Inc. are listed on the Toronto Stock Exchange. BCE Inc.’s common shares are also listed on the New York Stock Exchange.
TRADING OF OUR SECURITIES
The tables below and on the next pages show the range in share price per month and volume traded on the Toronto Stock Exchange in 2009 for each class of BCE Inc. shares.
BCE INC. 2009 ANNUAL INFORMATION FORM 23
Moody’s Short-term debt P-2 a strong ability to repay short-term debt obligations Long-term debt Baa subject to moderate credit risk
considered medium-grade and may have certain speculative characteristics
RATING AGENCY DESCRIPTION OF SECURITIES RATING CATEGORY EXPLANATION OF RATING CATEGORY RECEIVEDS&P Short-term debt
A-2 satisfactory capacity of the company to fulfill its financial commitment on the obligation higher susceptibility to changing circumstances or economic conditions than obligations rated A-1 (low).
Long-term debt
BBB adequate capacity to meet its financial commitmentsadverse economic conditions or changing circumstances are more likely to lead to a weakened capacity of the company to meet its financial commitments
Preferred Shares P-2 adequate protection parametersadverse economic conditions or changing circumstances are more likely to weaken the company’s ability to meet its financial commitment on the obligation
COMMONSHARES
PREFERREDSHARES
SERIES R
PREFERREDSHARES
SERIES S
PREFERREDSHARES
SERIES T
PREFERREDSHARES
SERIES Y
PREFERREDSHARES
SERIES Z
PREFERREDSHARES
SERIES AA
PREFERREDSHARES
SERIES AB
January 2009 High $25.69 $17.50 $15.87 $16.35 $16.00 $16.51 $17.96 $14.99 Low $23.70 $14.25 $13.50 $14.20 $13.89 $13.50 $16.09 $13.65 Volume 96,049,662 108,055 112,165 127,700 132,958 187,507 797,981 222,800
February 2009 High $26.38 $16.00 $14.50 $15.95 $14.99 $16.49 $17.00 $14.55 Low $24.44 $15.30 $13.06 $14.01 $13.25 $14.81 $16.31 $14.00 Volume 73,688,146 124,260 71,315 40,580 186,089 94,279 101,740 106,500
March 2009 High $25.37 $15.65 $13.75 $15.20 $13.99 $15.24 $16.45 $13.50 Low $23.15 $14.10 $12.35 $14.25 $12.66 $13.00 $14.60 $13.00 Volume 104,048,027 45,902 27,235 42,445 23,221 17,765 129,469 60,450
April 2009 High $26.95 $15.94 $13.49 $15.30 $13.58 $15.28 $16.47 $13.93 Low $25.05 $14.75 $12.72 $14.00 $12.67 $14.24 $15.70 $12.90 Volume 67,569,988 59,015 107,475 140,825 209,291 125,509 547,734 382,700
May 2009 High $26.45 $16.74 $15.63 $16.70 $16.73 $15.97 $17.85 $15.75 Low $22.94 $15.66 $13.02 $15.00 $13.45 $14.54 $15.84 $13.25 Volume 111,372,082 111,304 189,138 291,313 106,965 122,641 621,002 59,394
June 2009 High $25.15 $18.05 $17.48 $17.79 $17.60 $17.25 $18.49 $17.40 Low $23.38 $16.81 $15.13 $16.47 $15.25 $15.85 $17.35 $16.19 Volume 79,847,371 94,899 142,045 145,215 91,981 105,023 197,944 152,393
COMMON
SHARES
PREFERREDSHARES
SERIES R
PREFERREDSHARES
SERIES S
PREFERREDSHARES
SERIES T
PREFERREDSHARES
SERIES Y
PREFERREDSHARES
SERIES Z
PREFERREDSHARES
SERIES AA
PREFERREDSHARES
SERIES AB
July 2009 High $24.94 $18.40 $17.76 $17.96 $17.99 $17.60 $18.50 $18.00 Low $23.28 $17.45 $16.68 $16.75 $16.97 $16.74 $17.70 $17.00 Volume 68,109,325 71,231 28,014 49,845 90,257 47,048 325,801 38,680
August 2009 High $27.00 $20.70 $19.06 $20.35 $19.98 $20.59 $20.67 $19.09 Low $24.40 $18.01 $17.50 $17.85 $17.00 $17.40 $18.35 $17.15 Volume 57,129,162 84,795 35,918 78,367 204,631 65,662 428,428 85,894
September 2009 High $27.35 $20.27 $19.00 $20.14 $18.43 $19.61 $20.39 $19.00 Low $26.01 $18.20 $17.99 $18.25 $17.20 $18.11 $18.53 $18.45 Volume 57,044,828 104,579 28,780 84,265 355,827 52,745 526,890 102,985
October 2009 High $26.63 $18.40 $18.10 $18.33 $17.50 $18.25 $19.18 $18.45 Low $25.07 $17.00 $16.05 $16.75 $16.40 $17.00 $17.71 $16.50 Volume 54,353,243 175,392 57,145 63,925 131,431 39,246 291,021 117,580
November 2009 High $28.00 $17.94 $17.71 $18.00 $18.08 $18.69 $19.49 $18.50 Low $25.50 $16.85 $16.50 $17.00 $16.80 $16.66 $17.75 $16.80 Volume 39,737,900 473,707 68,000 422,788 52,113 56,105 298,491 28,989
December 2009 High $29.00 $18.45 $18.40 $18.39 $18.65 $18.39 $20.40 $19.99

24 BCE INC. 2009 ANNUAL INFORMATION FORM
BCE INC. 2009 ANNUAL INFORMATION FORM 25
The board of directors of BCE Inc. reviews from time to time the adequacy of BCE Inc.’s dividend policy. On February 10, 2009, the board of directors of BCE Inc. adopted a new common share dividend policy with a target dividend payout ratio of 65% to 75% of earnings per share (EPS) before restructuring and other and net (gains) losses on investments (Adjusted EPS). This dividend policy was adopted with the objective of allowing sufficient financial flexibility to continue investing in BCE’s business while growing returns to shareholders. Under this dividend policy, increases in the common share dividend are directly linked to growth in BCE Inc.’s Adjusted EPS. BCE Inc.’s dividend policy and the declaration of dividends are subject to the discretion of BCE Inc.’s board of directors and, consequently, there can be no guarantee that BCE Inc.’s dividend policy will be maintained or that dividends will be declared.
In the course of 2009, BCE Inc. announced increases in the annual dividend payable on BCE Inc.’s common shares, as indicated in the table below.
Low $26.14 $17.71 $17.40 $17.88 $17.77 $17.55 $19.10 $17.95 Volume 49,808,836 187,288 69,955 247,792 132,921 84,761 399,934 16,771
PREFERRED PREFERRED PREFERRED PREFERRED PREFERRED PREFERRED PREFERRED SHARES SHARES SHARES SHARES SHARES SHARES SHARES
SERIES AC SERIES AD SERIES AE SERIES AF SERIES AG SERIES AH SERIES AI
January 2009 High $16.74 $14.50 $15.50 $16.50 $16.50 $15.00 $17.82 Low $15.01 $14.00 $14.00 $15.00 $15.25 $13.02 $13.95 Volume 251,637 1,900 6,050 242,021 88,602 227,934 312,859
February 2009 High $16.35 $14.25 $15.00 $15.75 $15.75 $14.25 $16.45 Low $15.50 $13.25 $14.00 $14.20 $14.60 $13.00 $15.02 Volume 208,160 80,500 4,150 201,700 45,620 96,510 149,788
March 2009 High $16.00 $13.45 $13.76 $14.75 $15.20 $13.25 $15.34 Low $15.35 $13.00 $13.00 $13.95 $12.00 $12.75 $14.03 Volume 154,830 6,100 24,325 87,268 29,350 77,850 167,537
April 2009 High $15.90 $13.45 $14.00 $15.50 $15.25 $13.24 $16.16 Low $15.00 $12.90 $13.25 $14.35 $13.91 $12.60 $14.40 Volume 435,215 422,100 27,518 255,293 153,028 772,268 273,381
PREFERRED PREFERRED PREFERRED PREFERRED PREFERRED PREFERRED PREFERRED SHARES SHARES SHARES SHARES SHARES SHARES SHARES SERIES AC SERIES AD SERIES AE SERIES AF SERIES AG SERIES AH SERIES AI
May 2009 High $16.74 $16.00 $16.34 $17.50 $16.50 $16.00 $17.50 Low $15.89 $13.50 $13.65 $14.80 $14.70 $13.10 $15.65 Volume 378,028 43,700 132,364 439,955 353,811 156,920 246,076
June 2009 High $17.50 $18.00 $18.10 $18.50 $18.99 $17.22 $19.04 Low $16.70 $16.25 $16.10 $17.15 $16.49 $15.42 $17.15 Volume 387,931 9,175 8,500 150,514 138,542 315,383 133,617
July 2009 High $18.00 $17.70 $17.75 $18.49 $17.91 $17.94 $18.90 Low $17.18 $17.25 $16.81 $17.56 $16.49 $16.50 $18.06 Volume 359,248 23,900 19,300 328,498 247,541 73,375 142,255
August 2009 High $20.50 $20.37 $19.00 $19.50 $20.25 $19.10 $20.75 Low $17.92 $17.65 $17.99 $17.99 $17.59 $17.20 $18.57 Volume 281,156 104,050 8,275 352,202 123,816 91,980 147,302
September 2009 High $20.30 $19.95 $19.05 $19.49 $20.40 $18.30 $20.48 Low $18.50 $18.70 $18.25 $18.25 $17.98 $17.25 $18.30 Volume 352,630 15,000 13,200 238,804 423,233 141,745 258,349
October 2009 High $18.70 $18.75 $18.25 $18.95 $18.00 $17.50 $18.40 Low $17.13 $17.25 $16.26 $16.75 $16.70 $16.50 $17.01 Volume 285,396 11,600 46,778 124,934 121,807 132,270 241,164
November 2009 High $19.06 $18.48 $17.75 $18.21 $17.78 $17.75 $18.39 Low $17.39 $17.30 $16.51 $16.91 $16.61 $16.50 $17.15 Volume 297,967 9,775 30,205 178,542 147,410 95,275 496,502
December 2009 High $19.60 $19.12 $18.48 $18.65 $18.33 $18.10 $19.14 Low $18.78 $18.00 $17.50 $17.82 $17.70 $17.50 $18.31 Volume 254,943 15,370 95,210 202,773 221,995 245,910 361,901
Our Dividend Policy
DATE OF ANNOUNCEMENT AMOUNT OF INCREASE EFFECTIVE TIME
February 11, 2009 5% (from $1.46 per share to $1.54 per share) Quarterly dividend payable on April 15, 2009 August 6, 2009 5% (from $1.54 per share to $1.62 per share) Quarterly dividend payable on October 15, 2009 December 17, 2009 7% (from $1.62 per share to $1.74 per share) Quarterly dividend payable on April 15, 2010
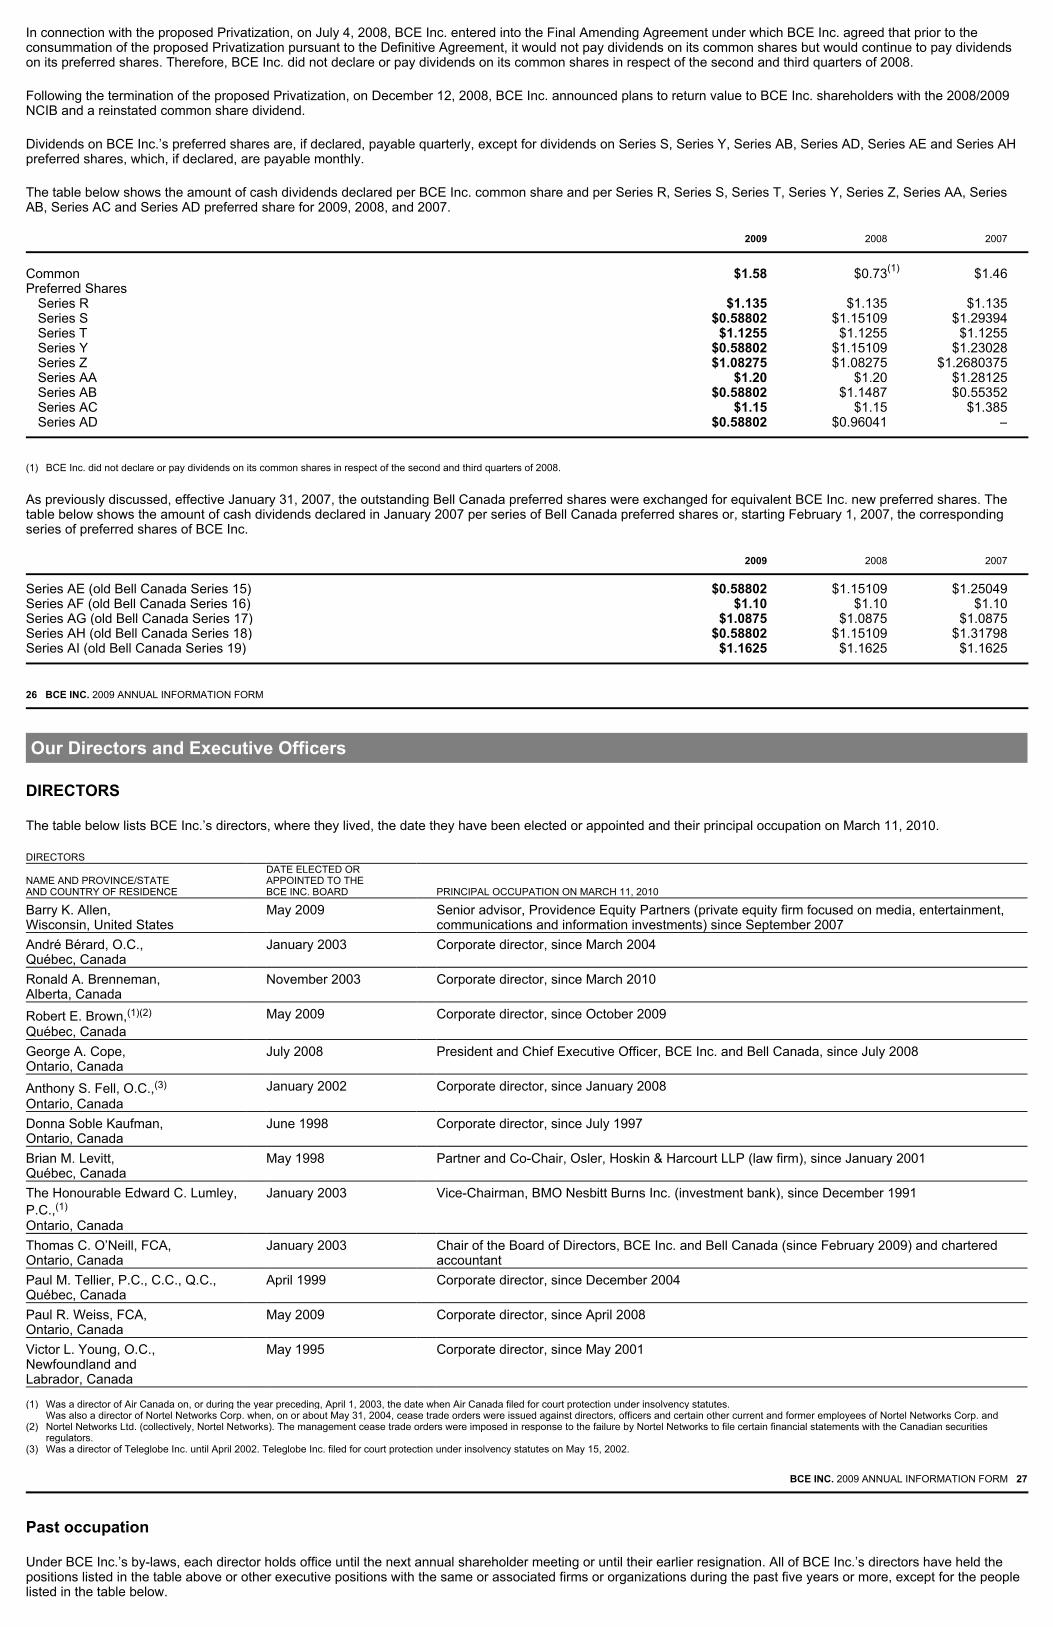
In connection with the proposed Privatization, on July 4, 2008, BCE Inc. entered into the Final Amending Agreement under which BCE Inc. agreed that prior to the consummation of the proposed Privatization pursuant to the Definitive Agreement, it would not pay dividends on its common shares but would continue to pay dividends on its preferred shares. Therefore, BCE Inc. did not declare or pay dividends on its common shares in respect of the second and third quarters of 2008.
Following the termination of the proposed Privatization, on December 12, 2008, BCE Inc. announced plans to return value to BCE Inc. shareholders with the 2008/2009 NCIB and a reinstated common share dividend.
Dividends on BCE Inc.’s preferred shares are, if declared, payable quarterly, except for dividends on Series S, Series Y, Series AB, Series AD, Series AE and Series AH preferred shares, which, if declared, are payable monthly.
The table below shows the amount of cash dividends declared per BCE Inc. common share and per Series R, Series S, Series T, Series Y, Series Z, Series AA, Series AB, Series AC and Series AD preferred share for 2009, 2008, and 2007.
As previously discussed, effective January 31, 2007, the outstanding Bell Canada preferred shares were exchanged for equivalent BCE Inc. new preferred shares. The table below shows the amount of cash dividends declared in January 2007 per series of Bell Canada preferred shares or, starting February 1, 2007, the corresponding series of preferred shares of BCE Inc.
26 BCE INC. 2009 ANNUAL INFORMATION FORM
DIRECTORS
The table below lists BCE Inc.’s directors, where they lived, the date they have been elected or appointed and their principal occupation on March 11, 2010.
BCE INC. 2009 ANNUAL INFORMATION FORM 27
Past occupation
Under BCE Inc.’s by-laws, each director holds office until the next annual shareholder meeting or until their earlier resignation. All of BCE Inc.’s directors have held the positions listed in the table above or other executive positions with the same or associated firms or organizations during the past five years or more, except for the people listed in the table below.
2009 2008 2007
Common $1.58 $0.73(1) $1.46 Preferred Shares
Series R $1.135 $1.135 $1.135 Series S $0.58802 $1.15109 $1.29394 Series T $1.1255 $1.1255 $1.1255 Series Y $0.58802 $1.15109 $1.23028 Series Z $1.08275 $1.08275 $1.2680375 Series AA $1.20 $1.20 $1.28125 Series AB $0.58802 $1.1487 $0.55352 Series AC $1.15 $1.15 $1.385 Series AD $0.58802 $0.96041 –
(1) BCE Inc. did not declare or pay dividends on its common shares in respect of the second and third quarters of 2008.
2009 2008 2007
Series AE (old Bell Canada Series 15) $0.58802 $1.15109 $1.25049 Series AF (old Bell Canada Series 16) $1.10 $1.10 $1.10 Series AG (old Bell Canada Series 17) $1.0875 $1.0875 $1.0875 Series AH (old Bell Canada Series 18) $0.58802 $1.15109 $1.31798 Series AI (old Bell Canada Series 19) $1.1625 $1.1625 $1.1625
Our Directors and Executive Officers
DIRECTORS
NAME AND PROVINCE/STATE AND COUNTRY OF RESIDENCE
DATE ELECTED OR APPOINTED TO THE BCE INC. BOARD PRINCIPAL OCCUPATION ON MARCH 11, 2010
Barry K. Allen, Wisconsin, United States
May 2009 Senior advisor, Providence Equity Partners (private equity firm focused on media, entertainment, communications and information investments) since September 2007
André Bérard, O.C., Québec, Canada
January 2003 Corporate director, since March 2004
Ronald A. Brenneman, Alberta, Canada
November 2003 Corporate director, since March 2010
Robert E. Brown,(1)(2)
Québec, Canada May 2009 Corporate director, since October 2009
George A. Cope, Ontario, Canada
July 2008 President and Chief Executive Officer, BCE Inc. and Bell Canada, since July 2008
Anthony S. Fell, O.C.,(3) Ontario, Canada
January 2002 Corporate director, since January 2008
Donna Soble Kaufman, Ontario, Canada
June 1998 Corporate director, since July 1997
Brian M. Levitt, Québec, Canada
May 1998 Partner and Co-Chair, Osler, Hoskin & Harcourt LLP (law firm), since January 2001
The Honourable Edward C. Lumley, P.C.,(1) Ontario, Canada
January 2003 Vice-Chairman, BMO Nesbitt Burns Inc. (investment bank), since December 1991
Thomas C. O’Neill, FCA, Ontario, Canada
January 2003 Chair of the Board of Directors, BCE Inc. and Bell Canada (since February 2009) and chartered accountant
Paul M. Tellier, P.C., C.C., Q.C., Québec, Canada
April 1999 Corporate director, since December 2004
Paul R. Weiss, FCA, Ontario, Canada
May 2009 Corporate director, since April 2008
Victor L. Young, O.C., Newfoundland and Labrador, Canada
May 1995 Corporate director, since May 2001
(1) Was a director of Air Canada on, or during the year preceding, April 1, 2003, the date when Air Canada filed for court protection under insolvency statutes.
(2)Was also a director of Nortel Networks Corp. when, on or about May 31, 2004, cease trade orders were issued against directors, officers and certain other current and former employees of Nortel Networks Corp. and Nortel Networks Ltd. (collectively, Nortel Networks). The management cease trade orders were imposed in response to the failure by Nortel Networks to file certain financial statements with the Canadian securities regulators.
(3) Was a director of Teleglobe Inc. until April 2002. Teleglobe Inc. filed for court protection under insolvency statutes on May 15, 2002.

Committees of the board
The table below lists the committees of BCE Inc.’s board of directors and their current members.
28 BCE INC. 2009 ANNUAL INFORMATION FORM
EXECUTIVE OFFICERS
The table below lists BCE Inc.’s and Bell Canada’s executive officers, being the 12 members of the Executive Committee of BCE Inc. and Bell Canada, where they lived and the office that they held at BCE Inc. and/or Bell Canada on March 11, 2010.
BCE INC. 2009 ANNUAL INFORMATION FORM 29
Past Occupation
All of our executive officers have held their present positions or other executive positions with BCE Inc. or Bell Canada during the past five years or more, except for:
DIRECTOR PAST OCCUPATION
Mr. Allen Executive Vice-President of Operations of Qwest Communications International (communications company) from 2004 to June 2007
Mr. Brenneman Executive Vice-Chairman of Suncor Energy Inc. (petroleum company) from August 2009 to February 2010 and President and Chief Executive Officer of Petro-Canada (petroleum company) from 2000 to July 2009
Mr. Brown President and Chief Executive Officer of CAE Inc. (provider of simulation and modeling technologies as well as integrated training service for both civil aviation and defence customers) from 2004 to September 2009
Mr. Cope President and Chief Executive Officer of TELUS Mobility (a business unit of TELUS Corporation) from 2000 to November 2005
Mr. Fell Chairman of the board of RBC Capital Markets (investment bank) from 1999 to December 2007
Mr. O’Neill Corporate director from 2003 to February 2009 when he was appointed Chair of the board, BCE Inc. and Bell Canada
Mr. Weiss Partner of KPMG LLP (accounting and audit firm) from 1977 until March 2008
COMMITTEES MEMBERS
Audit Paul R. Weiss (Chair) André Bérard Anthony S. Fell Victor L. Young
Corporate Governance Robert E. Brown (Chair) Barry K. Allen André Bérard Donna Soble Kaufman
Management Resources and Brian M. Levitt (Chair) Compensation Barry K. Allen Ronald A. Brenneman Anthony S. Fell
Pension Fund Paul M. Tellier (Chair) Robert E. Brown Edward C. Lumley Paul R. Weiss Victor L. Young
PROVINCE AND COUNTRY NAME OF RESIDENCE OFFICE HELD AT BCE INC./BELL CANADA
J. Trevor Anderson Ontario, Canada Executive Vice-President – Network (Bell Canada)
Stéphane Boisvert Québec, Canada President – Bell Business Markets (Bell Canada)
Charles Brown(1)(2) Ontario, Canada Executive Vice-President – Strategic Initiatives (Bell Canada)
Michael Cole Ontario, Canada Executive Vice-President and Chief Information Officer (Bell Canada)
George A. Cope Ontario, Canada President and Chief Executive Officer (BCE Inc. and Bell Canada)
Kevin W. Crull Ontario, Canada President – Residential Services (Bell Canada)
Wade Oosterman Ontario, Canada President – Bell Mobility and Chief Brand Officer (Bell Canada)
John Sweeney Ontario, Canada President – Wholesale (Bell Canada)
Mary Ann Turcke Ontario, Canada Executive Vice-President – Field Services (Bell Canada)
Martine Turcotte Québec, Canada Executive Vice-President and Chief Legal & Regulatory Officer (BCE Inc. and Bell Canada)
Siim A. Vanaselja Québec, Canada Executive Vice-President and Chief Financial Officer (BCE Inc. and Bell Canada)
David Wells Ontario, Canada Executive Vice-President – Corporate Services (BCE Inc. and Bell Canada)
(1) Was Vice-President, Sales and Marketing of Waverider Communications Inc. when, in April 2002, Waverider Communications Inc. was delisted from the NASDAQ National Market as a result of its share price falling below $1.00 for a period of 30 days. Waverider Communications Inc. then began to trade on the Over The Counter Bulletin Board.
(2) Was a director and the Chief Executive Officer of Wave Wireless Corporation on, or during the year preceding, October 31, 2006, the date when Wave Wireless Corporation filed a voluntary petition for relief pursuant to Chapter 11 of Title 11 of the United States Code in the United States Bankruptcy Court.
OFFICER PAST OCCUPATION

DIRECTORS’ AND EXECUTIVE OFFICERS’ SHARE OWNERSHIP
As at March 11, 2010, BCE Inc.’s directors and executive officers as a group beneficially owned, or exercised control or direction over, directly or indirectly, 567,480 common shares (or 0.07%) of BCE Inc.
30 BCE INC. 2009 ANNUAL INFORMATION FORM
We become involved in various claims and litigation as a part of our business. This section describes important legal proceedings. While we cannot predict the final outcome of the claims and litigation described below or of any other claims and litigation pending at March 11, 2010, based on the information currently available and management’s assessment of the merits of such claims and litigation, management believes that the resolution of these claims and litigation will not have a material and negative effect on our consolidated financial position or results of operations. With regard to those claims and litigation where we are defendants, we believe that we have strong defences and we intend to vigorously defend our position.
LAWSUITS RELATED TO BCE INC.
Privatization Transaction Lawsuit
On June 30, 2007, BCE Inc. announced that it had entered into a definitive agreement (subsequently amended on July 4, 2008), providing for the Privatization. For more information on the proposed Privatization, see General Development of Our Business – Three-Year History.
The closing of the Privatization was contingent upon the fulfillment of several closing conditions, including, pursuant to Section 8.1(f) of the Definitive Agreement, the receipt at the effective time (on December 11, 2008, the outside date for the closing of the Privatization) of a positive solvency opinion from KPMG LLP (KPMG) stating that BCE Inc. would be “Solvent” (in accordance with the solvency tests set out in the Definitive Agreement) as at the effective time and immediately following the closing of the Privatization.
On November 26, 2008, BCE Inc. announced it had received a preliminary view from KPMG that, based on current market conditions, KPMG’s analysis to date and the amount of indebtedness involved in the financing of the Privatization, KPMG did not expect to be in a position to deliver at the effective time an opinion that BCE Inc. would meet, post-transaction, the solvency tests as defined in the Definitive Agreement. BCE Inc. disagreed that the addition of the financing debt would result in BCE Inc. not meeting the technical solvency definition and continued to work with KPMG and the Purchaser to seek to satisfy all closing conditions.
On December 11, 2008, BCE Inc. announced that it had received from the Purchaser on December 10, 2008 a notice purporting to terminate the Definitive Agreement. BCE Inc. disputes that the Purchaser was entitled to terminate the Definitive Agreement on December 10, 2008, as such notice was delivered prematurely, prior to the outside date for closing of the transaction (i.e., December 11, 2008), and is therefore invalid. Also on December 11, 2008, BCE Inc. announced that it had received confirmation from KPMG that it would not be able to deliver an opinion that BCE Inc. would meet, post-transaction, the solvency tests set out in the Definitive Agreement. All closing conditions had been satisfied by BCE Inc., other than the solvency opinion, a condition to closing that was to be satisfied by its nature at the effective time.
In light of these developments, BCE Inc. terminated the Definitive Agreement in accordance with its terms on December 12, 2008, and demanded payment of the $1.2 billion break-up fee from the Purchaser. The demand for payment was refused or neglected by the Purchaser and its guarantors (the Ontario Teachers’ Pension Plan and affiliates of Providence Equity Partners Inc. and Madison Dearborn Partners, LLC (the Guarantors)).
On December 17, 2008, BCE Inc. filed a motion to institute legal proceedings against the Purchaser and the Guarantors in the Québec Superior Court in respect of the payment of the $1.2 billion break-up fee.
On October 5, 2009, the Purchaser and the Guarantors served their statement of defence alleging, among other things, that the solvency opinion is a mutual condition precedent that was not, by its nature, a condition to be satisfied at the effective time.
Purported Class Action Concerning Dividends
On October 24, 2008, a statement of claim was filed under The Class Actions Act (Saskatchewan) in the Court of Queen’s Bench, Judicial Centre of Regina, Saskatchewan against BCE Inc., the Purchaser and the Guarantors on behalf of persons or entities who held common shares of BCE Inc. between August 8, 2007 and July 4, 2008.
BCE INC. 2009 ANNUAL INFORMATION FORM 31
The plaintiffs allege, among other things, that by amending the June 29, 2007 definitive agreement on July 4, 2008 by the Final Amending Agreement without seeking the approval of the class members, BCE Inc. violated the terms, restrictions and conditions of its by-laws, articles and dividend policy, and of the Definitive Agreement, the Canada Business Corporations Act and the March 7, 2008 order of the Québec Superior Court approving the Arrangement. The plaintiffs also allege that the Final Amending Agreement was oppressive to class members within the meaning of the Canada Business Corporations Act in that, among other things, the cancellation of BCE Inc.’s common share dividends defeated the reasonable expectations of class members in approving the Arrangement.
The action seeks, among other things, the payment by BCE Inc. to class members of common share dividends in respect of the second and third quarters of 2008.
On October 15, 2009, BCE Inc. served a motion to strike the statement of claim on the basis that it does not disclose a reasonable cause of action against BCE Inc.
On December 23, 2009, the plaintiffs filed an application seeking, among other things:
Mr. Boisvert Senior Vice-President, Global Client Solutions Sales – Sun Microsystems Inc. before June 2006
Mr. Brown Chief Executive Officer, Wave Wireless Corporation in 2006 Chief Executive Officer, WaveRider Communications Inc. from 2005 to 2006 Executive Vice-President, WaveRider Communications Inc. from 2002 to 2005
Mr. Cope President and Chief Executive Officer, TELUS Mobility before November 2005
Mr. Crull Senior Vice-President and General Manager – AT&T Mobility before March 2005
Mr. Oosterman Executive Vice-President, Sales and Marketing – TELUS Mobility before December 2005 Chief Marketing Officer – TELUS Corporation before December 2005
Mr. Sweeney President, John Sweeney and Associates, LLC from June 2005 to May 2006 President of Kaval Wireless Solutions from March 2002 to May 2005
Ms. Turcke Partner and Director of the Board, Codesta LLC, Toronto and Palo Alto, USA from November 2002 to January 2005
Mr. Wells Executive Vice-President of Corporate Services, TELUS Mobility from October 2000 to June 2006
Legal Proceedings
(a) leave to amend the statement of claim to, among other things, substitute plaintiffs and add five individual defendants;(b) leave to commence a claim under the secondary market disclosure provisions of The Securities Act (Saskatchewan); and(c) certification of the action as a multi-jurisdictional class action.

On January 26, 2010, the court ordered, among other things, that the plaintiffs’ application to certify the action as a multi-jurisdictional class action will be adjourned to a date to be determined later to be brought back on 30 days’ notice only after the plaintiffs’ motions for leave to amend and leave to proceed under the secondary market disclosure provisions of The Securities Act (Saskatchewan) and the motion brought by BCE Inc. to strike the claim will have been heard and decided by the court.
LAWSUITS RELATED TO BELL CANADA
Independent Dealers’ Lawsuits
On October 21, 2008, two lawsuits were filed in Ontario and Québec against Bell Distribution Inc. (Bell Distribution) by certain independent dealers. A statement of claim was filed in the Ontario Superior Court of Justice by 36 Ontario-based dealers and a motion to institute legal proceedings was filed in the Québec Superior Court by 37 Québec-based dealers.
The lawsuits allege that Bell Distribution breached its 2004 BDI Independent Dealer Agreement (Dealer Agreement), an associated settlement agreement which partly settled previous claims made by dealers in connection with the Dealer Agreement, and Bell Distribution’s contractual, statutory and common law duties of good faith and fair dealing by, among other things, unilaterally reducing certain commissions and unfairly competing with the dealers through other sales channels. The plaintiffs are seeking a mandatory order compelling Bell Distribution to cancel and reverse the commission reductions, injunctive relief in Québec and Ontario preventing further unilateral changes to commissions, declarations that the dealers are not bound by the exclusivity and non-competition clauses in the Dealer Agreement and an accounting of all profits from sales made through other channels in breach of the Dealer Agreement. The plaintiffs are seeking damages, totaling $266 million, for lost commissions ($17 million), diminution in the value of their businesses ($219 million) and punitive damages ($30 million).
In the Ontario action, Bell Distribution served a statement of defence on December 1, 2008 and, on June 15, 2009, the plaintiffs amended their statement of claim in Ontario and amended their motion to institute legal proceedings in Québec on August 25, 2009, to add allegations that Bell Distribution unilaterally adjusted commissions paid to the dealers on a retroactive basis, failed to provide adequate administrative support to the dealers and engaged in excessive pricing on non-subsidized Bell Distribution products. In Ontario, Bell Distribution served an amended statement of defence in January 2010.
32 BCE INC. 2009 ANNUAL INFORMATION FORM
Purported Class Action Concerning 911 Fees
On June 26, 2008, a statement of claim was filed under The Class Actions Act (Saskatchewan) in the Court of Queen’s Bench, Judicial Centre of Regina, Saskatchewan against communications service providers, including Bell Mobility and Bell Aliant Regional Communications, Limited Partnership, on behalf of certain alleged customers. The action also names BCE Inc. and Bell Canada as defendants.
The statement of claim alleges, among other things, breach of contract and duty to inform, deceit, misrepresentation and collusion, in connection with certain “911 fees” invoiced by communications service providers to their customers. The plaintiffs seek unspecified damages and punitive damages. The action seeks certification of a national class encompassing all customers of communications service providers wherever resident in Canada. The lawsuit has not yet been authorized as a class action.
Purported Class Action Concerning Bell Canada Internet Service Speed
On May 29, 2008, a motion to obtain the authorization to institute a class action was filed in the Québec Superior Court against Bell Canada on behalf of all former and current Québec residential customers of Bell Canada who subscribed and subscribe, respectively, to Bell Canada’s high-speed Internet service since October 28, 2007.
On July 9, 2008, plaintiffs served a motion to amend the initial proceeding to modify the class by including all Ontario residential customers. The plaintiffs allege that Bell Canada misrepresented the actual speed of its Internet service in its contracts and its publicity and had no right to unilaterally reduce the speed of its Internet service. The plaintiffs also claim that Bell Canada breached the privacy of its customers by using the “Deep Packet Inspection” technology on its Internet network. The action seeks the reimbursement of 80% of customers’ monthly fees for their high-speed Internet service and the payment of punitive damages. The lawsuit has not yet been authorized as a class action.
Class Action Concerning Bell Canada and Bell Mobility Late Payment Charges
On June 27, 2006, a motion to obtain the authorization to institute a class action was filed in the Québec Superior Court against Bell Canada and Bell Mobility on behalf of all physical persons and companies in Canada who were billed late payment charges despite having allegedly paid on time. On September 28, 2007, the plaintiffs filed an amended motion to reduce the classes to Québec customers only.
On January 10, 2008, the Québec Superior Court granted the plaintiffs’ motion to be authorized to institute the class action and determined that members of the classes are all physical persons and companies in Québec, of 50 employees or less, who were billed late payment charges since June 21, 2003 after allegedly having made full payment of amounts owing to Bell Canada and/or Bell Mobility to a financial institution and/or, for Bell Mobility’s customers only, by cheque, within the payment period indicated on their bills. The class action seeks an order requiring Bell Canada and Bell Mobility to repay all late payment charges to the members of the classes. In addition to the reimbursement of such amounts, the class action also seeks payment of punitive damages by Bell Canada and Bell Mobility.
On April 11, 2008, the plaintiffs filed their motion to institute the class action.
Wireless Income Fund Transaction Lawsuit
On March 28, 2006, a motion to institute legal proceedings was filed in the Québec Superior Court against Bell Distribution by 50 independent dealers that own 78 Bell World retail stores.
The plaintiffs allege that Bell Distribution agreed to proceed with a transaction pursuant to which the independent dealer retail stores and Bell Distribution-owned retail stores would be sold to a Wireless Distribution Income Fund (WDIF) and that Bell Distribution subsequently reneged on this agreement causing damages to the independent dealers; and alternatively, that Bell Distribution’s refusal to allow the independent dealers to proceed to sell their stores and assign the dealer agreements to the WDIF constitutes an abuse of right and is contrary to Bell Distribution’s obligations to act fairly and in accordance with reasonable commercial standards. The plaintiffs seek damages against Bell Distribution in an amount of $135 million.
Bell Distribution filed its defence in late fall 2006.
BCE INC. 2009 ANNUAL INFORMATION FORM 33
Class Action Concerning Bell TV Late Payment Charges
On September 29, 2005, a statement of claim was filed under the Class Proceedings Act, 1992 (Ontario) in the Ontario Superior Court of Justice against Bell TV on behalf of certain alleged customers.
The statement of claim alleges that the interest and late payment fees charged by Bell TV to customers whose accounts are in arrears are in excess of the effective annual rate of interest permitted by certain provisions of the Criminal Code (Canada). The plaintiff seeks an order requiring Bell TV to repay all interest and late payment fees paid to Bell TV by the members of the class. In addition to the reimbursement of such amounts, the class action also seeks payment of punitive damages in the amount of $10 million.
On February 12, 2008, the court granted the plaintiff’s motion to certify the action as a class proceeding and certified as a class all former and current customers of Bell TV who have been charged one or more administrative fees (the fees of $19 and $25 charged by Bell TV beginning January 1, 2003 for the payment of an account after the due date) and have paid those fees up to the date of certification of the proceeding.
On September 15, 2008, the court ruled as a preliminary matter that the administrative fees charged by Bell TV were “interest” as defined in the Criminal Code (Canada). Bell TV appealed this preliminary ruling and, on September 11, 2009, the Ontario Court of Appeal allowed Bell TV’s appeal and found that the administrative fees were not “interest” as defined in the Criminal Code (Canada). On November 10, 2009, Bell TV was served with the plaintiff’s application for leave to appeal to the Supreme Court of Canada.

Vidéotron Lawsuit
On August 31, 2005, a motion to institute legal proceedings was filed in the Québec Superior Court against Bell TV by Vidéotron ltée, Vidéotron (Régional) ltée and CF Cable TV Inc. (a subsidiary of Vidéotron ltée).
In the statement of claim, the plaintiffs allege that Bell TV has failed to adequately protect its system against signal piracy, thereby depriving the plaintiffs of subscribers who, but for their alleged ability to pirate Bell TV’s signal, would be subscribing to plaintiffs’ services.
On November 4, 2005, the plaintiffs amended their statement of claim to increase the amount of damages claimed from $1 million to approximately $49.5 million for profits allegedly lost over a three-year period, $314.7 million for alleged future losses and $10 million in punitive damages.
Bell TV filed its defence in November 2006.
Purported Class Action Concerning Bell Mobility Billing System
On October 28, 2004, a motion to obtain the authorization to institute a class action was filed in the Québec Superior Court against Bell Mobility on behalf of any person who entered into a contract with Bell Mobility. Identical motions were filed in Ontario, Alberta and British Columbia in December 2006.
The lawsuits allege that such persons have unjustly incurred expenses as a result of billing errors made by Bell Mobility following the change of its billing platform. In addition to the reimbursement of such expenses, the class actions seek payment in the amount of $100 per class member for inconvenience as well as punitive damages in the amount of $200 per class member in Québec, general damages in the amount of $500 million with no precise amount claimed as punitive damages in Ontario, and damages with no precise amount in Alberta and British Columbia.
On July 20, 2007, the Québec Superior Court dismissed the motion to obtain the authorization to institute a class action. On August 16, 2007, the plaintiff filed a notice of appeal and in December 2007 filed a motion to amend the class description. On November 19, 2008, the Québec Court of Appeal dismissed the plaintiff’s motion to amend the class description and dismissed the appeal, with costs. The plaintiff did not file a motion for leave to appeal to the Supreme Court of Canada.
The motions seeking certification to proceed as class actions in Ontario, Alberta and British Columbia have been dormant since they were filed in 2006.
34 BCE INC. 2009 ANNUAL INFORMATION FORM
Class Action Concerning Wireless Access Charges
On August 9, 2004, a statement of claim was filed under The Class Actions Act (Saskatchewan) in the Court of Queen’s Bench, Judicial Centre of Regina, Saskatchewan against wireless communications service providers, including Bell Mobility and Aliant Telecom Inc., on behalf of certain alleged customers (Initial Action).
The statement of claim for the Initial Action alleges, among other things, breach of contract and duty to inform, deceit, misrepresentation, unjust enrichment and collusion, in connection with certain “system access fees” and “system licensing charges” invoiced by wireless communications service providers to their customers. The plaintiff is seeking unspecified damages and punitive damages. The Initial Action is seeking certification of a national class encompassing all customers of wireless communications service providers wherever resident in Canada.
On July 18, 2006, the Saskatchewan Court of Queen’s Bench rendered its judgment on the motion for certification, refusing to certify the action against all defendant Bell Canada companies except Bell Mobility. With respect to Bell Mobility, the court refused to certify the lawsuit on all grounds except for the claim for unjust enrichment. However, the court refused to grant certification at that point on the basis that there was no appropriate representative plaintiff. The court gave the plaintiff leave to re-apply for certification. The continuation of the certification application was heard on June 18 and 19, 2007.
On September 17, 2007, the court granted certification of the Initial Action finding that there was a proper representative plaintiff. On May 9, 2008, the plaintiff filed motions to convert the certified Initial Action from a national opt-in class to a national opt-out class and to add BCE Inc. and Bell Canada as defendants. The court dismissed plaintiff’s motions on May 7, 2009.
On July 27, 2009, a new statement of claim was filed under The Class Actions Act (Saskatchewan) in the Court of Queen’s Bench, Judicial Centre of Regina, Saskatchewan against wireless service providers, including Bell Mobility and members of the Bell Aliant group, on behalf of certain alleged customers (Second Action).
The statement of claim for the Second Action is based on alleged facts similar to those in the Initial Action. The causes of action alleged in the Second Action are misrepresentation, breach of the Competition Act, conspiracy and unjust enrichment. The Second Action also alleges that the government charges for spectrum licenses and the CRTC rural contribution obligation constitute less than what Bell Mobility collected for the system access fees (SAF). As such, the plaintiff is seeking either a reimbursement of the full amount of the SAF or, in the alternative, the difference between the SAF charged and the government spectrum and CRTC charges.
On August 13, 2009, the plaintiff in the Initial Action filed a notice of discontinuance in order to allow the Second Action to proceed. Bell Mobility and the other defendants filed a motion to strike the Second Action as an abuse of process. On December 7, 2009, the plaintiff withdrew its motion for discontinuance of the Initial Action.
On December 22, 2009, the court stayed the Second Action as an abuse of process.
On February 24, 2010, the Saskatchewan Court of Appeal heard the defendants’ leave to appeal applications regarding the July 18, 2006 and September 17, 2007 certification decisions as well as Bell Mobility’s leave to appeal application regarding a February 20, 2008 decision concerning proper forum for the Initial Action. In addition, the Court of Appeal heard the plaintiff’s leave to appeal applications of the May 7, 2009 decision in the Initial Action regarding the national opt-in class and the addition of BCE Inc. and Bell Canada as defendants. The Court of Appeal reserved its decision on all of the leave to appeal applications.
On March 9, 2010, the plaintiff filed a motion for leave to appeal to the Saskatchewan Court of Appeal the December 22, 2009 decision that stayed the Second Action as an abuse of process.
LAWSUITS RELATED TO TELEGLOBE INC.
Teleglobe Plan Administrator Lawsuit
On November 16, 2005, Kathy Morgan, in her capacity as plan administrator for Teleglobe Inc., filed a lawsuit in the Ontario Superior Court of Justice against BCE Inc. and seven former directors of Teleglobe Inc.
The plaintiff is seeking a declaration that Teleglobe Inc. and its creditors have been oppressed by the former directors of Teleglobe Inc. and by BCE Inc. within the meaning of the Canada Business Corporations Act. The plaintiff is also seeking a declaration that the former directors of Teleglobe Inc. breached their fiduciary duty to Teleglobe Inc. and failed to act in accordance with the standard of care prescribed under the Canada Business Corporations Act.
BCE INC. 2009 ANNUAL INFORMATION FORM 35
The plaintiff is seeking compensation for oppression in the amount of $3 billion and damages for breach of fiduciary duty in the amount of $3 billion, in each case plus interest and costs.
Teleglobe Inc. was at the relevant time a subsidiary of BCE Inc. Pursuant to standard policies and subject to applicable laws, the seven former directors are entitled to seek indemnification from BCE Inc. in connection with this lawsuit.
BNP Paribas (Canada) Lawsuit
On December 23, 2004, BNP Paribas (Canada), a former plaintiff in the Teleglobe lending syndicate lawsuit described below, filed a statement of claim in the Ontario Superior Court of Justice against BCE Inc. and five former directors of Teleglobe Inc.

The statement of claim is based on several allegations, including:
oppression against the former directors; and breach of contract against BCE Inc.
BNP Paribas (Canada) seeks U.S.$50 million in damages.
Teleglobe Inc. was at the relevant time a subsidiary of BCE Inc. Pursuant to standard policies and subject to applicable laws, the five former directors of Teleglobe Inc. are entitled to seek indemnification from BCE Inc. in connection with this lawsuit.
On November 20, 2007, the defendants filed their statement of defence. On March 20, 2008, the plaintiff delivered its reply.
Teleglobe Unsecured Creditor Lawsuit
On May 26, 2004, a lawsuit was filed in the United States Bankruptcy Court for the District of Delaware by Teleglobe Communications Corporation, certain of its affiliated U.S. debtors and debtors in possession, and the Official Committee of Unsecured Creditors of these debtors against BCE Inc. and 10 former directors and officers of Teleglobe Inc. and certain of its subsidiaries.
The lawsuit is based on several allegations, including:
breach of an alleged funding commitment of BCE Inc. towards the debtors; misrepresentation by BCE Inc.; and breach and aiding and abetting breaches of fiduciary duty by the defendants.
The plaintiffs seek an unspecified amount of damages against the defendants.
In March 2006, the plaintiffs filed an amended complaint to add certain factual allegations.
On June 19, 2009, BCE Inc. and the individual defendants filed a motion for summary judgment regarding all claims brought against them. On August 21, 2009, plaintiffs filed an opposition to such motion and filed a motion for leave to amend the complaint to add a claim against the individual defendants.
Kroll Restructuring Lawsuit
On February 26, 2003, BCE Inc. was informed that Kroll Restructuring Ltd., in its capacity as interim receiver of Teleglobe Inc., had filed a notice of action in the Ontario Superior Court of Justice against five former directors of Teleglobe Inc. The statement of claim was filed on March 26, 2003 and was served to each of the directors in August and September 2003.
The plaintiff, now Kathy Morgan, in her capacity as plan administrator for Teleglobe Inc., is seeking a declaration that the redemption by Teleglobe Inc. of its third series preferred shares in April 2001 and the retraction of its fifth series preferred shares in March 2001 were prohibited under the Canada Business Corporations Act and that the five former directors should be held jointly and severally liable to restore to Teleglobe Inc. all amounts paid or distributed on these transactions. These amounts total approximately $661 million, plus interest.
On April 16, 2004, the defendants filed their statement of defence.
On February 26, 2007, the five former directors filed a third party claim in the Ontario Superior Court of Justice against the former third series preferred shareholders of Teleglobe Inc. As provided by the Canada Business Corporations Act, the third party claim seeks to recover from those former third series preferred shareholders any amounts the former directors may have to restore to Teleglobe Inc. as a result of this lawsuit, on account of the redemption of the third series preferred shares.
36 BCE INC. 2009 ANNUAL INFORMATION FORM
While BCE Inc. is not a defendant in this lawsuit, Teleglobe Inc. was at the relevant time a subsidiary of BCE Inc. Pursuant to standard policies and subject to applicable laws, the five former directors are entitled to seek indemnification from BCE Inc. in connection with this lawsuit.
Teleglobe Lending Syndicate Lawsuit
On July 12, 2002, a statement of claim was filed in the Ontario Superior Court of Justice by ABN AMRO Bank N.V., Bank of Montreal, Bank of Tokyo-Mitsubishi (Canada), Bayerische Landesbank Girozentrale, BNP Paribas (Canada), La Caisse Centrale Desjardins du Québec, Canadian Imperial Bank of Commerce, Canadian Imperial Bank of Commerce, N.Y. Agency, Citibank, N.A., Credit Suisse First Boston Canada, Credit Suisse First Boston, Export Development Canada, HSBC Bank Canada, JPMorgan Chase Bank, Laurentian Bank of Canada, Merrill Lynch Capital (Canada) Inc., Merrill Lynch Capital Corporation, National Bank of Canada, Royal Bank of Canada, Société Générale, The Bank of Nova Scotia, and The Toronto-Dominion Bank against BCE Inc.
The plaintiffs sought damages of U.S.$1.19 billion, plus interest and costs, from BCE Inc. They alleged that these damages were equal to the amount they advanced as members of the Teleglobe Inc. and Teleglobe Holdings (U.S.) Corporation lending syndicate. The plaintiffs represented approximately 95.2% of the U.S.$1.25 billion that the members of that lending syndicate advanced.
The plaintiffs’ claim is based on several allegations, including that:
the actions and representations of BCE Inc. and its management, in effect, amounted to a legal commitment that BCE Inc. would repay the advances; and the court should disregard Teleglobe Inc. as a corporate entity and hold BCE Inc. responsible to repay the advances as Teleglobe Inc.’s and Teleglobe Holdings (U.S.) Corporation’s alter ego.
On September 16, 2003, BCE Inc. filed its statement of defence relating to this action.
On November 2, 2004, two of the plaintiffs, Canadian Imperial Bank of Commerce and Canadian Imperial Bank of Commerce, N.Y. Agency, which had advanced approximately U.S.$104 million to Teleglobe Inc. and Teleglobe Holdings (U.S.) Corporation, filed a notice of discontinuance with the court and are therefore no longer plaintiffs in this action.
On May 3, 2005, following the launch of the BNP Paribas (Canada) lawsuit described above, BNP Paribas (Canada), which had advanced approximately U.S.$50 million to Teleglobe Inc. and Teleglobe Holdings (U.S.) Corporation, filed a notice of discontinuance with the court and is therefore no longer a plaintiff in this action.
Following these discontinuances, the damages sought by the remaining plaintiffs would now amount to approximately U.S.$1.04 billion, plus interest and costs, representing approximately 83% of the U.S.$1.25 billion that the members of the lending syndicate advanced to Teleglobe Inc. and Teleglobe Holdings (U.S.) Corporation.
On June 29, 2006, the plaintiffs filed an amended statement of claim to add certain allegations of material misrepresentations regarding Teleglobe Inc.’s and Teleglobe Holdings (U.S.) Corporation’s business plan.
Trial is scheduled to commence on February 7, 2011.
OTHER
We are subject to other claims and a number of judicial and administrative proceedings considered normal in the ordinary course of our current and past operations, including employment-related disputes, contract disputes, intellectual property disputes and customer disputes. In some proceedings, the claimant seeks damages as well as other relief, which, if granted, would require substantial expenditures on our part.
BCE INC. 2009 ANNUAL INFORMATION FORM 37

Except as previously disclosed in respect of the proposed Privatization in the Notice of Special Shareholder Meeting and Management Proxy Circular of BCE Inc. dated August 7, 2007 in the section entitled Interests of Senior Management and Others in the Arrangement, as updated in the BCE Inc. 2007 annual information form dated March 5, 2008 in the section entitled Interest of Management and Others in Material Transactions, to the best of our knowledge, there were no directors or executive officers or any associate or affiliate of a director or executive officer with a material interest in any transaction within the three most recently completed financial years or during the current financial year that has materially affected us or is reasonably expected to materially affect us.
Deloitte & Touche LLP prepared the Report of Independent Registered Chartered Accountants in respect of our audited consolidated financial statements and the Report of Independent Registered Chartered Accountants in respect of our internal control over financial reporting. Deloitte & Touche LLP is independent of BCE Inc. within the meaning of the Code of Ethics of the Ordre des comptables agréés du Québec and the United States Securities Act of 1933 and the applicable rules and regulations thereunder.
The transfer agent and registrar for the common shares and preferred shares of BCE Inc. in Canada is Computershare Trust Company of Canada (Computershare) at its principal offices in Montréal, Québec; Halifax, Nova Scotia; Toronto, Ontario; Calgary, Alberta; and Vancouver, British Columbia and in the United States is Computershare Trust Company, N.A. at its principal offices in Edison, New Jersey and New York, New York.
The register for Bell Canada’s debentures is kept at the principal office of CIBC Mellon Trust Company (CIBC Mellon), in Montréal, and facilities for registration, exchange and transfer of the debentures are maintained at the principal offices of CIBC Mellon in Halifax, Montréal, Toronto, Calgary and Vancouver. The co-registrar for Bell Canada’s series ES debentures is Bank of Montreal Trust Company, in New York, and the series ES debentures may be presented for registration, transfer or exchange at the office of the Bank of Montreal Trust Company in New York.
The register for Bell Canada’s subordinated debentures is kept at the principal office of Computershare, in Montréal, and facilities for registration, exchange and transfer of the subordinated debentures are maintained at the principal offices of Computershare in Halifax, Montréal, Toronto, Calgary and Vancouver.
38 BCE INC. 2009 ANNUAL INFORMATION FORM
DOCUMENTS YOU CAN REQUEST
You can ask us for a copy of any of the following documents:
this annual information form, together with any document, or the relevant pages of any document, incorporated by reference into it; BCE Inc.’s most recent annual report, which includes the audited consolidated financial statements and management’s discussion and analysis for the most recently completed financial year together with the accompanying auditors’ report; any interim financial statements that were filed after the financial statements for the most recently completed financial year; any other documents that are incorporated by reference into a preliminary short form prospectus or a short form prospectus and are not listed above.
Please send your request to the Corporate Secretary of BCE Inc., at 1 Carrefour Alexander-Graham-Bell, Building A, 7th floor, Verdun, Québec H3E 3B3.
We will send you the documents at no charge when our securities are being distributed under a preliminary short form prospectus or short form prospectus.
At any other time, we may charge you a reasonable fee if you or the company you work for is not a security holder of BCE Inc.
You can also ask us for a copy of the annual and quarterly management’s discussion and analysis of BCE Inc. by contacting the Investor Relations group of BCE Inc., at 1 Carrefour Alexander-Graham-Bell, Building A, 6th Floor, Verdun, Québec H3E 3B3 or by sending an e-mail to [email protected].
OTHER INFORMATION ABOUT BCE INC.
The above documents, as well as BCE Inc.’s annual and quarterly reports and news releases, are also available on BCE Inc.’s website at www.bce.ca.
Additional information, including information as to directors’ and officers’ remuneration securities and securities authorized for issuance under equity compensation plans, is contained in BCE Inc.’s management proxy circular for its most recent annual meeting of the securityholders that involved the election of directors.
Additional information relating to BCE Inc. is available on SEDAR at www.sedar.com and on EDGAR at www.sec.gov. Additional financial information is provided in BCE Inc.’s audited consolidated financial statements and related management discussion and analysis for BCE Inc.’s most recently completed financial year contained in the BCE 2009 Annual Report.
BCE INC. 2009 ANNUAL INFORMATION FORM 39
The purpose of BCE Inc.’s audit committee (Audit Committee) is to assist the board in its oversight of:
the integrity of BCE Inc.’s financial statements and related information; BCE Inc.’s compliance with applicable legal and regulatory requirements; the independence, qualifications and appointment of the external auditors; the performance of both the external and internal auditors; BCE Inc.’s management’s responsibility for assessing and reporting on the effectiveness of internal controls and reporting on risk management.
Members’ Financial Literacy, Expertise and Simultaneous Service
Under the Sarbanes-Oxley Act and related United States Securities and Exchange Commission rules, BCE Inc. is required to disclose whether its Audit Committee members include at least one “audit committee financial expert,” as defined by these rules. In addition, National Instrument 52-110 – Audit Committees and the New York
Interest of Management and Others in Material Transactions
Experts
Transfer Agent and Registrar
For More Information
Shareholder inquiries 1-800-561-0934Investor relations 1-800-339-6353
Schedule 1 – Audit Committee Information(1)

Stock Exchange governance rules followed by BCE Inc. require that all audit committee members be “financially literate” and “independent”.
The board has determined that all the members of the Audit Committee during 2009 were, and all current members of the Audit Committee are, financially literate and independent. In respect of the current Audit Committee members, as well as members during 2009, the board determined that at least one of the members of the Audit Committee, being, respectively, the past Chair of the Audit Committee, Mr. T.C. O’Neill, until he stepped down from that committee on May 6, 2009, and the current Chair of the Audit Committee, Mr. P.R. Weiss, is qualified as an “audit committee financial expert.” The table below indicates the relevant education and experience of all the Audit Committee members during 2009 and the current members.
40 BCE INC. 2009 ANNUAL INFORMATION FORM
The New York Stock Exchange governance rules followed by BCE Inc. require that if an audit committee member serves simultaneously on the audit committee of more than three public companies, the board of directors must determine and disclose that this simultaneous service does not impair the ability of the member to effectively serve on the audit committee.
In addition to serving on BCE Inc.’s Audit Committee, the following Audit Committee members during 2009 served on the audit committees of the following public companies: Mr. Bérard, Bombardier Inc., Groupe BMTC Inc. and TransForce Inc. and Mr. O’Neill, Nexen Inc., Adecco, S.A., Loblaw Companies Limited, and The Bank of Nova Scotia. The board has carefully reviewed the audit committee service of each of Messrs. Bérard and O’Neill and has concluded in each case that these other activities did not during 2009 and, in the case of Mr. Bérard, do not currently impair his ability to effectively serve on BCE Inc.’s Audit Committee. This conclusion is based on the following:
each is retired and is not involved in professional activities other than sitting on various public corporations’ boards of directors and audit committees; each has extensive accounting and financial knowledge and experience, which serves the best interests of BCE Inc.; and each makes valuable contributions to BCE Inc.’s Audit Committee.
Pre-Approval Policies and Procedures
BCE Inc.’s Auditors Independence Policy is a comprehensive policy governing all aspects of BCE’s relationship with the external auditors, including:
establishing a process for determining whether various audit and other services provided by the external auditors affect their independence; identifying the services that the external auditors may and may not provide to BCE Inc. and its subsidiaries; pre-approving all services to be provided by the external auditors of BCE Inc. and its subsidiaries; and establishing a process outlining procedures when hiring current or former personnel of the external auditors in a financial oversight role to ensure auditors’ independence is maintained.
The Auditors Independence Policy is available in the governance section of BCE Inc.’s website at www.bce.ca.
BCE INC. 2009 ANNUAL INFORMATION FORM 41
External Auditors’ Fees
The table below shows the fees that Deloitte & Touche LLP billed to BCE Inc. and its subsidiaries for various services in each of the past two fiscal years. Audit fees increased in 2009 due to services related to the changeover to International Financial Reporting Standards and the review of securities offering documents. All other fees relate to BCE’s program for compliance with the Payment Card Industry Data Security Standard.
Relevant Education and ExperienceP.R. Weiss, FCA (Chair) Mr. Weiss has been a director on the BCE Inc. board since May 2009 and became Chair of the Audit Committee on May 7, 2009. Mr. Weiss
is director and audit committee Chair at Torstar Corporation and ING Bank of Canada and a director of Empire Life Insurance Company. He is Chair of the Board of Directors of Soulpepper Theatre Company, past Chair and a director of Toronto Rehab Foundation, and a director of Niagara International Music Festival. For over 40 years until his retirement in 2008, he was with KPMG Canada. He served as Managing Partner of the Canadian Audit Practice, a member of KPMG Canada’s Management Committee, and a member of the International Global Audit Steering Group. Mr. Weiss holds a Bachelor of Commerce degree from Carleton University.
A. Bérard, O.C. Mr. Bérard has been a director on the BCE Inc. board since January 2003. Mr. Bérard was Chair of the Board of National Bank of Canada (chartered bank) from 2002 to March 2004, and Chair of the Board and Chief Executive Officer of National Bank of Canada from 1990 to March 2002. He holds a Fellows Diploma of the Institute of Canadian Bankers and was Chair of the Executive Council of the Canadian Bankers’ Association from 1986 to 1988. He was appointed an Officer of the Order of Canada in 1995.
A.S. Fell, O.C. Mr. Fell has been a director on the BCE Inc. board since January 2002. Mr. Fell is a former Deputy Chairman of Royal Bank of Canada. He was with RBC Capital Markets (investment bank) and predecessor companies for 48 years including 18 years as Chief Executive Officer and a further 8 years as Chairman until his retirement in 2007. Mr. Fell is a past Chairman of the Investment Dealers Association of Canada and a past Governor of the Toronto Stock Exchange. Mr. Fell is also a past Chairman of the University Health Network, the United Way Campaign for Metropolitan Toronto, the Princess Margaret Hospital Capital Campaign and is a past Governor of the Duke of Edinburgh’s Award Program in Canada, St. Andrew’s College and the Ontario Division of the Canadian Arthritis Society. Mr. Fell was appointed an Officer of the Order of Canada in 2001 and received an Honorary Doctor of Laws Degree from McMaster University in 2001 and from the University of Toronto in 2006.
(1) You will find a summary of the differences between our governance practices and the New York Stock Exchange governance rules in the governance section of BCE Inc.’s website at www.bce.ca
V.L. Young, O.C. Mr. Young has been a director on the BCE Inc. board since May 1995. Mr. Young was Chairman and Chief Executive Officer of Fishery Products International Inc. (vertically integrated seafood company) from 1984 to 2001. He is also a director of RBC Dexia Investor Services Trust (institutional investor services company) and McCain Foods Limited (food distribution, retail and production company). In 1996, he was appointed an Officer of the Order of Canada and was awarded an honorary doctorate from Memorial University in Newfoundland and Labrador. In 2007, he was named a Fellow of the Institute of Corporate Directors.
T.C. O’Neill, FCA (member until May 7, 2009)
Mr. O’Neill has been a director on the BCE Inc. board since January 2003 and was also Chair of the Audit Committee until May 7, 2009. He was appointed Chair of the Board of BCE Inc. and Bell Canada on February 17, 2009. Mr. O’Neill was Chief Executive Officer of PricewaterhouseCoopers Consulting (provider of management consulting and technology services) from January 2002 to May 2002 and then Chair of the Board from May 2002 to October 2002. Mr. O’Neill is a former Vice-Chair of the Board of Trustees of Queen’s University and a past member of the Advisory Council of Queen’s University School of Business. Mr. O’Neill graduated from Queen’s University with a BComm and is a chartered accountant. Mr. O’Neill received an Honorary LLD from Queen’s University and is a Fellow of the Institute of Corporate Directors.
J. Maxwell (member until her retirement from the board on February 17, 2009)
Ms. Maxwell was a director on the BCE Inc. board until February 2009. She is currently a research fellow of the Canadian Policy Research Networks Inc. (since January 2006) and served as President from 1995 until January 2006. Prior to this appointment, she was Associate Director of the School of Political Studies at Queen’s University. She acted as Chair of the Economic Council of Canada from 1985 to 1992. Prior to 1985, Ms. Maxwell worked as a consultant and as Director of Policy Studies at the C.D. Howe Institute.
2009 2008 (IN $ MILLIONS) (IN $ MILLIONS )
Audit fees(1) 9.2 8.4 Audit-related fees(2) 3.0 3.2 Tax fees(3) 0.7 0.8 All other fees(4) 1.0 0.3
Total 13.9(5) 12.7 (5)

42 BCE INC. 2009 ANNUAL INFORMATION FORM
I. PURPOSE
II. DUTIES AND RESPONSIBILITIES
A. Financial Reporting and Control
BCE INC. 2009 ANNUAL INFORMATION FORM 43
B. Oversight of the Shareholders’ Auditors
44 BCE INC. 2009 ANNUAL INFORMATION FORM
C. Oversight of Internal Audit
(1) These fees include professional services provided by the external auditors for statutory audits of the annual financial statements, the audit of the effectiveness of internal control over financial reporting, the review of interim financial statements, the review of financial accounting and reporting matters, the review of securities offering documents, other regulatory audits and filings and translation services.
(2) These fees relate to non-statutory audits, due diligence and the review of financial accounting and reporting matters.(3) These fees include professional services for tax compliance, tax advice and assistance with tax audits and appeals.(4) These fees include any other fees for permitted services not included in any of the above-stated categories. In 2009 and 2008, the fees are solely for services related to compliance with the Payment Card Industry Data
Security Standard.(5) The amounts of $13.9 million for 2009 and $12.7 million for 2008 reflect fees billed in those fiscal years without taking into account the year to which those services relate. Total fees for services provided for each fiscal
year amounted to $12.8 million in 2009 and $11.8 million in 2008.
Schedule 1A – Audit Committee Charter
The purpose of the Audit Committee is to assist the Board of Directors in its oversight of:A. the integrity of the Corporation’s financial statements and related information;B. the Corporation’s compliance with applicable legal and regulatory requirements;C. the independence, qualifications and appointment of the shareholders’ auditor;D. the performance of the Corporation’s shareholders’ auditor and internal audit; andE. management responsibility for assessing and reporting on the effectiveness of internal controls and reporting on risk management.
The Audit Committee shall perform the functions customarily performed by audit committees and any other functions assigned by the Board of Directors. In particular, the Audit Committee shall have the following duties and responsibilities:
1. On a periodic basis, review and discuss with management and the shareholders’ auditor the following: a. major issues regarding accounting principles and financial statement presentation, including any significant changes in the Corporation’s selection or application of
accounting principles, and issues as to the adequacy of the Corporation’s internal controls and any special audit steps adopted in light of material control deficiencies;
b. analyses prepared by management and/or the shareholders’ auditor setting forth significant financial reporting issues and judgements made in connection with the preparation of the financial statements, including the effects of alternative generally accepted accounting principles (GAAP) methods on the financial statements when such alternatives have been selected in the current reporting period;
c. the effect of regulatory and accounting developments, as well as off-balance sheet structures, on the financial statements of the Corporation; d. the type and presentation of information to be included in earnings press releases (including any use of pro-forma or adjusted non-GAAP, information).2. Meet to review and discuss with management and the shareholders’ auditor, report and, where appropriate, provide recommendations to the Board of Directors on the
following prior to its public disclosure: a. the annual and interim consolidated financial statements, the Corporation’s disclosure under “Management Discussion and Analysis”, Annual Information Form,
earnings press releases, financial information and earnings guidance provided to analysts and rating agencies and the integrity of the financial reporting of the Corporation;
– In addition to the role of the Audit Committee to make recommendations to the Board of Directors, where the members of the Audit Committee consider that it is appropriate and in the best interest of the Corporation, the interim consolidated financial statements, the interim Corporation’s disclosure under “Management Discussion and Analysis” for interim period and interim earnings press releases and earnings guidance, may also be approved on behalf of the Board of Directors by the Audit Committee, provided that such approval is subsequently reported to the Board of Directors at its next meeting;
b. any audit problems or difficulties raised by the shareholders’ auditor and management’s response thereto, including any restrictions on the scope of the activities of the shareholders’ auditor or access to requested information and any significant disagreements with management.
3. Review and discuss reports from the shareholders’ auditor on: a. all critical accounting policies and practices used by the Corporation; b. all material alternative treatments of financial information within GAAP that have been discussed with management, including the ramifications of the use of such
alternative treatments and disclosures and the treatment preferred by the shareholders’ auditor; and c. other material written communications between the shareholders’ auditor and management, and discuss such report with the shareholders’ auditor.
1. Be directly responsible for the appointment, compensation, retention and oversight of the work of the shareholders’ auditor and any other auditor preparing or issuing an audit report or performing other audit services or attest services for the Corporation or any consolidated subsidiary of the Corporation, where required and review, report and where appropriate, provide recommendations to the Board of Directors on the appointment, terms and review of engagement, removal, independence and proposed fees of the shareholders’ auditor.
2. Approve in advance all audit, review or attest engagement fees and terms for all audit, review or attest services to be provided by the shareholders’ auditor to the Corporation and any consolidated subsidiary and any other auditor preparing or issuing an audit report or performing other audit services or attest services for the Corporation or any consolidated subsidiary of the Corporation, where required.
3. Pre-approve all engagements for permitted non-audit services provided by the shareholders’ auditor to the Corporation and any consolidated subsidiary and to this effect may establish policies and procedures for the engagement of the shareholders’ auditor to provide to the Corporation and any consolidated subsidiary permitted non-audit services, which shall include approval in advance by the Audit Committee of all audit/review and permitted non-audit services to be provided by the shareholders’ auditor to the Corporation and any consolidated subsidiary.
4. Delegate, if deemed appropriate, authority to one or more members of the Audit Committee to grant pre-approvals of audit, review and permitted non-audit services, provided that any such approvals shall be presented to the Audit Committee at its next scheduled meeting.
5. Establish policies for the hiring of partners, employees and former partners and employees of the shareholders’ auditor.6. At least annually, consider, assess, and report to the Board of Directors on: a. the independence of the shareholders’ auditor, including whether the shareholders’ auditor’s performance of permitted non-audit services is compatible with the
shareholders’ auditor’s independence; b. obtaining from the shareholders’ auditor a written statement (i) delineating all relationships between the shareholders’ auditor and the Corporation; (ii) assuring that
lead audit partner rotation is carried out, as required by law; and (iii) delineating any other relationships that may adversely affect the independence of the shareholders’ auditor; and
c. the evaluation of the lead audit partner, taking into account the opinions of management and internal audit.7. At least annually, obtain and review a report by the shareholders’ auditor describing: a. the shareholders’ auditor’s internal quality-control procedures; b. any material issues raised by the most recent internal quality-control review, or peer review of the shareholders’ auditor firm, or by any inquiry or investigation by
governmental or professional authorities, within the preceding five years, respecting one or more independent audits carried out by the shareholders’ auditor firm, and any steps taken to deal with any such issues.
8. Resolve any disagreement between management and the shareholders’ auditor regarding financial reporting.9. Review audit plan with the shareholders’ auditor.10. Meet periodically with the shareholders’ auditor in the absence of management and internal audit.
1. Review and discuss with the head of internal audit, report and, where appropriate, provide recommendations to the Board of Directors on the following: a. the appointment and mandate of internal audit, including the responsibilities, budget and staffing of internal audit; b. discuss with the head of internal audit the scope and performance of internal audit, including a review of the annual internal audit plan, and whether there are any
restrictions or limitations on internal audit; c. obtain periodic reports from the head of internal audit regarding internal audit findings, including the Corporation’s internal controls, and the Corporation’s progress
in remedying any audit findings. 2. Meet periodically with the head of internal audit in the absence of management and the shareholders’ auditor.

D. Oversight of the Corporation’s Internal Control System
E. Oversight of the Corporation’s Risk Management
BCE INC. 2009 ANNUAL INFORMATION FORM 45
F. Compliance with Legal Requirements
III. EVALUATION OF THE AUDIT COMMITTEE AND REPORT TO BOARD OF DIRECTORS
IV. OUTSIDE ADVISORS
V. MEMBERSHIP
VI. AUDIT COMMITTEE CHAIR
46 BCE INC. 2009 ANNUAL INFORMATION FORM
VII. TERM
VIII. PROCEDURES FOR MEETINGS
IX. QUORUM AND VOTING
X. SECRETARY
1. Review and discuss with management, the shareholders’ auditor and internal audit, monitor, report and, when appropriate, provide recommendations to the Board of Directors on the following:
a. the Corporation’s systems of internal controls; b. compliance with the policies and practices of the Corporation relating to business ethics; c. compliance by Directors, Officers and other management personnel with the Corporation’s Disclosure Policy; and d. the relationship of the Audit Committee with other committees of the Board of Directors, management and the Corporation’s consolidated subsidiaries’ audit
committees. 2. Review and discuss with the Chief Executive Officer and Chief Financial Officer of the Corporation the process for the certifications to be provided in the Corporation’s
public disclosure documents. 3. Review, monitor, report and where appropriate, provide recommendations to the Board of Directors on the Corporation’s disclosure controls and procedures.4. Establish procedures, for the receipt, retention, and treatment of complaints received by the Corporation regarding accounting, internal accounting controls or auditing
matters, including procedures for confidential, anonymous submission by employees regarding questionable accounting or auditing matters.5. Meet periodically with management in the absence of the shareholders’ auditor and internal audit.
1. Review, monitor, report and, where appropriate, provide recommendations to the Board of Directors on the following: a. the Corporation’s processes for identifying, assessing and managing risks; and b. the Corporation’s major financial risk exposures and the steps the Corporation has taken to monitor and control such exposures; c. the Corporation’s major security risks and security trends that may impact the Corporation’s operations and business; d. the Corporation’s business continuity plans, including work stoppage and disaster recovery plans; e. the Corporation’s environmental risks, and environment trends that may impact the Corporation’s operations and business.2. Review, monitor, report and, where appropriate, provide recommendations to the Board of Directors on the Corporation’s compliance with internal policies and the
Corporation’s progress in remedying any material deficiencies related to: i. security policies, including the safeguarding of corporate assets and information systems; ii. environmental policy and environmental management systems.
3. When appropriate, ensure that the Corporation’s subsidiaries establish an environmental policy and environmental management systems, and review and report thereon to the Board of Directors.
1. Review and discuss with management, the shareholders’ auditor and internal audit, monitor, report and, when appropriate, provide recommendation to the Board of Directors on the adequacy of the Corporation’s process for complying with laws and regulations.
2. Receive, on a periodic basis, reports from the Corporation’s Chief Legal Officer, with respect to the Corporation's pending or threatened material litigation.
A. The Audit Committee shall evaluate and review with the Corporate Governance Committee of the Board of Directors, on an annual basis, the performance of the Audit Committee.
B. The Audit Committee shall review and discuss with the Corporate Governance Committee of the Board of Directors, on an annual basis, the adequacy of the Audit Committee charter.
C. The Audit Committee shall report to the Board of Directors periodically on the Audit Committee’s activities.
The Audit Committee shall have the authority to engage outside counsel and other outside advisors as it deems appropriate to assist the Audit Committee in the performance of its functions. The Corporation shall provide appropriate funding for such advisors as determined by the Audit Committee.
The Audit Committee shall consist of such number of directors, in no event to be less than three, as the Board of Directors may from time to time by resolution determine. The members of the Audit Committee shall meet the independence, experience and other membership requirements under applicable laws, rules and regulations as determined by the Board of Directors.
The Chair of the Audit Committee shall be appointed by the Board of Directors. The Chair of the Audit Committee leads the Audit Committee in all aspects of its work and is responsible to effectively manage the affairs of the Audit Committee and ensure that it is properly organized and functions efficiently. More specifically, the Chair of the Audit Committee shall: A. Provide leadership to enable the Audit Committee to act effectively in carrying out its duties and responsibilities as described elsewhere in this charter and as
otherwise may be appropriate; B. In consultation with the Board Chair and the Chief Executive Officer, ensure that there is an effective relationship between management and the members of the Audit
Committee; C. Chair meetings of the Audit Committee; D. In consultation with the Chief Executive Officer, the Corporate Secretary’s Office and the Board Chair, determine the frequency, dates and locations of meetings of the
Audit Committee; E. In consultation with the Chief Executive Officer, the Chief Financial Officer, the Corporate Secretary’s Office and, as required, other Officers, review the annual work
plan and the meeting agendas to ensure all required business is brought before the Audit Committee to enable it to efficiently carry out its duties and responsibilities; F. Ensure, in consultation with the Board Chair, that all items requiring the Audit Committee’s approval are appropriately tabled;G. Ensure the proper flow of information to the Audit Committee and review, with the Chief Executive Officer, the Chief Financial Officer, the Corporate Secretary’s Office
and, as required, other Officers, the adequacy and timing of materials in support of management’s proposals;H. Report to the Board of Directors on the matters reviewed by, and on any decisions or recommendations of, the Audit Committee at the next meeting of the Board of
Directors following any meeting of the Audit Committee; andI. Carry out any special assignments or any functions as requested by the Board of Directors.
The members of the Audit Committee shall be appointed or changed by resolution of the Board of Directors to hold office from the time of their appointment until the next annual general meeting of the shareholders or until their successors are so appointed.
The Audit Committee shall fix its own procedure at meetings and for the calling of meetings. The Audit Committee shall meet separately in executive session in the absence of management, internal audit and the shareholders’ auditor, at each regularly scheduled meeting.
Unless otherwise determined from time to time by resolution of the Board of Directors, two members of the Audit Committee shall constitute a quorum for the transaction of business at a meeting. For any meeting(s) at which the Audit Committee Chair is absent, the Chair of the meeting shall be the person present who shall be decided upon by all members present. At a meeting, any question shall be decided by a majority of the votes cast by members of the Audit Committee, except where only two members are present, in which case any question shall be decided unanimously.
Unless otherwise determined by resolution of the Board of Directors, the Corporate Secretary of the Corporation or his/her delegate shall be the Secretary of the Audit Committee.

XI. VACANCIES
XII. RECORDS
BCE INC. 2009 ANNUAL INFORMATION FORM 47
Certain capitalized words and terms used throughout this annual information form are defined below:
2008/2009 NCIB means BCE Inc.’s normal course issuer bid for the 12-month period starting on December 23, 2008 and ending on December 22, 2009 which BCE Inc. completed ahead of schedule in May 2009;
2010 NCIB means BCE Inc.’s normal course issuer bid for the 12-month period starting on December 29, 2009 and ending on December 28, 2010; Adjusted EPS means earnings per share before restructuring and other and net (gains) losses on investments; Arrangement means the plan of arrangement of BCE Inc. under section 192 of the Canada Business Corporations Act giving effect to the proposed Privatization; Audit Committee means BCE Inc.’s audit committee; AWS means advanced wireless services; BCE means BCE Inc., its direct and indirect subsidiaries and joint ventures; BCE 2009 Annual Report means the BCE Inc. 2009 annual report; BCE 2009 MD&A means BCE Inc.’s 2009 management’s discussion and analysis on pages 18 to 79 and page 123 of the BCE 2009 Annual Report; Bell means our Bell Wireline and Bell Wireless segments on an aggregate basis; Bell Aliant means Bell Aliant Regional Communications Income Fund and its subsidiaries; Bell Distribution means Bell Distribution Inc.; Bell TV means Bell ExpressVu Limited Partnership; Bell Mobility means Bell Mobility Inc.; CDMA means code division multiple access; CEP means the Communications, Energy and Paperworkers’ Union of Canada; CIBC Mellon means CIBC Mellon Trust Company; Computershare means Computershare Trust Company of Canada; CTVglobemedia means CTVglobemedia Inc.; Dealer Agreement means Bell Distribution’s 2004 BDI Independent Dealer Agreement; DBRS means DBRS Limited; Definitive Agreement means the definitive agreement dated as of June 29, 2007 between the Purchaser and BCE Inc., as amended on July 12, 2007 and by the Final
Amending Agreement; DSL means digital subscriber line; DTH means direct-to-home; EPS means earnings per share; EVDO means evolution-data optimized; Final Amending Agreement means the agreement dated July 4, 2008, between BCE Inc. and the Purchaser, further amending the definitive agreement dated as of
June 29, 2007 between the Purchaser and BCE Inc., as amended on July 12, 2007; FTTB means fibre-to–the-building; FTTH means fibre-to-the-home; FTTN means fibre-to-the-node; Guarantors means the Ontario Teachers’ Pension Plan and affiliates of Providence Equity Partners Inc. and Madison Dearborn Partners, LLC; HD means high definition; HSPA means high-speed packet access; HSPA/HSPA+ network means the new wireless HSPA/HSPA+ network launched on November 4, 2009; ICT means information and communications technology; Initial Action means the statement of claim filed on August 9, 2004 under The Class Actions Act (Saskatchewan) in the Court of Queen’s Bench, Judicial Centre of
Regina, Saskatchewan against wireless communications service providers, including Bell Mobility and Aliant Telecom Inc., on behalf of certain alleged customers; IP means Internet protocol; IPTV means Internet protocol television; IPVPN means Internet protocol virtual private network; KPMG means KPMG LLP; LTE means long-term evolution; Mbps means megabits per second;
48 BCE INC. 2009 ANNUAL INFORMATION FORM
MDUs means multiple-dwelling units; Moody’s means Moody’s Investors Service, Inc.; MPLS means multi-protocol label switching; Nortel Networks means, collectively, Nortel Networks Corp. and Nortel Networks Ltd.; Privatization means the proposed acquisition, pursuant to the terms of the Definitive Agreement, of all of the outstanding common and preferred equity of BCE Inc. by the
Purchaser; Purchaser means BCE Acquisition Inc. (formerly known as 6796508 Canada Inc.), a corporation owned by an investor group led by Teachers’ and affiliates of Providence
Equity Partners Inc., Madison Dearborn Partners, LLC and Merrill Lynch Global Private Equity; PVR means personal video recorder; SAF means system access fees; Second Action means the statement of claim filed on July 27, 2009 under The Class Actions Act (Saskatchewan) in the Court of Queen’s Bench, Judicial Centre of
Regina, Saskatchewan against wireless service providers, including Bell Mobility and members of the Bell Aliant group, on behalf of certain alleged customers; S&P means Standard & Poor’s, a division of The McGraw-Hill Companies, Inc.; Teachers’ means Teachers’ Private Capital, the private investment arm of the Ontario Teachers’ Pension Plan; Telesat means Telesat Canada; The Source means The Source (Bell) Electronics Inc., Bell Canada’s wholly-owned subsidiary; VDSL means very high-speed digital subscriber line; Virgin means Virgin Mobile Canada; VoIP means voice over Internet protocol; and WDIF means Wireless Distribution Income Fund.
BCE INC. 2009 ANNUAL INFORMATION FORM 49
The table below is a list of our trademarks that are referred to and used as such in this annual information form and their owners.
Vacancies at any time occurring shall be filled by resolution of the Board of Directors.
The Audit Committee shall keep such records as it may deem necessary of its proceedings and shall report regularly its activities and recommendations to the Board of Directors as appropriate.
Schedule 2 – Glossary
Schedule 3 – Trademarks
OWNER TRADEMARK
Bell Aliant Regional Communications, Limited Partnership Aliant FibreOP Xwave
BCE Inc. BCE

Any other trademarks, or corporate, trade or domain names used in this annual information form are the property of their owners. We believe that our trademarks are very important to our success. Our exclusive trademark rights are perpetual provided that their registrations are timely renewed and that the trademarks are used in commerce by us or our licencees. We take appropriate measures to protect, renew and defend our trademarks. We also spend considerable time and resources overseeing, registering, renewing, licensing and protecting our trademarks and prosecuting those who infringe on them. We take great care not to infringe on the intellectual property and trademarks of others.
50 BCE INC. 2009 ANNUAL INFORMATION FORM
www.bce.ca
PRINTED IN CANADA
Bell Canada Bell Bell Centre Bell Distribution Bell Fibe Bell Internet Bell Mobility Bell TV Bell World Espace Bell La vie est Bell Sympatico Today just got better
Bell ExpressVu Limited Partnership ExpressVu
Bell Mobility Inc. Solo Solo Mobile

Exhibit 99.2
Management’s Discussion and Analysis
In this management’s discussion and analysis of financial condition and results of operations (MD&A), we, us, our and BCE mean BCE Inc., its subsidiaries and joint ventures. Bell Canada is, unless otherwise indicated, referred to herein as Bell, and comprises our Bell Wireline and Bell Wireless segments. Bell Aliant means Bell Aliant Regional Communications Income Fund and its subsidiaries. All amounts in this MD&A are in millions of Canadian dollars, except where noted. Please refer to our glossary on page 123 for a list of defined terms. Please refer to BCE Inc.’s audited consolidated financial statements for the year ended December 31, 2009 when reading this MD&A. In preparing this MD&A, we have taken into account information available to us up to March 11, 2010, the date of this MD&A, unless otherwise stated. You will find BCE Inc.’s audited consolidated financial statements for the year ended December 31, 2009 and BCE Inc.’s annual information form for the year ended December 31, 2009 dated March 11, 2010 (BCE 2009 AIF) and recent financial reports, on BCE Inc.’s website at www.bce.ca, on SEDAR at www.sedar.com and on EDGAR at www.sec.gov. This MD&A comments on our operations, performance and financial condition for the years ended December 31, 2009, 2008 and 2007.
ABOUT FORWARD-LOOKING STATEMENTS
BCE’s 2009 annual report including this MD&A and, in particular, but without limitation, the sections of this MD&A entitled Strategic Imperatives, Business Outlook and Assumptions and Financial and Capital Management – Liquidity contain forward-looking statements. These forward-looking statements include, but are not limited to, BCE Inc.’s dividend policy, the business outlook for BCE’s segments, BCE’s business objectives and strategies, the sources of liquidity we expect to use to meet our 2010 cash requirements, our fibre-optic deployment plans, and our plan to introduce Internet Protocol Television (IPTV) in the course of 2010. Forward-looking statements also include any other statements that do not refer to historical facts. A statement we make is forward-looking when it uses what we know and expect today to make a statement about the future. Forward-looking statements may include words such as aim, anticipate, assumption, believe, could, expect, goal, guidance, intend, may, objective, outlook, plan, project, seek, should, strategy, strive, target and will. All such forward-looking statements are made pursuant to the ‘safe harbour’ provisions of applicable Canadian securities laws and of the United States Private Securities Litigation Reform Act of 1995. Unless otherwise indicated by us, forward-looking statements in BCE’s 2009 annual report, including in this MD&A, describe our expectations at March 11, 2010 and, accordingly, are subject to change after such date. Except as may be required by Canadian securities laws, we do not undertake any obligation to update or revise any forward-looking statements, whether as a result of new information, future events or otherwise. Forward-looking statements, by their very nature, are subject to inherent risks and uncertainties and are based on several assumptions which give rise to the possibility that actual results or events could differ materially from our expectations expressed in or implied by such forward-looking statements and that our business outlook, objectives, plans and strategic priorities may not be achieved. As a result, we cannot guarantee that any forward-looking statement will materialize and you are cautioned not to place undue reliance on these forward-looking statements. Forward-looking statements are provided in BCE’s 2009 annual report, including in this MD&A, for the purpose of giving information about management’s current strategic priorities, expectations and plans and allowing investors and others to get a better understanding of our business outlook and operating environment. Readers are cautioned, however, that such information may not be appropriate for other purposes. Forward-looking statements made in BCE’s 2009 annual report, including in this MD&A, are based on a number of assumptions that we believed were reasonable on March 11, 2010. Refer, in particular, to the section of this MD&A entitled Business Outlook and Assumptions for a description of certain key economic, market and operational assumptions we have used in making forward-looking statements contained in this annual report and, in particular, but without limitation, contained in this MD&A in the sections entitled Strategic Imperatives, Business Outlook and Assumptions and Financial and Capital Management – Liquidity. If our assumptions turn out to be inaccurate, our actual results could be materially different from what we expect. Important risk factors that could cause actual results or events to differ materially from those expressed in or implied by the above-mentioned forward-looking statements and other forward-looking statements included in BCE’s 2009 annual report include, but are not limited to: the intensity of competitive activity, including the increase in wireless competitive activity that is expected to result from Industry Canada’s licensing of advanced wireless services (AWS) spectrum to new wireless entrants, and the resulting impact on our ability to retain existing, and attract new, customers, and on our pricing strategies and financial results; general economic and financial market conditions, the level of consumer confidence and spending, and the demand for, and prices of, our products and services; our ability to implement our strategies and plans in order to produce the expected benefits; our ability to continue to implement our cost reduction initiatives and contain capital intensity while seeking to improve customer service; our ability to respond to technological changes and rapidly offer new products and services; increased
18 BCE INC. 2009 ANNUAL REPORT MANAGEMENT’S DISCUSSION AND ANALYSIS
contributions to employee benefit plans; events affecting the functionality of, and our ability to protect, maintain and replace, our networks, information technology (IT) systems and software; events affecting the ability of third-party suppliers to provide to us essential products and services; the quality of our network and customer equipment and the extent to which they may be subject to manufacturing defects; labour disruptions; the potential adverse effects on our Internet and wireless businesses of the significant increase in broadband demand; our ability to raise the capital we need to implement our business plan, including for BCE Inc.’s share buy-back program and dividend payments and to fund capital and other expenditures and generally meet our financial obligations; our ability to discontinue certain traditional services as necessary to improve capital and operating efficiencies; regulatory initiatives or proceedings, litigation and changes in laws or regulations; launch and in-orbit risks of satellites used by Bell ExpressVu Limited Partnership (Bell TV); competition from unregulated U.S. direct-to-home (DTH) satellite television services sold illegally in Canada and the theft of our satellite television services; BCE Inc.’s dependence on the ability of its subsidiaries, joint ventures and other companies in which it has an interest to pay dividends and make other distributions; there can be no certainty that dividends will be declared by BCE Inc.’s board of directors or that BCE Inc.’s dividend policy will be maintained; stock market volatility; our ability to maintain customer service and our networks operational in the event of the occurrence of epidemics, pandemics and other health risks; health concerns about radio frequency emissions from wireless devices; and loss of key employees. These and other risk factors that could cause actual results or events to differ materially from our expectations expressed in or implied by our forward-looking statements are discussed throughout this MD&A and, in particular, under Our Competitive Environment, Our Regulatory Environment and Risks that Could Affect Our Business and Results. We caution readers that the risks described above are not the only ones that could impact us. Additional risks and uncertainties not currently known to us or that we currently deem to be immaterial may also have a material adverse effect on our business, financial condition or results of operations. Except as otherwise indicated by us, forward-looking statements do not reflect the potential impact of any non-recurring or other special items or of any dispositions, monetizations, mergers, acquisitions, other business combinations or other transactions that may be announced or that may occur after March 11, 2010. The financial impact of these transactions and non-recurring and other special items can be complex and depends on the facts particular to each of them. We therefore cannot describe the expected impact in a meaningful way or in the same way we present known risks affecting our business.
ABOUT OUR BUSINESS
BCE is Canada’s largest communications company. We are a comprehensive provider of wireline voice and wireless communications services, Internet access, data services and video services to residential, business and wholesale customers. In 2009, we reported the results of our operations in three segments: Bell Wireline, Bell Wireless and Bell Aliant. Bell, which encompasses our core operations, is the largest local exchange carrier in Ontario and Québec, and is comprised of our Bell Wireline and Bell Wireless segments. We also own a 44.1% interest in, and, through our right to appoint a majority of the directors and trustees, control, Bell Aliant, the incumbent carrier in Canada’s Atlantic provinces and in rural and regional areas of Ontario and Québec. For the year ended December 31, 2009, we generated consolidated operating revenues of $17,735 million, consolidated operating income of $3,191 million, and consolidated EBITDA(1) of $7,089 million. Our reporting structure reflects how we manage our business and how we classify our operations for planning and measuring performance. We discuss our consolidated operating results in this MD&A, as well as the operating results of each segment. See Note 2 to the consolidated financial statements for additional information about our segments. We also discuss our results by product line to provide further insight into our operations.
Returning Value to Shareholders
In 2009, BCE Inc. has announced three increases in the annual dividend payable on BCE Inc.’s common shares, delivering a 19% increase overall. The three increases during the course of 2009 were as follows:
on February 11, 2009, we announced a 5% increase from $1.46 to $1.54 per common share, starting with the quarterly dividend payable on April 15, 2009 on August 6, 2009, we announced a 5% increase from $1.54 to $1.62 per common share, starting with the quarterly dividend payable on October 15, 2009 on December 17, 2009, we announced a 7% increase from $1.62 to $1.74 per common share, starting with the quarterly dividend payable on April 15, 2010.
These dividend increases announced in 2009 were consistent with BCE Inc.’s common share dividend policy of a target payout ratio of 65% to 75% of Adjusted net earnings per share (Adjusted EPS)(2). This dividend policy was adopted by the board of directors of BCE Inc. with the objective of allowing sufficient financial flexibility to continue investing in BCE’s business while growing returns to shareholders. Under this dividend policy, increases in the common share dividend are directly linked to growthin BCE Inc.’s Adjusted EPS. The target payout ratio also allows flexibility so that any surplus cash
(1) EBITDA (earnings before interest, taxes, depreciation and amortization of intangible assets) is a non-GAAP financial measure. See Non-GAAP Financial Measures – EBITDA in this MD&A for more details, including a reconciliation to the most comparable Canadian GAAP financial measure.
(2) Adjusted net earnings and Adjusted EPS are non-GAAP financial measures. See Non-GAAP Financial Measures – Adjusted net earnings in this MD&A for more details, including a reconciliation to the most comparable Canadian GAAP financial measure.
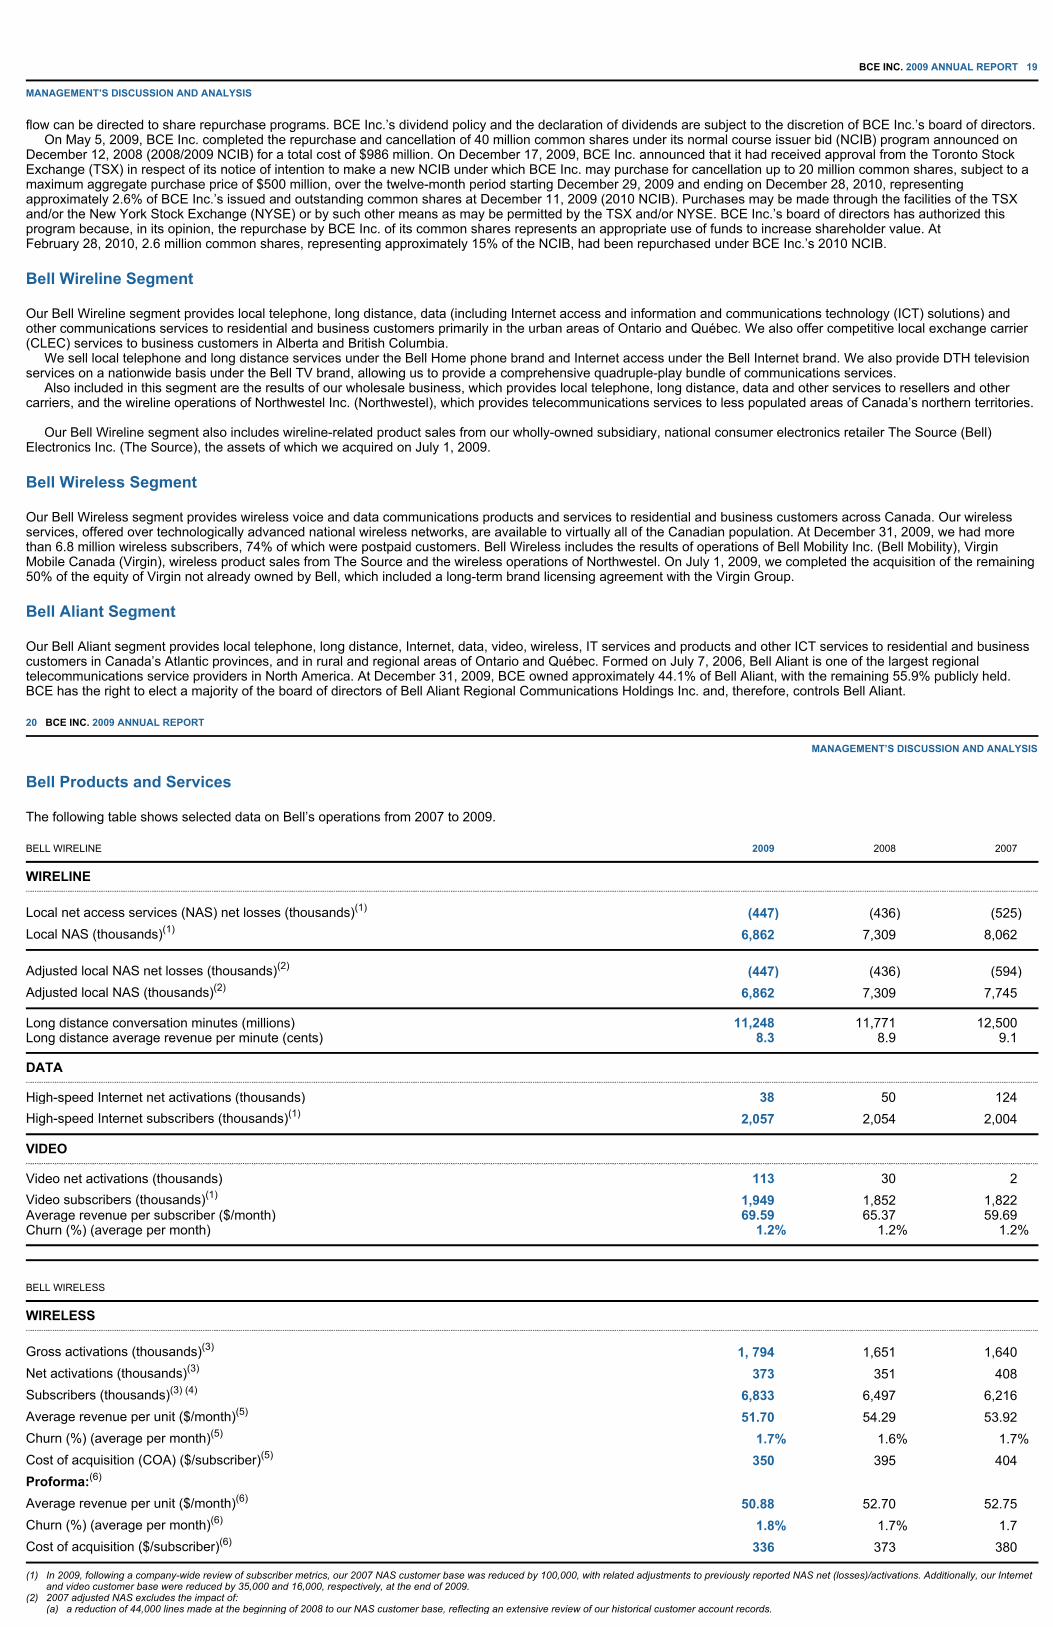
BCE INC. 2009 ANNUAL REPORT 19
MANAGEMENT’S DISCUSSION AND ANALYSIS
flow can be directed to share repurchase programs. BCE Inc.’s dividend policy and the declaration of dividends are subject to the discretion of BCE Inc.’s board of directors. On May 5, 2009, BCE Inc. completed the repurchase and cancellation of 40 million common shares under its normal course issuer bid (NCIB) program announced on December 12, 2008 (2008/2009 NCIB) for a total cost of $986 million. On December 17, 2009, BCE Inc. announced that it had received approval from the Toronto Stock Exchange (TSX) in respect of its notice of intention to make a new NCIB under which BCE Inc. may purchase for cancellation up to 20 million common shares, subject to a maximum aggregate purchase price of $500 million, over the twelve-month period starting December 29, 2009 and ending on December 28, 2010, representing approximately 2.6% of BCE Inc.’s issued and outstanding common shares at December 11, 2009 (2010 NCIB). Purchases may be made through the facilities of the TSX and/or the New York Stock Exchange (NYSE) or by such other means as may be permitted by the TSX and/or NYSE. BCE Inc.’s board of directors has authorized this program because, in its opinion, the repurchase by BCE Inc. of its common shares represents an appropriate use of funds to increase shareholder value. At February 28, 2010, 2.6 million common shares, representing approximately 15% of the NCIB, had been repurchased under BCE Inc.’s 2010 NCIB.
Bell Wireline Segment
Our Bell Wireline segment provides local telephone, long distance, data (including Internet access and information and communications technology (ICT) solutions) and other communications services to residential and business customers primarily in the urban areas of Ontario and Québec. We also offer competitive local exchange carrier (CLEC) services to business customers in Alberta and British Columbia. We sell local telephone and long distance services under the Bell Home phone brand and Internet access under the Bell Internet brand. We also provide DTH television services on a nationwide basis under the Bell TV brand, allowing us to provide a comprehensive quadruple-play bundle of communications services. Also included in this segment are the results of our wholesale business, which provides local telephone, long distance, data and other services to resellers and other carriers, and the wireline operations of Northwestel Inc. (Northwestel), which provides telecommunications services to less populated areas of Canada’s northern territories. Our Bell Wireline segment also includes wireline-related product sales from our wholly-owned subsidiary, national consumer electronics retailer The Source (Bell) Electronics Inc. (The Source), the assets of which we acquired on July 1, 2009.
Bell Wireless Segment
Our Bell Wireless segment provides wireless voice and data communications products and services to residential and business customers across Canada. Our wireless services, offered over technologically advanced national wireless networks, are available to virtually all of the Canadian population. At December 31, 2009, we had more than 6.8 million wireless subscribers, 74% of which were postpaid customers. Bell Wireless includes the results of operations of Bell Mobility Inc. (Bell Mobility), Virgin Mobile Canada (Virgin), wireless product sales from The Source and the wireless operations of Northwestel. On July 1, 2009, we completed the acquisition of the remaining 50% of the equity of Virgin not already owned by Bell, which included a long-term brand licensing agreement with the Virgin Group.
Bell Aliant Segment
Our Bell Aliant segment provides local telephone, long distance, Internet, data, video, wireless, IT services and products and other ICT services to residential and business customers in Canada’s Atlantic provinces, and in rural and regional areas of Ontario and Québec. Formed on July 7, 2006, Bell Aliant is one of the largest regional telecommunications service providers in North America. At December 31, 2009, BCE owned approximately 44.1% of Bell Aliant, with the remaining 55.9% publicly held. BCE has the right to elect a majority of the board of directors of Bell Aliant Regional Communications Holdings Inc. and, therefore, controls Bell Aliant.
20 BCE INC. 2009 ANNUAL REPORT MANAGEMENT’S DISCUSSION AND ANALYSIS
Bell Products and Services
The following table shows selected data on Bell’s operations from 2007 to 2009.
BELL WIRELINE 2009 2008 2007
WIRELINE
Local net access services (NAS) net losses (thousands)(1) (447) (436 ) (525) Local NAS (thousands)(1) 6,862 7,309 8,062
Adjusted local NAS net losses (thousands)(2) (447) (436 ) (594) Adjusted local NAS (thousands)(2) 6,862 7,309 7,745
Long distance conversation minutes (millions) 11,248 11,771 12,500 Long distance average revenue per minute (cents) 8.3 8.9 9.1
DATA
High-speed Internet net activations (thousands) 38 50 124 High-speed Internet subscribers (thousands)(1) 2,057 2,054 2,004
VIDEO
Video net activations (thousands) 113 30 2 Video subscribers (thousands)(1) 1,949 1,852 1,822 Average revenue per subscriber ($/month) 69.59 65.37 59.69 Churn (%) (average per month) 1.2% 1.2 % 1.2%
BELL WIRELESS
WIRELESS
Gross activations (thousands)(3) 1, 794 1,651 1,640 Net activations (thousands)(3) 373 351 408 Subscribers (thousands)(3) (4) 6,833 6,497 6,216 Average revenue per unit ($/month)(5) 51.70 54.29 53.92 Churn (%) (average per month)(5) 1.7% 1.6 % 1.7% Cost of acquisition (COA) ($/subscriber)(5) 350 395 404 Proforma:(6) Average revenue per unit ($/month)(6) 50.88 52.70 52.75 Churn (%) (average per month)(6) 1.8% 1.7 % 1.7 Cost of acquisition ($/subscriber)(6) 336 373 380
(1) In 2009, following a company-wide review of subscriber metrics, our 2007 NAS customer base was reduced by 100,000, with related adjustments to previously reported NAS net (losses)/activations. Additionally, our Internet and video customer base were reduced by 35,000 and 16,000, respectively, at the end of 2009.
(2) 2007 adjusted NAS excludes the impact of: (a) a reduction of 44,000 lines made at the beginning of 2008 to our NAS customer base, reflecting an extensive review of our historical customer account records.

Bell is our primary operational focus and the largest component of our business. Traditional legacy telecommunications services (legacy services), as referred to in this MD&A, are those services, such as long distance and local telephone services, voice private lines and dedicated digital private line services, that we offer over our traditional circuit-switched voice and data networks. Growth services, as referred to in this MD&A, are made up of our wireless, video, high-speed Internet and other services, including ICT solutions. Our Bell Wireline segment generates revenues from the following five major lines of business:
local and access services long distance services data services video services equipment and other.
BCE INC. 2009 ANNUAL REPORT 21
MANAGEMENT’S DISCUSSION AND ANALYSIS
Local and Access Services
Bell operates an extensive local access network that provides local telephone services to residential and business customers primarily in the urban areas of Ontario and Québec including major urban centres such as Toronto, Montréal, Ottawa, Québec City, Hamilton and London. We also provide local telephone services to business customers in Alberta and British Columbia and to less populated areas of Canada’s northern territories through Northwestel. The 6.9 million NAS lines we provide to our customers are a key factor in establishing customer relationships and are the foundation for the other products and services we offer. Local telephone service is the main source of local and access revenues. Other sources of local and access revenues include:
value-added services (VAS) such as call display, call waiting and voicemail services provided to competitors accessing our local network connections to and from our local telephone service customers for competing long distance service providers subsidies from the National Contribution Fund to support local service in high-cost areas.
We offer a variety of Bell Home phone packages that include unlimited local phone calling with a number of different VAS depending on the package chosen by the customer. When a Bell Home phone package is combined with our other products to form a service bundle, a customer is eligible to receive a monthly discount. To qualify, a customer must subscribe to at least two of the following products: Bell Home phone, Long Distance, Bell Internet, Bell TV and Bell Mobility. Customers subscribing to one of our bundle-eligible plans receive a single bill for all of their Bell services. We faced a significantly high level of competitive intensity from cable companies in 2009 as a result of them offering voice services over their networks, which continued to place downward pressure on our local telephony market share, especially in the residential market. Cable telephony in particular is being driven by its inclusion in discounted bundles and is now offered by cable operators in most major and mid-sized communities, as well as in many smaller communities. In addition, increased customer adoption of wireless telephony as their primary means of voice communication is resulting in a reduced number of primary NAS lines and contributing to a higher rate of wireless substitution. The Canadian Radio-television and Telecommunications Commission (CRTC) regulates rates for services in our incumbent territories that are subject to regulation. While the market for telephone services in Canada has seen increased competition since 2005 due mainly to the launch and expansion of telephony services by cable operators, past regulatory changes have improved the competitive environment for Bell from one that heavily favoured its competitors to a more level playing field. Prior to these changes, Bell’s marketing, pricing, bundling and customer winback strategies relating to local services were restricted, limiting our ability to compete against cable telephony and Voice over Internet Protocol (VoIP) providers which did not face such restrictions. On April 4, 2007, the Canadian Minister of Industry eliminated customer winback and promotional restrictions for local exchange services. We believe that these changes, along with decisions made by the CRTC since then, deregulating over 90% of Bell Canada’s residential telephone access lines and over 80% of Bell Canada’s business telephone access lines in Ontario and Québec, allow for significant improvements in our operating flexibility and have improved our ability to compete effectively with other local service providers, bundle our services and offer more value to our customers.
Long Distance Services
We provide domestic and international long distance voice services to residential and business customers. These services include a wide variety of subscription plans ranging from monthly unlimited provincial or North American calling plans catering to heavy callers to pay-per-minute plans for more casual callers. We also provide wholesale access service to other carriers and resellers, and receive settlement payments from other carriers for completing their customers’ long distance calls in our territory. We offer large usage long distance packages for a set monthly price to Bell Home phone customers, allowing for affordable long distance calling across North America. We also offer an unlimited world long distance plan to Bell Bundle customers that allows for unlimited long distance calls to more than 50 countries, including within Canada and the United States, for one set monthly price. We experience significant competition in the provision of long distance service from VoIP service providers and cable companies and others, dial-around providers and prepaid card providers, as well as from traditional competitors such as inter-exchange carriers and resellers. We also experience competition from telecommunications providers such as Skype Technologies (a division of eBay) that provide long distance service at low prices using personal computers and broadband connections. Competition for contracts to supply long distance services to large business customers is very intense. Customers may choose to switch to competitors that offer lower prices to gain market share. Such competitors may be less concerned about the quality of service or impact on their margins than we are.
Data Services
We provide high-speed Internet access service under the Bell Internet brand for residential and business customers. At December 31, 2009, we provided high-speed Internet access to more than two million customers, whether through digital subscriber line (DSL) technology, fibre-optic or wireless broadband service. Our high-speed Internet access footprint in Ontario and Québec reached more than 93% of our homes and business lines passed at December 31, 2009.
22 BCE INC. 2009 ANNUAL REPORT
MANAGEMENT’S DISCUSSION AND ANALYSIS
We currently offer three DSL packages for the light to moderate user, marketed as Essential, Essential Plus and Performance, which provide download speeds of up to 500 kilobits per second, 2 megabits per second (Mbps) and 7 Mbps, respectively. For the moderate to heavy user, we launched Bell Fibe Internet service on February 4, 2010 in the Montréal and Greater Toronto areas. Fibe Internet provides customers access to download speeds of up to 25 Mbps and upload speeds of up to 7 Mbps. Fibe Internet is enabled by advanced very high-speed digital subscriber line 2 (VDSL2) technology enhancements to Bell’s fibre-to-the-node (FTTN) network. We also offer wireless Internet through our Bell Wireless segment, which provides high-speed Internet access from personal desktop computers or laptops at speeds of up to 21 Mbps, using a mobile Internet universal serial bus (USB) stick. In addition, we offer a nationwide portable wireless broadband service that delivers wireless Internet access using worldwide interoperability for microwave access (WiMAX) technology with speeds of up to 3 Mbps. This service is enabled through the network provider Inukshuk Wireless Inc. (Inukshuk), a joint venture between Bell Canada and one of our cable competitors. We run Canada’s largest general interest portal, Sympatico.ca. The portal receives about 20 million unique visitors per month and reaches approximately 80% of online Canadians. We also sell a full range of data services to business customers. In addition to Internet access, some of the services we offer include:
Internet protocol (IP)-based Services – Bell manages the largest IP multi-protocol label switching (MPLS) footprint of any Canadian provider, enabling us to offer customers a virtual private network (VPN) service for IP traffic and to optimize bandwidth for real-time voice and video. Our IP-based services include IP virtual private networks, Ethernet, business Internet and VoIP. ICT Solutions – Bell provides ICT solutions that include professional, managed and infrastructure services.
We also continue to offer legacy data services, such as integrated services digital network, frame relay and ATM services to existing customers. The market for these services is declining over time as customers migrate to newer technologies.
(b) an adjustment in 2008 to our beginning-of-period business NAS customer base to write-off 273,000 lines following formal notification received from a major wholesale customer in 2007 that it was in the process of migrating all of its subscribers onto its own network facilities.
(3) Total wireless gross activations, net activations and end of period (EOP) subscribers include 100% of Virgin Mobile’s subscribers. (4) In 2009, following a company-wide review of subscriber metrics, we reduced wireless subscribers by 37,000 at the end of 2009.(5) Beginning in the third quarter of 2009, wireless average revenue per unit, churn and (COA) reflect 100% of Virgin’s results due to our acquisition on July 1, 2009 of the remaining 50% not already owned. All prior periods
reflect the original 50% ownership. (6) Wireless average revenue per unit, churn and COA in the prior years have been restated to include 100% of Virgin’s results, rather than 50%.

Video Services
We are Canada’s largest digital television provider, nationally broadcasting more than 500 all-digital video and audio channels and a wide range of domestic and international programming. We currently distribute our video services to more than 1.9 million customers. Our primary video operations are marketed nationally under the Bell TV brand and carried out through our wholly-owned Bell TV subsidiary, which has been offering DTH satellite service since 1997. Our DTH operations currently use three satellites. Telesat Canada (Telesat), our former subsidiary, operates or directs the operation of these satellites. We have leveraged this satellite capacity to offer a menu of programming options, such as a wide range of over-the-air and specialty programming, more than 100 high-definition (HD) channels with TV shows, movies, sports and other entertainment options and a broad selection of pay-per-view service offers. We also offer hardware, including personal video recorders (PVRs), Bell TV Online subscription video-on-demand and the most HD channels in Canada. The other components of our video offering that complement our DTH service include:
Very high-speed digital subscriber line (VDSL) – We currently offer VDSL-based video services within certain multiple-dwelling units (MDUs) in select urban centres in Ontario and Québec. This service is a wireline-based video offering, providing subscribers with a competitive, fully digital video solution over a DSL line. This technology has been deployed in urban areas as an alternative to DTH service within the MDU market. Hybrid fibre co-axial cable – We sell residential video services through Cable VDN, a Montréal-based cable business that offers competitive analog and digital video services within certain neighbourhoods in the Greater Montréal area via its proprietary co-axial fibre network. IP television – We currently offer IP-based television services on a limited trial basis in selected Toronto and Montréal neighbourhoods. The service trial is designed to acquire valuable operational and marketing insights and to ensure that the IP television platform and service offering are stable and robust prior to our commercial launch expected in 2010.
Equipment and Other
This category includes revenues from a number of other sources, including:
renting, selling and maintaining business terminal equipment video set-top box (STB) sales network installation and maintenance services for third parties product sales, other than wireless products, at national consumer electronics retailer The Source.
Wireless Services
We offer a broad range of wireless voice and data communications products and services to consumer and business customers across Canada. We also provide an array of VAS such as call display and voicemail, e-mail, text, picture and video calling and messaging, music downloads, ringtones and games, video streaming, live TV, as well as roaming services with other wireless service providers. Customers can choose to pay for their services through a monthly rate plan (postpaid) or in advance (prepaid). Our postpaid rate plans, payable on a monthly basis, are available with a one, two or three-year contract that offer handset discounts, but also can be obtained without a contract. At December 31, 2009, we served more than 6.8 million wireless customers, of which approximately 5.0 million subscribed to postpaid rate plans.
BCE INC. 2009 ANNUAL REPORT 23
MANAGEMENT’S DISCUSSION AND ANALYSIS
We provide wireless communications services under the Bell, Solo Mobile and Virgin Mobile brands. Solo Mobile is a brand, owned and operated by Bell Mobility, positioned to compete against other flanker brands in Canada. We offer a wide variety of single-user and shared postpaid rate plans, designed for local and long distance service. Data also can be added to voice service. We provide a wide range of wireless data services to consumers and business clients, including text and e-mail services, picture and video messaging, Internet browsing, ring tunes, ringtones and screen-savers, social networking, instant messaging, multimedia such as music downloads (including Canada’s largest mobile music catalogue), video streaming, TV (including exclusive HBO programming), full-length movies and other services such as GPS navigation and location-based services. Mobile business services include sales force automation and customer relationship management tools, field service automation, and resource and asset tracking tools. On November 4, 2009, we participated in the launch of a new wireless high-speed packet access (HSPA)/HSPA+ network (the HSPA/HSPA+ network), capable of delivering high-speed mobile access of up to 21 Mbps to 93% of the Canadian population and covering almost 20,000 cities and towns in both urban and rural locations. The HSPA/HSPA+ network supports full global roaming, as well as a wide range of new smartphones, wireless Internet sticks and other leading-edge mobile devices. The new network also supports international roaming in more than 200 countries, including a preferred roaming agreement with AT&T Inc. (AT&T), the largest HSPA operator in the United States. The vast majority of the site connectivity for the new network was built with high-speed fibre and an all-IP architecture for enhanced reliability. The new HSPA/HSPA+ network joins our existing national 3G code division multiple access (CDMA)/evolution, data optimized (EVDO) network, which Bell currently plans to continue to operate alongside the new network. Our CDMA wireless network covered 99% of Ontario’s and Québec’s population and approximately 97% of Atlantic Canada’s population at December 31, 2009. Our CDMA network also covers major cities in the provinces of Alberta and British Columbia. In response to the proliferation of wireless data service, we continue to expand our EVDO network launched in October 2005. At the end of 2009, Bell’s EVDO network covered 90% of the Canadian population. EVDO delivers high-speed mobile services with data-rich content such as e-mail, video messaging, gaming, video conferencing, telematics and streaming entertainment. With our dual high-speed data networks, we are able to offer Canadian consumers the broadest range of choice in wireless smartphones, including the Apple iPhone 3GS, RIM BlackBerry devices and the Palm Pre, as well as other QWERTY-keyboard and touch screen smartphones designed for data services such as e-mail, messaging, Internet access and social networking.
Employees
At December 31, 2009, BCE employed 50,662 people on a full- or part-time basis, compared with 49,536 at the end of 2008. The total number of Bell employees at the end of 2009 was 42,597, up from 40,779 on December 31, 2008. The increase in Bell’s headcount was primarily the result of the acquisitions on July 1, 2009 of The Source and Virgin. Excluding these acquisitions, Bell’s workforce decreased 6.1%, or by 2,492, to 38,287 employees in 2009, driven by productivity improvements in our field services and customer contact centres, efficiencies achieved from the integration of our Enterprise, SMB and Bell West units into a single unit called Bell Business Markets, a retirement incentive offered to qualifying employees represented by the Communications, Energy and Paperworkers’ Union of Canada (CEP), and a management downsizing during the second half of the year focused on achieving a competitive cost structure. The number of management departures at Bell in 2009 totalled approximately 1,200, representing about 3% of the total Bell workforce or 8% of management. We signed collective bargaining agreements in 2009 with varying expiration dates through July 6, 2014, covering approximately 10,000 of Bell’s more than 18,000 union employees. Approximately 43% of Bell employees are represented by labour unions. Since June 2008, excluding the impact of acquisitions, Bell has reduced its workforce by 5,800, primarily in the non-customer-facing management ranks, which were reduced by 22%. At Bell Aliant, the total number of employees decreased to 8,065 in 2009 from 8,757 in the previous year, due mainly to workforce reduction programs initiated in the fourth quarter of 2008 and throughout 2009 that further streamlined Bell Aliant’s organizational structure.
STRATEGIC IMPERATIVES
This section contains forward-looking statements concerning our business objectives and strategies. For a description of assumptions underlying certain of such forward-looking statements, refer to Business Outlook and Assumptions. For a description of certain risk factors that could cause actual results or events to differ materially from our expectations expressed in or implied by such forward-looking statements, refer in particular to Our Competitive Environment, Our Regulatory Environment and Risks that Could Affect Our Business and Results. Our goal is to be recognized by customers as Canada’s leading communications company. Our primary business objective is to maximize subscribers, revenues, operating profit, free cash flow and return on invested capital by further enhancing our position as a foremost provider of comprehensive communications services to residential and business customers. We seek to take advantage of opportunities to leverage our networks, infrastructure, sales channels, and brand and marketing resources across our various lines of business to create value for both our customers and other stakeholders.
24 BCE INC. 2009 ANNUAL REPORT
MANAGEMENT’S DISCUSSION AND ANALYSIS
Our strategy to deliver a better customer experience at every level is enabled by our five strategic imperatives:
Improve Customer Service Accelerate Wireless Leverage Wireline Momentum Invest in Broadband Networks and Services Achieve a Competitive Cost Structure.

These strategic imperatives are rooted in efficiently and cost effectively delivering consistent, reliable, high-quality communications services to customers, proactively managing legacy revenue erosion and profitably expanding our customer base.
Our ability to return cash to shareholders now and in the future is directly supported by accelerating our business performance. The Bell team’s progress in executing our customer-focused strategy in 2009 supports the financial flexibility required to continue to create value for shareholders, to maintain a strong balance sheet and to invest significantly in network and service program expansion. We intend to execute our business plan in 2010 on the basis of disciplined market leadership behaviour, while maintaining a balance between profitable growth and market share in each of our lines of business.
The following table highlights some of the important steps we took in 2009 to address each of our 5 Strategic Imperatives.
BCE INC. 2009 ANNUAL REPORT 25
MANAGEMENT’S DISCUSSION AND ANALYSIS
26 BCE INC. 2009 ANNUAL REPORT
MANAGEMENT’S DISCUSSION AND ANALYSIS
STRATEGIC IMPERATIVE OBJECTIVES 2009 ACCOMPLISHMENTS
Improve customer service
Deliver the programs and investments we need to improve our front-line service capabilities, our networks, our products and our distribution channels to win and keep customers
Enhance customers’ overall experience with Bell by delivering the service basics in terms of call centre efficiency, meeting commitments for the installation and timely repair of services, increasing network quality, and implementing process improvements to simplify customer transactions and interactions with our front-line employees, all of which will help differentiate us from our competitors and gain long-term customer loyalty
Improved service delivery by meeting more than 90% of our commitments for Same Day Next Day service for all our residential home products
Reduced residential call centre volumes by 16% year over year
Improved help desk agent satisfaction by three percentage points, from 79% to 82%
73% of all new high-speed Internet service customers used our Full Install service
Invested significantly in our field services operations, with 2,000 new service vehicles equipped with GPS and laptops and a new team-based support structure to drive speed and productivity
Customer satisfaction with our field technicians exceeded 90%
Reduced business customer outages in our core data and broadband services by approximately 30%
Provided upgraded online and over-the-phone options to Bell’s wireless customers, allowing them to take advantage of self-service capabilities for basic service issues, which improved overall customer satisfaction levels while saving costs for the company
STRATEGIC IMPERATIVE OBJECTIVES 2009 ACCOMPLISHMENTS
Accelerate wireless
Profitably grow our wireless business by capturing our fair share of the postpaid market, maximizing average revenue per unit (ARPU) by targeting high-value subscribers, increasing our share of in-bound global roaming, driving higher wireless data penetration and usage, and leveraging the HSPA/HSPA+ network and footprint advantage
The key elements of our wireless strategy are as follows:
focusing on voice and data services that are attractive to both residential and business customers maintaining the most technologically advanced, high-quality and pervasive wireless network possible offering a wide range of high-quality handsets improving customer service while reducing churn expanding sales distribution channels to increase points of presence and retail traffic.
Participated in the launch of a new national HSPA/HSPA+ wireless network, the broadest in Canada
Offered the widest range of choice in wireless devices with more than 50 different mobile device options available to customers, including smartphones such as the Apple iPhone 3GS, RIM BlackBerry Bold and the Palm Pre
Acquired consumer electronics retailer The Source and its approximately 750 retail stores, giving us a national presence in Canada’s highest-traffic mall locations and effectively increasing the number of places where customers can buy Bell products and services. Bell Mobility and Virgin Mobile launched at The Source in January 2010.
Acquired the remaining 50% of the equity of Virgin not already owned, along with a long-term brand licencing agreement with the Virgin Group. We believe that full ownership of this asset enhances our competitive market position by allowing us to compete more effectively with the Canadian industry’s other flanker brands.
Mobile data revenue grew 32%, accounting for 18% of wireless service revenues by the end of 2009
Announced the signing of a preferred reciprocal wireless roaming agreement with AT&T, the largest HSPA operator in the United States, that will enable AT&T wireless customers to roam on the new wireless HSPA/HSPA+ network while providing Bell customers with access to AT&T’s GSM and 3G wireless networks in the United States
Leverage wireline momentum
Reduce the rate of local residential line losses through winbacks, driving higher multi-product home penetration, and increasing household-move wins and retentions. Our TV and broadband Internet services remain critical components of our service bundling strategy, which we intend to further leverage in order to drive subscriber acquisition and retention, and to maximize average revenue per household (ARPHH).
In our business markets, our focus will remain on retaining small business customers and winning important large business customer contracts. This will be supported by the strength of our IP MPLS network and the breadth of our ICT services, which should help moderate the decline in voice and data revenues.
Reduced the number of residential line losses by 12.6% over 2008 through improving service delivery, winbacks and service bundling
Maintained our industry leadership in HD by offering over 100 HD channels, the most in Canada. With Bell TV’s market leadership in HD, we became the fastest-growing TV service in Canada.
Residential Internet subscribers were up 25% year over year
ARPHH increased 9%
No major large business customer contracts lost in 2009
Maintained our market share of the mass and mid-sized business market segments
Made a minority interest investment in the Montréal Canadiens Hockey Club and the Bell Centre, allowing us to leverage the marketing power of the Canadiens name and the popularity of the Canadiens content on TV, online and on mobile phones
STRATEGIC IMPERATIVE OBJECTIVES 2009 ACCOMPLISHMENTS

BCE INC. 2009 ANNUAL REPORT 27
MANAGEMENT’S DISCUSSION AND ANALYSIS
BUSINESS OUTLOOK AND ASSUMPTIONS
This section contains forward-looking statements concerning the business outlook of our Bell Wireline, Bell Wireless and Bell Aliant segments. This section also describes certain key economic, market and operational assumptions we have used in making such forward-looking statements and other forward-looking statements contained in this MD&A. For a description of risk factors that could cause actual results or events to differ materially from our expectations expressed in or implied by such forward-looking statements, refer in particular to Our Competitive Environment, Our Regulatory Environment and Risks that Could Affect Our Business and Results. Based on the estimates of the six major banks in Canada at the end of 2009, the Canadian economy is expected to grow, on average, by 2.6% in 2010. Consistent with this consensus view, we have assumed a gradual improvement in the Canadian economic environment with momentum beginning in the second half of 2010. In addition, we have made certain market assumptions in preparing our business outlook for 2010, including the following:
increased spending and investment by business customers as the economic environment strengthens revenues generated by the residential voice telecommunications market in Canada to continue to decrease due, in part, to land line substitution to competing technologies such as wireless, which is expected to increase in 2010 particularly as a result of aggressive competitive activity by new wireless entrants having purchased AWS spectrum, and VoIP and other factors including e-mail and instant messaging substitution current levels of competition to continue for residential and business local voice telephony, as cable operators and other telecom service providers maintain the intensity of their marketing efforts and continue to leverage their network footprints to pursue market share in our regions wireless industry penetration growth in 2010 similar to 2009, and TV and Internet market growth at levels slightly lower than 2009, given the relatively high penetration rates and maturity levels for these products.
Our business outlook is also based on certain operational assumptions and other market assumptions that are discussed below.
Bell Wireline
In both our residential and business markets for 2010, we will seek to minimize the decline in revenues from legacy voice and data services mainly through ongoing service and product value enhancements, targeted marketing initiatives to slow the rate of NAS erosion, and leveraging the strength of our core connectivity services portfolio. Many of our residential market product lines demonstrate a good level of inelasticity to a downturn in the economy. However, with an expected increase in housing starts and residential moves as the economy improves, we could experience higher customer turnover. Although we will continue to incur local line losses, primarily as a result of cable telephony competition, we are targeting a relatively stable rate of residential NAS erosion based on the assumption that targeted retention and service bundle offers, customer winbacks and better service execution will maintain residential customer NAS line losses steady year over year. However, aggressive marketing actions from the new wireless entrants, which may include offering low-priced wireless home phone replacement plans, could also result in higher residential customer NAS line losses. At Bell TV, we intend to leverage our market leadership position in HD programming, seek greater penetration within the MDU market and capitalize on our ownership of The Source to drive subscriber acquisition and higher ARPU, while proceeding with a measured launch of IPTV. Our focus at Bell Internet will centre on expanding our FTTN customer base, building out FTTH in targeted markets, and pursuing usage-based pricing in order to grow revenues. We also intend to achieve service improvements by further enhancing the speed and reliability of our broadband Internet network, while continuing to offer full installation and customer support for new subscribers. Business market demand was adversely affected in 2009 as business clients curtailed their spending and investment plans due to tighter credit availability, economic uncertainty, continued competition from offshore manufacturing and reduced employment levels. It is expected that these trends will continue to have a negative impact on
Invest in broadband networks and services
Continue investing in fibre build-outs and pursue advanced network enhancements to further grow our base of subscribers on broadband platforms
We also aim to roll out thousands of new FTTN network locations serving millions of households and businesses, enabling new online video, networking and other rich, high-speed IP-based services
With respect to our wireless business, leverage the advantages of the HSPA/HSPA+ national network.
Participated in the launch of a new national HSPA/HSPA+ wireless network, the broadest deployment in Canada
Expanded our high-speed fibre optic capabilities through our FTTN rollout to residential neighbourhoods and to MDUs throughout the Québec-Windsor corridor. At the end of 2009, our FTTN network reached 2.9 million homes out of a total of approximately 6.4 million households in Bell’s incumbent territories.
Substantially advanced the deployment of VDSL2 technology, with close to two million homes passed offering up to 25 Mbps service capability
Increased our base of FTTN subscribers by 46% in 2009 to 500,000.
Subsequent to the end of 2009, we have:
announced our plan to deploy fibre-to-the-home (FTTH) in Québec City. Québec City is the largest urban centre in Canada to be selected to date for the deployment of FTTH, which will offer consumers and business customers download speeds of at least 100 Mbps. announced the deployment of FTTH in all new urban and suburban housing developments in Ontario and Québec beginning in the second half of 2010. This is in addition to our deployment of fibre-to-the-building (FTTB) to MDUs already underway. At the end of 2009, 360 MDUs were equipped with Bell fibre, primarily in Toronto and Montréal. launched our new Bell Fibe high-speed Internet service, providing customers access to enhanced download speeds of up to 25 Mbps and the fastest upload speeds available in the market at up to 7 Mbps announced the launch of competitive Bell IPTV services in Toronto and Montréal starting in 2010, which is expected to enhance Bell’s competitive position in these core urban markets and complement our existing Bell TV DTH-based service.
Achieve a competitive cost structure
Cost containment is a core element of our financial performance and remains a key factor in our objective to maintain margins in the face of both the expected continued decline in legacy revenues and a further shift in product mix towards growth services
We aim to accomplish this through building the most cost-effective structure possible to extract maximum operational efficiency and productivity gains throughout our business.
Reduced Bell’s total workforce by 2,500 in 2009 (excluding the increase in Bell’s workforce due to the acquisitions of The Source and Virgin)
Combined our Enterprise, SMB and Bell West units into a single, business-focused unit called Bell Business Markets to improve customer focus and optimize efficiency
Reduced operating expenses related to wireline field services, IT, network and corporate support by approximately $100 million over 2008
Renegotiated contracts with our key IT and outsource suppliers. Since 2008, we have reduced IT and network supply chain costs by 15%
Improved working capital through tighter collection of accounts receivable, and accounts payable and inventory management. We lowered Bell’s accounts receivable balance by approximately $100 million in 2009 and improved Days Sales Outstanding by approximately five days.
Reduced travel and entertainment expenses by 17%
Completed a $1 billion public debt offering which replaced existing debt with new debt at a significantly lower cost.

demand at least through the first two quarters of 2010. As the economy strengthens, we expect that the performance of our Business Markets unit, including business NAS line losses, will improve gradually, based on an assumption of increased customer spending, new business formation and higher demand for basic connectivity and ICT services. However, even with a recovery in the economy, more conservative strategies by large business customers may result in lower capital spending requirements and the deferral of ICT projects. Furthermore, any additional softening in employment levels or new business starts in the small and medium sized business segment of the market in Ontario and Québec could drive business NAS erosion higher. Through our Business Markets unit, we will continue to deliver network-centric ICT solutions to large business and public sector clients that increase the value of connectivity services. We expect to experience continued competitive intensity in all business markets as cable operators continue to transition from consumer-only plays and other telecom competitors seek to grow their business in these markets. We
28 BCE INC. 2009 ANNUAL REPORT
MANAGEMENT’S DISCUSSION AND ANALYSIS
also intend to introduce service offerings that help drive innovative solutions and value for our small and mid-sized customers, while focusing on growing overall profitability through customer retention, maintaining ARPU levels and optimizing operations to further reduce costs. Other areas of focus at Bell Wireline for 2010 include ongoing improvements in customer experience and the introduction of new products in our markets, including the launch of Bell Fibe, a new high-speed Internet service enabled by our extensive broadband fibre footprint that is expected to encompass 3.6 million homes by the end of 2010 and offer download speeds of up to 25 Mbps to a majority of our customers, and the anticipated launch of Bell IPTV services in Toronto and Montréal. These initiatives, as well as ongoing investment in our fibre optic network to further expand our wireline broadband footprint, are expected to strengthen our competitive position versus the cable companies. We also intend to maintain a strong focus on cost control in order to support the objective of maintaining stable EBITDA margins. This assumes that we will be able to achieve expense savings from renegotiated contracts with all our key IT vendors and outsource suppliers, the flow-through from labour force reductions in 2009, field workforce productivity improvements, leveraging operational synergies from the integration in 2009 of our business customer-facing units, controlling network maintenance costs, and reducing traffic that is not on our own network.
Bell Wireless
We expect higher wireless usage and roaming revenues year over year, based on higher employment levels, increased discretionary spending and the resumption of travel consistent with our assumption that the economic environment improves in the second half of 2010. As a result of new wireless entrant competition, which should intensify progressively throughout the course of 2010 as additional service providers come to market, we expect added pressure on ARPU and customer churn, highlighting the critical importance of continuing to improve customer satisfaction and proactively focusing on customer retention. This is expected to be mitigated in part by the impact of the recently launched HSPA/HSPA+ network, which should drive increased smartphone device penetration and incremental growth in data usage and roaming. We expect that our Wireless unit will continue to be a key contributor to Bell’s revenue and EBITDA results in 2010. The financial performance of Bell Wireless is based on its continued ability to focus on profitable growth and execute its market strategies. We have assumed that our wireless revenue growth will be driven by ARPU from new services, careful price management and continued disciplined expansion of our subscriber base. We will seek to achieve our ARPU objectives through data revenue growth, supported by the new HSPA/HSPA+ network, higher demand for data services and increasing usage from wireless services such as text and picture messaging, web browsing, music and video downloads and community portals such as Facebook and YouTube. We also have assumed that we will benefit from ongoing technological improvements by manufacturers in our handset and device lineup and from faster data speeds that are allowing our clients to optimize the use of our services. We intend to continue introducing new products and services to the market in a timely manner, balancing innovation with profitability. The development of wireless data transmission technologies has led to the development of more sophisticated wireless devices with increasingly advanced capabilities, including access to e-mail and other corporate IT platforms, news, sports, financial information and services, photos, music and streaming video clips, TV and other functions. We believe that the introduction of such new applications will drive the growth for data transmission services. As a result, we aim to introduce additional high-speed enabled data applications and other services to our wireless customers in order to deliver increasing value to them. However, the proliferation of these relatively more expensive and sophisticated devices, as well as heightened competitive activity, is expected to exert pressure on EBITDA, due mainly to increased handset subsidization resulting in higher subscriber acquisition and retention costs. We have moderate wireless subscriber growth expectations for 2010 that assume a significant increase in our points of sale due to the launch of Bell Mobility and Virgin at The Source in January 2010 and that also take into account the impact of new entrants. Our 2010 financial outlook for Bell Wireless assumes a view that requires diligent expense management to moderate the impact of aggressive discount brand and new entrant pricing, higher retention spending and increased acquisition costs driven by increased smartphone customer penetration.
Bell Aliant
Bell Aliant intends to continue to pursue the five strategic objectives it identified in 2009. Firstly, it intends to improve the customer experience through improvements to service fundamentals supported by operational improvements to its processes, tools and training. Secondly, it intends to mitigate customer churn through increasing its retention efforts and increasing the penetration of service bundles. Bell Aliant also intends to make enhancements to its value packages and bundle offers in 2010 as these have proven to be effective churn-reduction tools in the past. Thirdly, Bell Aliant plans to focus on growing its broadband business by increasing its investment in FTTH technology in 2010. This increased investment should enable Bell Aliant to provide Internet speeds exceeding those of its competitors in those markets where the technology has been deployed, increase Bell Aliant’s IPTV footprint and allow for more IP service development. Bell Aliant’s fourth strategic objective is to become more profitable and more competitive through resetting its cost structure. As a result of organizational restructurings implemented at the end of 2008 and throughout 2009, Bell Aliant is
BCE INC. 2009 ANNUAL REPORT 29
MANAGEMENT’S DISCUSSION AND ANALYSIS
well-positioned to operate more efficiently in the future. Bell Aliant plans to focus on increasing productivity by concentrating on continued cost containment, procurement improvements and gains in process and operational efficiency. Finally, in 2010, Bell Aliant will maintain its performance-based culture by more closely aligning personal performance with corporate objectives. Building on current learning programs, it will aim to invest in new learning opportunities for its leaders and front-line managers.
2009 OPERATING HIGHLIGHTS
Our operating results for 2009 reflect improved year-over-year wireline performance, growing momentum in our TV business, disciplined execution of our wireless strategy, and diligent cost management that delivered strong earnings and substantial cash flow to support investment in the business, increases to BCE Inc.’s common share dividend and share buy-back programs. Top-line growth of 1.0% at Bell in 2009 was driven largely by the inclusion of revenues from the acquisitions of The Source and Virgin. Increased revenues from our TV, Internet, wireless data and IP broadband connectivity services also contributed to overall growth in 2009. The weak economy adversely impacted the revenue performance of our Business Markets unit in 2009, which experienced higher NAS line disconnections, fewer new installations, lower equipment sales, as well as reduced demand for basic connectivity service as business customers deferred spending and lowered usage. However, our residential business was less affected by the economic downturn and also effectively managed the competitive pressures of cable telephony, as evidenced by the year-over-year improvement in residential local line losses. Our home services bundling strategy, together with improvements in service delivery, helped reduce the total number of residential NAS losses by 13% in 2009, while contributing to a 9% increase in ARPHH and higher TV and residential high-speed Internet net subscriber activations. Notwithstanding strong postpaid subscriber growth, higher wireless data usage and the additional revenues from owning 100% of Virgin, Bell Wireless operating revenues grew modestly in 2009, mainly as a result of lower voice usage and decreased roaming consistent with reduced travel, employment levels and discretionary spending in a soft economy. Although ARPU decreased in 2009, the year-over-year decline progressively improved in the second half of the year, providing some evidence that the economy is beginning to stabilize. Led by the performance of Bell Wireless, we enjoyed improved subscriber acquisitions in 2009 from our growth services, comprised primarily of wireless, video and high-speed Internet, despite weak economic conditions and competitive pressures across all product lines. Total wireless net activations increased 6.3% in 2009, supported by strong postpaid growth in the second half of the year. This result reflected the positive consumer response to our expanded lineup of mobile devices, driven largely by the launch of the new HSPA/HSPA+ network, the growing popularity of wireless Internet sticks, the attractiveness of our promotional offers, and better sales execution through our independent retail channels. Although postpaid net activations in 2009 were essentially unchanged compared with the previous year, we experienced improved postpaid subscriber acquisition momentum as the year progressed, highlighted by a 20% year-over-year increase in the second half of 2009. Postpaid subscriptions represented 89% of our total wireless net activations in 2009. Our Bell TV unit added 113,000 net video subscribers in 2009 compared with 30,000 in the previous year. Success was driven by strong direct and retail sales channel results as we continue to leverage our position as the industry leader in HD programming, as well as by increased customer subscriptions from MDUs. Video ARPU increased 6.5% in 2009, reflecting a shift in customer mix to HD and upgrades to premium programming packages. In a maturing Canadian Internet market, which has resulted in slower high-speed Internet subscriber growth for the overall industry and aggressive acquisition offers from the cable TV competitors, we added 38,000 net high-speed Internet subscribers in 2009. Although this represents 12,000 fewer new net subscriber activations compared with 2008, due to higher business customer deactivations as a result of the weak economy, our residential high-speed Internet net activations increased year over year. Improved residential sales were driven largely by our competitive product offers that are supported by full installation service and an increased number of customers using our FTTN network. Our residential local voice business continued to perform solidly, despite ongoing aggressive competition particularly from the cable operators, due mainly to a higher number of customer winbacks and effective marketing. Our residential services bundling strategy, together with improvements in service delivery, helped reduce the total

number of residential line losses by 12.6% in 2009, slowing the annual rate of residential NAS erosion to 7.9% in 2009 from 8.3% in 2008. However, total NAS losses at Bell increased 2.5% year over year due to a greater number of business access line disconnections and fewer new installations because of the economic slowdown, resulting in a business NAS erosion rate of 3.7% in 2009 compared with 1.7% in 2008.
30 BCE INC. 2009 ANNUAL REPORT MANAGEMENT’S DISCUSSION AND ANALYSIS
Operating income at Bell was 13.5% higher in 2009, due to lower restructuring and other charges and higher EBITDA. Bell’s EBITDA grew by 1.4% in 2009 as higher operating revenues and cost reductions more than offset higher pension expense, foreign exchange losses stemming from higher U.S. dollar hedge rates in 2009 on our U.S. dollar-denominated purchases, and increased sponsorship-related costs for the Vancouver Winter Olympics. EBITDA growth in 2009 also reflected the reversal of a liability for CRTC video broadcast licence fees in the amount of $54 million resulting from a settlement with the federal government. With the slower pace of erosion in our high-margin residential wireline business, disciplined execution of our wireless strategy, continued strong results at Bell TV and ongoing execution in our efficiency programs to reduce overall costs, Bell’s EBITDA margin remained essentially unchanged year over year at 38.1% in 2009 compared with 37.9% in 2008. Bell invested $2,390 million of capital in 2009, or 2.8% less than 2008, which corresponds to a capital intensity ratio of 15.9% of revenues compared with 16.5% in 2008. Capital expenditures in 2009 supported Bell’s strategic imperatives with a particular focus on completing the deployment of the HSPA/HSPA+ network and continuing to add fibre to our wireline broadband network. At year end, our FTTN broadband network reached more than 2.9 million homes. BCE’s operating revenues increased 0.4% in 2009 while EBITDA improved 1.2%, reflecting our disciplined focus on controlling costs in a challenging economic and competitive environment. BCE’s cash flow from operating activities was $4,884 million in 2009, down from $5,909 million in the previous year. Free cash flow(3) available to BCE Inc.’s common shareholders was $1,456 million in 2009 versus $1,689 million in 2008. The year-over-year decrease was due to higher pension plan contributions, including a $500 million voluntary contribution, and increased investment in working capital at Bell, partly offset by higher EBITDA, reduced capital spending and a decrease in restructuring cost payments. The $500 million voluntary cash contribution was made at the end of 2009 in respect of Bell Canada’s defined benefit pension plan, and is expected to improve our financial flexibility by reducing our overall future pension funding requirements as well as the volatility of that funding. Net earnings applicable to common shares for 2009 were $1,631 million, or $2.11 per share, compared with $819 million, or $1.02 per share, in 2008. The year-over-year increase in earnings was due mainly to asset write-downs in 2008 related to non-core investments, lower restructuring and other charges, the favourable resolution of uncertain tax positions, and gains on sales of non-core assets. Adjusted EPS increased 11.1% to $2.50 per common share in 2009 from $2.25 per common share, primarily as a result of the favourable resolution of uncertain tax positions, higher EBITDA, lower interest expense and fewer common shares outstanding due to share repurchases under BCE Inc.’s 2008/2009 NCIB program completed in May 2009. Some of our segments’ revenues vary slightly by season. Wireline segment revenues tend to be higher in the fourth quarter because of higher levels of voice and data equipment sales to business customers and higher consumer electronics sales at The Source during the holiday period. Our operating income can also vary by season. Wireless segment operating income tends to be lower in the fourth quarter due to higher subscriber acquisition costs associated with a higher number of new subscriber activations during the holiday season.
BCE INC. 2009 ANNUAL REPORT 31
MANAGEMENT’S DISCUSSION AND ANALYSIS
SELECTED ANNUAL AND QUARTERLY INFORMATION
Annual Financial Information
The following tables show selected consolidated financial data of BCE, prepared in accordance with Canadian generally accepted accounting principles (GAAP), for each year from 2005 to 2009. We discuss the factors that caused our results to vary over the past three years throughout this MD&A.
(3) Free cash flow is a non-GAAP financial measure. See Non-GAAP Financial Measures – Free cash flow in this MD&A for more details, including a reconciliation to the most comparable Canadian GAAP financial measure.
2009 2008 2007 2006 2005
OPERATIONS
Operating revenues 17,735 17,661 17,707 17,516 17,428 Cost of revenue, exclusive of depreciation and amortization (4,525) (4,389) (4,058 ) (3,945) (4,020) Selling, general and administrative expenses (6,121) (6,268) (6,658 ) (6,780) (6,568)
EBITDA(1) 7,089 7,004 6,991 6,791 6,840
Depreciation (2,595) (2,537) (2,547 ) (2,503) (2,505) Amortization of intangible assets (776) (727) (634 ) (612 ) (550) Restructuring and other (527) (871) (331 ) (354 ) (55 )
Operating income 3,191 2,869 3,479 3,322 3,730 Other (expense) income (18) (253) 2,406 (186 ) 13 Interest expense (723) (791) (859 ) (940 ) (934)
Pre-tax earnings from continuing operations 2,450 1,825 5,026 2,196 2,809 Income taxes (368) (469) (735 ) (78 ) (795) Non-controlling interest (333) (323) (332 ) (222 ) (192)
Earnings from continuing operations 1,749 1,033 3,959 1,896 1,822 Discontinued operations (11) (90 ) 98 111 139
Net earnings 1,738 943 4,057 2,007 1,961 Dividends on preferred shares (107) (124) (131 ) (70 ) (70 )
Net earnings applicable to common shares 1,631 819 3,926 1,937 1,891
Net earnings per common share Continuing operations – basic 2.12 1.13 4.76 2.12 1.89 Continuing operations – diluted 2.12 1.12 4.75 2.12 1.89 Net earnings – basic 2.11 1.02 4.88 2.25 2.04 Net earnings – diluted 2.11 1.01 4.87 2.25 2.04
Included in net earnings Net gains (losses) on investments
Continuing operations 48 (358) 2,125 419 33 Discontinued operations (7) (62 ) 123 106 (6 )
Restructuring and other (339) (572) (206 ) (222 ) (37 ) Cost incurred to form Bell Aliant – – – (42 ) – Adjusted net earnings(2) 1,929 1,811 1,884 1,676 1,901 Adjusted EPS(2) 2.50 2.25 2.34 1.95 2.05
Ratios EBITDA margin (%) 40.0% 39.7 % 39.5 % 38.8 % 39.2 % Operating margin (%) 18.0% 16.2 % 19.6 % 19.0 % 21.4 % Return on equity (%) 11.3% 5.6% 30.0 % 15.7 % 14.9 %
(1) EBITDA (earnings before interest, taxes, depreciation and amortization of intangible assets) is a non-GAAP financial measure. See Non-GAAP Financial Measures – EBITDA in this MD&A for more details, including a reconciliation to the most comparable Canadian GAAP financial measure.
(2) The terms Adjusted net earnings and Adjusted EPS are non-GAAP financial measures. See Non-GAAP Financial Measures – Adjusted net earnings in this MD&A for more details, including a reconciliation to the most comparable Canadian GAAP financial measures.
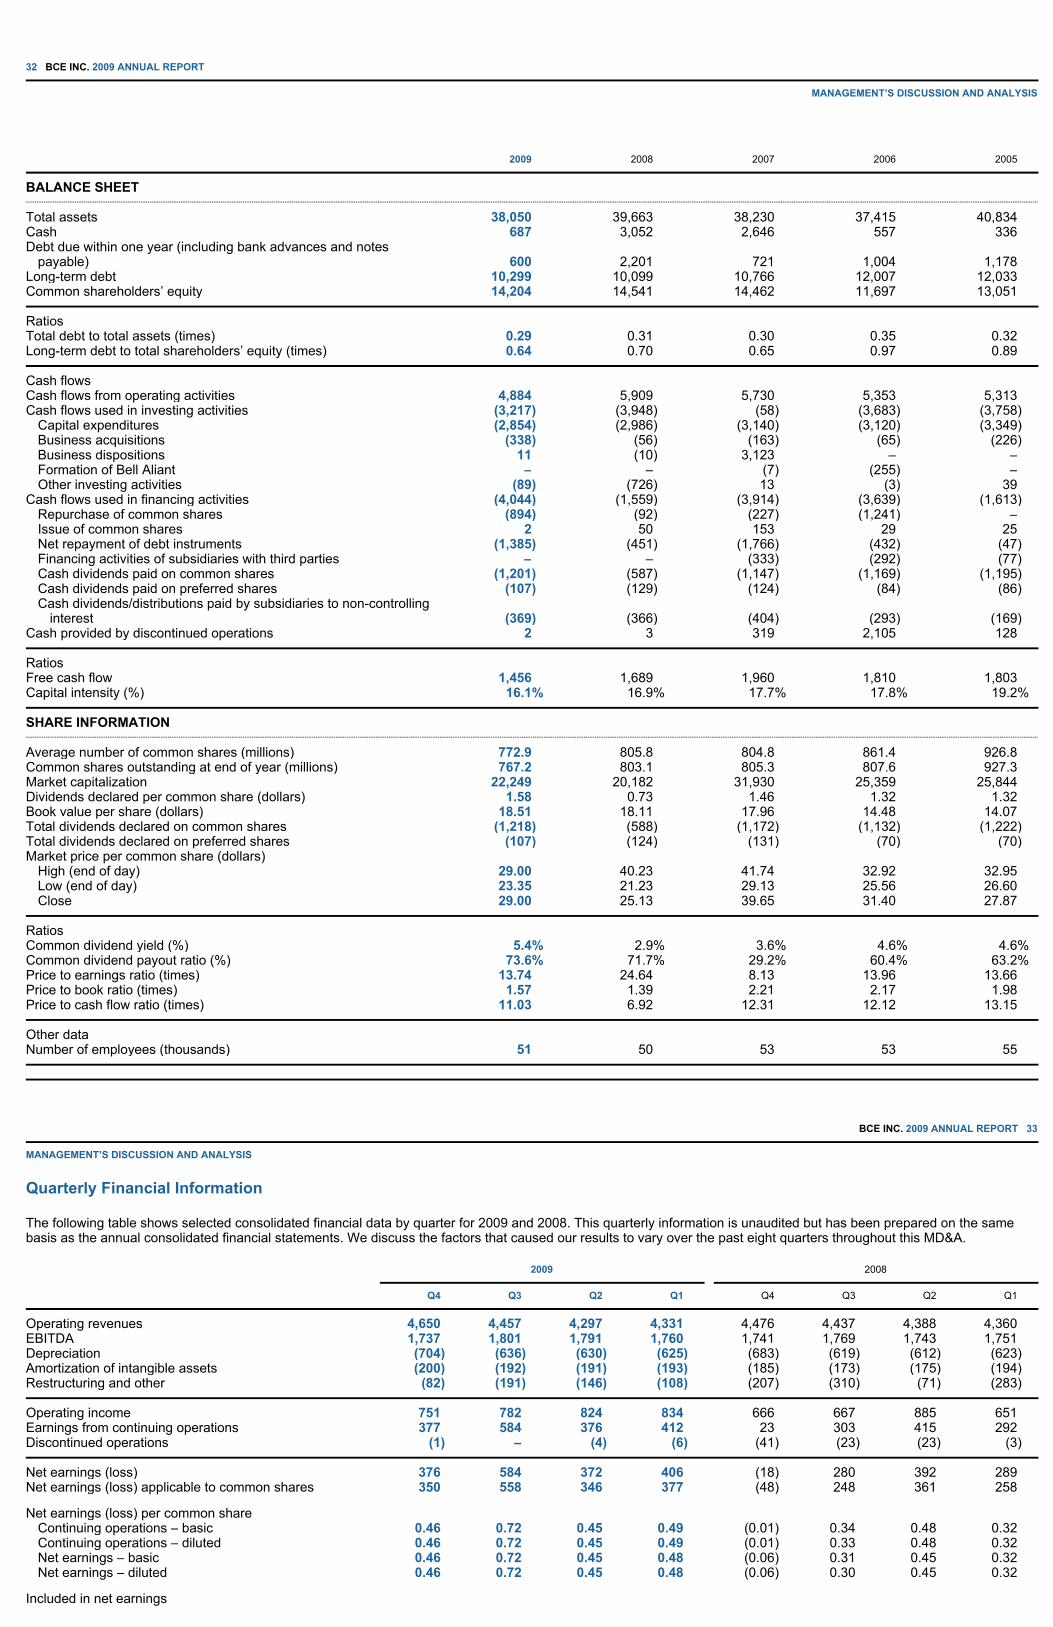
32 BCE INC. 2009 ANNUAL REPORT MANAGEMENT’S DISCUSSION AND ANALYSIS
BCE INC. 2009 ANNUAL REPORT 33
MANAGEMENT’S DISCUSSION AND ANALYSIS
Quarterly Financial Information
The following table shows selected consolidated financial data by quarter for 2009 and 2008. This quarterly information is unaudited but has been prepared on the same basis as the annual consolidated financial statements. We discuss the factors that caused our results to vary over the past eight quarters throughout this MD&A.
2009 2008 2007 2006 2005
BALANCE SHEET
Total assets 38,050 39,663 38,230 37,415 40,834 Cash 687 3,052 2,646 557 336 Debt due within one year (including bank advances and notes
payable) 600 2,201 721 1,004 1,178 Long-term debt 10,299 10,099 10,766 12,007 12,033 Common shareholders’ equity 14,204 14,541 14,462 11,697 13,051
Ratios Total debt to total assets (times) 0.29 0.31 0.30 0.35 0.32 Long-term debt to total shareholders’ equity (times) 0.64 0.70 0.65 0.97 0.89
Cash flows Cash flows from operating activities 4,884 5,909 5,730 5,353 5,313 Cash flows used in investing activities (3,217) (3,948) (58 ) (3,683) (3,758)
Capital expenditures (2,854) (2,986) (3,140 ) (3,120) (3,349) Business acquisitions (338) (56 ) (163 ) (65 ) (226) Business dispositions 11 (10 ) 3,123 – – Formation of Bell Aliant – – (7 ) (255 ) – Other investing activities (89) (726) 13 (3 ) 39
Cash flows used in financing activities (4,044) (1,559) (3,914 ) (3,639) (1,613) Repurchase of common shares (894) (92 ) (227 ) (1,241) – Issue of common shares 2 50 153 29 25 Net repayment of debt instruments (1,385) (451) (1,766 ) (432 ) (47 ) Financing activities of subsidiaries with third parties – – (333 ) (292 ) (77 ) Cash dividends paid on common shares (1,201) (587) (1,147 ) (1,169) (1,195) Cash dividends paid on preferred shares (107) (129) (124 ) (84 ) (86 ) Cash dividends/distributions paid by subsidiaries to non-controlling
interest (369) (366) (404 ) (293 ) (169) Cash provided by discontinued operations 2 3 319 2,105 128
Ratios Free cash flow 1,456 1,689 1,960 1,810 1,803 Capital intensity (%) 16.1% 16.9 % 17.7 % 17.8 % 19.2 %
SHARE INFORMATION
Average number of common shares (millions) 772.9 805.8 804.8 861.4 926.8 Common shares outstanding at end of year (millions) 767.2 803.1 805.3 807.6 927.3 Market capitalization 22,249 20,182 31,930 25,359 25,844 Dividends declared per common share (dollars) 1.58 0.73 1.46 1.32 1.32 Book value per share (dollars) 18.51 18.11 17.96 14.48 14.07 Total dividends declared on common shares (1,218) (588) (1,172 ) (1,132) (1,222) Total dividends declared on preferred shares (107) (124) (131 ) (70 ) (70 ) Market price per common share (dollars)
High (end of day) 29.00 40.23 41.74 32.92 32.95 Low (end of day) 23.35 21.23 29.13 25.56 26.60 Close 29.00 25.13 39.65 31.40 27.87
Ratios Common dividend yield (%) 5.4% 2.9% 3.6 % 4.6 % 4.6% Common dividend payout ratio (%) 73.6% 71.7 % 29.2 % 60.4 % 63.2 % Price to earnings ratio (times) 13.74 24.64 8.13 13.96 13.66 Price to book ratio (times) 1.57 1.39 2.21 2.17 1.98 Price to cash flow ratio (times) 11.03 6.92 12.31 12.12 13.15
Other data Number of employees (thousands) 51 50 53 53 55
2009 2008 Q4 Q3 Q2 Q1 Q4 Q3 Q2 Q1
Operating revenues 4,650 4,457 4,297 4,331 4,476 4,437 4,388 4,360 EBITDA 1,737 1,801 1,791 1,760 1,741 1,769 1,743 1,751 Depreciation (704) (636) (630) (625) (683 ) (619 ) (612) (623) Amortization of intangible assets (200) (192) (191) (193) (185 ) (173 ) (175) (194) Restructuring and other (82) (191) (146) (108) (207 ) (310 ) (71 ) (283)
Operating income 751 782 824 834 666 667 885 651 Earnings from continuing operations 377 584 376 412 23 303 415 292 Discontinued operations (1) – (4) (6) (41 ) (23 ) (23 ) (3 )
Net earnings (loss) 376 584 372 406 (18 ) 280 392 289 Net earnings (loss) applicable to common shares 350 558 346 377 (48 ) 248 361 258 Net earnings (loss) per common share
Continuing operations – basic 0.46 0.72 0.45 0.49 (0.01 ) 0.34 0.48 0.32 Continuing operations – diluted 0.46 0.72 0.45 0.49 (0.01 ) 0.33 0.48 0.32 Net earnings – basic 0.46 0.72 0.45 0.48 (0.06 ) 0.31 0.45 0.32 Net earnings – diluted 0.46 0.72 0.45 0.48 (0.06 ) 0.30 0.45 0.32
Included in net earnings
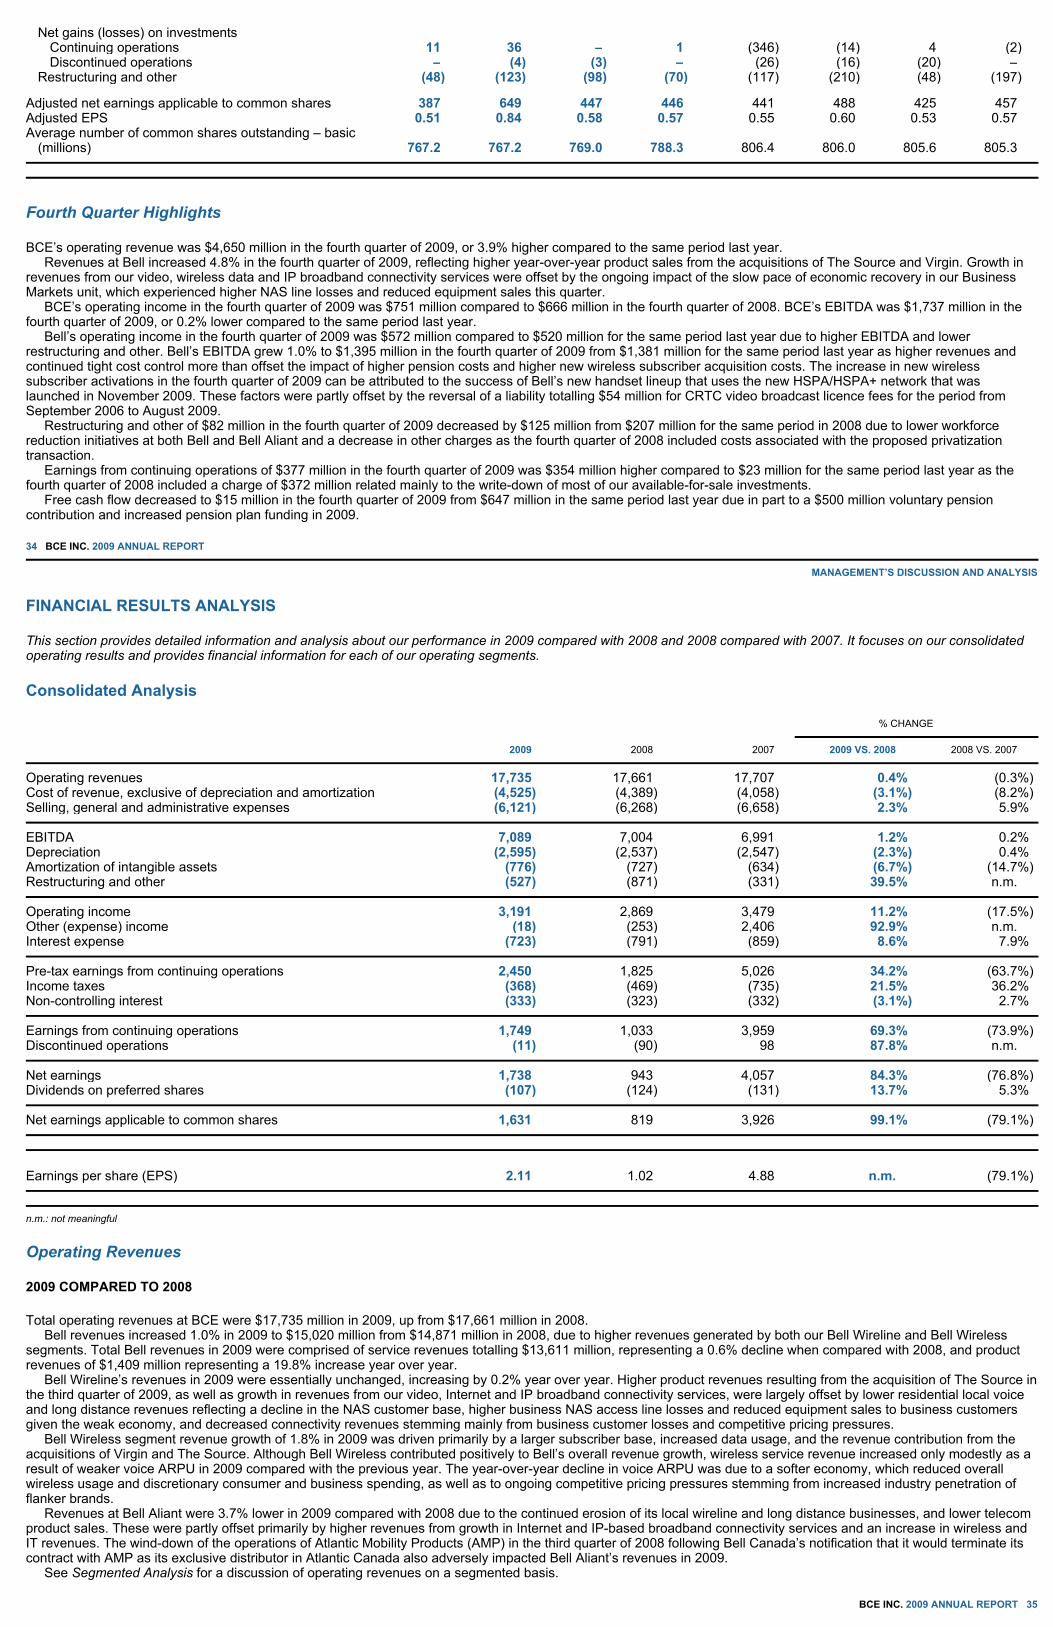
Fourth Quarter Highlights
BCE’s operating revenue was $4,650 million in the fourth quarter of 2009, or 3.9% higher compared to the same period last year. Revenues at Bell increased 4.8% in the fourth quarter of 2009, reflecting higher year-over-year product sales from the acquisitions of The Source and Virgin. Growth in revenues from our video, wireless data and IP broadband connectivity services were offset by the ongoing impact of the slow pace of economic recovery in our Business Markets unit, which experienced higher NAS line losses and reduced equipment sales this quarter. BCE’s operating income in the fourth quarter of 2009 was $751 million compared to $666 million in the fourth quarter of 2008. BCE’s EBITDA was $1,737 million in the fourth quarter of 2009, or 0.2% lower compared to the same period last year. Bell’s operating income in the fourth quarter of 2009 was $572 million compared to $520 million for the same period last year due to higher EBITDA and lower restructuring and other. Bell’s EBITDA grew 1.0% to $1,395 million in the fourth quarter of 2009 from $1,381 million for the same period last year as higher revenues and continued tight cost control more than offset the impact of higher pension costs and higher new wireless subscriber acquisition costs. The increase in new wireless subscriber activations in the fourth quarter of 2009 can be attributed to the success of Bell’s new handset lineup that uses the new HSPA/HSPA+ network that was launched in November 2009. These factors were partly offset by the reversal of a liability totalling $54 million for CRTC video broadcast licence fees for the period from September 2006 to August 2009. Restructuring and other of $82 million in the fourth quarter of 2009 decreased by $125 million from $207 million for the same period in 2008 due to lower workforce reduction initiatives at both Bell and Bell Aliant and a decrease in other charges as the fourth quarter of 2008 included costs associated with the proposed privatization transaction. Earnings from continuing operations of $377 million in the fourth quarter of 2009 was $354 million higher compared to $23 million for the same period last year as the fourth quarter of 2008 included a charge of $372 million related mainly to the write-down of most of our available-for-sale investments. Free cash flow decreased to $15 million in the fourth quarter of 2009 from $647 million in the same period last year due in part to a $500 million voluntary pension contribution and increased pension plan funding in 2009.
34 BCE INC. 2009 ANNUAL REPORT MANAGEMENT’S DISCUSSION AND ANALYSIS
FINANCIAL RESULTS ANALYSIS
This section provides detailed information and analysis about our performance in 2009 compared with 2008 and 2008 compared with 2007. It focuses on our consolidated operating results and provides financial information for each of our operating segments.
Consolidated Analysis
n.m.: not meaningful
Operating Revenues
2009 COMPARED TO 2008
Total operating revenues at BCE were $17,735 million in 2009, up from $17,661 million in 2008. Bell revenues increased 1.0% in 2009 to $15,020 million from $14,871 million in 2008, due to higher revenues generated by both our Bell Wireline and Bell Wireless segments. Total Bell revenues in 2009 were comprised of service revenues totalling $13,611 million, representing a 0.6% decline when compared with 2008, and product revenues of $1,409 million representing a 19.8% increase year over year. Bell Wireline’s revenues in 2009 were essentially unchanged, increasing by 0.2% year over year. Higher product revenues resulting from the acquisition of The Source in the third quarter of 2009, as well as growth in revenues from our video, Internet and IP broadband connectivity services, were largely offset by lower residential local voice and long distance revenues reflecting a decline in the NAS customer base, higher business NAS access line losses and reduced equipment sales to business customers given the weak economy, and decreased connectivity revenues stemming mainly from business customer losses and competitive pricing pressures. Bell Wireless segment revenue growth of 1.8% in 2009 was driven primarily by a larger subscriber base, increased data usage, and the revenue contribution from the acquisitions of Virgin and The Source. Although Bell Wireless contributed positively to Bell’s overall revenue growth, wireless service revenue increased only modestly as a result of weaker voice ARPU in 2009 compared with the previous year. The year-over-year decline in voice ARPU was due to a softer economy, which reduced overall wireless usage and discretionary consumer and business spending, as well as to ongoing competitive pricing pressures stemming from increased industry penetration of flanker brands. Revenues at Bell Aliant were 3.7% lower in 2009 compared with 2008 due to the continued erosion of its local wireline and long distance businesses, and lower telecom product sales. These were partly offset primarily by higher revenues from growth in Internet and IP-based broadband connectivity services and an increase in wireless and IT revenues. The wind-down of the operations of Atlantic Mobility Products (AMP) in the third quarter of 2008 following Bell Canada’s notification that it would terminate its contract with AMP as its exclusive distributor in Atlantic Canada also adversely impacted Bell Aliant’s revenues in 2009. See Segmented Analysis for a discussion of operating revenues on a segmented basis.
BCE INC. 2009 ANNUAL REPORT 35
Net gains (losses) on investments Continuing operations 11 36 – 1 (346 ) (14 ) 4 (2 ) Discontinued operations – (4) (3) – (26 ) (16 ) (20 ) –
Restructuring and other (48) (123) (98) (70) (117 ) (210 ) (48 ) (197) Adjusted net earnings applicable to common shares 387 649 447 446 441 488 425 457 Adjusted EPS 0.51 0.84 0.58 0.57 0.55 0.60 0.53 0.57 Average number of common shares outstanding – basic
(millions) 767.2 767.2 769.0 788.3 806.4 806.0 805.6 805.3
% CHANGE 2009 2008 2007 2009 VS. 2008 2008 VS. 2007
Operating revenues 17,735 17,661 17,707 0.4% (0.3 %) Cost of revenue, exclusive of depreciation and amortization (4,525) (4,389) (4,058 ) (3.1%) (8.2 %) Selling, general and administrative expenses (6,121) (6,268) (6,658 ) 2.3% 5.9%
EBITDA 7,089 7,004 6,991 1.2% 0.2% Depreciation (2,595) (2,537) (2,547 ) (2.3%) 0.4% Amortization of intangible assets (776) (727) (634 ) (6.7%) (14.7%) Restructuring and other (527) (871) (331 ) 39.5% n.m.
Operating income 3,191 2,869 3,479 11.2% (17.5%) Other (expense) income (18) (253) 2,406 92.9% n.m. Interest expense (723) (791) (859 ) 8.6% 7.9%
Pre-tax earnings from continuing operations 2,450 1,825 5,026 34.2% (63.7%) Income taxes (368) (469) (735 ) 21.5% 36.2 % Non-controlling interest (333) (323) (332 ) (3.1%) 2.7%
Earnings from continuing operations 1,749 1,033 3,959 69.3% (73.9%) Discontinued operations (11) (90 ) 98 87.8% n.m.
Net earnings 1,738 943 4,057 84.3% (76.8%) Dividends on preferred shares (107) (124) (131 ) 13.7% 5.3%
Net earnings applicable to common shares 1,631 819 3,926 99.1% (79.1%)
Earnings per share (EPS) 2.11 1.02 4.88 n.m. (79.1%)

MANAGEMENT’S DISCUSSION AND ANALYSIS
2008 COMPARED TO 2007
Total operating revenues at BCE were $17,661 million in 2008, compared with $17,707 million in 2007. Despite higher revenues at Bell, the year-over-year decrease in total operating revenues was attributable primarily to the sale of Telesat on October 31, 2007, which contributed revenues of $458 million in 2007. Lower revenues at Bell Aliant also contributed to the annual decline in total operating revenues at BCE. Bell’s revenues grew 1.6% to $14,871 million in 2008 from $14,643 million in 2007. The year-over-year increase was driven by revenue growth of 7.9% at Bell Wireless, reflecting the combined impact of a larger subscriber base, greater data usage and increased roaming revenues. This increase was partly offset by a 0.7% decline at our Bell Wireline segment brought about largely by the loss of residential local voice and long distance business to alternative service providers, competitive pressures in our wholesale business, and lower overall product sales consistent with our continued focus on not pursuing low-margin business. Growth in revenues from video, Internet, IP broadband connectivity and ICT services moderated the year-over-year decline in Bell Wireline’s revenues in 2008. Revenues at Bell Aliant were 0.5% lower in 2008 compared with the previous year, due mainly to the wind-down in the operations of AMP in the third quarter of 2008, as well as to continued erosion of its local wireline and long distance businesses. This was largely offset by the increase in revenues from growth in data (including Internet), wireless and IT revenues. See Segmented Analysis for a discussion of operating revenues on a segmented basis.
Operating Expenses
2009 COMPARED TO 2008
Operating expenses for BCE were virtually unchanged in 2009, decreasing 0.1% to $10,646 million from $10,657 million in 2008. The year-over-year improvement was due to lower selling, general and administrative expenses, offset partly by higher cost of revenue. Cost of revenue was $4,525 million in 2009, up 3.1% when compared to $4,389 million last year. The increase in cost of revenue can be attributed mainly to higher product costs, consistent with growth in total product revenues, due to the acquisitions of The Source and Virgin. Higher costs associated with increased wireless data usage and more mobile data content, higher cost of service at Bell TV from a larger subscriber base and increased programming costs, as well as higher U.S. dollar hedge rates in 2009 on our U.S. dollar-denominated purchases of wireless devices, video STBs and cross-border exchange traffic, also contributed to the year-over-year increase in cost of revenue. These factors were partly offset by the reversal of a liability totalling $54 million for CRTC video broadcast licence fees for the period from September 2006 to August 2009, lower wireless network expenses, as well as by decreased payments to other carriers resulting from reduced rates and lower volumes settled on other carriers’ networks. In addition, 2008 cost of revenue was adversely affected by a $31 million charge related to the Federal Court of Appeal’s decision in early 2008 in respect of CRTC video broadcast licence fees for the period from September 2006 to June 2008 and a $28 million charge for a loss on a long-term large business customer contract. Selling, general and administrative expenses include salaries, wages and benefits not directly attributable to a service or a product, net benefit plans cost, bad debt expense, taxes other than income, marketing, advertising and sales commission costs, customer billing, call centre and IT costs, professional service fees and rent. Selling, general and administrative expenses decreased 2.3% to $6,121 million in 2009 from $6,268 million in 2008. The year-over-year improvement was the result of:
lower labour costs due to a reduced workforce (excluding the impact of acquisitions), decreased use of consultants and contractors, and a cutback in outsourced labour resulting mainly from reduced call centre volumes and IT project-related activity lower wireless subscriber acquisition costs and retention spending decreased wireless sales promotion and advertising expenses reduced discretionary spending in areas such as travel and entertainment the adverse impact in 2008 from a $14 million net charge associated with the termination of Bell Internet’s PC equipment sales program.
These factors were partly offset by a number of cost increases at Bell in 2009, including:
increased customer care costs, including increased warranty and repair costs, as a result of supporting more sophisticated wireless devices and mobile services higher operating expenses from the consolidation of The Source and Virgin in our results higher net benefit plans cost.
2008 COMPARED TO 2007
Total operating expenses at BCE declined 0.6% in 2008 to $10,657 million from $10,716 million in 2007. The year-over-year improvement was due to lower selling, general and administrative expenses, offset partly by higher cost of revenue. Telesat contributed $195 million to total operating expenses in 2007 until its sale on October 31, 2007. Cost of revenue was $4,389 million in 2008, compared with $4,058 million in the previous year, representing a year-over-year increase of 8.2%. Higher cost of revenue was due primarily to increased wireless operating expenses to support a larger subscriber base and growth in data usage, higher wireless roaming costs, increased cost of product sales at Bell Wireless stemming from a higher proportion of higher-end data devices sold and more handset upgrades, higher operating costs at Bell TV, and increased sales of business ICT solutions. In addition, cost of revenue was adversely affected by a number of unusual items in 2008: a $31 million
36 BCE INC. 2009 ANNUAL REPORT MANAGEMENT’S DISCUSSION AND ANALYSIS
charge taken in the second quarter of 2008 related to the Federal Court of Appeal’s decision in early 2008 in respect of CRTC video broadcast licence fees for the period from September 2006 to June 2008, and a $28 million charge recorded in the fourth quarter of 2008 for a loss on a long-term large business customer contract. Higher cost of product sales at Bell Aliant, mainly from increased IT-related sales, also contributed to the increase in cost of revenue in 2008. These factors were partly offset by lower cost of product sales at Bell Wireline, driven primarily by reduced equipment sales under Bell Internet’s PC equipment sales program, which was terminated in the second quarter of 2008, as well as lower network termination costs from reduced southbound call traffic to the United States. Selling, general and administrative expenses decreased 5.9% to $6,268 million in 2008 from $6,658 million in 2007. The year-over-year improvement can be attributed mainly to:
lower labour costs at Bell from a reduced workforce lower wireless handset subsidies at Bell Mobility decreased bad debt expense resulting mainly from our ongoing focus on accounts receivable collections and cash flow reduced advertising costs and lower promotional spending cost containment initiatives at Bell and Bell Aliant lower net benefit plans cost the adverse impact in 2008 from a $14 million net charge associated with the termination of Bell Internet’s PC equipment sales program.
Operating Income
2009 COMPARED TO 2008
BCE’s operating income was $3,191 million in 2009, compared with $2,869 million in 2008. The year-over-year increase was due primarily to higher restructuring and other charges in 2008 totalling $871 million, which included amounts recorded for involuntary workforce reduction initiatives, the relocation of employees and closing of real estate facilities that are no longer needed as a result of a reduced workforce, the CRTC’s decision in the first quarter of 2008 to approve the use of a portion of the deferral account funds for the uneconomic expansion of broadband service, and costs associated with the proposed privatization of BCE Inc. This compared with restructuring and other items of $527 million in 2009, reflecting amounts for voluntary and involuntary workforce reduction initiatives, including a retirement incentive for unionized employees, the consolidation of employees to campus environments, and a charge recorded as a result of a Supreme Court of Canada ruling relating to the use of Bell’s remaining deferral account balance with the CRTC. Operating income before restructuring and other(4) for BCE in 2009 was $3,718 million, down 0.6% as compared with $3,740 million in 2008. The year-over-year decrease was attributable mainly to lower operating income before restructuring and other items at Bell. At Bell, operating income in 2009 totalled $2,432 million, up from $2,143 million in 2008, due to lower restructuring and other costs year over year. Bell’s operating income before restructuring and other was $2,915 million in 2009, down 1.3% from $2,953 million in 2008. The year-over-year decrease was the result of higher net benefit plans cost and increased depreciation and amortization expense, offset partly by lower operating expenses and higher operating revenues as previously described. Higher operating income at Bell Aliant also positively contributed to overall operating income at BCE in 2009. Bell Aliant’s operating income amounted to $759 million, up 4.5% from $726 million in 2008. The year-over-year increase was due mainly to lower operating expenses driven largely by the positive impact of cost containment initiatives such as workforce reductions and tight control over discretionary expenses, offset partly by lower operating revenues. See Segmented Analysis for a discussion of operating income on a segmented basis.

2008 COMPARED TO 2007
BCE’s operating income was $2,869 million in 2008, compared with $3,479 million in 2007. The year-over-year decline was due mainly to lower operating income at Bell, resulting largely from higher restructuring and other charges in 2008 as described above, and to the reduction in operating income as a result of the sale of Telesat on October 31, 2007. Telesat contributed $157 million of operating income to BCE’s results in 2007. Higher operating income at Bell Aliant, driven mainly by lower net benefit plans cost and cost containment initiatives, moderated the year-over-year decrease in BCE’s operating income in 2008. Operating income at Bell totalled $2,143 million in 2008, down from $2,652 million in 2007. The results for 2008 included restructuring and other charges totalling $810 million, compared with restructuring and other charges of $308 million in 2007. Bell’s operating income before restructuring and other in 2008 was $2,953 million, down 0.2% from $2,960 million in 2007. The year-over-year decrease was driven mainly by higher operating expenses primarily at our Bell Wireless segment, increased depreciation and amortization expense, as well as by the adverse impact of a number of unusual items, which included a $31 million charge recorded in the second quarter of 2008 related to the Federal Court of Appeal’s decision in respect of CRTC video broadcast licence fees for the period from September 2006 to June 2008; a $14 million charge related to a write-down of assets associated with the termination of Bell Internet’s PC equipment sales program in the second quarter of 2008; and a $28 million charge recorded in the fourth quarter of 2008 for a loss on a long-term large business customer contract. Higher operating revenues and lower net benefit plans cost moderated the decline in Bell’s operating income in 2008.
BCE INC. 2009 ANNUAL REPORT 37
MANAGEMENT’S DISCUSSION AND ANALYSIS
See Segmented Analysis for a discussion of operating income on a segmented basis.
EBITDA
2009 COMPARED TO 2008
EBITDA at BCE increased 1.2% in 2009 to $7,089 million from $7,004 million in 2008. BCE’s EBITDA margin in 2009 increased to 40.0% from 39.7% in 2008, reflecting higher revenues, year over year, and tight control over operating expenses. Bell’s EBITDA was $5,719 million in 2009, up 1.4% from $5,638 million in 2008. This corresponds to an EBITDA margin of 38.1%, representing a 0.2 percentage point improvement over 2008. The year-over-year increase was driven by higher EBITDA at both our Bell Wireline and Bell Wireless segments, despite higher net benefit plans cost and the acquisition of a greater number of new wireless and TV subscribers compared with 2008. Bell Wireless’s EBITDA increased 2.4% in 2009, despite modest year-over-year revenue growth and higher cost of product sales, mainly as a result of reduced network expenses, decreased roaming costs, lower subscriber acquisition costs, reduced marketing and advertising expenses, and controlled customer retention and handset upgrade spending. EBITDA at our Bell Wireline segment increased 1.0% in 2009, due primarily to a decline in overall labour costs attributable to a reduced workforce and strict management of selling, general and administrative costs. The reversal of a liability totalling $54 million for CRTC video broadcast licence fees for the three years ended August 31, 2009 also contributed to higher EBITDA at Bell in 2009. The ongoing decrease in higher-margin legacy voice and data revenues, increased net benefit plans cost, foreign exchange losses on our U.S. dollar-denominated purchases stemming from higher U.S. dollar hedge rates in 2009, and increased expenses related to our sponsorship of the Vancouver Winter Olympics partly offset the year-over-year EBITDA improvement. In addition, 2008 EBITDA was adversely affected by a $31 million charge related to the Federal Court of Appeal’s decision in early 2008 in respect of CRTC video broadcast licence fees for the period from September 2006 to June 2008, a $28 million charge for a loss on a long-term large business customer contract and a $14 million net charge associated with the termination of Bell Internet’s PC equipment sales program. Bell Aliant’s EBITDA in 2009 was consistent with 2008, increasing by 0.3%. Reduced operating expenses were offset largely by lower operating revenues. Higher net benefit plans cost had an adverse impact on Bell’s EBITDA in 2009. Net benefit plans cost at Bell totalled $263 million in 2009, representing an increase of 58%, compared with $166 million in 2008. The year-over-year increase was due to a lower expected return on plan assets, prior period gains that were fully amortized in 2008 and higher amortization of actuarial losses, offset partly by a higher discount rate. Net benefit plans cost at Bell Aliant increased year over year to $92 million in 2009 from $84 million in 2008. Accordingly, net benefit plans cost for BCE increased to $355 million in 2009 from $250 million in the previous year.
2008 COMPARED TO 2007
EBITDA at BCE increased 0.2% to $7,004 million in 2008 from $6,991 million in 2007, due to higher EBITDA at both Bell and Bell Aliant. The sale of Telesat on October 31, 2007 that resulted in no EBITDA being recorded for Telesat in our consolidated results in 2008, compared with $263 million in 2007 largely offset the year-over-year improvement. Bell’s EBITDA totalled $5,638 million in 2008, up 2.2% compared with $5,519 million in 2007. The increase was driven by higher EBITDA at Bell Wireless, while EBITDA at our Bell Wireline segment remained relatively unchanged. Bell Wireless’s EBITDA growth in 2008 was driven primarily by higher revenues and lower subscriber acquisition costs, which more than offset the negative impact of higher cost of revenue and increased customer retention and handset upgrade spending resulting from a larger subscriber base year over year. EBITDA at our Bell Wireline segment was fairly constant year over year as the loss of higher-margin legacy voice and data revenues was offset by increased revenues from growth services, lower labour costs due mainly to a reduced workforce, careful control over selling, general and administrative costs, and lower net benefit plans cost. Bell’s EBITDA was also adversely impacted in 2008 by three unusual items: a $31 million charge in respect of CRTC video broadcast licence fees, a $14 million charge related to the termination of Bell Internet’s PC equipment sales program and a $28 million charge related to a loss on a long-term large business customer contract. Bell Aliant’s EBITDA increased 5.4% in 2008. The improvement was mainly the result of higher revenues and lower net benefit plans cost, partly offset by higher cost of revenue related to increased product sales and higher labour costs due to increased IT service contract labour and annual wage increases. Lower net benefit plans cost had a positive impact on EBITDA for all of BCE’s segments in 2008. Net benefit plans cost totalled $250 million in 2008, representing a 39% decrease compared with $410 million in 2007. The year-over-year decline was due primarily to lower amortization of actuarial losses, driven by a higher discount rate, the impact of prior period gains, a greater asset base and the reversal of a valuation allowance at Bell Aliant, partly offset by a lower return on plan assets.
Depreciation and Amortization of Intangible Assets
The amount of our depreciation and amortization of intangible assets in any year is affected by:
how much we invested in new capital assets in previous years how many assets we retired during the year changes in accounting rules and estimates.
38 BCE INC. 2009 ANNUAL REPORT MANAGEMENT’S DISCUSSION AND ANALYSIS
DEPRECIATION
Depreciation of $2,595 million in 2009 represented an increase of $58 million, or 2.3%, compared to $2,537 million in 2008. The increase was due to a higher asset base and asset write-downs and depreciation adjustments, partly offset by charges in 2008 of $12 million as a result of an impairment of certain fixed assets and $7 million at Bell Aliant on the finalization of the purchase price allocation related to its privatization of the Bell Nordiq Income Fund (Bell Nordiq). Depreciation of $2,537 million in 2008 decreased $10 million, or 0.4%, compared to $2,547 million in 2007. The $10 million decrease reflected a decrease of $62 million from the sale of Telesat offset by an increase of $52 million, or 2.1%, from our continuing operations. The $52 million increase in 2008 was due to a higher asset base, lower asset retirements and the charges described in the previous paragraph.
AMORTIZATION OF INTANGIBLE ASSETS
Amortization of intangible assets in 2009 of $776 million increased $49 million, or 6.7%, compared to $727 million in 2008 and $93 million, or 14.7%, compared to $634 million in 2007. The increases resulted from our continued investment in finite-life intangible assets. In 2008, we incurred charges of $11 million for an impairment of certain intangible assets and $9 million at Bell Aliant related to its privatization of Bell Nordiq. Both of these charges contributed to the increase in amortization of intangible assets in 2008.
Restructuring and Other
(4) Operating income before restructuring and other is a non-GAAP financial measure. See Non-GAAP Financial Measures – Operating income before restructuring and other in this MD&A for more details, including a reconciliation to the most comparable Canadian GAAP financial measure.

This category includes various income and expenses that are not directly related to the operating revenues generated during the year.
2009
We recorded restructuring and other charges of $527 million in 2009. These 2009 charges included:
charges related to voluntary and involuntary workforce reduction initiatives of $219 million at Bell and $41 million at Bell Aliant charges of $80 million at Bell for relocating employees and closing real estate facilities that are no longer needed other charges of $187 million primarily related to the Supreme Court of Canada decision rendered in September 2009 to uphold the CRTC’s decision that the funds remaining in our deferral account could be used for broadband expansion or returned to our customers. In light of this ruling, we recorded a charge of $152 million for the years 2002 to 2006, which reflects our estimate of the remaining amount of our deferral account commitment. Our commitment under the deferral account is fully accrued in the financial statements.
2008
We recorded restructuring and other charges of $871 million in 2008. These included:
charges related to involuntary workforce reduction initiatives of $274 million at Bell and $61 million at Bell Aliant charges of $81 million for real estate costs of which $32 million related to relocating employees and closing real estate facilities that are no longer needed because of workforce reduction initiatives and $49 million related to the relocation to campus environments charges of $455 million related to a charge of $236 million for the CRTC’s decision to approve the use of the deferral account funds for the uneconomic expansion of our broadband network, $187 million for employee retention costs, and other financial advisory, professional and consulting costs associated with the proposed privatization transaction and costs related to Bell’s rebranding.
2007
We recorded restructuring and other charges of $331 million in 2007. These included:
charges related to voluntary and involuntary workforce reduction initiatives of $63 million at Bell and $27 million at Bell Aliant charges of $77 million for real estate costs of which $61 million related to relocating employees and closing real estate facilities that are no longer needed because of workforce reduction initiatives and $16 million related to the relocation to campus environments charges of $164 million related to employee retention costs, other financial advisory, professional and consulting costs associated with the proposed privatization transaction and a charge of $37 million for uneconomic broadband expansion approved by the CRTC.
Other (Expense) Income
Other (expense) income includes expenses and income that we incur and receive from activities that are not part of our main business operations, such as:
net gains or losses on investments, including gains or losses when we dispose of, write down or reduce our ownership in investments foreign currency gains and losses interest income on cash and cash equivalents other miscellaneous income or expense.
2009
Other expense of $18 million in 2009 included premiums paid on the early redemption of debt of $45 million, partly offset by gains on investments.
BCE INC. 2009 ANNUAL REPORT 39
MANAGEMENT’S DISCUSSION AND ANALYSIS
2008
Other expense of $253 million in 2008 included losses on investments of $308 million in 2008 from the write-down of most of our available-for-sale investments, partly offset by interest income on investments.
2007
Other income of $2,406 million in 2007 included a $2,300 million gain on the sale of Telesat in October 2007 and a $92 million dilution gain resulting from an issuance of units by Bell Aliant, in conjunction with its privatization of Bell Nordiq.
Interest Expense
2009 COMPARED TO 2008
Interest expense of $723 million in 2009 represented a decrease of $68 million, or 8.6%, compared to $791 million for the same period last year as a result of interest capitalized on spectrum licences not yet in use and lower interest rates on debt, partly offset by higher average debt levels.
2008 COMPARED TO 2007
In 2008, interest expense of $791 million decreased $68 million, or 7.9%, compared to interest expense of $859 million in 2007. The decrease was the result of lower average debt balances and refinancing debt at lower interest rates.
Income Taxes
2009 COMPARED TO 2008
Income taxes of $368 million represented a decrease of $101 million, or 21.5%, compared to $469 million for the same period last year as a result of the resolution of uncertain tax positions, higher depreciation and amortization expense and a decrease in the Ontario income tax rate at the end of 2009. This was partly offset by higher EBITDA and lower restructuring and other expense. As a result, the effective tax rate decreased to 15.0% in 2009 compared to 25.7% in 2008.
2008 COMPARED TO 2007
Income taxes of $469 million in 2008 decreased $266 million, or 36%, compared to $735 million in 2007. In 2008, lower pre-tax earnings due to higher restructuring charges contributed to the lower tax expense as well as a decrease in the statutory tax rate in 2008. Income taxes in 2007 included $407 million of tax expense on the gain on sale of Telesat. This was partly offset by the reversal of a tax liability due to the settlement of an uncertain tax position in connection with the sale of an investment in a prior year, as well as the non-taxable dilution gain from the issuance of units by Bell Aliant in conjunction with the privatization of Bell Nordiq. As a result, the effective tax rate increased to 25.7% in 2008 compared to 14.6% in 2007.
Discontinued Operations
In 2009, we incurred a net loss from discontinued operations of $11 million as compared to $90 million in 2008. The net loss in 2008 was due mainly to losses incurred and asset impairments related to our decisions to cease operations or to sell certain of our businesses, including our investment in Expertech Network Installation (U.S.) Inc. (Expertech US). A loss of $15 million was recorded in 2008 in anticipation of the sale of Expertech US. In 2009, we ceased the operations of Expertech US. The net gain from discontinued operations of $98 million in 2007 related mainly to Bell Aliant’s gain on sale of its directory business, Aliant Directory Services (ADS), of
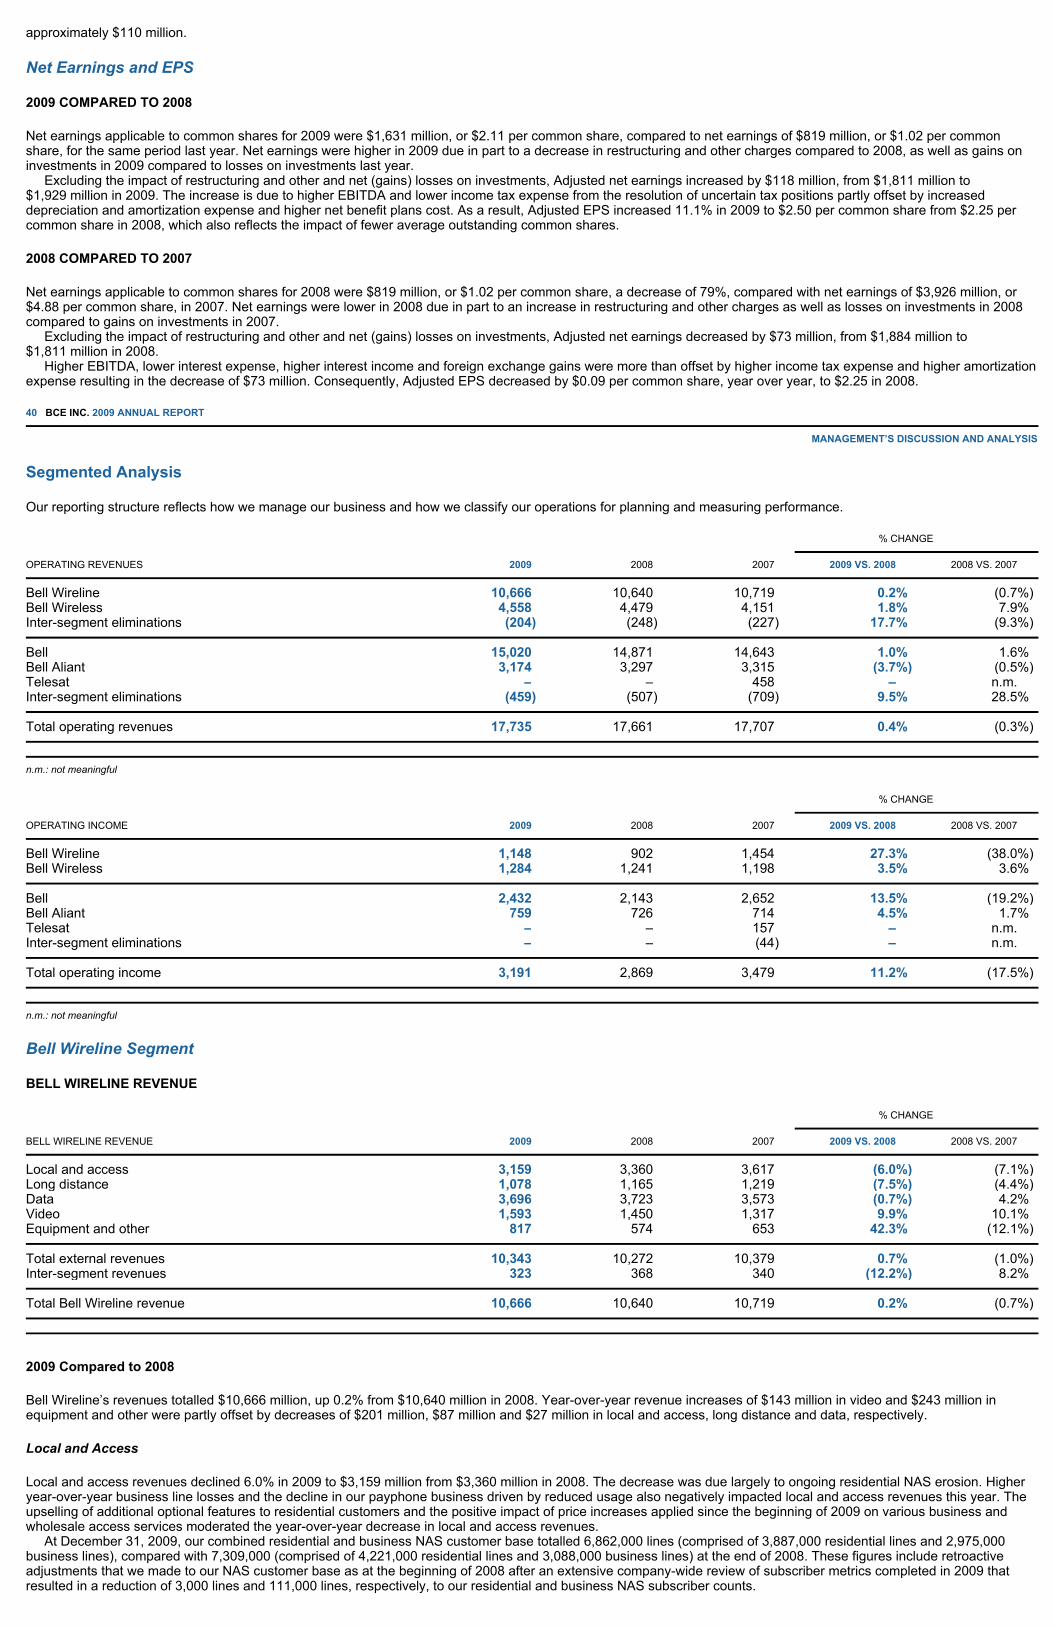
approximately $110 million.
Net Earnings and EPS
2009 COMPARED TO 2008
Net earnings applicable to common shares for 2009 were $1,631 million, or $2.11 per common share, compared to net earnings of $819 million, or $1.02 per common share, for the same period last year. Net earnings were higher in 2009 due in part to a decrease in restructuring and other charges compared to 2008, as well as gains on investments in 2009 compared to losses on investments last year. Excluding the impact of restructuring and other and net (gains) losses on investments, Adjusted net earnings increased by $118 million, from $1,811 million to $1,929 million in 2009. The increase is due to higher EBITDA and lower income tax expense from the resolution of uncertain tax positions partly offset by increased depreciation and amortization expense and higher net benefit plans cost. As a result, Adjusted EPS increased 11.1% in 2009 to $2.50 per common share from $2.25 per common share in 2008, which also reflects the impact of fewer average outstanding common shares.
2008 COMPARED TO 2007
Net earnings applicable to common shares for 2008 were $819 million, or $1.02 per common share, a decrease of 79%, compared with net earnings of $3,926 million, or $4.88 per common share, in 2007. Net earnings were lower in 2008 due in part to an increase in restructuring and other charges as well as losses on investments in 2008 compared to gains on investments in 2007. Excluding the impact of restructuring and other and net (gains) losses on investments, Adjusted net earnings decreased by $73 million, from $1,884 million to $1,811 million in 2008. Higher EBITDA, lower interest expense, higher interest income and foreign exchange gains were more than offset by higher income tax expense and higher amortization expense resulting in the decrease of $73 million. Consequently, Adjusted EPS decreased by $0.09 per common share, year over year, to $2.25 in 2008.
40 BCE INC. 2009 ANNUAL REPORT MANAGEMENT’S DISCUSSION AND ANALYSIS
Segmented Analysis
Our reporting structure reflects how we manage our business and how we classify our operations for planning and measuring performance.
n.m.: not meaningful
n.m.: not meaningful
Bell Wireline Segment
BELL WIRELINE REVENUE
2009 Compared to 2008
Bell Wireline’s revenues totalled $10,666 million, up 0.2% from $10,640 million in 2008. Year-over-year revenue increases of $143 million in video and $243 million in equipment and other were partly offset by decreases of $201 million, $87 million and $27 million in local and access, long distance and data, respectively.
Local and Access
Local and access revenues declined 6.0% in 2009 to $3,159 million from $3,360 million in 2008. The decrease was due largely to ongoing residential NAS erosion. Higher year-over-year business line losses and the decline in our payphone business driven by reduced usage also negatively impacted local and access revenues this year. The upselling of additional optional features to residential customers and the positive impact of price increases applied since the beginning of 2009 on various business and wholesale access services moderated the year-over-year decrease in local and access revenues. At December 31, 2009, our combined residential and business NAS customer base totalled 6,862,000 lines (comprised of 3,887,000 residential lines and 2,975,000 business lines), compared with 7,309,000 (comprised of 4,221,000 residential lines and 3,088,000 business lines) at the end of 2008. These figures include retroactive adjustments that we made to our NAS customer base as at the beginning of 2008 after an extensive company-wide review of subscriber metrics completed in 2009 that resulted in a reduction of 3,000 lines and 111,000 lines, respectively, to our residential and business NAS subscriber counts.
% CHANGE OPERATING REVENUES 2009 2008 2007 2009 VS. 2008 2008 VS. 2007
Bell Wireline 10,666 10,640 10,719 0.2% (0.7 %) Bell Wireless 4,558 4,479 4,151 1.8% 7.9% Inter-segment eliminations (204) (248) (227 ) 17.7% (9.3 %)
Bell 15,020 14,871 14,643 1.0% 1.6% Bell Aliant 3,174 3,297 3,315 (3.7%) (0.5 %) Telesat – – 458 – n.m. Inter-segment eliminations (459) (507) (709 ) 9.5% 28.5 %
Total operating revenues 17,735 17,661 17,707 0.4% (0.3 %)
% CHANGE OPERATING INCOME 2009 2008 2007 2009 VS. 2008 2008 VS. 2007
Bell Wireline 1,148 902 1,454 27.3% (38.0%) Bell Wireless 1,284 1,241 1,198 3.5% 3.6%
Bell 2,432 2,143 2,652 13.5% (19.2%) Bell Aliant 759 726 714 4.5% 1.7% Telesat – – 157 – n.m. Inter-segment eliminations – – (44 ) – n.m.
Total operating income 3,191 2,869 3,479 11.2% (17.5%)
% CHANGE BELL WIRELINE REVENUE 2009 2008 2007 2009 VS. 2008 2008 VS. 2007
Local and access 3,159 3,360 3,617 (6.0 %) (7.1 %) Long distance 1,078 1,165 1,219 (7.5 %) (4.4 %) Data 3,696 3,723 3,573 (0.7 %) 4.2% Video 1,593 1,450 1,317 9.9 % 10.1 % Equipment and other 817 574 653 42.3 % (12.1%)
Total external revenues 10,343 10,272 10,379 0.7 % (1.0 %) Inter-segment revenues 323 368 340 (12.2 %) 8.2%
Total Bell Wireline revenue 10,666 10,640 10,719 0.2 % (0.7 %)

BCE INC. 2009 ANNUAL REPORT 41
MANAGEMENT’S DISCUSSION AND ANALYSIS
NAS net losses in 2009 were 447,000, up from 436,000 in the previous year, representing an annual rate of NAS erosion of 6.1% in 2009 compared with 5.6% in 2008. The year-over-year increase in line losses can be attributed to the weaker economy in 2009 that brought about a higher number of business customer disconnections and fewer new installations in Ontario and Québec. As a result, we experienced a higher rate of business NAS erosion in 2009, which increased to 3.7% from 1.7% in 2008. However, our residential local business has exhibited resiliency to the economy as evidenced by the reduction in residential NAS line losses in 2009, which improved 12.6% year over year, despite ongoing aggressive competition from both cable TV operators and CLECs for local telephone service. Effective marketing of our Home phone packages, the benefits of service bundling, customer winbacks and better service delivery all contributed to lowering the annual rate of residential NAS erosion, which improved to 7.9% in 2009 from 8.3% in 2008.
Long Distance
Long distance revenues were $1,078 million in 2009, compared with $1,165 million in 2008. The 7.5% decrease was driven by lower billed minute volumes resulting from residential and business NAS line erosion, toll competition, pricing pressures in our business and wholesale markets, as well as technological substitution to wireless and Internet. Increased adoption of unlimited or large usage packages for a set monthly price instead of per-minute rates by residential customers also contributed to lower long distance revenues in 2009 compared with the previous year. Consistent with NAS erosion, technological substitution and the impacts of a weaker economy, particularly in our business markets, total minute volumes decreased by 4.4% in 2009 to 11,248 million conversation minutes from 11,771 million in 2008. The year-over-year decline reflected lower volumes in both our residential and business markets, as well as competitive pressures in wholesale. As a result of a decrease in total minutes of usage and lower per-minute rates resulting from intense price competition and the shift by residential customers to set-price packages, average revenue per minute (ARPM) decreased by $0.006 in 2009 to $0.083 from $0.089 in the previous year.
Data
Data revenues decreased 0.7% in 2009 to $3,696 million from $3,723 million in 2008. The modest decline in 2009 was attributable to decreased equipment sales to business customers who have deferred buying decisions and are spending more cautiously during the economic downturn. Although legacy data revenues decreased year over year, total data service revenues increased 1.1% in 2009, mainly as a result of higher Internet services revenue driven by a greater number of high-speed Internet customer connections, higher residential Internet ARPU, and increased IP broadband connectivity revenue from both our business and wholesale customers. Legacy data revenue erosion continued as a result of business customer migrations to IP-based systems, competitive losses, continued market pricing pressures, and a lower number of digital network access circuits used by existing customers due to a reduced level of overall business activity and cost rationalization given the slowdown in the economy. We added 38,000 net high-speed Internet subscribers in 2009 compared with 50,000 in 2008. Despite increased residential sales through our direct channels, driven by competitive product offers and improvements in service delivery, total net subscriber activations decreased in 2009 as a result of higher economy-related business deactivations, fewer wholesale net activations and a maturing Internet market. At December 31, 2009, we had 2,057,000 high-speed Internet subscribers, representing a 0.1% increase over 2008. This figure includes an end-of-year subscriber base adjustment following a company-wide review of subscriber metrics, which resulted in a decrease of 35,000 customers. The subscriber base adjustment did not impact net subscriber activations for 2009.
Video
Video revenues increased 9.9% in 2009 to $1,593 million from $1,450 million in 2008 as a result of higher ARPU and a larger customer base. Video ARPU in 2009 was up 6.5%, or $4.22, to $69.59 per month from $65.37 per month in 2008. The year-over-year improvement in video ARPU was due to customer upgrades to higher-priced programming packages, driven partly by increased customer adoption of premium STBs. We added 113,000 net video subscribers in 2009, compared with 30,000 in 2008. The year-over-year improvement can be attributed to higher activations through our direct channels and increased customer subscriptions from MDUs. Our video churn rate in 2009 remained unchanged year over year at 1.2%. At December 31, 2009, our video subscriber base totalled 1,949,000, representing a 5.2% increase over 2008. This figure includes an end-of-year subscriber base adjustment following a company-wide review of subscriber metrics, which resulted in a decrease of 16,000 customers. The subscriber base adjustment did not impact net subscriber activations for 2009.
Equipment and Other
Equipment and other revenues increased 42.3% to $817 million in 2009 from $574 million last year, mainly as a result of the acquisition of The Source in the third quarter of 2009.
42 BCE INC. 2009 ANNUAL REPORT MANAGEMENT’S DISCUSSION AND ANALYSIS
2008 Compared to 2007
Bell Wireline’s revenues totalled $10,640 million in 2008, down 0.7% from $10,719 million in 2007. Year-over-year revenue improvements of $150 million in data and $133 million in video were more than offset by decreases of $257 million, $54 million and $79 million in local and access, long distance, and equipment and other, respectively.
Local and Access
Local and access revenues declined 7.1% in 2008 to $3,360 million from $3,617 million in 2007. The year-over-year decrease was due largely to ongoing residential NAS erosion and the related loss of revenue from optional features. The reversal of a regulatory provision in 2007 related to the price caps deferral account also contributed to the year-over-year decrease in local and access revenues in 2008. The positive revenue impact of price increases over 2007 on certain basic voice products and features, as well as various other business and wholesale access services, helped to moderate the year-over-year decrease in local and access revenues in 2008. At December 31, 2008, our combined residential and business NAS customer base totalled 7,309,000 lines, compared with 8,062,000 at the end of 2007. This corresponds to an annualized rate of NAS erosion of 9.3% in 2008 compared with 6.7% in 2007. The decrease in total NAS line losses was further impacted by a number of adjustments that we made at the beginning of 2008. At that time, we adjusted our beginning-of-period business NAS customer base to write-off 273,000 lines following notification from a major wholesale customer in the fourth quarter of 2007 that it was in the process of migrating all its subscribers onto its own network facilities. As a result, the NAS subscriber count was adjusted in 2007. In addition, we adjusted our beginning-of-year residential NAS subscriber count down by 44,000 to reflect the results of an extensive review of our historical customer records. Excluding the impact of these adjustments, our annualized rate of NAS erosion at December 31, 2008 was 5.6%, compared with 7.1% at December 31, 2007. In terms of NAS lines, our net losses on an adjusted basis in 2008 were 436,000, compared with 594,000 in 2007. The approximate 27% year-over-year improvement in adjusted total NAS line losses can be attributed to the effectiveness of our integrated household marketing campaign, continued solid demand for our Bell Home Phone packages, ongoing customer winbacks, and reduced losses to CLECs. At the end of 2008, we had 4,221,000 residential lines and 3,088,000 business lines, compared with customer bases of 4,603,000 and 3,142,000, respectively, at the end of 2007.
Long Distance
Long distance revenues decreased 4.4% in 2008 to $1,165 million from $1,219 million in 2007, for primarily the same reasons as in 2009. Consistent with NAS erosion and competitive substitution, total minute volumes decreased by 5.8% in 2008 to 11,771 million conversation minutes from 12,500 million in 2007. The year-over-year decline reflected lower domestic and overseas minute volumes in both our consumer and business sectors, as well as competitive pressures in wholesale. Despite the positive impact of price increases at the beginning of 2008 for residential and business customers, ARPM decreased $0.002 in 2008 to $0.089 from $0.091 in 2007.
Data
Data revenues were 4.2% higher year over year, increasing to $3,723 million in 2008 from $3,573 million in 2007. The main drivers of data revenue growth in 2008 included higher Internet services revenues, higher IP broadband connectivity services revenues, increased sales of ICT solutions to business customers, and higher Internet portal revenues. These factors, which had a positive impact on data revenues in 2008, were partly offset by lower revenues from legacy products and services. We added 50,000 net high-speed Internet subscribers in 2008 compared with 124,000 in 2007. This brought our total Internet subscriber count at December 31, 2008 to 2,054,000, representing a 2.5% increase since the end of the previous year. The year-over-year decrease in net activations in 2008 can be attributed primarily to our competitors’ aggressive acquisition offers and lower overall market demand due to the relatively high broadband Internet penetration rate in Canada.
Video
Video revenues increased 10.1% in 2008 to $1,450 million from $1,317 million in 2007, due to higher ARPU and a larger customer base. Video ARPU grew considerably in 2008, increasing by $5.68 to reach $65.37 per month from $59.69 per month in the previous year. We added 30,000 net new video subscribers in 2008, compared with 2,000 in the previous year. The year-over-year improvement can be attributed mainly to higher

sales through our call centre channels largely as a result of our integrated household strategy marketing campaign and increased customer subscriptions from MDUs. Our video churn rate in 2008 remained unchanged year over year at 1.2%. At December 31, 2008, our video subscriber base totalled 1,852,000.
Equipment and Other
Consistent with our strategy of not pursuing low-margin business, equipment and other revenues decreased 12.1% in 2008 to $574 million from $653 million in 2007, largely as a result of lower business equipment sales, reduced maintenance of legacy voice equipment, and the termination in the second quarter of 2008 of Bell Internet’s PC equipment sales program.
BCE INC. 2009 ANNUAL REPORT 43
MANAGEMENT’S DISCUSSION AND ANALYSIS
BELL WIRELINE OPERATING INCOME
2009 Compared to 2008
Operating income for our Bell Wireline segment was $1,148 million in 2009, up from $902 million in 2008. The year-over-year increase was due primarily to lower restructuring and other charges in 2009 of $475 million, reflecting amounts for voluntary and involuntary workforce reduction initiatives, including a retirement incentive for unionized employees, the relocation of employees to campus environments, and a charge recorded as a result of a Supreme Court of Canada ruling upholding the CRTC’s decision as to the disposition of Bell’s remaining deferral account balance. This compared with restructuring and other items of $773 million in 2008, which included amounts recorded for involuntary workforce reduction initiatives, the relocation of employees and closing of real estate facilities that are no longer needed as a result of a reduced workforce, the CRTC’s decision in the first quarter of 2008 to approve the use of a portion of the deferral account funds for the uneconomic expansion of broadband service, and costs associated with the proposed privatization of BCE Inc. Bell Wireline’s operating income before restructuring and other decreased 3.1% to $1,623 million in 2009 from $1,675 million in the previous year, mainly as a result of the following:
loss of higher-margin legacy voice and data revenues due to erosion of our residential NAS customer base and business customer losses higher TV programming and customer acquisition costs consistent with the addition of multiple new channels and an increased number of new video subscriber activations higher U.S. dollar hedge rates in 2009 on our U.S. dollar-denominated purchases increased wireline marketing and sales expenses costs related to Bell’s sponsorship of the Vancouver Winter Olympics higher depreciation and amortization expense higher net benefit plans cost.
These factors, which had an unfavourable impact on operating income this year, were partly offset by:
higher video, Internet and IP broadband connectivity revenues a decline in overall labour costs due to a reduced workforce, a reduction in outsourced labour, and decreased use of consultants and contractors lower overall general and administrative expenses the reversal of a liability for CRTC video broadcast licence fees for the three years ended August 31, 2009 related to a settlement with the federal government the adverse impact on 2008 operating income of a $31 million charge related to the Federal Court of Appeal’s decision in early 2008 in respect of CRTC video broadcast licence fees for the period from September 2006 to June 2008, a $28 million charge for a loss on a long-term large business customer contract and a $14 million net charge associated with the termination of Bell Internet’s PC equipment sales program.
2008 Compared to 2007
Operating income for our Bell Wireline segment was $902 million in 2008, down from $1,454 million in the previous year. The results for 2008 included restructuring and other charges totalling $773 million as described above, compared with restructuring and other charges of $304 million in 2007. Excluding the impact of these items, operating income before restructuring and other in 2008 decreased 4.7% to $1,675 million from $1,758 million in 2007, mainly as a result of the following:
loss of higher-margin legacy voice and data revenues due to erosion of our residential NAS customer base and business customer migration towards IP-based networks higher outsourcing costs from increased call volumes and IT service contract labour increased expenses related to ongoing service improvements higher fleet expenses due mainly to increased fuel costs higher depreciation and amortization expense.
In addition, a number of unusual items occurred in 2008, which adversely affected operating income. These included a $31 million charge related to the Federal Court of Appeal’s decision in respect of CRTC video broadcast licence fees for the period from September 2006 to June 2008, a $14 million net charge related to a write-down of assets associated with the termination of Bell Internet’s PC equipment sales program in the second quarter of 2008, and a $28 million charge recorded in the fourth quarter of 2008 for a loss on a long-term large business customer contract. The year-over-year decrease in operating income in 2008 was moderated by:
higher video, Internet, broadband connectivity and ICT services revenues lower labour costs from a reduced workforce and lower compensation expense lower cost of product sales consistent with a decrease in overall business equipment sales and the termination of Bell Internet’s PC equipment sales program in the second quarter of 2008 lower cost of revenue due to reduced long distance traffic and lower international rates decreased bad debt expense resulting mainly from our focus on accounts receivable collections and cash flow lower net benefit plans cost.
44 BCE INC. 2009 ANNUAL REPORT MANAGEMENT’S DISCUSSION AND ANALYSIS
Bell Wireless Segment
BELL WIRELESS REVENUE
2009 Compared to 2008
Bell Wireless operating revenues, comprised of network service and product revenues, increased 1.8% to $4,558 million in 2009 from $4,479 million in 2008. Despite
% CHANGE BELL WIRELESS REVENUE 2009 2008 2007 2009 VS. 2008 2008 VS. 2007
Service 4,102 4,059 3,773 1.1% 7.6% Product 405 375 319 8.0% 17.6 %
Total external revenues 4,507 4,434 4,092 1.6% 8.4% Inter-segment revenues 51 45 59 13.3% (23.7%)
Total Bell Wireless revenue 4,558 4,479 4,151 1.8% 7.9%

subscriber base growth and the July 2009 acquisitions of Virgin and The Source, operating revenues were adversely affected by the economic downturn, which has resulted in reduced usage and lower overall spending by both our consumer and business customers. Wireless service revenue in 2009 grew by 1.1%, or $43 million, to $4,102 million from $4,059 million in 2008. The year-over-year increase was driven by higher wireless data usage, subscriber base growth and the acquisition of Virgin. Lower voice ARPU moderated the growth in wireless service revenue in 2009, reflecting the impacts of a weaker economy and competitive pricing pressures due to increased penetration by flanker brands in the market. Product revenues increased 8.0% in 2009 to $405 million from $375 million in 2008. The year-over-year increase was due to the acquisitions of Virgin and The Source, and increased sales of smartphones. Beginning in the third quarter of 2009, wireless ARPU, churn and COA reflect 100% of Virgin’s results. These metrics, prior to this time, reflected our previous 50% ownership. Wireless gross activations, net activations and end-of-period subscribers in prior periods have always included 100% of Virgin’s subscribers. Wireless ARPU decreased in 2009 mainly as a result of declining voice usage triggered by the soft economy. The decline in the voice component of ARPU can be attributed to a decrease in usage reflecting reduced employment levels and increased customer adoption of richer rate plans with more services and voice minutes included at lower monthly prices, and decreased roaming revenues from lower in-bound roaming rates and customers curtailing travel. These factors were partly offset by growth in data revenues, reflecting increased usage and features penetration consistent with the sale of a greater number of smartphones, wireless Internet sticks and other data-capable devices. In addition, due to the inclusion of a higher proportion of Virgin prepaid customers in our ARPU calculation, blended ARPU for 2009 was impacted adversely when compared to 2008, while postpaid ARPU remained virtually unaffected. Although wireless ARPU decreased in 2009, the year-over-year decline improved in the second half of the year. Postpaid ARPU was $62.87 per month in 2009, down from $66.09 per month in 2008, while prepaid ARPU was essentially unchanged at $17.15 per month in 2009 compared with $17.14 per month in the previous year. Accordingly, blended ARPU declined to $51.70 per month in 2009 from $54.29 per month in 2008. On a pro forma basis, assuming the acquisition of Virgin occurred on January 1, 2008, postpaid and prepaid ARPU decreased, year over year, in 2009. Postpaid ARPU was $62.81 per month in 2009, compared with $66.02 per month in 2008. Prepaid ARPU declined to $17.53 per month in 2009 from $17.83 per month in the previous year. Accordingly, blended ARPU declined to $50.88 per month in 2009 from $52.70 per month in 2008. Notwithstanding the softer economy and intense competition, our gross wireless activations increased 8.7% in 2009 to 1,794,000 compared with 1,651,000 in 2008. The year-over-year improvement was driven by both higher postpaid and prepaid gross activations. Postpaid gross activations grew 8.9% in 2009 to 1,056,000 from 970,000 last year, reflecting the positive consumer response to the launch of the new HSPA/HSPA+ network, our expanded handset and smartphone lineup (including the Apple iPhone, BlackBerry Bold, LG Xenon and Palm Pre), growth in activations of wireless Internet sticks and our promotional offers. Prepaid gross activations increased 8.4% in 2009 to 738,000 from 681,000 in 2008, reflecting growth at Virgin and relatively higher demand for prepaid products as consumers curbed spending in a weak economy. Our blended churn rate increased to 1.7% in 2009 from 1.6% in 2008, reflecting higher postpaid and prepaid churn. Postpaid churn increased to 1.3% in 2009 from 1.2% in the previous year, due to higher economy-driven deactivations and aggressive acquisition offers from our competitors. Prepaid churn increased to 3.2% in 2009 from 3.1% in 2008. On a pro forma basis, our blended churn rate increased to 1.8% in 2009 from 1.7% last year, reflecting higher postpaid and prepaid churn. Postpaid churn increased to 1.3% in 2009 from 1.2% in 2008. Prepaid churn increased to 3.2% in 2009 from 3.1% in 2008. As a result of higher gross subscriber activations, total wireless net activations increased 6.3% in 2009 to 373,000 compared with 351,000 in 2008. Postpaid net activations, which represented 89% of total net activations in 2009, were
BCE INC. 2009 ANNUAL REPORT 45
MANAGEMENT’S DISCUSSION AND ANALYSIS
essentially stable year over year at 331,000 compared with 332,000 in 2008, while prepaid net activations increased to 42,000 in 2009 from 19,000 in the previous year. At December 31, 2009, we provided service to 6,833,000 wireless subscribers, representing a 5.2% increase since the end of 2008. This figure includes an end-of-year subscriber base adjustment following a company-wide review of subscriber metrics, which resulted in a decrease of 37,000 customers (35,000 postpaid and 2,000 prepaid). The subscriber base adjustment did not impact net subscriber activations for 2009.
2008 Compared to 2007
Bell Wireless operating revenues increased 7.9% to $4,479 million in 2008 from $4,151 million in 2007. Wireless service revenues grew 7.6% to $4,059 million in 2008, driven mainly by the combination of a larger subscriber base, significantly higher data usage and increased roaming revenues. Product revenues were 17.6% higher in 2008 at $375 million, compared with $319 million in 2007. The year-over-year improvement in product revenues reflected a higher volume of handset sales and customer upgrades, driven primarily by continued subscriber base growth, as well as an increase in the average handset price due to a higher proportion of high-end data devices sold. Both postpaid and prepaid ARPU in 2008 increased marginally, year over year, to $66.09 per month and $17.14 per month, respectively, from $65.88 per month and $17.11 per month in 2007. Accordingly, on a combined postpaid and prepaid basis, blended ARPU increased in 2008 to $54.29 per month compared with $53.92 per month in the previous year. Gross wireless activations increased 0.7% in 2008 to 1,651,000 from 1,640,000 in 2007, driven by higher postpaid gross activations. Postpaid gross activations grew by 6.7% in 2008, reflecting our promotional offers, the growing demand for high-end data handsets and smartphones, a higher number of points of sale, and Virgin’s introduction of postpaid rate plans at the beginning of 2008. Prepaid gross activations in 2008 decreased 6.6%, year over year, mainly as a result of our increased focus on postpaid customer acquisition. Our blended churn rate for 2008 decreased slightly year over year to 1.6% from 1.7% in 2007. Postpaid churn decreased to 1.2% in 2008 from 1.3% in 2007, due mainly to our customer retention and service improvement strategies, while prepaid churn increased to 3.1% from 2.8% in 2007, mainly as a result of a higher number of inactive customer deactivations. Postpaid net activations improved significantly in 2008, increasing 61% to 332,000 from 206,000 in 2007. The year-over-year improvement can be attributed to the combined impact of higher postpaid gross activations and lower postpaid customer churn. Despite significantly higher postpaid net activations, our total wireless net activations decreased to 351,000 in 2008 from 408,000 in the previous year, as a result of lower prepaid net activations, which totalled 19,000 in 2008 compared with 202,000 in 2007. At the end of 2008 we adjusted our end-of-period wireless subscriber base. During the fourth quarter of 2008, we decommissioned our analog wireless network that was deployed in the mid-1980s and had reached the end of its useful service life. We began notifying customers of the pending network shutdown approximately one year earlier. These customers were offered free digital handsets and the option of higher-powered long-range phones at a low cost. The deactivation of the remaining analog subscribers resulted in the removal of approximately 37,000 subscribers (11,000 postpaid and 26,000 prepaid) from our wireless subscriber base. In addition, we adjusted our end-of-period wireless subscriber base by 32,000 postpaid customers to reflect customers with credit issues when postpaid service was introduced at Virgin at the beginning of 2008. These adjustments were not included in the determination of net activations or customer churn for 2008. Taking into account the aforementioned subscriber-base adjustments, we ended 2008 with 6,497,000 wireless subscribers, representing a 4.5% increase over 2007.
BELL WIRELESS OPERATING INCOME
2009 Compared to 2008
Our Bell Wireless segment reported operating income of $1,284 million in 2009, up 3.5% from $1,241 million in 2008. The year-over-year increase was due to higher operating revenues, lower subscriber acquisition costs, decreased network operating expenses, reduced payments to other carriers as a result of lower overall roaming volumes in combination with lower rates, lower marketing and sales expenses, as well as decreased customer retention and handset upgrade spending. These factors were partly offset by:
higher costs to support a larger number of subscribers and wireless data usage growth increased costs to provide more data content and support services being offered increased customer care costs, including increased warranty and repair costs, as a result of supporting more sophisticated devices and services higher cost of product sales driven by a significant year-over-year increase in smartphone activations increased operating expenses consistent with the acquisitions of Virgin and The Source higher U.S. dollar hedge rates in 2009 on our U.S. dollar-denominated purchases of wireless devices.
Wireless COA decreased by 11.4% in 2009 to $350 per gross activation from $395 per gross activation in 2008. On a pro forma basis, wireless COA decreased by 9.9% in 2009 to $336 per gross activation from $373 in the previous year. The improvement in wireless COA was the result of reductions in selling and advertising costs, and a higher proportion of wireless Internet stick activations compared to last year. Handset subsidies were higher, year over year, due to foreign exchange losses on U.S. dollar hedges incurred on the purchase of wireless devices and a shift in handset mix towards higher-priced smartphones and data devices.
46 BCE INC. 2009 ANNUAL REPORT
MANAGEMENT’S DISCUSSION AND ANALYSIS
2008 Compared to 2007
Our Bell Wireless segment reported operating income of $1,241 million in 2008, up 3.6% from $1,198 million in 2007. The year-over-year increase was due primarily to higher revenues and lower subscriber acquisition costs. These factors were partly offset by:

higher network operating expenses to sustain a larger subscriber base, increased data usage and roaming increased costs to provide data content and to support services being offered higher cost of product sales consistent with increased equipment revenues increased customer retention and handset upgrade expenses higher labour costs associated with increased call centre volumes and new stores.
Wireless COA decreased 2.2% in 2008 to $395 per gross activation from $404 per gross activation. The year-over-year improvement was due mainly to lower handset subsidies, despite increased sales of higher-end data devices, and reduced marketing costs.
Bell Aliant Segment
BELL ALIANT REVENUE
2009 Compared to 2008
Bell Aliant revenues decreased 3.7% to $3,174 million in 2009 from $3,297 million in 2008. The year-over-year decline resulted from the continued erosion of Bell Aliant’s local wireline and long distance businesses and reduced telecom product sales. These declines were partly offset by higher revenues from growth in Internet and IP-based broadband connectivity services, and an increase in wireless and IT revenue. The wind-down of the operations of AMP in the third quarter of 2008, following Bell’s notification that it would terminate its contract with AMP as its exclusive distributor in Atlantic Canada, also adversely impacted Bell Aliant’s operating revenues in 2009. Local and access revenues decreased 3.3% in 2009 to $1,348 million from $1,394 million in 2008. This was due to a 5.1% decline in the NAS customer base in 2009, reflecting competitive losses driven by aggressive pricing and increased promotional activity by competitors, as well as expansion in the cable telephony footprint and substitution for other services including wireless and VoIP services. The decline in revenue was moderated by retention programs that targeted high-value customers, pricing increases in certain areas of Bell Aliant’s territory, and increased penetration of features and service bundles. At December 31, 2009, Bell Aliant had 2,926,000 NAS in service, compared with 3,082,000 NAS one year earlier. Long distance revenues were $399 million in 2009, down 7.0% compared with $429 million in 2008. The decrease was due to a 4.1% annual decline in conversation minutes in 2009 resulting from competitive losses and technology substitution to wireless calling and IP-based services. ARPM decreased 2.1% in 2009 to $0.093 from $0.095 in 2008, due to price reductions, primarily for business customers, and the continued shift by residential customers from per-minute rate plans to fixed-price packages. Data revenues increased 5.7% in 2009 to $632 million from $598 million in 2008. The year-over-year improvement can be attributed to higher Internet revenues driven by a 7.0% increase in the number of high-speed subscribers and higher residential ARPU from growth in VAS and price increases over the past year. At December 31, 2009, Bell Aliant had 810,000 high-speed Internet subscribers compared with 757,000 subscribers one year earlier. Wireless revenues grew 8.3% in 2009 to $78 million from $72 million in 2008, due mainly to a larger subscriber base and higher ARPU. At December 31, 2009, Bell Aliant had 121,000 wireless customers, representing a 6.1% increase since the end of 2008. Equipment and other revenues decreased 7.4% in 2009 to $428 million from $462 million in 2008. The year-over-year decline was due to lower telecom product sales in 2009 compared with 2008. Equipment and other revenues in 2009 were also adversely impacted by the wind-down in the operations of AMP in the third quarter of 2008.
BCE INC. 2009 ANNUAL REPORT 47
MANAGEMENT’S DISCUSSION AND ANALYSIS
2008 Compared to 2007
Bell Aliant segment revenues decreased 0.5% to $3,297 million in 2008 from $3,315 million in 2007. The year-over-year decline was due primarily to the wind-down in the operations of AMP in the third quarter of 2008, as well as to the continued decrease in revenues from its local and access and long distance services, which was offset largely by higher revenues from data (including Internet), IT services and wireless. Local and access revenues decreased 2.2% in 2008 to $1,394 million from $1,426 million in 2007. This was due to a 3.4% decline in the NAS customer base since the end of 2007. The year-over-year revenue decline was lower than Bell Aliant’s NAS erosion rate, due primarily to the impact of price increases in certain areas of Bell Aliant’s territory and increased penetration of value-added features and service bundles. At December 31, 2008, Bell Aliant had 3,082,000 NAS in service, compared with 3,191,000 one year earlier. Long distance revenues totalled $429 million in 2008, down 3.6% compared with $445 million in 2007. This was due primarily to a decline in annual long distance minutes of 3.7%. ARPM decreased to $0.095 in 2008 from $0.096 in 2007. Data revenues, including Internet, increased 14.6% in 2008 to $598 million from $522 million in 2007, mainly as a result of a 9.9% increase in the number of high-speed subscribers, as well as to growth in IP connectivity broadband services such as VPN. At December 31, 2008, Bell Aliant had 757,000 high-speed Internet subscribers compared with 689,000 one year earlier. Wireless revenues grew 35.8% in 2008 to $72 million from $53 million in 2007. The year-over-year increase was due to the combined impact of a larger subscriber base and higher ARPU driven primarily by growth in data services. At December 31, 2008, Bell Aliant had 114,000 wireless customers, representing an approximate 20% increase since the end of 2007. Equipment and other revenues decreased 1.9% in 2008 to $462 million from $471 million in 2007. The decrease in 2008 was due primarily to the wind-down in the operations of AMP, offset partly by higher year-over-year IT services revenue driven by growth in IT project activity within the healthcare industry and by increased IT product sales to a few key customers.
BELL ALIANT OPERATING INCOME
2009 Compared to 2008
Operating income at Bell Aliant was higher year over year, increasing by 4.5% to $759 million in 2009 from $726 million in 2008. The year-over-year improvement was due mainly to lower labour costs as a result of workforce reduction programs initiated in the fourth quarter of 2008 and the first quarter of 2009, and to decreased use of consultants and IT services contract labour. Other cost containment initiatives that resulted in reduced selling, general and administrative expenses, as well as lower restructuring and other charges also contributed to higher operating income in 2009. These favourable factors were partly offset by lower total operating revenues and higher net benefit plans cost year over year.
2008 Compared to 2007
Operating income at Bell Aliant increased 1.7% in 2008 to $726 million from $714 million in 2007. Lower net benefit plans cost and strict management of selling, general and administrative expenses more than offset decreased operating revenues, higher cost of revenue driven by increased IT-related sales, higher depreciation and amortization expense, and higher restructuring and other charges reflecting a charge recorded in the fourth quarter of 2008 related to a workforce reduction initiative to remove approximately 500 management positions in 2009.
FINANCIAL AND CAPITAL MANAGEMENT
This section tells you how we manage our cash and capital resources to carry out our strategy and deliver financial results. It provides an analysis of our financial condition, cash flows and liquidity on a consolidated basis.
Net Debt
% CHANGE BELL ALIANT REVENUE 2009 2008 2007 2009 VS. 2008 2008 VS. 2007
Local and access 1,348 1,394 1,426 (3.3%) (2.2 %) Long distance 399 429 445 (7.0%) (3.6 %) Data 632 598 522 5.7% 14.6 % Wireless 78 72 53 8.3% 35.8 % Equipment and other 428 462 471 (7.4%) (1.9 %)
Total external revenues 2,885 2,955 2,917 (2.4%) 1.3% Inter-segment revenues 289 342 398 (15.5%) (14.1%)
Total Bell Aliant revenue 3,174 3,297 3,315 (3.7%) (0.5 %)

Net debt increased $964 million to $14,287 million in 2009 due mainly to a decrease in cash and cash equivalents. BCE Inc. paid dividends on common shares of $1,201 million, repurchased and cancelled 36 million outstanding common shares for $894 million and invested $338 million for business acquisitions, including Virgin and The Source. These decreases in cash were partly offset by free cash flow of $1,456 million in 2009.
Outstanding Share Data
We had 767.2 million common shares outstanding at the end of 2009, a decrease of 35.9 million from 2008 resulting from BCE Inc.’s repurchase of 36 million of its outstanding common shares for cancellation through a NCIB, partly offset by stock options that were exercised in 2009. At February 28, 2010, 765.2 million common shares and 10.3 million stock options were outstanding.
48 BCE INC. 2009 ANNUAL REPORT MANAGEMENT’S DISCUSSION AND ANALYSIS
The number of stock options outstanding at the end of 2009 was 11.3 million, a decrease of 3.7 million from 2008. The weighted average exercise price of the stock options outstanding at December 31, 2009 was $32. Of the total outstanding stock options at December 31, 2009, 8.8 million were exercisable at a weighted average exercise price of $34. In 2009:
0.1 million previously granted options were exercised 3.6 million previously granted options were forfeited.
Cash Flows
The following table is a summary of our cash inflows and outflows.
n.m.: not meaningful
Cash Flows from Operating Activities
2009 COMPARED TO 2008
Cash flows from operating activities were $4,884 million, a decrease of $1,025 million, or 17.3%, compared to $5,909 million in 2008. The decrease was due to:
an increase of $836 million in pension contributions, including a $500 million voluntary pension contribution at Bell a decrease of $88 million in interest received as a result of lower interest rates on temporary cash investments and lower average cash balances an increase of $56 million in income taxes paid an increase in investment in working capital.
This was partly offset by higher cash earnings from an increase in EBITDA, exclusive of net benefit plans cost of $190 million.
2008 COMPARED TO 2007
Cash flows from operating activities were $5,909 million in 2008, an increase of $179 million, or 3.1%, compared to $5,730 million in 2007. The increase was due to:
a decrease of $152 million in net interest paid as a result of both lower average debt and higher interest income a decrease of $33 million in pension contributions made an improvement in working capital.
2009 2008
Debt due within one year(1) 600 2,201 Long-term debt 10,299 10,099 Securitization of accounts receivable 1,305 1,305 Preferred shares 2,770 2,770 Less: Cash and cash equivalents (687) (3,052)
Total net debt 14,287 13,323
(1) Includes bank advances and notes payable.
(in millions) 2009 2008
Common shares 767.2 803.1 Stock options 11.3 15.0
% CHANGE 2009 2008 2007 2009 VS. 2008 2008 VS. 2007
Cash flows from operating activities 4,884 5,909 5,730 (17.3%) 3.1% Bell Aliant distributions to BCE 291 290 282 0.3% 2.8% Capital expenditures (2,854) (2,986) (3,140 ) 4.4% 4.9% Other investing activities (89) (726) 13 87.7% n.m. Cash dividends paid on preferred shares (107) (129) (124 ) 17.1% (4.0 %) Cash dividends/distributions paid by subsidiaries to non-controlling
interest (369) (366) (404 ) (0.8%) 9.4% Bell Aliant free cash flow (300) (303) (397 ) 1.0% 23.7 %
Free cash flow 1,456 1,689 1,960 (13.8%) (13.8%) Bell Aliant undistributed free cash flow 9 13 115 (30.8%) (88.7%) Business acquisitions (338) (56 ) (163 ) n.m. 65.6 % Business dispositions 11 (10 ) 3,123 n.m. n.m. Formation of Bell Aliant – – (7 ) – 100.0 % Going-private costs (7) (163) (49 ) 95.7% n.m. Increase in investments (53) (8 ) (27 ) n.m. 70.4 % Decrease in investments 113 1 192 n.m. (99.5%) Net repayment of debt instruments (1,385) (451) (1,766 ) n.m. 74.5 % Cash dividends paid on common shares (1,201) (587) (1,147 ) n.m. 48.8 % Issue of common shares 2 50 153 (96.0%) (67.3%) Repurchase of common shares (894) (92 ) (227 ) n.m. 59.5 % Redemption of equity securities by subsidiaries from non-controlling
interest – – (333 ) – 100.0 % Other financing activities (90) 16 (66 ) n.m. n.m. Cash provided by discontinued operations 2 3 319 (33.3%) (99.1%)
Net (decrease) increase in cash and cash equivalents (2,375) 405 2,077 n.m. (80.5%)

These increases were partly offset by:
an increase of $187 million in payments of restructuring and other from workforce reduction initiatives a decrease in EBITDA, exclusive of net benefit plans cost of $147 million an increase of $76 million in income taxes paid due to higher refunds received in 2007 a decrease of $21 million from the securitization of accounts receivable.
BCE INC. 2009 ANNUAL REPORT 49
MANAGEMENT’S DISCUSSION AND ANALYSIS
Free Cash Flow
2009 COMPARED TO 2008
Free cash flow was $1,456 million in 2009, a decrease of $233 million, or 13.8%, compared to $1,689 million in 2008. This was due to lower cash flows from operating activities of $1,025 million, partly offset by a reduction in capital expenditures of $132 million and a smaller investment in 2009 for AWS spectrum licences. In 2009, we invested $40 million in spectrum licences compared to $741 million in 2008.
2008 COMPARED TO 2007
Free cash flow was $1,689 million in 2008, a decrease of $271 million, or 13.8%, compared to free cash flow of $1,960 million in 2007. This decrease was due to our purchase of AWS spectrum licences for $741 million, partly offset by higher cash flows from operating activities of $179 million and lower capital expenditures of $154 million.
Capital Expenditures
2009 COMPARED TO 2008
Capital expenditures for BCE were $2,854 million in 2009, compared with $2,986 million in 2008. As a percentage of revenues, capital expenditures for BCE decreased to 16.1% in 2009 from 16.9% in 2008. At Bell, capital expenditures decreased 2.8% in 2009 to $2,390 million from $2,459 million in the previous year. This represents a capital intensity ratio of 15.9% in 2009 compared with 16.5% in 2008. Although total expenditures were lower year over year, we maintained spending on our key priorities within the growth areas of our business with more than 80% of the capital spent in 2009 centred on our five strategic imperatives. In 2009, we made new investments in both our wireless and wireline broadband networks, including the deployment of a nation-wide HSPA/HSPA+ network, the continued rollout of FTTN in residential neighbourhoods and fibre to new condominiums and other MDUs primarily in the Québec-Windsor corridor, as well as speed and capacity enhancements to our IP backbone network infrastructure. However, reduced spending to maintain our legacy network infrastructure and to support large business customer contracts, as well as higher real estate expenditures in 2008 to form campus environments in Montréal, Toronto and Calgary, resulted in lower overall capital expenditures in 2009. Capital spending at Bell Aliant decreased to $464 million in 2009 from $527 million in 2008, due to a planned reduction in capital spending for 2009 and higher spending in 2008 on the expansion of its broadband footprint.
2008 COMPARED TO 2007
Capital expenditures for BCE were $2,986 million in 2008, compared with $3,140 million in 2007. As a percentage of revenues, capital expenditures for BCE decreased to 16.9% in 2008 from 17.7% in 2007. The decrease can be explained primarily by the sale of Telesat on October 31, 2007 that resulted in no capital expenditures being reported for Telesat in 2008, compared with $188 million in 2007. Reduced spending at Bell Aliant, particularly in the first half of 2008, also contributed to the overall decrease in BCE’s capital expenditures in 2008. These reductions stemmed from the completion of the accelerated phase of its investment in FTTN technology in 2007 and planned reduced capital spending for 2008. Bell Aliant’s capital expenditures in 2008 decreased 1.9% to $527 million, compared with $537 million in the previous year. At Bell, capital expenditures increased 1.8% in 2008 to $2,459 million from $2,415 million in 2007, corresponding to a stable capital intensity ratio of 16.5% year over year. The majority of spending was focused on strategic priorities within the growth areas of our business, including investments to enhance and update our wireless network, and expand broadband access and capabilities through Bell’s FTTN program, as well as to meet customer demand and service expectations. Higher spending on wireless cell site capacity and signal quality, the implementation of a card swap program at Bell TV, and our move to campus environments in Montréal, Toronto and Calgary also contributed to increased capital expenditures year over year. This was offset partly by lower expenditures to maintain our legacy network infrastructure and reduced IT project-related spending on system upgrades, office equipment and process improvements.
Business Acquisitions
We invested $338 million in 2009 for business acquisitions, including Virgin and The Source. We invested $56 million in 2008 for various business acquisitions, compared to $163 million in 2007, mainly due to the privatization of Bell Nordiq by Bell Aliant.
Business Dispositions
On October 31, 2007, we sold Telesat, our satellite services subsidiary, which represented our Telesat segment, and realized net cash proceeds of $3,123 million.
Going-Private Costs
Going-private costs of $163 million in 2008 increased $114 million compared to $49 million in 2007. Amounts paid in 2008 included employee retention costs and costs associated with the proposed privatization transaction for financial advisory, professional and consulting fees.
Increase/Decrease in Investments
The cash provided by investments in 2009 and 2007 related to the sales of available-for-sale investments in those periods. The cash used in investments in 2009 represents our purchase of a minority interest investment in the Montréal Canadiens Hockey Club and Bell Centre.
50 BCE INC. 2009 ANNUAL REPORT
MANAGEMENT’S DISCUSSION AND ANALYSIS
Debt Instruments
We use a combination of short-term and long-term debt to finance our operations. Our short-term debt consists mostly of bank facilities and notes payable under commercial paper programs. We usually pay fixed rates of interest on our long-term debt and floating rates on our short-term debt.
2009
We repaid $1,385 million of debt, net of issuances, in 2009. The debt repayments included the redemption of $1,450 million of debentures at Bell Canada and of $650 million of notes at BCE Inc., the repayment of $150 million of credit facilities at Bell Aliant, payments of bank advances and notes payable of approximately $200 million and payments under capital leases. This was partly offset by Bell Canada’s issuance of medium-term debentures having a principal amount of $1 billion and the issuance by Bell Aliant Regional Communications, Limited Partnership of medium-term notes with a principal amount of $350 million.
2008
We repaid $451 million of debt, net of issuances, in 2008, which were primarily payments under capital leases.
2007
We repaid $1,766 million of debt, net of issuances, in 2007. The repayments included $1,175 million of debentures at Bell Canada, $1,135 million of credit facilities at Bell
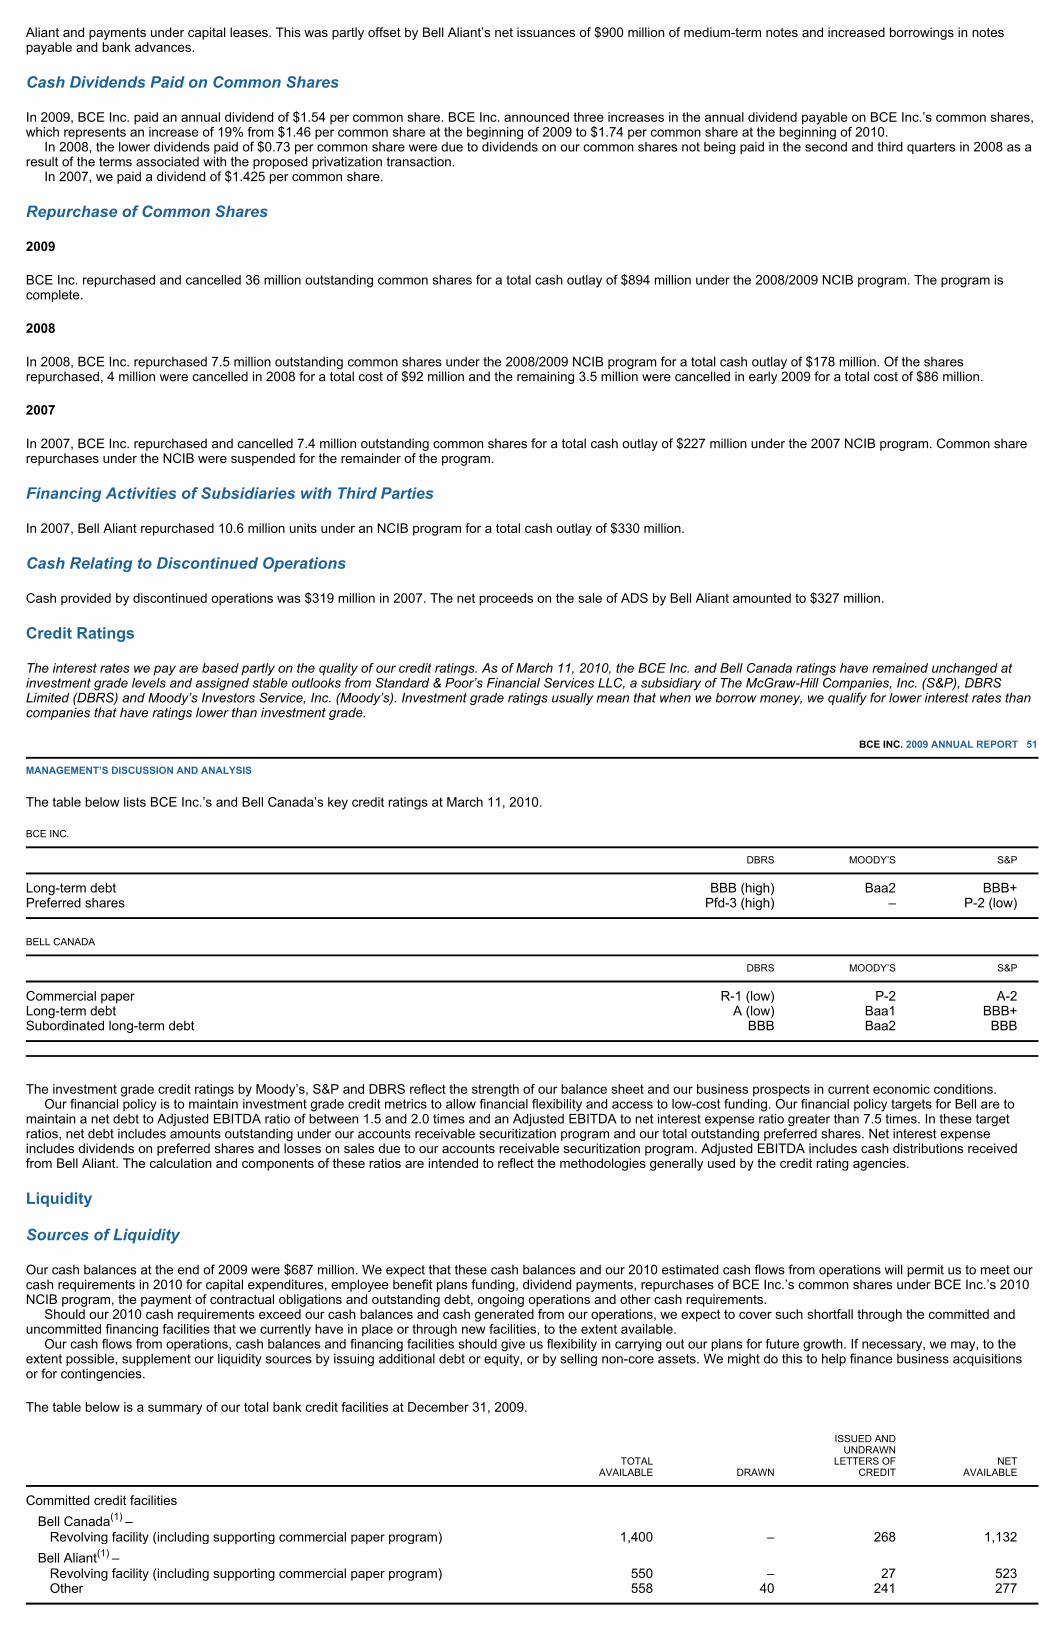
Aliant and payments under capital leases. This was partly offset by Bell Aliant’s net issuances of $900 million of medium-term notes and increased borrowings in notes payable and bank advances.
Cash Dividends Paid on Common Shares
In 2009, BCE Inc. paid an annual dividend of $1.54 per common share. BCE Inc. announced three increases in the annual dividend payable on BCE Inc.’s common shares, which represents an increase of 19% from $1.46 per common share at the beginning of 2009 to $1.74 per common share at the beginning of 2010. In 2008, the lower dividends paid of $0.73 per common share were due to dividends on our common shares not being paid in the second and third quarters in 2008 as a result of the terms associated with the proposed privatization transaction. In 2007, we paid a dividend of $1.425 per common share.
Repurchase of Common Shares
2009
BCE Inc. repurchased and cancelled 36 million outstanding common shares for a total cash outlay of $894 million under the 2008/2009 NCIB program. The program is complete.
2008
In 2008, BCE Inc. repurchased 7.5 million outstanding common shares under the 2008/2009 NCIB program for a total cash outlay of $178 million. Of the shares repurchased, 4 million were cancelled in 2008 for a total cost of $92 million and the remaining 3.5 million were cancelled in early 2009 for a total cost of $86 million.
2007
In 2007, BCE Inc. repurchased and cancelled 7.4 million outstanding common shares for a total cash outlay of $227 million under the 2007 NCIB program. Common share repurchases under the NCIB were suspended for the remainder of the program.
Financing Activities of Subsidiaries with Third Parties
In 2007, Bell Aliant repurchased 10.6 million units under an NCIB program for a total cash outlay of $330 million.
Cash Relating to Discontinued Operations
Cash provided by discontinued operations was $319 million in 2007. The net proceeds on the sale of ADS by Bell Aliant amounted to $327 million.
Credit Ratings
The interest rates we pay are based partly on the quality of our credit ratings. As of March 11, 2010, the BCE Inc. and Bell Canada ratings have remained unchanged at investment grade levels and assigned stable outlooks from Standard & Poor’s Financial Services LLC, a subsidiary of The McGraw-Hill Companies, Inc. (S&P), DBRS Limited (DBRS) and Moody’s Investors Service, Inc. (Moody’s). Investment grade ratings usually mean that when we borrow money, we qualify for lower interest rates than companies that have ratings lower than investment grade.
BCE INC. 2009 ANNUAL REPORT 51
MANAGEMENT’S DISCUSSION AND ANALYSIS
The table below lists BCE Inc.’s and Bell Canada’s key credit ratings at March 11, 2010.
The investment grade credit ratings by Moody’s, S&P and DBRS reflect the strength of our balance sheet and our business prospects in current economic conditions. Our financial policy is to maintain investment grade credit metrics to allow financial flexibility and access to low-cost funding. Our financial policy targets for Bell are to maintain a net debt to Adjusted EBITDA ratio of between 1.5 and 2.0 times and an Adjusted EBITDA to net interest expense ratio greater than 7.5 times. In these target ratios, net debt includes amounts outstanding under our accounts receivable securitization program and our total outstanding preferred shares. Net interest expense includes dividends on preferred shares and losses on sales due to our accounts receivable securitization program. Adjusted EBITDA includes cash distributions received from Bell Aliant. The calculation and components of these ratios are intended to reflect the methodologies generally used by the credit rating agencies.
Liquidity
Sources of Liquidity
Our cash balances at the end of 2009 were $687 million. We expect that these cash balances and our 2010 estimated cash flows from operations will permit us to meet our cash requirements in 2010 for capital expenditures, employee benefit plans funding, dividend payments, repurchases of BCE Inc.’s common shares under BCE Inc.’s 2010 NCIB program, the payment of contractual obligations and outstanding debt, ongoing operations and other cash requirements. Should our 2010 cash requirements exceed our cash balances and cash generated from our operations, we expect to cover such shortfall through the committed and uncommitted financing facilities that we currently have in place or through new facilities, to the extent available. Our cash flows from operations, cash balances and financing facilities should give us flexibility in carrying out our plans for future growth. If necessary, we may, to the extent possible, supplement our liquidity sources by issuing additional debt or equity, or by selling non-core assets. We might do this to help finance business acquisitions or for contingencies.
The table below is a summary of our total bank credit facilities at December 31, 2009.
BCE INC.
DBRS MOODY’S S&P
Long-term debt BBB (high) Baa2 BBB+ Preferred shares Pfd-3 (high) – P-2 (low)
BELL CANADA
DBRS MOODY’S S&P
Commercial paper R-1 (low) P-2 A-2 Long-term debt A (low) Baa1 BBB+ Subordinated long-term debt BBB Baa2 BBB
ISSUED AND UNDRAWN TOTAL LETTERS OF NET AVAILABLE DRAWN CREDIT AVAILABLE
Committed credit facilities Bell Canada(1) –
Revolving facility (including supporting commercial paper program) 1,400 – 268 1,132 Bell Aliant(1) –
Revolving facility (including supporting commercial paper program) 550 – 27 523 Other 558 40 241 277

52 BCE INC. 2009 ANNUAL REPORT
MANAGEMENT’S DISCUSSION AND ANALYSIS
Bell Canada and Bell Aliant may issue notes under their commercial paper programs up to the net available amount of their supporting committed revolving bank credit facilities, which may be drawn at any time. Bell Canada and Bell Aliant had no commercial paper outstanding at December 31, 2009. Our expectations relating to our ability to meet our cash requirements in 2010 with our cash flows from operations and our cash balances are based on certain key economic, market and operational assumptions that are described in the section entitled Business Outlook and Assumptions. For a description of risk factors that could affect our business and, consequently, our cash flows from operations refer to Our Competitive Environment, Our Regulatory Environment and Risks that Could Affect Our Business and Results. In addition, our ability to supplement our liquidity sources by issuing additional debt and equity depends largely on prevailing market conditions and the outlook for our business and credit ratings at the time capital is raised. For a description of risk factors that could affect our ability to issue additional debt or equity refer to the risk entitled If we are unable to raise the capital we need, we may need to limit our capital expenditures or our investments in new business, or try to raise capital by disposing of assets under Risks that Could Affect Our Business and Results.
Cash Requirements
CAPITAL EXPENDITURES
In 2010, our capital spending will be focused on our strategic priorities, demand growth and service quality, reflecting an appropriate level of investment in our networks and services.
EMPLOYEE BENEFIT PLANS FUNDING
Our employee benefit plans include both defined benefit and defined contribution plans, as well as other post-employment benefits. The funding requirements of our employee benefit plans, resulting from valuations of our plan assets and liabilities, depend on a number of factors, including actual returns on pension plan assets, long-term interest rates, plan demographics and pension regulations. Our expected funding for 2010 is detailed in the following table and is subject to actuarial valuations being completed in 2010. An actuarial valuation was last performed on most of our pension plans as at December 31, 2008. For a more detailed description of risks that could cause our actual employee benefit plans funding to differ materially from our current estimates, please refer to the risk entitled We may be required to increase contributions to our employee benefit plans in the future depending on various factors under Risks that Could Affect Our Business and Results.
We expect to contribute approximately $520 million to all of our defined benefit pension plans in 2010, including subsidiary and supplemental plans, subject to actuarial valuations being completed. We also expect, in 2010, to pay approximately $100 million to beneficiaries under other post-employment benefit plans and to contribute approximately $50 million to the defined contribution pension plans. In 2010, funding of our defined benefit pension plans is expected to be lower than 2009 mainly as a result of higher returns on pension plan assets in 2009 and a $500 million voluntary pension contribution made in 2009, partly offset by an increase in the solvency discount rate. Our cash funding estimate does not take into account the proposed federal pension reform announced by the Minister of Finance on October 27, 2009. Bell Canada closed the membership of its defined benefit plan in January 2005 to eliminate its pension obligation volatility in respect of all new employees who now enroll in the defined contribution plan. Similarly in 2006, we announced the phase-out over a ten-year period of post-employment benefits for all employees, which will result in Bell’s post-employment benefits funding being gradually phased out after 2016.
DIVIDEND PAYMENTS
In 2010, the cash dividends to be paid on BCE Inc.’s common shares are expected to be higher than in 2009 as the board of directors of BCE Inc. approved three increases in the annual dividend on BCE Inc.’s common shares in 2009. As a result, BCE Inc.’s common share dividend increased by 19% from $1.46 per common share at the beginning of 2009 to $1.74 per common share at the beginning of 2010. These increases are consistent with BCE Inc.’s common share dividend policy of a target payout ratio of 65% to 75% of Adjusted EPS. BCE Inc.’s dividend policy and the declaration of dividends are subject to the discretion of BCE Inc.’s board of directors.
BCE INC.’S 2010 NCIB PROGRAM
Under BCE Inc.’s 2010 NCIB program, it is authorized to repurchase up to $500 million of its outstanding common shares over the course of 2010. As at February 28, 2010, BCE Inc. has spent approximately $75 million under its 2010 NCIB program.
BCE INC. 2009 ANNUAL REPORT 53
MANAGEMENT’S DISCUSSION AND ANALYSIS
CONTRACTUAL OBLIGATIONS
The following table is a summary of our contractual obligations at December 31, 2009 that are due in each of the next five years and thereafter.
Total committed credit facilities 2,508 40 536 1,932
Non-committed credit facilities Bell Canada 225 2 89 134 Bell Aliant 14 – 1 13
Total non-committed credit facilities 239 2 90 147
Total committed and non-committed credit facilities 2,747 42 626 2,079
(1) Bell Canada’s current $1,400 million supporting committed revolving bank credit facility expires in May 2012 and Bell Aliant’s current $550 million supporting committed revolving bank credit facility expires in July 2011.
2010 EXPECTED FUNDING BELL BELL ALIANT TOTAL
Defined benefit pension – service cost 200 50 250 Defined benefit pension – deficit 170 100 270
Defined benefit 370 150 520 Other post-employment benefits 90 10 100 Defined contribution 40 10 50
Total net benefit plans 500 170 670
2010 2011 2012 2013 2014 THERE-AFTER TOTAL
Long-term debt(1) 357 1,009 513 73 1,559 5,349 8,860 Notes payable and bank advances 53 – – – – – 53 Capital leases 332 363 224 225 199 1,784 3,127 Operating leases 215 185 154 139 127 686 1,506 Commitments for capital expenditures 78 56 98 88 82 826 1,228

Our treasury strategy, executed over the past years, has resulted in an attractive long-term debt maturity schedule. Capital leases include imputed interest of $1,157 million. Rental expense relating to operating leases was $236 million in 2009, $233 million in 2008 and $260 million in 2007. Purchase obligations consist mainly of contractual obligations under service contracts. Our commitments for capital expenditures include investments to expand and update our networks, and to meet customer demand. At December 31, 2009, we had other long-term liabilities that are excluded from the table, including an accrued employee benefit liability, future income tax liabilities, deferred revenue and various other long-term liabilities. The accrued employee benefit liability and future income tax liabilities are excluded as we cannot accurately determine the timing and cash requirements as:
future contributions to the pension plans depend largely on how well they are funded. This varies based on the results of actuarial valuations that are performed periodically and on the investment performance of the pension fund assets. future payments of income taxes depend on the amount of taxable earnings and on whether there are tax loss carryforwards available to reduce income tax liabilities.
Deferred revenue and gains on assets are excluded as they do not represent future cash payments.
OTHER CASH REQUIREMENTS
Our cash requirements may also be affected by the liquidity risks related to our contingencies and off-balance sheet arrangements. We may not be able to quantify all of these risks for the reasons described as follows.
Off-Balance Sheet Arrangements
GUARANTEES
As a regular part of our business, we enter into agreements that provide for indemnifications and guarantees to counterparties in transactions involving business dispositions, sales of assets, sales of services, purchases and development of assets, securitization agreements and operating leases. We cannot reasonably estimate the maximum potential amount we could be required to pay counterparties because of the nature of almost all of these indemnifications. As a result, we cannot determine how they could affect our future liquidity, capital resources or credit risk profile. We have not made any significant payments under these indemnifications in the past. See Note 25 to the consolidated financial statements for more information.
SECURITIZATION OF ACCOUNTS RECEIVABLE
Bell Canada and Bell Aliant have sale of receivable agreements in place that provide them with what we believe is an attractive form of financing compared to debt financing. Under the agreements, Bell Canada and Bell Aliant sold interests in accounts receivable to securitization trusts for a total of $1,305 million. The accounts receivable that were sold must meet minimum performance targets. These are based on specific delinquency, default and receivable turnover ratio calculations, as well as minimum credit ratings. If these accounts receivable fail to meet these performance targets, Bell Canada and Bell Aliant would no longer be able to sell their receivables and would need to find an alternate source of financing. These securitization agreements are an important part of our capital structure and liquidity. If we did not have them, we would have had to issue $1,305 million of additional debt and/or equity to replace the financing they provided at year end. See Note 9 to the consolidated financial statements for more information.
54 BCE INC. 2009 ANNUAL REPORT MANAGEMENT’S DISCUSSION AND ANALYSIS
Litigation
We become involved in various claims and litigation as a part of our business. While we cannot predict the final outcome of claims and litigation that were pending at December 31, 2009, based on information currently available and management’s assessment of the merits of such claims and litigation, management believes that the resolution of these claims and litigation will not have a material and negative effect on our consolidated financial position or results of operations. You will find a more detailed description of the material claims and litigation pending at December 31, 2009 in the BCE 2009 AIF and in Note 24 to the consolidated financial statements.
OUR COMPETITIVE ENVIRONMENT
We face intense competition from cable companies and from other CLECs that could adversely affect our market shares, volumes and pricing strategies and, consequently, our financial results. The rapid development of new technologies, services and products has altered the traditional lines between telecommunications, Internet and broadcasting services and brought new competitors to our markets. Technology substitution and VoIP, in particular, have reduced barriers to entry in our industry. This has allowed competitors to launch new products and services and gain market share with far less investment in financial, marketing, personnel and technological resources than has historically been required. We expect this trend to continue in the future, which could adversely affect our growth and our financial performance. Competition affects our pricing strategies and could reduce our revenues and lower our profitability. We are under constant pressure to keep our prices and service offerings competitive. Changes in our pricing strategies that result in price increases for certain services or products, or changes in pricing strategies by our competitors, could affect our ability to gain new customers and retain existing ones. We need to be able to anticipate and respond quickly to the constant changes in our businesses and markets. If we fail to do so, our business and market position could be adversely affected. The CRTC regulates the prices we can charge for basic access services in areas where it determines there is not enough competition to protect the interests of users. Since August 2007, the CRTC has determined that competition was sufficient to grant forbearance from price regulation for over 90% of Bell Canada’s residential local telephone service lines and over 80% of Bell Canada’s business local telephone service lines in Ontario and Québec. See Our Regulatory Environment for more information. We already have several domestic and foreign competitors. In recent years, the Government of Canada has reviewed the foreign ownership restrictions that apply to telecommunications carriers and to broadcast distribution undertakings. On June 26, 2009, the Competition Policy Review Panel provided its report to the Government of Canada and suggested that the federal government adopt a two-phased approach to foreign participation in the telecommunications and broadcast industry. On March 3 and 4, 2010, the federal government issued its Speech from the Throne and federal budget, respectively, wherein it indicated that the limits on foreign ownership in the Canadian telecommunications industry will be reviewed. No specific proposals were put forward and there are no details regarding the timing of any review of the foreign ownership limits. Removing or easing the limits on foreign ownership could result in more foreign companies entering the Canadian market by making acquisitions or investments. This could result in greater access to capital for our competitors or the arrival of new competitors with global scale, which would increase competitive pressure. Until further details are released, we cannot predict what action the Government of Canada will take and we are unable to determine how any potential reform proposals may affect us.
Wireline
Our main competitors in local and access services are: Rogers Cable Inc. (Rogers Cable); TELUS Corporation (TELUS); Allstream Enterprise Solutions (a division of MTS Allstream Inc.) (Allstream); Primus Telecommunications Canada Inc. (Primus); Vidéotron Ltée (Vidéotron), in Québec; Cogeco Cable Inc. (a subsidiary of Cogeco Inc.) (Cogeco Cable), in Ontario and Québec; Bragg Communications Inc. operating under the Eastlink trade-name, in New Brunswick, Nova Scotia and Prince Edward Island; Maskatel Inc., in Québec; and Shaw Communications Inc. (Shaw), in British Columbia, Alberta, Saskatchewan and Manitoba. Our major competitors in long distance services are: Allstream; TELUS; Primus; Vonage Canada (a division of Vonage Holdings Corp.) (Vonage); dial-around providers, such as Yak and Looney Call, which are divisions of YAK Communications (Canada) Inc. which is owned by Globalive Communications Corporation; prepaid long distance providers, such as Group of Gold Line and Vonage; Cogeco Cable, in Ontario and Québec; Rogers Cable, in Ontario; Vidéotron, in Québec; and Eastlink, in New Brunswick, Nova Scotia and Prince Edward Island. We continue to face cross-platform competition as customers replace traditional services with new and non-traditional technologies. For example, our wireline business competes with VoIP, wireless and Internet services, including chat services, instant messaging and e-mail. Industry Canada’s licensing of AWS spectrum to ten new potential wireless competitors, one of which already started providing services, as discussed in more detail below, could result in additional technology substitution. We are facing significant competitive pressure from cable companies as a result of them offering voice services over their networks. Cable telephony is being driven by
Purchase obligations 1,364 994 696 360 350 887 4,651 Interest payable on long-term debt, notes payable
and bank advances 567 530 470 450 400 5,516 7,933 Net interest receipts on derivatives (32) (23 ) (13 ) (8 ) (3 ) (2 ) (81 )
Total 2,934 3,114 2,142 1,327 2,714 15,046 27,277
(1) Includes $750 million of long-term debt maturing in 2011, comprised of Bell Aliant’s $750 million 4.72% Series 1 medium-term notes.

its inclusion in discounted bundles and is now offered by cable operators in most major and mid-sized communities and in small communities as well. Although we expect the rate of expansion of the cable companies’ footprints to moderate, cable companies will continue to put downward pressure on our
BCE INC. 2009 ANNUAL REPORT 55
MANAGEMENT’S DISCUSSION AND ANALYSIS
market share, especially in the residential market. This could continue to have an adverse effect on our business and results of operations. Although we expect the rate of our residential NAS losses in 2010 to remain relatively steady and the rate of our business NAS losses to improve, there is a risk that adverse changes in certain factors, including, in particular, competitive actions by cable providers and higher wireless substitution that may result especially from new entrants starting to provide wireless services at lower prices relative to our prices and those of other existing wireless service providers, may result in acceleration, beyond our current assumptions, in our rates of NAS erosion. This could have an adverse effect on our results of operations. Furthermore, additional competitive pressure from the adoption of alternative technologies, products and services is making significant inroads into our legacy services, which typically represent our higher-margin business. Prices for long distance services have been declining since this segment was opened to competition. Our long distance services continue to face intense competitive pressure given the expanded presence of cable telephony and the continuing impact of non-traditional suppliers, including prepaid card suppliers, dial-around services and VoIP providers, as well as from traditional competitors such as inter-exchange carriers and resellers. We also experience competition from telecommunications providers such as Skype Technologies (a division of eBay) that provide long distance service at low prices using personal computers and broadband connections. Competition for contracts to supply long distance services to large business customers is very intense. Customers may choose to switch to competitors that offer lower prices to gain market share. Such competitors may be less concerned about the quality of service or impact on their margins than we are. Competitors are also offering IP-based telephony to business customers at attractive prices. In Bell Aliant’s residential markets, competition for most product lines is well established. Competition for local telephone service is most established in Nova Scotia and Prince Edward Island, where it was introduced in the residential market in 1999 and 2001, respectively. In more recent years, the competitive local service market has continued to expand with the introduction of local service competition in New Brunswick and Newfoundland and Labrador, as well as in Ontario and Québec. In the business customer base, Bell Aliant operates in an increasingly competitive marketplace, with competition emerging from VoIP providers, cable television operators and system integrators. The current competitive environment suggests that the number of our legacy wireline customers and the volume of our long distance traffic will continue to decline in the future. Continued decline will lead to reduced economies of scale in those businesses and, in turn, lower margins. Our strategy is to seek to mitigate these declines through cost reductions and by building the business for newer growth services, but the margins on newer services are generally less than the margins on legacy services and we cannot provide any assurance that our efforts will be successful. If legacy services margins decline faster than the rate of growth in margins for our newer growth services, our financial performance could be adversely affected. In addition, if a large portion of the customers who stop using our voice services also cease using our other services, our financial performance could be adversely affected. Bringing to market new growth products and services is expensive and inherently risky as it requires capital and other investments at a time when the demand for the products or services is uncertain. It may also require us to compete in areas outside our core connectivity business against highly capable competitors. The launch of new products or services could be delayed or cancelled due to reductions in the amount of available capital to be invested. Any such delay or cancellation could have an adverse effect on our business, cash flows and results of operations.
Wireless
Competition for subscribers to wireless services is based on price, products, services and enhancements, technical quality, coverage and capacity of the wireless networks, customer service and distribution. The Canadian wireless telecommunications industry is highly competitive. We compete for wireless subscribers, dealers and retail distribution outlets, content and device access, and personnel directly with the following wireless service providers: Rogers Wireless Inc. (including its subsidiary Fido Solutions Inc.), TELUS Mobility (a business unit of TELUS), Globalive Wireless Management Corp. (Globalive), and with a multitude of resellers known as mobile virtual network operators that aggressively introduce, price and market their products and services. We expect competition to intensify as new technologies, products and services are developed which could adversely affect our ability to achieve our subscriber additions and ARPU targets. For example, mobile handsets that bypass wireless service providers’ networks to access the Internet are now available from a number of manufacturers and service providers. If these products significantly penetrate the marketplace, usage of our wireless networks may decline, which could adversely affect our wireless revenues. Competition is also expected to increase as a result of Industry Canada’s licensing of AWS spectrum to ten new facilities-based wireless competitors that each acquired spectrum in separate regions, many of which overlap. In addition to Globalive, which started providing services in Toronto and Calgary in December 2009, and which may launch services in other cities in 2010 where Globalive owns spectrum, and Data and Audio Visual Enterprises Wireless Inc. (DAVE), which has announced its launch for spring 2010 in Toronto, spectrum was also awarded to the following entities, or one of their affiliates, which have indicated launch dates of mid-2010 or later: Shaw, Vidéotron, Bragg Communications Inc., Public Mobile Inc., Celluworld Inc., Rich Telecom Corp., Blue Canada Wireless Inc. and Novus Wireless Inc. The increase in the level of competitive intensity in the Canadian wireless industry will depend on when and in what regions these new competitors will start providing wireless
56 BCE INC. 2009 ANNUAL REPORT
MANAGEMENT’S DISCUSSION AND ANALYSIS
services, as well as their pricing, marketing and other strategies. In order to gain market share, the new wireless competitors’ strategies are expected to include price discounting relative to our and other incumbents’ pricing as well as increased competition at the distribution level. The pricing and other strategies of these new wireless competitors, as well as the pricing and other strategies of existing wireless service providers in response to the new wireless competitors’ actions, could adversely affect our ability to gain new customers and retain existing ones and require us to adjust our own pricing and other strategies, which in turn could have an adverse effect on our business and results of operation. The new wireless carriers could achieve higher market shares than we currently expect particularly as a result of their pricing strategies and focused product offerings. The ultimate number and viability of new competitors will remain unknown until they actually commence operations or make specific announcements in relation thereto. See Our Regulatory Environment – Radiocommunication Act – AWS Spectrum for more details on this subject. The wireless communications industry commits significant resources to research and development (R&D). A majority of this work is expended in the refinement of mainstream wireless standardization activities that result in highly successful technology such as HSPA and long-term evolution (LTE). Some of this technology is transferable into competing or complementary technology tracks that can be standards-based in the case of wireless fidelity (Wi-Fi) and WiMAX or proprietary vendor-specific solutions. Although these technology tracks have not gained significant revenue market share in Canada, we expect that continued development and refinement of the business model will increase competition. Pressures on our ARPU, COA and costs of retention would likely result if competitors increase subsidies for handsets, particularly for smartphones, lower airtime and wireless data prices and offer other incentives to attract new customers. Wireless competition has also intensified due to an increased emphasis on multi-product bundles and new data plans. This emphasis could also pressure our ARPU and increase churn and COA.
Internet Access
We compete with cable companies and Internet service providers (ISPs) to provide high-speed and dial-up Internet access and related services. In particular, cable companies have focused on increased bandwidth and discounted pricing on bundles to compete against us, which could directly affect our ability to maintain ARPU performance and could adversely affect our results of operations. Cable companies have aggressively rolled out Internet networks offering higher speeds to their customers, forcing us to incur significant capital expenditures in order to also be able to offer higher speeds on our networks. The failure to make continued investments in our Internet networks enabling us to offer Internet services at higher speeds to our customers as well as our inability to offer a different range of products and services compared to our competitors would adversely affect the pricing of our products and services and our results of operations. Furthermore, as penetration of the Canadian broadband Internet market reaches higher levels, the possibility to acquire new customers increasingly depends on our ability to win customers away from our competitors. However, as customers increasingly choose to bundle services, our ability to acquire customers from our competitors is adversely affected. Developments in wireless broadband services may also lead to increased competition in certain geographic areas. This could have an adverse effect on the financial performance of our Internet access services business. In the high-speed Internet access services market, we compete with large cable companies such as: Rogers Cable, in Ontario and New Brunswick, Nova Scotia and Prince Edward Island; Vidéotron, in Québec; Cogeco Cable, in Ontario and Québec; Eastlink, in New Brunswick, Nova Scotia and Prince Edward Island; and Persona Communications Inc., which was acquired by Eastlink in 2007, in all provinces except New Brunswick, Nova Scotia and Prince Edward Island.
Video
Competition for subscribers is based on the number and kinds of channels offered, quality of the signal, STB features, availability of service in the region, price and customer service. Bell TV competes throughout Canada directly with Shaw Direct (a business unit of Shaw Communications Inc.), which like Bell TV operates a DTH satellite TV service, and with cable companies across Canada. Most of these cable companies continue to upgrade their networks, operational systems and services, which will improve their competitiveness. This could negatively affect our financial performance. Bell Canada holds broadcasting distribution licences for major centres in Ontario and Québec to offer video services on a wireline basis. Bell Canada and Bell TV offer video services through DTH satellite, VDSL and hybrid fibre co-axial cable. Bell Canada is currently offering IPTV services on a limited basis and intends to start offering IPTV services on a broader basis in the course of 2010 starting with the cities of Toronto and Montréal. The launch of our IPTV services will provide us the opportunity to gain market share and enhance our competitive position in core urban markets starting with the cities of Toronto and Montréal. Bell TV’s and Bell Canada’s competitors also include Canadian cable companies such as: Rogers Cable, in Ontario, New Brunswick and Newfoundland; Vidéotron, in Québec; Cogeco Cable, in Ontario and Québec; Shaw, in British Columbia, Alberta, Saskatchewan, Manitoba and northwestern Ontario; Eastlink, in New Brunswick, Nova Scotia and Prince Edward Island; and Persona Communications Inc., in all provinces except New Brunswick, Nova Scotia and Prince Edward Island. In addition to these traditional video competitors, certain traditional telephone companies have recently launched or are contemplating the launch of IPTV services that would compete with Bell TV in certain markets.

BCE INC. 2009 ANNUAL REPORT 57
MANAGEMENT’S DISCUSSION AND ANALYSIS
Bell TV continues to face competition from unregulated U.S. DTH satellite television services that are sold illegally in Canada. In response, we are participating in legal actions that are challenging the sale of U.S. DTH satellite television equipment in Canada. This competition and the outcome of the related legal actions could have an adverse effect on the business and results of operations of Bell TV. In addition to the licenced broadcast distribution undertakings noted above, new unregulated video services and offerings available over high-speed Internet connections are beginning to compete with traditional television services. The continued growth and adoption by customers of these alternative TV services could negatively affect the financial performance of Bell TV and Bell Canada.
Wholesale
The main competitors in our wholesale business include both traditional carriers and emerging carriers. Traditional competitors include Allstream and TELUS, both of which may wholesale some or all of the same products and services as Bell Canada. Non-traditional competitors include electrical utility-based telecommunications providers, cable operators, domestic CLECs and U.S.-based carriers for certain services. Despite intense competitive pressure, our new products and unregulated services markets continue to grow. However, growth of end-user technologies such as VoIP is continuing to increase pressure on some legacy product lines.
OUR REGULATORY ENVIRONMENT
This section describes the legislation that governs our businesses, and provides highlights of recent regulatory initiatives and proceedings and government consultations that affect us. Bell Canada, Bell Aliant and several of Bell Canada’s direct and indirect subsidiaries and significantly influenced companies, including NorthernTel, Limited Partnership (NorthernTel), Télébec, Limited Partnership (Télébec), Northwestel, Bell Mobility and Bell TV, are governed by the Telecommunications Act, the Broadcasting Act, the Radiocommunication Act and the Bell Canada Act. Our business is affected by decisions made by various regulatory agencies, including the CRTC. The CRTC, an independent agency of the Government of Canada, is responsible for regulating Canada’s telecommunications and broadcasting industries. Other aspects of the businesses of these companies are regulated in various ways by federal government departments, in particular Industry Canada.
Telecommunications Act
The Telecommunications Act governs telecommunications in Canada. It defines the broad objectives of Canada’s telecommunications policy and provides the Government of Canada the power to give general direction to the CRTC on any of these objectives. It applies to several of the Bell Canada companies and partnerships, including Bell Canada, Bell Mobility, Bell Aliant, NorthernTel, Northwestel and Télébec. Under the Telecommunications Act, all telecommunications common carriers must seek regulatory approval for all proposed tariffs for telecommunications services, unless the services are exempt from regulation or are not regulated. The CRTC may exempt an entire class of carriers from regulation under the Telecommunications Act if the exemption meets the objectives of Canada’s telecommunications policy. The Telecommunications Act includes the following ownership requirements for companies, such as Bell Canada, Bell Aliant and Bell Mobility, that operate as telecommunications common carriers:
they must be eligible to operate as Canadian carriers; they must be Canadian owned and controlled corporations. Direct ownership must be at least 80% Canadian ownership of voting shares and indirect ownership, such as indirect ownership through BCE Inc., must be at least 662/3% Canadian ownership of voting shares; they must not otherwise be controlled by non-Canadians; and at least 80% of the members of their board of directors must be Canadian.
BCE Inc. monitors and periodically reports on the level of non-Canadian ownership of its common shares.
Key Telecommunications Issues
This section describes key regulatory issues which are being addressed, or have been addressed in past years, that influence or have influenced our business and may continue to affect our flexibility to compete in the marketplace.
COMMITMENT UNDER THE CRTC DEFERRAL ACCOUNT MECHANISM
Bell Canada’s accumulated deferral account commitment is estimated at $488 million. The clearing of the deferral account is subject to CRTC approval. In Telecom Decision 2008-1, the CRTC approved Bell Canada’s proposed initiatives to improve access to telecommunications services for persons with disabilities using $24 million from its deferral account. The CRTC determined that these funds should be fully utilized within a four-year period ending in 2011, and directed Bell Canada to file a report each year, by March 31, providing updates on the status. The CRTC also approved the use of deferral account funds to fund the uneconomic cost of expanding broadband services to 112 communities, and determined that the remainder in Bell Canada’s deferral account should be returned to residential customers in urban, non-high-cost serving areas within the Ontario and Québec portions of the serving areas of Bell Canada and Bell Aliant. Pursuant to the follow-up processes related to Telecom Decision 2008-1, on February 26, 2010, Bell Canada and Bell Aliant advised the CRTC that as part of their deferral account-funded broadband expansion program, they intended to provide wireless broadband services to the approved communities and indicated that the uneconomic cost of this program would
58 BCE INC. 2009 ANNUAL REPORT MANAGEMENT’S DISCUSSION AND ANALYSIS
be approximately $454 million, leaving $10 million for returns to eligible customers. On January 29, 2010, Bell Canada and Bell Aliant also filed their proposals on the manner in which funds would be returned to customers, and will be filing additional information in this regard on March 15, 2010. CRTC approval of these proposals is pending, and a decision is expected later this year.
REVIEW OF REGULATORY FRAMEWORK FOR WHOLESALE SERVICES
In light of several CRTC decisions and appeals to the Governor-in-Council, the CRTC is required to rule on several wholesale issues by September 1, 2010. An oral proceeding is scheduled to begin on May 31, 2010 and will include a consideration of whether aggregated wholesale DSL services must be made available at speeds equivalent to the incumbents’ retail offerings (speed-matching). This proceeding will also include an examination of the appropriateness of mandating access to any new types of Internet access infrastructure as well as whether the respective wholesale obligations imposed on incumbent telephone companies and cable companies are equitable or represent a competitive disadvantage. The CRTC will examine whether such wholesale obligations: 1) would unduly diminish incentives to invest in new network infrastructure, 2) are necessary to enable sufficient competition to protect the interest of users, and 3) unduly impair the ability of incumbent telephone companies to offer new converged services like IPTV. This proceeding introduces the possibility that new additional wholesale obligations could be imposed on Bell Canada or that, on a going-forward basis, certain wholesale services could be priced at lower rates. Neither would have a retroactive effect on current rates or revenues. Depending on the outcome, these issues could, however, require Bell Canada to modify its investment plans and its retail and wholesale commercial practices, pricing and plans.
REVIEW OF UNBUNDLED LOCAL LOOP RATES
On June 2, 2009, Bell Canada and Bell Aliant proposed changes to the existing rates for their wholesale service that provides unbundled local loops to competitors in their Ontario and Québec serving areas, and requested the CRTC to make the current rates interim until it issues its final determination. The companies filed updated cost studies to support their tariff application. On December 14, 2009, the CRTC issued Telecom Order 2009-775 and made the current loop rates interim, pending a complete review of the companies’ updated cost studies. The process is scheduled to conclude on May 28, 2010, with unbundled loop rates expected to be finalized within 120 days of the close of the record. The CRTC’s newly determined rates may then be retroactively applied to the date of interim approval (December 14, 2009).
REVIEW OF SUPPORT STRUCTURE RATES
In August 2009, the CRTC launched a proceeding to review the large incumbent local exchange carriers’ (ILECs) support structure service rates and declared that each ILEC’s current support structure service rates have interim approval effective the date of the CRTC’s notice. This proceeding will review the rates that competitors must pay ILECs such as Bell Canada in order to lease space on the poles and underground conduit owned by the ILECs. Current support structure rates are expected to increase given the rise in costs since the last review, which ended in 1993, but there is also a slight risk that they will decrease. A decision is expected in the fourth quarter of 2010, after which the new rates may be retroactively applied to competitors back to the date of interim approval.
REVIEW OF THE INTERNET TRAFFIC MANAGEMENT PRACTICES (ITMPS) OF ISPS

On November 20, 2008, the CRTC issued Telecom Public Notice 2008-19 where it initiated a proceeding to consider ITMPs for retail and wholesale Internet services. The CRTC sought comments with supporting rationale on the changes in bandwidth consumption that can lead to network congestion, technical or economic ITMPs that are currently available or may be developed in the future, and the impact of these practices on end-users. In addition, the CRTC examined the appropriateness of implementing regulatory measures in relation to Internet traffic management by ISPs. The CRTC issued its decision on October 21, 2009, in which it: preserved ISPs’ flexibility to manage their networks and established certain transparency requirements. The CRTC approved the use of technical ITMPs, including application-specific ITMPs such as those applied by Bell Canada; encouraged the use of economic ITMPs such as usage-based billing; established a framework against which future complaints about traffic management will be assessed; and established certain privacy and notification requirements with which Bell Canada is already largely compliant.
PROCEEDING TO REVIEW ACCESS TO BASIC TELECOMMUNICATIONS SERVICES AND OTHER MATTERS
The CRTC has a $208 million subsidy (contribution) regime (using 2009 data) to support local service in high-cost (i.e. rural and remote) areas. This subsidy is funded by an industry tax on revenues which was set at 0.81% of eligible telecom revenues in 2009. While Bell Canada draws monies from the contribution subsidy fund, it is also the largest payer into the fund. On January 28, 2010, the CRTC initiated a proceeding to review issues associated with access to basic telecommunications service. The proceeding will include a review of the obligation to serve, the basic service objective, and the local service subsidy (contribution) regime. It will also re-examine the local competition and wireless number portability frameworks in the territories of the small ILECs. Finally, as wireless data was forborne completely from retail and wholesale regulation in 1996, the CRTC will examine whether it would be appropriate to modify the wireless data forbearance framework in order for the guidelines established in the previously mentioned ITMPs proceeding to be applicable to wireless service providers.
BCE INC. 2009 ANNUAL REPORT 59
MANAGEMENT’S DISCUSSION AND ANALYSIS
The proceeding will include a two-week oral hearing scheduled to begin on October 25, 2010. This proceeding may result in changes to various regulatory regimes, including possible increased annual contributions to the subsidy regime, which could have an adverse effect on Bell Canada’s business and financial results. A decision is expected in the first quarter of 2011.
Broadcasting Act
The Broadcasting Act assigns the regulation and supervision of the broadcasting system to the CRTC. Key policy objectives of the Broadcasting Act are to:
protect and strengthen the cultural, political, social and economic fabric of Canada; and encourage the development of Canadian expression.
Most broadcasting activities require a broadcasting licence or broadcasting distribution licence from the CRTC. The CRTC may exempt broadcasting undertakings from complying with certain licensing and regulatory requirements if the CRTC is satisfied that complying with those requirements will not materially affect the implementation of Canadian broadcasting policy. A corporation must meet the following ownership requirements to obtain a broadcasting or a broadcasting distribution licence:
it must be Canadian-owned and controlled. At least 80% of all outstanding and issued voting shares and at least 80% of the votes must be beneficially owned directly by Canadians; it must not otherwise be controlled by non-Canadians; at least 80% of the board of directors, as well as the Chief Executive Officer (CEO), must be Canadian; and at least 662/3% of all outstanding and issued voting shares, and at least 662/3% of the votes of the parent corporation must be beneficially owned and controlled, directly or indirectly, by Canadian interests.
If the parent corporation of a broadcasting licencee has fewer than 80% Canadian directors on its board of directors, a non-Canadian CEO or less than 80% Canadian ownership, the parent corporation must demonstrate to the CRTC that it or its directors do not have control or influence over any of the broadcasting licencee’s programming decisions. Corporations must have the CRTC’s approval before they can transfer effective control of a broadcasting licencee. The CRTC may impose certain requirements, including the payment of certain benefits, as a condition of the transfer. The Canadian ownership rules for broadcasting licencees, such as Bell TV, set out in the Direction to the CRTC (ineligibility of Non-Canadians) issued by the Governor General in Council under the Broadcasting Act, restrict allowable foreign investments in voting shares at the licencee operating company level, and at the level of any broadcasting licencee, to a maximum of 20%, and at the holding company level to a maximum of 331/3%. Because BCE Inc. previously held a broadcasting licence as a limited partner in Bell TV, BCE Inc. was also subject to the 20% foreign ownership limit for broadcasting licencees. However, following a recent corporate reorganization, BCE Inc. has ceased to be a broadcasting licencee, with the result that foreign ownership in BCE Inc. is now permitted up to a maximum of 331/3%. Bell Canada holds broadcasting distribution licences, for major centres in Ontario and Québec, to offer video on a wireline basis. In addition, Bell TV, Bell Aliant, Northwestel and Cablevision du Nord du Québec Inc., a Télébec subsidiary, have broadcasting distribution licences that allow them to offer services. Bell TV is permitted to offer services nationally. Bell Aliant is permitted to offer services in Newfoundland and Labrador, Nova Scotia and New Brunswick. Télébec is permitted to offer services in specific areas of Ontario and Québec. Northwestel is permitted to offer services in specific areas of the Northwest Territories.
Bell TV
Bell TV is subject to programming and carriage requirements under CRTC regulations. Changes to the regulations that govern broadcasting could negatively affect Bell TV’s competitive position or the cost of providing its services. Bell TV’s DTH satellite television distribution undertaking licence was renewed in March 2004 and expires on August 31, 2010. While we expect this licence will be renewed at term, there is no assurance that this will happen, or of the terms under which renewal will be granted. On October 30, 2008, the CRTC issued Broadcasting Public Notice 2008-100, in which it established its regulatory frameworks for broadcast distribution undertakings and discretionary programming services, and set out its policies related to signal carriage and distant signals. The majority of the CRTC’s determinations are to be implemented on August 31, 2011 and in certain respects will provide Bell TV a measure of added flexibility in service packaging. The CRTC rejected the over-the-air broadcasters’ fee-for-carriage proposal, which would have required cable and satellite operators to pay for the right to carry local signals. However, the CRTC determined that cable and satellite operators would be required, starting in September 2009, to contribute 1% of their annual revenue to a new local programming improvement fund (LPIF) administered by an independent third party chosen by the Canadian Association of Broadcasters (CAB). The CRTC’s Broadcasting Public Notice 2008-100 also altered its policies regarding delivery of distant or out-of-market signals. Cable and satellite operators can continue to deliver these signals without consent or fees within the province of origin but will require the permission of broadcasters to deliver the signals to subscribers in other provinces. The CRTC determined that broadcasters and cable and satellite operators should negotiate the terms under which the signals will be delivered but that it will arbitrate disputes when parties are unable to reach mutually satisfactory agreements. Those negotiations have subsequently been suspended pending the determination of the FFC/VFS (as defined below) hearings described below.
60 BCE INC. 2009 ANNUAL REPORT MANAGEMENT’S DISCUSSION AND ANALYSIS
On March 27, 2009, the CRTC announced that it would reexamine the LPIF in its consultation on licence renewals for private conventional television stations to determine if the 1% contribution will provide sufficient support for local programming in non-metropolitan markets, either on a short-term or a longer-term basis. At the same time, and in light of the impact of the current economic uncertainty on broadcasters, the CRTC announced that it would again address the issue of fee-for-carriage for local signals as part of its spring 2010 licence renewal process. On July 6, 2009, and before the LPIF was implemented, the CRTC issued a decision increasing the required amount to be contributed by cable and satellite operators to 1.5% and deciding that funds generated by the LPIF do not need to be spent on additional local programming by TV stations. Subsequently, regulations were issued under the Broadcasting Act requiring cable and satellite operators to commence paying the LPIF as of September 1, 2009. In order to meet the CRTC’s orders without impacting the current and future quality of our products and services, Bell TV has decided to apply a monthly fee to customer bills which will not exceed 1.5% of the total monthly Bell TV charges incurred by a customer on and after September 1, 2009. The CRTC held a public hearing from November 16 to November 27, 2009 to, among other things, consider the appropriate contribution level for the LPIF. There can be no assurance that the LPIF contribution level will be reduced, maintained, or increased. On August 11, 2009, the CRTC also decided to consider whether it would be appropriate for over-the-air broadcasters to be compensated for the “value” of their conventional TV signals. This form of compensation is commonly called fee-for-carriage (FFC) but is referred to by the CRTC as value for signal (VFS). Under one proposal, all distributors, including Bell TV, would be required to compensate the conventional broadcasters in order to distribute their signals. The CRTC held a public hearing from November 16 to November 27, 2009 to consider whether FFC/VFS is appropriate and, if so, how it should be implemented. In addition, the CRTC held a public hearing from December 7 to December 11, 2009, after being ordered to do so by the Governor-in-Council, in order to issue a report to the Governor-in-Council on FFC/VFS taking into account how FFC/VFS would impact the affordability of cable and satellite TV services and the impact of FFC/VFS, on the broadcast industry. Because it is uncertain whether a FFC/VFS regime will be adopted, or at what levels, we are unable to estimate the potential impact of FFC/VFS at this time. The CRTC is required to issue a report to the Governor-in-Council on the FFC/VFS issue as soon as practicable.
Radiocommunication Act
Industry Canada regulates the use of radio spectrum by Bell Canada, Bell Mobility and other wireless service providers under the Radiocommunication Act. Under the

Radiocommunication Act, Industry Canada ensures that radio communication in Canada is developed and operated efficiently. The Minister of Industry has the discretion to:
issue and amend radio licences set technical standards for radio equipment establish licensing conditions decide how radio spectrum is allocated and used.
Under the Radiocommunication Regulations, companies that are eligible for radio licences, such as Bell Canada and Bell Mobility, must meet the same ownership requirements that apply to corporations under the Telecommunications Act. The Radiocommunication Act contains provisions which make it a criminal offence to manufacture, offer for sale or sell any device used to decode an encrypted subscription signal in connection with unauthorized reception of satellite signals. Bell TV, Bell Canada, the CAB and members of Canada’s broadcasting production community continue to encourage the Government of Canada to strengthen the Radiocommunication Act in order to combat the black market in signal theft.
Spectrum Licences
Companies must have a spectrum licence to operate wireless systems in Canada. The Minister of Industry awards spectrum licences, through a variety of methods, at his or her discretion under the Radiocommunication Act. While we anticipate that the licences under which we provide cellular and personal communications services (PCS) willbe renewed at term, there is no assurance that this will happen. In Industry Canada’s November 28, 2007 decision regarding the licensing and auction policy for the auctioning of AWS spectrum, Industry Canada indicated that an upcoming consultation regarding the renewal process may affect the renewal of both existing cellular and PCS as well as future AWS spectrum licence renewals. Industry Canada can revoke a company’s licence at any time if the company does not comply with the licence’s conditions. Moreover, in its AWS decision, Industry Canada indicated that even with full compliance with the conditions of a licence, Industry Canada could withdraw a licence based on circumstances in existence at the time of renewal. While we believe that we comply with the conditions of our licences, there is no assurance that Industry Canada will agree. Should there be a disagreement, this could have a negative effect on our business and financial results. As a result of a 2003 Industry Canada decision, the cellular and PCS licences under which we provide service, which would have expired on March 31, 2006, will now expire in 2011. The PCS licences that were awarded in the 2001 PCS auction will expire on November 29, 2011. As a result, our cellular and PCS licences are now classified as “spectrum licences”, that is, licences issued on a geographic basis rather than on a radio-site-by-radio-site basis, with a standard ten-year licence term.
Wireless and Radio Towers
In its November 28, 2007 AWS decision, Industry Canada adopted a new policy which mandates the sharing of wireless towers and cell sites at commercial rates, where technically feasible, and prohibits exclusive rooftop arrangements with landlords. On February 29, 2008, Industry Canada issued its conditions of licence for mandated roaming and antenna
BCE INC. 2009 ANNUAL REPORT 61
MANAGEMENT’S DISCUSSION AND ANALYSIS
tower and site sharing and to prohibit exclusive site arrangements. On November 21, 2008, the conditions of licence came into effect, incorporating the arbitration rules and procedures issued on the same day. As noted by Industry Canada, the revised conditions of licence are intended to facilitate competitive entry into the Canadian wireless market and, taken collectively, are intended to result in increased competition. On April 14, 2009, Industry Canada issued its guidelines for compliance with its conditions of licence for mandated roaming and antenna tower and site sharing. The guidelines outlined the content which should be included in requests for preliminary tower and cell site information and established the time lines for licencee response. Industry Canada also clarified its tower space reservation considerations with respect to licencee’s future requirements and third-party contracts, as well as its site access and confidentiality requirements. Due to the nature and number of uncertainties that remain concerning mandated tower sharing, we are unable to estimate the potential impact of the revised conditions of licence on our business at this time.
Consultation on the Renewal of Cellular and PCS Spectrum Licences
Spectrum licences are issued with a ten-year term. Bell Mobility holds a number of cellular and PCS spectrum licences that expire in 2011 and that are used for providing cellular and PCS services. Industry Canada’s policy for spectrum licences is to hold consultations two years prior to licence expiry to consider the renewal of existing licences as well as the terms and conditions that will apply to renewed licences. Accordingly, on March 25, 2009, Industry Canada initiated a consultation to consider the renewal of those cellular and PCS spectrum licences which expire in 2011. The proposed renewal conditions of licence include retention of the ten-year licence term and elimination of the implementation of spectrum usage requirement. Industry Canada has also indicated that the current R&D investment requirement is under active consideration in the concurrent consultation regarding changes to Canada’s spectrum auction framework (see below Consultation on Revisions to the Framework for Spectrum Auctions in Canada). Industry Canada has commissioned a separate study to assess the current market value of cellular and PCS spectrum as input into its consideration of renewal fees. This study was completed for Industry Canada late in the fourth quarter of 2009 and is expected to be publicly released late in the first quarter or in the second quarter of 2010. It will include an international fee comparison and a review of auction prices paid for similar spectrum in Canada as well as internationally. The Industry Canada decision on renewal fees has the potential to significantly affect the cost of spectrum for all carriers including Bell Mobility. Bell Mobility filed comments in response to the initial Industry Canada consultation on May 29, 2009 and filed reply comments on June 30, 2009. Among other things, Bell Mobility argued for indefinite or 20-year licence terms, as opposed to the ten-year term proposed by Industry Canada. Bell Mobility also argued that no renewal fees should apply at all, but if any such fees are imposed, that they should be restricted to a level sufficient to recover Industry Canada’s cost of managing the spectrum, as is currently the case in the U.S. It is not possible to estimate, at this time, the impact that Industry Canada’s conclusions will have on our operations and financial results.
Consultation on Revisions to the Framework for Spectrum Auctions in Canada
On April 8, 2009, Industry Canada initiated the previously announced consultation regarding, among other issues, the renewal of long-term spectrum licences. The consultation, which considers changes to the 2001 Framework for spectrum auctions in Canada, invites comments on: the use of auction types other than the currently used simultaneous multiple-round ascending auction format; the use of auctions to award satellite licences; restructuring the tier service areas for licensing so as to distinguish between rural and urban areas; and on the continued need for the condition of licence requiring that licencees invest a percentage of their adjusted gross revenues in R&D. Industry Canada’s consultation also invites comments on the renewal of long-term, or ten-year, auctioned and non-auctioned spectrum licences including Industry Canada’s proposal to apply licence fees to subsequent terms beyond the initial ten-year term. Industry Canada also seeks comments on its proposal that licence fees, applicable in subsequent renewal terms, be based on an estimation of the market value of the spectrum in question. Industry Canada has stated that market value could be estimated by considering fees for similar spectrum in Canada, the fees charged for similar spectrum in other jurisdictions, or as reflected in the prices paid at auction for similar spectrum. Determining the market value of spectrum will likely be a contentious issue and could significantly affect the cost of spectrum for all carriers, including Bell Mobility. Bell Mobility filed its comments on June 15, 2009, and reply comments on July 15, 2009. Among other things, Bell Mobility argued for significantly longer licence terms and supported Industry Canada’s proposal to remove the 2% R&D investment requirement applicable to cellular and PCS licences. The 2% R&D condition of licence requires licencees to invest an amount equal to a minimum of 2% of the adjusted gross revenues derived from its operations using the spectrum in telecommunications-related R&D. In 2008, Bell Mobility’s R&D requirement amounted to $48 million. It is not possible to estimate, at this time, the impact that Industry Canada’s conclusions will have on our operations and results.
Consultation on Transition to Broadband Radio Services (BRS) in the Band 2500–2690 Megahertz (MHz)
In March 2009, Industry Canada issued its long anticipated consultation which addresses issues surrounding the implementation of mobile service in the 2500 MHz band. The consultation is the next phase in Industry Canada’s 2006 2500
62 BCE INC. 2009 ANNUAL REPORT
MANAGEMENT’S DISCUSSION AND ANALYSIS
MHz policy, which enables use of the Bell–Rogers Inukshuk Wireless Inc. spectrum for mobile services, provided that approximately one-third of the licensed (fixed-use) spectrum is returned to Industry Canada. Among other things, the consultation addresses whether to apply a firm transition date to existing multipoint communication system (MCS) and multipoint distribution service (MDS) licences, the criteria to be used when issuing BRS licences, treatment of incumbents and proposed licence conditions applicable to BRS licences. Regarding licence fees, Industry Canada indicated its intention to consult on a new licence fee regime that will apply to BRS licences. The consultation also indicates that a forthcoming stakeholder proposal development (SPD) process would facilitate discussions among incumbents with the goal of developing proposals for an internationally compatible band plan for BRS. A joint submission, on behalf of Bell Canada, Inukshuk and Rogers Communications Inc., was filed in response to Industry Canada’s consultation on June 15, 2009 and reply comments on July 17, 2009. Although it is not possible to estimate, at this time, the impact that Industry Canada’s conclusions will have on our operations and financial results, it is anticipated that Industry Canada will hold an auction to award the returned and

unused 2500 MHz spectrum in 2011.
AWS Spectrum
As previously mentioned, on November 28, 2007, Industry Canada released its decision concerning the policy and rules governing the licensing of additional mobile spectrum for AWS in the 1.7 and 2.1 gigahertz (GHz) bands. The licensing process also made an additional 10 MHz of PCS spectrum available in the 1.9 GHz band and 5 MHz in the 1.6 GHz band. In total, 105 MHz of spectrum, 90 MHz of which is AWS spectrum, was available to be licensed through the competitive spectrum auction, the bidding stage of which ended on July 21, 2008. Industry Canada’s AWS decision set aside 40 MHz of the available 90 MHz of AWS spectrum for which only new entrants were able to bid. The remaining 50 MHz of AWS spectrum was open to bidding by any party, including incumbent carriers and new entrants. In order to provide an expansion path for next-generation technologies and future services, we purchased new wireless licences in the AWS spectrum auction. We acquired 20 MHz of spectrum in Ontario (including Toronto and surrounding areas), in Canada’s Atlantic provinces, and in Northern Canada, as well as 10 MHz in Québec and in Western Canada, for a total investment of $741 million. Industry Canada’s policies relating to the auction and to the licensing of AWS spectrum favoured the entry of new competitors into the Canadian wireless market and resulted in ten potential new competitors, one of which already started providing services, securing blocks of spectrum in the auction, some of which are on a regional basis. Refer to Our Competitive Environment – Wireless for more details, including the identity of the ten new entrants.
700 MHz Auction
Industry Canada is also planning to auction the 700 MHz band for mobile and fixed wireless service, likely within the next five years. The band is currently used by broadcasters for over the air analog TV service and a decision to auction the 700 MHz band is complicated by the requirement to first move the broadcasters off the spectrum. In this regard, current policy dictates that the broadcasters must vacate the band by August 31, 2011. However, it is uncertain whether broadcasters will meet this deadline. This auction is expected to provide an opportunity for incumbents to expand their services and may also enable new entrants.
Accessibility for Ontarians with Disabilities Act, 2005 (AODA) – Proposed Standard for Pay Telephone Furniture
The Ontario government is currently considering a proposed standard under the AODA process which could require significant changes to the arrangement of all pay telephone furniture in Ontario. Bell Canada currently has in excess of 35,000 pay telephones installed in Ontario. The average cost of renovating pay telephones to comply with the proposed standard is estimated to exceed $1,000 per unit. Bell Canada has submitted comments on October 16, 2009 to reduce the cost of compliance.
Bell Canada Act
Under the Bell Canada Act, the CRTC must approve any sale or other disposal of Bell Canada voting shares that are held by BCE Inc., unless the sale or disposal would result in BCE Inc. retaining at least 80% of all of the issued and outstanding voting shares of Bell Canada. Except in the ordinary course of its business, the CRTC must also approve the sale or other disposal of facilities integral to Bell Canada’s telecommunications activities.
RISKS THAT COULD AFFECT OUR BUSINESS AND RESULTS
This section describes the principal risks that could have a material adverse effect on our business, financial condition or results of operations, and cause actual results or events to differ materially from our expectations expressed in or implied by our forward-looking statements, in addition to the risks previously described under Our Competitive Environment and Our Regulatory Environment or those described elsewhere in the MD&A. A risk is the possibility that an event might happen in the future that could have a negative effect on our business, financial condition or results of operations. The actual effect of any event could be materially different from what we currently anticipate. The risks described below are not the only ones that could affect us. Additional risks and uncertainties not currently known to us or that we currently deem to be immaterial may also have a material adverse effect on our business, financial condition or results of operations.
BCE INC. 2009 ANNUAL REPORT 63
MANAGEMENT’S DISCUSSION AND ANALYSIS
A decline in economic growth and in retail and commercial activity and/or adverse conditions in the financial markets could decrease demand for our products and services, potentially reducing profitability and threatening the ability of our customers to pay their expenses.
Our business is affected by general economic and financial conditions, consumer confidence and spending, and the demand for, and prices of, our products and services. Declines in economic growth and in retail and commercial activity, and/or adverse conditions in the financial markets, could result in lower demand for our products and services. During these periods, customers may delay buying our products and services, reduce purchases or discontinue using them. Weak economic and financial conditions could lower our profitability and reduce cash flows from operations. Such conditions could also negatively affect the financial condition and creditworthiness of our customers, which could increase uncertainty about our ability to collect receivables and potentially increase our bad debt expenses, which could adversely affect our results of operations.
Failure to achieve our business objectives could have an adverse impact on our financial performance and growth prospects.
We continue to pursue our goal to be recognized by customers as Canada’s leading communications company through focused execution against our five strategic imperatives. Executing against these imperatives requires shifts in employee skills, investing capital to implement our strategies and operating priorities as well as targeted cost reductions. If our management, processes or employees are not able to adapt to these changes or if required capital is not available on favourable terms, we may fail to achieve our business objectives, which could have an adverse effect on our business, financial performance and growth prospects. Our strategies require us to continue to transform our cost structure. Accordingly, we are continuing to implement several initiatives to reduce costs while containing our capital expenditures. Our objectives for targeted cost reductions continue to be aggressive and there is no assurance that we will be successful in reducing costs, especially because on an ongoing basis, incremental cost savings are more difficult to achieve. Our cost reduction objectives require aggressive negotiations with our key suppliers and there can be no assurance that such negotiations will be successful or that replacement products or services provided will not lead to operational issues. Improved customer service and an enhanced perception of Bell Canada’s service offerings by existing and potential customers are critical to increasing customer retention and ARPU and attracting new customers. However, there is a risk that the increasing complexity of our networks could hinder the effective management of such networks, which could adversely affect service levels. In addition, the increasing number of smartphone users could require more support from our customer contact centres than currently anticipated, which could have an adverse effect on customer service and on our costs of providing such service. Delays in the planned implementation of improvements within our customer contact centres could also adversely affect customer service and delay the achievement of cost reductions. Accordingly, there is a risk that customer service improvements will be delayed or not be achieved or that, even if achieved, that they will not necessarily translate into an enhanced public perception of Bell Canada’s service offerings or the achievement of customer retention objectives. There is also a risk that customer service improvements will be more costly to implement than currently anticipated, which could adversely affect our results of operations. If we are unable to achieve any or all of these objectives, our business and results of operations could be adversely affected.
We need to anticipate technological change and invest in or develop new technologies, products and services. If we are unable to launch new technologies, products and services on a timely basis or if regulation expands to delay newer technologies, our business and results of operations may be adversely affected.
We operate in markets that are affected by constant technological change, evolving industry standards, changing client needs, frequent introductions of new products and services and short product life cycles. Investment in new technologies, products and services and the ability to launch, on a timely basis, such technologies, products and services are critical to increasing the number of our subscribers and achieving our financial performance objectives. We may face additional risks as we develop new products, services and technologies, and update our networks to stay competitive. Newer technologies, for example, may quickly become obsolete or may need more capital than initially expected. Development could be delayed for reasons beyond our control. Substantial investments usually need to be made before new technologies prove to be commercially viable. There is also a risk that current regulation could be expanded to apply to newer technologies which could delay our launch of new services. There is no assurance that we will be successful in developing, implementing and marketing new technologies, products, services or enhancements in a reasonable time, or that they will gain market acceptance. New products or services that use new or evolving technologies could reduce demand for our existing offerings or cause prices for those services to decline. Our failure to successfully develop, implement and market new technologies, products, services or enhancements in a reasonable time could have an adverse effect on our business and results of operations.
64 BCE INC. 2009 ANNUAL REPORT
MANAGEMENT’S DISCUSSION AND ANALYSIS
We may be required to increase contributions to our employee benefit plans in the future depending on various factors.
The funding requirements of our employee benefit plans, resulting from valuations of our plan assets and liabilities, depend on a number of factors, including actual returns

on pension plan assets, long-term interest rates, plan demographics and pension regulations. Changes in these factors could cause actual future contributions to significantly differ from our current estimates and could require us to increase contributions to our employee benefit plans in the future and, therefore, could have a negative effect on our liquidity and results of operations. There is no assurance that our pension plans will be able to earn their assumed rate of return. A substantial portion of our pension plans’ assets is invested in both public equity and debt securities. As a result, the ability of our pension plans to earn the rate of return that we have assumed significantly depends on the performance of capital markets. Market conditions also impact the discount rate used to calculate our solvency obligations and thereby could also significantly affect our cash funding requirements. In addition, our estimated funding requirements for 2010 are based on preliminary calculations which do not take into account the Federal Minister of Finance’s announcement on October 27, 2009 of a proposed federal pension reform in 2010. Based on our interpretation of the information currently available, if this reform project is applicable to actuarial calculations with an effective date of December 31, 2009 or later, the impact on funding requirements would not be materially negative. However, such funding requirements may still be higher than expected if the results of our actuarial valuations materially and negatively differ from our preliminary calculations and if the final federal pension reform law and regulations differ significantly from what we currently anticipate.
Our operations depend on how well we protect, maintain and replace our networks, equipment, It systems and software.
Our operations depend on how well we protect our networks, equipment, IT systems and software, and the information stored in our data centres, against damage from fire, natural disaster (including seismic and severe weather-related events such as ice, snow and wind storms, flooding and tornadoes), power loss, hacking, computer viruses, disabling devices, acts of war or terrorism, sabotage, vandalism and other events. Global climate change could exacerbate certain of those threats, including the frequency and severity of weather-related events. Our operations also depend on the timely replacement, maintenance and upgrade of our networks, equipment, IT systems and software. Any of these and other events could result in network failures, billing errors and delays in customer service. Our operations also depend on our ability to protect the information stored in our data centres against theft. The theft of such information could adversely affect our customer relationships and expose us to claims in damages by customers. Our networks are connected with the networks of other telecommunications carriers, and we rely on them to deliver some of our services. Any of the events mentioned above, as well as strikes or other work disruptions, bankruptcies or other insolvency proceedings, technical difficulties or other events affecting the networks of these other carriers, could also harm our business and our customer relationships.
We depend on key third-party suppliers to provide products and services that we need to operate our business.
We depend on key third-party suppliers over which we have no operational or financial control for certain products and services that are critical to our operations. These critical products and services may only be available from a limited number of suppliers. If, at any time, suppliers cannot provide us with products or services, including, without limitation, telecommunications equipment, software and maintenance services, that comply with evolving telecommunications standards or that are compatible with our equipment, IT systems and software, our business and results of operations could be adversely affected. In addition, if we are unable to obtain products or services that are essential to our operations on a timely basis and at an acceptable cost, or if telecommunications equipment, such as handsets, that we sell or otherwise provide to customers or network equipment that we use to provide services has manufacturing defects, our ability to offer our products and services and to roll out our advanced services, and the quality of our services and networks, may be negatively impacted, our network development and expansion could be impeded, and our business, strategy and results of operations could be adversely affected. These suppliers may be subject to litigation with respect to technology that we depend on for our service offerings. In addition, the business and operations of our suppliers and their ability to continue to provide us with products and services could be adversely affected by various factors, including, without limitation, general economic and financial market conditions, the intensity of competitive activity, labour disruptions, availability of and accessibility to capital, bankruptcy or other insolvency proceedings, and changes in technological standards.
Renegotiating collective bargaining agreements with employees could result in higher labour costs and work disruptions.
Approximately 45% of our employees are represented by unions and are covered by collective bargaining agreements. Renegotiating collective bargaining agreements could result in higher labour costs and work disruptions, including work stoppages or work slowdowns. There can be no assurance that should a strike or work disruption occur, it would not adversely affect service to our customers and our results of operations. In addition, work disruptions at our service providers, including work slowdowns and work stoppages due to strikes, could harm our business, including our customer relationships and results of operations.
BCE INC. 2009 ANNUAL REPORT 65
MANAGEMENT’S DISCUSSION AND ANALYSIS
The following collective agreements will expire in 2010:
the collective agreement between the CEP and Bell Canada covering approximately 770 communications sales employees will expire on December 31, 2010 the collective agreement between the CEP and Expertech Network Installation Inc. covering approximately 165 clerical employees will expire on November 30, 2010 the collective agreement between the CEP and Bell Canada covering approximately 115 craft employees located in Western Canada will expire on May 10, 2010.
In addition, negotiations with respect to a first collective agreement between the CEP and Bell Canada covering approximately 50 clerical employees located in Western Canada are scheduled to commence later this year.
The significant increase in broadband demand could have an adverse effect on our business and financial results.
With the rapid growth in video and other bandwidth-intensive applications on the Internet and on mobile devices, we may need to incur significant capital expenditures to provide additional capacity on our Internet and wireless networks. We may not be able to recover these costs from customers due to competitors’ short-term pricing of comparable services. There is also a risk that our efforts to optimize network performance, in the face of increasing broadband demand, through paced fibre deployment, traffic management and rate plan changes could be unsuccessful and/or generate adverse publicity, potentially resulting in an increase in our subscriber churn rate beyond our current expectations, or new regulation, and thereby compromising our efforts to attract new customers. This could have an adverse effect on our business and results of operations.
If we are unable to raise the capital we need, we may need to limit our capital expenditures or our investments in new businesses, or try to raise capital by disposing of assets.
As previously discussed under Financial and Capital Management – Liquidity, we have significant cash requirements to implement our business plan and meet our financial obligations. These cash requirements may be adversely affected by the risks associated with our contingencies, off-balance sheet arrangements and assumptions built into our business and financial plans. Our ability to meet our cash requirements and provide for planned growth depends on our having access to adequate sources of capital and on our ability to generate cash flows from operations, which is subject to general economic, market, competitive, regulatory and other risk factors described in this document, many of which are not within our control. Also, the amount of working capital available to operate our business and our ability to achieve our working capital objectives could be adversely impacted by the quality of, and our level of success in collecting, accounts receivable through the use of our employees, systems and technology. In general, our capital needs are funded from cash generated by our operations or investments, by borrowing from commercial banks, through debt and equity offerings in the capital markets, or by selling or otherwise disposing of assets (including the sale of accounts receivable). Our ability to raise financing depends on our ability to access the public equity and debt capital markets as well as the bank credit market. Our ability to access such markets and the cost and amount of funding available depend largely on prevailing market conditions and the outlook for our business and credit ratings at the time capital is raised. An increased level of debt borrowings could result in lower credit ratings, increased borrowing costs and a reduction in the amount of funding available to us (including through equity offerings). Business acquisitions could also adversely affect our outlook and credit ratings and have similar adverse consequences. In addition, participants in the public capital and bank credit markets have internal policies limiting their ability to invest in, or extend credit to, any single entity or entity group or to a particular industry. Our bank credit facilities, including credit facilities supporting our commercial paper programs, are with various financial institutions. While it is our intention to renew such credit facilities from time to time, there are no assurances that these facilities will be renewed on favourable terms or in similar amounts. If we cannot raise the capital we need to implement our business plan upon acceptable terms, we may have to limit our ongoing capital expenditures, limit our investment in new businesses, or try to raise additional capital by selling or otherwise disposing of assets. Any of these could have an adverse effect on our cash flows from operations and on our growth prospects.
We may not be able to discontinue certain services as necessary to improve capital and operating efficiencies.
We are in the process of moving traffic on our core circuit-based infrastructure to IP technology. As part of this move, we are in the process of discontinuing certain services that are based on circuit-based infrastructure. This is a necessary component of improving capital and operating efficiencies. In some cases, this could be delayed or prevented by customers or regulatory actions. If we cannot discontinue these services as planned, we will not be able to achieve the efficiencies as expected and this may adversely affect our results of operations.
Regulatory initiatives or proceedings, pending or future litigation, changes in laws or regulations or government tax audits could have an adverse effect on our business and

results of operations.
Our business is affected by decisions made by various regulatory agencies, including the CRTC. Decisions of the CRTC may have an adverse effect on our business and results of
66 BCE INC. 2009 ANNUAL REPORT MANAGEMENT’S DISCUSSION AND ANALYSIS
operations. In addition, we become involved in various claims and litigation as a part of our business. Pending or future litigation, including an increase in class action claims which, by their nature, could result in sizeable damage awards, could have an adverse effect on our business and results of operations. Changes in laws or regulations or in how they are interpreted, and the adoption of new laws or regulations, could negatively affect us. These include changes in tax laws or the adoption of new tax laws that result in higher tax rates or new taxes. They also include amendments to Canadian securities laws that introduced statutory civil liability for misrepresentations in continuous disclosure. These amendments have facilitated the introduction in Canada of class action lawsuits by secondary market investors against public companies for alleged misrepresentations in public disclosure documents and oral statements. Significant damages could be awarded by courts in these types of actions should they be successful. Such awards of damages and costs relating to litigation could adversely affect our results of operations. We believe that we have adequately provided for all income and commodity taxes based on all of the information that is currently available. The calculation of income taxes and the applicability of commodity taxes in many cases, however, require significant judgment in interpreting tax rules and regulations. Our tax filings are subject to government audits which could result in material changes to the amount of current and future income tax assets and liabilities and other liabilities and could, in certain circumstances, result in an assessment of interest and penalties. For a description of the principal regulatory initiatives and proceedings affecting us, see Our Regulatory Environment. For a description of the principal legal proceedings involving us, please see the section Legal Proceedings contained in the BCE 2009 AIF.
Satellites used by Bell TV are subject to significant operational risks and satellites that are not yet built are subject to construction and launch delays that could have an adverse effect on Bell TV’s business and financial results.
In conjunction with the sale by BCE Inc. of its subsidiary Telesat on October 31, 2007, a set of commercial arrangements between Telesat and Bell TV were put into place that provide Bell TV access to satellite capacity. Pursuant to these commercial arrangements, Bell TV currently uses three satellites. Telesat operates or directs the operation of these satellites. Satellites utilize highly complex technology and operate in the harsh environment of space and are therefore subject to significant operational risks while in orbit. The risks include in-orbit equipment failures, malfunctions and other kinds of problems commonly referred to as anomalies that could reduce the commercial usefulness of a satellite used by Bell TV. Acts of war or terrorism, magnetic, electrostatic or solar storms, and space debris or micrometeoroids could also damage the satellites used by Bell TV. Any loss, failure, manufacturing defects, damage or destruction of these satellites, of Bell TV’s terrestrial broadcasting infrastructure or of Telesat’s tracking, telemetry and control facilities to operate the satellites could have an adverse effect on Bell TV’s business and results of operations and could result in many customers terminating their subscription to Bell TV’s DTH satellite television service. In addition, there are certain risks related to the construction and launch of new satellites. Launch delays can result from delays in the construction of satellites and launch vehicles, the periodic unavailability of reliable launch opportunities, possible delays in obtaining regulatory approvals, and launch failures. If satellite construction schedules are not met, a launch opportunity may not be available at the time the satellite is ready to be launched. Launch vehicles may fail resulting in significant delays in the deployment of satellites because of the need to construct replacement satellites, which typically takes up to 30 months or longer, and to obtain another launch vehicle. Such significant delays could adversely affect Bell TV’s ability to launch new services and reduce the competitiveness of its television services, and may adversely affect our results of operations.
The theft of our satellite television services could have an adverse effect on Bell TV’s business and results of operations.
Bell TV faces a loss of revenue resulting from the theft of its services. In 2008, Bell TV introduced and completed a smart card exchange for its authorized digital receivers that is designed to block unauthorized reception of Bell TV’s signals. However, as with any technology-based security system, it is not possible to prevent with absolute certainty the compromise or circumvention of that security system. As is the case for all other television distributors, Bell TV has experienced, and continues to experience, ongoing efforts to steal its services by way of compromise or circumvention of Bell TV’s signal security systems. The theft of Bell TV’s services could have an adverse effect on Bell TV’s business and results of operations.
BCE Inc. is dependent on the ability of its subsidiaries, joint ventures and other companies in which it has an interest to pay dividends or otherwise make distributions to it.
BCE Inc. has no material sources of income or assets of its own, other than the interests that it has in its subsidiaries, joint ventures and other companies, including its direct ownership of the equity of Bell Canada. BCE Inc.’s cash flow and, consequently, its ability to service its indebtedness and to pay dividends on its equity securities are therefore dependent upon the ability of its subsidiaries, joint ventures and other companies in which it has an interest to pay dividends or otherwise make distributions to it.
BCE INC. 2009 ANNUAL REPORT 67
MANAGEMENT’S DISCUSSION AND ANALYSIS
BCE Inc.’s subsidiaries, joint ventures and other companies in which it has an interest are separate and distinct legal entities and have no obligation, contingent or otherwise, to pay any dividends or make any other distributions to BCE Inc. In addition, any right of BCE Inc. to receive assets of its subsidiaries, joint ventures and other companies in which it has an interest upon their liquidation or reorganization will be structurally subordinated to the prior claims of creditors of such subsidiaries, joint ventures and other companies. As for Bell Aliant, it intends, subject to approval of the trustees of Bell Aliant, to make cash distributions to its unit-holders, including BCE Inc. and Bell Canada, but there can be no guarantee regarding the amounts of these cash distributions, which may fluctuate with Bell Aliant’s performance and other variables. Bell Aliant also has the discretion to establish cash reserves for the proper conduct of its business, which would reduce the amount of cash available for distributions in the year. Accordingly, we cannot provide any assurance regarding the actual levels of distributions by Bell Aliant. The Government of Canada’s changes to the tax treatment of income trusts announced on October 31, 2006 received royal assent and were enacted into law on June 22, 2007 (the SIFT Rules). Effective in 2011, income trusts that were publicly traded before November 2006, like Bell Aliant, will be subject to taxation at corporate tax rates and certain distributions to unitholders will be taxed like dividends received from a corporation. All else being equal, the taxation of income trusts at corporate tax rates is likely to result in less cash being available to Bell Aliant to pay distributions. The Government of Canada specified that while there was no intention to prevent existing income trusts from normal growth during the transitional period, any undue expansion of an existing income trust before 2011 would make the new rules effective immediately. To qualify for the delay in applying the SIFT Rules, Bell Aliant must comply with the government’s normal growth guidelines regarding equity capital that were issued on December 15, 2006, as amended from time to time. In particular, the equity of Bell Aliant is only permitted to grow by a prescribed annual amount up to and including the 2010 calendar year. In December 2008, the Minister of Finance released Explanatory Notes to the November 28, 2008 Notice of Ways and Means Motion which revised the normal growth guidelines to accelerate the safe harbour amounts for 2009 and 2010 to make them available on and after December 4, 2008. This change did not alter the maximum permitted growth of a trust, but generally allowed a trust, like Bell Aliant, to use the remaining growth room in a single year, rather than incrementally over 2009 and 2010. Because there is still uncertainty as to the interpretation of these guidelines and what constitutes growth in certain situations, there can be no assurance that Bell Aliant will be able to retain the benefit of the deferral of the SIFT Rules. A reduction in distributions from Bell Aliant could have an adverse effect on our cash flows and results of operations.
We cannot guarantee that BCE Inc.’s dividend policy will be maintained or that dividends will be declared.
The board of directors of BCE Inc. reviews from time to time the adequacy of BCE Inc.’s dividend policy. On February 10, 2009, the board of directors of BCE Inc. adopted anew common share dividend policy with a target dividend payout ratio of 65% to 75% of Adjusted EPS. This new dividend policy was adopted with the objective of allowing sufficient financial flexibility to continue investing in BCE’s business while growing returns to shareholders. Under this dividend policy, increases in the common share dividend are directly linked to growth in BCE Inc.’s Adjusted EPS. BCE Inc.’s dividend policy and the declaration of dividends are subject to the discretion of BCE Inc.’s board of directors and, consequently, there can be no guarantee that BCE Inc.’s dividend policy will be maintained or that dividends will be declared.
A major decline in the market price of BCE Inc.’s securities may negatively impact our ability to raise capital, issue debt, retain employees, make strategic acquisitions or enter into joint ventures.
Differences between BCE Inc.’s actual or anticipated financial results and the published expectations of financial analysts may contribute to volatility in BCE Inc.’s securities. A major decline in the capital markets in general, or an adjustment in the market price or trading volumes of BCE Inc.’s securities, may negatively affect our ability to raise capital, issue debt, retain employees, make strategic acquisitions or enter into joint ventures.
Health concerns about radio frequency emissions from wireless devices, as well as epidemics and other health risks, could have an adverse effect on our business.
It has been suggested that some radio frequency emissions from cellular phones may be linked to certain medical conditions. Interest groups have also requested investigations into claims that digital transmissions from handsets used with digital wireless technologies pose health concerns and cause interference with hearing aids and other medical devices. Increasing concern over the use of cellular phones and the possible related health risks is expected to put additional pressure on the wireless

communications industry to demonstrate their safe use and could lead to additional government regulation, which could have a negative effect on our business. In addition, actual or perceived health risks of using wireless communications devices could result in fewer new network subscribers, lower network usage per subscriber, higher churn rates, product liability lawsuits or less outside financing being available to the wireless communications industry. We rely on our suppliers to ensure that the network equipment and customer equipment supplied to us meets all applicable safety requirements. Epidemics, pandemics and other health risks
68 BCE INC. 2009 ANNUAL REPORT MANAGEMENT’S DISCUSSION AND ANALYSIS
could also occur which could adversely affect our ability to maintain operational networks and provide services to our customers. Any of these events could have an adverse effect on our business and results of operations.
Our business depends on the performance of and our ability to retain our employees.
Our business depends on the efforts, abilities and expertise of our employees and, more specifically, of our senior executives and other key employees. A key component of our retention strategy for our key personnel lies in our ability to provide clear, meaningful and challenging objectives that will drive performance and enhance their skills and expertise. Our senior executives and other key employees are important to our success because they have been instrumental in setting our strategic direction, operating our business, identifying, recruiting and training key personnel, and identifying business opportunities. The loss of one or more of these key individuals could impair our business and development until qualified replacements are found. We cannot assure you that these individuals could quickly be replaced with persons of equal experience and capabilities. Although we have retention plans in place and employment agreements with certain of these individuals, we cannot prevent them from terminating their employment with us. In addition, deterioration in employee morale resulting from recent significant staff reductions, wage freezes, ongoing cost reductions or unresolved collective agreements could also adversely affect our business and financial results.
Risk Management Practices
BCE Inc.’s audit committee (Audit Committee) is responsible for the oversight of our risk management processes. Such processes are designed to manage, rather than eliminate, the risk of failure to achieve our business objectives. The Audit Committee also takes into account significant social, environmental and ethical matters that relate to our business. We have enterprise-wide risk assessment processes which incorporate the internal control and enterprise risk management frameworks of the Committee of Sponsoring Organizations of the Treadway Commission (COSO). Risk assessment and evaluation is an important part of the annual business planning cycle. In developing their annual plans, BCE’s business units identify and assess significant risks to the achievement of their business objectives and, where necessary, develop mitigation plans. The risk information generated is reviewed with senior management and BCE Inc.’s board of directors in evaluating the business plans for each of the business units and the company as a whole. The Internal Audit group plans its annual activities employing a risk-based review of internal control processes in the company. Throughout the year the Internal Audit group carries out continuing assessments of the quality of controls. On a quarterly basis the Internal Audit group reports to the Audit Committee on the results of their internal audits and on areas identified for specific improvement. The Internal Audit group also promotes effective risk management in our lines of business. The Audit Committee considers the effectiveness of the operation of our internal control procedures, reviewing reports from the Internal Audit group and BCE Inc.’s external auditors. The Audit Committee reports its conclusions to BCE Inc.’s board of directors.
OUR ACCOUNTING POLICIES
This section discusses key estimates and assumptions that management has made and how they affect the amounts reported in the financial statements and notes. It also describes key changes in accounting standards and our accounting policies, and how they affect our financial statements. We have prepared our consolidated financial statements according to Canadian GAAP. Other significant accounting policies, not involving the same level of measurement uncertainty as those discussed in this section, are nevertheless important to an understanding of our financial statements. Estimates related to revenues, allowance for doubtful accounts, useful lives of capital assets, asset impairments, inventory reserves, employee compensation plans, evaluation of minimum lease terms for operating leases, and business combinations require difficult judgments on complex matters that are often subject to multiple sources of authoritative guidance. See Note 1 to the consolidated financial statements for more information about the accounting principles we used to prepare our financial statements.
Critical Accounting Estimates
As required under Canadian GAAP, we make estimates when we account for and report assets, liabilities, revenues and expenses, and disclose contingent assets and liabilities in our financial statements. We are also required to regularly evaluate the estimates that we make. We base our estimates on a number of factors, including historical experience, current events and actions that we may undertake in the future, and other assumptions that we believe are reasonable based on information available at the time they are made. Given the inherent uncertainty involved in making estimates, actual results reported in future periods could differ from these estimates. We consider the estimates described in this section to be an important part of understanding our financial statements because they require management to make assumptions about matters that are highly uncertain at the time the estimate was made and changes to these estimates could have a material impact on our financial statements.
BCE INC. 2009 ANNUAL REPORT 69
MANAGEMENT’S DISCUSSION AND ANALYSIS
Our senior management has discussed the development and selection of the critical accounting estimates described in this section with the Audit Committee of our board of directors. The Audit Committee has reviewed these critical accounting estimates. Any sensitivity analysis included in this section should be used with caution as the changes are hypothetical and the impact of changes in each key assumption may not be linear.
Employee Benefit Plans
We maintain defined benefit plans that provide pension and other post-employment benefits for most of our employees. The amounts reported in the financial statements relating to these benefits are determined using actuarial calculations that are based on several assumptions. We perform a valuation at least every three years to determine the actuarial present value of the accrued pension and other post-employment benefits. The valuation uses management’s assumptions for the discount rate, expected long-term rate of return on plan assets, rate of compensation increase, trends in healthcare costs and expected average remaining years of service of employees. While we believe that these assumptions are reasonable, differences in actual results or changes in assumptions could materially affect employee benefit obligations and future net benefit plans costs. We account for differences between actual and assumed results by recognizing differences in benefit obligations and plan performance over the estimated average working lives of the employees who benefit from the plans. The two most significant assumptions used to calculate the net employee benefit plans cost are the discount rate and the expected long-term rate of return on plan assets. Each of our operating segments is affected by these assumptions.
DISCOUNT RATE
The discount rate is the interest rate used to determine the present value of the future cash flows that we expect will be needed to settle employee benefit obligations. It is based on the yield on long-term high-quality corporate fixed income investments, with maturities matching the estimated cash flows from the plan. We determine the appropriate discount rate at the end of every year. Our discount rate was 6.4% at December 31, 2009, a decrease from 7.0% at December 31, 2008. The following table shows the impact of a 0.5% increase and a 0.5% decrease in the discount rate on the net benefit plans cost for 2009 and the accrued benefit asset at December 31, 2009.
IMPACT ON ACCRUED IMPACT ON NET BENEFIT ASSET BENEFIT PLANS AT DECEMBER 31, COST FOR 2010 2010 INCREASE/ INCREASE/ (DECREASE) (DECREASE)
Discount rate increased to 6.9% Bell Wireline (42 ) 42 Bell Wireless (1) 1 Bell Aliant (19 ) 19

Although there is no immediate impact on our balance sheet, a lower discount rate results in a higher accrued benefit obligation and a higher pension deficit.
EXPECTED LONG-TERM RATE OF RETURN
The expected long-term rate of return is a weighted average rate of our forward-looking view of long-term returns on each of the major plan asset categories in our funds. We determine the appropriate expected long-term rate of return at the end of every year. We assumed an expected long-term rate of return on plan assets of 7.0% in 2009, compared to 7.25% in 2008. The following table shows the impact of a 0.5% increase and a 0.5% decrease in the expected rate of return on plan assets on the net benefit plans cost for 2009 and the accrued benefit asset at December 31, 2010.
70 BCE INC. 2009 ANNUAL REPORT MANAGEMENT’S DISCUSSION AND ANALYSIS
Although there is no immediate impact on our balance sheet, poor fund performance results in a lower fair value of plan assets and a higher pension deficit. This means that we may have to increase cash contributions to the pension fund.
Useful Lives of Property, Plant and Equipment
We review estimates of the useful lives of property, plant and equipment on a periodic basis and adjust them on a prospective basis, if necessary. A significant proportion of our total assets consist of property, plant and equipment. Changes in technology or in our intended use of these assets, as well as changes in business prospects or economic and industry factors may cause the estimated useful lives of these assets to change. We perform internal studies to assess the appropriateness of depreciable lives of property, plant and equipment. These studies use models, which take into account actual and expected future usage, physical wear and tear, replacement history and assumptions about technology evolution to calculate the remaining life of our assets. When these factors indicate that assets’ useful lives are different from the original assessment, we depreciate the remaining carrying values prospectively over the adjusted estimated useful lives.
Goodwill Impairment
We assess goodwill impairment of individual reporting units in the fourth quarter of every year and when events or changes in circumstances indicate that goodwill might be impaired. We test goodwill impairment in two steps:
we compare the fair value of a reporting unit to its carrying value. Fair value is based on estimates of discounted future cash flows or other valuation methods. When the fair value of a reporting unit is less than its carrying value, fair values are determined for all of its identifiable assets and liabilities. The excess of the fair value of the reporting unit over the total of the amounts assigned to its assets and liabilities is the fair value of goodwill. an impairment charge is deducted from earnings for any excess of the carrying value of goodwill over its fair value.
We make a number of significant estimates when calculating fair value using discounted future cash flows or other valuation methods. These estimates include the assumed growth rates for future cash flows, the numbers of years used in the cash flow model, the discount rate and others. We believe that all of our estimates are reasonable. They are consistent with our internal planning and reflect our best estimates, but they have inherent uncertainties that management may not be able to control. Any changes in each of the estimates used could have a material impact on the calculation of the fair value and resulting impairment charge. As a result, we are unable to reasonably quantify the changes in our overall financial performance if we had used different assumptions. We cannot predict whether an event that triggers impairment will occur, when it will occur or how it will affect the asset values we have reported. There were no impairment charges recorded in 2009, 2008 or 2007.
Contingencies
We become involved in various claims and litigation and regulatory matters as a part of our business. Each of our operating segments may be affected. Pending litigation, regulatory initiatives or regulatory proceedings represent potential financial loss to our business. We accrue a potential loss if we believe the loss is probable and it can be reasonably estimated. We base our decision on information that is available at the time. We estimate the amount of the loss by consulting with the outside legal counsel that is handling our defence. This involves analyzing potential outcomes and assuming various litigation and settlement strategies. If the final resolution of a legal or regulatory matter results in a judgment against us or requires us to pay a large settlement, it could have a material effect on our results of operations, cash flows and financial position in the period in which the judgment or settlement occurs. Any accrual would be charged to operating income and included in Accounts payable and accrued liabilities or Other long-term liabilities. Any cash settlement would be deducted from cash from operating activities. None of our operating segments had any significant provisions relating to pending litigation, regulatory initiatives or regulatory proceedings at December 31, 2009. We have not made any significant changes to our estimates in the past two years.
Income Taxes
The calculation of income tax expense requires significant judgment in interpreting tax rules and regulations, which are changing constantly. There are many transactions and calculations for which the ultimate tax determination is uncertain. Our tax filings are also subject to audits, the outcome of which could materially change the amount of current and future income tax assets and liabilities.
Total (62 ) 62
Discount rate decreased to 5.9%
Bell Wireline 69 (69 ) Bell Wireless 1 (1) Bell Aliant 22 (22 )
Total 92 (92 )
IMPACT ON ACCRUED IMPACT ON NET BENEFIT ASSET BENEFIT PLANS AT DECEMBER 31, COST FOR 2010 2010 INCREASE/ INCREASE/ (DECREASE) (DECREASE)
Expected rate of return increased to 7.5% Bell Wireline (58 ) 58 Bell Wireless (1) 1 Bell Aliant (14 ) 14
Total (73 ) 73
Expected rate of return decreased to 6.5%
Bell Wireline 58 (58 ) Bell Wireless 1 (1) Bell Aliant 14 (14 )
Total 73 (73 )

BCE INC. 2009 ANNUAL REPORT 71
MANAGEMENT’S DISCUSSION AND ANALYSIS
Management believes that it has sufficient amounts accrued for outstanding income tax matters based on all of the information that is currently available. Future tax assets and liabilities require management judgment in determining the amounts to be recognized. In particular, significant judgment is required when assessing the timing of the reversal of the temporary differences to which future tax rates are applied. Further, the amount of future tax assets, which is limited to the amount that is more likely than not to be realized, is estimated with consideration given to the timing, sources and level of future taxable profit.
Recent Changes to Accounting Standards
Goodwill and Intangible Assets
The Canadian Accounting Standards Board (AcSB) issued section 3064, Goodwill and Intangible Assets, which establishes standards for the recognition, measurement, presentation and disclosure of intangible assets. Section 3064 came into effect on January 1, 2009, replacing section 3062, Goodwill and Other Intangible Assets and section 3450, Research and Development Costs. Adoption of this new standard did not have a significant impact on our financial results.
Future Changes to Accounting Standards
Multiple Deliverable Revenue Arrangements
In December 2009, the Emerging Issues Committee of the AcSB issued EIC-175, Multiple Deliverable Revenue Arrangements, which addresses certain aspects of accounting by a vendor for arrangements under which it will perform multiple revenue-generating activities, amending the previous guidance under EIC-142, Revenue Arrangements with Multiple Deliverables. The amendments require a vendor to allocate arrangement consideration at the inception of an arrangement to all deliverables using the relative selling price method, thus prohibiting the use of the residual method. EIC-175 also changes the level of evidence of the standalone selling price required to separate deliverables when more objective evidence of the selling price is not available. EIC-175 may be applied prospectively and must be applied to revenue arrangements with multiple deliverables entered into or materially modified in the first annual fiscal period beginning on or after January 1, 2011. Early adoption is permitted. We are currently evaluating the impact and effective date of adoption of EIC-175.
International Financial Reporting Standards (IFRS)
The AcSB has set January 1, 2011 as the date that IFRS will replace Canadian GAAP for publicly accountable enterprises, which includes Canadian reporting issuers. We will prepare our financial statements in accordance with IFRS commencing January 1, 2011. Financial reporting under IFRS differs from Canadian GAAP in a number of respects, some of which are significant. IFRS on the date of adoption also is expected to differ from current IFRS due to new IFRS that are expected to be issued before the changeover date. We describe below our IFRS changeover plan, selected key activities and their status, and the significant known impacts on our financial reporting. This information is provided to allow investors and others to obtain a better understanding of our IFRS changeover plan and the resulting possible effects on our financial statements and operating performance measures. Readers are cautioned, however, that it may not be appropriate to use such information for any other purpose. This information also reflects our most recent assumptions and expectations; circumstances may arise, such as changes in IFRS, regulations or economic conditions, which could change these assumptions or expectations.
IFRS Changeover Plan
We have developed a detailed plan for our changeover to IFRS comprised of three related phases:
Review and Assessment Design Implementation.
PHASE 1: REVIEW AND ASSESSMENT
The objective of this phase was to identify the required changes to our accounting policies and practices resulting from the changeover to IFRS to determine the scope of the work effort required for the Design and Implementation phases. Phase 1 involved:
a detailed review of all relevant IFRS standards to identify differences with our current accounting policies and practices the separate consideration of one-time accounting choices that must be addressed at the changeover date and those accounting policy choices that will be applied on an ongoing basis in periods subsequent to the changeover to IFRS the prioritization of those differences that could have a more than inconsequential impact on our financial statements, business processes or IT systems the identification of internal stakeholders and business areas that may be affected by the changeover.
72 BCE INC. 2009 ANNUAL REPORT MANAGEMENT’S DISCUSSION AND ANALYSIS
PHASE 2: DESIGN
Phase 2 involved the design and development of detailed solutions to address the differences identified in the first phase of our changeover plan. These solutions resulted in certain necessary changes to our internal business processes and financial systems to comply with IFRS accounting and disclosure requirements. Phase 2 activities included:
the evaluation of accounting policy alternatives the investigation, development and documentation of solutions to resolve differences identified in Phase 1, reflecting changes to existing accounting policies and practices, business processes, IT systems and internal controls the implementation of a change management strategy to address the information and training needs of internal and external stakeholders.
PHASE 3: IMPLEMENTATION
In the third and final phase of our changeover plan, currently underway, we will implement the changes to affected accounting policies and practices, business processes, systems and internal controls. These changes will be tested prior to the formal reporting requirements under IFRS to ensure all significant differences are appropriately addressed in time for the changeover.
Progress towards Completion of Our IFRS Changeover Plan
We have identified the differences between Canadian GAAP and IFRS that impact our financial statements. Our detailed analysis identified a number of accounting differences and policy alternatives under IFRS as compared to Canadian GAAP. We also have determined, however, that our accounting policies generally are aligned with IFRS requirements in many key areas. We will continue to monitor changes to IFRS throughout 2010. We will review and assess any new or modified standards that are issued prior to our changeover. Phase 2 of our changeover plan is substantially complete. During 2010, we will complete our selection of our accounting policies and transition options under IFRS. Phase 3 work on development and implementation of system changes is complete. During 2010, we will complete the work effort undertaken to ready our business processes and internal controls for the changeover. Appropriate resources have been secured to complete the changeover on a timely basis according to our plan milestones. We have ensured training needs are met and will continue to be addressed throughout the changeover period. We have detailed project plans and progress reporting in place to support and communicate the changeover. Summarized below is a description of our progress towards completion of selected key activities of our IFRS changeover plan as of December 31, 2009. At this time, we cannot quantify the impact that the future adoption of IFRS will have on our financial statements and operating performance measures; however, such impact may be material. The changeover to IFRS will impact internal controls over financial reporting, disclosure controls and procedures, and IT systems and processes. Additional information will be provided as we move towards the changeover date.
BCE INC. 2009 ANNUAL REPORT 73

MANAGEMENT’S DISCUSSION AND ANALYSIS
Progress towards Completion of Our IFRS Changeover Plan
74 BCE INC. 2009 ANNUAL REPORT
MANAGEMENT’S DISCUSSION AND ANALYSIS
First-Time Adoption of IFRS
Our financial statements for the year ended December 31, 2011, will be prepared according to IFRS with comparative amounts for the year ended December 31, 2010. IFRS 1, First-Time Adoption of International Financial Reporting Standards, generally requires that we apply IFRS on a retrospective basis in our opening balance sheet as at January 1, 2010. IFRS 1 also provides certain mandatory exceptions and elective exemptions to retrospective application. We expect that our IFRS 1 elections will be approved by senior management during the first half of 2010, once we have completed our analysis of, and quantified on a preliminary basis, each exemption.
Accounting Policies under IFRS
Our analysis of IFRS and comparison with our accounting policies under Canadian GAAP has identified a number of differences. Many of these differences are not
SELECTED KEY ACTIVITIES MILESTONES/DEADLINES PROGRESS TO DATE
Financial statement preparation
Identify relevant differences between IFRS and our accounting policies and practices and design and implement solutions
Evaluate and select one-time and ongoing accounting policy alternatives
Benchmark findings with peer companies
Prepare financial statements and related note disclosures to comply with IFRS
Quantify the effects of changeover to IFRS
Assessment and quantification of the significant effects of the changeover completed by approximately the third quarter of 2010
Final selection of accounting policy alternatives by the changeover date
Completed the identification of IFRS differences
Completed the design of solutions, including business processes, to resolve substantially all IFRS differences
Implementation decisions on virtually all accounting differences have been made
Assessment and quantification of the impact of one-time transition choices is underway
Evaluation and preliminary selection of accounting policies is substantially complete but will continue to be assessed
Training and communication
Provide training to affected employees of operating units, management and the board of directors and relevant committees thereof, including the Audit Committee
Engage subject matter experts to assist in the transition
Communicate progress of changeover plan to internal and external stakeholders
Timely training provided to align with work under changeover – training completed by mid-2010
Communicate effects of changeover in time for 2011 financial planning process by the third quarter of 2010
Completed detailed training for resources directly engaged in the changeover and general training to broader group of finance employees, including senior finance management and the board of directors
Periodic internal and external communications about our progress are ongoing
Change management plans have been developed to address training needs for the remainder of the changeover period to the end of 2010
Third-party subject matter experts have validated our design work and continue to provide assistance in the transition
Our auditors are providing input as significant milestones are met
IT systems
Identify and address IFRS differences that require changes to financial systems
Evaluate and select methods to address need for dual record-keeping during 2010 (i.e., IFRS and Canadian GAAP) for comparatives and budget and planning purposes in 2011
Changes to significant systems and dual record-keeping process completed in time for the first quarter of 2010
IFRS differences with system impacts identified and design of significant IT solutions is complete
IT development and testing of dual record-keeping, capital accounting and other system solutions is complete
Financial accounting systems have been modified and we have commenced dual record-keeping
Contractual arrangements and compensation
Identify impact of changeover on contractual arrangements, including customer and supplier agreements, financial covenants and employee compensation plans
Make any required changes to arrangements and plans
Changes completed by the third quarter of 2010
IFRS differences with potential impacts on contractual arrangements and compensation plans are minimal
The impact of IFRS differences on debt and other financial covenants has been assessed and is not significant
SELECTED KEY ACTIVITIES MILESTONES/DEADLINES PROGRESS TO DATE
Internal controls
Internal control over financial reporting (ICFR)
Revise existing internal control processes and procedures to address significant changes to existing accounting policies and practices, including the need for dual record-keeping during 2010
Design and implement internal controls with respect to one-time changeover adjustments and related communications
Changes completed by the first quarter of 2010
Conduct management evaluation of new or revised controls throughout 2010
Update CEO/Chief Financial Officer (CFO) certification process by the fourth quarter of 2010
Monitored design of solutions to address IFRS differences to design or revise and implement the necessary internal controls
Testing of automated controls has commenced
Internal controls
Disclosure controls and procedures (DC&P)
For changes to accounting policies and practices identified, assess the DC&P design and effectiveness implications
See ICFR deadlines above MD&A disclosures began in December 2008
Project steering committee, including Investor Relations, meets monthly to track progress

expected to have a significant impact on our financial position or results of operations. In certain cases, IFRS provides for a choice of accounting policies. Set out below is a description of our proposed changes in accounting policies under IFRS that we believe may result in a significant impact to our consolidated financial statements, based on Canadian GAAP and IFRS issued at December 31, 2009, except as otherwise noted.
EMPLOYEE BENEFIT PLANS
We use the corridor method approach under Canadian GAAP to recognize actuarial gains and losses in earnings relating to our defined benefit pension and other post-employment benefit plans. We deduct 10% of the greater of the benefit obligation or the market-related value of plan assets from the unamortized net actuarial gains or losses on a market-related value basis. Any excess is amortized to earnings on a straight-line basis over the average remaining service period of active employees. Past service costs under Canadian GAAP are also amortized on a straight-line basis over the average remaining service period of active employees. Under IFRS, we plan to recognize actuarial gains and losses on a current basis directly in equity with no impact to earnings. Vested past service costs are recognized immediately in earnings; unvested past service costs are amortized on a straight-line basis over the vesting period. IFRS also requires that plan assets be measured using market values, instead of the market-related values we currently use.
AMORTIZATION OF CAPITAL ASSETS
We amortize most of our telecommunications assets using the group depreciation method under Canadian GAAP. When we retire assets in the ordinary course of business,we charge their original cost to accumulated depreciation; no gain or loss is recorded on retirement of the asset. We will discontinue the use of the equal life group depreciation method under IFRS, and gains and losses on retirement of assets will be included in earnings as incurred. In addition, the estimated useful life of assets will not be determined using the group method. Under IFRS, we will depreciate capital assets using the straight-line method over their estimated useful lives.
BORROWING COSTS
We capitalize borrowing costs under Canadian GAAP on capital assets that we build or develop when the expenditure is significant. Under IFRS, we will capitalize borrowing costs to capital assets that take in excess of one year to build or develop. Amounts capitalized will be amortized using the method and over the estimated useful life of the corresponding asset, similar to Canadian GAAP.
SECURITIZATION OF ACCOUNTS RECEIVABLE
We currently account for a transfer of receivables as a sale when we give up control of the accounts receivable in exchange for proceeds other than our retained beneficial ownership interest in those receivables. We recognize a loss on the derecognition of the receivables, calculated as the
BCE INC. 2009 ANNUAL REPORT 75
MANAGEMENT’S DISCUSSION AND ANALYSIS
excess of the carrying value of the receivables over the fair value of the consideration received. Under IFRS, the criteria to derecognize financial assets are substantially different than under Canadian GAAP. Our securitization of accounts receivable program will not qualify for derecognition under current IFRS. Therefore, both the accounts receivable balance and related obligation will be shown on the balance sheet as a current asset and current liability, respectively.
PROVISIONS, INCLUDING ASSET RETIREMENT OBLIGATIONS
Under Canadian GAAP, we record provisions when a present obligation exists as a result of past transactions or events, there is a likely outflow of resources required to settle the obligation and the amount of the obligation can be reliably estimated. Asset retirement obligations are recorded when a legal or contractual obligation exists. Provisions are recorded under IFRS when an outflow of resources is more likely than not, instead of the higher “likely” threshold under Canadian GAAP. Other specific differences exist in relation to the methods used to estimate the amount of provisions. Asset retirement obligations are recorded when a legal, contractual or constructive obligation exists.
JOINT VENTURE INTERESTS
We account for our interests in joint ventures using the proportionate consolidation method under Canadian GAAP. Under this method, we record our pro-rata share of the revenues and expenses, cash flows and balance sheet amounts of our joint ventures. Although IFRS currently permits the use of the proportionate consolidation method to account for joint venture interests, we expect that IFRS will be modified prior to January 1, 2011 to require the use of the equity method to account for joint venture interests.
BUSINESS COMBINATIONS AND CONSOLIDATION
We consolidate 100% of the assets and liabilities of our subsidiaries under Canadian GAAP; any non-controlling interest in subsidiaries is recorded in our balance sheet based on carrying values. When we acquire control of an entity in steps, each step is recorded based on the fair value of consideration paid; any previously held investment in that entity continues to be reflected in our consolidated financial statements based on our carrying value for that investment. Subsequent decreases in our ownership may result in gains and losses recorded through income; increases in ownership are accounted for as an acquisition in steps. We also include certain transaction and restructuring costs relating to acquisitions in the cost of the purchase or the purchase price allocation. Under IFRS, non-controlling interest in a subsidiary is recorded based on fair values at the date of acquisition; when we acquire control of an entity, any previously held interest is remeasured to fair value resulting in a gain or loss recorded in current period earnings. Subsequent increases or decreases in ownership interest are accounted for as equity transactions. Transaction costs and most restructuring costs relating to acquisitions are expensed as incurred.
AVAILABLE-FOR-SALE FINANCIAL ASSETS
Under Canadian GAAP, we initially record our portfolio investments in privately-held securities at their fair value at the date of acquisition; subsequent changes in the fair value of these investments are recorded when realized or when we determine that a decline in fair value is other than temporary. Under IFRS, changes in the fair value of portfolio investments in privately-held securities are recorded if the range of fair value estimates is not significant or the probabilities of the estimates within the range can be reasonably assessed and used in estimating fair value. Changes in fair value would be recorded in other comprehensive income, similar to Canadian GAAP.
IMPAIRMENT OF ASSETS
Under Canadian GAAP, we determine whether to record an impairment of assets, other than goodwill and indefinite-life intangible assets, using a two-step approach. The first step identifies whether an impairment of assets exists by comparing the carrying value of assets to their associated undiscounted future cash flows. If the undiscounted future cash flows are insufficient to demonstrate recoverability of the carrying value of assets, we proceed with the second step, which involves measuring the amount of impairment to record as the difference between the carrying value and the fair value of assets. Impairment of assets recognized under Canadian GAAP cannot be reversed in a subsequent period if circumstances change. Under IFRS, identification and measurement of impairment of assets is performed in a single test by comparing the carrying value of assets to the greater of their fair value less costs to sell and value-in-use (generally discounted future cash flows). Impairment of assets, other than goodwill, is reversed in a subsequent period if circumstances change such that the previously determined impairment is reduced or eliminated.
EFFECTIVENESS OF INTERNAL CONTROLS
Disclosure Controls and Procedures
Our disclosure controls and procedures are designed to provide reasonable assurance that information required to be disclosed by us is recorded, processed, summarized and reported within the time periods specified under Canadian and U.S. securities laws and include controls and procedures that are designed to ensure that the information is accumulated and communicated to management, including BCE Inc.’s President and CEO and Executive Vice-President and CFO, to allow timely decisions regarding required disclosure. As of December 31, 2009, management evaluated, under the supervision of and with the participation of the CEO and the CFO, the effectiveness of our disclosure controls and
76 BCE INC. 2009 ANNUAL REPORT

MANAGEMENT’S DISCUSSION AND ANALYSIS
procedures, as defined in Rule 13a-15(e) under the U.S. Securities Exchange Act of 1934 and under National Instrument 52-109 – Certification of Disclosure in Issuers’ Annual and Interim Filings. The CEO and CFO have limited the scope of their design and evaluation of our disclosure controls and procedures to exclude the disclosure controls and procedures of BCE Inc.’s wholly-owned subsidiary The Source. We acquired the assets held by The Source on July 1, 2009. The Source’s contribution to our consolidated financial statements for the year ended December 31, 2009 was less than 2% of consolidated revenues and less than 1% of consolidated earnings. Additionally, at December 31, 2009, The Source’s current assets and current liabilities were 7% and 2% of consolidated current assets and current liabilities, respectively, and its long-term assets and long-term liabilities were both less than 1% of consolidated long-term assets and long-term liabilities. Further details related to acquisitions are disclosed in Note 13 to BCE’s consolidated financial statements for the year ended December 31, 2009. Based on that evaluation, which excluded The Source’s disclosure controls and procedures, the CEO and CFO concluded that our disclosure controls and procedures were effective as of December 31, 2009.
Internal Control over Financial Reporting
Management is responsible for establishing and maintaining adequate internal control over financial reporting, as defined in Rule 13a-15(f) under the U.S. Securities Exchange Act of 1934 and under National Instrument 52-109. Our internal control over financial reporting is a process designed under the supervision of the CEO and CFO to provide reasonable assurance regarding the reliability of financial reporting and the preparation of financial statements for external purposes in accordance with GAAP. However, because of its inherent limitations, internal control over financial reporting may not prevent or detect misstatements on a timely basis. Management evaluated, under the supervision of and with the participation of the CEO and the CFO, the effectiveness of our internal control over financial reporting as of December 31, 2009, based on the framework and criteria established in the Internal Control – Integrated Framework issued by the COSO. The CEO and CFO have limited the scope of their design and evaluation of our internal control over financial reporting to exclude The Source’s internal control over financial reporting. Based on that evaluation, which excluded The Source’s internal control over financial reporting, the CEO and CFO concluded that our internal control over financial reporting was effective as of December 31, 2009. There were no material weaknesses that have been identified by management as of December 31, 2009. No changes were made in our internal control over financial reporting during the year ended December 31, 2009 that have materially affected, or are reasonably likely to materially affect, our internal control over financial reporting.
NON-GAAP FINANCIAL MEASURES
This section describes the non-GAAP financial measures we use in the MD&A to explain our financial results. It also provides reconciliations of the non-GAAP financial measures to the most comparable Canadian GAAP financial measures.
EBITDA
The term EBITDA (earnings before interest, taxes, depreciation and amortization of intangible assets) does not have any standardized meaning according to GAAP. It is therefore unlikely to be comparable to similar measures presented by other companies. We define EBITDA as operating revenues less cost of revenue and selling, general and administrative expenses, meaning it represents operating income before depreciation, amortization of intangible assets and restructuring and other. We use EBITDA, among other measures, to assess the operating performance of our ongoing businesses without the effects of depreciation, amortization of intangible assets and restructuring and other. We exclude these items because they affect the comparability of our financial results and could potentially distort the analysis of trends in business performance. We exclude depreciation and amortization of intangible assets because it largely depends on the accounting methods and assumptions a company uses, as well as non-operating factors such as the historical cost of capital assets. Excluding restructuring and other does not imply they are non-recurring. EBITDA allows us to compare our operating performance on a consistent basis. We believe that certain investors and analysts use EBITDA to measure a company’s ability to service debt and to meet other payment obligations, or as a common measurement to value companies in the telecommunications industry. The most comparable Canadian GAAP financial measure is operating income. The following tables are reconciliations of operating income to EBITDA on a consolidated basis for BCE, Bell and for our Bell Wireline and Bell Wireless segments.
BCE INC. 2009 ANNUAL REPORT 77
MANAGEMENT’S DISCUSSION AND ANALYSIS
The following tables are reconciliations of operating income to EBITDA on a consolidated basis for BCE, Bell and for our Bell Wireline and Bell Wireless segments for the fourth quarter of 2009 and 2008.
BCE 2009 2008 2007
Operating income 3,191 2,869 3,479 Depreciation and amortization of intangible assets 3,371 3,264 3,181 Restructuring and other 527 871 331
EBITDA 7,089 7,004 6,991
BELL 2009 2008 2007
Operating income 2,432 2,143 2,652 Depreciation and amortization of intangible assets 2,804 2,685 2,559 Restructuring and other 483 810 308
EBITDA 5,719 5,638 5,519
BELL WIRELINE 2009 2008 2007
Operating income 1,148 902 1,454 Depreciation and amortization of intangible assets 2,284 2,193 2,121 Restructuring and other 475 773 304
EBITDA 3,907 3,868 3,879
BELL WIRELESS 2009 2008 2007
Operating income 1,284 1,241 1,198 Depreciation and amortization of intangible assets 520 492 438 Restructuring and other 8 37 4
EBITDA 1,812 1,770 1,640
BCE Q4 2009 Q4 2008
Operating income 751 666 Depreciation and amortization of intangible assets 904 868 Restructuring and other 82 207
EBITDA 1,737 1,741
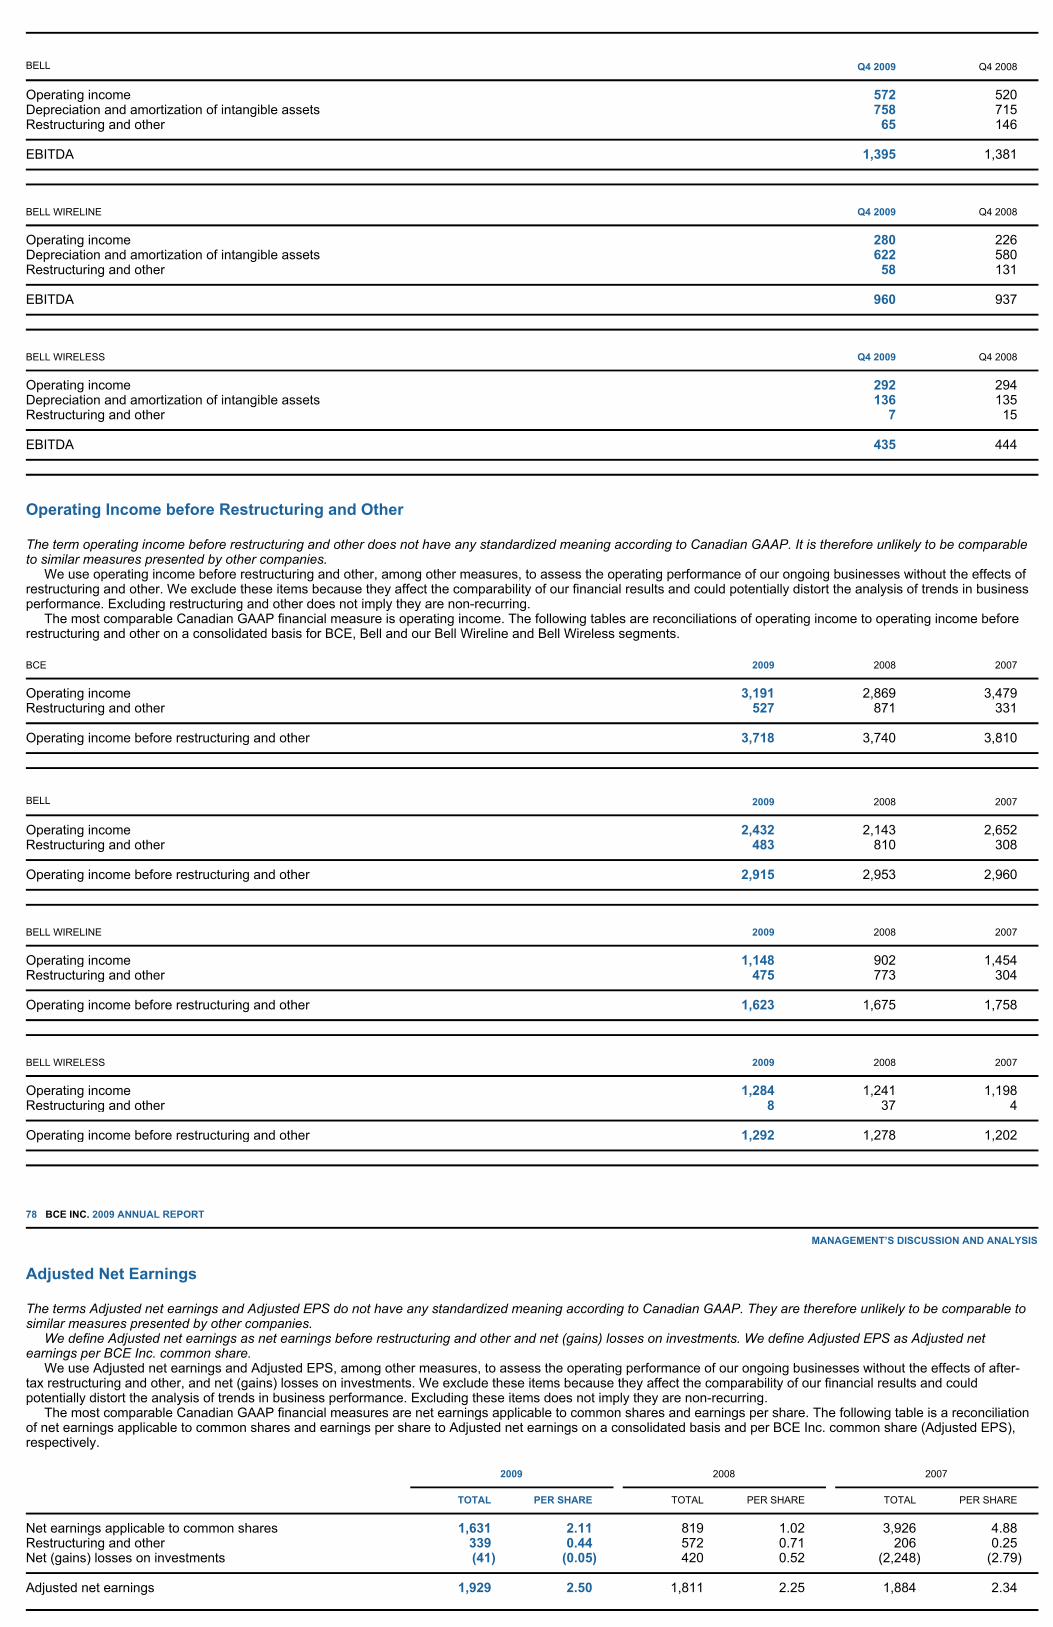
Operating Income before Restructuring and Other
The term operating income before restructuring and other does not have any standardized meaning according to Canadian GAAP. It is therefore unlikely to be comparable to similar measures presented by other companies. We use operating income before restructuring and other, among other measures, to assess the operating performance of our ongoing businesses without the effects of restructuring and other. We exclude these items because they affect the comparability of our financial results and could potentially distort the analysis of trends in business performance. Excluding restructuring and other does not imply they are non-recurring. The most comparable Canadian GAAP financial measure is operating income. The following tables are reconciliations of operating income to operating income before restructuring and other on a consolidated basis for BCE, Bell and our Bell Wireline and Bell Wireless segments.
78 BCE INC. 2009 ANNUAL REPORT MANAGEMENT’S DISCUSSION AND ANALYSIS
Adjusted Net Earnings
The terms Adjusted net earnings and Adjusted EPS do not have any standardized meaning according to Canadian GAAP. They are therefore unlikely to be comparable to similar measures presented by other companies. We define Adjusted net earnings as net earnings before restructuring and other and net (gains) losses on investments. We define Adjusted EPS as Adjusted net earnings per BCE Inc. common share. We use Adjusted net earnings and Adjusted EPS, among other measures, to assess the operating performance of our ongoing businesses without the effects of after-tax restructuring and other, and net (gains) losses on investments. We exclude these items because they affect the comparability of our financial results and could potentially distort the analysis of trends in business performance. Excluding these items does not imply they are non-recurring. The most comparable Canadian GAAP financial measures are net earnings applicable to common shares and earnings per share. The following table is a reconciliation of net earnings applicable to common shares and earnings per share to Adjusted net earnings on a consolidated basis and per BCE Inc. common share (Adjusted EPS), respectively.
BELL Q4 2009 Q4 2008
Operating income 572 520 Depreciation and amortization of intangible assets 758 715 Restructuring and other 65 146
EBITDA 1,395 1,381
BELL WIRELINE Q4 2009 Q4 2008
Operating income 280 226 Depreciation and amortization of intangible assets 622 580 Restructuring and other 58 131
EBITDA 960 937
BELL WIRELESS Q4 2009 Q4 2008
Operating income 292 294 Depreciation and amortization of intangible assets 136 135 Restructuring and other 7 15
EBITDA 435 444
BCE 2009 2008 2007
Operating income 3,191 2,869 3,479 Restructuring and other 527 871 331
Operating income before restructuring and other 3,718 3,740 3,810
BELL 2009 2008 2007
Operating income 2,432 2,143 2,652 Restructuring and other 483 810 308
Operating income before restructuring and other 2,915 2,953 2,960
BELL WIRELINE 2009 2008 2007
Operating income 1,148 902 1,454 Restructuring and other 475 773 304
Operating income before restructuring and other 1,623 1,675 1,758
BELL WIRELESS 2009 2008 2007
Operating income 1,284 1,241 1,198 Restructuring and other 8 37 4
Operating income before restructuring and other 1,292 1,278 1,202
2009 2008 2007 TOTAL PER SHARE TOTAL PER SHARE TOTAL PER SHARE
Net earnings applicable to common shares 1,631 2.11 819 1.02 3,926 4.88 Restructuring and other 339 0.44 572 0.71 206 0.25 Net (gains) losses on investments (41) (0.05) 420 0.52 (2,248 ) (2.79)
Adjusted net earnings 1,929 2.50 1,811 2.25 1,884 2.34

Free Cash Flow
The term free cash flow does not have any standardized meaning according to Canadian GAAP. It is therefore unlikely to be comparable to similar measures presented by other companies. We define free cash flow as cash flows from operating activities and distributions received from Bell Aliant less capital expenditures, preferred share dividends, dividends/distributions paid by subsidiaries to non-controlling interest, other investing activities and Bell Aliant free cash flow. We consider free cash flow to be an important indicator of the financial strength and performance of our business because it shows how much cash is available to repay debt and reinvest in our company. We present free cash flow consistently from period to period, which allows us to compare our financial performance on a consistent basis. We believe that certain investors and analysts use free cash flow to value a business and its underlying assets. The most comparable Canadian GAAP financial measure is cash from operating activities. The following table is a reconciliation of cash flows from operating activities to free cash flow on a consolidated basis.
BCE INC. 2009 ANNUAL REPORT 79
Consolidated Financial Statements
MANAGEMENT’S RESPONSIBILITY FOR FINANCIAL REPORTING
These financial statements form the basis for all of the financial information that appears in this annual report. The financial statements and all of the information in this annual report are the responsibility of the management of BCE Inc. and have been reviewed and approved by the board of directors. The board of directors is responsible for ensuring that management fulfills its financial reporting responsibilities. Deloitte & Touche LLP, Independent Registered Chartered Accountants, have audited the financial statements. Management has prepared the financial statements according to generally accepted accounting principles. Under these principles, management has made certain estimates and assumptions that are reflected in the financial statements and notes. Management believes that these financial statements fairly present BCE’s consolidated financial position, results of operations and cash flows. Management has a system of internal controls designed to provide reasonable assurance that the financial statements are accurate and complete in all material respects. This is supported by an internal audit group that reports to the Audit Committee, and includes communication with employees about policies for ethical business conduct. Management believes that the internal controls provide reasonable assurance that our financial records are reliable and form a proper basis for preparing the financial statements, and that our assets are properly accounted for and safeguarded. The board of directors has appointed an Audit Committee, which is made up of unrelated and independent directors. The Audit Committee’s responsibilities include reviewing the financial statements and other information in this annual report, and recommending them to the board of directors for approval. You will find a description of the Audit Committee’s other responsibilities on page 124 of this annual report. The internal auditors and the shareholders’ auditors have free and independent access to the Audit Committee.
(signed) George A. Cope President and Chief Executive Officer
(signed) Siim A. Vanaselja Executive Vice-President and Chief Financial Officer
(signed) Karyn A. Brooks Senior Vice-President and Controller
March 11, 2010
82 BCE INC. 2009 ANNUAL REPORT CONSOLIDATED FINANCIAL STATEMENTS
REPORT OF INDEPENDENT REGISTERED CHARTERED ACCOUNTANTS
To the board of directors and shareholders of BCE Inc.
We have audited the accompanying consolidated balance sheets of BCE Inc. and subsidiaries (the “Company”) as at December 31, 2009 and 2008, and the related consolidated statements of operations, comprehensive income, deficit and cash flows for each of the three years in the period ended December 31, 2009. These financial statements are the responsibility of the Company’s management. Our responsibility is to express an opinion on these financial statements based on our audits. We conducted our audits in accordance with Canadian generally accepted auditing standards and the standards of the Public Company Accounting Oversight Board (United States). Those standards require that we plan and perform the audit to obtain reasonable assurance about whether the financial statements are free of material misstatement. An audit includes examining, on a test basis, evidence supporting the amounts and disclosures in the financial statements. An audit also includes assessing the accounting principles used and significant estimates made by management, as well as evaluating the overall financial statement presentation. We believe that our audits provide a reasonable basis for our opinion. In our opinion, these consolidated financial statements present fairly, in all material respects, the financial position of BCE Inc. and subsidiaries as at December 31, 2009 and 2008 and the results of their operations and their cash flows for each of the three years in the period ended December 31, 2009 in accordance with Canadian generally accepted accounting principles. We have also audited, in accordance with the standards of the Public Company Accounting Oversight Board (United States), the Company’s internal control over financial reporting as of December 31, 2009, based on the criteria established in Internal Control – Integrated Framework issued by the Committee of Sponsoring Organizations of the Treadway Commission, and our report dated March 11, 2010 expressed an unqualified opinion on the Company’s internal control over financial reporting.
(signed) Deloitte & Touche LLP (1)
Independent Registered Chartered Accountants
Montréal, Canada March 11, 2010 (1) Chartered accountant auditor permit no. 13633
BCE INC. 2009 ANNUAL REPORT 83
2009 2008 2007
Cash flows from operating activities 4,884 5,909 5,730 Bell Aliant distributions to BCE 291 290 282 Capital expenditures (2,854) (2,986) (3,140) Other investing activities (89) (726 ) 13 Dividends paid on preferred shares (107) (129 ) (124) Dividends/distributions paid by subsidiaries to non-controlling interest (369) (366 ) (404) Bell Aliant free cash flow (300) (303 ) (399) Telesat free cash flow – – 2
Free cash flow 1,456 1,689 1,960
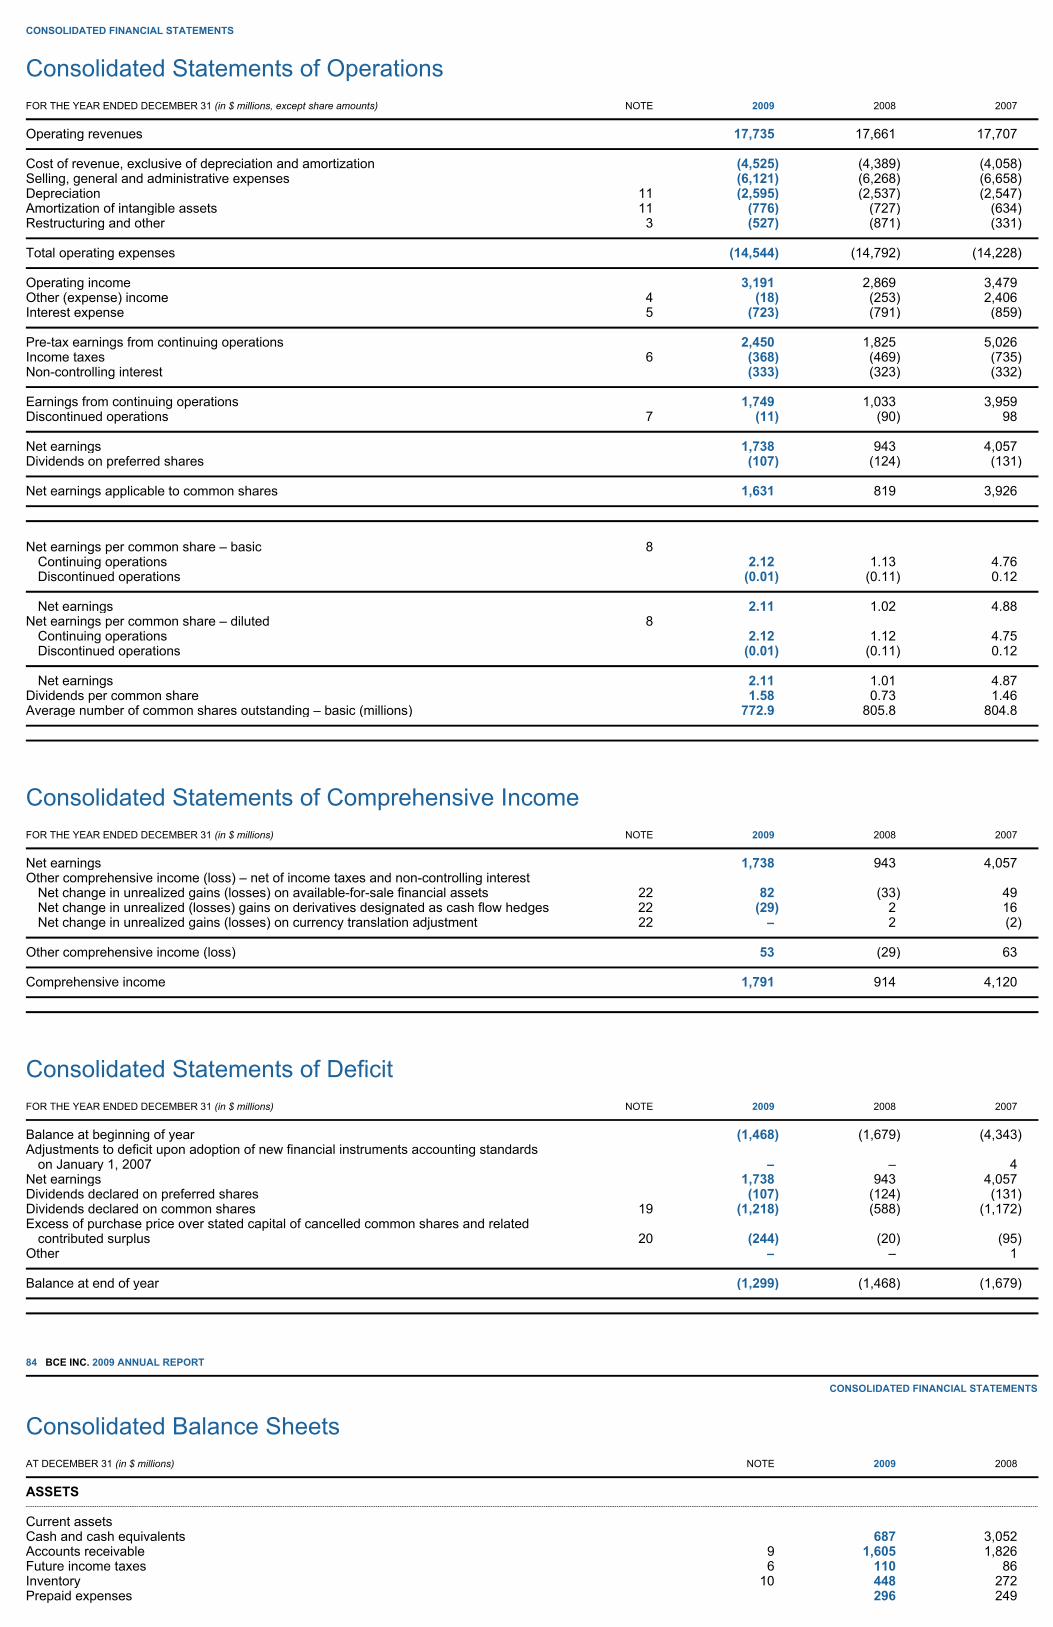
CONSOLIDATED FINANCIAL STATEMENTS
Consolidated Statements of Operations
Consolidated Statements of Comprehensive Income
Consolidated Statements of Deficit
84 BCE INC. 2009 ANNUAL REPORT CONSOLIDATED FINANCIAL STATEMENTS
Consolidated Balance Sheets
FOR THE YEAR ENDED DECEMBER 31 (in $ millions, except share amounts) NOTE 2009 2008 2007
Operating revenues 17,735 17,661 17,707
Cost of revenue, exclusive of depreciation and amortization (4,525) (4,389) (4,058) Selling, general and administrative expenses (6,121) (6,268) (6,658) Depreciation 11 (2,595) (2,537) (2,547) Amortization of intangible assets 11 (776) (727 ) (634) Restructuring and other 3 (527) (871 ) (331)
Total operating expenses (14,544) (14,792 ) (14,228 )
Operating income 3,191 2,869 3,479 Other (expense) income 4 (18) (253 ) 2,406 Interest expense 5 (723) (791 ) (859)
Pre-tax earnings from continuing operations 2,450 1,825 5,026 Income taxes 6 (368) (469 ) (735) Non-controlling interest (333) (323 ) (332)
Earnings from continuing operations 1,749 1,033 3,959 Discontinued operations 7 (11) (90 ) 98
Net earnings 1,738 943 4,057 Dividends on preferred shares (107) (124 ) (131)
Net earnings applicable to common shares 1,631 819 3,926
Net earnings per common share – basic 8
Continuing operations 2.12 1.13 4.76 Discontinued operations (0.01) (0.11 ) 0.12
Net earnings 2.11 1.02 4.88 Net earnings per common share – diluted 8
Continuing operations 2.12 1.12 4.75 Discontinued operations (0.01) (0.11 ) 0.12
Net earnings 2.11 1.01 4.87 Dividends per common share 1.58 0.73 1.46 Average number of common shares outstanding – basic (millions) 772.9 805.8 804.8
FOR THE YEAR ENDED DECEMBER 31 (in $ millions) NOTE 2009 2008 2007
Net earnings 1,738 943 4,057 Other comprehensive income (loss) – net of income taxes and non-controlling interest
Net change in unrealized gains (losses) on available-for-sale financial assets 22 82 (33 ) 49 Net change in unrealized (losses) gains on derivatives designated as cash flow hedges 22 (29) 2 16 Net change in unrealized gains (losses) on currency translation adjustment 22 – 2 (2 )
Other comprehensive income (loss) 53 (29 ) 63
Comprehensive income 1,791 914 4,120
FOR THE YEAR ENDED DECEMBER 31 (in $ millions) NOTE 2009 2008 2007
Balance at beginning of year (1,468) (1,679) (4,343) Adjustments to deficit upon adoption of new financial instruments accounting standards
on January 1, 2007 – – 4 Net earnings 1,738 943 4,057 Dividends declared on preferred shares (107) (124 ) (131) Dividends declared on common shares 19 (1,218) (588 ) (1,172) Excess of purchase price over stated capital of cancelled common shares and related
contributed surplus 20 (244) (20 ) (95 ) Other – – 1
Balance at end of year (1,299) (1,468) (1,679)
AT DECEMBER 31 (in $ millions) NOTE 2009 2008
ASSETS
Current assets Cash and cash equivalents 687 3,052 Accounts receivable 9 1,605 1,826 Future income taxes 6 110 86 Inventory 10 448 272 Prepaid expenses 296 249

On behalf of the board of directors:
BCE INC. 2009 ANNUAL REPORT 85
CONSOLIDATED FINANCIAL STATEMENTS
Consolidated Statements of Cash Flows
Other current assets 137 54 Current assets of discontinued operations 7 1 39
Total current assets 3,284 5,578
Capital assets Property, plant and equipment 19,441 19,406 Finite-life intangible assets 2,541 2,693 Indefinite-life intangible assets 3,803 3,697
Total capital assets 11 25,785 25,796
Other long-term assets 12 3,207 2,610 Goodwill 13 5,774 5,659 Non-current assets of discontinued operations 7 – 20
Total assets 38,050 39,663
LIABILITIES
Current liabilities Accounts payable and accrued liabilities 14 3,716 3,528 Interest payable 113 139 Dividends payable 354 337 Debt due within one year 15 600 2,201 Current liabilities of discontinued operations 7 3 22
Total current liabilities 4,786 6,227
Long-term debt 16 10,299 10,099 Other long-term liabilities 17 4,942 4,946
Total liabilities 20,027 21,272
Non-controlling interest 18 1,049 1,080
Commitments and contingencies 24 SHAREHOLDERS’ EQUITY
Preferred shares 20 2,770 2,770
Common shareholders’ equity Common shares 20 12,921 13,525 Treasury stock 20 – (86 ) Contributed surplus 20 2,490 2,531 Accumulated other comprehensive income 22 92 39 Deficit (1,299) (1,468)
Total common shareholders’ equity 14,204 14,541
Total shareholders’ equity 16,974 17,311
Total liabilities and shareholders’ equity 38,050 39,663
(signed) Thomas C. O’Neill Director
(signed) Paul R. Weiss Director
FOR THE YEAR ENDED DECEMBER 31 (in $ millions) NOTE 2009 2008 2007
Cash flows from operating activities Net earnings 1,738 943 4,057 Less: (Losses) earnings from discontinued operations, net of income tax and non-
controlling interest (11) (90 ) 98
Earnings from continuing operations 1,749 1,033 3,959 Adjustments to reconcile earnings from continuing operations to cash flows from
operating activities Depreciation and amortization of intangible assets 2, 11 3,371 3,264 3,181 Net benefit plans cost 23 355 250 410 Restructuring and other 2, 3 527 871 331 (Gains) losses on investments 4 (49) 308 (2,414) Future income taxes 32 129 413 Non-controlling interest 333 323 332 Contributions to employee pension plans 23 (1,068) (232 ) (265) Other employee future benefit plan payments 23 (96) (96 ) (96 ) Payments of restructuring and other (310) (305 ) (118) Operating assets and liabilities 26 40 364 (3 )
Cash flows from operating activities 4,884 5,909 5,730
Cash flows used in investing activities Capital expenditures 2 (2,854) (2,986) (3,140) Business acquisitions 13 (338) (56 ) (163) Business dispositions 13 11 (10 ) 3,123 Formation of Bell Aliant – – (7) Going-private costs (7) (163 ) (49 ) Increase in investments (53) (8 ) (27 ) Decrease in investments 113 1 192 Other investing activities (89) (726 ) 13
Cash flows used in investing activities (3,217) (3,948) (58 )

86 BCE INC. 2009 ANNUAL REPORT
Notes to Consolidated Financial Statements
This section of our annual report contains the audited consolidated financial statements of BCE Inc. and detailed notes with explanations and additional information. The financial statements contain our results and financial history for the past three years. The notes are an important part of understanding our financial results. They explain how we arrived at the numbers in the financial statements, describe significant events or changes that affect the numbers, and explain certain items in the financial statements.
The notes also include details about our results that do not appear in the financial statements. We, us, our and BCE mean BCE Inc., its subsidiaries and joint ventures; Bell means our Bell Wireline and Bell Wireless segments on an aggregate basis; and Bell Aliant means Bell Aliant Regional Communications Income Fund and its subsidiaries. All amounts are in millions of Canadian dollars, except where noted.
NOTE 1: SIGNIFICANT ACCOUNTING POLICIES
Basis of Presentation
We have prepared the consolidated financial statements according to Canadian generally accepted accounting principles (GAAP).
Basis of Consolidation
We consolidate the financial statements of all of the companies we control. We proportionately consolidate our share of the financial statements of our joint venture interests. All transactions and balances between these companies have been eliminated on consolidation.
Comparative Figures
We have reclassified some of the amounts for the previous periods in the consolidated financial statements to make them consistent with the presentation for the current period. We have restated financial information for the previous periods to reflect our decisions in 2009 to cease the operations of or to sell certain of our businesses.
Using Estimates
When preparing financial statements according to GAAP, management makes estimates and assumptions relating to:
reported amounts of revenues and expenses reported amounts of assets and liabilities disclosure of contingent assets and liabilities.
We base our estimates on a number of factors, including historical experience, current events and actions that the company may undertake in the future, and other assumptions that we believe are reasonable under the circumstances. By their nature, these estimates are subject to measurement uncertainty and actual results could differ, the impact of which would be recorded in future periods. In particular, we use estimates when accounting for certain items such as revenues, allowance for doubtful accounts, useful lives of capital assets, asset impairments, legal and tax contingencies, employee compensation plans, employee benefit plans, retained interest in securitized receivables, and income taxes. We also use estimates when recording the fair values of assets acquired and liabilities assumed in a business combination.
Recognizing Revenue
We recognize revenues when they are earned, specifically when all the following conditions are met:
services are provided or products are delivered to customers there is clear evidence that an arrangement exists amounts are fixed or can be determined our ability to collect is reasonably assured.
In particular, we recognize:
fees for local, long distance and wireless services when we provide the services other fees, such as network access fees, licence fees, hosting fees, maintenance fees and standby fees, over the term of the contract
Cash flows used in financing activities (Decrease) increase in notes payable and bank advances (194) 1 211 Issue of long-term debt 1,348 50 1,071 Repayment of long-term debt (2,539) (502 ) (3,048) Issue of common shares 20 2 50 153 Repurchase of common shares 20 (894) (92 ) (227) Redemption of equity securities by subsidiaries from non-controlling interest – – (333 ) Cash dividends paid on common shares 19 (1,201) (587 ) (1,147) Cash dividends paid on preferred shares (107) (129 ) (124) Cash dividends/distributions paid by subsidiaries to non-controlling interest (369) (366 ) (404) Other financing activities (90) 16 (66 )
Cash flows used in financing activities (4,044) (1,559) (3,914)
Cash flows (used in) from continuing operations (2,377) 402 1,758 Cash flows used in discontinued operations activities (9) (22 ) (19 ) Cash flows from discontinued investing activities 11 27 338 Cash flows used in discontinued financing activities – (2 ) –
Net (decrease) increase in cash and cash equivalents (2,375) 405 2,077 Cash and cash equivalents at beginning of year 3,063 2,658 581
Cash and cash equivalents at end of year 688 3,063 2,658
Consists of:
Cash and cash equivalents of continuing operations 687 3,052 2,646 Cash and cash equivalents of discontinued operations 7 1 11 12
Total 688 3,063 2,658
Income taxes paid (net of refunds) 168 112 36 Interest paid 789 787 880

subscriber revenues when customers receive the service revenues from the sale of equipment when the equipment is delivered and accepted by customers revenues on long-term contracts as services are provided, equipment is delivered and accepted, and contract milestones are met rebates and allowances to customers as a reduction of revenue.
Revenues exclude sales taxes and other taxes we collect from our customers.
BCE INC. 2009 ANNUAL REPORT 87
NOTES TO CONSOLIDATED FINANCIAL STATEMENTS
Multiple-Element Arrangements
We enter into arrangements that may include the sale of a number of products and services, notably in our wireless and video product lines and in our business portfolio. In all such cases, we separately account for each product or service according to the methods previously described when the following three conditions are met:
the product or service has value to our customer on a stand-alone basis there is objective and reliable evidence of the fair value of any undelivered product or service if the sale includes a general right of return relating to a delivered product or service, the delivery or performance of any undelivered product or service is probable and substantially in our control.
If there is objective and reliable evidence of fair value for all products and services in a sale, the total price to the customer is allocated to each product and service based on its relative fair value. Otherwise, we first allocate a portion of the total price to any undelivered products and services based on their fair value and the remainder to the products and services that have been delivered. If the conditions to account separately for each product or service are not met, we recognize revenue pro rata over the term of the customer agreement.
Subcontracted Services
We may enter into arrangements with subcontractors who provide services to our customers. When we act as the principal in these arrangements, we recognize revenue based on the amounts billed to our customers. Otherwise, we recognize as revenue the net amount that we retain.
Sales Returns
We accrue an estimated amount for sales returns, based on our past experience, when revenue is recognized.
Deferred Revenues
We record payments we receive in advance, including upfront non-refundable payments, as deferred revenues until we provide the service or deliver the product to customers. Deferred revenues also include amounts billed under multiple-element sales contracts where the conditions to account separately for each product or service sold have not been met. Deferred revenues are presented in Accounts payable and accrued liabilities or in Other long-term liabilities on the balance sheet.
Cash and Cash Equivalents
Cash and cash equivalents is comprised mainly of highly liquid investments with original maturities of three months or less from the date of purchase.
Securitization of Accounts Receivable
We consider a transfer of accounts receivable to be a sale when we give up control of the accounts receivable in exchange for proceeds other than our retained beneficial interest in the accounts receivable. We determine the fair value of the accounts receivable transferred based on the present value of future expected cash flows, which we project using management’s best estimates of discount rates, the weighted average life of accounts receivable, credit loss ratios and other key assumptions. We recognize a loss on the securitization, which we record in Other (expense) income. The loss is calculated by reference to the carrying amount of the transferred accounts receivable and is allocated between accounts receivable sold and our retained interest, according to their relative fair values on the day the transfer is made. We recognize a servicing liability on the day accounts receivable are transferred when we continue to service the accounts receivable after the transfer. We amortize this liability to earnings over the expected life of the transferred accounts receivable.
Inventory
We measure inventory at the lower of cost and net realizable value. Inventory includes all costs to purchase, convert and bring the inventories to their present location and condition. We determine cost using specific identification for major equipment for resale and the weighted-average cost formula for all other inventory items. We maintain inventory valuation provisions for inventory that is slow-moving or obsolete, calculated using an inventory aging analysis.
Capital Assets
We carry capital assets at cost less accumulated amortization. Most of our telecommunications assets are amortized using the group depreciation method. When we retire assets in the ordinary course of business, we charge their original cost to accumulated amortization. In general, we amortize capital assets other than indefinite-life intangible assets on a straight-line basis over their estimated useful lives. We review the estimates of the useful lives of the assets on a periodic basis and adjust them on a prospective basis, if needed.
We capitalize construction costs, including labour and overhead, and interest when the project cost is significant, related to assets we build or develop.
88 BCE INC. 2009 ANNUAL REPORT NOTES TO CONSOLIDATED FINANCIAL STATEMENTS
We capitalize certain costs of developing or buying software for internal use. We expense software maintenance and training costs when they are incurred. The expense is included in Selling, general and administrative expenses in the statement of operations. We initially measure and record asset retirement obligations at fair value using a present value methodology, adjusted subsequently for any changes to the timing or amount of the original estimate of cash flows. We capitalize asset retirement costs as part of the related assets and amortize them into earnings over time. We also increasethe recorded asset retirement obligation and record a corresponding amount in earnings to reflect the passage of time. We assess capital assets for impairment when events or changes in circumstances indicate that we may not be able to recover their carrying value. We calculate impairment by deducting the assets’ fair value, based on discounted cash flows expected from their use and disposition, from their carrying value. If the fair value is less than the carrying value, the difference is deducted from earnings. We account for leases that transfer substantially all of the benefits and risks of ownership of an asset to us as capital leases. We record an asset when we enter into a capital lease together with a related long-term obligation. Rental payments under operating leases are expensed as incurred.
ESTIMATED USEFUL LIFE
Telecommunications assets 3 to 50 years Machinery and equipment 2 to 20 years Buildings 10 to 40 years Satellites 12 to 15 years Finite-life intangible assets
Software 2 to 7 years Customer relationships 5 to 30 years

Indefinite-Life Intangible Assets
Our indefinite-life intangible assets consist mainly of the Bell brand and wireless spectrum licences. We assess these assets for impairment every year and when events or changes in circumstances indicate that an asset might be impaired. We assess impairment by comparing the assets’ fair value, based on estimates of discounted future cash flows or other valuation methods, to their carrying value. If the fair value is less than the carrying value, the difference is deducted from earnings.
Available-for-Sale (AFS) Financial Assets
We generally designate our portfolio investments in securities as AFS. They are classified in our balance sheet as Other long-term assets. These securities initially are recorded at their fair value on the date of acquisition, plus related transaction costs. Investments in publicly-traded securities are adjusted to fair value at each balance sheet date. The corresponding unrealized gains and losses are recorded in our statement of comprehensive income and are reclassified to Other (expense) income in the statement of operations when realized or when management assesses a decline in fair value to be other than temporary. Investments in our privately-held securities are recorded at cost as their fair value cannot be measured reliably. Gains and losses are recorded in our statement of operations when realized or when management assesses a decline in fair value, calculated using valuation techniques, compared to cost to be other than temporary. Other earnings from investments are also recorded in Other (expense) income in the statement of operations.
Costs of Issuing Debt and Equity
The cost of issuing debt is included as part of long-term debt and is accounted for at amortized cost using the effective interest method, unless the debt is recorded at fair value as part of a hedging relationship. The cost of issuing equity is reflected in the statement of deficit.
Goodwill
We assess goodwill for impairment for each of our reporting units in the fourth quarter of every year and when events or changes in circumstances indicate that goodwill might be impaired. We test goodwill impairment in two steps:
we compare the fair value of a reporting unit to its carrying value. Fair value is based on estimates of discounted future cash flows or other valuation methods. When the fair value of a reporting unit is less than its carrying value, fair values are determined for all of its identifiable assets and liabilities. The excess of the fair value of the reporting unit over the total of the amounts assigned to its assets and liabilities is the fair value of goodwill. an impairment charge is deducted from earnings for any excess of the carrying value of goodwill over its fair value.
Derivative Financial Instruments
We do not use derivative financial instruments for speculative purposes. We use derivative financial instruments to manage:
interest rate risk foreign currency risk changes in the price of BCE Inc. common shares relating to restricted share units (RSUs), deferred share units (DSUs) and special compensation payments (SCPs).
We document all relationships between derivatives and the items they hedge and our risk management objective and strategy for using hedges. This process includes linking every derivative to:
a specific asset or liability, or a specific firm commitment, or an anticipated transaction.
We assess the effectiveness of a derivative in managing an identified risk when hedge accounting is initially applied, and on an ongoing basis thereafter. If a hedge becomes ineffective, we stop using hedge accounting. Any premiums paid for derivatives used in hedging relationships are deferred and expensed to earnings over the term of the contract. Any forward premiums or discounts on foreign currency forward contracts that are used to hedge long-term debt denominated in foreign currencies are amortized to interest expense over the term of the forward contract.
BCE INC. 2009 ANNUAL REPORT 89
NOTES TO CONSOLIDATED FINANCIAL STATEMENTS
Fair Value Hedges
Our fair value hedges primarily consist of interest rate swaps used to manage the effect of changes in interest rates relating to fixed-rate long-term debt. These swaps usually involve exchanging interest payments without exchanging the notional amount on which the payments are based. We record the exchange of payments as an adjustment to interest expense on the hedged debt. We include the related net receivable or payable from counterparties in Other current assets or Accounts payable and accrued liabilities for swaps that mature within one year, and in Other long-term assets or Other long-term liabilities for swaps that have a maturity of more than one year. Changes in the fair value of these derivatives and the related long-term debt are recognized in Other (expense) income in the statement of operations and offset, except for any ineffective portion of the hedging relationship.
Cash Flow Hedges
Our cash flow hedges are used to mitigate the foreign currency risk on certain long-term debt instruments and purchase commitments. We use cross-currency swaps to hedge firm commitments to pay interest and/or principal amounts in a foreign currency. We use foreign currency forward contracts to manage the exposure to anticipated transactions denominated in foreign currencies. Changes in the fair value of these derivatives are recognized in our statement of comprehensive income, except for any ineffective portion, which is recognized immediately in income. Realized gains and losses in accumulated other comprehensive income are reclassified to the statement of operations in the same periods as the corresponding hedged items are recognized in income. Cash flow hedges that mature within one year are included in Other current assets or Accounts payable and accrued liabilities, whereas hedges that have a maturity of more than one year are included in Other long-term assets or Other long-term liabilities.
Economic Hedges
Derivatives that are economic hedges but do not qualify for hedge accounting are recognized at fair value. We record changes in the fair value of these derivatives in the statement of operations as they occur. Unrealized gains and losses are included in Other current assets or Accounts payable and accrued liabilities.
Employee Benefit Plans
Defined Benefit (DB) Pension and Other Post-Employment Benefit Plans
We maintain DB plans that provide pension benefits for most of our employees. Benefits are based on the employee’s length of service and highest average rate of pay during five consecutive years of service. Most employees are not required to contribute to the plans. The plans provide increasing pension benefits to help protect a portion of the income of retired employees against inflation. We are responsible for adequately funding our DB pension plans. We make contributions to them based on various actuarial cost methods permitted by pension regulatory bodies. Contributions reflect actuarial assumptions about future investment returns, salary projections and future service. We also may make voluntary contributions up to the maximum allowed as per applicable pension legislation. We also provide other post-employment benefits to some of our employees, including:
healthcare and life insurance benefits during retirement. The provision of such benefits is being phased out over a ten-year period ending on December 31, 2016. We do not fund most of these other post-employment benefit plans. other benefits, including various disability plans, workers’ compensation and medical benefits to former or inactive employees, their beneficiaries and dependants, from the time their employment ends until their retirement starts, under certain circumstances.

We accrue our obligations and related costs under employee benefit plans, net of the fair value of plan assets. Pension and other post-employment benefit costs are determined using:
the projected benefit method, prorated based on years of service, which takes into account future pay levels a discount rate based on market interest rates of high-quality corporate bonds with maturities that match the timing of benefits expected to be paid under the plans management’s best estimate of the plans’ expected investment performance, pay increases, retirement ages of employees and expected healthcare costs.
90 BCE INC. 2009 ANNUAL REPORT
NOTES TO CONSOLIDATED FINANCIAL STATEMENTS
We value pension plan assets at fair value using current market values. We use a market-related value to calculate the expected return on plan assets. This value is based on a four-year weighted average of the fair value of the pension plan assets. We amortize past service costs from plan amendments on a straight-line basis over the average remaining service period of employees who were active on the day of the amendment. This represents the period during which we expect to realize economic benefits from the amendments. Transitional assets and obligations that arose upon implementation of new accounting standards for employee future benefits are amortized on a straight-line basis over the average remaining service period of employees expected to receive benefits under the plans. We use the corridor approach to recognize actuarial gains and losses in earnings. We deduct 10% of the benefit obligation or the market-related value of plan assets, whichever is greater, from the unamortized net actuarial gains or losses on a market-related value basis. Any excess is amortized over the average remaining service period of active employees. At the end of 2009, this period ranged from 9 to 13 years, with a weighted average period of 10.2 years. December 31 is the measurement date for our employee benefit plans. Our actuaries perform a valuation at least every three years to determine the actuarial present value of the accrued pension and other post-employment benefits. An actuarial valuation was last performed on most of our pension plans on December 31, 2008. When the restructuring of a benefit plan results in both a curtailment and a settlement of obligations, we account for the curtailment before we account for the settlement.
Defined Contribution (DC) Plans
We also maintain DC plans that provide certain employees with pension benefits. Under these plans, we are responsible for contributing an amount to an employee’s retirement savings, based on a predetermined percentage of that employee’s salary and certain incentive compensation subject to company rules. We recognize a pension cost for DC plans when the employee provides service to the company, essentially coinciding with our cash contributions. Generally, new employees participate only in the DC pension arrangements.
Income Taxes
The income tax expense for the period comprises current and future tax expense. We use the liability method to account for future income taxes. Future income taxes reflect:
the temporary differences between the carrying amounts of assets and liabilities for accounting purposes and the amounts used for tax purposes the benefit of unutilized tax losses that will more likely than not be realized and carried forward to future years to reduce income taxes.
We calculate future income taxes using the rates enacted by tax law and those substantively enacted at the end of the reporting period that are expected to apply when the future tax asset or liability is recovered or settled. The effect of a change in tax rates on future income tax assets and liabilities is included in earnings in the period when the change is substantively enacted.
Investment Tax Credits
We recognize investment tax credits (ITCs) when there is reasonable assurance that they will be realized, and they are presented as part of Accounts receivable and Other long-term assets on the balance sheet. We use the cost reduction method to account for ITCs, under which the credits are applied against the qualifying expense or asset to which the ITC relates.
Subscriber Acquisition Costs
We expense all subscriber acquisition costs when the related services are activated.
Stock-Based Compensation Plans
BCE Inc.’s stock-based compensation plans include stock option plans, RSUs, DSUs and the employee savings plan (ESP). Before 2000, the long-term incentive plans included SCPs. Any liabilities relating to stock-based compensation plans are recorded as part of Accounts payable and accrued liabilities or Other long-term liabilities.
BCE INC. 2009 ANNUAL REPORT 91
NOTES TO CONSOLIDATED FINANCIAL STATEMENTS
Stock Options
We use the fair value-based method to account for employee stock options granted on or after January 1, 2002 and the Black-Scholes option pricing model to measure compensation expense relating to options. We credit contributed surplus for the stock option expense recorded over the vesting period, based on management’s estimate of the number of options that are expected to vest. Upon the exercise of stock options, we credit share capital for the amount paid by the employees as well as the amounts previously credited to contributed surplus.
RSUs
For each RSU granted, we record compensation expense equal to the market value of a BCE Inc. common share at the date of grant, prorated over the vesting period and based on management’s estimate of the number of RSUs that are expected to vest. Compensation expense is adjusted for subsequent changes in the market value of BCE Inc. common shares and any change in management’s estimate of the number of RSUs that are expected to vest. The cumulative effect of any change in value is recognized in the period of the change. Vested RSUs are paid in cash, except for executives who can settle either in BCE Inc. common shares purchased on the open market, in cash, in DSUs or through a combination of these.
DSUs
For each DSU granted, we record compensation expense equal to the market value of a BCE Inc. common share at the date of grant. Compensation expense is adjusted for subsequent changes in the market value of BCE Inc. common shares. DSUs are settled in BCE Inc. common shares purchased on the open market following the cessation of a participant’s employment or when a director leaves the board.
ESP and SCPs
We recognize our contributions under the ESP as compensation expense. We also recognize compensation expense or recovery relating to SCPs.
Regulation of the Telecommunications Industry
Some of our subsidiaries, such as Bell Canada and Bell Aliant, are regulated by the Canadian Radio-television and Telecommunications Commission (CRTC) pursuant to the Telecommunications Act. Although the majority of our services are forborne from economic regulation, our business is affected by CRTC decisions over the prices we charge for specific services that remain subject to economic regulation and other operating requirements.
Recent Changes to Accounting Policies and Standards

Goodwill and Intangible Assets
The Canadian Accounting Standards Board (AcSB) issued section 3064, Goodwill and Intangible Assets, which establishes standards for the recognition, measurement, presentation and disclosure of intangible assets. Section 3064 came into effect on January 1, 2009, replacing section 3062, Goodwill and Other Intangible Assets and section 3450, Research and Development Costs. Adoption of this new standard did not have a significant impact on our financial results.
Future Changes to Accounting Policies and Standards
Multiple Deliverable Revenue Arrangements
In December 2009, the Emerging Issues Committee of the AcSB issued EIC-175, Multiple Deliverable Revenue Arrangements, which addresses certain aspects of accounting by a vendor for arrangements under which it will perform multiple revenue-generating activities, amending the previous guidance under EIC-142, Revenue Arrangements with Multiple Deliverables. The amendments require a vendor to allocate arrangement consideration at the inception of an arrangement to all deliverables using the relative selling price method, thus prohibiting the use of the residual method. EIC-175 also changes the level of evidence of the stand-alone selling price required to separate deliverables when more objective evidence of the selling price is not available. EIC-175 may be applied prospectively and must be applied to revenue arrangements with multiple deliverables entered into or materially modified in the first annual fiscal period beginning on or after January 1, 2011. Early adoption is permitted. We are currently evaluating the impact and effective date of adoption of EIC-175.
92 BCE INC. 2009 ANNUAL REPORT NOTES TO CONSOLIDATED FINANCIAL STATEMENTS
NOTE 2: SEGMENTED INFORMATION
The accounting policies used by the segments are the same as those we describe in Note 1, Significant Accounting Policies. Segments negotiate sales with each other as if they were unrelated parties. We measure the profitability of each segment based on its operating earnings before interest, income taxes, and depreciation and amortization (EBITDA). For financial reporting purposes, we allocate depreciation and amortization, and restructuring and other to the segments to calculate operating income by segment. Our operations, including most of our revenues, capital assets and goodwill, are located in Canada. Our results of operations are reported in four segments: Bell Wireline, Bell Wireless, Bell Aliant and Telesat. Our reporting structure reflects how we manage our business and how we classify our operations for planning and measuring performance. Accordingly, we operate and manage our segments as strategic business units organized by products and services. Substantially all of our interest expense, other (expense) income, income tax and non-controlling interest are managed on a total company basis and are, accordingly, not reflected in segment results. The inter-segment eliminations eliminate any intercompany transactions included in each segment’s results. The Bell Wireline segment provides local telephone, long distance, data (including Internet access), video and other services to Bell Canada’s residential, small and medium-sized business and large enterprise customers, primarily in the urban areas of Ontario and Québec. Video services are provided nationwide. Also included in this segment is our wholesale business, which provides and purchases local telephone, long distance, data and other services to or from resellers and other carriers. The Bell Wireless segment provides wireless telephone and products to Bell Canada’s residential, small and medium-sized business and large enterprise customers across Canada. The Bell Aliant segment provides local telephone, long distance, Internet, data, video, wireless, IT services and products, and other information and communications technology solutions to residential and business customers in the Atlantic provinces, and in rural Ontario and Québec. Telesat provides satellite communications and systems management and also provides consulting services in establishing, operating and upgrading satellite systems worldwide. On October 31, 2007, we sold Telesat, which represents all of our Telesat segment. We have maintained continuing commercial arrangements between Telesat and Bell TV that provide Bell TV continued access to satellite capacity. As a result of these arrangements, we have not accounted for Telesat as a discontinued operation.
BCE INC. 2009 ANNUAL REPORT 93
NOTES TO CONSOLIDATED FINANCIAL STATEMENTS
Segmented Information
BELL
WIRELINE BELL
WIRELESS
INTER-SEGMENT
ELIMINA-TIONS BELL
BELLALIANT
INTER-SEGMENT
ELIMINA-TIONS
CONSOLI-DATED
For the year ended December 31, 2009 Operating revenues
External customers 10,343 4,507 – 14,850 2,885 – 17,735 Inter-segment 323 51 (204) 170 289 (459) –
Total operating revenues 10,666 4,558 (204) 15,020 3,174 (459) 17,735 Operating expenses (6,759) (2,746) 204 (9,301) (1,804) 459 (10,646) Depreciation and amortization of intangible assets (2,284) (520) – (2,804) (567) – (3,371) Restructuring and other (475) (8) – (483) (44) – (527)
Operating income 1,148 1,284 – 2,432 759 – 3,191 Other expense (18) Interest expense (723) Income taxes (368) Non-controlling interest (333)
Earnings from continuing operations 1,749 Segment assets 24,236 7,868 – 32,104 6,198 (252) 38,050 Capital expenditures 1,717 673 – 2,390 464 – 2,854 Additions to advanced wireless services (AWS) spectrum licences – 40 – 40 – – 40
For the year ended December 31, 2008 Operating revenues
External customers 10,272 4,434 – 14,706 2,955 – 17,661 Inter-segment 368 45 (248) 165 342 (507) –
Total operating revenues 10,640 4,479 (248) 14,871 3,297 (507) 17,661 Operating expenses (6,772 ) (2,709) 248 (9,233 ) (1,931 ) 507 (10,657 ) Depreciation and amortization of intangible assets (2,193 ) (492) – (2,685 ) (579 ) – (3,264 ) Restructuring and other (773 ) (37 ) – (810 ) (61 ) – (871 )
Operating income 902 1,241 – 2,143 726 – 2,869 Other expense (253) Interest expense (791) Income taxes (469) Non-controlling interest (323)
Earnings from continuing operations 1,033 Segment assets 25,836 7,823 – 33,659 6,306 (302) 39,663 Capital expenditures 1,966 493 – 2,459 527 – 2,986 Additions to AWS spectrum licences – 741 – 741 – – 741
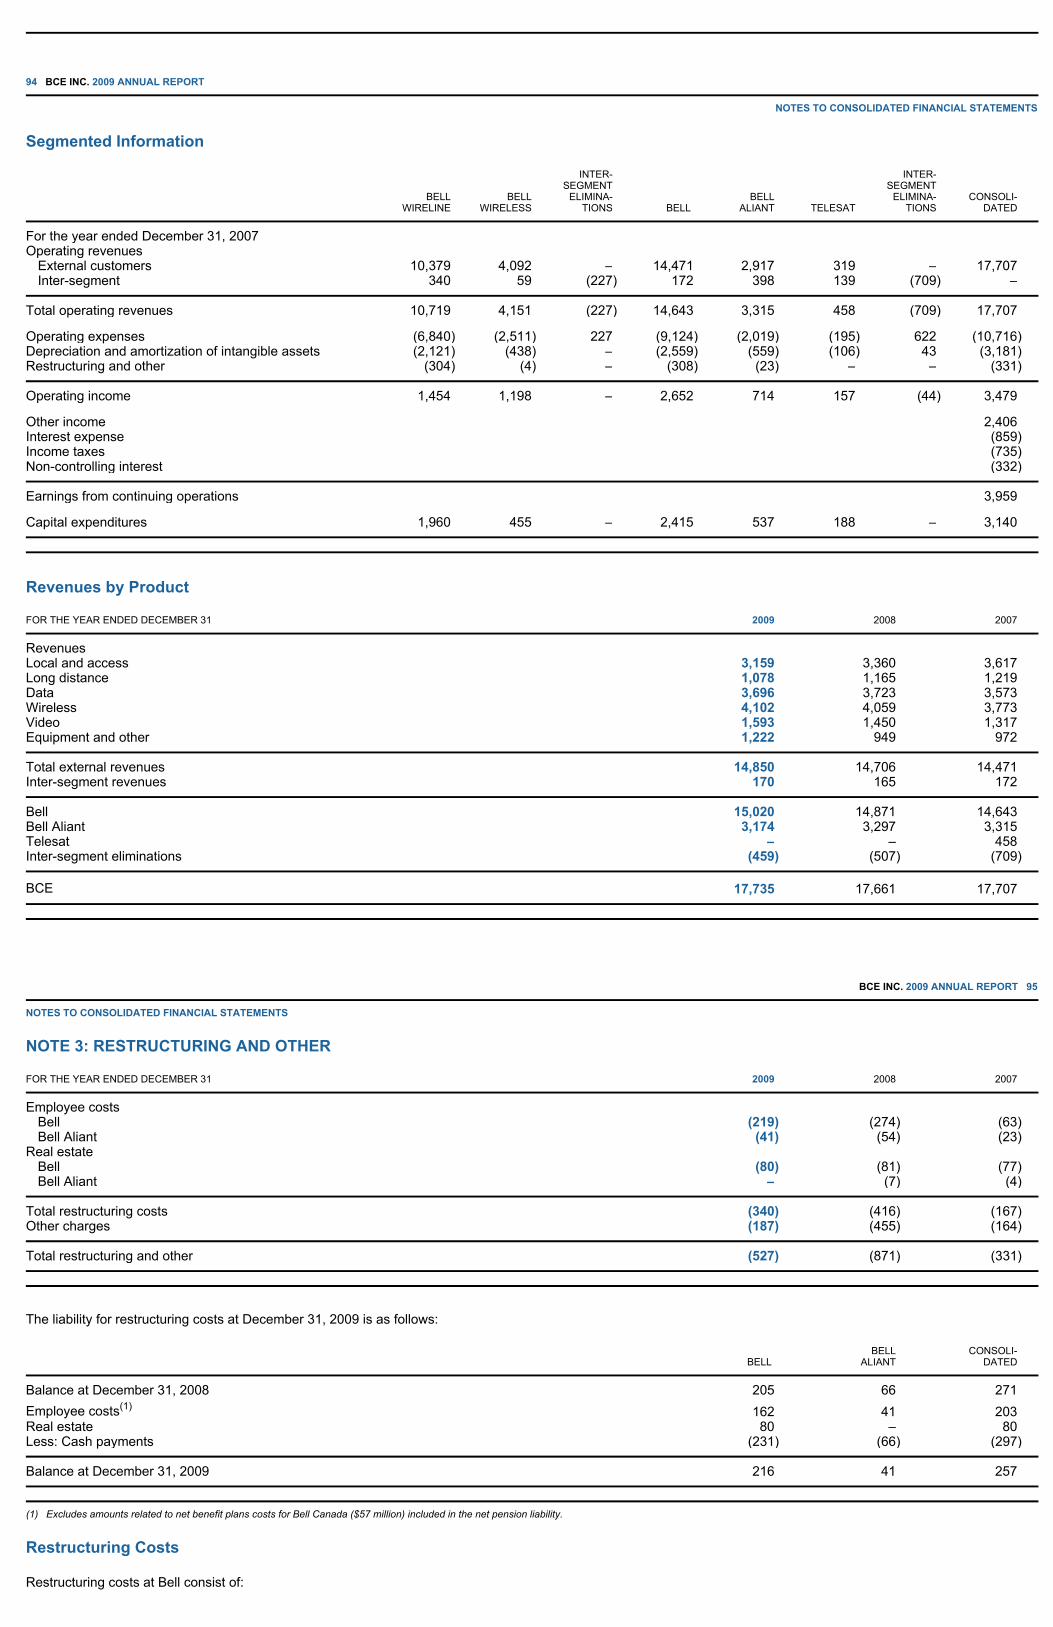
94 BCE INC. 2009 ANNUAL REPORT NOTES TO CONSOLIDATED FINANCIAL STATEMENTS
Segmented Information
Revenues by Product
BCE INC. 2009 ANNUAL REPORT 95
NOTES TO CONSOLIDATED FINANCIAL STATEMENTS
NOTE 3: RESTRUCTURING AND OTHER
The liability for restructuring costs at December 31, 2009 is as follows:
Restructuring Costs
Restructuring costs at Bell consist of:
BELLWIRELINE
BELLWIRELESS
INTER-SEGMENT
ELIMINA-TIONS BELL
BELLALIANT TELESAT
INTER-SEGMENT
ELIMINA-TIONS
CONSOLI-DATED
For the year ended December 31, 2007 Operating revenues
External customers 10,379 4,092 – 14,471 2,917 319 – 17,707 Inter-segment 340 59 (227) 172 398 139 (709) –
Total operating revenues 10,719 4,151 (227) 14,643 3,315 458 (709) 17,707 Operating expenses (6,840 ) (2,511 ) 227 (9,124) (2,019 ) (195 ) 622 (10,716 ) Depreciation and amortization of intangible assets (2,121 ) (438 ) – (2,559 ) (559 ) (106 ) 43 (3,181) Restructuring and other (304 ) (4 ) – (308 ) (23 ) – – (331 )
Operating income 1,454 1,198 – 2,652 714 157 (44 ) 3,479 Other income 2,406 Interest expense (859) Income taxes (735) Non-controlling interest (332)
Earnings from continuing operations 3,959 Capital expenditures 1,960 455 – 2,415 537 188 – 3,140
FOR THE YEAR ENDED DECEMBER 31 2009 2008 2007
Revenues Local and access 3,159 3,360 3,617 Long distance 1,078 1,165 1,219 Data 3,696 3,723 3,573 Wireless 4,102 4,059 3,773 Video 1,593 1,450 1,317 Equipment and other 1,222 949 972
Total external revenues 14,850 14,706 14,471 Inter-segment revenues 170 165 172
Bell 15,020 14,871 14,643 Bell Aliant 3,174 3,297 3,315 Telesat – – 458 Inter-segment eliminations (459) (507 ) (709)
BCE 17,735 17,661 17,707
FOR THE YEAR ENDED DECEMBER 31 2009 2008 2007
Employee costs Bell (219) (274 ) (63 ) Bell Aliant (41) (54 ) (23 )
Real estate Bell (80) (81 ) (77 ) Bell Aliant – (7 ) (4 )
Total restructuring costs (340) (416 ) (167) Other charges (187) (455 ) (164)
Total restructuring and other (527) (871 ) (331)
BELL BELL
ALIANT CONSOLI-
DATED
Balance at December 31, 2008 205 66 271 Employee costs(1) 162 41 203 Real estate 80 – 80 Less: Cash payments (231 ) (66 ) (297)
Balance at December 31, 2009 216 41 257
(1) Excludes amounts related to net benefit plans costs for Bell Canada ($57 million) included in the net pension liability.
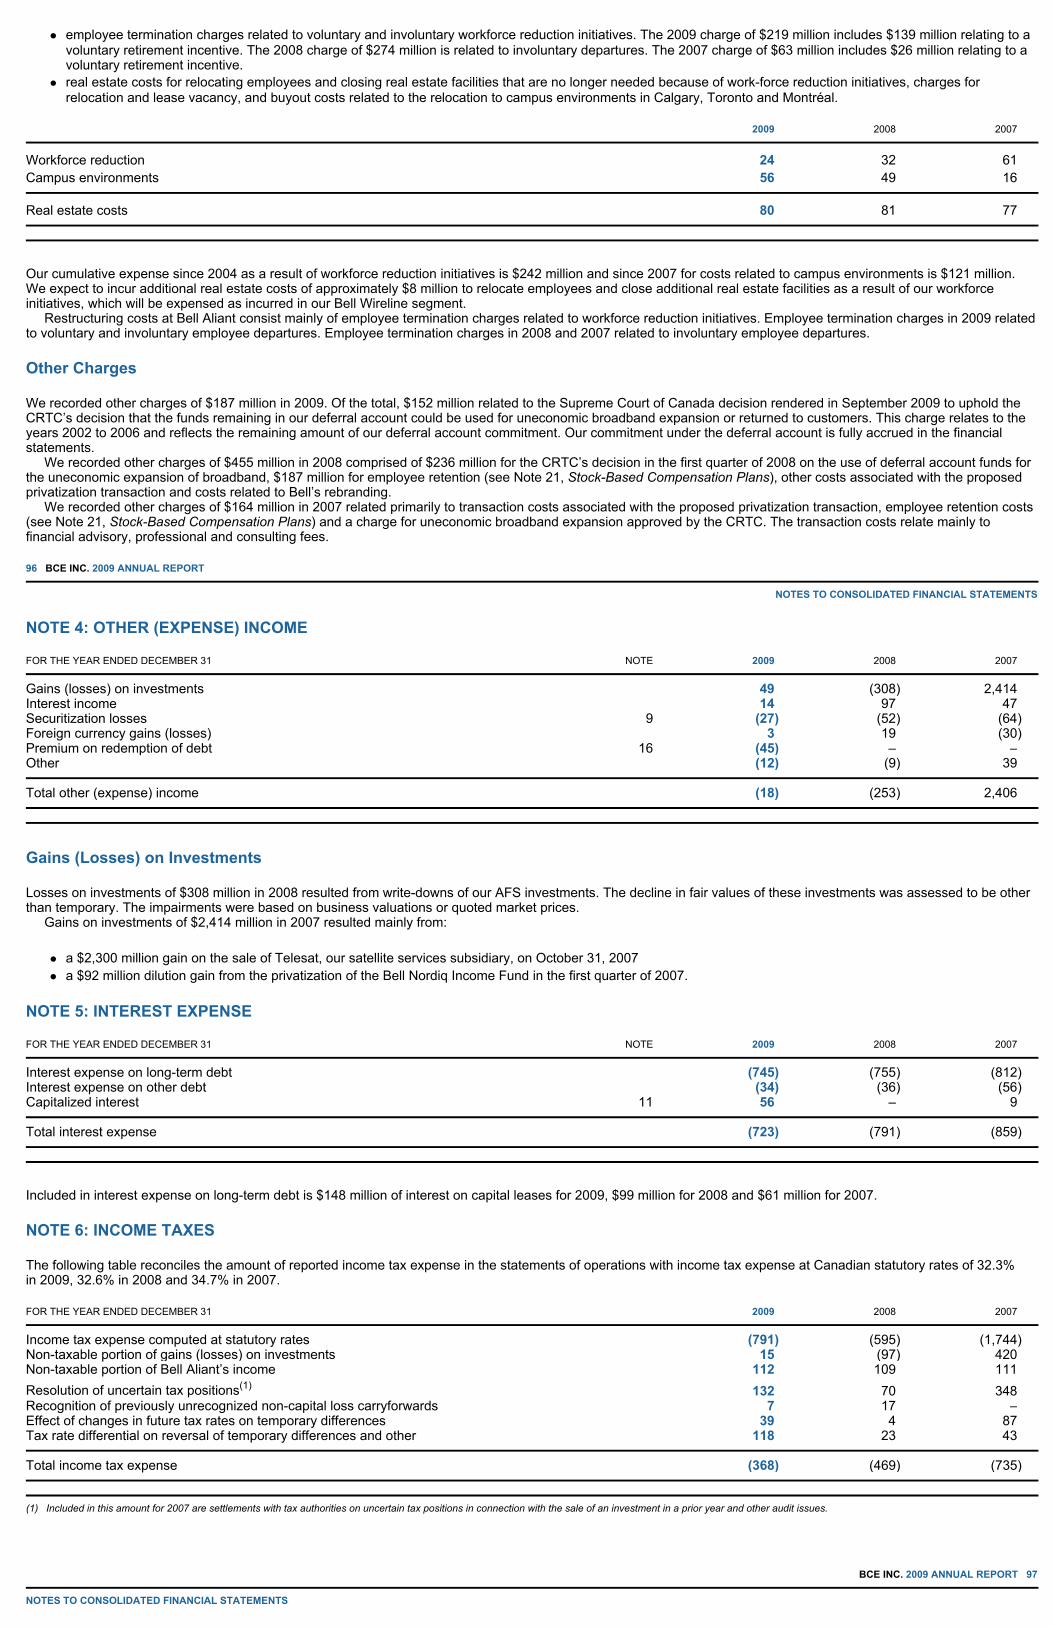
employee termination charges related to voluntary and involuntary workforce reduction initiatives. The 2009 charge of $219 million includes $139 million relating to a voluntary retirement incentive. The 2008 charge of $274 million is related to involuntary departures. The 2007 charge of $63 million includes $26 million relating to a voluntary retirement incentive. real estate costs for relocating employees and closing real estate facilities that are no longer needed because of work-force reduction initiatives, charges for relocation and lease vacancy, and buyout costs related to the relocation to campus environments in Calgary, Toronto and Montréal.
Our cumulative expense since 2004 as a result of workforce reduction initiatives is $242 million and since 2007 for costs related to campus environments is $121 million. We expect to incur additional real estate costs of approximately $8 million to relocate employees and close additional real estate facilities as a result of our workforce initiatives, which will be expensed as incurred in our Bell Wireline segment. Restructuring costs at Bell Aliant consist mainly of employee termination charges related to workforce reduction initiatives. Employee termination charges in 2009 related to voluntary and involuntary employee departures. Employee termination charges in 2008 and 2007 related to involuntary employee departures.
Other Charges
We recorded other charges of $187 million in 2009. Of the total, $152 million related to the Supreme Court of Canada decision rendered in September 2009 to uphold the CRTC’s decision that the funds remaining in our deferral account could be used for uneconomic broadband expansion or returned to customers. This charge relates to the years 2002 to 2006 and reflects the remaining amount of our deferral account commitment. Our commitment under the deferral account is fully accrued in the financial statements. We recorded other charges of $455 million in 2008 comprised of $236 million for the CRTC’s decision in the first quarter of 2008 on the use of deferral account funds for the uneconomic expansion of broadband, $187 million for employee retention (see Note 21, Stock-Based Compensation Plans), other costs associated with the proposed privatization transaction and costs related to Bell’s rebranding. We recorded other charges of $164 million in 2007 related primarily to transaction costs associated with the proposed privatization transaction, employee retention costs (see Note 21, Stock-Based Compensation Plans) and a charge for uneconomic broadband expansion approved by the CRTC. The transaction costs relate mainly to financial advisory, professional and consulting fees.
96 BCE INC. 2009 ANNUAL REPORT NOTES TO CONSOLIDATED FINANCIAL STATEMENTS
NOTE 4: OTHER (EXPENSE) INCOME
Gains (Losses) on Investments
Losses on investments of $308 million in 2008 resulted from write-downs of our AFS investments. The decline in fair values of these investments was assessed to be other than temporary. The impairments were based on business valuations or quoted market prices. Gains on investments of $2,414 million in 2007 resulted mainly from:
a $2,300 million gain on the sale of Telesat, our satellite services subsidiary, on October 31, 2007 a $92 million dilution gain from the privatization of the Bell Nordiq Income Fund in the first quarter of 2007.
NOTE 5: INTEREST EXPENSE
Included in interest expense on long-term debt is $148 million of interest on capital leases for 2009, $99 million for 2008 and $61 million for 2007.
NOTE 6: INCOME TAXES
The following table reconciles the amount of reported income tax expense in the statements of operations with income tax expense at Canadian statutory rates of 32.3% in 2009, 32.6% in 2008 and 34.7% in 2007.
BCE INC. 2009 ANNUAL REPORT 97
NOTES TO CONSOLIDATED FINANCIAL STATEMENTS
2009 2008 2007
Workforce reduction 24 32 61 Campus environments 56 49 16
Real estate costs 80 81 77
FOR THE YEAR ENDED DECEMBER 31 NOTE 2009 2008 2007
Gains (losses) on investments 49 (308 ) 2,414 Interest income 14 97 47 Securitization losses 9 (27) (52 ) (64 ) Foreign currency gains (losses) 3 19 (30 ) Premium on redemption of debt 16 (45) – – Other (12) (9 ) 39
Total other (expense) income (18) (253 ) 2,406
FOR THE YEAR ENDED DECEMBER 31 NOTE 2009 2008 2007
Interest expense on long-term debt (745) (755 ) (812) Interest expense on other debt (34) (36 ) (56 ) Capitalized interest 11 56 – 9
Total interest expense (723) (791 ) (859)
FOR THE YEAR ENDED DECEMBER 31 2009 2008 2007
Income tax expense computed at statutory rates (791) (595 ) (1,744) Non-taxable portion of gains (losses) on investments 15 (97 ) 420 Non-taxable portion of Bell Aliant’s income 112 109 111 Resolution of uncertain tax positions(1) 132 70 348 Recognition of previously unrecognized non-capital loss carryforwards 7 17 – Effect of changes in future tax rates on temporary differences 39 4 87 Tax rate differential on reversal of temporary differences and other 118 23 43
Total income tax expense (368) (469 ) (735)
(1) Included in this amount for 2007 are settlements with tax authorities on uncertain tax positions in connection with the sale of an investment in a prior year and other audit issues.

The following table shows the significant components of income tax expense that related to earnings from continuing operations.
The following table shows future income taxes resulting from temporary differences between the carrying amounts of assets and liabilities for accounting purposes and the amounts used for tax purposes, as well as tax loss carryforwards.
At December 31, 2009, BCE had $832 million of non-capital loss carryforwards. We:
recognized a future tax asset of $225 million, of which $181 million related to Bell Aliant, on approximately $734 million of the non-capital loss carryforwards. Of the total non-capital loss carryforwards recognized, $41 million expires in varying annual amounts until the end of 2019. The balance expires in varying annual amounts from 2020 to 2029. did not recognize a future tax asset for approximately $98 million of non-capital loss carryforwards. This balance expires in varying annual amounts from 2020 to 2029.
At December 31, 2009, BCE had $1,021 million in unrecognized capital loss carryforwards which can be carried forward indefinitely.
98 BCE INC. 2009 ANNUAL REPORT NOTES TO CONSOLIDATED FINANCIAL STATEMENTS
NOTE 7: DISCONTINUED OPERATIONS
The following table is a summarized statement of operations for the discontinued operations.
Expertech US
In 2008, we decided to sell our investment in Expertech US. As such, we accounted for Expertech US as a discontinued operation and no longer consolidated its financial results. A loss of $15 million was recorded in anticipation of the sale of Expertech US. In 2009, we ceased operations of Expertech US. Expertech US was previously included in the Bell Wireline segment.
ADS
In February 2007, Yellow Pages Group (YPG), through Yellow Pages Income Fund, and Bell Aliant announced that they had entered into a memorandum of understanding for YPG to acquire the assets of ADS, a partnership held 87.14% by Bell Aliant and the balance by YPG. At March 31, 2007, we accounted for ADS as a discontinued operation and no longer proportionately consolidated its financial results. ADS was previously included in the Bell Aliant segment. On April 30, 2007, the transaction was completed and we realized net proceeds of $327 million. The gain on disposition was approximately $110 million.
NOTE 8: EARNINGS PER SHARE
The following table is a reconciliation of the components used in the calculation of basic and diluted earnings per common share from continuing operations.
FOR THE YEAR ENDED DECEMBER 31 2009 2008 2007
Current income taxes (336) (340 ) (322) Future income taxes
Recognition and utilization of loss carryforwards (27) (61 ) (478) Resolution of uncertain tax positions 132 70 348 Effect of changes in future tax rates on temporary differences 39 4 87 Change in temporary differences and other (176) (142 ) (370)
Total income tax expense (368) (469 ) (735)
AT DECEMBER 31 NOTE 2009 2008
Non-capital loss carryforwards 225 215 Employee benefit plans (116) 104 Property, plant and equipment and finite-life intangible assets (804) (795) Indefinite-life intangible assets (440) (426) Investment tax credits (175) (240) Partnership income deferral(1) (118) (116) Other (427) (574)
Total future income taxes (1,855) (1,832)
Future income tax balances are comprised of: Future income tax asset – current portion 110 86 Future income tax asset – long-term portion 12 52 76 Future income tax liability – current portion 14 (31) (86 ) Future income tax liability – long-term portion 17 (1,986) (1,908)
Total future income taxes (1,855) (1,832)
(1) The taxation year end of certain of Bell Aliant’s corporate subsidiaries differs from their partnership year ends. This results in a deferral of partnership income for tax purposes.
FOR THE YEAR ENDED DECEMBER 31 2009 2008 2007
Expertech Network Installation (US) Inc. (Expertech US) 1 (43 ) (3 ) ADS – (5 ) 114 Other(1) (12) (42 ) (13 )
Net (loss) gain from discontinued operations (11) (90 ) 98
(1) Due mainly to asset impairments related to our decisions to cease the operations of or to sell certain of our businesses.
FOR THE YEAR ENDED DECEMBER 31 2009 2008 2007
Revenue 43 125 167
(Loss) income from discontinued operations (7) (43 ) (35 ) (Loss) gain from discontinued operations (13) (55 ) 338 Income tax recovery on operating loss – – 4 Income tax expense on gain – – (56 ) Non-controlling interest 9 8 (153)
Net (loss) gain from discontinued operations (11) (90 ) 98

BCE INC. 2009 ANNUAL REPORT 99
NOTES TO CONSOLIDATED FINANCIAL STATEMENTS
NOTE 9: ACCOUNTS RECEIVABLE
Securitization of Accounts Receivable
At December 31, 2009, an interest of $1,140 million of Bell Canada’s accounts receivable had been sold to a securitization trust for cash ($1,140 million in cash at December 31, 2008) under a revolving sales agreement that expires on May 13, 2012. Bell Canada had a retained interest of $192 million in the accounts receivable at December 31, 2009 ($130 million at December 31, 2008), which equals the amount of overcollateralization in the receivables sold. At December 31, 2009, an interest of $165 million of Bell Aliant’s accounts receivable had been sold to a securitization trust for cash ($165 million in cash at December 31, 2008) under a revolving sales agreement that expires on July 7, 2011. Bell Aliant had a retained interest of $43 million in the accounts receivable at December 31, 2009 ($44 million at December 31, 2008). Bell Canada and Bell Aliant continue to service these accounts receivable. The buyers’ interest in the collection of these accounts receivable ranks ahead of the interests of Bell Canada and Bell Aliant, which means that Bell Canada and Bell Aliant are exposed to certain risks of default on the amount securitized. Bell Canada and Bell Aliant have provided various credit enhancements in the form of overcollateralization and subordination of their retained interests. The buyers will reinvest the amounts collected by buying additional interests in the Bell Canada and Bell Aliant accounts receivable until the agreements expire. The buyers and their investors have no further claim on Bell Canada’s and Bell Aliant’s other assets if customers do not pay amounts owed. In 2009, we recognized a loss of $27 million on the revolving sale of accounts receivable for the combined securitizations, compared to losses of $52 million in 2008 and $64 million in 2007. The following table shows balances for the securitization programs at December 31, 2009 and the assumptions that were used on the date of transfer and at December 31, 2009. A 10% or 20% adverse change in each of these assumptions would have no significant effect on the current fair value of the retained interest.
The following table is a summary of certain cash flows received from and paid to the trusts during the year.
NOTE 10: INVENTORY
The total amount of inventories recognized as an expense was $1,505 million in 2009, $1,307 million in 2008 and $1,277 million in 2007.
100 BCE INC. 2009 ANNUAL REPORT NOTES TO CONSOLIDATED FINANCIAL STATEMENTS
NOTE 11: CAPITAL ASSETS
2009 2008 2007
Earnings from continuing operations Earnings from continuing operations 1,749 1,033 3,959 Dividends on preferred shares (107) (124 ) (131)
Earnings from continuing operations – basic 1,642 909 3,828 Weighted average number of common shares outstanding (in millions) Weighted average number of common shares outstanding – basic 772.9 805.8 804.8 Assumed exercise of stock options(1) – 1.4 2.1
Weighted average number of common shares outstanding – diluted 772.9 807.2 806.9
(1) The calculation of the assumed exercise of stock options includes the effect of the average unrecognized future compensation cost of dilutive options. It does not include anti-dilutive options, which are options that would not be exercised because their exercise price is higher than the average market value of a BCE Inc. common share. The number of excluded options was 10,508,239 in 2009, 4,646,531 in 2008 and 5,278,529 in 2007.
AT DECEMBER 31 2009 2008
Trade accounts receivable 1,245 1,394 Allowance for doubtful accounts (105) (131) Allowance for revenue adjustments (83) (82 ) Income taxes receivable 118 63 Investment tax credits 300 408 Other accounts receivable 130 174
Total accounts receivable 1,605 1,826
RANGE FOR 2009 2009 2008
Securitized interest in accounts receivable 1,305 1,305 Retained interest 235 174 Servicing liability 2 2 Average accounts receivable managed 2,146 2,091 Assumptions
Cost of funds 2.05%–3.86 % 2.05% 4.05 % Average delinquency ratio 11.60%–12.00 % 11.60% 11.60 % Average net credit loss ratio 1.00%–1.02 % 1.00% 0.96 % Weighted average life (days) 34–36 34 37 Servicing fee liability 2.00 % 2.00% 2.00 %
FOR THE YEAR ENDED DECEMBER 31 2009 2008 2007
Collections reinvested in revolving sales 19,423 18,374 18,579 Decrease in sale proceeds – (27 ) (6 )
AT DECEMBER 31 2009 2008
Inventory Work in progress 57 54 Finished goods 433 236 Provision (42) (18 )
Total inventory 448 272
2009 2008
ACCUMULATED NET BOOK ACCUMULATED NET BOOK
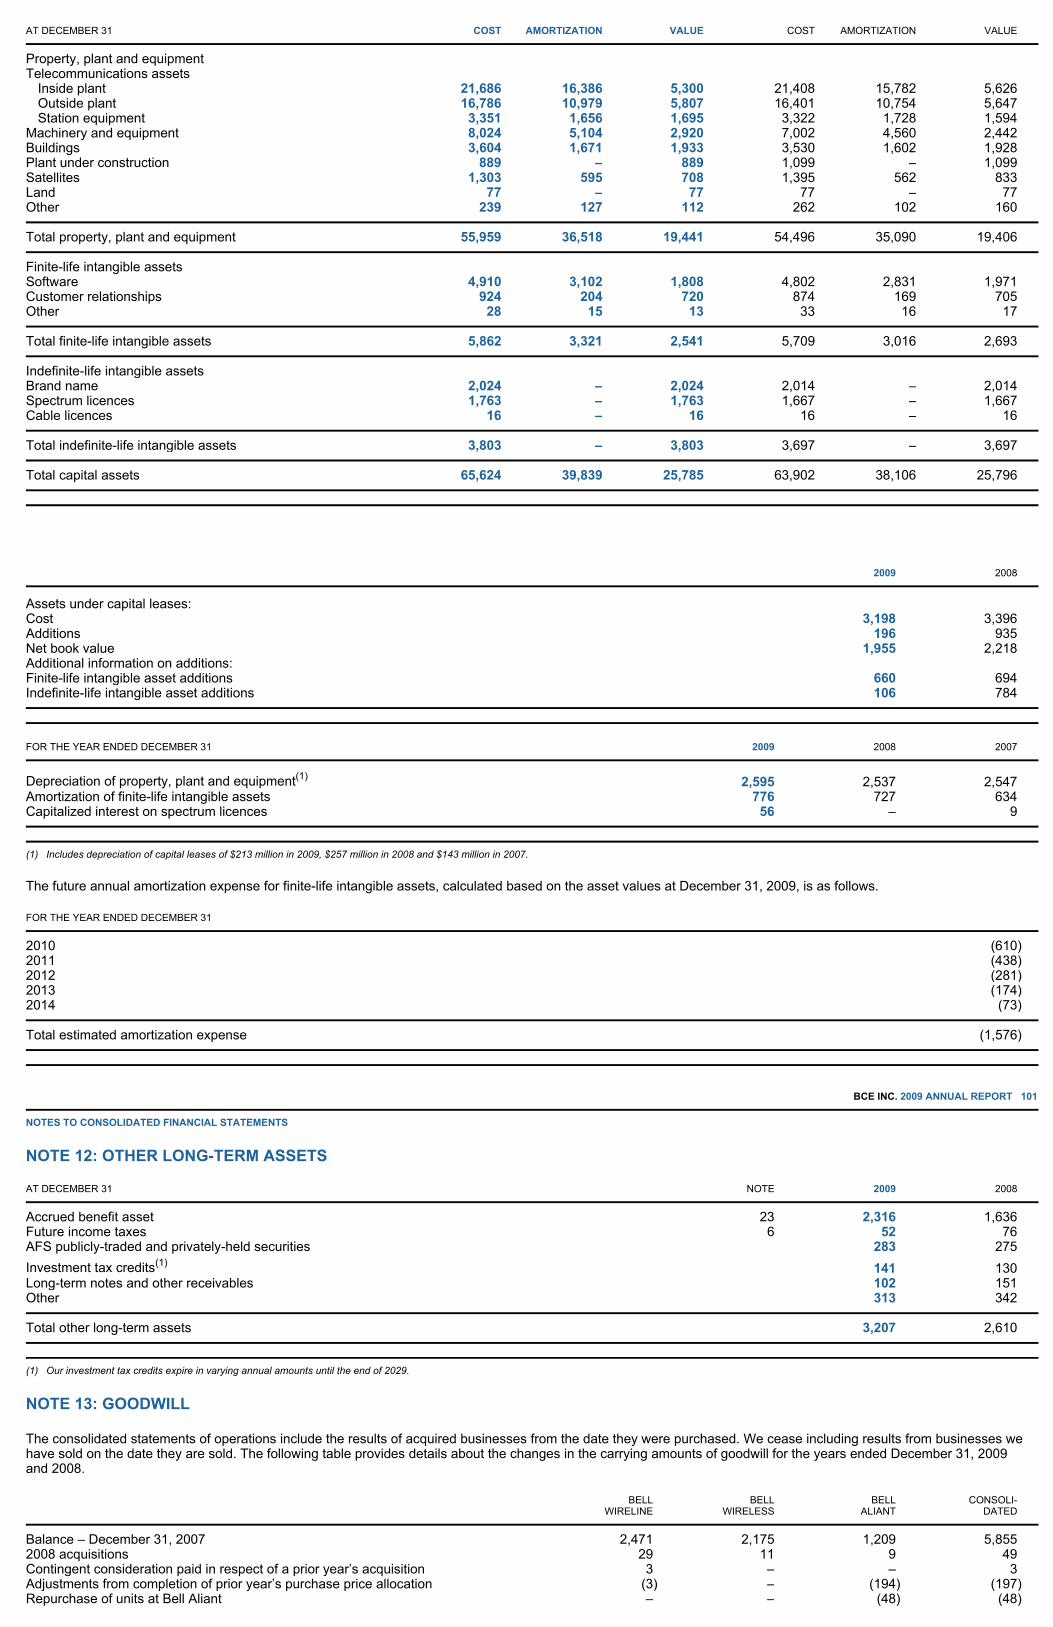
The future annual amortization expense for finite-life intangible assets, calculated based on the asset values at December 31, 2009, is as follows.
BCE INC. 2009 ANNUAL REPORT 101
NOTES TO CONSOLIDATED FINANCIAL STATEMENTS
NOTE 12: OTHER LONG-TERM ASSETS
NOTE 13: GOODWILL
The consolidated statements of operations include the results of acquired businesses from the date they were purchased. We cease including results from businesses we have sold on the date they are sold. The following table provides details about the changes in the carrying amounts of goodwill for the years ended December 31, 2009 and 2008.
AT DECEMBER 31 COST AMORTIZATION VALUE COST AMORTIZATION VALUE
Property, plant and equipment Telecommunications assets
Inside plant 21,686 16,386 5,300 21,408 15,782 5,626 Outside plant 16,786 10,979 5,807 16,401 10,754 5,647 Station equipment 3,351 1,656 1,695 3,322 1,728 1,594
Machinery and equipment 8,024 5,104 2,920 7,002 4,560 2,442 Buildings 3,604 1,671 1,933 3,530 1,602 1,928 Plant under construction 889 – 889 1,099 – 1,099 Satellites 1,303 595 708 1,395 562 833 Land 77 – 77 77 – 77 Other 239 127 112 262 102 160
Total property, plant and equipment 55,959 36,518 19,441 54,496 35,090 19,406
Finite-life intangible assets Software 4,910 3,102 1,808 4,802 2,831 1,971 Customer relationships 924 204 720 874 169 705 Other 28 15 13 33 16 17
Total finite-life intangible assets 5,862 3,321 2,541 5,709 3,016 2,693
Indefinite-life intangible assets Brand name 2,024 – 2,024 2,014 – 2,014 Spectrum licences 1,763 – 1,763 1,667 – 1,667 Cable licences 16 – 16 16 – 16
Total indefinite-life intangible assets 3,803 – 3,803 3,697 – 3,697
Total capital assets 65,624 39,839 25,785 63,902 38,106 25,796
2009 2008
Assets under capital leases: Cost 3,198 3,396 Additions 196 935 Net book value 1,955 2,218 Additional information on additions: Finite-life intangible asset additions 660 694 Indefinite-life intangible asset additions 106 784
FOR THE YEAR ENDED DECEMBER 31 2009 2008 2007
Depreciation of property, plant and equipment(1) 2,595 2,537 2,547 Amortization of finite-life intangible assets 776 727 634 Capitalized interest on spectrum licences 56 – 9
(1) Includes depreciation of capital leases of $213 million in 2009, $257 million in 2008 and $143 million in 2007.
FOR THE YEAR ENDED DECEMBER 31
2010 (610) 2011 (438) 2012 (281) 2013 (174) 2014 (73 )
Total estimated amortization expense (1,576)
AT DECEMBER 31 NOTE 2009 2008
Accrued benefit asset 23 2,316 1,636 Future income taxes 6 52 76 AFS publicly-traded and privately-held securities 283 275 Investment tax credits(1) 141 130 Long-term notes and other receivables 102 151 Other 313 342
Total other long-term assets 3,207 2,610
(1) Our investment tax credits expire in varying annual amounts until the end of 2029.
BELL
WIRELINE BELL
WIRELESS BELL
ALIANT CONSOLI-
DATED
Balance – December 31, 2007 2,471 2,175 1,209 5,855 2008 acquisitions 29 11 9 49 Contingent consideration paid in respect of a prior year’s acquisition 3 – – 3 Adjustments from completion of prior year’s purchase price allocation (3 ) – (194 ) (197) Repurchase of units at Bell Aliant – – (48 ) (48 )
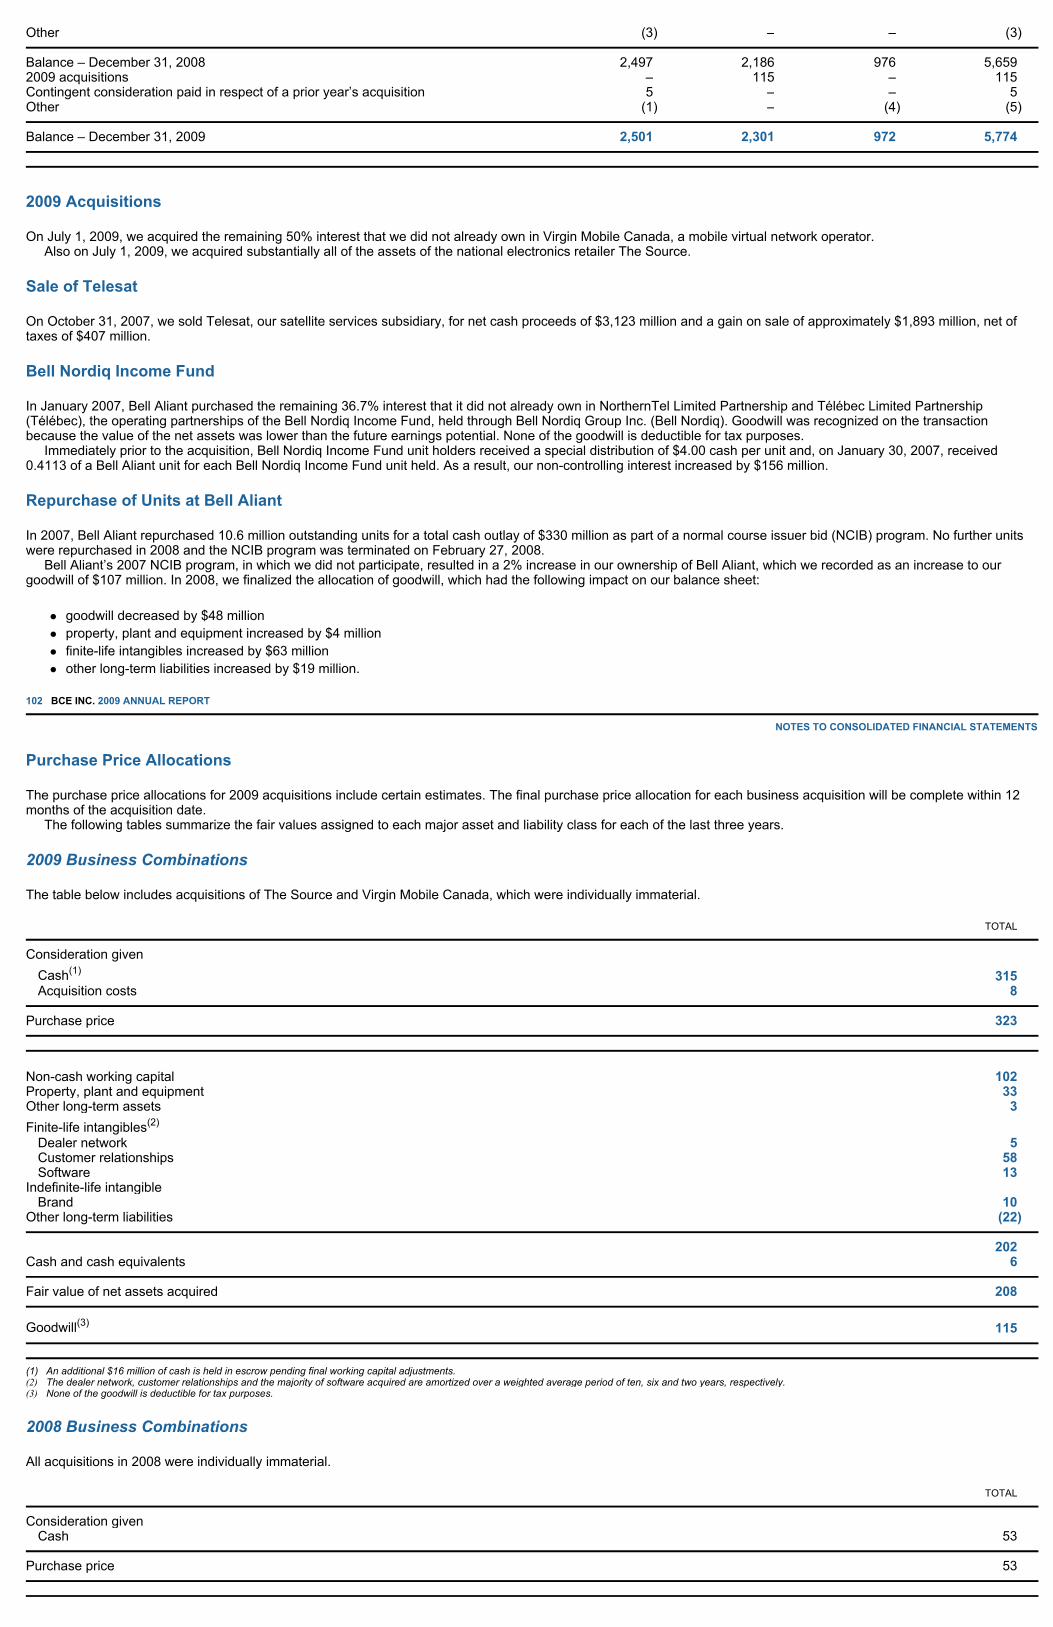
2009 Acquisitions
On July 1, 2009, we acquired the remaining 50% interest that we did not already own in Virgin Mobile Canada, a mobile virtual network operator. Also on July 1, 2009, we acquired substantially all of the assets of the national electronics retailer The Source.
Sale of Telesat
On October 31, 2007, we sold Telesat, our satellite services subsidiary, for net cash proceeds of $3,123 million and a gain on sale of approximately $1,893 million, net of taxes of $407 million.
Bell Nordiq Income Fund
In January 2007, Bell Aliant purchased the remaining 36.7% interest that it did not already own in NorthernTel Limited Partnership and Télébec Limited Partnership (Télébec), the operating partnerships of the Bell Nordiq Income Fund, held through Bell Nordiq Group Inc. (Bell Nordiq). Goodwill was recognized on the transaction because the value of the net assets was lower than the future earnings potential. None of the goodwill is deductible for tax purposes. Immediately prior to the acquisition, Bell Nordiq Income Fund unit holders received a special distribution of $4.00 cash per unit and, on January 30, 2007, received 0.4113 of a Bell Aliant unit for each Bell Nordiq Income Fund unit held. As a result, our non-controlling interest increased by $156 million.
Repurchase of Units at Bell Aliant
In 2007, Bell Aliant repurchased 10.6 million outstanding units for a total cash outlay of $330 million as part of a normal course issuer bid (NCIB) program. No further units were repurchased in 2008 and the NCIB program was terminated on February 27, 2008. Bell Aliant’s 2007 NCIB program, in which we did not participate, resulted in a 2% increase in our ownership of Bell Aliant, which we recorded as an increase to our goodwill of $107 million. In 2008, we finalized the allocation of goodwill, which had the following impact on our balance sheet:
goodwill decreased by $48 million property, plant and equipment increased by $4 million finite-life intangibles increased by $63 million other long-term liabilities increased by $19 million.
102 BCE INC. 2009 ANNUAL REPORT NOTES TO CONSOLIDATED FINANCIAL STATEMENTS
Purchase Price Allocations
The purchase price allocations for 2009 acquisitions include certain estimates. The final purchase price allocation for each business acquisition will be complete within 12 months of the acquisition date. The following tables summarize the fair values assigned to each major asset and liability class for each of the last three years.
2009 Business Combinations
The table below includes acquisitions of The Source and Virgin Mobile Canada, which were individually immaterial.
2008 Business Combinations
All acquisitions in 2008 were individually immaterial.
Other (3 ) – – (3)
Balance – December 31, 2008 2,497 2,186 976 5,659 2009 acquisitions – 115 – 115 Contingent consideration paid in respect of a prior year’s acquisition 5 – – 5 Other (1 ) – (4 ) (5 )
Balance – December 31, 2009 2,501 2,301 972 5,774
TOTAL
Consideration given Cash(1) 315 Acquisition costs 8
Purchase price 323
Non-cash working capital 102 Property, plant and equipment 33 Other long-term assets 3 Finite-life intangibles(2)
Dealer network 5 Customer relationships 58 Software 13
Indefinite-life intangible Brand 10
Other long-term liabilities (22)
202 Cash and cash equivalents 6
Fair value of net assets acquired 208
Goodwill(3) 115
(1) An additional $16 million of cash is held in escrow pending final working capital adjustments.(2) The dealer network, customer relationships and the majority of software acquired are amortized over a weighted average period of ten, six and two years, respectively.(3) None of the goodwill is deductible for tax purposes.
TOTAL
Consideration given Cash 53
Purchase price 53
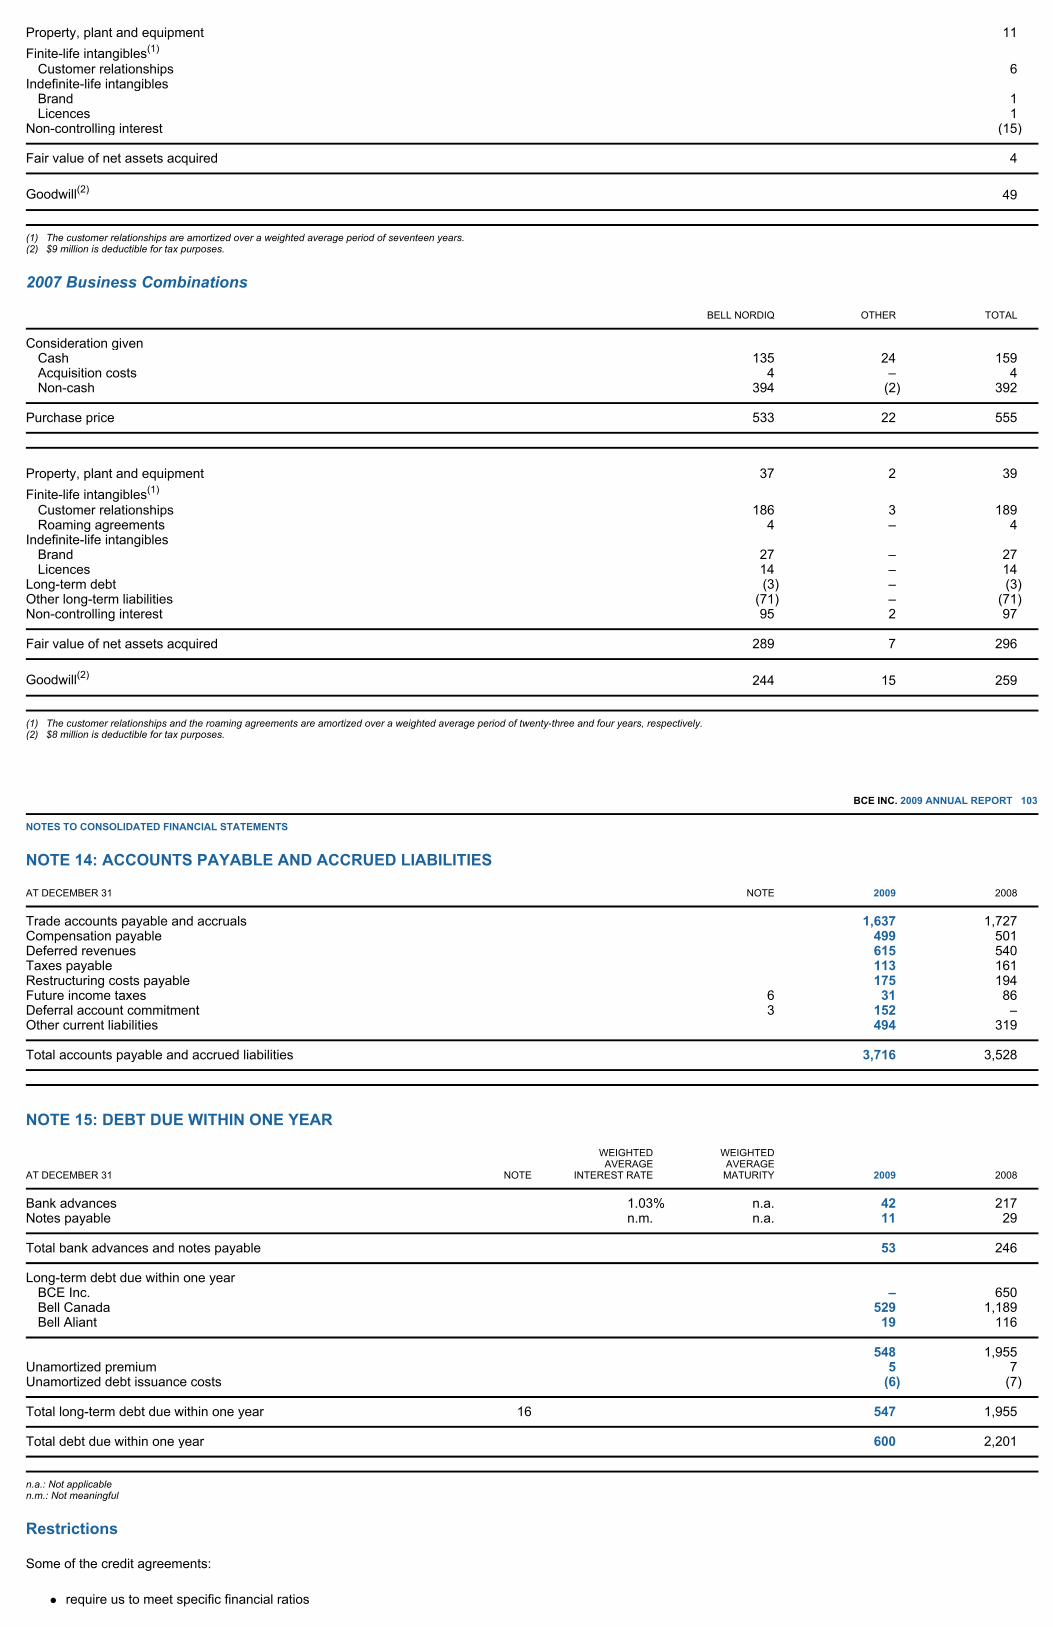
2007 Business Combinations
BCE INC. 2009 ANNUAL REPORT 103
NOTES TO CONSOLIDATED FINANCIAL STATEMENTS
NOTE 14: ACCOUNTS PAYABLE AND ACCRUED LIABILITIES
NOTE 15: DEBT DUE WITHIN ONE YEAR
n.a.: Not applicable n.m.: Not meaningful
Restrictions
Some of the credit agreements:
require us to meet specific financial ratios
Property, plant and equipment 11 Finite-life intangibles(1)
Customer relationships 6 Indefinite-life intangibles
Brand 1 Licences 1
Non-controlling interest (15 )
Fair value of net assets acquired 4
Goodwill(2) 49
(1) The customer relationships are amortized over a weighted average period of seventeen years.(2) $9 million is deductible for tax purposes.
BELL NORDIQ OTHER TOTAL
Consideration given Cash 135 24 159 Acquisition costs 4 – 4 Non-cash 394 (2 ) 392
Purchase price 533 22 555
Property, plant and equipment 37 2 39 Finite-life intangibles(1)
Customer relationships 186 3 189 Roaming agreements 4 – 4
Indefinite-life intangibles Brand 27 – 27 Licences 14 – 14
Long-term debt (3 ) – (3) Other long-term liabilities (71 ) – (71 ) Non-controlling interest 95 2 97
Fair value of net assets acquired 289 7 296
Goodwill(2) 244 15 259
(1) The customer relationships and the roaming agreements are amortized over a weighted average period of twenty-three and four years, respectively.(2) $8 million is deductible for tax purposes.
AT DECEMBER 31 NOTE 2009 2008
Trade accounts payable and accruals 1,637 1,727 Compensation payable 499 501 Deferred revenues 615 540 Taxes payable 113 161 Restructuring costs payable 175 194 Future income taxes 6 31 86 Deferral account commitment 3 152 – Other current liabilities 494 319
Total accounts payable and accrued liabilities 3,716 3,528
AT DECEMBER 31 NOTE
WEIGHTEDAVERAGE
INTEREST RATE
WEIGHTEDAVERAGEMATURITY 2009 2008
Bank advances 1.03 % n.a. 42 217 Notes payable n.m. n.a. 11 29
Total bank advances and notes payable 53 246
Long-term debt due within one year BCE Inc. – 650 Bell Canada 529 1,189 Bell Aliant 19 116
548 1,955 Unamortized premium 5 7 Unamortized debt issuance costs (6) (7 )
Total long-term debt due within one year 16 547 1,955
Total debt due within one year 600 2,201

require us to offer to repay and cancel the credit agreement upon a change of control of BCE Inc. or Bell Canada.
We are in compliance with all conditions and restrictions.
Credit Facilities
Bell Canada and Bell Aliant may issue notes under their commercial paper programs up to the net available amount of their supporting committed revolving bank credit facilities. The total amount of these supporting committed revolving bank credit facilities may be drawn at any time. Bell Canada and Bell Aliant had no commercial paper outstanding at December 31, 2009.
The table below is a summary of our total bank credit facilities at December 31, 2009.
104 BCE INC. 2009 ANNUAL REPORT
NOTES TO CONSOLIDATED FINANCIAL STATEMENTS
NOTE 16: LONG-TERM DEBT
Restrictions
Some of the debt agreements:
require us to meet specific financial ratios impose covenants, maintenance tests and new issue tests require us to make an offer to repurchase certain series of debentures upon the occurrence of a change of control triggering event as defined in the relevant debt agreements.
We are in compliance with all conditions and restrictions.
(a) BCE Inc.
On June 8, 2009, BCE Inc. redeemed early its 7.35% Series C Notes, which were due on October 30, 2009. We incurred a $16 million charge for the premium costs on early redemption which is included in Other (expense) income.
(b) Bell Canada
All outstanding debentures are issued under trust indentures and are unsecured. They include US$200 million maturing in 2010, which has been swapped into Canadian dollars. All debentures are issued in series and certain series are redeemable at Bell Canada’s option prior to maturity at the prices, times and conditions specified in each series. On July 30, 2009, Bell Canada redeemed early its 5.5% Series M-16 debentures, issued under its 1997 trust indenture, having an outstanding principal amount of $600 million, which were due on August 12, 2010. We incurred a $29 million charge for the premium costs on early redemption, which is included in Other (expense)
TOTAL
AVAILABLE DRAWN
ISSUED ANDUNDRAWN
LETTERS OFCREDIT
NETAVAILABLE
Committed credit facilities Bell Canada(1) –
Revolving facility (including supporting commercial paper program) 1,400 – 268 1,132 Bell Aliant(1) –
Revolving facility (including supporting commercial paper program) 550 – 27 523 Other 558 40 241 277
Total committed credit facilities 2,508 40 536 1,932
Non-committed credit facilities Bell Canada 225 2 89 134 Bell Aliant 14 – 1 13
Total non-committed credit facilities 239 2 90 147
Total committed and non-committed credit facilities 2,747 42 626 2,079
(1) Bell Canada’s current $1,400 million supporting committed revolving bank credit facility expires in May 2012 and Bell Aliant’s current $550 million supporting committed revolving bank credit facility expires in July 2011.
AT DECEMBER 31 NOTE
WEIGHTEDAVERAGE
INTEREST RATE MATURITY 2009 2008
BCE Inc.(a) – 650
Bell Canada(b) Debentures
1997 trust indenture 5.91 % 2011–2035 4,100 4,400 1976 trust indenture 9.73 % 2010–2054 1,584 1,770
Subordinated debentures 8.21 % 2026–2031 275 275 Capital leases 7.91 % 2010–2047 1,929 2,129 Other 157 230
Total – Bell Canada 8,045 8,804
Bell Aliant(c) Non-revolving term facility Floating 2009 – 100 Debentures, notes and bonds 5.41 % 2011–2037 2,740 2,395 Other 45 81
Total – Bell Aliant 2,785 2,576
Total debt 10,830 12,030 Unamortized premium 57 66 Unamortized debt issuance costs (41) (42 ) Less: Amount due within one year 15, 19 (547) (1,955)
Total long-term debt 19 10,299 10,099

income. On June 29, 2009, Bell Canada issued 4.85% Series M-20 debentures under its 1997 trust indenture for a principal amount of $1 billion, which mature on June 30, 2014.
(c) Bell Aliant
All outstanding debentures, notes and bonds are issued under trust indentures and are unsecured with the exception of Télébec’s debentures of $100 million, which are secured by a mortgage on a property located in the province of Québec. At December 31, 2009, the carrying value of this property was $12 million. All debentures, notes and bonds are issued in series and certain series are redeemable at Bell Aliant’s option prior to maturity at the prices, times and conditions specified in each series. On May 12, 2009, Bell Aliant Regional Communications, Limited Partnership issued 6.29% medium-term notes with a principal amount of $350 million which mature on February 17, 2015.
BCE INC. 2009 ANNUAL REPORT 105
NOTES TO CONSOLIDATED FINANCIAL STATEMENTS
NOTE 17: OTHER LONG-TERM LIABILITIES
NOTE 18: NON-CONTROLLING INTEREST
NOTE 19: FINANCIAL AND CAPITAL MANAGEMENT
Financial Management
Management’s objectives are to protect BCE Inc. and its subsidiaries on a consolidated basis against material economic exposures and variability of results against various financial risks that include credit risk, liquidity risk, interest rate risk, foreign currency risk and equity price risk. To minimize our exposure, we enter into derivative financial instruments to manage our risk as it relates to interest rate risk, foreign currency risk and equity price risk. We do not use derivative instruments for speculative purposes.
Derivatives
We use derivative instruments to manage our exposure to foreign currency risk, interest rate risk and changes in the price of BCE Inc. common shares that may be issued under our compensation plans (SCPs, DSUs and RSUs). We do not use derivative instruments for speculative purposes, and so we are not exposed to any significant liquidity risks relating to them. The following derivative instruments were outstanding at December 31, 2009:
cross-currency swaps and foreign currency forward contracts that hedge foreign currency risk on a portion of our long-term debt foreign currency forward contracts that hedge certain purchase commitments interest rate swaps that hedge interest rate risk on a portion of our long-term debt forward contracts on BCE Inc. common shares that hedge the fair-value exposure related to DSUs and RSUs.
At December 31, 2009, the amount of hedge ineffectiveness recorded in Other (expense) income in the statement of operations was not material.
Credit Risk
We are exposed to credit risk from operating activities and certain financing activities, the maximum exposure of which is represented by the carrying amounts reported on the balance sheet. We are exposed to credit risk if counterparties to our accounts receivable and derivative instruments are unable to meet their obligations. The concentration of credit risk from our customers is minimized because we have a large and diverse customer base. We regularly monitor our credit risk and credit exposure. There was minimal credit risk relating to derivative instruments at December 31, 2009. We deal with institutions that have strong credit ratings and as such we expect that they will be able to meet their obligations. The following table provides the change in allowance for doubtful accounts for trade accounts receivable.
For many of our customers, accounts receivable are written off directly to bad debt expense if the account has not been collected after a predetermined period of time.
106 BCE INC. 2009 ANNUAL REPORT NOTES TO CONSOLIDATED FINANCIAL STATEMENTS
The following table provides further details on trade accounts receivable past due but not provisioned.
AT DECEMBER 31 NOTE 2009 2008
Future income taxes 6 1,986 1,908 Accrued benefit liability 23 2,016 2,090 Deferral account commitment 3 273 273 Deferred revenue on long-term contracts 154 178 Deferred contract payments 46 89 Restructuring costs payable 82 77 Other 385 331
Total other long-term liabilities 4,942 4,946
AT DECEMBER 31 2009 2008
Non-controlling interest in subsidiaries Bell Aliant 1,030 1,061 Other 19 19
Total non-controlling interest 1,049 1,080
Balance at December 31, 2008 (131) Additions (37 ) Use 63
Balance at December 31, 2009 (105)
AT DECEMBER 31 2009 2008
Trade accounts receivable not past due 835 935 Trade accounts receivable past due and not provisioned
Under 60 days 91 105 60 to 120 days 108 138 Over 120 days 106 85
Trade accounts receivable, net of allowance for doubtful accounts 1,140 1,263
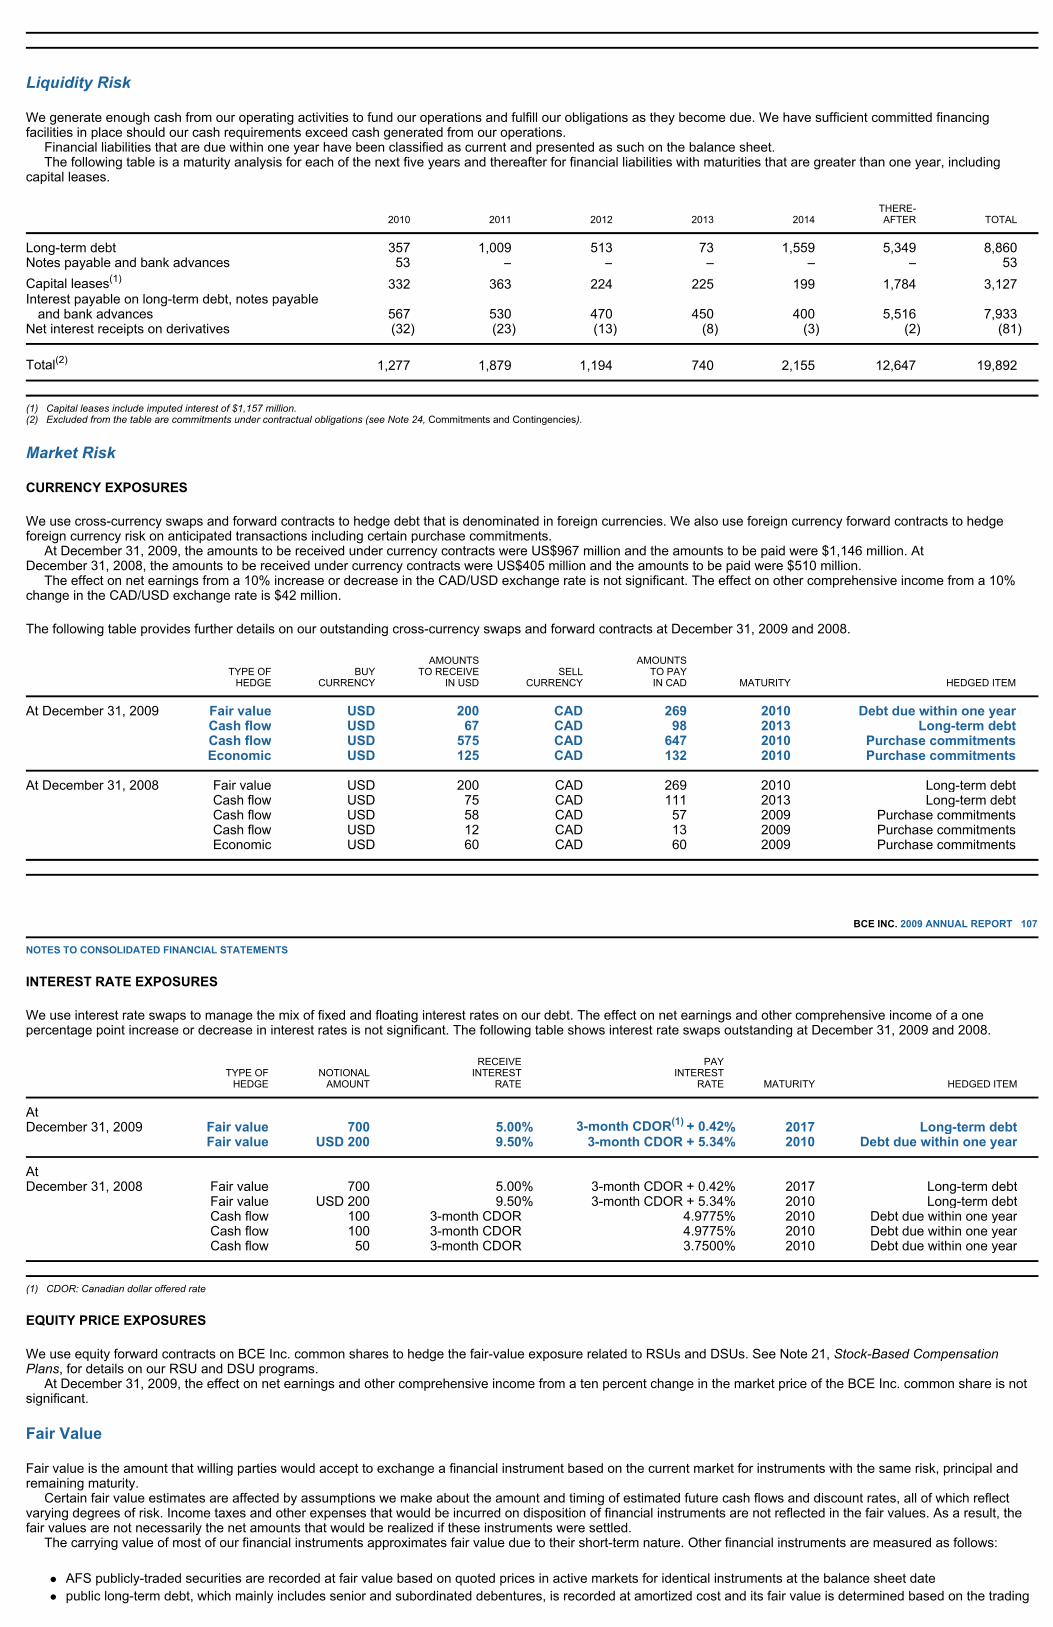
Liquidity Risk
We generate enough cash from our operating activities to fund our operations and fulfill our obligations as they become due. We have sufficient committed financing facilities in place should our cash requirements exceed cash generated from our operations. Financial liabilities that are due within one year have been classified as current and presented as such on the balance sheet. The following table is a maturity analysis for each of the next five years and thereafter for financial liabilities with maturities that are greater than one year, including capital leases.
Market Risk
CURRENCY EXPOSURES
We use cross-currency swaps and forward contracts to hedge debt that is denominated in foreign currencies. We also use foreign currency forward contracts to hedge foreign currency risk on anticipated transactions including certain purchase commitments. At December 31, 2009, the amounts to be received under currency contracts were US$967 million and the amounts to be paid were $1,146 million. At December 31, 2008, the amounts to be received under currency contracts were US$405 million and the amounts to be paid were $510 million. The effect on net earnings from a 10% increase or decrease in the CAD/USD exchange rate is not significant. The effect on other comprehensive income from a 10% change in the CAD/USD exchange rate is $42 million.
The following table provides further details on our outstanding cross-currency swaps and forward contracts at December 31, 2009 and 2008.
BCE INC. 2009 ANNUAL REPORT 107
NOTES TO CONSOLIDATED FINANCIAL STATEMENTS
INTEREST RATE EXPOSURES
We use interest rate swaps to manage the mix of fixed and floating interest rates on our debt. The effect on net earnings and other comprehensive income of a one percentage point increase or decrease in interest rates is not significant. The following table shows interest rate swaps outstanding at December 31, 2009 and 2008.
EQUITY PRICE EXPOSURES
We use equity forward contracts on BCE Inc. common shares to hedge the fair-value exposure related to RSUs and DSUs. See Note 21, Stock-Based Compensation Plans, for details on our RSU and DSU programs. At December 31, 2009, the effect on net earnings and other comprehensive income from a ten percent change in the market price of the BCE Inc. common share is not significant.
Fair Value
Fair value is the amount that willing parties would accept to exchange a financial instrument based on the current market for instruments with the same risk, principal and remaining maturity. Certain fair value estimates are affected by assumptions we make about the amount and timing of estimated future cash flows and discount rates, all of which reflect varying degrees of risk. Income taxes and other expenses that would be incurred on disposition of financial instruments are not reflected in the fair values. As a result, the fair values are not necessarily the net amounts that would be realized if these instruments were settled. The carrying value of most of our financial instruments approximates fair value due to their short-term nature. Other financial instruments are measured as follows:
AFS publicly-traded securities are recorded at fair value based on quoted prices in active markets for identical instruments at the balance sheet date public long-term debt, which mainly includes senior and subordinated debentures, is recorded at amortized cost and its fair value is determined based on the trading
2010 2011 2012 2013 2014 THERE-AFTER TOTAL
Long-term debt 357 1,009 513 73 1,559 5,349 8,860 Notes payable and bank advances 53 – – – – – 53 Capital leases(1) 332 363 224 225 199 1,784 3,127 Interest payable on long-term debt, notes payable
and bank advances 567 530 470 450 400 5,516 7,933 Net interest receipts on derivatives (32) (23 ) (13 ) (8 ) (3 ) (2 ) (81 )
Total(2) 1,277 1,879 1,194 740 2,155 12,647 19,892
(1) Capital leases include imputed interest of $1,157 million. (2) Excluded from the table are commitments under contractual obligations (see Note 24, Commitments and Contingencies).
TYPE OFHEDGE BUY
CURRENCY
AMOUNTSTO RECEIVE
IN USD SELL
CURRENCY
AMOUNTSTO PAYIN CAD MATURITY HEDGED ITEM
At December 31, 2009 Fair value USD 200 CAD 269 2010 Debt due within one year Cash flow USD 67 CAD 98 2013 Long-term debt Cash flow USD 575 CAD 647 2010 Purchase commitments Economic USD 125 CAD 132 2010 Purchase commitments
At December 31, 2008 Fair value USD 200 CAD 269 2010 Long-term debt Cash flow USD 75 CAD 111 2013 Long-term debt Cash flow USD 58 CAD 57 2009 Purchase commitments Cash flow USD 12 CAD 13 2009 Purchase commitments Economic USD 60 CAD 60 2009 Purchase commitments
TYPE OFHEDGE NOTIONAL
AMOUNT
RECEIVEINTEREST
RATE
PAYINTEREST
RATE MATURITY HEDGED ITEM
At December 31, 2009 Fair value 700 5.00% 3-month CDOR(1) + 0.42% 2017 Long-term debt Fair value USD 200 9.50% 3-month CDOR + 5.34% 2010 Debt due within one year
At December 31, 2008 Fair value 700 5.00 % 3-month CDOR + 0.42 % 2017 Long-term debt Fair value USD 200 9.50 % 3-month CDOR + 5.34 % 2010 Long-term debt Cash flow 100 3-month CDOR 4.9775 % 2010 Debt due within one year Cash flow 100 3-month CDOR 4.9775 % 2010 Debt due within one year Cash flow 50 3-month CDOR 3.7500 % 2010 Debt due within one year
(1) CDOR: Canadian dollar offered rate
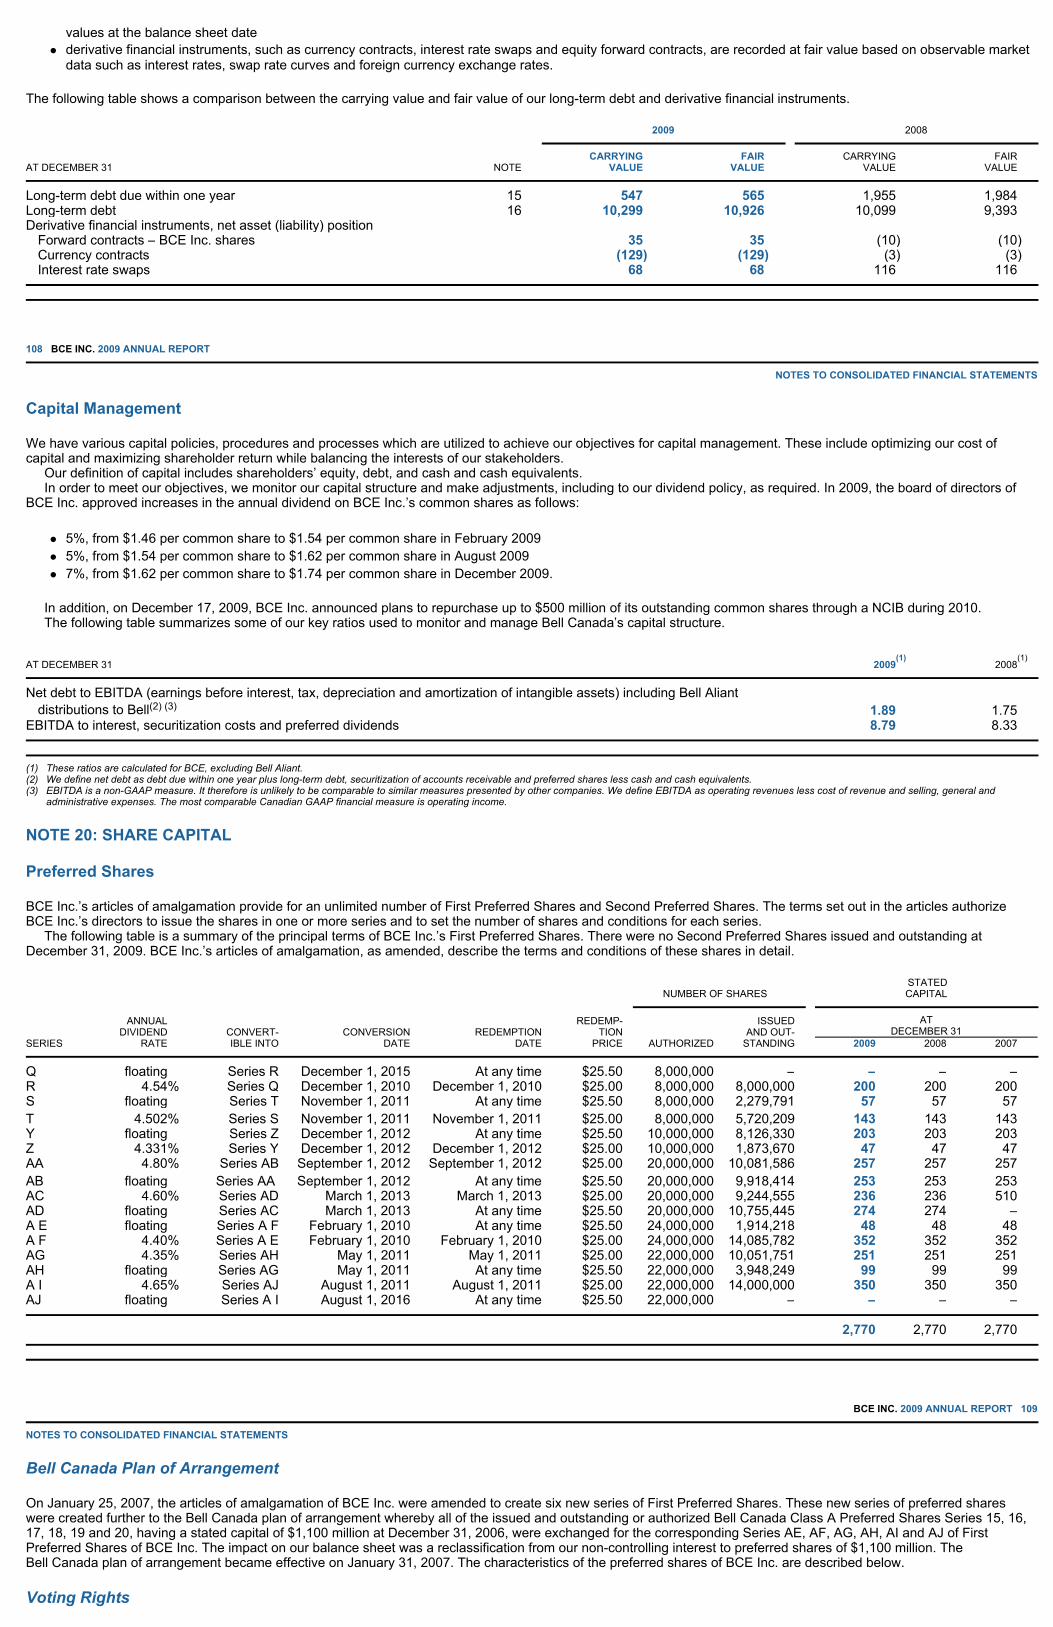
values at the balance sheet date derivative financial instruments, such as currency contracts, interest rate swaps and equity forward contracts, are recorded at fair value based on observable market data such as interest rates, swap rate curves and foreign currency exchange rates.
The following table shows a comparison between the carrying value and fair value of our long-term debt and derivative financial instruments.
108 BCE INC. 2009 ANNUAL REPORT NOTES TO CONSOLIDATED FINANCIAL STATEMENTS
Capital Management
We have various capital policies, procedures and processes which are utilized to achieve our objectives for capital management. These include optimizing our cost of capital and maximizing shareholder return while balancing the interests of our stakeholders. Our definition of capital includes shareholders’ equity, debt, and cash and cash equivalents. In order to meet our objectives, we monitor our capital structure and make adjustments, including to our dividend policy, as required. In 2009, the board of directors of BCE Inc. approved increases in the annual dividend on BCE Inc.’s common shares as follows:
5%, from $1.46 per common share to $1.54 per common share in February 2009 5%, from $1.54 per common share to $1.62 per common share in August 2009 7%, from $1.62 per common share to $1.74 per common share in December 2009.
In addition, on December 17, 2009, BCE Inc. announced plans to repurchase up to $500 million of its outstanding common shares through a NCIB during 2010. The following table summarizes some of our key ratios used to monitor and manage Bell Canada’s capital structure.
NOTE 20: SHARE CAPITAL
Preferred Shares
BCE Inc.’s articles of amalgamation provide for an unlimited number of First Preferred Shares and Second Preferred Shares. The terms set out in the articles authorize BCE Inc.’s directors to issue the shares in one or more series and to set the number of shares and conditions for each series. The following table is a summary of the principal terms of BCE Inc.’s First Preferred Shares. There were no Second Preferred Shares issued and outstanding at December 31, 2009. BCE Inc.’s articles of amalgamation, as amended, describe the terms and conditions of these shares in detail.
BCE INC. 2009 ANNUAL REPORT 109
NOTES TO CONSOLIDATED FINANCIAL STATEMENTS
Bell Canada Plan of Arrangement
On January 25, 2007, the articles of amalgamation of BCE Inc. were amended to create six new series of First Preferred Shares. These new series of preferred shares were created further to the Bell Canada plan of arrangement whereby all of the issued and outstanding or authorized Bell Canada Class A Preferred Shares Series 15, 16, 17, 18, 19 and 20, having a stated capital of $1,100 million at December 31, 2006, were exchanged for the corresponding Series AE, AF, AG, AH, AI and AJ of First Preferred Shares of BCE Inc. The impact on our balance sheet was a reclassification from our non-controlling interest to preferred shares of $1,100 million. The Bell Canada plan of arrangement became effective on January 31, 2007. The characteristics of the preferred shares of BCE Inc. are described below.
Voting Rights
AT DECEMBER 31 NOTE
2009 2008
CARRYINGVALUE FAIR
VALUE CARRYING
VALUE FAIR
VALUE
Long-term debt due within one year 15 547 565 1,955 1,984 Long-term debt 16 10,299 10,926 10,099 9,393 Derivative financial instruments, net asset (liability) position
Forward contracts – BCE Inc. shares 35 35 (10 ) (10 ) Currency contracts (129) (129) (3 ) (3 ) Interest rate swaps 68 68 116 116
AT DECEMBER 31 2009(1) 2008
(1)
Net debt to EBITDA (earnings before interest, tax, depreciation and amortization of intangible assets) including Bell Aliant distributions to Bell(2) (3) 1.89 1.75
EBITDA to interest, securitization costs and preferred dividends 8.79 8.33
(1) These ratios are calculated for BCE, excluding Bell Aliant. (2) We define net debt as debt due within one year plus long-term debt, securitization of accounts receivable and preferred shares less cash and cash equivalents.(3) EBITDA is a non-GAAP measure. It therefore is unlikely to be comparable to similar measures presented by other companies. We define EBITDA as operating revenues less cost of revenue and selling, general and
administrative expenses. The most comparable Canadian GAAP financial measure is operating income.
SERIES ANNUAL
DIVIDEND RATE CONVERT-
IBLE INTO CONVERSIONDATE
REDEMPTIONDATE
REDEMP-TION
PRICE
NUMBER OF SHARES STATED CAPITAL
AUTHORIZED
ISSUEDAND OUT-
STANDING
AT DECEMBER 31
2009 2008 2007
Q floating Series R December 1, 2015 At any time $25.50 8,000,000 – – – – R 4.54 % Series Q December 1, 2010 December 1, 2010 $25.00 8,000,000 8,000,000 200 200 200 S floating Series T November 1, 2011 At any time $25.50 8,000,000 2,279,791 57 57 57 T 4.502% Series S November 1, 2011 November 1, 2011 $25.00 8,000,000 5,720,209 143 143 143 Y floating Series Z December 1, 2012 At any time $25.50 10,000,000 8,126,330 203 203 203 Z 4.331 % Series Y December 1, 2012 December 1, 2012 $25.00 10,000,000 1,873,670 47 47 47 AA 4.80 % Series AB September 1, 2012 September 1, 2012 $25.00 20,000,000 10,081,586 257 257 257 AB floating Series AA September 1, 2012 At any time $25.50 20,000,000 9,918,414 253 253 253 AC 4.60 % Series AD March 1, 2013 March 1, 2013 $25.00 20,000,000 9,244,555 236 236 510 AD floating Series AC March 1, 2013 At any time $25.50 20,000,000 10,755,445 274 274 – A E floating Series A F February 1, 2010 At any time $25.50 24,000,000 1,914,218 48 48 48 A F 4.40 % Series A E February 1, 2010 February 1, 2010 $25.00 24,000,000 14,085,782 352 352 352 AG 4.35 % Series AH May 1, 2011 May 1, 2011 $25.00 22,000,000 10,051,751 251 251 251 AH floating Series AG May 1, 2011 At any time $25.50 22,000,000 3,948,249 99 99 99 A I 4.65 % Series AJ August 1, 2011 August 1, 2011 $25.00 22,000,000 14,000,000 350 350 350 AJ floating Series A I August 1, 2016 At any time $25.50 22,000,000 – – – –
2,770 2,770 2,770

All of the issued and outstanding preferred shares at December 31, 2009 are non-voting, except under special circumstances, when the holders are entitled to one vote per share.
Entitlement to Dividends
Holders of Series R, T, Z, AA, AC, AF, AG and AI shares are entitled to fixed cumulative quarterly dividends. The dividend rate on these shares is reset every five years, as set out in BCE Inc.’s articles of amalgamation, as amended. Holders of Series S, Y, AB, AD, AE and AH shares are entitled to floating adjustable cumulative monthly dividends. The floating dividend rate on these shares is calculated every month, as set out in BCE Inc.’s articles of amalgamation, as amended. If Series Q and AJ shares are issued, their holders will be entitled to floating adjustable cumulative monthly dividends.
Conversion Features
All of the issued and outstanding preferred shares at December 31, 2009 are convertible at the holder’s option into another associated series of preferred shares on a one-for-one basis according to the terms set out in BCE Inc.’s articles of amalgamation, as amended. If Series Q and AJ shares are issued, their holders will be entitled to convert them on December 1, 2015 and August 1, 2016, respectively.
Redemption Features
BCE Inc. may redeem each of Series R, T, Z, AA, AC, AF, AG and AI shares at $25.00 per share on the applicable redemption date and every five years after that date. BCE Inc. may redeem Series S, Y, AB, AD, AE and AH shares at any time at $25.50 per share. If Series Q and AJ shares are issued, BCE Inc. may redeem them at any time at $25.50 per share.
Conversion of Preferred Shares
On February 1, 2010, 592,772 of BCE Inc.’s 14,085,782 Cumulative Redeemable First Preferred Shares, Series AF (Series AF Preferred Shares) were converted, on a one-for-one basis, into Cumulative Redeemable First Preferred Shares, Series AE (Series AE Preferred Shares). In addition, on February 1, 2010, 1,084,090 of BCE Inc.’s 1,914,218 Series AE Preferred Shares were converted, on a one-for-one basis, into series AF Preferred Shares. The balance of the Series AE and Series AF Preferred Shares that have not been converted remains outstanding. The Series AE Preferred Shares will continue to pay a monthly floating adjustable cash dividend. For the five-year period beginning on February 1, 2010, the Series AF Preferred Shares will pay a quarterly fixed dividend based on the annual dividend rate of 4.541%. Dividends will be paid as and when declared by the board of directors of BCE Inc. On March 1, 2008, 10,755,445 of BCE Inc.’s 20,000,000 Cumulative Redeemable First Preferred Shares, Series AC (Series AC Preferred Shares) were converted, on a one-for-one basis, into Cumulative Redeemable First Preferred Shares, Series AD (Series AD Preferred Shares). The balance of the Series AC Preferred Shares that has not been converted remains outstanding. On December 1, 2007, 6,991,775 of BCE Inc.’s 8,852,620 Cumulative Redeemable First Preferred Shares, Series Z (Series Z Preferred Shares) were converted, on a one-for-one basis, into Cumulative Redeemable First Preferred Shares, Series Y (Series Y Preferred Shares). In addition, 12,825 of its 1,147,380 Series Y Preferred Shareswere converted, on a one-for-one basis, into Series Z Preferred Shares. The balance of the Series Y and Series Z Preferred Shares that have not been converted remains outstanding. On September 1, 2007, 9,918,414 of BCE Inc.’s 20,000,000 Cumulative Redeemable First Preferred Shares, Series AA (Series AA Preferred Shares) were converted, on a one-for-one basis, into Cumulative Redeemable First Preferred Shares, Series AB (Series AB Preferred Shares). The balance of the Series AA Preferred Shares that has not been converted remains outstanding.
Common Shares and Class B Shares
BCE Inc.’s articles of amalgamation provide for an unlimited number of voting common shares and non-voting Class B shares. The common shares and the Class B shares rank equally in the payment of dividends and in the distribution of assets if BCE Inc. is liquidated, dissolved or wound up, after payments due to the holders of preferred shares.
110 BCE INC. 2009 ANNUAL REPORT
NOTES TO CONSOLIDATED FINANCIAL STATEMENTS
The following table provides details about the outstanding common shares of BCE Inc. No Class B shares were outstanding at December 31, 2009, 2008 or 2007.
NCIB
2010 NCIB program
On December 17, 2009, BCE Inc. announced its plan to repurchase up to $500 million of its outstanding common shares through a NCIB to be executed over the course of 2010. On the same date, the Toronto Stock Exchange approved the 2010 NCIB program.
2008/2009 NCIB program
On December 12, 2008, BCE Inc. announced its plan to repurchase up to 5% of its outstanding common shares through a NCIB. On December 19, 2008, the Toronto Stock Exchange approved the 2008 NCIB program. In 2008, BCE Inc. repurchased a total of 7.5 million common shares, of which 4 million were cancelled, for a total cost of $92 million. Of the total cost, $67 million represents stated capital and $5 million represents the reduction of the contributed surplus attributable to these common shares. The remaining $20 million was charged to the deficit. In 2009, BCE Inc. repurchased a total of 32.5 million common shares and cancelled 36 million common shares for a total cost of $894 million. Of the total cost,
2009 2008 2007 NUMBER STATED NUMBER STATED NUMBER STATED NOTE OF SHARES CAPITAL OF SHARES CAPITAL OF SHARES CAPITAL
Outstanding, beginning of year 803,056,958 13,525 805,264,816 13,536 807,643,941 13,487
Shares issued under employee stock option plan(1) 21 130,471 2 1,785,142 56 4,994,073 172
Shares repurchased and cancelled (36,007,000) (606) (3,993,000) (67 ) (7,373,198 ) (123)
Outstanding, end of year 767,180,429 12,921 803,056,958 13,525 805,264,816 13,536
(1) Includes a nil reclassification in 2009 ($6 million in 2008 and $19 million in 2007) from contributed surplus relating to the exercise of employees’ stock options. The cash inflows in respect of the employee stock option plan were $2 million in 2009, $50 million in 2008 and $153 million in 2007.
2008/2009 NCIB 2007 NCIB 2009 2008 TOTAL 2007 NUMBER TOTAL NUMBER TOTAL NUMBER TOTAL NUMBER TOTAL AT DECEMBER 31 OF SHARES COST OF SHARES COST OF SHARES COST OF SHARES COST
Shares repurchased (millions) 32.5 808.0 7.5 178.0 40.0 986.0 7.4 227.0
Shares cancelled (36.0) (894.0) (4.0 ) (92.0 ) (40.0 ) (986.0) (7.4 ) (227.0)
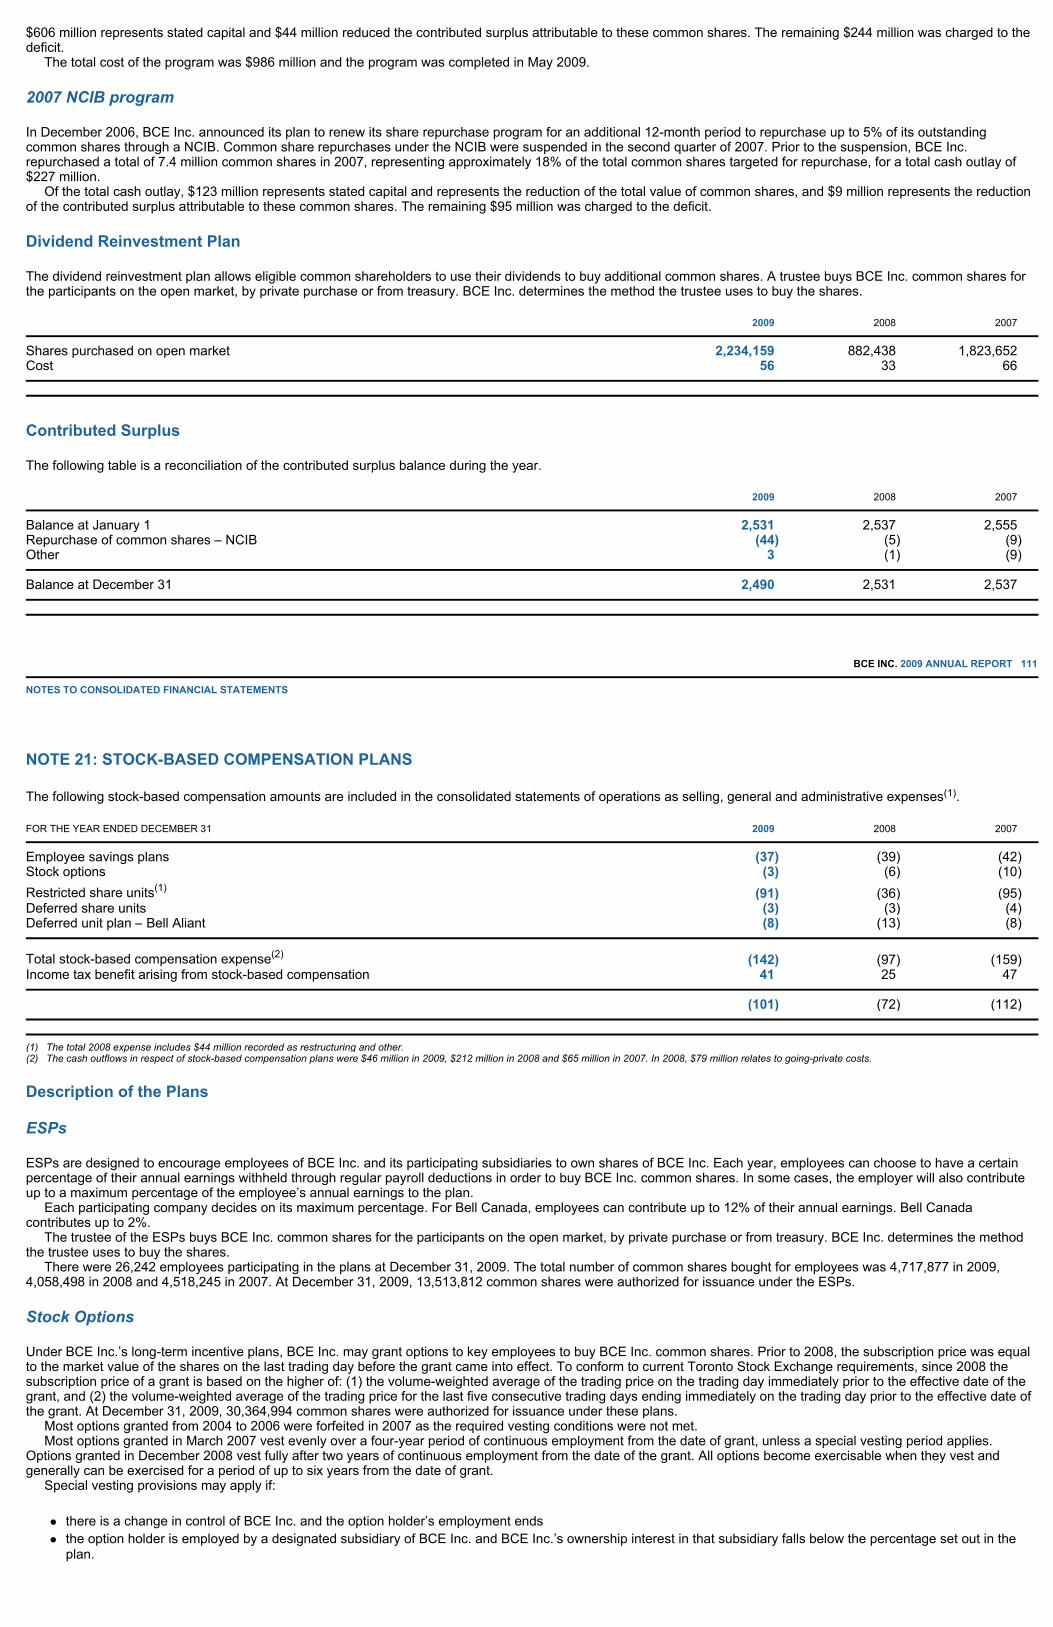
$606 million represents stated capital and $44 million reduced the contributed surplus attributable to these common shares. The remaining $244 million was charged to the deficit. The total cost of the program was $986 million and the program was completed in May 2009.
2007 NCIB program
In December 2006, BCE Inc. announced its plan to renew its share repurchase program for an additional 12-month period to repurchase up to 5% of its outstanding common shares through a NCIB. Common share repurchases under the NCIB were suspended in the second quarter of 2007. Prior to the suspension, BCE Inc. repurchased a total of 7.4 million common shares in 2007, representing approximately 18% of the total common shares targeted for repurchase, for a total cash outlay of $227 million. Of the total cash outlay, $123 million represents stated capital and represents the reduction of the total value of common shares, and $9 million represents the reduction of the contributed surplus attributable to these common shares. The remaining $95 million was charged to the deficit.
Dividend Reinvestment Plan
The dividend reinvestment plan allows eligible common shareholders to use their dividends to buy additional common shares. A trustee buys BCE Inc. common shares for the participants on the open market, by private purchase or from treasury. BCE Inc. determines the method the trustee uses to buy the shares.
Contributed Surplus
The following table is a reconciliation of the contributed surplus balance during the year.
BCE INC. 2009 ANNUAL REPORT 111
NOTES TO CONSOLIDATED FINANCIAL STATEMENTS
NOTE 21: STOCK-BASED COMPENSATION PLANS
The following stock-based compensation amounts are included in the consolidated statements of operations as selling, general and administrative expenses(1).
Description of the Plans
ESPs
ESPs are designed to encourage employees of BCE Inc. and its participating subsidiaries to own shares of BCE Inc. Each year, employees can choose to have a certain percentage of their annual earnings withheld through regular payroll deductions in order to buy BCE Inc. common shares. In some cases, the employer will also contribute up to a maximum percentage of the employee’s annual earnings to the plan. Each participating company decides on its maximum percentage. For Bell Canada, employees can contribute up to 12% of their annual earnings. Bell Canada contributes up to 2%. The trustee of the ESPs buys BCE Inc. common shares for the participants on the open market, by private purchase or from treasury. BCE Inc. determines the method the trustee uses to buy the shares. There were 26,242 employees participating in the plans at December 31, 2009. The total number of common shares bought for employees was 4,717,877 in 2009, 4,058,498 in 2008 and 4,518,245 in 2007. At December 31, 2009, 13,513,812 common shares were authorized for issuance under the ESPs.
Stock Options
Under BCE Inc.’s long-term incentive plans, BCE Inc. may grant options to key employees to buy BCE Inc. common shares. Prior to 2008, the subscription price was equal to the market value of the shares on the last trading day before the grant came into effect. To conform to current Toronto Stock Exchange requirements, since 2008 the subscription price of a grant is based on the higher of: (1) the volume-weighted average of the trading price on the trading day immediately prior to the effective date of the grant, and (2) the volume-weighted average of the trading price for the last five consecutive trading days ending immediately on the trading day prior to the effective date of the grant. At December 31, 2009, 30,364,994 common shares were authorized for issuance under these plans. Most options granted from 2004 to 2006 were forfeited in 2007 as the required vesting conditions were not met. Most options granted in March 2007 vest evenly over a four-year period of continuous employment from the date of grant, unless a special vesting period applies. Options granted in December 2008 vest fully after two years of continuous employment from the date of the grant. All options become exercisable when they vest and generally can be exercised for a period of up to six years from the date of grant. Special vesting provisions may apply if:
there is a change in control of BCE Inc. and the option holder’s employment ends the option holder is employed by a designated subsidiary of BCE Inc. and BCE Inc.’s ownership interest in that subsidiary falls below the percentage set out in the plan.
2009 2008 2007
Shares purchased on open market 2,234,159 882,438 1,823,652 Cost 56 33 66
2009 2008 2007
Balance at January 1 2,531 2,537 2,555 Repurchase of common shares – NCIB (44) (5 ) (9 ) Other 3 (1 ) (9 )
Balance at December 31 2,490 2,531 2,537
FOR THE YEAR ENDED DECEMBER 31 2009 2008 2007
Employee savings plans (37) (39 ) (42 ) Stock options (3) (6 ) (10 ) Restricted share units(1) (91) (36 ) (95 ) Deferred share units (3) (3 ) (4 ) Deferred unit plan – Bell Aliant (8) (13 ) (8 )
Total stock-based compensation expense(2) (142) (97 ) (159) Income tax benefit arising from stock-based compensation 41 25 47
(101) (72 ) (112)
(1) The total 2008 expense includes $44 million recorded as restructuring and other. (2) The cash outflows in respect of stock-based compensation plans were $46 million in 2009, $212 million in 2008 and $65 million in 2007. In 2008, $79 million relates to going-private costs.

112 BCE INC. 2009 ANNUAL REPORT NOTES TO CONSOLIDATED FINANCIAL STATEMENTS
The following table summarizes BCE Inc.’s outstanding stock options as at December 31, 2009.
The following table provides additional information about BCE Inc.’s stock option plans at December 31, 2009.
As at December 31, 2009, the unrecognized compensation cost related to non-vested stock options was $2 million to be recorded over a weighted average period of one year.
The following table summarizes stock options outstanding at December 31, 2008 and 2007.
ASSUMPTIONS USED IN STOCK OPTION PRICING MODEL
The following table shows the weighted average assumptions used to determine the stock-based compensation expense using the Black-Scholes option pricing model in 2008 and 2007.
BCE INC. 2009 ANNUAL REPORT 113
NOTES TO CONSOLIDATED FINANCIAL STATEMENTS
RSUs
The following table summarizes RSUs outstanding at December 31, 2009, 2008 and 2007.
NOTE
NUMBER OF OPTIONS
WEIGHTED AVERAGE
GRANT DATE FAIR VALUE ($)
WEIGHTED AVERAGE
EXERCISE PRICE ($)
NON-VESTED VESTED TOTAL
NON -VESTED VESTED
NON-VESTED VESTED TOTAL
Outstanding, January 1, 2009 3,476,250 11,550,638 15,026,888 $4 $6 $29 $34 $33
Exercised(1) 20 – (130,471) (130,471) – $6 – $18 $18 Vested (898,750) 898,750 – $4 $4 $31 $31 – Forfeited (77,500) (3,520,678) (3,598,178) $4 $6 $31 $36 $36
Outstanding, December 31, 2009(2) 2,500,000 8,798,239 11,298,239 $4 $5 $28 $34 $32
(1) The aggregate intrinsic value of options exercised was $1 million.(2) The aggregate intrinsic values of options outstanding were $5 million for non-vested options and $3 million for vested options.
RANGE OF EXERCISE PRICES
STOCK OPTIONS EXERCISABLE STOCK OPTIONS OUTSTANDING
NUMBER
WEIGHTEDAVERAGE
REMAININGLIFE
WEIGHTEDAVERAGE EXERCISE
PRICE ($ ) NUMBER
WEIGHTEDAVERAGE
REMAINING LIFE
WEIGHTEDAVERAGE EXERCISE
PRICE ($ )
$20–$29 2,285,790 3.0 $28 3,075,790 3.5 $26 $30–$39 4,181,286 2.4 $33 5,891,286 2.6 $32 $40 or more 2,331,163 0.8 $41 2,331,163 0.8 $41
8,798,239 2.1 $34 11,298,239 2.5 $32
NOTE
2008 2007
NUMBEROF OPTIONS
WEIGHTEDAVERAGE EXERCISE
PRICE ($ )NUMBER
OF OPTIONS
WEIGHTEDAVERAGEEXERCISE
PRICE ($)
Outstanding, January 1 17,697,380 $33 24,241,848 $33 Granted 790,000 $23 5,739,106 $31 Exercised(1) 20 (1,785,142) $28 (4,994,073 ) $31 Expired/forfeited (1,675,350) $34 (7,289,501 ) $32
Outstanding, December 31 15,026,888 $33 17,697,380 $33
Exercisable, December 31 11,550,638 $34 11,502,280 $35
(1) The aggregate intrinsic value of options exercised was $16 million and $31 million in 2008 and 2007, respectively.
2008 2007
Weighted average fair value per option granted ($) 3 4 Dividend yield 6.5 % 4.4% Expected volatility 30 % 20 % Risk-free interest rate 1.9 % 4.0% Expected life (years) 3.5 4.5
NUMBER OF RSUS
2009(1) 2008 2007
Outstanding, January 1 5,033,924 633,143 2,985,035 Granted 2,282,755 5,033,924 56,465 Dividends credited 435,875 6,074 118,329 Payments – (561,859 ) (141,983) Forfeited (537,216) (77,358 ) (97,248 ) Cancelled as part of the proposed privatization transaction – – (2,287,455 )

RSUs are granted to executives and other key employees. The value of an RSU is equal to the value of one BCE Inc. common share. Dividends in the form of additional RSUs are credited to the participant’s account on each dividend payment date and are equivalent in value to the dividend paid on BCE Inc. common shares. Executives and other key employees are granted a specific number of RSUs for a given performance period based on their position and level of contribution. Prior to 2008, most RSUs vested at the end of a performance period if performance objectives were met as determined by the board or were forfeited. Most of the outstanding RSUs vest in December 2010, provided that the holder is employed by Bell Canada or one of its subsidiaries at that time. Vested RSUs are paid in cash, except for those of executives, who can choose from cash, BCE Inc. common shares purchased on the open market, DSUs or through a combination of each, as long as individual share ownership requirements are met. Special vesting provisions apply if there is a change in control. At December 31, 2009, the unrecognized compensation cost related to RSUs was $92 million. As a result of the proposed privatization transaction, in 2007 the board approved the implementation of a retention policy, in lieu of the RSU plan. RSUs held by executives who became eligible to a retention incentive were forfeited in 2007. Retention payments were paid in 2008 and were greater than the value of the original RSUs. The difference between what would have been paid under the original RSU plan and what was paid under the retention policy was expensed as restructuring and other over the retention period.
DSUs
Eligible bonuses may be paid in the form of DSUs when executives or other key employees elect to or are required to participate in the plan. For non-management directors, their compensation is paid in DSUs until the minimum share ownership requirement is met or as elected by the directors thereafter. The value of a DSU is equal to the value of one BCE Inc. common share. Dividends in the form of additional DSUs are credited to the participant’s account on each dividend payment date and are equivalent in value to the dividends paid on BCE Inc. common shares. DSUs are paid in BCE Inc. common shares purchased on the open market following the cessation of a participant’s employment or when a director leaves the board. The following table is a summary of the status of DSUs.
SCPs
Prior to 2000, when BCE Inc. granted options to executives and other key employees, related rights to SCPs were also often granted. SCPs are cash payments representing the amount that the market value of the shares on the date of exercise of the related options exceeds the exercise price of those options. When the distribution of Nortel Networks Inc. (Nortel) common shares was made in 2000, the outstanding options were cancelled and replaced with options to buy BCE Inc. common shares and options to buy Nortel common shares. The related SCPs were adjusted accordingly. All SCPs expired or were paid during 2009.
114 BCE INC. 2009 ANNUAL REPORT NOTES TO CONSOLIDATED FINANCIAL STATEMENTS
NOTE 22: ACCUMULATED OTHER COMPREHENSIVE INCOME
The following table summarizes the changes in the balance of each classification within accumulated other comprehensive income (loss).
In 2009, we received proceeds of $109 million on sales of AFS financial assets and realized a pre-tax gain of $35 million. We used the average cost method in determining the gain. The estimated net amount of existing gains and losses reported in accumulated other comprehensive income that is expected to be reclassified to earnings within the next 12 months as a result of 2010 cash flow hedges maturing is a pre-tax loss of $33 million.
BCE INC. 2009 ANNUAL REPORT 115
NOTES TO CONSOLIDATED FINANCIAL STATEMENTS
NOTE 23: EMPLOYEE BENEFIT PLANS
We provide pension and other post-employment benefits for most of our employees. These include DB pension plans and DC pension plans.
Outstanding, December 31 7,215,338 5,033,924 633,143
(1) All RSUs were non-vested at December 31, 2009.
NUMBER OF DSUS
2009(1) 2008 2007
Outstanding, January 1 1,098,978 1,538,640 1,287,422 Issued 337,478 72,880 408,341 Dividends credited 76,652 29,946 58,543 Payments (329,413) (542,488 ) (215,666)
Outstanding, December 31 1,183,695 1,098,978 1,538,640
(1) All DSUs were fully vested at December 31, 2009.
AVAILABLE-FOR-SALEFINANCIAL
ASSETS
DERIVATIVESDESIGNATED
AS CASH FLOWHEDGES
CUMULATIVETRANSLATIONADJUSTMENT
ACCUMULATEDOTHER
COMPREHENSIVEINCOME (LOSS)
Balance in accumulated other comprehensive income (loss) at January 1, 2008 74 (2 ) (4 ) 68 Details of other comprehensive income (net of non-controlling interest)
Unrealized (losses) gains (159) 16 2 (141) Income taxes on unrealized (losses) gains – (1 ) – (1) Reclassification adjustments included in earnings 74 (15 ) – 59 Income taxes on reclassification adjustments included in earnings 52 2 – 54
Other comprehensive (loss) income for the year ended December 31, 2008 (33 ) 2 2 (29 )
Balance in accumulated other comprehensive income (loss) at December 31, 2008 41 – (2 ) 39
Details of other comprehensive income (net of non-controlling interest)
Unrealized gains (losses) 106 (25 ) – 81 Income taxes on unrealized gains (losses) – 6 – 6 Reclassification adjustments included in earnings (24 ) (12 ) – (36 ) Income taxes on reclassification adjustments included in earnings – 2 – 2
Other comprehensive income (loss) for the year ended December 31, 2009 82 (29 ) – 53
Balance in accumulated other comprehensive income (loss) at December 31, 2009 123 (29) (2) 92
FOR THE YEAR ENDED DECEMBER 31 2009 2008 2007

Components of DB Plans Cost
The following table shows the DB plans cost before and after recognizing its long-term nature. The recognized net benefit plans cost reflects the amount reported in our statements of operations and is calculated according to our accounting policy.
116 BCE INC. 2009 ANNUAL REPORT NOTES TO CONSOLIDATED FINANCIAL STATEMENTS
Components of Accrued Benefit Asset (Liability)
The following table shows the change in benefit obligations, change in fair value of plan assets and the funded status of the DB plans.
For DB pension plans with an accrued benefit obligation that was more than plan assets:
Pension benefits DB plans cost (239) (102 ) (263) DC plans cost (45) (45 ) (38 )
Other future benefits cost (71) (103 ) (109)
Net benefit plans cost(1) (355) (250 ) (410)
(1) Net benefit plans cost is included as part of selling, general and administrative expenses in the statement of operations.
PENSION BENEFITS OTHER BENEFITS FOR THE YEAR ENDED DECEMBER 31 2009 2008 2007 2009 2008 2007
Current service cost (175) (252) (278) (7) (11 ) (11 ) Interest cost on accrued benefit obligation (892) (864) (858) (99) (99 ) (97 ) Actual return (loss) on plan assets 1,566 (2,610) 566 28 (6 ) 3 Past service credits arising during period – – 58 – – 345 Actuarial (loss) gain on accrued benefit
obligation (1,043) 2,295 741 (94) 323 56
Elements of employee future benefit plans (cost) before recognizing its long-term nature (544) (1,431) 229 (172) 207 296
(Excess) deficiency of actual return over expected return(1) (685) 3,634 462 (16) 18 9
Deferral of amounts arising during period Past service credits – – (58 ) – – (345 ) Actuarial loss (gain) on accrued benefit
obligation 1,043 (2,295) (741) 94 (323 ) (56 ) Amortization of previously deferred amounts
Net past service (costs) credits (5) (5 ) (13) 27 28 27 Net actuarial losses (84) (29 ) (120) (3) (32 ) (38 ) Transitional asset (obligation) 3 3 6 (1) (1 ) (2 )
Adjustments to recognize long-term nature of employee future benefit plans cost 272 1,308 (464) 101 (310 ) (405)
Decrease (increase) in valuation allowance 33 19 (28) – – – Other – 2 – – – –
DB plans cost, recognized (239) (102) (263) (71) (103 ) (109)
(1) The expected return on plan assets for a given year is calculated based on the market-related value of plan assets at the beginning of that year. The market-related value of pension plan assets was $12,612 million at January 1, 2009, $14,775 million at January 1, 2008 and $14,269 million at January 1, 2007.
PENSION BENEFITS OTHER BENEFITS AT DECEMBER 31 2009 2008 2009 2008
Accrued benefit obligation, beginning of the year (13,602) (15,690 ) (1,518) (1,827) Current service cost (175) (252 ) (7) (11 ) Interest cost on accrued benefit obligation (892) (864 ) (99) (99 ) Actuarial (loss) gain on accrued benefit obligation (1,043) 2,295 (94) 323 Benefit payments 1,038 915 96 96 Employee contributions (6) (6 ) – –
Accrued benefit obligation, end of the year (14,680) (13,602 ) (1,622) (1,518)
Fair value of plan assets, beginning of the year 11,510 14,841 163 169
Actual return (loss) on plan assets 1,566 (2,610 ) 28 (6 ) Benefit payments (1,038) (915 ) (96) (96 ) Employer contributions 1,025 189 96 96 Employee contributions 6 6 – – Transfers to DC pension plans – (1 ) – –
Fair value of plan assets, end of the year 13,069 11,510 191 163
Plan (deficit) surplus (1,611) (2,092 ) (1,431) (1,355) Unamortized net actuarial losses 3,358 3,153 144 72 Unamortized net past service costs (credits) 56 62 (120) (163) Unamortized transitional obligation (asset) 1 (1 ) 3 3 Valuation allowance (100) (133 ) – –
Accrued benefit asset (liability), end of the year 1,704 989 (1,404) (1,443)
Accrued benefit asset included in other long-term assets 2,316 1,636 – – Accrued benefit liability included in other long-term liabilities (612) (647 ) (1,404) (1,443)

the accrued benefit obligation was $14,553 million at December 31, 2009 and $13,455 million at December 31, 2008. the fair value of plan assets was $12,811 million at December 31, 2009 and $11,276 million at December 31, 2008.
For DB pension plans with an accrued benefit obligation that was less than plan assets:
the accrued benefit obligation was $127 million at December 31, 2009 and $147 million at December 31, 2008 the fair value of plan assets was $258 million at December 31, 2009 and $234 million at December 31, 2008.
BCE INC. 2009 ANNUAL REPORT 117
NOTES TO CONSOLIDATED FINANCIAL STATEMENTS
Significant Assumptions
We used the following key assumptions to measure the accrued benefit obligation and the net benefit plans cost for the DB pension plans and plans that provide other employee future benefits. These assumptions are long-term, which is consistent with the nature of employee benefit plans.
We assumed the following trend rates in healthcare costs:
an annual rate of increase of 4.5% in the cost per person of covered healthcare benefits for 2009 and the foreseeable future an annual rate of increase in the cost of medication: – for retirees under age 65 of 7.0% for 2009 with a gradual decline to 4.5% over ten years – for retirees over age 65 of 4.5%.
Assumed trend rates in healthcare costs have a significant effect on the amounts reported for the healthcare plans. The following table, for example, shows the effect of a 1% change in the assumed trend rates in healthcare costs.
Pension Plan Assets
The investment strategy for the major pension plans is to maintain a diversified portfolio of assets, invested in a prudent manner to maintain the security of funds while taking into account the liability structure of the pension plan and maximizing returns within our guidelines. The expected rate of return assumption is based on our target asset allocation policy and the expected future rates of return on these assets. The following table shows the allocation of our pension plan assets at December 31, 2009 and 2008, target allocations for 2009 and the expected long-term rate of return by asset class.
Equity securities included approximately $34 million of BCE Inc. common shares and Bell Aliant units, or 0.3% of total plan assets at December 31, 2009, and approximately $43 million of BCE Inc. common shares and Bell Aliant units, or 0.4% of total plan assets at December 31, 2008. At December 31, 2009, the amount of BCE Inc. and affiliates’ debentures included in debt securities was not significant. At December 31, 2008, debt securities included approximately $5 million of BCE Inc. and affiliates’ debentures or 0.1% of total plan assets at December 31, 2008.
Estimated Future Benefit Payments
The following table shows the estimated future payments to pensioners for the next ten years at December 31, 2009.
118 BCE INC. 2009 ANNUAL REPORT
PENSION BENEFITS OTHER BENEFITS 2009 2008 2007 2009 2008 2007
At December 31 Accrued benefit obligation
Discount rate, end of year 6.4% 7.0 % 5.6% 6.4% 7.0 % 5.6% Rate of compensation increase, end of year 3.0% 3.0 % 3.0% 3.0% 3.0 % 3.0%
For the year ended December 31 Net benefit plans cost
Discount rate, end of preceding year 7.0% 5.6 % 5.3% 7.0% 5.6 % 5.3% Expected return on plan assets, end of
preceding year 7.25% 7.25 % 7.5% 7.25% 7.25 % 7.5% Rate of compensation increase, end of
preceding year 3.0% 3.0 % 3.0% 3.0% 3.0 % 3.0%
1% INCREASE 1% DECREASE
Effect on other benefits – total service and interest cost 7 (7 ) Effect on other benefits – accrued obligation 120 (104)
WEIGHTEDAVERAGE
TARGETALLOCATION
PERCENTAGE OF PLAN ASSETS AT DECEMBER 31 FAIR VALUE OF PLAN ASSETS
AT DECEMBER 31
WEIGHTEDAVERAGE
EXPECTEDLONG-TERM
RATE OF RETURN ASSET CATEGORY 2009 2009 2008 2009 2008 2009
Equity securities 35% – 55% 44% 56 % 5,789 6,423 9.0% Debt securities 45% – 65% 56% 44 % 7,280 5,087 5.1%
Total/average 100% 100 % 13,069 11,510 7.2%
PENSION
BENEFITS OTHER
BENEFITS
2010 (969 ) (100) 2011 (991 ) (109) 2012 (1,012) (113) 2013 (1,034) (117) 2014 (1,058) (121) 2015–2019 (5,665) (659)
Total estimated future benefit payments (10,729 ) (1,219)
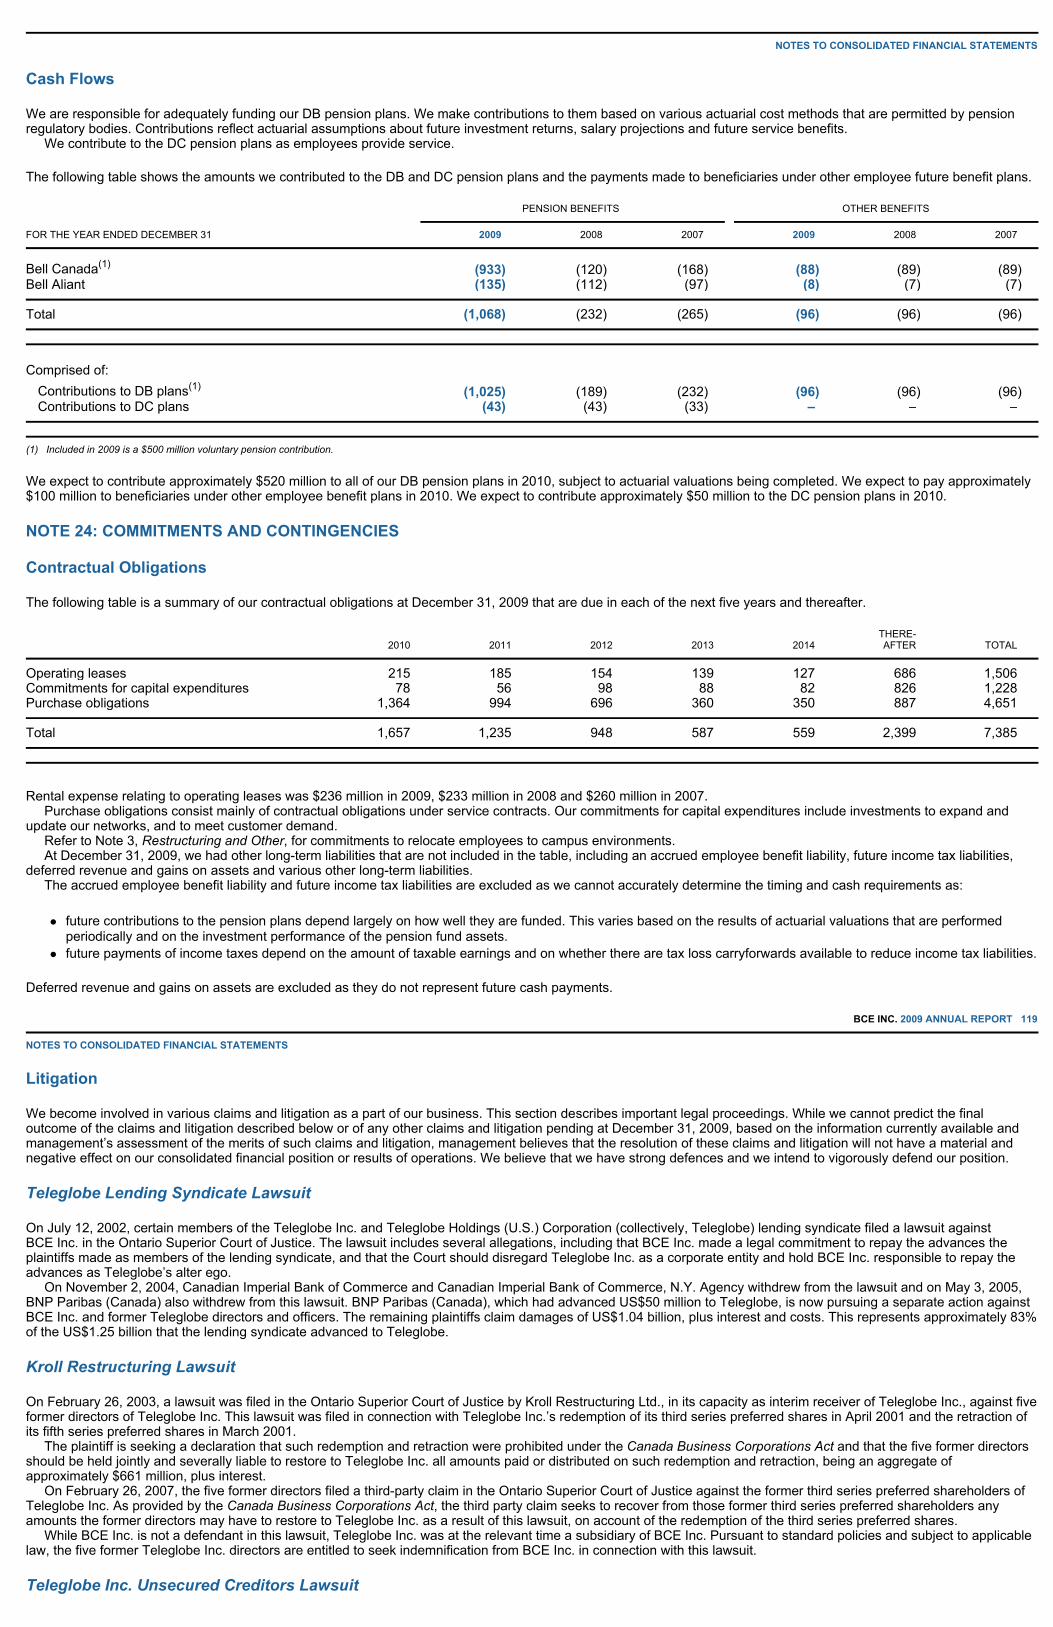
NOTES TO CONSOLIDATED FINANCIAL STATEMENTS
Cash Flows
We are responsible for adequately funding our DB pension plans. We make contributions to them based on various actuarial cost methods that are permitted by pension regulatory bodies. Contributions reflect actuarial assumptions about future investment returns, salary projections and future service benefits. We contribute to the DC pension plans as employees provide service.
The following table shows the amounts we contributed to the DB and DC pension plans and the payments made to beneficiaries under other employee future benefit plans.
We expect to contribute approximately $520 million to all of our DB pension plans in 2010, subject to actuarial valuations being completed. We expect to pay approximately $100 million to beneficiaries under other employee benefit plans in 2010. We expect to contribute approximately $50 million to the DC pension plans in 2010.
NOTE 24: COMMITMENTS AND CONTINGENCIES
Contractual Obligations
The following table is a summary of our contractual obligations at December 31, 2009 that are due in each of the next five years and thereafter.
Rental expense relating to operating leases was $236 million in 2009, $233 million in 2008 and $260 million in 2007. Purchase obligations consist mainly of contractual obligations under service contracts. Our commitments for capital expenditures include investments to expand and update our networks, and to meet customer demand. Refer to Note 3, Restructuring and Other, for commitments to relocate employees to campus environments. At December 31, 2009, we had other long-term liabilities that are not included in the table, including an accrued employee benefit liability, future income tax liabilities, deferred revenue and gains on assets and various other long-term liabilities. The accrued employee benefit liability and future income tax liabilities are excluded as we cannot accurately determine the timing and cash requirements as:
future contributions to the pension plans depend largely on how well they are funded. This varies based on the results of actuarial valuations that are performed periodically and on the investment performance of the pension fund assets. future payments of income taxes depend on the amount of taxable earnings and on whether there are tax loss carryforwards available to reduce income tax liabilities.
Deferred revenue and gains on assets are excluded as they do not represent future cash payments.
BCE INC. 2009 ANNUAL REPORT 119
NOTES TO CONSOLIDATED FINANCIAL STATEMENTS
Litigation
We become involved in various claims and litigation as a part of our business. This section describes important legal proceedings. While we cannot predict the final outcome of the claims and litigation described below or of any other claims and litigation pending at December 31, 2009, based on the information currently available and management’s assessment of the merits of such claims and litigation, management believes that the resolution of these claims and litigation will not have a material and negative effect on our consolidated financial position or results of operations. We believe that we have strong defences and we intend to vigorously defend our position.
Teleglobe Lending Syndicate Lawsuit
On July 12, 2002, certain members of the Teleglobe Inc. and Teleglobe Holdings (U.S.) Corporation (collectively, Teleglobe) lending syndicate filed a lawsuit against BCE Inc. in the Ontario Superior Court of Justice. The lawsuit includes several allegations, including that BCE Inc. made a legal commitment to repay the advances the plaintiffs made as members of the lending syndicate, and that the Court should disregard Teleglobe Inc. as a corporate entity and hold BCE Inc. responsible to repay the advances as Teleglobe’s alter ego. On November 2, 2004, Canadian Imperial Bank of Commerce and Canadian Imperial Bank of Commerce, N.Y. Agency withdrew from the lawsuit and on May 3, 2005, BNP Paribas (Canada) also withdrew from this lawsuit. BNP Paribas (Canada), which had advanced US$50 million to Teleglobe, is now pursuing a separate action against BCE Inc. and former Teleglobe directors and officers. The remaining plaintiffs claim damages of US$1.04 billion, plus interest and costs. This represents approximately 83% of the US$1.25 billion that the lending syndicate advanced to Teleglobe.
Kroll Restructuring Lawsuit
On February 26, 2003, a lawsuit was filed in the Ontario Superior Court of Justice by Kroll Restructuring Ltd., in its capacity as interim receiver of Teleglobe Inc., against five former directors of Teleglobe Inc. This lawsuit was filed in connection with Teleglobe Inc.’s redemption of its third series preferred shares in April 2001 and the retraction of its fifth series preferred shares in March 2001. The plaintiff is seeking a declaration that such redemption and retraction were prohibited under the Canada Business Corporations Act and that the five former directors should be held jointly and severally liable to restore to Teleglobe Inc. all amounts paid or distributed on such redemption and retraction, being an aggregate of approximately $661 million, plus interest. On February 26, 2007, the five former directors filed a third-party claim in the Ontario Superior Court of Justice against the former third series preferred shareholders of Teleglobe Inc. As provided by the Canada Business Corporations Act, the third party claim seeks to recover from those former third series preferred shareholders any amounts the former directors may have to restore to Teleglobe Inc. as a result of this lawsuit, on account of the redemption of the third series preferred shares. While BCE Inc. is not a defendant in this lawsuit, Teleglobe Inc. was at the relevant time a subsidiary of BCE Inc. Pursuant to standard policies and subject to applicable law, the five former Teleglobe Inc. directors are entitled to seek indemnification from BCE Inc. in connection with this lawsuit.
Teleglobe Inc. Unsecured Creditors Lawsuit
FOR THE YEAR ENDED DECEMBER 31 PENSION BENEFITS OTHER BENEFITS
2009 2008 2007 2009 2008 2007
Bell Canada(1) (933) (120 ) (168 ) (88) (89) (89 ) Bell Aliant (135) (112 ) (97 ) (8) (7 ) (7 )
Total (1,068) (232 ) (265 ) (96) (96) (96 )
Comprised of:
Contributions to DB plans(1) (1,025) (189 ) (232 ) (96) (96) (96 ) Contributions to DC plans (43) (43 ) (33 ) – – –
(1) Included in 2009 is a $500 million voluntary pension contribution.
2010 2011 2012 2013 2014 THERE-AFTER TOTAL
Operating leases 215 185 154 139 127 686 1,506 Commitments for capital expenditures 78 56 98 88 82 826 1,228 Purchase obligations 1,364 994 696 360 350 887 4,651
Total 1,657 1,235 948 587 559 2,399 7,385

On May 26, 2004, a lawsuit was filed in the United States Bankruptcy Court for the District of Delaware. The lawsuit is against BCE Inc. and ten former directors and officers of Teleglobe Inc. and certain of its subsidiaries. The plaintiffs are comprised of Teleglobe Communications Corporation, certain of its affiliated debtors and debtors in possession, and the Official Committee of Unsecured Creditors of these debtors. The lawsuit alleges breach of an alleged funding commitment of BCE Inc. towards the debtors, misrepresentation by BCE Inc. and breach and aiding and abetting breaches of fiduciary duty by the defendants. The plaintiffs seek an unspecified amount of damages against the defendants. On June 19, 2009, BCE Inc. and the individual defendants filed a motion for summary judgment regarding all claims, which motion is still pending.
Teleglobe Inc. Plan Administrator Lawsuit
On November 16, 2005, Kathy Morgan, in her capacity as plan administrator for Teleglobe Inc., filed a lawsuit in the Ontario Superior Court of Justice against BCE Inc. and seven former directors of Teleglobe Inc. The plaintiff is seeking a declaration that Teleglobe Inc. and its creditors have been oppressed by the former directors of Teleglobe Inc. and by BCE Inc. within the meaning of the Canada Business Corporations Act. The plaintiff is also seeking a declaration that the former directors of Teleglobe Inc. breached their fiduciary duty to Teleglobe Inc. and failed to act in accordance with the standard of care prescribed under the Canada Business Corporations Act. The plaintiff is seeking compensation for oppression in the amount of $3 billion and damages for breach of fiduciary duty in the amount of $3 billion, in each case plus interest and costs.
120 BCE INC. 2009 ANNUAL REPORT NOTES TO CONSOLIDATED FINANCIAL STATEMENTS
Class Action Concerning Bell Canada and Bell Mobility Inc. (Bell Mobility) Late Payment Charges
On June 27, 2006, a motion to obtain the authorization to institute a class action was filed in the Québec Superior Court against Bell Canada and Bell Mobility on behalf of all physical persons and companies in Canada who were billed late payment charges despite having allegedly paid on time. On September 28, 2007, the plaintiffs filed an amended motion to reduce the classes to Québec customers only. On January 10, 2008, the Québec Superior Court granted the plaintiffs’ motion to be authorized to institute the class action and determined that members of the classes are all physical persons and companies in Québec, of 50 employees or less, who had been billed late payment charges since June 21, 2003 after allegedly having made full payment of amounts owing to Bell Canada and/or Bell Mobility to a financial institution and/or, for Bell Mobility’s customers only, by cheque, within the payment period indicated on their bills. The class action seeks an order requiring Bell Canada and Bell Mobility to repay all late payment charges to the members of the classes. In addition to the reimbursement of such amounts, the class action also seeks payment of punitive damages by Bell Canada and Bell Mobility. On April 11, 2008, the plaintiffs filed their motion to institute the class action.
NOTE 25: GUARANTEES
As a regular part of our business, we enter into agreements that provide for indemnifications and guarantees to counterparties that may require us to pay for costs and losses incurred in various types of transactions. We cannot reasonably estimate the maximum potential amount we could be required to pay counterparties. While some of the agreements specify a maximum potential exposure, many do not specify a maximum amount or limited period. The amount also depends on the outcome of future events and conditions, which cannot be predicted. Historically, we have not made any significant payments under these indemnifications or guarantees.
The following table represents guarantees that BCE has entered into that have a fixed maximum potential exposure, and their respective terms. BCE also has guarantees where no maximum potential amount is specified.
Sale of Assets and Businesses
As part of transactions involving business dispositions and sales of assets, we may be required to pay counterparties for costs and losses incurred as a result of breaches of representations and warranties, losses or damages to property, environmental liabilities, changes in or in the interpretation of laws and regulations (including tax legislation), valuation differences, earn-out guarantees if the disposed business does not meet specific targets, contingent liabilities of a disposed business, or reassessments of previous tax filings of the corporation that carries on the business. A nominal amount has been accrued in the consolidated balance sheet relating to this type of indemnification or guarantee at December 31, 2009. Historically, we have not made any significant payments under this type of indemnification or guarantee.
Sale of Services
In transactions involving sales of services, we may be required to pay counterparties for costs and losses incurred as a result of breaches of representations and warranties, or changes in or in the interpretation of laws and regulations (including tax legislation). No amount has been accrued in the consolidated balance sheet relating to this type of indemnification or guarantee at December 31, 2009. Historically, we have not made any significant payments under such indemnifications or guarantees.
BCE INC. 2009 ANNUAL REPORT 121
NOTES TO CONSOLIDATED FINANCIAL STATEMENTS
Purchase and Development of Assets
As part of transactions involving purchases and development of assets, we may be required to pay counterparties for costs and losses incurred as a result of breaches of representations and warranties, losses of or damages to property, or changes in or in the interpretation of laws and regulations (including tax legislation). No amount has been accrued in the consolidated balance sheet relating to this type of indemnification or guarantee at December 31, 2009. Historically, we have not made any significant payments under such indemnifications or guarantees.
Other Transactions
As part of other transactions, we may be required to pay counterparties for costs and losses incurred as a result of breaches of representations and warranties, losses of or damages to property, or changes in or in the interpretation of laws and regulations (including tax legislation). No amount has been accrued in the consolidated balance sheet relating to this type of indemnification or guarantee at December 31, 2009. Historically, we have not made any significant payments under such indemnifications or guarantees.
NOTE 26: SUPPLEMENTAL DISCLOSURE FOR STATEMENTS OF CASH FLOWS
2010 2011 2012 2013 2014 + INDEFI-
NITE TOTAL
Sale of assets and businesses 45 1 – 1 – 1,601 1,648 Sale of services – – 75 – 40 5 120 Purchase and development of assets 1 – – – – 3 4 Other 6 7 4 4 27 9 57
Total 52 8 79 5 67 1,618 1,829
FOR THE YEAR ENDED DECEMBER 31 2009 2008 2007
Cash from (used in) non-cash operating assets and liabilities is as follows: Accounts receivable 124 52 53 Inventory (149) (40 ) 51 Prepaid expenses (1) 25 (72 ) Other current assets (104) – (5) Other long-term assets (52) 86 (75 ) Accounts payable and accrued liabilities 9 263 127 Interest payable (24) (6 ) (22 ) Other long-term liabilities 141 (29 ) (16 )

122 BCE INC. 2009 ANNUAL REPORT
Glossary
Adjusted EPS This is earnings per share before restructuring and other and net (gains) losses on investments.
ARPU Average revenue per unit expressed as a rate per month for the year.
Black-Scholes Option Pricing Model The Black-Scholes option pricing model is the financial model we use to calculate the weighted-average fair value of a stock option granted using four key assumptions: stock dividend yield, expected stock volatility, risk-free interest rate and expected life of the stock option.
Book Value Per Share This is common shareholders’ equity divided by the number of common shares outstanding.
Capital Intensity This is capital expenditures divided by operating revenues.
Churn This is the rate at which existing subscribers cancel their services. Churn is calculated as the number of subscribers disconnected divided by the average subscriber base.
Common Dividend Payout Ratio Dividends paid on common shares divided by net earnings applicable to common shares.
Common Dividend Yield Dividends paid on common shares divided by BCE Inc.’s share price at the end of the year multiplied by the number of common shares outstanding.
Cost of Acquisition (COA) COA is also referred to as subscriber acquisition costs. This measure is expressed per gross activation. It includes costs associated with acquiring a customer such as hardware subsidies, marketing and distribution costs.
Curtailment A curtailment is a significant reduction in plan benefits that can result when a defined benefit pension plan is amended or restructured. Types of curtailments include a reduction in the expected number of years of future service of active employees or the elimination of the right to earn defined benefits for some or all of the future service of employees.
EBITDA We define EBITDA (earnings before interest, taxes, depreciation and amortization of intangible assets) as operating revenues less cost of revenue and selling, general and administrative expenses, meaning it represents operating income before depreciation, amortization of intangible assets and restructuring and other.
EBITDA Margin This is EBITDA divided by operating revenues.
Free Cash Flow We define free cash flow as cash flows from operating activities and distributions received from Bell Aliant less capital expenditures, preferred share dividends, dividends/distributions paid by subsidiaries to non-controlling interest, other investing activities and Bell Aliant free cash flow.
Goodwill Goodwill may be created when we acquire a business. It is calculated by deducting the fair value of the net assets acquired from the consideration given and represents the value of factors that contribute to greater earning power, such as a good reputation, customer loyalty or intellectual capital.
Long-Term Debt to Total Shareholders’ Equity This is long-term debt (including any portion due within one year) divided by shareholders’ equity.
Market Capitalization This is BCE Inc.’s share price at the end of the year multiplied by the number of common shares outstanding.
Operating Margin Operating income divided by operating revenues.
Price to Book Ratio BCE Inc.’s share price at the end of the year divided by the book value per share.
Price to Cash Flow Ratio BCE Inc.’s share price at the end of the year divided by the cash flow per share. Cash flow per share is cash flow from operating activities less capital expenditures divided by the average number of common shares outstanding.
Price to Earnings Ratio BCE Inc.’s share price at the end of the year divided by earnings per share.
Return on Equity Return on common shareholders’ equity is net earnings available to common shares as a percentage of average common shareholders’ equity.
Total Debt to Total Assets Total long-term debt (including debt due within one year) divided by total assets.
BCE INC. 2009 ANNUAL REPORT 123
Other 96 13 (44 )
Total cash from (used in) non-cash operating assets and liabilities 40 364 (3 )
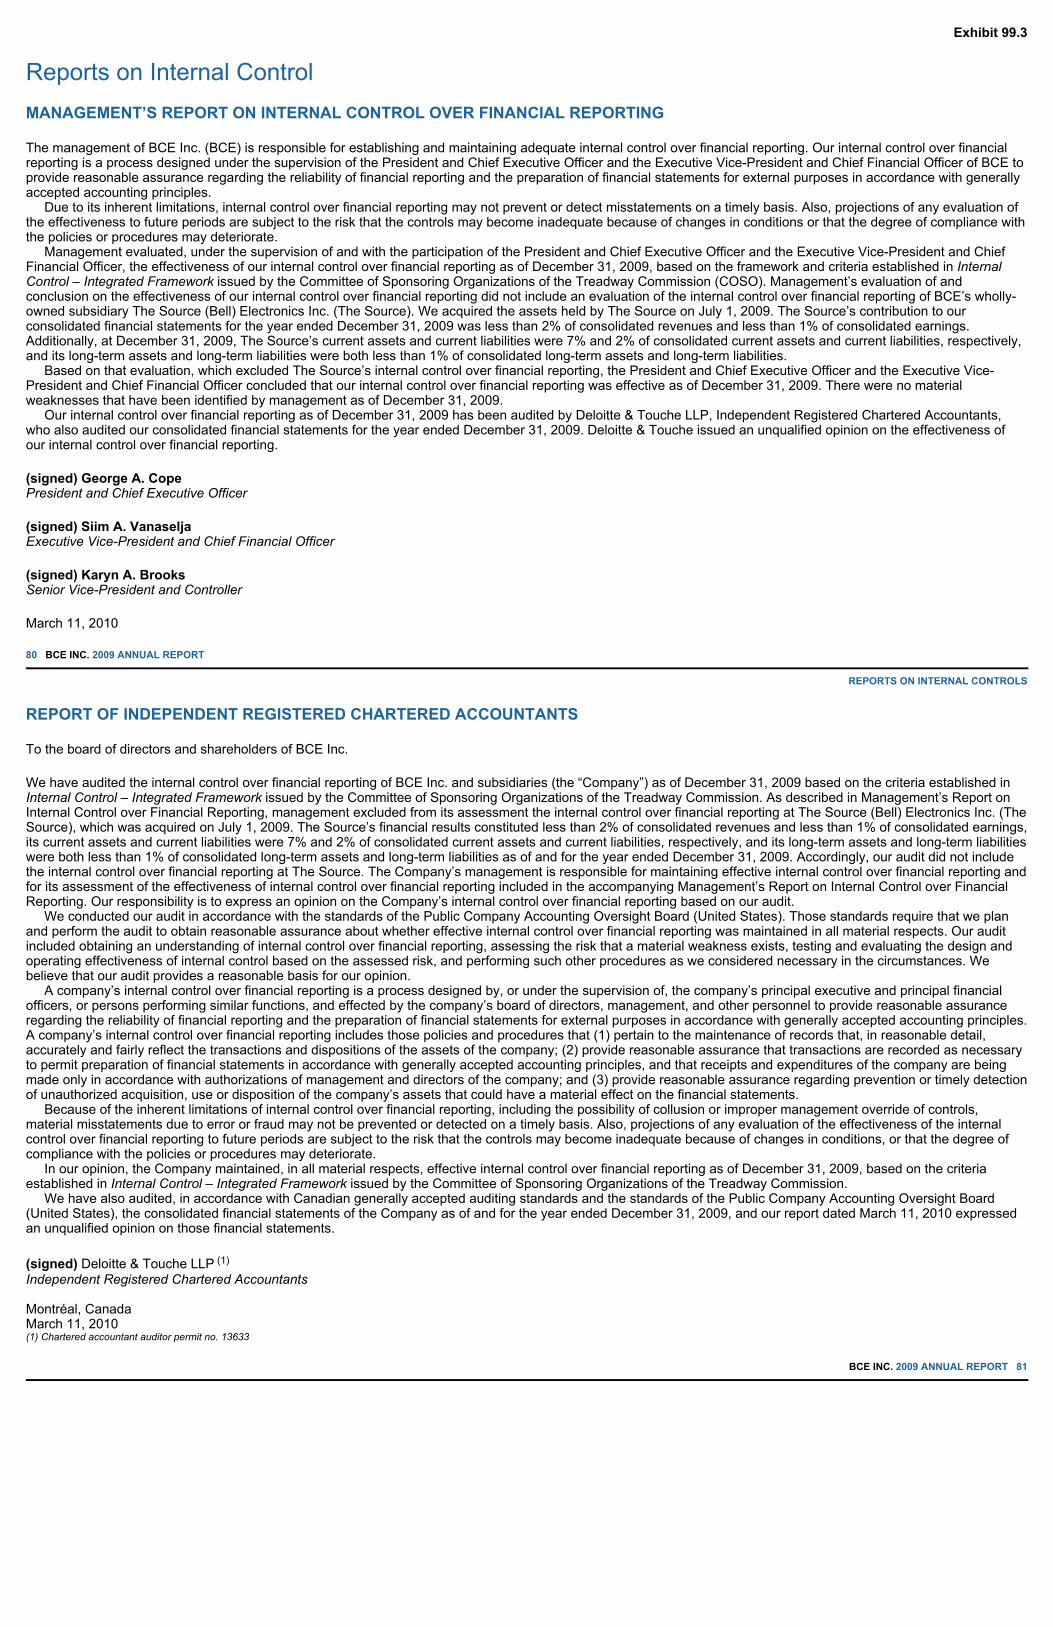
Exhibit 99.3
Reports on Internal Control MANAGEMENT’S REPORT ON INTERNAL CONTROL OVER FINANCIAL REPORTING
The management of BCE Inc. (BCE) is responsible for establishing and maintaining adequate internal control over financial reporting. Our internal control over financial reporting is a process designed under the supervision of the President and Chief Executive Officer and the Executive Vice-President and Chief Financial Officer of BCE to provide reasonable assurance regarding the reliability of financial reporting and the preparation of financial statements for external purposes in accordance with generally accepted accounting principles. Due to its inherent limitations, internal control over financial reporting may not prevent or detect misstatements on a timely basis. Also, projections of any evaluation of the effectiveness to future periods are subject to the risk that the controls may become inadequate because of changes in conditions or that the degree of compliance with the policies or procedures may deteriorate. Management evaluated, under the supervision of and with the participation of the President and Chief Executive Officer and the Executive Vice-President and Chief Financial Officer, the effectiveness of our internal control over financial reporting as of December 31, 2009, based on the framework and criteria established in Internal Control – Integrated Framework issued by the Committee of Sponsoring Organizations of the Treadway Commission (COSO). Management’s evaluation of and conclusion on the effectiveness of our internal control over financial reporting did not include an evaluation of the internal control over financial reporting of BCE’s wholly-owned subsidiary The Source (Bell) Electronics Inc. (The Source). We acquired the assets held by The Source on July 1, 2009. The Source’s contribution to our consolidated financial statements for the year ended December 31, 2009 was less than 2% of consolidated revenues and less than 1% of consolidated earnings. Additionally, at December 31, 2009, The Source’s current assets and current liabilities were 7% and 2% of consolidated current assets and current liabilities, respectively, and its long-term assets and long-term liabilities were both less than 1% of consolidated long-term assets and long-term liabilities. Based on that evaluation, which excluded The Source’s internal control over financial reporting, the President and Chief Executive Officer and the Executive Vice-President and Chief Financial Officer concluded that our internal control over financial reporting was effective as of December 31, 2009. There were no material weaknesses that have been identified by management as of December 31, 2009. Our internal control over financial reporting as of December 31, 2009 has been audited by Deloitte & Touche LLP, Independent Registered Chartered Accountants, who also audited our consolidated financial statements for the year ended December 31, 2009. Deloitte & Touche issued an unqualified opinion on the effectiveness of our internal control over financial reporting.
(signed) George A. Cope President and Chief Executive Officer
(signed) Siim A. Vanaselja Executive Vice-President and Chief Financial Officer
(signed) Karyn A. Brooks Senior Vice-President and Controller
March 11, 2010
80 BCE INC. 2009 ANNUAL REPORT
REPORTS ON INTERNAL CONTROLS
REPORT OF INDEPENDENT REGISTERED CHARTERED ACCOUNTANTS
To the board of directors and shareholders of BCE Inc.
We have audited the internal control over financial reporting of BCE Inc. and subsidiaries (the “Company”) as of December 31, 2009 based on the criteria established in Internal Control – Integrated Framework issued by the Committee of Sponsoring Organizations of the Treadway Commission. As described in Management’s Report on Internal Control over Financial Reporting, management excluded from its assessment the internal control over financial reporting at The Source (Bell) Electronics Inc. (The Source), which was acquired on July 1, 2009. The Source’s financial results constituted less than 2% of consolidated revenues and less than 1% of consolidated earnings, its current assets and current liabilities were 7% and 2% of consolidated current assets and current liabilities, respectively, and its long-term assets and long-term liabilities were both less than 1% of consolidated long-term assets and long-term liabilities as of and for the year ended December 31, 2009. Accordingly, our audit did not include the internal control over financial reporting at The Source. The Company’s management is responsible for maintaining effective internal control over financial reporting and for its assessment of the effectiveness of internal control over financial reporting included in the accompanying Management’s Report on Internal Control over Financial Reporting. Our responsibility is to express an opinion on the Company’s internal control over financial reporting based on our audit. We conducted our audit in accordance with the standards of the Public Company Accounting Oversight Board (United States). Those standards require that we plan and perform the audit to obtain reasonable assurance about whether effective internal control over financial reporting was maintained in all material respects. Our audit included obtaining an understanding of internal control over financial reporting, assessing the risk that a material weakness exists, testing and evaluating the design and operating effectiveness of internal control based on the assessed risk, and performing such other procedures as we considered necessary in the circumstances. We believe that our audit provides a reasonable basis for our opinion. A company’s internal control over financial reporting is a process designed by, or under the supervision of, the company’s principal executive and principal financial officers, or persons performing similar functions, and effected by the company’s board of directors, management, and other personnel to provide reasonable assurance regarding the reliability of financial reporting and the preparation of financial statements for external purposes in accordance with generally accepted accounting principles. A company’s internal control over financial reporting includes those policies and procedures that (1) pertain to the maintenance of records that, in reasonable detail, accurately and fairly reflect the transactions and dispositions of the assets of the company; (2) provide reasonable assurance that transactions are recorded as necessary to permit preparation of financial statements in accordance with generally accepted accounting principles, and that receipts and expenditures of the company are being made only in accordance with authorizations of management and directors of the company; and (3) provide reasonable assurance regarding prevention or timely detection of unauthorized acquisition, use or disposition of the company’s assets that could have a material effect on the financial statements. Because of the inherent limitations of internal control over financial reporting, including the possibility of collusion or improper management override of controls, material misstatements due to error or fraud may not be prevented or detected on a timely basis. Also, projections of any evaluation of the effectiveness of the internal control over financial reporting to future periods are subject to the risk that the controls may become inadequate because of changes in conditions, or that the degree of compliance with the policies or procedures may deteriorate. In our opinion, the Company maintained, in all material respects, effective internal control over financial reporting as of December 31, 2009, based on the criteria established in Internal Control – Integrated Framework issued by the Committee of Sponsoring Organizations of the Treadway Commission. We have also audited, in accordance with Canadian generally accepted auditing standards and the standards of the Public Company Accounting Oversight Board (United States), the consolidated financial statements of the Company as of and for the year ended December 31, 2009, and our report dated March 11, 2010 expressed an unqualified opinion on those financial statements.
(signed) Deloitte & Touche LLP (1)
Independent Registered Chartered Accountants Montréal, Canada March 11, 2010 (1) Chartered accountant auditor permit no. 13633
BCE INC. 2009 ANNUAL REPORT 81

Exhibit 99.4
CONSENT OF INDEPENDENT REGISTERED CHARTERED ACCOUNTANTS
We consent to the incorporation by reference in Registration Statements No. 333-12130 on Form F-3 and No. 333-12780 and 333-12802 on Form S-8 and to the use of our reports dated March 11, 2010 relating to the financial statements of BCE Inc., the reconciliation of Canadian GAAP to United States GAAP (which report includes an explanatory paragraph relating to changes in accounting principles), and to BCE Inc.’s internal control over financial reporting appearing in and incorporated by reference in the annual report on Form 40-F of BCE Inc. for the year ended December 31, 2009.
(signed) Deloitte & Touche LLP1
Independent Registered Chartered Accountants
Montréal, Canada March 11, 2010
1 Chartered accountant auditor permit no 13633
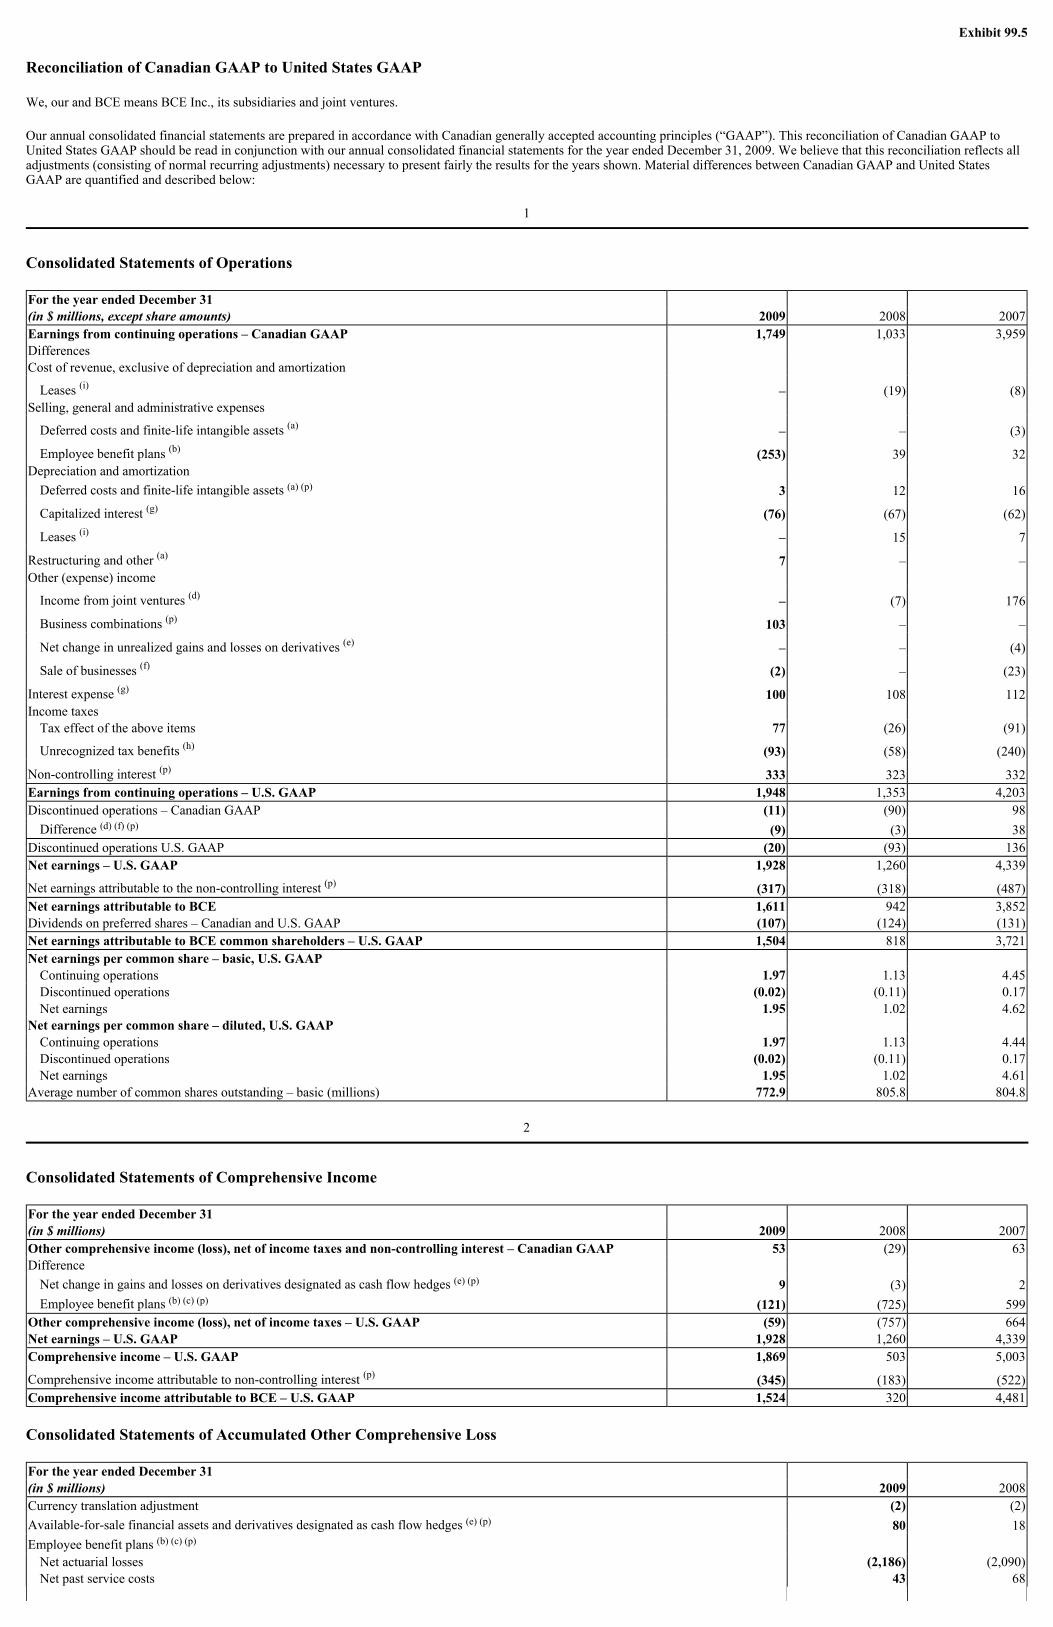
Exhibit 99.5
Reconciliation of Canadian GAAP to United States GAAP
We, our and BCE means BCE Inc., its subsidiaries and joint ventures.
Our annual consolidated financial statements are prepared in accordance with Canadian generally accepted accounting principles (“GAAP”). This reconciliation of Canadian GAAP to United States GAAP should be read in conjunction with our annual consolidated financial statements for the year ended December 31, 2009. We believe that this reconciliation reflects all adjustments (consisting of normal recurring adjustments) necessary to present fairly the results for the years shown. Material differences between Canadian GAAP and United States GAAP are quantified and described below:
1
Consolidated Statements of Operations
2
Consolidated Statements of Comprehensive Income
Consolidated Statements of Accumulated Other Comprehensive Loss
For the year ended December 31 (in $ millions, except share amounts) 2009 2008 2007 Earnings from continuing operations – Canadian GAAP 1,749 1,033 3,959 Differences Cost of revenue, exclusive of depreciation and amortization
Leases (i) – (19) (8) Selling, general and administrative expenses
Deferred costs and finite-life intangible assets (a) – – (3)
Employee benefit plans (b) (253) 39 32 Depreciation and amortization
Deferred costs and finite-life intangible assets (a) (p) 3 12 16
Capitalized interest (g) (76) (67) (62)
Leases (i) – 15 7
Restructuring and other (a) 7 – – Other (expense) income
Income from joint ventures (d) – (7) 176
Business combinations (p) 103 – –
Net change in unrealized gains and losses on derivatives (e) – – (4)
Sale of businesses (f) (2) – (23)
Interest expense (g) 100 108 112 Income taxes
Tax effect of the above items 77 (26) (91)
Unrecognized tax benefits (h) (93) (58) (240)
Non-controlling interest (p) 333 323 332 Earnings from continuing operations – U.S. GAAP 1,948 1,353 4,203 Discontinued operations – Canadian GAAP (11) (90) 98
Difference (d) (f) (p) (9) (3) 38 Discontinued operations U.S. GAAP (20) (93) 136 Net earnings – U.S. GAAP 1,928 1,260 4,339
Net earnings attributable to the non-controlling interest (p) (317) (318) (487) Net earnings attributable to BCE 1,611 942 3,852 Dividends on preferred shares – Canadian and U.S. GAAP (107) (124) (131) Net earnings attributable to BCE common shareholders – U.S. GAAP 1,504 818 3,721 Net earnings per common share – basic, U.S. GAAP
Continuing operations 1.97 1.13 4.45 Discontinued operations (0.02) (0.11) 0.17 Net earnings 1.95 1.02 4.62
Net earnings per common share – diluted, U.S. GAAP Continuing operations 1.97 1.13 4.44 Discontinued operations (0.02) (0.11) 0.17 Net earnings 1.95 1.02 4.61
Average number of common shares outstanding – basic (millions) 772.9 805.8 804.8
For the year ended December 31 (in $ millions) 2009 2008 2007 Other comprehensive income (loss), net of income taxes and non-controlling interest – Canadian GAAP 53 (29) 63 Difference
Net change in gains and losses on derivatives designated as cash flow hedges (e) (p) 9 (3) 2 Employee benefit plans (b) (c) (p) (121) (725) 599
Other comprehensive income (loss), net of income taxes – U.S. GAAP (59) (757) 664 Net earnings – U.S. GAAP 1,928 1,260 4,339 Comprehensive income – U.S. GAAP 1,869 503 5,003
Comprehensive income attributable to non-controlling interest (p) (345) (183) (522) Comprehensive income attributable to BCE – U.S. GAAP 1,524 320 4,481
For the year ended December 31 (in $ millions) 2009 2008 Currency translation adjustment (2) (2) Available-for-sale financial assets and derivatives designated as cash flow hedges (e) (p) 80 18 Employee benefit plans (b) (c) (p)
Net actuarial losses (2,186) (2,090) Net past service costs 43 68

3
Consolidated Balance Sheets
4
Consolidated Statements of Cash Flows
Net transitional obligations (2) (2) Accumulated other comprehensive loss – U.S. GAAP (2,067) (2,008)
Accumulated other comprehensive income attributable to non-controlling interest (p) 482 510 Accumulated other comprehensive income attributable to BCE – U.S. GAAP (1,585) (1,498)
At December 31 2009 2008 Canadian U.S. Canadian U.S. (in $ millions) GAAP Differences GAAP GAAP Differences GAAP ASSETS Current assets
Cash and cash equivalents 687 – 687 3,052 – 3,052 Accounts receivable 1,605 – 1,605 1,826 – 1,826
Future income taxes (p) 110 (7) 103 86 – 86 Inventory 448 – 448 272 – 272 Prepaid expenses 296 – 296 249 – 249 Other current assets 137 – 137 54 – 54 Current assets of discontinued operations 1 – 1 39 – 39
Total current assets 3,284 (7) 3,277 5,578 – 5,578 Capital assets
Property, plant and equipment (i) (g) (p) 19,441 624 20,065 19,406 586 19,992 Finite-life intangible assets (a) (g) (p) 2,541 110 2,651 2,693 51 2,744
Indefinite-life intangible assets (p) 3,803 4 3,807 3,697 – 3,697 Total capital assets 25,785 738 26,523 25,796 637 26,433 Other long-term assets (m) (p) 3,207 (2,276) 931 2,610 (1,874) 736 Goodwill (f) (p) 5,774 94 5,868 5,659 64 5,723 Non-current assets of discontinued operations – – – 20 – 20 Total assets 38,050 (1,451) 36,599 39,663 (1,173) 38,490 LIABILITIES Current liabilites
Accounts payable and accrued liabilites (p) 3,716 (29) 3,687 3,528 – 3,528 Interest payable 113 – 113 139 – 139 Dividends payable 354 – 354 337 – 337 Debt due within one year (i) (k) 600 11 611 2,201 12 2,213 Current liabilities of discontinued operations 3 – 3 22 – 22
Total current liabilities 4,786 (18) 4,768 6,227 12 6,239
Long-term debt (e) (i) (k) 10,299 25 10,324 10,099 25 10,124 Other long-term liabilities (m) (p) 4,942 115 5,057 4,946 110 5,056 Total liabilities 20,027 122 20,149 21,272 147 21,419
Non-controlling interest in subsidiaries (p) 1,049 (1,049) – 1,080 (1,080) – EQUITY (l) (f) (p) BCE shareholders’ equity
Preferred shares 2,770 – 2,770 2,770 – 2,770
Common shares (j) 12,921 (65) 12,856 13,525 (65) 13,460 Treasury stock – – – (86) – (86) Contributed surplus (f) (p) 2,490 (1,538) 952 2,531 (1,540) 991 Accumulated other comprehensive income (loss) 92 (1,677) (1,585) 39 (1,537) (1,498) (Deficit) retained earnings (1,299) 2,182 883 (1,468) 2,309 841
Total BCE shareholders’ equity 16,974 (1,098) 15,876 17,311 (833) 16,478
Non-controlling interest in subsidiaries (p) – 574 574 – 593 593 Total equity 16,974 (524) 16,450 17,311 (240) 17,071 Total liabilities and equity 38,050 (1,451) 36,599 39,663 (1,173) 38,490
For the year ended December 31 (in $ millions) 2009 2008 2007 Cash flows from operating activities – Canadian GAAP 4,884 5,909 5,730 Differences
Deferred costs (a) – – (3)
Capitalized interest (g) 100 107 111
Income from joint ventures (d) – – 3 Cash flows from operating activities – U.S. GAAP 4,984 6,016 5,841 Cash flows used in investing activities – Canadian GAAP (3,217) (3,948) (58) Differences
Deferred costs (a) – – 3
Capitalized interest (g) (100) (107) (111)
Income from joint ventures (d) – – 326 Cash flows (used in) from investing activities – U.S. GAAP (3,317) (4,055) 160 Cash flows used in financing activities – Canadian and U.S. GAAP (4,044) (1,559) (3,914) Cash flows (used in) from continuing operations – U.S. GAAP (2,377) 402 2,087
Cash flows used in discontinued operations activities – U.S. GAAP (d) (9) (22) (29) Cash flows from discontinued investing activities – U.S. GAAP 11 27 19 Cash flows used in discontinued financing activities – U.S. GAAP – (2) – Net (decrease) increase in cash and cash equivalents (2,375) 405 2,077 Cash and cash equivalents at beginning of period 3,063 2,658 581

5
All amounts are in millions of Canadian dollars, except where noted.
(a) Deferred Costs and Finite-life Intangible Assets
Under Canadian GAAP, certain expenses, such as development costs and pre-operating expenses, are deferred and amortized if they meet specified criteria. Under United States GAAP, these costs must be expensed as incurred.
(b) Employee Benefit Plans
Under United States GAAP, we recognize the funded status of benefit plans in the balance sheet by aggregating overfunded plans separately from underfunded plans and recording the resulting amounts as an asset and a liability, respectively. We also recognize as a component of other comprehensive income, net of tax, the actuarial gains or losses and past service costs or credits that arise during the period. Under Canadian GAAP, these amounts are not recorded on the balance sheet until the period in which they affect earnings.
Also, under Canadian GAAP, we recognize a pension valuation allowance for any excess of the accrued benefit asset over the related expected future benefit. Changes in the pension valuation allowance are recognized in the consolidated statement of operations. United States GAAP does not permit pension valuation allowances. Differences also arise from the use of the corridor method to amortize actuarial gains and losses for Canadian GAAP purposes.
(c) Post-Employment Benefits
In 2007, we announced the phase-out of other post-employment benefits for future retirees over the next 10 years. Under Canadian GAAP, this plan amendment reduces the unamortized transitional obligation and increases past service credits amortized over the expected average remaining service lives (EARSL) of affected employees. Under United States GAAP, this plan amendment was reflected as an increase in other comprehensive income (loss) of $209 million in June, 2007.
(d) Income from Joint Ventures
Under Canadian GAAP, we account for our interests in joint ventures using the proportionate consolidation method. Under United States GAAP, these interests would be accounted for using the equity method. This difference is not reflected in our United States GAAP reconciliation for those joint venture interests that qualify for the related accommodation provided by the United States Securities and Exchange Commission. Our joint venture interests accounted for using the proportionate consolidation method are not material to our financial position or results of operations.
Certain joint venture interests have been accounted for as discontinued operations under Canadian GAAP. Under United States GAAP, we must continue to reflect these investments in continuing operations. Our proportionate interest in joint venture results of operations and any gain or loss on disposal are reclassified from discontinued operations under Canadian GAAP to continuing operations under United States GAAP.
(e) Derivative Instruments and Hedging Activities
Under Canadian GAAP, foreign-currency derivatives embedded in a non-financial instrument host contract are not bifurcated and separately accounted for when specified conditions are met.
Differences may also arise with respect to the measurement of hedge ineffectiveness recorded in earnings.
6
(f) Sale of Businesses, Business Combinations and Goodwill
Under Canadian GAAP, certain business combinations have been accounted for at the carrying value of the underlying assets and liabilities exchanged, whereas under United States GAAP such transactions were recorded on a fair value basis. Also, differences between Canadian GAAP and United States GAAP may cause corresponding differences in the carrying values of the net assets of businesses sold, including those classified as discontinued operations. Changes in our ownership interest in these businesses will cause a corresponding difference in any resulting gains or losses.
BCE’s ownership interest in Bell Aliant was reduced through a distribution of trust units by way of a return of capital to holders of BCE Inc. common shares on July 10, 2006. This distribution resulted in an increase in contributed surplus of $1,547 million for Canadian GAAP. For United States GAAP purposes, the distribution of trust units is deemed to have occurred at fair value, with the resulting gain recognized in earnings. Therefore, the increase in contributed surplus under Canadian GAAP, adjusted for previously existing United States and Canadian GAAP differences, was recorded as a gain on distribution of trust units in earnings from continuing operations for United States GAAP purposes.
(g) Capitalized Interest
Under Canadian GAAP, we capitalize interest for significant assets under construction. Under United States GAAP, borrowing costs must be capitalized for all assets under construction.
(h) Income Taxes
Under United States GAAP an income tax position is recognized when it is more likely than not that it will be sustained upon examination based on its technical merits, and is measured as the largest amount that is greater than 50% likely to be realized upon settlement. Under Canadian GAAP, we recognize and measure income tax positions, including any related accruals for interest and penalties, based on our best estimate of the amount that is more likely than not to be realized.
BCE and its subsidiaries are subject to either Canadian federal and provincial income tax, United States federal, state or local income tax. BCE has substantially concluded all Canadian federal and provincial income tax matters for taxation years through 2000. Canadian federal income tax returns for taxation years 2001 through 2008 are currently under examination by the Canada Revenue Agency, which to date has not proposed any significant adjustments. No material matters pertaining to United States federal, state or local income tax matters are currently outstanding.
A reconciliation of the beginning and ending amount of unrecognized tax benefits is as follows:
The balance of $711 million at December 31, 2009 includes $290 million of tax positions for which the ultimate deductibility is highly certain but for which there is uncertainty as to the timing of such deductibility. The disallowance of a shorter deductibility period would not affect the effective tax rate, except with respect to interest and penalties and the impact of declining income tax rates. The remaining $421 million of unrecognized tax benefits would, if recognized, favourably affect the effective income tax rate in future periods. Subject to the results of audit examinations by taxing authorities and to legislative amendments, BCE does not anticipate adjustments to the amount of unrecognized tax benefits during the next twelve months that would have a material impact on its financial statements.
7
Cash and cash equivalents at end of period 688 3,063 2,658 Consists of:
Cash and cash equivalents of continuing operations 687 3,052 2,646 Cash and cash equivalents of discontinued operations 1 11 12 Total 688 3,063 2,658
(in $ millions) Balance at January 1, 2009 662
Increases based on tax positions related to the current year 12 Increase for tax positions of prior years 188 Decrease for tax positions of prior years (151)
Balance at December 31, 2009 711
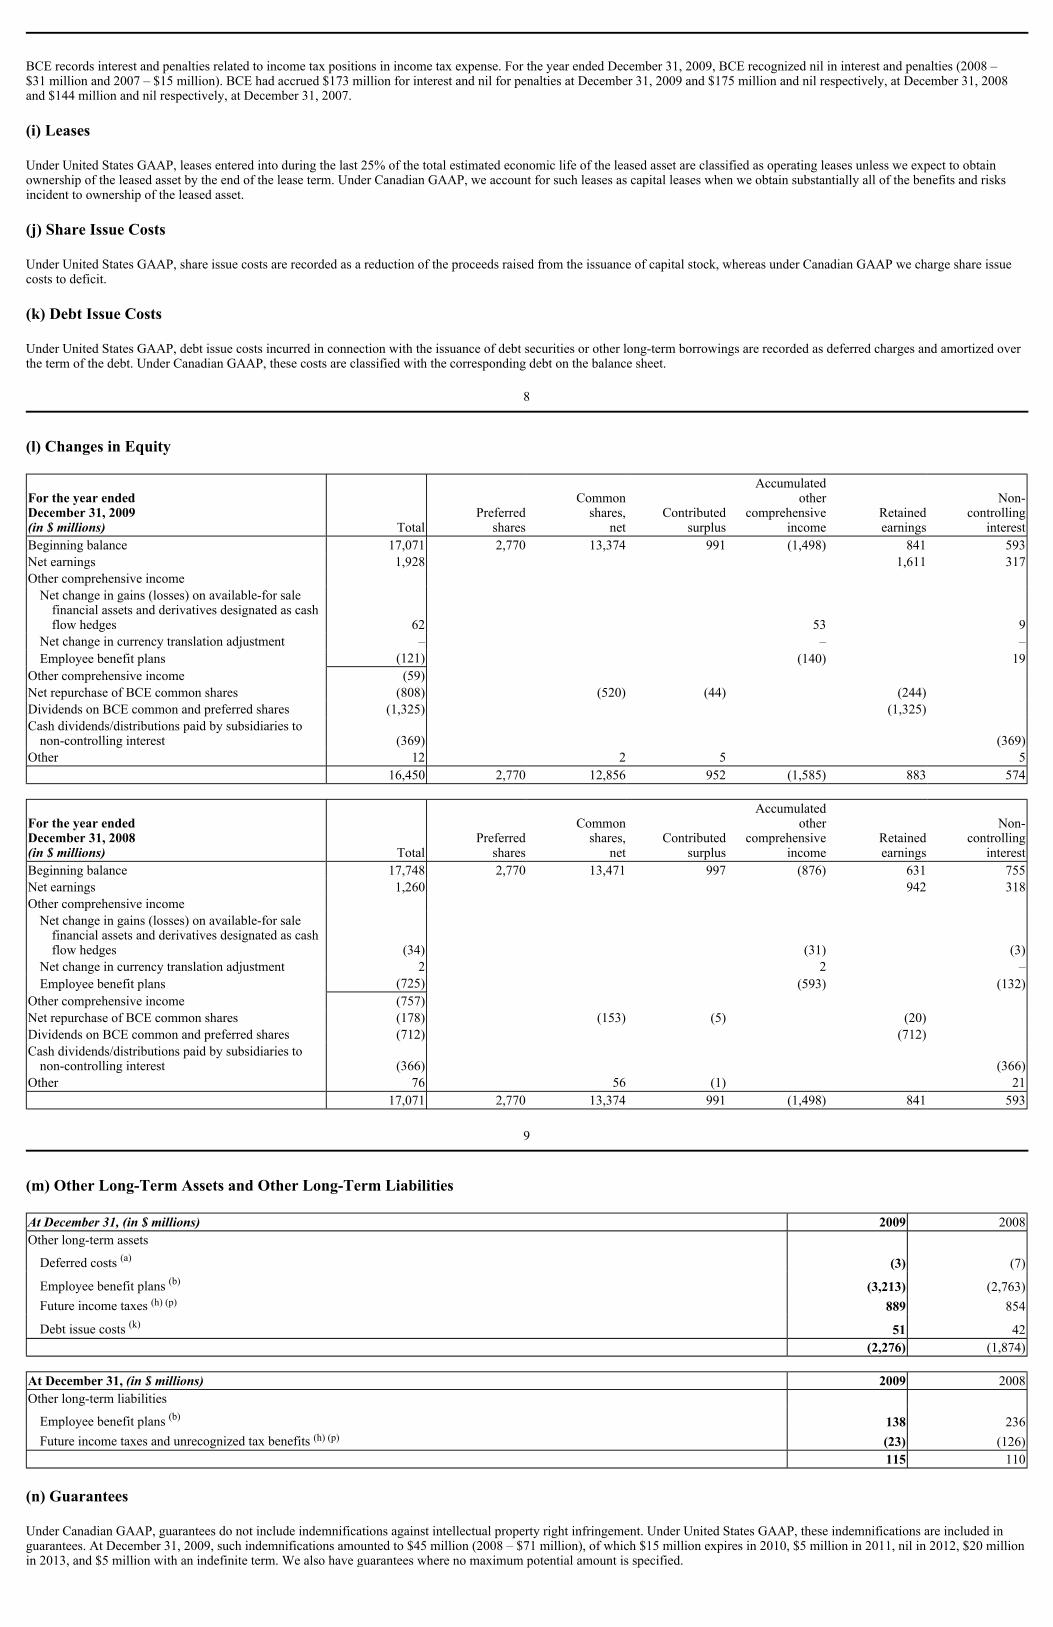
BCE records interest and penalties related to income tax positions in income tax expense. For the year ended December 31, 2009, BCE recognized nil in interest and penalties (2008 – $31 million and 2007 – $15 million). BCE had accrued $173 million for interest and nil for penalties at December 31, 2009 and $175 million and nil respectively, at December 31, 2008 and $144 million and nil respectively, at December 31, 2007.
(i) Leases
Under United States GAAP, leases entered into during the last 25% of the total estimated economic life of the leased asset are classified as operating leases unless we expect to obtain ownership of the leased asset by the end of the lease term. Under Canadian GAAP, we account for such leases as capital leases when we obtain substantially all of the benefits and risks incident to ownership of the leased asset.
(j) Share Issue Costs
Under United States GAAP, share issue costs are recorded as a reduction of the proceeds raised from the issuance of capital stock, whereas under Canadian GAAP we charge share issue costs to deficit.
(k) Debt Issue Costs
Under United States GAAP, debt issue costs incurred in connection with the issuance of debt securities or other long-term borrowings are recorded as deferred charges and amortized over the term of the debt. Under Canadian GAAP, these costs are classified with the corresponding debt on the balance sheet.
8
(l) Changes in Equity
9
(m) Other Long-Term Assets and Other Long-Term Liabilities
(n) Guarantees
Under Canadian GAAP, guarantees do not include indemnifications against intellectual property right infringement. Under United States GAAP, these indemnifications are included in guarantees. At December 31, 2009, such indemnifications amounted to $45 million (2008 – $71 million), of which $15 million expires in 2010, $5 million in 2011, nil in 2012, $20 million in 2013, and $5 million with an indefinite term. We also have guarantees where no maximum potential amount is specified.
For the year ended December 31, 2009 (in $ millions) Total
Preferredshares
Common shares,
net Contributed
surplus
Accumulatedother
comprehensiveincome
Retainedearnings
Non- controlling
interest Beginning balance 17,071 2,770 13,374 991 (1,498) 841 593 Net earnings 1,928 1,611 317 Other comprehensive income
Net change in gains (losses) on available-for sale financial assets and derivatives designated as cash flow hedges 62 53 9
Net change in currency translation adjustment – – – Employee benefit plans (121) (140) 19
Other comprehensive income (59) Net repurchase of BCE common shares (808) (520) (44) (244) Dividends on BCE common and preferred shares (1,325) (1,325) Cash dividends/distributions paid by subsidiaries to
non-controlling interest (369) (369) Other 12 2 5 5 16,450 2,770 12,856 952 (1,585) 883 574
For the year ended December 31, 2008 (in $ millions) Total
Preferredshares
Common shares,
net Contributed
surplus
Accumulatedother
comprehensiveincome
Retainedearnings
Non- controlling
interest Beginning balance 17,748 2,770 13,471 997 (876) 631 755 Net earnings 1,260 942 318 Other comprehensive income
Net change in gains (losses) on available-for sale financial assets and derivatives designated as cash flow hedges (34) (31) (3)
Net change in currency translation adjustment 2 2 – Employee benefit plans (725) (593) (132)
Other comprehensive income (757) Net repurchase of BCE common shares (178) (153) (5) (20) Dividends on BCE common and preferred shares (712) (712) Cash dividends/distributions paid by subsidiaries to
non-controlling interest (366) (366) Other 76 56 (1) 21 17,071 2,770 13,374 991 (1,498) 841 593
At December 31, (in $ millions) 2009 2008 Other long-term assets
Deferred costs (a) (3) (7)
Employee benefit plans (b) (3,213) (2,763) Future income taxes (h) (p) 889 854
Debt issue costs (k) 51 42 (2,276) (1,874)
At December 31, (in $ millions) 2009 2008 Other long-term liabilities
Employee benefit plans (b) 138 236 Future income taxes and unrecognized tax benefits (h) (p) (23) (126)
115 110

(o) Fair Value of Financial Instruments
The following table shows a comparison between the carrying value and fair value of our long-term debt and derivative financial instruments.
10
(p) Recently Adopted Accounting Changes
Effective January 1, 2009, we prospectively adopted the amendments to the Financial Accounting Standards Board (FASB) Accounting Standards Codification (ASC) Topic 805 (ASC 805) (originally issued as FASB Statement No. 141 (revised 2007), Business Combinations). The most significant changes resulting from the adoption of the amendments to ASC 805 include:
100% of the fair value of assets acquired, liabilities assumed, and non-controlling interest is recognized in acquisitions of less than a 100% controlling interest in an acquired entity when the acquisition results in a change in control of the acquired entity; Contingent consideration arrangements are recognized at their acquisition-date fair values; Acquisition-related transaction costs are expensed as incurred; and Acquisition-related restructuring costs are accrued and included in the purchase price allocation only if certain criteria are met as of the acquisition date.
During the year ended December 31, 2009, under United States GAAP, we recorded income of $103 million (net of transaction costs of $7 million and directly related restructuring costs incurred of $5 million), comprised mainly of a gain on remeasurement of a preexisting equity interest in an entity in which we acquired a controlling interest during the period and a bargain purchase gain on a business combination completed during the period.
Also effective January 1, 2009, we adopted the amendments to ASC Subtopic 810-10 (originally issued as FASB Statement No. 160, Non-controlling Interests in Consolidated Financial Statements – an amendment of ARB No. 51). Under ASC 810-10, non-controlling interest in subsidiaries is presented in the consolidated balance sheets as a separate component of equity. Changes in ownership interests in subsidiaries that do not result in a loss of control are accounted for as equity transactions instead of resulting in dilution gains or losses recorded through income. Changes in ownership interests that result in a loss of control and require deconsolidation trigger full gain or loss recognition by measuring any remaining ownership interests at fair value. ASC 810-10 also requires that net earnings reported in the consolidated statements of operations and other comprehensive income include amounts attributable to the non-controlling interest. The amendments to ASC 810-10 have been applied prospectively, except for the presentation and disclosure requirements which have been applied retroactively. Net earnings include net earnings attributable to non-controlling interest of $317 million, $318 million and $487 for the year ended December 31, 2009, 2008 and 2007 respectively. Total equity includes non-controlling interest in subsidiaries of $574 million and $593 million at December 31, 2009 and December 31, 2008, respectively.
In April 2009, the FASB issued amendments to ASC 820-10 (originally issued as Staff Position No. 157-4, Determining Fair Value When the Volume and Level of Activity for the Asset or Liability Have Significantly Decreased and Identifying Transactions That Are Not Orderly). ASC 820-10 provides additional guidance for estimating fair value when the volume and level of activity for the asset or liability have significantly decreased. It also includes guidance on identifying circumstances that indicate a transaction is not orderly. The adoption of the amendments to ASC 820-10 did not have a material impact on our financial position or results of operations.
11
In August 2009, the FASB issued amendments to ASC Subtopic 820-10, Fair Value Measurements and Disclosures – Overall, for the fair value measurement of liabilities. The amendments provide clarification that in circumstances in which quoted prices in an active market for the identical liability is not available, fair value should be measured using one of the following techniques:
The adoption of the amendments to ASC Subtopic 820-10 did not have a material impact on our financial position or results of operations.
(q) Future Accounting Changes
In June 2009, the FASB amended Topic 810, Consolidation, to change the way entities account for transfers of financial assets and determine what entities must be consolidated, including the removal of the concept of a Qualifying Special-Purpose Entity (QSPE) from FASB Statement 140.
We are currently evaluating the impact of adoption of the amendments to Topic 810, effective for years beginning after November 15, 2009.
In October 2009, the FASB amended Topic 605, Revenue Recognition, to address certain aspects of accounting by a vendor for arrangements under which it will perform multiple revenue-generating activities, amending the previous guidance under Subtopic 605-25, Revenue Arrangements with Multiple Deliverables. The amendments require a vendor to allocate arrangement consideration at the inception of an arrangement to all deliverables using the relative selling price method, thus prohibiting the use of the residual method. The amendments to Topic 605 also change the level of evidence of the standalone selling price required to separate deliverables when more objective evidence of the selling price is not available.
The amendments to Topic 605 may be applied prospectively and must be applied to revenue arrangements with multiple deliverables entered into or materially modified in the first annual fiscal period beginning on or after June 15, 2010. Early adoption is permitted.
We are currently evaluating the impact and effective date of adoption of the amendments to Topic 605.
12
December 31, 2009 December 31, 2008
(in $ millions) Carrying
valueFair
valueCarrying
value Fair
value Long-term debt due within one year 558 565 1,967 1,984 Long-term debt 10,324 10,926 10,124 9,393 Derivative financial instruments, net asset (liability) position
Forward contracts – BCE Inc. shares 35 35 (10) (10) Currency contracts (128) (128) (3) (3) Interest rate swaps 68 68 116 116
1. A valuation technique that uses: a. The quoted price of the identical liability when traded as an asset b. Quoted prices for similar liabilities or similar liabilities when traded as assets. 2. Another valuation technique that is consistent with the principles of Topic 820.

Exhibit 99.6
REPORT OF INDEPENDENT REGISTERED CHARTERED ACCOUNTANTS ON RECONCILIATION OF CANADIAN GAAP TO UNITED STATES GAAP
To the Board of Directors and Shareholders of BCE Inc.
We have audited the consolidated financial statements of BCE Inc. and subsidiaries (the “Company”) as at December 31, 2009 and 2008 and for each of the three years in the period ended December 31, 2009, and the Company’s internal control over financial reporting as of December 31, 2009, and have issued our reports thereon dated March 11, 2010; such consolidated financial statements and reports are contained in Exhibit 99.2 and Exhibit 99.3 of Form 40-F. Our audits also included the reconciliation from Canadian GAAP to United States GAAP of the Company contained in Exhibit 99.5 of Form 40-F. This reconciliation from Canadian GAAP to United States GAAP is the responsibility of the Company’s management. Our responsibility is to express an opinion based on our audits. In our opinion, such reconciliation from Canadian GAAP to United States GAAP, when considered in relation to the basic consolidated financial statements taken as a whole, presents fairly, in all material respects, the information set forth therein.
As disclosed in note (p) to the reconciliation from Canadian GAAP to United States GAAP, the Company changed its method of accounting for business combinations and non-controlling interests effective January 1, 2009.
(signed) Deloitte & Touche LLP1
Independent Registered Chartered Accountants
Montréal, Canada March 11, 2010
1 Chartered accountant auditor permit no 13633

Exhibit 99.31
CERTIFICATIONS
CERTIFICATIONS
I, George A. Cope, certify that: 1. I have reviewed this annual report on Form 40-F of BCE Inc.;
2. Based on my knowledge, this report does not contain any untrue statement of a material fact or omit to state a material fact necessary to make the statements made, in light of the
circumstances under which such statements were made, not misleading with respect to the period covered by this report;
3. Based on my knowledge, the financial statements, and other financial information included in this report, fairly present in all material respects the financial condition, results of operations and cash flows of the issuer as of, and for, the periods presented in this report;
4. The issuer’s other certifying officer(s) and I are responsible for establishing and maintaining disclosure controls and procedures (as defined in Exchange Act Rules 13a-15(e) and 15d-15(e)) and internal control over financial reporting (as defined in Exchange Act Rules 13a-15(f) and 15d-15(f)) for the issuer and have:
(a) Designed such disclosure controls and procedures, or caused such disclosure controls and procedures to be designed under our supervision, to ensure that material information relating to the issuer, including its consolidated subsidiaries, is made known to us by others within those entities, particularly during the period in which this report is being prepared;
(b) Designed such internal control over financial reporting, or caused such internal control over financial reporting to be designed under our supervision, to provide reasonable assurance regarding the reliability of financial reporting and the preparation of financial statements for external purposes in accordance with generally accepted accounting principles;
(c) Evaluated the effectiveness of the issuer’s disclosure controls and procedures and presented in this report our conclusions about the effectiveness of the disclosure controls and procedures, as of the end of the period covered by this report based on such evaluation; and
(d) Disclosed in this report any change in the issuer’s internal control over financial reporting that occurred during the period covered by the annual report that has materially affected, or is reasonably likely to materially affect, the issuer’s internal control over financial reporting; and
5. The issuer’s other certifying officer(s) and I have disclosed, based on our most recent evaluation of internal control over financial reporting, to the issuer’s auditors and the audit committee of the issuer’s board of directors (or persons performing the equivalent functions):
(a) All significant deficiencies and material weaknesses in the design or operation of internal control over financial reporting which are reasonably likely to adversely affect the issuer’s ability to record, process, summarize and report financial information; and
(b) Any fraud, whether or not material, that involves management or other employees who have a significant role in the issuer’s internal control over financial reporting.
Date: March 17, 2010
(signed) George A. Cope George A. Cope President and Chief Executive Officer BCE Inc.
I, Siim A. Vanaselja, certify that: 1. I have reviewed this annual report on Form 40-F of BCE Inc.;
2. Based on my knowledge, this report does not contain any untrue statement of a material fact or omit to state a material fact necessary to make the statements made, in light of the
circumstances under which such statements were made, not misleading with respect to the period covered by this report;
3. Based on my knowledge, the financial statements, and other financial information included in this report, fairly present in all material respects the financial condition, results of operations and cash flows of the issuer as of, and for, the periods presented in this report;
4. The issuer’s other certifying officer(s) and I are responsible for establishing and maintaining disclosure controls and procedures (as defined in Exchange Act Rules 13a-15(e) and 15d-15(e)) and internal control over financial reporting (as defined in Exchange Act Rules 13a-15(f) and 15d-15(f)) for the issuer and have:
(a) Designed such disclosure controls and procedures, or caused such disclosure controls and procedures to be designed under our supervision, to ensure that material information relating to the issuer, including its consolidated subsidiaries, is made known to us by others within those entities, particularly during the period in which this report is being prepared;
(b) Designed such internal control over financial reporting, or caused such internal control over financial reporting to be designed under our supervision, to provide reasonable assurance regarding the reliability of financial reporting and the preparation of financial statements for external purposes in accordance with generally accepted accounting principles;
(c) Evaluated the effectiveness of the issuer’s disclosure controls and procedures and presented in this report our conclusions about the effectiveness of the disclosure controls and procedures, as of the end of the period covered by this report based on such evaluation; and
(d) Disclosed in this report any change in the issuer’s internal control over financial reporting that occurred during the period covered by the annual report that has materially affected, or is reasonably likely to materially affect, the issuer’s internal control over financial reporting; and
5. The issuer’s other certifying officer(s) and I have disclosed, based on our most recent evaluation of internal control over financial reporting, to the issuer’s auditors and the audit committee of the issuer’s board of directors (or persons performing the equivalent functions):
(a) All significant deficiencies and material weaknesses in the design or operation of internal control over financial reporting which are reasonably likely to adversely affect the issuer’s ability to record, process, summarize and report financial information; and

(b) Any fraud, whether or not material, that involves management or other employees who have a significant role in the issuer’s internal control over financial reporting.
Date: March 17, 2010
(signed) Siim A. Vanaselja Siim A. Vanaselja Executive Vice-President and Chief Financial Officer BCE Inc.

Exhibit 99.32
CERTIFICATION PURSUANT TO 18 U.S.C. SECTION 1350, AS ADOPTED PURSUANT TO SECTION 906 OF THE SARBANES-OXLEY ACT OF 2002
Pursuant to Section 1350 of Chapter 63 of Title 18 of the United States Code (18 U.S.C. Section 1350), as adopted pursuant to Section 906 of the Sarbanes-Oxley Act of 2002, each of the undersigned officers of BCE Inc. (the “Company”), does hereby certify that:
the annual report on Form 40-F for the year ended December 31, 2009 of the Company (the “Form 40-F”) fully complies with the requirements of Section 13(a) or 15(d) of the Securities Exchange Act of 1934 and the information contained in the Form 40-F fairly presents, in all material respects, the financial condition and results of operations of the Company.
Date: March 17, 2010 (signed) George A. Cope
George A. Cope President and Chief Executive Officer BCE Inc.
Date: March 17, 2010 (signed) Siim A. Vanaselja
Siim A. Vanaselja Executive Vice-President and Chief Financial Officer BCE Inc.