Embed Size (px)
Citation preview


CTI Journal, Vol. 31, No. 1 1
The CTI Journal(ISSN: 0273-3250)
PUBLISHED SEMI-ANNUALLYCopyright 2010 by The CoolingTechnology Institute, PO Box 73383,Houston, TX 77273. Periodicalspostage paid at FORT WORTH, Texas.
MISSION STATEMENTIt is CTI’s objective to: 1) Maintain andexpand a broad base membership ofindividuals and organizationsinterested in Evaporative HeatTransfer Systems (EHTS), 2) Identifyand address emerging and evolvingissues concerning EHTS, 3) Encour-age and support educationalprograms in various formats toenhance the capabilities andcompetence of the industry to realizethe maximum benefit of EHTS, 4)Encourge and support cooperativeresearch to improve EHTS Technologyand efficiency for the long-termbenefit of the environment, 5) Assureacceptable minimum quality levelsand performance of EHTS and theircomponents by establishing standardspecifications, guidelines, andcertification programs, 6) Establishstandard testing and performanceanalysis systems and prcedures forEHTS, 7) Communicate with andinfluence governmental entitiesregarding the environmentallyresponsible technologies, benefits,and issues associated with EHTS, and8) Encourage and support forums andmethods for exchanging technicalinformation on EHTS.
LETTERS/MANUSCRIPTSLetters to the editor and manuscriptsfor publication should be sent to: TheCooling Technology Institute, PO Box73383, Houston, TX 77273.
SUBSCRIPTIONSThe CTI Journal is published inJanuary and June. Complimentarysubscriptions mailed to individuals inthe USA. Library subscriptions $45/yr.Subscriptions mailed to individualsoutside the USA are $45/yr.
CHANGE OF ADDRESSRequest must be received atsubscription office eight weeks beforeeffective date. Send both old and newaddresses for the change. You mayfax your change to 281.537.1721 oremail: [email protected].
PUBLICATION DISCLAIMERCTI has compiled this publicationwith care, but CTI has not Investi-gated, and CTI expressly disclaimsany duty to investigate, any product,service process, procedure, design,or the like that may be describedherein. The appearance of anytechnical data, editorial material, oradvertisement in this publicationdoes not constitute endorsement,warranty, or guarantee by CTI of anyproduct, service process, procedure,design, or the like. CTI does notwarranty that the information in thispublication is free of errors, and CTIdoes not necessarily agree with anystatement or opinion in thispublication. The entire risk of the useof any information in this publicationis assumed by the user. Copyright2010 by the CTI Journal. All rightsreserved.
ContentsFeature Articles8 An Integrated Approach to Water Reuse
Peter Elliott and Gary Geiger30 Cooling Towers, Drift and Legionellosis
Thomas Bugler, Barry Fields and Richard D. Miller
48 Safely Stopping, Holding and Locking Out Cooling TowerMechanical SetsDuane Byerly
54 Florida Building Code Structural Requirements forEvaporative Cooling EquipmentGreg Hentschell and Mark Speckin
62 A Digital Method for Analyzing Droplets on SensitivePaperDudley Benton
72 A Systematic Review of Biocides Used in Cooling TowerFor Prevention and Control of Legionella spp.ContaminationKelly Rangel
Special Sections80 CTI Licensed Testing Agencies81 CTI Certified Cooling Towers86 CTI ToolKit
Departments02 Meeting Calendar02 Multi Agency Press Release04 View From the Tower04 President Elect06 Editor’s Corner
see.......page 16
see.......page 50see.......page 66

CTI Journal, Vol. 31, No. 12
CTI JournalThe Official Publication of The Cooling Technology Institute
Vol. 31 No.1 Winter 2010
Journal CommitteePaul Lindahl, Editor-in-ChiefArt Brunn, Sr. EditorVirginia Manser, Managing Editor/Adv. ManagerDonna Jones, Administrative AssistantGraphics by Sarita Graphics
Board of DirectorsDennis P. Shea, PresidentJess Seawell, Vice President / President ElectFrank L. Michell, SecretaryRandy White, TreasurerJon Bickford, DirectorHelen Cerra, DirectorTim Facius, DirectorGary Geiger, DirectorChris Lazenby, DirectorKen Mortensen, Director
Address all communications to:Virginia A. Manser, CTI AdministratorCooling Technology InstitutePO Box 73383Houston, Texas 77273281.583.4087281.537.1721 (Fax)
Internet Address:http://www.cti.org
E-mail:[email protected]
FUTURE MEETING DATESCommittee AnnualWorkshop Conference
July 11-15, 2010 February 6-10, 2011Marriott Albuquerque Pyramid N Westin Riverwalk
Albuquerque, NM San Antonio, TXJuly 17-20, 2011 February 5-9, 2012
Amelia Island Plantation Hilton HotelAmelia Island, FL Houston, TX
REDWOOD
DOUGLAS FIR24 Hour Service on Your Lumber and Plywood Requirements
Redwood Lumber • Douglas Fir Lumber & Plywood • • • • • Fiberglass DeckingFiberglass Structural Components ••••• Corrugated Fiberglass Panels ••••• 24 Hour Service
GAIENNIE LUMBERCOMPANY
BOX 1240 • OPELOUSAS, LA 70571-1240800-326-4050 • 337-948-3067 • 337-948-3069 (FAX) Member
Press ReleaseContact: Chairman, CTI Multi-Agency Testing Committee
Houston, Texas 2-November-2009
Cooling Technology Institute, PO Box 73383, Houston, Texas77273 - The Cooling Technology Institute announces its annualinvitation for interested thermal testing agencies to apply forpotential Licensing as CTI Thermal Testing Agencies. CTI providesan independent third party thermal testing program to service theindustry. Interested agencies are required to declare their interestby March 1, 2010, at the CTI address listed.

CTI Journal, Vol. 31, No. 1 3

CTI Journal, Vol. 31, No. 14
View From The Tower
Denny SheaPresident
EDITORIAL: MODERNIZATION OF CTI
I want to bring you a glimpse of what the Future ofCTI holds. The current economic trends seem tobe against “Technical Organizations.” The oldquestion of “what’s in it for us” is asked more andmore by corporate managers.The answer to these questions is very simple. Thevalue of a Technical Organization is INFORMA-TION. We live in the age of quick available infor-
We are exploring ways to bring our Annual Con-ference to a worldwide audience via videoconferencing and webinars. We hope that these newfeatures will be of benefit to our membership and cool-ing tower industry as a whole.We are assembling the most “Frequently Asked Ques-tions” that are sent to CTI’s “Ask The Expert” websiteso they can be included available on-line.Our technical committee’s agendas, meeting minutesand master document lists will be made available on-line; so that, everyone can see what CTI technical
committees and tasks groups are working on. We hope to encour-age as many technical experts as possible to become new memberswho can assist in the work of improving existing standards anddeveloping new standards and guidelines.Technology is changing everyday; your CTI is changing to meetthe needs of the membership. We invite you to send all email in-quires or suggestions to Virginia Manser, CTI Administrator [email protected]. The CTI Administrator will make sure that youremails get to the appropriate person.I wish to thank the CTI Staff, Board of Directors and CTI Member-ship for my two years as your President. I hope that I can continueto be of service to CTI in future.Yours truly,Denny SheaCTI President 2008-2009
mation acquisition. Everyday, we seek information on manydifferent subjects via the internet. The Cooling TechnologyInstitute is all about providing information to our member-ship and general public. We have no other product. It is withthis thought in mind that the Board of Directors along withmany of our member volunteers and CTI staff are develop-ing plans for improvements in the way CTI provides accessto the information that has been accumulated over the last60 years.In the future, we plan to improve our website so that ourmembership can have better access to the wealth of infor-mation that exists in CTI Standards, Guidelines TechnicalPapers and Technical Experts.
Jess Seawell’s career spans over a 29 year periodin the cooling tower industry. He has over 32 yearsengineering and manufacturing experience withcomposite structures. He was one of the foundingpartners of Composite Cooling Solutions and heldthe position of President and CEO from its beginninguntil his semi-retirement in mid 2008. Seawellremains with the company as a partner andconsulting capacity.He has held positions at the executive level inengineering, operations, and marketing while at the
presented numerous articles and related technicalpublications to the cooling tower and powerindustries.Jess Seawell is presently Vice President of theCooling Technologies Institute (CTI) and has heldthe role of Committee Chairman on “Fire RetardantConstruction of Cooling Towers”, Vice Chairmanof CTI Committee on “FRP Tower StructuralDesign”, and is a Voting Member of NFPA-214and a Past ASME East TN Section Chairman.
CTI’s President Elect for 2010 & 2011
former Ceramic Cooling Tower Corporation. Seawell holdsmultiple patents in the structural and mechanical design ofcooling towers. Seawell is considered an industry technicalexpert on composite materials and their application to coolingtowers as well as the leading industry consultant for FMApproval as applied to cooling tower design. Seawell has
Mr. Seawell received a Bachelor of Science degree inMechanical Engineering from Vanderbilt University and is alicensed Professional Engineer in the State of Texas.Seawell presently resides in Granbury Texas.
Jess Seawell

CTI Journal, Vol. 31, No. 1 5

CTI Journal, Vol. 31, No. 16
Editor’s Corner
Paul LindahlEditor-In-Chief
Dear Reader,
As this letter is being written, a great deal of changeis in the air. The major changes in the global pic-ture are beyond the scope of this letter (and thegrasp of this writer). In our corner of global indus-try, and in our Cooling Technology Institute orga-nization there are some changes worthy of note.For the millennium (remember the Y2K hoopla?),Toby Daley, a past CTI President, led the move tochange the “T” in the name of CTI from tower totechnology. It was a clairvoyant move. In theyears since that change, the emergence of aircooled condensers for the power market has been
CTI thermal certification has seen dramatic growth,transforming from a US centric program to a globalprogram with reach across multiple Asian countries,the US and Mexico, and Europe. Cooperation withEurovent is in process for thermal certification aswell, which could introduce a new level in Europe.Our organization has weathered, so far, the challeng-ing economics of the last year and a half. We antici-pate that this will continue. A new CTI President,Jess Seawell, will take office at the Annual Meetingin February. Jess will be the third President to holdoffice since the structure of the Board and the office
amazing. It is an area in which the technical papers presented atCTI and the new thermal test code for ACC’s contribute anongoing benefit to the industry.
of the President were changed to enable a 2 year term for the Presi-dent. Jim Baker and Denny Shea have contributed two years eachto the good of CTI as the first leaders under the new system. Most
seem to agree that this has fostered stabilityand enhanced the ability for the President toengage in leading and sustaining progresswithin the organization. What do you think?We have many challenges ahead, but a greatdeal of energy is evident in the leadership ofthe organization. We should have confidencethat progress will continue as we include newgenerations of leaders from our industry andlook to ensure the long term viability of ourCooling Technology Institute organization.
Respectfully,
Paul LindahlCTI Journal Editor

CTI Journal, Vol. 31, No. 1 7

CTI Journal, Vol. 31, No. 18
AbstractLimited water resources combinedwith wastewater discharge con-cerns have made water reuse agrowing focus of industry. Indus-trial cooling towers have long beenseen as an ideal repository forwastewater because of the largevolumes of water necessary forevaporative cooling. However, the
An Integrated Approach to Water Reuse
bition. The soluble phos-phate is adjusted based onthe corrosion program andthe cycles of concentra-tion at the cooling towers.Water exiting the pondtypically contains 30-100ppm COD and 10 ppm sus-pended solids.The most significant chal-lenge the reuse waterposes to the cooling wa-ter systems is biological.The high levels of CODand the presence of ammo-
Peter Elliott, Gary GeigerGE Water & ProcessTechnologies4636 Somerton Road,Trevose, PA 19053
use of wastewater as a source of cooling tower makeup water canresult in significant corrosion, deposition and biological foulingissues. To address these issues at a major corn processing plant,a creative combination of mechanical and chemical approaches wasemployed to make a process wastewater suitable for use as coolingtower makeup water. This paper will discuss both the approach tothe wastewater pretreatment and the chemical treatment used at thecooling tower.
IntroductionA major corn refining facility implemented a water reuse scheme inresponse to periodic drought conditions and increasing water re-quirements due to plant expansions. Over the past eight years thecooling tower makeup water requirements increased from 3.4 to 8.6million gallons per day. The site utilizes three large, cross flowcooling towers to meet their process cooling needs. The totalcirculation rate of the towers is 295,000 gpm. All of the coolingtowers have splash fill and an open distribution deck. Coolingtower blowdown is sent to a municipal waste treatment facility. Thecooling tower makeup water is a combination process wastewater,well water and municipal (potable) water. The majority of the cool-ing tower makeup water (>80%) is composed of treated processwastewater. Table 1 provides a relative indication of the composi-tion of the various water sources. The composition of the pondwater varies with production rates and drought conditions.Primary treatment of the process wastewater occurs in a 25-acrepond having a volume of 160-180 million gallons. The pond servesas an equilibration facility to allow particulate solids to settle andprocess organics to be biologically degraded. Process water enter-ing the pond contains 200-300 ppm COD from a variety of organicmaterials including fructose, alcohols, amino acids and starch.Additionally, the ammonia concentration can range from 2 – 25 ppmand the inorganic phosphate level from 3-40 ppm (primarily ortho-phosphate). A dissolved air flotation (DAF) system is used tofurther reduce the organic matter and facilitate additional solidsremoval. Inorganic phosphate is removed by precipitation withalum (aluminum sulfate). Alum is fed manually such that a pre-scribed level of soluble phosphate remains for steel corrosion inhi-
nia and phosphate make the cycled cooling water an ideal environ-ment for biological growth. Biological activity has been directlyand indirectly responsible for corrosion failures of process heatexchangers. Microbiologically influenced corrosion (MIC) hascontributed to stainless steel plate and frame heat exchanger fail-ures and extensive deterioration of mild steel distribution piping.The high organic loading and biological activity at the coolingsystems, combined with additional organic and ammonia contami-nation from process leaks, require the use of significant levels of achlorine-based oxidizing agent. This has contributed to high chlo-ride concentrations that have resulted in chloride-induced pittingof stainless steel.The process coolers of all three cooling water systems are primarilyplate and frame exchangers with 316L stainless steel plates. Theexit water temperature of critical equipment can reach 160O F. Verylittle carbon steel or copper alloys are present in the systems.The composition of the makeup water varies with production loadsand fresh water availability.
Evolution of the Water Reuse SchemePhase 1 - Initial ApproachMakeup Water TreatmentCooling tower makeup water was primarily composed of pond wa-ter and of city water. The makeup water was treated with up to 400pounds per day of ozone and a bleach/sodium bromide combina-tion that provided 8-9 ppm mixed oxidant (HOCl/HOBr), as ppm Cl2.The ozone/halogen combination was used to reduce the COD load-ing at the cooling towers and achieve some level of biological con-trol. Ozone was chosen because it is a strong oxidizing agentcapable of rapidly destroying organic compounds. However, theozone was only capable of oxidizing a small percentage of the 900+pounds per day of COD entering the cooling system with the makeupwater. Bromine chemistry was included because of the presence ofammonia in the pond water. Unlike chlorine, bromine retains itbiological control capabilities in the presence of ammonia. Theozone, bleach, sodium bromide program was able to achieve 0.2 –0.5 ppm total oxidant, as Cl2, in the cooling tower makeup water.
Gary GeigerPeter Elliott

CTI Journal, Vol. 31, No. 1 9

CTI Journal, Vol. 31, No. 110
Cooling Tower Treatment ProgramTwo biological approaches were employed at the cooling towers.The smallest of the cooling towers (60,000 gpm recirculation rate)used a combination of ozone, up to 200 pounds per day, and ableach/sodium bromide combination. The mole ratio of the combi-nation was such that 25% of the tolal halogen was HOBr. Thecontrol range for the total oxidant was 0.5 – 1.0 ppm, as Cl2. Themicrobiological treatment program for the remaining two coolingtower systems consisted exclusively of chlorine dioxide (ClO2).Originally, chlorine dioxide was generated using chlorine gas and a25% solution of sodium chlorite as precursors. This later evolvedinto using the three-precursor combination of liquid bleach (10-12% NaOCl), and sulfuric acid (98%) and 25% sodium chlorite solu-tion. In either case, the plant required chlorine dioxide generationsystems capable of supplying 900,000 lbs per year (~103 lbs perhour) to the cooling water systems. Excess chlorine (bleach orgas) was fed to ensure a high ClO2 yield. The total halogen controlrange was >0.5 ppm, as Cl2. During upset conditions (COD valuesexceeding 250 ppm) supplemental chlorine bleach and non-oxidiz-ing biocide were added. The pH of the cooling systems was con-trolled in the 6.8 – 7.4 range to maximize the oxidizing power of thefree chlorine. Additionally, neutral pH operation, in combinationwith a calcium phosphate polymer dispersant, allowed high levelsof inorganic phosphate and zinc to be utilized for steel corrosioncontrol.The use of bleach or chlorine gas in the generation of bromine andchlorine dioxide introduces considerable levels of chloride; espe-cially when used to respond to process leaks. Bleach is an equalmolar combination of chloride ion (present as NaCl) and hypochlo-rite (present as NaOCl). Chlorine gas dissociates to an equal molarcombination of hydrochloric acid (HCl) and hypochlorous acid(HOCl).The chloride concentration of the cooling water is critical whenstainless steel alloys are present. Rapid failure of process equip-ment can occur from chloride-induced pitting. The chloride ion iscapable of penetrating and destroying the naturally occurring pro-tective passive oxide film on stainless steel surfaces. Once a voidin the film occurs, corrosion will proceed, unless the film reestab-lishes itself. The most significant factors affecting the pitting po-tential are the chloride concentration and surface temperature. Aswith any noble metal, the surface must be kept free of deposits toprevent the formation of oxygen differential cells. Deposits restrictthe access of oxygen to the metal surface, which is necessary topreserve the naturally occurring passive oxide. As corrosion be-gins, the oxygen-rich area adjacent to the deposit serves as thecathode generating hydroxide ions resulting from the reaction ofoxygen and electrons. As corrosion proceeds, metal ions are gen-erated under the deposit (at the anode), creating a net positiveelectrical charge. The coulombic attractions cause chloride ions topreferentially migrate through the deposit to neutralize the charge.As the chloride ions accumulate under the deposit, acidic metalchlorides are formed that further accelerate corrosion.Performance/ResultsThe microbiological control program at all three cooling towers wasnot sufficient to prevent biofouling of heat transfer surfaces orMIC of carbon steel distribution piping. High levels of supplemen-tal chlorine were applied during process leaks, but were not suffi-
cient to prevent biological growth. Slime deposits retarded theheat transfer efficiency of process equipment, making frequentcleanings necessary. Algae mats formed on the cooling tower decks,which served as a constant source of anaerobic bacteria. Thefailure of the programs was attributed to the high organic matter(COD) of the cycled makeup water and the additional organic con-taminants encountered during process leaks. The organic matterprovided the food source for microbial growth and consumed halo-gen, particularly chlorine.Numerous corrosion failures of the 316L stainless steel plate andframe exchangers occurred due to chloride-induced pitting, under-deposit corrosion and manganese induced corrosion. Chloridelevels in excess of 700 ppm could be encountered during upsetconditions. The high chloride levels were a result of the halogenprograms and the supplemental chlorine (bleach) added during pro-cess leaks. Cycles of concentration were maintained at 3 to mini-mize the chloride contribution from the makeup water. Under-de-posit corrosion was primarily due to biological fouling and accu-mulations of particulate matter. Manganese induced corrosion wasattributed to low levels of soluble manganese (Mn+2) in the makeupwater that was not oxidized by ozone or halogen. The source of themanganese was the well water that is added to the makeup waterstream. Stainless steel catalyzes the air oxidation of Mn+2 to in-soluble MnO2 at the metal surface. In the presence of chlorine,MnO2 can oxidize to form permanganate that will pit stainless steel.
Phase 2 - Improvement in Makeup WaterPretreatmentMakeup Water TreatmentThe use of hollow fiber ultrafiltration (UF) was employed to reducethe COD of the makeup water and hence the oxidant demand at thecooling towers. Reducing the COD would diminish the demand forchlorine and chlorine dioxide. This in turn would improve micro-biological control at the cooling tower and reduce the chloride levelin the cooling water.With the development of submerged hollow fiber membranes, thenext generation of advanced purification technologies in water andwastewater treatment became a reality. Instead of clarification pondsto settle solids from the purified water stream and relying on grav-ity for solids/liquid separation – a technology that was developedmore than 100 years ago to ensure safe drinking water treatmentand proper sanitation – today’s membranes ensure that all contami-nants of a specific diameter (0.04 mm) or larger, are removed fromthe purified effluent.Membranes are based on filtration methods found throughout na-ture. The membranes employed at this facility consist of hollowpolymer fibers with billions of microscopic pores on the surface.The pores are much smaller in size than common contaminants, likebacteria and viruses. This physical barrier only allows visibly cleanwater to pass through while rejecting multiple impurities— guaran-teeing an exceptional water quality and clarity on a continuousbasis. In this application, a slight vacuum is applied, drawing waterinto the membrane fiber and consequently filtering out the vastmajority of impurities. The working principle is demonstrated inFigures 1 and 2.The advanced hollow fiber UF membrane in use at this facility wasextremely effective at removing all of the visible impurities con-

CTI Journal, Vol. 31, No. 1 11

CTI Journal, Vol. 31, No. 112
tained in the process-generated wastewater. COD levels werereduced from greater than 50 ppm in the pond water to10 ppm. Theimprovement in water clarity is clearly evident in Figure 3.The UF filtration system is downstream of the alum injection point.Permeate is collected in a makeup storage tank along with raw pondwater, well water and city water. The inclusion of raw pond wasnecessary because the UF system was not large enough to meetthe cooling makeup water demands. The use of raw pond water aspartial cooling tower makeup causes the blended water to haveCOD levels greater than 10 ppm. The water blend was subse-quently treated with ozone and bleach/sodium bromide as detailedin Phase 1 before going to the cooling towers.Cooling Tower TreatmentThe corrosion and biological control programs did not change afterinclusion of the UF permeate. The small cooling tower continuedto use ozone and bleach/NaBr and the other two towers continuedwith chlorine dioxide. Supplemental bleach and non-oxidizing bio-cide were added during upset conditions when process leaks causedthe COD to exceed 250 ppm. The pH of the cooling water wascontrolled at 6.8 –7.4, and zinc/phosphate was applied for carbonsteel corrosion protection. For the most part, cycles were main-tained at 3, unless the chloride concentration exceeded 400 ppm. Achloride maximum of 400 ppm was chosen in an attempt to minimizepitting of stainless steel.Performance/ResultsReducing the COD at the cooling towers greatly improved biologi-cal control. Biological fouling diminished along with MIC. Highlevels of halogen were still required when process leaks occurred.This increased the chloride levels above the 400 ppm limit andrequired a reduction in cycles of concentration. During periods ofhigh process contamination the 400 ppm chloride limit was exceeded.Chloride concentrations of 650-800 ppm were recorded in each cool-ing tower at various isolated times.Although biological control improved and fouling greatly dimin-ished, chloride-induced pitting of stainless steel was not reduced.The failure rate of the stainless steel plate and frame exchangersremained virtually unchanged.
Phase 3 - Chloride ReductionMakeup Water TreatmentThe cooling tower supply water disinfection program was changedfrom bleach/sodium bromide to chlorine dioxide in an effort to re-duce the chloride level at the cooling towers. Ozonation was dis-continued because of cost/maintenance issues. The main sourceof organic contamination at the cooling towers was from processleaks. Chlorine dioxide was chosen because of its relative inactiv-ity with organic components, and because its disinfection proper-ties are not compromised by the presence of ammonia.Chlorine dioxide was generated electrochemically with a highlyconcentrated sodium chlorite solution. The electrochemical methodeliminated the need to adjust multiple chlorine dioxide precursorsto ensure maximum yield. The chemical reaction proceeds accord-ing to:2NaClO2 + 2H2O → 2ClO2 + 2NaOH + H2 (1)The key to this strategy is the dosing point in the system. The highcapacity electrochemical chlorine dioxide generator was able to
produce up to 100 lbs. of chlorine dioxide per day. The chlorinedioxide was injected directly into the pond water makeup/reuseheader supplying the process cooling towers. This was reasonedas a way to effectively disinfect the makeup water stream that wasinoculating the cooling water. Ultimately, this would reduce thehalogen requirements and the chloride levels at the cooling towers.The feed point was later relocated to the makeup water tank, whichis the repository for the hollow-fiber UF permeate, direct pond wa-ter bypass, well, and city water. This dosing point change providedfor a greater contact time with the composite makeup water prior toentry into the cooling water system. Typical ClO2 residual range inthe makeup water was 0.2-1.0 ppm. The entire wastewater pretreat-ment and cooling water systems appear as Figures 4(a) and 4(b),respectively.Cooling Tower TreatmentFor years, the standard method of chlorine dioxide generation re-quired the use of precursor combinations of either chlorine gasreacted with sodium chlorite, or using liquid bleach, and reacting itwith a strong acid (hydrochloric or sulfuric) and then taking thatintermediate product and reacting it with sodium chlorite in theconfines of the chlorine dioxide generator. (See equations 1-3 be-low.)Cl2 (gas) + 2NaClO2 → 2ClO2 (gas) + 2NaCl (2)
-Or-NaOCl + 2HCl → Cl2 + NaCl + H2O (3)2NaClO2 + Cl2 → 2ClO2 + 2NaCl(4)In an effort to eliminate as many hazardous precursors as possibleand reduce the chloride contribution from the chlorine source, asignificantly different means of chlorine dioxide generation wasimplemented. This method employs the use of a unique set ofprecursor chemicals that essentially eliminates one of the needs forchlorine (gas/bleach).One set of generators is the main source of chlorine dioxide feed tothe process cooling towers. This generation system employs asodium chlorate/hydrogen peroxide solution in combination withsulfuric acid. This unique chlorine dioxide generation chemistry isshown by the following reaction:[NaClO3 + H2O2] + H2SO4 → ClO2 + O2 + Na2SO4 + H2O (5)Figure 5 is a schematic of this system that currently acts as theprincipal source of chlorine dioxide to each of the process coolingtowers.In attempting to maintain the new, higher level of performance withrespect to cooling system surface cleanliness, the new generationmethod was set to produce higher levels of chlorine dioxide. Thechlorine dioxide generator serving two of the cooling towers wasset to produce 30-110 lbs/hour. The unit dedicated to the thirdcooling tower had its output increased to 40-130 lbs/hour. The newgenerators increased the average chlorine dioxide capability from103 lbs./hour to 155 lbs./hour. The target residual range for ClO2 inthe cooling towers was set at 0.5-1.0 ppm. The use of ozone andbleach/sodium bromide at the small cooling tower was discontin-ued. Supplemental sodium hypochlorite is fed on a relatively infre-quent basis, during process upsets as previously discussed.

CTI Journal, Vol. 31, No. 1 13

CTI Journal, Vol. 31, No. 114
Performance/ResultsThe change in the disinfection method and the new chemistry em-ployed for generating chlorine dioxide reduced the chloride levelsat the cooling towers (Figure 6), without sacrificing microbiologicalcontrol. The lower chloride concentration allowed the cooling wa-ter cycles of concentration to be increased from 3 to 4 withoutnegatively impacting the integrity of the stainless steel processequipment. Figure 7 summarizes the two years of operation with thenew treatment protocol. The frequency of corrosion failures hasdeclined since the new treatment protocol was implemented. How-ever, the success of the program cannot be conclusively assesseduntil the life (failure rate) of newly installed equipment is deter-mined. Many of the failures currently encountered may be a resultthe condition that existed in the past.Total water savings associated with increasing cycles of concen-tration by one (from 3 to 4) amounted to almost 358 million gallonsper year (980,000 gallons/day), significantly reducing the municipalwater treatment charges. See Figure 8 for the relationship betweencycles of concentration and blowdown rate.Corrosion and Scale ControlIn addition to the microbiological treatment involving chlorine di-oxide, the areas of corrosion and deposition must also be addressedto ensure full asset protection and operational efficiency is main-tained. In order to fully complement the mechanical pretreatment ofthe reuse water employed as cooling tower makeup, a strong chemi-cal water treatment strategy would be required to meet the highstress condition posed by the reuse water. To preclude seriousscaling conditions associated with calcium carbonate and calciumphosphate, the cooling water was maintained at a relatively neutralpH of 6.8-7.5. High pH conditions coupled with the elevated skintemperatures present in the system’s process heat exchangers,would pose a serious scaling threat, in light of the retrograde solu-bility associated with calcium carbonate and calcium phosphate.As is the case many times in industrial water treatment, when therisks in one direction are minimized, different risks can, and nor-mally do surface in the other direction. High temperature, neutralpH water, high conductivity and chlorides, increase the potentialfor corrosion, both general and localized (pitting/crevice corrosion).Therefore, it was imperative to design a chemical treatment pro-gram to address this potentially high corrosion potential using acombination of effective agents.In consideration of this stressful water environment, the followingoperating parameter ranges were set for the process cooling sys-tems:
· Calcium hardness 400-800 ppm, as CaCO3
· pH 6.8 – 7.5· Chloride 400 ppm, as Cl- (maximum)· Conductivity 4,000 – 5,500 mmhos/cm· Ortho-PO4 15 - 40 ppm, as PO4
· LSI 0.15 – 1.0Orthophosphate was used for carbon steel corrosion protectionand dosed at such a rate to induce the formation of a passive oxidefilm. There already was a ready supply of phosphate present in themakeup/reuse water generated as process wastewater. The chal-lenge in this case was to dose the proper amount of alum prior tothe UF hollow-fiber membrane inlet in order to precipitate a portion,but have some remain soluble. The soluble phosphate would thencycle at the cooling towers, providing a sufficient concentrationfor carbon steel corrosion protection. The filtered orthophosphate
levels charted over the past 2.5 years appear as Figure 9. Addition-ally, a complete phosphate profile is routinely performed across theentire system (Reuse Water Collection Tank, to the Process Waste-water Settling Pond, to the inlet and outlet of the UF hollow fibermembrane, and finally the discharge of the cooling tower makeuptank). This practice helps to accurately monitor phosphate levelsthroughout the entire system, in order to properly control alumfeed, which is ultimately regulating orthophosphate levels in thecooling towers. Wide variation in soluble phosphate in the treatedreuse water was experienced because alum feed was not automated.To complete the mild steel corrosion package, and provide the ad-ditional protection of cathodic corrosion inhibition for mild steel,zinc was fed at a low concentration 1-2 ppm. Just recently, zinc hasbeen removed from the chemical treatment program due to dis-charge limitations imposed by the municipal water treatment plant.With a relatively high concentration of phosphate and additionalzinc (when used), maintaining inhibitor solubility becomes crucialto maintaining both corrosion and deposition control. A halogenstable, sulfonated copolymer was applied for scale control. Thepolymer dosage was adjusted based on the calcium phosphatesaturation of the cooling water. Therefore, the key component ofthis particular treatment regimen becomes the polymeric dispers-ant. The copolymer effectively prevented scaling of hot processequipment even when the inorganic phosphate concentrationreached 40 ppm. The results of the corrosion treatment program areevidenced by the mild steel corrosion rates from each cooling tower.These results are highly respectable considering the elevated con-ductivity levels encountered with the increase in cycles of concen-tration achieved. This corrosion data is charted and shown asFigure 10. Corrosion rates of 316L stainless steel were essentiallyzero and did not give any indication of the pitting corrosion experi-enced with the process equipment.
Conclusions1. Proper pretreatment of process water is essential to the
successful use as cooling tower makeup water.2. Hollow fiber ultrafiltration is capable of removing particu-
late matter, microbiological organisms, and most organicscomponents that contribute to COD, but not inorganic ionssuch as orthophosphate and manganese.
3. Chloride ions are extremely detrimental to the integrity ofheat exchanger components, principally 316L stainless steelplates. When critical levels are exceeded, severe pittingand crevice corrosion of these plates will occur.
4. Chlorine dioxide, produced with the sodium chlorate/hy-drogen peroxide combination will limit chloride inventory,compared to conventional methods using chlorine gas orbleach with acid.
5. Chlorine dioxide is a very effective biocide in waters con-taminated with process organics and/or ammonia, as it is aselective oxidant and will not react with these types ofcontaminants.
6. Effective deposition control requires a polymeric dispers-ant capable of preventing calcium phosphate formationover a wide range of super-saturations.
References1. CTI (1993), Application of Oxidizing Biocides, Houston,
TX, pp. 12-14.2. PureLine Technical Presentation (2006).3. Alfa-Laval Company, Drawing Ref. No. T9-L 8701-33.

CTI Journal, Vol. 31, No. 1 15

CTI Journal, Vol. 31, No. 116
Table 1. Cooling Tower Makeup Water Composition Profile
Membrane Fiber : Electron microscope view of membrane surface
Figure 1: Hollow Fiber Membrane Method of Operationwith electron microscope view of membrane surface
Figure 2: Cutaway View of a Single Hollow Fiber

CTI Journal, Vol. 31, No. 1 17

CTI Journal, Vol. 31, No. 118
Figure 3: Hollow Fiber Membrane SystemInfluent and Effluent
Figure 4(a): Process Wastewater Pretreatment System

CTI Journal, Vol. 31, No. 1 19

CTI Journal, Vol. 31, No. 120
Figure 4(b): Open Evaporative Cooling System

CTI Journal, Vol. 31, No. 1 21

CTI Journal, Vol. 31, No. 122
Figure 5: Sodium Chlorate/Hydrogen Peroxide ChlorineDioxide Generator in Basic Schematic Form (Courtesy of
PureLine Treatment Systems)
Figure 6: Conductivity and Chloride Levels for the Three Cooling Towers

CTI Journal, Vol. 31, No. 1 23

CTI Journal, Vol. 31, No. 124
Figure 7: Conductivity and Chlorides– A Closer Look at Cooling Tower C
Figure 8: Relative Water Savings Achieved by IncreasingCooling Tower Cycles of Concentration from 3.0 to 4.0

CTI Journal, Vol. 31, No. 1 25

CTI Journal, Vol. 31, No. 126
Figure 9: Cooling Tower Filtered Orthophosphate Residuals

CTI Journal, Vol. 31, No. 1 27

CTI Journal, Vol. 31, No. 128
Figure 10: Cooling Tower General Corrosion Rates (Carbon Steel)

CTI Journal, Vol. 31, No. 1 29

CTI Journal, Vol. 31, No. 130
ABSTRACTBy itself, the presence of legionellae in a cooling tower is insuffi-cient to predict the potential for disease transmission because otherfactors are involved. This paper will describe details about one ofthe important factors, cooling tower air emissions, by providing acomprehensive technical understanding of drift quantity, dropletdistribution, and plume dispersion. By understanding these airemission details, ranges of Legionella bacteria concentration atdistances from the tower can be estimated as a function of legionellaeconcentration in the tower water.This paper will also describe the ecology of the bacteria in coolingtowers and the epidemiology of outbreaks attributed to coolingtowers. Most importantly, the paper will discuss the correlation ofthe bacteria-exposure model described in this paper with the inci-dents of disease from previously studied outbreaks.The quantity of bacteria required to cause disease depends onseveral factors including the health of the individual and the expo-sure. A hypothetical example would be a situation where an indi-vidual could inhale 1 bacterium a week for fifty weeks with no illeffects, but develops disease when he inhales 50 bacteria in anhour. There is likely some exposure rate (inhalation of X bacteria /time) where the risk of disease may occur; the higher the exposurerate, the more likely the occurrence of disease. The inhalation rate(inhalation is the only means of transmission from cooling towers)depends strongly on two factors: 1) the concentration of bacteriain the ambient air in a particular area and 2) the time spent in thatarea.
INTRODUCTIONLegionellosis is a form of pneumonia caused from Legionella bac-teria being inhaled or aspirated deeply into the lungs. Legionellais quite common in the environment and there are many steps from‘present in the environment’ to ‘disease’.The accepted prerequisite for infection is the bacteria must be con-tained in droplets of water less than 5 microns in diameter. Largerdroplets would not penetrate deeply enough into the lungs to causeinfection. While there is no known infectious dose or alternativelysafe level for the bacteria, because of its ubiquity in nature, most
Cooling Towers, Drift, and Legionellosis
researchers believe that an infection requires the inhalation of tensif not hundreds of bacteria.As might be expected with the widespread distribution ofLegionella bacteria, there is a ‘normal’, low incidence of randomcases of Legionellosis. With the low background rate, a cluster ofdisease would be statistically rare. When a cluster has occurred,there is often a specific source identified as the cause of the out-break.Outbreaks of community-acquired Legionella have been attrib-uted to specific spas, fountains, cooling towers, metal workingfluids, misters and other sources. With all of these sources exceptcooling towers, a very close proximity to the source was requiredfor exposure. With cooling towers, exposures have been reportedseveral kilometers away from the purported source.The exposure to disease connection is not fully understood. Thereare likely at least two competing processes occurring in the host:bacteria germination and host immune system response. In ahealthy, non-smoking individual, an exposure of thousands of bac-teria is likely necessary before the immune system is overwhelmed;in others the exposure of a few bacteria may be sufficient.It is not the norm for a cooling tower to cause an outbreak ofLegionnaires’ disease. There are hundreds of thousands of cool-ing towers in the US, many if not most containing some level ofLegionella bacteria, yet there are only a handful of cooling-towerimplicated outbreaks. A person’s exposure to Legionella bacteriafrom a cooling tower is based on a variety of factors:
1) The drift rate of the tower. Drift is the mechanically aspi-rated droplets of circulating water that are entrained intothe effluent air stream.
2) The volume of air passing through the tower.3) The dispersal of the exhaust air with ambient air (plume
dilution).4) The time spent in plume/air mix5) The concentration of Legionella bacteria in the circulating
water.This paper will explore these factors and the effect they have onrisk of exposure.
COOLING TOWER DRIFTMost tests on a specific tower design show a linear relationshipbetween circulating water flow and drift within normal cooling toweroperating air flow. Air flow rate will significantly affect tower driftonly at the extremes of the design. Because of this, drift is typicallydescribed as a percentage of circulating water rate.All modern cooling towers are or should be equipped with drifteliminators (DE). The DE force the exhaust air to make sharp turnsbefore exiting. The momentum of entrained droplets carries thedroplets to the DE surfaces where they coalesce and drip back intothe tower. Cooling towers or drift eliminators may be evaluated for
THOMAS BUGLERJOHN LANEEvapco, Inc.Taneytown, MD
BARRY FIELDS, PhDCenters for DiseaseControl and PreventionAtlanta, GA
RICHARD D. MILLER,PhD Microbiology &ImmunologySchool ofMedicine, University ofLouisville, Louisville KY
Thomas Bugler

CTI Journal, Vol. 31, No. 1 31

CTI Journal, Vol. 31, No. 132
drift rates under controlled conditions. The standard test is the“Heated Bead Isokinetic (HBIK) Drift Test Procedure” described inthe Cooling Technology Institute code ATC 1401. A portion of theexit air stream is drawn at the same speed and direction(isokinetically) into a collection device. The collection device con-sists of heated beads. Any drift that is pulled into the tower is driedon the beads. The tower water has a specific concentration of atracer element and by measuring the quantity recovered from thebeads, the quantity of drift can be determined.Less modern designs for drift eliminators are not as efficient asnewer equipment. While an older design might result in drift ratesup to 0.02%, all towers constructed in the last few years by themajor manufacturers are much better. Typically, for cross-flow de-signs the drift rate will be less than 0.005% while because of use ofhigher efficiency eliminators, counterflow designs routinely achieve0.001%.The newer cellular drift eliminators started being used in the late1980’s with particular model lines changing over about a 15-yearperiod. Around the early 1990’s the 0.005% drift rate for crossflowtowers became standard. The 0.001% drift rate for induced-draftcounterflow became standard also around 1990. For forced-draftcounterflow units, 0.001% didn’t become standard until just a fewyears ago. Prior to the change, cooling tower drifts were typicallyin the 0.02% or higher range.A typical 1,000-ton HVAC cooling tower nominally circulates 3,000gpm water. At nominal conditions, the drift from a 1,000-toncrossflow tower would be less than 0.15 gpm while the drift from a1,000-ton counterflow tower would be less than 0.03 gpm. Thesevalues should be routinely achieved by units as they are shippedfrom the factory. With a well maintained tower, these rates can besustained for many years. However, there are things that happen inthe field which can degrade the eliminators effectiveness. A partiallist of these problems follows:
1) Damaged drift eliminators. UV, hail, and improper handlingcan all damage drift eliminators. Damaged drift eliminatorsinterfere with exhaust air flow. If there are gaps or holes inthe eliminator, then more air will pass through the open areaat high velocity carrying significantly more entrained wa-ter.
2) Clogged drift eliminators. In highly cycled water the en-trained droplets contain a high quantity of dissolved sol-ids. This can result in a gradual build up of minerals on theDE. As the minerals build up, the air is blocked in someareas and the air velocity increases in the open areas. Asthis velocity gets high enough, the amount of entrainedwater carried from the tower increases.
3) Misaligned or missing drift eliminators. If there are gaps inthe eliminators, their effectiveness is severely reduced.
4) Damaged fill. While not as obvious as damaged drift elimi-nators, damaged or partially clogged fill will change theairflow to the DE and affect their efficiency
5) Obstructed inlet air. For the same reason as in #4, changingthe airflow in the tower affects DE efficiency.
6) Water distribution. Improper water distribution may puttoo much water in one area resulting in very high drift fromthat part of the tower. Misaligned or over-pressured spray
nozzles can also increase the amount of drift.7) Use of surfactants in the chemical water treatment. By
lowering the surface tension of the recirculating water, sur-factants can cause water to form very small droplets. Thesesmall droplets are more easily carried by the air stream andare less effectively removed by the drift eliminators.
The drift that leaves the tower is in the form of small droplets. Thelarger the droplet the more momentum it carries and the more effec-tive the DE. The distribution of water drop sizes in the drift can bemeasured by water sensitive paper. The paper is treated so that adroplet impinging on the paper will generate a well defined mark.The size of the stain is related to drop size 2 . This is a less exactmethod than the HBIK test but provides some information aboutdroplet size distribution. This test is not effective for droplets lessthan 30 microns in size.Many studies have been performed on the size of drift particlesfrom a tower. Figure 1 shows the results from nine separate testson drift eliminators performed by the manufacturer3. The cumula-tive volume of drops is plotted as a function of the diameter of thedrop in microns. Below each label on the X-axis is the number ofdroplets of that specific diameter per milliliter of water.The drops per ml information is useful to see that, absent clumping,it would be very unusual for a single droplet to contain more than 1Legionella bacterium even in a heavily contaminated system witha Legionella count per ml of 1,000. Because of this, parametricstatistical analysis is valid for considering Legionella dispersionin the plume.
Figure 1 – Drift Droplet Size Distribution

CTI Journal, Vol. 31, No. 1 33
CTI Journal, Vol. 31, No. 134
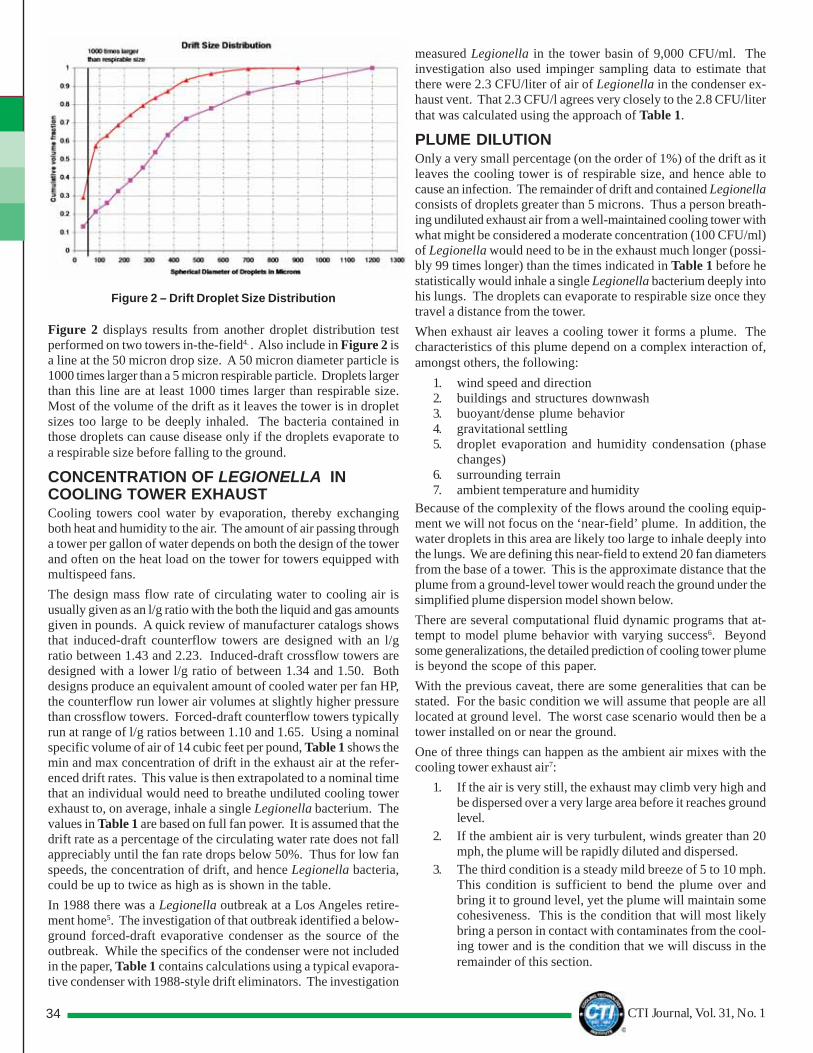
Figure 2 – Drift Droplet Size Distribution
Figure 2 displays results from another droplet distribution testperformed on two towers in-the-field4. . Also include in Figure 2 isa line at the 50 micron drop size. A 50 micron diameter particle is1000 times larger than a 5 micron respirable particle. Droplets largerthan this line are at least 1000 times larger than respirable size.Most of the volume of the drift as it leaves the tower is in dropletsizes too large to be deeply inhaled. The bacteria contained inthose droplets can cause disease only if the droplets evaporate toa respirable size before falling to the ground.
CONCENTRATION OF LEGIONELLA INCOOLING TOWER EXHAUSTCooling towers cool water by evaporation, thereby exchangingboth heat and humidity to the air. The amount of air passing througha tower per gallon of water depends on both the design of the towerand often on the heat load on the tower for towers equipped withmultispeed fans.The design mass flow rate of circulating water to cooling air isusually given as an l/g ratio with the both the liquid and gas amountsgiven in pounds. A quick review of manufacturer catalogs showsthat induced-draft counterflow towers are designed with an l/gratio between 1.43 and 2.23. Induced-draft crossflow towers aredesigned with a lower l/g ratio of between 1.34 and 1.50. Bothdesigns produce an equivalent amount of cooled water per fan HP,the counterflow run lower air volumes at slightly higher pressurethan crossflow towers. Forced-draft counterflow towers typicallyrun at range of l/g ratios between 1.10 and 1.65. Using a nominalspecific volume of air of 14 cubic feet per pound, Table 1 shows themin and max concentration of drift in the exhaust air at the refer-enced drift rates. This value is then extrapolated to a nominal timethat an individual would need to breathe undiluted cooling towerexhaust to, on average, inhale a single Legionella bacterium. Thevalues in Table 1 are based on full fan power. It is assumed that thedrift rate as a percentage of the circulating water rate does not fallappreciably until the fan rate drops below 50%. Thus for low fanspeeds, the concentration of drift, and hence Legionella bacteria,could be up to twice as high as is shown in the table.In 1988 there was a Legionella outbreak at a Los Angeles retire-ment home5. The investigation of that outbreak identified a below-ground forced-draft evaporative condenser as the source of theoutbreak. While the specifics of the condenser were not includedin the paper, Table 1 contains calculations using a typical evapora-tive condenser with 1988-style drift eliminators. The investigation
measured Legionella in the tower basin of 9,000 CFU/ml. Theinvestigation also used impinger sampling data to estimate thatthere were 2.3 CFU/liter of air of Legionella in the condenser ex-haust vent. That 2.3 CFU/l agrees very closely to the 2.8 CFU/literthat was calculated using the approach of Table 1.
PLUME DILUTIONOnly a very small percentage (on the order of 1%) of the drift as itleaves the cooling tower is of respirable size, and hence able tocause an infection. The remainder of drift and contained Legionellaconsists of droplets greater than 5 microns. Thus a person breath-ing undiluted exhaust air from a well-maintained cooling tower withwhat might be considered a moderate concentration (100 CFU/ml)of Legionella would need to be in the exhaust much longer (possi-bly 99 times longer) than the times indicated in Table 1 before hestatistically would inhale a single Legionella bacterium deeply intohis lungs. The droplets can evaporate to respirable size once theytravel a distance from the tower.When exhaust air leaves a cooling tower it forms a plume. Thecharacteristics of this plume depend on a complex interaction of,amongst others, the following:
1. wind speed and direction2. buildings and structures downwash3. buoyant/dense plume behavior4. gravitational settling5. droplet evaporation and humidity condensation (phase
changes)6. surrounding terrain7. ambient temperature and humidity
Because of the complexity of the flows around the cooling equip-ment we will not focus on the ‘near-field’ plume. In addition, thewater droplets in this area are likely too large to inhale deeply intothe lungs. We are defining this near-field to extend 20 fan diametersfrom the base of a tower. This is the approximate distance that theplume from a ground-level tower would reach the ground under thesimplified plume dispersion model shown below.There are several computational fluid dynamic programs that at-tempt to model plume behavior with varying success6. Beyondsome generalizations, the detailed prediction of cooling tower plumeis beyond the scope of this paper.With the previous caveat, there are some generalities that can bestated. For the basic condition we will assume that people are alllocated at ground level. The worst case scenario would then be atower installed on or near the ground.One of three things can happen as the ambient air mixes with thecooling tower exhaust air7:
1. If the air is very still, the exhaust may climb very high andbe dispersed over a very large area before it reaches groundlevel.
2. If the ambient air is very turbulent, winds greater than 20mph, the plume will be rapidly diluted and dispersed.
3. The third condition is a steady mild breeze of 5 to 10 mph.This condition is sufficient to bend the plume over andbring it to ground level, yet the plume will maintain somecohesiveness. This is the condition that will most likelybring a person in contact with contaminates from the cool-ing tower and is the condition that we will discuss in theremainder of this section.

CTI Journal, Vol. 31, No. 1 35

CTI Journal, Vol. 31, No. 136
SIMPLIFIED PLUME DISPERSAL MODEL – Under mild winds,plumes will generally expand in both the height and width directionwith a typical angle of expansion of approximately 6.0°. A simplis-tic model of a cooling tower, sitting on the ground with a unitdischarge characteristic dimension ‘F’ (this will be approximatelyequal to the fan diameter on an induced-draft tower) is shown inFigure 3. The plume is dispersed from an area equal to the dis-charge characteristic dimension squared (F2). As the plume spreads,the concentration of the cooling tower exhaust is diluted by theratio of the cross-sectional areas. When the plume touches theground, the plume expansion changes from a square to a rectanglesince the ground blocks the plume from further downward expan-sions. The model is particularly inaccurate in the ‘near field,’ be-fore the plume touches the ground. This area is essentially beingignored because the drift droplets as they leave the tower are toolarge to be respirable. Time and distance are required for the drop-lets to be reduced to 5 microns or less in size. For modelingLegionella dispersion in the far-field, we assume, conservatively,that all Legionella bacteria are in respirable-sized droplets.Due to the momentum of exhaust air as it leaves the tower, theplume will tend to rise up before bending down. To account for thisrise, the height of the plume when it bends is set at twice the char-acteristic discharge dimension. For typical factory-assembled,HVAC cooling towers set on the ground this is a reasonable as-sumption.Figure 3 details the near-field plume dispersion of the simplifiedmodel. With this model, the plume touches the ground at a dis-tance D0 = 2F/ tan (6o) = 20 F. At this point the cross-sectional areaof the plume will be (5F)2, 25 times the area as the plume left thetower. We are calling this D0 the characteristic distance and usingmultiples of this distance as a simplified way to describe plumedilution independent of cooling tower size.
Figure 3 – Near-Field Plume Dispersion Model.‘F’ = Characteristic Discharge Dimension
We have arbitrarily set the point where the plume touches theground, D0, as the end of the near-field. As the plume continues toexpand beyond this point, it is constrained from expansion in thevertical direction by the ground. We assume no such constraint inthe horizontal direction. Figure 4 illustrates how these assump-tions affect the plume dilution.At 2x D0 the cross-sectional area is 63 F2, at 3x D0 the area is 117 F2,and at 4x D0 the area is 187 F2. The ratio of the cross-sectional areaof the plume at a specific distance to the cross-sectional area of theplume as it leaves the tower (F2) is a measure of the dilution of thecooling tower exhaust by ambient air at that point.
Figure 4 – Far-Field Plume Dispersion Model. ‘F’ =Characteristic Discharge MMDimension
The characteristic distance, D0, that the plume travels before ittouches the ground is a function of the discharge dimension. Largerunits exhaust higher off the ground and the near-field of the plumeextends for a greater distance. Table 2 lists this distance for somecommon sized units used in factory-assembled towers as well assome multiples of this distance.
Fan Dia. D0 25/1 2x D0 63/1 3x D0 117/1 4x D0 187/1dilution dilution dilution dilution
6-foot fan 0.02 miles 0.05 miles 0.07 miles 0.09 miles8-foot fan 0.03 miles 0.06 miles 0.09 miles 0.12 miles10-foot fan 0.04 miles 0.08 miles 0.11 miles 0.15 miles12-foot fan 0.05 miles 0.09 miles 0.14 miles 0.18 miles
Table 2 – Characteristic Distance (D0) as a Function ofCommon HVAC Fan Diameters
COMPARISION OF SIMPLIFIED MODEL WITH EPA SCREENINGMODEL – The EPA has several plume modeling programs for esti-mating air quality impact of stationary sources. One of these pro-grams, SCREEN38 , was used to validate the simple model described
* Assumes 500 ml tidal volume and 15 breaths per minute. Note that no consideration is given to the size of the droplet although most of the driftvolume is accounted for in droplets which are much greater than 5 microns
** Uses a value of 9,000 CFU/ml not the 100 CFU/ml as in the balance of the Table.Table 1 – Concentration of Drift and Legionella in Model Cooling Tower Exhaust
Tower type l / gl/gl/gl/gl/g Cubic Feet air/gal Drift percent Milliliter drift Legionella per liter of Minutes to inhalerecirculating water per liter of @ 100 CFU/ml exhaust 1 Legionella
exhaust air air in tower water bacteria*
Induced-draft Counterflow min 1.43 81.6 0.001% 0.0000164 0.00164 81 min.Induced-draft Counterflow max 2.23 52.3 0.001% 0.0000256 0.00256 52 min.
Induced-draft Crossflow min 1.34 87.1 0.005% 0.0000768 0.00768 17 min.Induced-draft Crossflow max 1.50 77.8 0.005% 0.0000860 0.00860 15 min.
Forced-draft Counterflow min 1.10 106.1 0.001% 0.0000126 0.00126 106 minForced-draft Counterflow max 1.65 70.7 0.001% 0.0000189 0.00189 70 min.1988 Outbreak – typical 1988 1.38 84.5 0.020% 0.000316 2.8** 3 seconds

CTI Journal, Vol. 31, No. 1 37

CTI Journal, Vol. 31, No. 138
in this paper. Data was input for ground level pollutant dilutionfrom two cooling towers, one with a 12-foot diameter fan and oper-ating at ½ fan speed; the other with an 8-foot diameter fan operat-ing at full speed. The program automatically chooses the wind andatmospheric conditions that produce the highest concentration ata given distance. From these worst-case concentration values, theplume dilution was calculated. The values of the SCREEN3 worst-case dilutions are plotted against the simplified model dilutions inFigure 5. There is very good agreement between the two models.Both these models assume no other structures in the immediatearea. The close agreement of the simplified model with the EPAmodel helps to validate the reasonableness of this simplified ap-proach.The simplified model allows a quick consideration, independent oftower size, of the plume dilution at a distance from the tower. Themodel fails at very short distances (less than 20 fan diameters thesimplified model assumes zero ground-level concentration) and atvery long distances. For the intermediate distance in an open areait has some use.
Figure 5 – Plume Dilution Model Comparison
BACTERIA CONCENTRATION IN PLUMEWe can now combine the bacteria concentration in the drift fromTable 1 with the plume dilution after it touches the ground fromFigure 4 to determine how many hours someone must be at severaldistances from the tower in order to, on average, inhale a singleLegionella bacterium.These calculations assume:
1. A mechanically well-maintained tower (drift eliminators, fill,nozzles, etc.)
2. A moderate Legionella contamination of the circulatingwater of 100 CFU/ml
3. Ground-level tower (worst-case)4. The worst-case l/g (at full speed) for typical modern
crossflow towers and for typical modern counterflow tow-ers (in terms of drift concentration in the cooling towerexhaust).
5. Fans operating at ½ speed (worst-case doubling the driftconcentration from full fan speed).
6. All of the Legionella bacteria that leave the tower becomerespirable (worst-case).
Table 3 indicates that in a modern tower that was acceptably main-tained there is little chance of inhaling multiple Legionella bacteriaunless one spent extensive time close to the tower under a worst-scenario wind condition or if the cooling tower were sited very neara building fresh air intake.
Table 3 – Average Time to Inhale 1 Legionella BacteriumLEGIONELLA IN COOLING TOWER WATERTHE ECOLOGY OF LEGIONELLA – Legionella have a unique ecol-ogy compared with other bacteria that live in water. It is now wellunderstood that Legionella in the environment grow as intracellu-lar parasites of free-living amoebae and other protozoa.Rowbotham9 first demonstrated the ability of Legionella to repli-cate within freshwater and soil amoebae as early as 1980, and sincethen this phenomenon has been confirmed by many investigatorsusing Acanthamoeba, Naegleria, and Hartmanella amoebae, andthe ciliated protozoan Tetrahymena10. Most authorities agree thatthis intracellular replication not only plays a vital role in the ampli-fication of Legionella in the environment, but is also the uniquepathogenic ability that enables Legionella to infect humans viathe intracellular replication with monocytes and macrophages.In an environmental habitat such as a cooling tower, most of theamoebae reside as part of the biofilm on the solid surfaces, ratherthan free in the water. This complex ecosystem contains a widevariety of slime-producing bacteria that colonize the surfaces, alongwith higher organisms such as amoebae and other protozoa thatgraze on the bacteria as a food source. Legionella interact with theamoebae in the biofilm, blocking the killing and digestion processof the amoebae, and replicating to large numbers within the foodvacuole or vesicle inside of the amoebae. Eventually the amoeba iskilled and the Legionella are released to find new hosts. Some ofthe bacteria (including Legionella) and amoebae in the biofilm mi-grate from the surface into the free-flowing water and are distrib-uted to other biofilm locations. It is these water-borne (referred toas planktonic) Legionella, along with other bacteria and amoebae,that are released into the air from the cooling tower in the drift.Rowbotham8,11 has described the replication cycle of Legionellawithin the amoebae and first noticed the release of small vesicles

CTI Journal, Vol. 31, No. 1 39
Whether your project requiresnew construction or retrofit,standard products or customsolutions, Shepherd TowerComponents are a perfect fit.
· PVC Coated Hanger Grids· Stainless Steel Hanger Grids· Gull Wing Splash Fill Slats· V-Bar Splash Fill Slats· Film Pack· Drift Reduction Units· Nozzles & Accessories
C. E. Shepherd Company, L.P.2221 Canada Dry Street
Houston, TX 77023Telephone: 713.924.4300
Fax: 713.928.2324www.ceshepherd.com
Shepherd Standard high quality products for cooling towers include:
Since 1957, our primary business has been innovation!We encourage inquiries for custom product solutions!

CTI Journal, Vol. 31, No. 140
full of Legionella at certain stages. He hypothesized that, whileintact amoebae (10-40 ìm diameter) are generally too large to beinhaled into the lungs, the inhalation of small (<5 ìm) vesicles packedwith Legionella could provide an infectious dose in a singleinhalable particle10. More recently, Berk and colleagues12 have moreconvincingly demonstrated the production of respirable vesicles(2-6 ìm in diameter) containing live Legionella from Acanthamoeba.Berk11 estimated that each vesicle could contain between 20 and200 bacteria, while Rowbotham10 calculated numbers in the range of365-1,483 Legionella for a 5 ìm diameter vesicle. These membrane-bound vesicles would also protect the Legionella from desiccationduring the airborne dissemination from the tower.Thus, from a disease transmission perspective, the cooling towerdrift that exits the tower would contain a mixture of free Legionella,clusters of Legionella within respirable amoebae vesicles, and in-tact amoebae containing Legionella. In would seem obvious thatthe respirable vesicles would provide the highest risk to humanssince they can be inhaled into the lungs, with a single vesicle pro-viding a potentially infectious dose of Legionella.THE STANDARD CULTURE METHOD FOR LEGIONELLA – Thegold standard for detection and quantitation of Legionella in cool-ing towers or other environmental water samples is the standardculture method originally described by the CDC13. In this proce-dure, samples (with and without acid treatment to reduce the otherheterotrophic bacteria in the water) are diluted and portions platedon selective and non-selective agar media. Any Legionella-likecolonies that appear after appropriate incubation are confirmed asLegionella (species and serotype) with standard confirmation pro-cedures. Using the assumption that each colony originated from asingle bacterium, the number of Legionella in the water can becalculated and recorded as “colony forming units” (CFU) per ml orliter of original sample. To date, a number of organizations havepublished protocols for the culture of Legionella from environ-mental samples including an international standard (ISO 11731)14.Culture of Legionella from environmental samples is technicallydemanding and successful testing requires a microbiology labora-tory that is experienced in the detection of this bacterium. Thereare no programs to certify the proficiency of environmental labora-tories for their ability to culture Legionella. In addition, variationswhich can be associated with procedures such as filter concentra-tion or acid pretreatment (to kill non-Legionella bacteria) can dra-matically affect the number of Legionella detected by these proce-dures. CDC will be initiating a proficiency testing program forenvironmental laboratories culturing Legionella in 2009 whichshould help with the standardization of these practices. Until thattime, the only way to ensure accurate testing results is to rely onhighly experienced laboratories.It should be noted that other non-culture techniques are availablefor detection and quantitation of Legionella in environmentalsamples, including antigen-antibody based methods (such as im-munofluorescence microscopy) and nucleic acid detection proce-dures such as polymerase chain reaction (PCR). The major limita-tions of these other procedures is that they may cross-react withother bacteria in the water and do not distinguish between living(infectious) and dead (non-infectious) Legionella in the sample.LEGIONELLA CONCENTRATION IN TOWER WATER – Usingthe standard culture technique, many investigators have shown
that Legionella is a common part of the microbial ecosystem incooling tower water, although usually at low concentrations. Re-sults of a large survey of cooling towers (2,590 samples) over sev-eral years published by Miller and Koebel in 200615 showed that12% of the tower samples had detectable Legionella above thelimit of sensitivity of 10 CFU/ml and 2% of the samples had levelsabove 1,000 CFU/ml. A similar Spanish study presented at theEuropean Congress of Clinical Microbiology and Infectious Dis-eases in 2004 by Garcia-Nunez16 found that 18 % of 554 coolingtowers randomly sampled over a three-year period were culture-positive for Legionella at their increased limit of sensitivity of 10CFU/liter. Legionella numbers generally constitute a small per-centage of the total bacterial population in tower water (usually <1% of the total heterotrophic bacteria). However, Miller andKenepp17 showed that (perhaps as a result of biocide selectivity),the Legionella numbers may occasionally approach or achieve100% of the bacterial population in the cooling tower water, often atlevels exceeding 1,000 CFU/ml. Cooling towers responsible foroutbreaks of Legionnaires’ disease often have high concentrationsof Legionella in their water. To the best of out knowledge, thehighest concentration reported in such an outbreak investigationwas in a tower which contained 105 CFU/ml of L. pneumophila16.Analysis of cooling tower water with non-culture methodologytends to give higher percentages of samples positive for Legionella.This is due to 1) the detection of both living and dead Legionellain the samples, and 2) the increased sensitivity of PCR over thestandard culture method (i.e. the ability to detect very low levels ofLegionella in the sample).UNDER ESTIMATIONS OF THE STANDARD METHOD – Whilethe standard culture technique is generally very reliable and repro-ducible in a qualified laboratory, this method may significantly un-der-estimate the actual number of Legionella in a cooling towerwater sample as a result of:
1. Interference by other bacteria. Because Legionella is usu-ally a minority of the total bacterial population in the cool-ing tower water, it is essential that the acid treatment andselective media successfully eliminate or inhibit the otherbacteria so that the Legionella can grow without interfer-ence. While occasionally encountered in all labs, interfer-ence is a problem most common in laboratories not familiarwith these critical elements of the standard procedure.
2. Viable but non-culturable (VBNC) Legionella. Examinationof cooling tower water by non-culture techniques such asimmunofluorescent microscopy or polymerase chain reac-tion (PCR) often reveal the presence of Legionella insamples that were culture-negative, or higher numbers ofLegionella in samples that were culture-positive. The dem-onstration of a VBNC state for Legionella has been con-vincingly demonstrated by several investigators usingnutrient limitation18,19,20 or disinfectant exposure21,22. TheseVBNC Legionella can be resuscitated by exposure to amoe-bae and are potentially infectious for humans.
3. Clusters of Legionella bacteria. Any clusters or clumps ofLegionella introduced onto an agar plate would form asingle colony and be under-counted as a single Legionellabacterium. Clusters containing more than one Legionellaare readily observable when water samples are examined

CTI Journal, Vol. 31, No. 1 41

CTI Journal, Vol. 31, No. 142
using immunofluorescence microscopy (IFM). If each clus-ter were counted as a single Legionella, the clusters mayaccount for as much as 5-10 % of the Legionella observedby IFM (personal observation). Additional clusters ofLegionella within intact amoebae or amoebae vesicles maynot be observed by IFM due to an inaccessibility to theanti-Legionella antibody used in this method, but still formsingle colonies when cultured onto an agar plate. Thus,the production of vesicles (each containing potentially largenumbers of viable Legionella) by amoebae or other proto-zoa would be of great importance in terms of disease trans-mission.
EPIDEMIOLOGY OF OUTBREAKSThe preceding sections have discussed a semi-quantitative meth-odology for evaluating the risk for a Legionella infection from acooling tower. The fundamental question is does the epidemiologydata support the methodology.The methodology assumes that the concentration of airborne bac-teria is due primarily to four factors:
1. The concentration of Legionella bacteria in the circulatingwater.
2. The quantity of drift generated by the tower.3. The quantity of air passing through the tower.4. The dilution of the plume by ambient air.
The exposure dose and hence the risk of disease is then related tothe time spent breathing in the contaminated air.Robert Breiman5 describes a 1988 outbreak at a Los Angeles retire-ment home. The data from that study was used to validate themethodology used in Table 1 for calculating the concentration ofLegionella bacteria in cooling tower exhaust. The cooling systemconsisted of a below ground, forced-draft evaporative condenserthat exhausted at sidewalk level. There was an air intake to thebuilding located near and slightly higher than the exhaust. Testson the water in the condenser basin showed Legionella counts of9,000 CFU/ml.The cooling system in that study had many problems with its de-sign and operation that are addressed with current guidelines.
1. The drift eliminators on modern counterflow towers are 20times better. This alone may have prevented the outbreak.
2. 9,000 CFL/ml is very high. Almost any good water treat-ment would lower this value by one to two orders of magni-tude.
3. The location of the building inlet air was particularly bad.Cooling tower exhaust always has some buoyancy and willusually rise as it leaves the tower. Locating the buildingair-inlet near and above the exhaust is particularly bad.
4. Exhausting an underground condenser at sidewalk level isimproper.
5. Towers sited on the ground have a tendency to draw in abroad array of organic and mineral contaminates – muchmore so than a tower sited on a roof. An undergroundtower that draws its inlet air downwards is even more likelyto draw in contaminates. These contaminates make bio-logical control of the circulating water more difficult.
6. Since this is a retirement home, it would warrant specialattention
An order of magnitude analysis of the condenser identified as caus-ing the out break show that the drift rate was an order of magnitudetoo high, the bacteria concentration in the recirculating water wastwo orders two high, and the location of the condenser exhaust andthe building air intake resulted in a order of magnitude more con-taminated air being drawn into the building. Had any one of theorder-of-magnitude criteria conditions been properly controlled,the probability of an outbreak would have been greatly reduced.Clive Brown23 describes a 1994 outbreak in the area around a Dela-ware hospital. The paper strongly suggested a relationship to timespent near the contaminated cooling tower and risk of infection.The authors develop a variable which they call an Aerosol Expo-sure Unit (AEU) to describe the dose that an individual received.The AEU is proportional to the hours spent at a specific distancefrom the tower with a formula of:AEU = time (in hours) / distance (in miles).The authors performed a detailed case-control study of 22 peoplewho came down with the disease and matched controls of similarage and health that attend the same clinic but were disease-free.This study showed a very strong correlation with high AEU anddisease.The AEU formula assumes that:
1. The dose is linear with time spent breathing contaminatedair. This is exactly the assumption that we are making.
2. The contamination falls off in a linear manner the fartherthe distance form the tower. The AEU formula implies thatcontamination-concentration is proportional to 1/distance.Since contamination-concentration is proportional to 1/plume-dilution, the AEU formula assumes a linear increasebetween plume-dilution and distance. This is different fromthe model used in this paper.
Our model assumes a quadratic increase in plume dilution withdistance. Although different, the result on this relatively small database may not be noticeable. Figure 6 is a plot of the plume dilutionof a ground-based tower with a 12’ fan using the model proposed inthis paper. Also on this plot is a linear regression of those pointsthat is forced through the origin. This linear regression representsthe relationship used to develop the AEU variable. The differencein the two plots is not likely to be significant in the disease-AEUcorrelation.
Figure 6 – Model Plume Dilution with Linear Regression

CTI Journal, Vol. 31, No. 1 43

CTI Journal, Vol. 31, No. 144

CTI Journal, Vol. 31, No. 1 45

CTI Journal, Vol. 31, No. 146
DISCUSSIONThis description of Legionella concentration in a dispersed plumeis only intended as an order-of-magnitude approximation. Whilethere is no known safe levels of Legionella exposure, values thatare less than 1 Legionella bacterium inhaled in 24 hours seem verylow. This indicates that if current guidelines are followed – gooddrift eliminators, good mechanical repair of the tower, sound towersitting practice, reasonable microbiological control, etc. – the riskof Legionella infection can be quite low.The basic plume dispersion model is a very simplified case. Build-ings in the area of the tower as well as other structures will dramati-cally affect how the plume is diluted. The simplified model is onlyintended as a visualization and order-of-magnitude approximationthat bacteria concentration, in general, decreases as distance fromthe tower increases.There are well-documented cases of Legionellosis associated withcooling tower exposure – how does this analysis help understandthose cases? In general, two or more of the basic assumptions ofthis analysis were not followed. It is useful to review the basicassumptions of this analysis because they certainly do not applyin many situations. The assumptions of this analysis are:
1. That modern drift eliminators (0.005% for crossflow and0.001% for counterflow) are being used. The drift elimina-tors that were the standard just a few years ago were muchless effective, having drift rates up to an order of magni-tude higher.
2. That the tower is in good mechanical shape. Damaged ormissing drift eliminators will greatly increase the level ofdrift. While much of the drift from such a tower will be invery large, rain-drop sized drops that fall quickly to theground, some will be entrained in the air and contribute tothe respirable Legionella loading of the plume.
3. The tower is assumed sited on a clear area of ground withpeople below the level of the exhaust. A subterranean in-stallation with a ground-level exhaust would be more dan-gerous as would locating the cooling tower such that theexhaust can be drawn into a building’s air inlet.
4. Reasonable water treatment is in effect. Although not spe-cifically aimed for Legionella eradication as is required bysome non-US regulations, water treatment that keeps goodgeneral biological control is assumed.
Another underlining assumption is that infection is caused by theinhalation of individual Legionella bacteria. As previously de-scribed in this paper, there may be vesicles in cooling towers whichmay contain tens if not hundreds of Legionella bacteria. The cool-ing towers in the outbreaks discussed in this paper all had old-styledrift eliminators, high levels of Legionella in the basin, and wereimproperly sited. The contamination level was sufficiently high toallow an individual to inhale tens if not hundreds of Legionellabacteria by spending a relatively short time in the tower plume.These outbreaks can be explained by inhalation of sufficient indi-vidual bacteria to cause a disease. However, these outbreaks couldalso be explained by the inhalation of individual vesicles emitted inthe drift.There are several studies24,25,26 that implicate a cooling tower withinfection that occurred at a considerable distance from the cooling
tower. A vesicle-vector would help explain how an infectious dosecould be inhaled at a significant distance form the tower.If vesicles are the disease vector, and if a single vesicle containedsufficient Legionella bacteria to provide an infectious dose, thenthe analysis would change. A very simplified example illustratesthe difference.If we had an aerosol contamination such that there was 1 chance in10 that a person would inhale 1 bacteria in a minute and 1000 peoplespent 1 minute breathing the air then 100 people would breath in 1bacteria. A single bacteria is probably too low a dose to causedisease so nobody gets infected.If we had an aerosol contamination such that there was 1 chance in100 that a person would inhale 1 vesicle in a minute and 1000 peoplespent 1 minute breathing the air then 10 people would inhale avesicle. If every vesicle contained a large quantity of bacteria thensome of the 10 could become infected, depending on the health ofthe individual.Current epidemiological data has not been able to distinguish be-tween the alternative vectors and it is possible that both vectorsare involved in infections. Reduction or elimination of vesicles intower water could require a different water treatment approach thanreduction of Legionella bacteria.
CONCLUSIONThere are many excellent guidelines for minimizing the risk ofLegionella infection from cooling towers. These guidelines allrecommend proper maintenance, good drift eliminators, proper sit-ing, and good biological control among many other recommenda-tions; however, none of these guidelines attempts to describe therelative importance of these recommendations.Because of the quantitative nature of biological control, that as-pect is often emphasized over other aspects of control. A 1990-genre cooling tower with drift eliminators that reduce drift to 0.02%and a Legionella count of 50 CFU/ml might be thought of being alow risk of infection while a 2000-genre cooling tower with drifteliminators that reduce drift to 0.001% and a Legionella count of1000 CFU/ml would require immediate disinfection. Using the ap-proach in this paper, the 2000-genre cooling tower presents a simi-lar risk for a community-acquired infection than the less contami-nated, older tower. One way to reduce the risk of Legionella expo-sure from older equipment is to upgrade the drift eliminators to themodern, high-efficiency designs.Further studies of the transmission vector for cooling-tower infec-tion (bacteria, vesicles, or both) are needed. The control of amoe-bae and vesicles in the cooling water may require different watertreatment than the control of planktonic Legionella bacteria. Thefactor that vesicles may play in disease transmission needs to bebetter understood.It has been well known that the level of Legionella bacteria in thecooling tower plays some role in the risk of infection; however, themere presence of the bacteria is insufficient to predict the potentialfor disease transmission. The semi-quantitative approach toLegionella aerosol exposure level, as outlined in this paper, can bevery beneficial in the management of several of the differing factorsthat contribute to risk of Legionnaires’ disease transmission. Theimportance of drift eliminator design, physical maintenance prac-

CTI Journal, Vol. 31, No. 1 47
tices, and siting as well as bacteria counts can all be roughly weighedas to their contribution to the overall risk-of-infection. The authorsfeel that the semi-quantitative approach taken in this paper can bebeneficial in evaluating the risks associated with a particular cool-ing tower, evaluating the benefits of proposed changes in coolingtower guidelines, evaluating the importance of equipment designmodifications, and aiding in the investigation of outbreaks.
REFERENCES1 CTI ATC-140 – Heated Bead Isokinetic Drift test Procedure2 CTI Drift Measurement Position Paper, 19893 Brentwood CDX drift eliminators test results4 Hennon, K.E. and Wheeler, D.E., Cooling Tower Emissions Quan-
tification Using The Cooling Technology Institute Test Code ATC-140, CTI TP 03-08.
5 Breiman, R.E, et al., Role of Air Sampling in Investigation of anOutbreak of Legionaires
’ Disease Associated with Exposure to Aerosols from an Evapora-tive Condenser. J Infect Dis 1990;161:1257-1261.
6 Meroney, R.N. 2006. CFD Prediction of Cooling Tower Drift. Jour.Wind & Ind. Aerodynamics 94: 463-490.
7 ASHRAE Handbook – HVAC Applications, Chapter 44.8 US EPA, Technology Transfer Network Support Center for Regu-
latory Atmospheric Modeling.9 Rowbotham, T.J. 1980. Preliminary report on the pathogenicity of
Legionella pneumophila for freshwater and soil amoebae. J. Clin.Pathol. 33: 1179-1183.
10 Fields, B.S. 1993. Legionella and protozoa: interaction of a patho-gen and its natural host. In Legionella: Current Status and Emerg-ing Perspectives. J.M. Barbaree, R.F. Breiman, and A.P.Dufour(ed.), American Society for Microbiology, Washington, D.C., p.129-136.
11 Rowbotham, T.J. 1986. Current views on the relationships be-tween amoebae, Legionellae and man. Israel J. Med. Sci. 22: 678-689.
12 Berk, S.G., R.S. Ting, G.W. Turner, and R.J. Ashburn. 1998. Produc-tion of respirable vesicles containing live Legionella pneumophilacells by two Acanthamoeba spp. Appl. Environ. Microbiol. 64:279-286.
13 Centers for Disease Control and Prevention. (Standard culturemethod).
14 ISO 11731. Water Quality – Detection and Enumeration ofLegionella. 1998.
15 Miller, R.D. and D.A. Koebel. 2006. Legionella prevalence in cool-ing towers: association with specific biocide treatments. ASHRAETransactions 112 (Part 1): 700-708.
16 Garcia-Nunez, M. 2004. Prevalence and degree of Legionellacolonization in cooling towers. 14th European Congress of Clini-cal Microbiology and Infectious Diseases, Abst 902, p. 437.
17 Miller, R.D. and K.A. Kenepp. 1993. Risk assessments for Legion-naires disease based on routine surveillance of cooling towersfor legionellae. In: Legionella: Current Status and Emerging Per-spectives. J.M. Barbaree, R.F. Breiman, and A.P.Dufour (ed.),American Society for Microbiology, Washington, D.C., p. 40-43.
18 Hussong, D., R.R. Colwell, M. O’Brien, E. Weiss, A.D. Pearson,R.M. Weiner, and W.D. Burge. 1987. Viable Legionella pneumophilanot detectable by culture on agar media. Bio/Technol. 5: 947-950.
19 Paszko-Kolva, C., M. Shahamat, and R.R. Colwell. 1992. Longterm survival of Legionella pneumophila serogroup 1 under low-nutrient conditions and associated morphological changes. FEMSMicrobiol. Ecol. 102: 45-55
20 Steinert, M., L. Emody, R. Amann, and J. Hacker. 1997. Resuscitaionof viable but nonculturable Legionella pneumophila PhiladelphiaJR32 by Acanthamoeba castellani. Appl. Environ. Microbiol. 63:2047-2053.
21 Garcia, M.T., S. Jones, C. Pelazx, R.D. Miller, and Y. Abu Kwaik.2007. Acanthamoeba polyphaga resuscitates viable non-culturable Legionella pneumophila after disinfection. Environ.Microbiol. 9: 1267-1277.
22 Turetgen, I. 2008. Induction of viable but nonculturable (VBNC)state and the effect of multiple subculturing on the survival ofLegionella pneumophila strains in the presence of monochloramine.Annal. Microbiol. 58: 153-156.
23 Brown, C.M., et al. 1999, A community outbreak of Legionnaires’disease linked to hospital cooling towers: an epidemiologicalmethod to calculate dose of exposure, Int. Journal of Epidemiol-ogy 28: 353-359.
24 Addiss DG, Davis JP, LaVenture M, Wand PJ, Hutchinson MA,McKinney M. Community-acquired Legionnaires’ disease asso-ciated with a cooling tower: evidence for longer-distance trans-port of Legionella pneumophila. Am J Epidemiology 1989;130:557-68.
25 Cameron S, Roder D, Walker C, Feldheim J. Epidemiological char-acteristics of Legionella infection in South Australia: implicationsfor disease control. Aust N Z J Med 1991;21:65-70.
26 Nhu Nguyen TM, Ilef D, Jarraud S, Rouil L, Campese C, Che D, etal. A community-wide outbreak of Legionnaires’ disease linked toindustrial cooling towers—how far can contaminated aerosolsspread? J Infect Dis 2006;193:102-11.
Originally presented at the 2008 International Water Conference, October 26-30, 2008 in San Antonio, TX

CTI Journal, Vol. 31, No. 148
AbstractSafety is becoming an ever increas-ing factor while working aroundand inside of cooling towers.When a fan motor is not engaged,fans free wheel from wind and up-draft in cooling towers. Entering afan cell or removing a stack sec-tion with the fan rotating is anOSHA violation. Stopping andholding a fan to conduct mainte-
specific fan motor. Only the owner of that lock possesses the keyto that lock and can not be removed by anyone else.Second, the fan must be stopped and locked out prior to entering acell and the fan must be stopped and locked out prior to removinga section of the stack. Many times that fan is still rotating due toupdraft in the fan cell or exterior wind. Locking out the fan involvesstopping the fan if it is still coasting or rotating.The dilemma is how to stop that fan without using a 2x4 or a rope tocontact a moving piece of equipment. A coupling mounted back-stop is not enough. A backstop is an anti reversing device thatholds the fan from turning in the reverse direction. An anti windmilling device in the gear reducer is not adequate. This also holdsthe fan from turning in the reverse direction. Many times a fan willcontinue to freely rotate in the forward direction.Instances of OSHA violations:
• If an individual contacts a rotating energy source like a fanor a motor shaft with their hand or foot or a piece of wood.
• If an individual uses a rope to lasso a fan blade.• If someone removes a coupling guard or a fan stack while
something is rotating.Really the only way to stop a fan without an OSHA violation is aremotely actuated brake. This brake actuation must occur withoutremoving a guard; without removing a stack panel; without using arope or a 2x4 to contact a moving piece of equipment, or withoutputting an individual in danger.
Protect fans from wind millingFan wind milling is very common in our industry. When a motor isnot operating, in many cases a fan will be rotating in the wind.Sometimes this is caused by the wind and other times by an updraftin the tower. The fan can turn forward and sometimes in reverse.This can be damaging to the fan and stack if the wind gusts arehigh enough to cause the stack to deflect and contact the fan.When fan blade tips contact stacks, there is usually damage to theblades and the stacks. Higher winds cause more stack deflectionand more deflection causes more blade contact which causes moredamage.Fans should be locked down and held stationary during high windconditions; especially hurricanes. The best way to safely stopthese fans is a braking system that can quickly lock-out the me-chanical set during a plant lock-down prior to a hurricane. Thislock-out system should be easy and take less than one minute perfan. The brake should be designed to not slip during high winds. Itshould not be capable of coming loose or disengaging during hur-ricane gusts.During high wind condition when the fan is stationary, the stackmay still deflect, but there is no rubbing activity causing wear whichwill eventually damage the blades and stacks. With a brake therewill be no fan damage and no stack damage.
Safely Stopping, Holding and Lockingout Cooling Tower Mechanical SetsDuane ByerlyRexnord Industries LLC
nance operations can be dangerous to personnel. This paper pre-sents methods for stopping and holding fans for maintenance op-erations and high wind conditions. It also presents various mate-rial and mounting options.
IntroductionAs mechanical brakes are becoming more frequently used on cool-ing tower fans, it is important for owners and manufacturers tounderstand the brake design options available. Also it is importantto understand the mathematics and have a good command of thetechnical requirements when specifying a brake for their applica-tion.Throughout the course of a year, it will be necessary for mainte-nance personnel to enter a fan cell. CTI Chapter 10 (10.7.15.3 and10.10.7.2) recommends semi-annual inspection of the gear reducerand coupling alignment. This will require entering a fan cell. Acooling tower fan and its connected mechanical components (gearreducer, motor, shaft) have very high inertia. Freewheeling fanscontain a high level of kinetic energy. According to OSHA, anenergy source like a rotating fan must be locked out prior to entryto prevent injury to personnel.Second, fans should be stopped and locked down for high windconditions. High winds will deflect the fan stacks enough to forcethem into the path of the rotating fan. In the past, hurricanes havecaused considerable damage to cooling tower fans and fan stacksbecause the fans were not locked down and able to rotate.The current method of stopping a fan is using a wooden 2x4 wedgedup underneath the motor shaft. Unfortunately this is not safe asthis could seriously injure the operator. Another method is lasso-ing a fan blade then hanging on to the rope before the fan stops orit pulls you over the edge of the stack not to mention the possibledamage caused to the fan blades.
SafetyPrior to entering a fan cell, it is required to lock out and tag out theelectric motor. A lock must be placed on the main power box to that
Duane Byerly

CTI Journal, Vol. 31, No. 1 49

CTI Journal, Vol. 31, No. 150
CalculationsIt is important for the owner / operator to understand the methodol-ogy for calculating the inertia, kinetic energy, stopping time andtemperature rise in a braking system.Calculate fan inertia reflected at the brake = Wk2
fWk2
f = Wk2FAN * (rpmf / rpmm)2
where:Wk2
f = Rotational Inertia of fan reflected at motor (lb ft2)Wk2
FAN = Rotational Inertia of fan (lb ft2)rpmf = Rotational velocity of fan (rpm)rpmm = Rotational velocity of motor (rpm)
Total rotational inertia reflected to the brake =Wk2
t = Wk2m + Wk2
r + Wk2f
where:Wk2
t = Total rotational reflected inertia (lb ft2)Wk2
m = Rotational Inertia of motor (lb ft2)Wk2
r = Rotational Inertia of reducer (lb ft2)Wk2
f = Reflected rotational Inertia of fan (lb ft2)The time required to stop a fan can be calculated as follows:t = Wk2
t * rpmm / (Td * C)where:t = time (seconds)Wk2
t = Rotational reflected inertia (lb ft2)rpmm = Rotational velocity of motor (rpm)C = Constant = 308Td = Dynamic torque (in lb)
Kinetic Energy of rotating loadKE = Wk2
t * rpmm 2/5875
where:KE = Kinetic Energy (ft lb)Wk2
t = Total rotational reflected inertia (lb ft2)pmm = Rotational velocity of motor (rpm)
Heat generated on brake discConverting to BtuH = KE /778
where:H = Heat (Btu)KE = units of ft lb is divided by 778 ft lb per BTU
Temperature rise when brake is stoppedΔT = H / (C * m)
where:ΔT = Change in temperature (°F)H = heat (Btu)m = mass of rotor (lb)C = Specific heat of stainless steel = 0.12 BTU/(lb °F)
Calculation example: What is the total inertia reflected at the brake?Time required to stop the fan? Kinetic Energy of the system?Temperature rise at the brake disc?NOTE: This is a worst case scenario neglecting rolling resistanceof fan, reducer and motor.
Assume: 200 Hp motor @ 1780 rpmFan wind milling speed = 50 rpm32’ fan Wk2 = 120,000 lb-ft2
20.1:1 gear reducer Wk2r = 30 lb-ft2 (est)
Motor Wk2m = 50 lb-ft2
Brake rotor mass (m) = 20 lbBrake applied dynamic torque (T)= 200 ft lb
Calculate fan inertia reflected at the brake = Wk2f
Wk2f = Wk2
FAN * (rpmf / rpmm)2
Wk2f = 120,000 lb ft2 * (50 rpm / 1005 rpm)2
Wk2m = 297 lb ft2
Total rotational inertia reflected to the brake = Wk2t = Wk2
m + Wk2r + Wk2
f
Wk2t = 297 lb-ft2 + 50 lb-ft2+ 30 lb-ft2
Wk2t = 377 lb-ft2
Time to stop fan t = Wk2t * rpmm / (T * C)
t = 377 lb-ft2 * (1005 rpm) / (200 ft lb * 308)t = 6 seconds
Kinetic Energy (KE) =KE = 377 lb-ft2 * (1005) 2/5875KE = 64,800 lb ft
Heat generated on discH = KE /778H = 64,800 lb ft/778H = 84 Btu
Temperature rise on disc (°F)ΔT = H / (C * m)ΔT = 84 Btu / (.12 * 20 lb)ΔT = 35 °F
Based on the example problem, a fan wind milling under no power athalf speed will take 6 seconds to stop after brake is applied andhave a temperature rise on the disc of 35 °F.
Type of brakes
Caliper style brake

CTI Journal, Vol. 31, No. 1 51

CTI Journal, Vol. 31, No. 152
Mechanical Brake - The caliper style brake squeezes down on discthat is attached to the hub of the drive shaft. The caliper is mountedrigidly to the frame. During installation, it will be necessary toadjust the gap of the brake pads so they do not rub against the discduring operation. The brake should be designed to have a travelrange which will fully close and apply the locking torque to a wideopen position allowing no pad contact during operation. The cali-per brake is designed to self center so it does not apply excessiveloads on the motor bearings.
Drum style brake
The drum style squeezes down on the drive shaft hub. The padshave a round curvature. One concern with this design is that not allhubs have a round cross section. Some are designed with a non-machined scalloped outer surface. This would create an interruptedbraking surface and the pads would not have infinite contact withthe braking surface. Centering adjustment would also be requiredwith this method so it would not put a side bearing load on themotor bearings.Electric Motor brake - Mechanical sets can be stopped electricallyusing a brake in the motor’s circuitry. This method requires a directcurrent (DC) running through the stator coils during the shut-downperiod. This will require a break-off leg to be rectified into DCcurrent and all can be interfaced with the motor control circuit. Formore information on electric brakes refer to CTI paper TP80-13.
MaterialsMaterial selection is very important when deciding what type ofbrake to specify. As we all know, cooling towers are typically cor-rosive environments. Most cooling tower owners feel that stain-less steel is the best choice. Painted carbon steel may work for aperiod of time, but the concern is the longevity of the paint orcoating system over the life of the tower. A mechanical brake willactuate and this movement must remain free from corrosion andfunctional after 20-30 years. Additionally if this brake is mountedinside the stack, in the airflow, then noncorrosive material like stain-less steel is likely the best choice.The pad should be a sintered metallic friction material and it shouldbe corrosion resistant enough to withstand the corrosive environ-ment. The pad backing material should also be corrosion resistant.
It is also recommended that when purchasing pads that the padshave been tested to verify heat rise and durability for multiple starts.Pad material should have a high static and dynamic coefficient offriction.
Brake mounting and actuatingShould a mechanical brake be on the motor end or gear end? Thereare advantages and disadvantages to both. Mounting on the mo-tor end will make actuation closer and it is not required to buildlinkage out to the gear. It may be possible to mount outside of thestack if on the motor end. The other advantage to motor mountingis easy access. The advantage of mounting at the gear end is thatyou have a way to stop the fan if you want to work on the driveshaft or motor shaft.It is possible to mount the caliper at the 6:00 o’clock position or atthe 3:00 o’clock position. A robust adapting bracket will be re-quired to mount the brake caliper to the torque tube or motor baseframework. This will require a corrosion resistant bracket made forthe brake position that best fits the application.As a cooling tower owner, you should ask if a hand lever actuationor rotational actuation will work best. Levers are solid however cancome loose. Rotary actuation in which an operator can rotate ascrew 1 or 2 revolutions is very desirable. This is a more naturallocking feature and won’t accidently come loose. It is very impor-tant that when the brake is actuated, it be done outside of theguard. Someone’s hand can not go under a guard to actuate abrake.Problem is how can you see if a brake is engaged or not? Guardstend to be solid and not utilizing the mesh design. It is thereforeimpossible to tell if the brake is engaged from outside of the guard.It is recommended to use a proximity switch or some type of visualrepresentation to show that the brake is engaged. This proximityswitch circuit should be wired into the control room to signify tothe operator that the brake must be disengaged prior to starting themotor.
ConclusionCooling Tower owners should understand their options when speci-fying brakes on their mechanical sets. Things to look for whenspecifying a brake:
• Remote access from outside a guard for totally safe engage-ment
• Noncorrosive pads, discs and structural material for the cool-ing tower environment
• Simple and fast engagement• Exterior indicator verifying brake engagement• Self centering feature to prevent motor bearing loading
A brake system can provide remote locking out of a cooling towerfan which allows personnel direct control of fans during mainte-nance activities. Also a brake can be used for quick lock out of fansprior to hurricane preparation and plant lock-down.

CTI Journal, Vol. 31, No. 1 53

CTI Journal, Vol. 31, No. 154
Greg Hentschel, P.E.SPX Cooling Technologies
Mark Speckin, P.E.SPX Cooling Technologies
AbstractDue to high incidences of severe weatherand hurricanes to the Florida peninsula, theFlorida Department of Community Affairsand the International Code Council (ICC)has issued new and more stringent regula-tions to the Florida Building Code.
After a series of natural disasters in the early 1990s thestate building codes were reviewed. The study revealedthat code adoption and enforcement was inconsistent aswell as inadequate [1]. The end result occurred in theFlorida State legislature in 1998 when chapter 553, FloridaStatutes, Building Construction Standards was amendedto create one state building code to be enforced by localgovernments. As of March 1, 2002, the Florida BuildingCode (FBC) became active and by law supercedes ALLlocal building codes in the state. [1]Below is a brief chronology of the changes pertaining tothe evaporative cooling industry [2]
• July 1996 – Governor Chiles establishes the FBCStudy Commission.
Florida Building Code StructuralRequirements for Evaporative CoolingEquipment
This paper will provide an in depth examination of the Florida Build-ing Code and recent declaratory statements issued on how thecode applies to the structural design of cooling towers, fluid cool-ers and evaporative condensers. It will also review the benefits offollowing the code, how to ensure all parties involved are meetinglegal requirements and the responsibilities of the engineer of record,equipment manufacturer, building code officials and owners.
IntroductionThe State of Florida has issued many changes to its building codein the last 15 years. With the given number of changes and interpre-tations to the Florida Building Code (FBC), it is important to have aclear understanding of its intent. The following will explain paststructural requirements for evaporative cooling equipment (not tobe confused with an Evaporative Cooling System per the FBC),current code language, and demonstrate through actual FloridaBuilding Commission statements how the language, by law, is to beinterpreted. Lastly, an explanation of legal responsibilities will beoutlined for the benefit of all parties involved.
Florida Building Code (FBC) historicalrequirementsThe Florida Building Commission began mandating statewide build-ing codes in the 1970s. These codes were primarily created torequire local authorities to enforce one of four state minimum build-ing codes. An example of the requirements placed on evaporativecooling equipment can be found in the Broward county code of1994 part 6, chapter 23, section 2309.6. It states, “All exterior lo-cated plumbing, mechanical, and electrical equipment and theirframes, appurtenances, components, supports and anchoring de-vices shall be anchored to resist the forces due to wind pressure asnoted in this chapter”. [3] The key word here is ‘anchored’. Thistype of language has been and occasionally still is used as theminimum requirement for many Florida applications and is one ofthe primary differences between the previous codes and the cur-rent FBC.
• October 1998 – The Commission selects the 1997 StandardBuilding Code as the base code.
• February 1999 – The Commission replaces the 1997 Stan-dard Mechanical Code with the 1998 International Mechani-cal Code as the base Mechanical Code.
• August 1999 – The Commission adopts draft II of the FBCcovering windload design, roofing, and code enforcementfor addressing the concerns of South Florida.
• November 1999 – The Commission adopts the wind designoption from the International Building Code (IBC) includingAmerican Society of Civil Engineers ASCE 7-98.
• August 2001 – The Commission conducts hearings for rulesadoption in the Building Code Training Program.
• March 2002 - the Florida Building Code (FBC) becomes ac-tive and by law supercedes all local building codes in thestate. All new construction from this point must follow theFBC.
There are many points of debate shared by manufacturers, buildingdesign engineers, building inspector/local code officials, and cus-tomers as to what the actual interpretation should be. First, whereare the structural requirements for evaporative cooling equipmentand does the code apply to equipment anchorage, structure orboth? Second, what is the responsibility of each party involvedand is a structural review by a Florida State PE required?
Current FBC 2004 requirements forevaporative cooling equipmentOne of the primary sources of confusion for evaporative coolingequipment is the location of the structural requirements in the code.Few realize that the structural requirement is actually in the me-chanical code. Even more confusing, the structural code (FBC-Building) has a cooling tower section (section 1509.4) that does notmention any structural requirements. Since structural engineersmay not read the mechanical code, it is very easy for them to miss
Greg Hentschel

CTI Journal, Vol. 31, No. 1 55

CTI Journal, Vol. 31, No. 156
the structural requirements. In addition, many mechanical engi-neers and contractors do not understand the references in FBC-Mechanical to FBC-Building and fail to investigate.So where are the structural requirements for evaporative coolingequipment? For new mechanical construction, the first place tostart is FBC 2004–Mechanical, sections 301 and 908 [1].
301.12 Wind resistance.Mechanical equipment, appliances and supports that are exposedto wind shall be designed and installed to resist the wind pres-sures on the equipment and the supports as determined in accor-dance with the Florida Building Code, Building ...Here the code clearly states that the mechanical equipment shall bedesigned and installed to resist the wind pressure on the equip-ment and supports. So the answer is that both structure and an-chorage are required.In addition to section 301.12, the mechanical code also states thefollowing in section 908.1 [1]:
908.1 General.A cooling tower used in conjunction with an air-conditioningappliance shall be installed in accordance with the manufacturer’sinstallation instructions. The design of such cooling towers shallbe in accordance with the requirements of the Florida BuildingCode, Building for a structure.Here again, the code reinforces that the equipment must be de-signed per the FBC Building ‘for a structure’. And lastly section908.4 specifically addresses the supports and anchorage [1].
908.4 Support and anchorage.Supports for cooling towers, evaporative condensers and fluidcoolers shall be designed in accordance with the Florida Build-ing Code, Building.As a final confirmation, SPX Cooling Technologies submitted forruling two cases to the State of Florida Building Commission; onefor new construction and one for a level one alteration of an exist-ing building. The following was confirmed by Conclusion of Lawfor new construction [9]:
• The Florida Building Commission has the authority to inter-pret the FBC.
• Section 301.13, Florida Building Code, Mechanical statesthat mechanical equipment exposed to wind shall be designedand installed to resists the wind on equipment and supportsper Florida Building Code, Building.
• Section 908.1, Florida Building Code, Mechanical states thatcooling towers used in conjunction with air-condition appli-ance shall be designed per the Florida Building Code, Build-ing for a structure.
• Construction documents shall have all pertinent informa-tion per section 1604.5 of FBC, Building.
• Section 1609.1 states that structures shall be designed towithstand the minimum wind load prescribed and that de-creases shall not be made for the effect of shielding by otherstructures.
• The code requires the structure and anchorage of exteriormounted cooling towers to be designed to withstand the
applied wind force and the design must be included with theconstruction documents.
The following was confirmed by Conclusion of Law for existingconstruction [4]:
• The Florida Building Commission has the authority to inter-pret the FBC.
• Section 407.1.2 of the FBC states the wind design of existingbuildings shall be in accordance with the building codesthat were in effect when the building was permitted. Thisapplies to repairs not Level 1 alterations.
• Section 503.3 of the FBC states all new work shall complywith materials and methods in the FBC.
• Section 507.1 of the FBC states where work includes re-placement of equipment that is supported by the buildingthe structural provisions of this section apply.
• Where replacement of equipment results in additional deadloads, structural requirements shall comply with the verticalload requirements of the FBC Building.
• The Code requires the structure and anchorage of exteriormounted cooling towers that are subject to the forces ofwind to be designed to withstand the applied wind force.
• Mechanical equipment structure and support anchoragebeing replaced during a level 1 alteration shall meet the winddesign criteria of the current code, not the code in effectwhen the building was originally constructed or permitted.
Level 1 alterations are covered in Section 303.1 of FBC-ExistingBuilding [6]. See excerpt below:
303.1 ScopeLevel 1 alterations include the removal and replacement or the cov-ering of existing materials, elements, equipment, or fixtures usingnew materials, elements, equipment, or fixtures that serve the samepurpose. Level 1 alterations shall not include any removal, replace-ment or covering of existing materials, elements, equipment or fix-tures undertaken for purpose of repair…To summarize, minor repairs (not Level 1 alterations) must adhere tothe code in use when the building was permitted. Level 1 alter-ations and new buildings must adhere to the current FBC. Allcooling towers must be designed to meet the FBC wind load re-quirements for both structure and anchorage.From the above, it is clear that FBC-Building structural wind loadcriteria are required for cooling towers, fluid coolers and evapora-tive condensers. It will be left to the FBC and ASCE documents todemonstrate the calculations that provide the lb per sq. ft. (PSF)wind load requirement. More detail can be obtained by referencingthe following sections of FBC-Building [6].1609.1 Applications1609.3 Basic Wind Speed1609.4 Exposure Category1609.5 Importance FactorIn addition, high velocity hurricane zones are defined as Browardand Dade counties. For these regions consult the following: Sec-tions 1612.1.3, 1620 and 1621. As a side note, on March 1,2009, FBC2007 will become effective. In this new version there will be some

CTI Journal, Vol. 31, No. 1 57

CTI Journal, Vol. 31, No. 158
changes to the exposure categories as well as references and asso-ciated changes from ASCE 7-02 to 7-05. If you are involved in thedesign of new buildings in Florida, make sure your design engi-neers are aware of the new code and its requirements.Exception – The FBC does not have jurisdiction and does not ap-ply to Federal installations
ResponsibilitiesThe engineer, contractor, code officials, owner and equipment manu-facturer all have a responsibility to comply with the FBC. However,it all starts with the building design engineer or Project Engineer ofRecord. It is the engineer of record’s responsibility to manage theconstruction documents relating to the structural calculations asindicated in FBC-Building Section 1603.1, and provide the requiredinformation per Section 1603.1.4 [6]. The requirements of 1603.1.4are shown below [6]. In addition to this, per FBC-Building Section106.1, all construction documents are to be prepared by designprofessionals and in the case of engineers, must be a licensedprofessional engineer[1]. See the supporting documentation be-low:
106.1 Submittal documents.…The construction documents shall be prepared by a design pro-fessional where required by the statutes.If the design professional is an architect or engineer legally reg-istered under the laws of this state regulating the practice of ar-chitecture as provided for in Chapter 481, Florida Statutes, PartI, or engineering as provided for in Chapter 471, Florida Stat-utes, then he or she shall affix his or her official seal to said draw-ings, specifications and accompanying data, as required byFlorida Statute.
Chapter 471 [5]…All final drawings, specifications, plans, reports, or documentsprepared or issued by the licensee and being filed for public recordand all final documents provided to the owner or the owner’s repre-sentative shall be signed by the licensee, dated, and sealed…1603.1.4 Wind design data.The following information related to wind loads shall be shown,regardless of whether wind loads govern the design of the lateral-force-resisting system of the building:
1. Basic wind speed (3-second gust), miles per hour (km/hr).2. Wind importance factor, I W and building classification
from Table 1604.5 or Table 6-1, ASCE 7 and building classi-fication in Table 1-1, ASCE 7.
3. Wind exposure, if more than one wind exposure is utilized,the wind exposure and applicable wind direction shall beindicated
4. The applicable enclosure classifications and, if designingwith ASCE 7, internal pressure coefficient.
5. Components and cladding. The design wind pressures interms of psf (kN/m 2 ) to be used for the design of exteriorcomponent and cladding materials not specifically designedby the registered design professional.
At this point it is the project engineer of record who is responsiblefor the structural design of the evaporative cooling equipment.However, once the engineer of record obtains the above informa-
tion, he or she can perform the final equipment structural review (ifso qualified) or delegate the analysis to a qualified engineer. TheFlorida Board of Professional Engineers Statutes and Rules definesthis relationship and responsibility [5].
Chapter 61G15-30Delegated Engineer. A Florida professional engineer…the delegatedengineer is the engineer of record for that portion of the project.
Chapter 61G15-23…A professional engineer may only seal an engineering report,plan, print or specification if that engineer was in responsible chargeof the preparation and production of the engineering documentand the professional engineer has the expertise in the engineeringdiscipline used in producing the engineering document in ques-tion.In most instances the final structural analysis for the equipment issent to the manufacturer. If this is the case, the manufacturer canbe responsible for the following:
• Conform to anchorage and structural requirements outlinedby the project engineer of record.
• Provide support reactions.• Provide anchorage attachment details.• Provide certification of the equipment wind load capability
(PSF).If the manufacturer cannot provide certification by a qualified FloridaState structural P.E., then the burden of responsibility still remainson the project’s engineer of record or his delegated engineer. Itshould be pointed out that if the cooling equipment structural re-view is delegated to the manufacturer, the manufacturer is NOTresponsible for defining the building criteria in Section 1603.1.4.Even though clearly stated, there are challenges with these require-ments. For example, project engineers of record must find capablestructural engineers to perform the analysis or do the equipmentreview themselves if qualified. This is highly unlikely consideringthe time involved in analyzing an unfamiliar product.To remedy this and simplify the process, some manufacturers havestarted providing the structural design review and Florida State PEseal or “Certification”. Certification is defined in the Florida PEStatutes in chapter 61G15-18 [5]
Chapter 61G15-18.011“Certification” shall mean a statement signed and/or sealed by aprofessional engineer representing that the engineering servicesaddressed therein…have been performed by the professional engi-neer, and based upon the professional engineer’s knowledge, in-formation, belief, and in accordance with commonly accepted pro-cedures [are] consistent with applicable standards of practice…This allows the Engineer of Record, the contractor or anyone de-signing or modifying a building the simplicity of having the manu-facturer provide the necessary documentation with regard to thePSF wind load capability of the equipment. It also ensures it isdesigned by a qualified licensed engineer.As for the local building department, the Florida Department ofCommunity Affairs does a good job of summarizing the responsi-bilities by all current possible titles [7]. They are as follows:

CTI Journal, Vol. 31, No. 1 59

CTI Journal, Vol. 31, No. 160
“Building code administrator or building official – directly respon-sible for plan review, enforcement, and inspection of construction,repairs, additions, alterations, remodeling…requiring a permit toshow compliance with construction codes as specified by statelaw...”“Building code inspector – responsible for construction regula-tions and inspection of projects that require a permit to show com-pliance with construction codes.”“Plans examiner – person qualified to determine whether buildingor other plans submitted comply with applicable constructioncodes.”“Building code enforcement official or enforcement official – li-censed building code administrator, building code inspector, orplans examiner whose responsibilities are spelled out in section468.604, Florida Statutes.”Regardless of the title, the expectation of responsibility is clear.The local code officials are responsible for reviewing the construc-tion documents and making sure they follow FBC requirements.They are also responsible for enforcement.
Summary• The Florida Building Code takes precedence over all local
Florida codes.• FBC-Mechanical 908.1/908.4 must be followed for evapora-
tive cooling equipment (cooling towers, evaporative con-densers, and fluid coolers).
• Evaporative cooling equipment must be designed as a struc-ture per the Mechanical code (FBC-Mechanical).
• The structural code (FBC-Building) defines the lbs per sq. ft.(PSF) the equipment must meet.
The building design engineer (project engineer of record) or con-tractor responsibilities:
• Adhere to FBC-Building 1603.1.4• Provide site specific wind load (PSF) requirement• Provide wind speed (three second gust)• Provide Wind Importance Factor• Provide Wind Exposure• Provide Elevation to Base of Tower• Ensure the structural capabilities of the evaporative cooling
equipment has been reviewed by a qualified licensed FloridaState professional engineer unless he passes that responsi-bility to a Delegated Engineer per Florida State rules andguidelines.
Manufacturer• Ensure the evaporative cooling equipment conforms to the
anchorage and structural requirements provided by the Build-ing Design Engineer
• Provide support reactions• Provide anchorage attachment details• Provide certification of evaporative cooling equipment wind
load structural and anchorage capability.
Local Florida Code Official• Understand the FBC requirements• Understand that FBC-Mechanical refers to FBC-Building and
that FBC-Building is used to determine the PSF requirementfor evaporative cooling equipment.
• Review construction documents• Ensure all parties adhere to the FBC• Ensure that the structural design has been reviewed and
sealed by a licensed Florida structural PE.• Enforce non-compliance
Owner• Is ultimately responsible for the building and the safety of
those who use it. Not only is it the law, but it is also in theirbest interest and the public’s to make sure their project isdesigned correctly.
References[1] Florida Building Code - Mechanical. Florida. 2004th ed.
Falls Church, VA: International Code Council, 2004.[2] Blair, Jeff A. Florida Building Commission Milestones
July 1996 to Present. Florida. Florida State University.Florida Conflict Resolution Consortium. Tallahassee, FL:Florida State University, 2008.
[3] Part VI Engineering and Construction Regulations.Broward County. Broward County, FL, 1994. 1-21.
[4] Declaratory Statement SPX Cooling Technologies, Inc.,No. DCA07-DEC-183 (State of Florida Building Commis-sion February 6, 2008).
[5] Laws and Rules Chapter 471 Florida Statutes and RulesChapter 61G15 Florida Administrative Code. Florida.Florida Board of Professional Engineers. Tallahassee, FL,2008.
[6] Florida Building Code - Building. Florida. 2004th ed. FallsChurch, VA: International Code Council, 2004.
[7] “Local Building Department Responsibilities.” BuildingCodes and Standards. Florida Department of CommunityAffairs. 7 Nov. 2008 <http://www.dca.state.fl.us/fbc/publications/fact_sheets_0307responsibilityofbuildingdepartments060305revised.pdf>.
[8] Florida Building Code – Existing Building. Florida. 2004thed. Falls Church, VA: International Code Council, 2004.
[9] Declaratory Statement SPX Cooling Technologies, Inc.,No. DCA07-DEC-182 (State of Florida Building Commis-sion February 6, 2008).

CTI Journal, Vol. 31, No. 1 61

CTI Journal, Vol. 31, No. 162
AbstractSensitive paper has long been used to detectdroplet impingement in several processes, in-cluding drift measurement. Identifying, count-ing, and measuring the individual droplet stainshas been a tedious, laborintensive task involv-ing microscopic examination and statistical ex-trapolation; because, counting all the stains haspreviously been impractical. Digital techniquesnow in common use, however can reduce thispreviously laborintensive task to a rather simpleone of graphical data screening. Furthermore,all the stains are counted, reducing the uncer-
can take quite a while to complete the process-ing of samples from a single test.This processhas been known to take weeks to complete andis done away from the site of the measurements.Returning for more data was also not consid-ered practical. This is the motivation for devel-oping the current digital processing.
Digital Processing of theSensitive PapersPrecision digital color scanners are now readilyavailable. These units are surprisingly inexpen-sive, quickly installed, easy to use, and comewith powerful software. While their intendedpurpose is primarily photographic, they can beused for a variety of other tasks. One such pur-pose would be eliminating the microscope andprojector from this sensitive paper examination.
A Digital Method for Analyzing Dropletson Sensitive PaperDudley J. Benton, Ph.D., PrincipalEngineer McHale & Associates, Inc.,Knoxville, TN
tainty of the results. The conventional (manual/optical) and digitalmethods are compared for actual samples as well as the effort andequipment involved.
IntroductionThe sensitive paper method of measuring droplet count and sizedistribution was developed by J. D. Womack in the 1970s at theEnvironmental Systems Corporation. The sensitive paper is pre-pared by first soaking it in a solution of Potassium Ferricyanide[K3Fe(CN)6] and allowing it to dry. Then the paper is dusted withFerrous Ammonium Sulfate [Fe(NH4)2(SO4)2·6H2O] powder. The re-sulting surface is ferric yellow in color. When any moisture, such asa droplet, comes in contact with the paper, it produces a deep am-monium blue stain. The relationship between droplet and stain sizewas determined by a series of experiments using precision-gener-ated drops as described in the Appendix. Frequently, 47 mm diam-eter filter papers are used for convenience and consistency.Traditionally, the stains are examined with a microscope and thesize, shape, and number are used to infer the count and size distri-bution of the impinging droplets. As there may be hundreds, eventhousands of stains on a single paper, a statistical approximationhas traditionally been used rather than an exhaustive examination.In this practice, a series of precision grids are overlaid on the paperand the stains fitting within several grid cells are counted. Thecounting continues from cell-to-cell until some statistical measureof sample significance is met. The examination can be facilitated byusing a magnifying projection device, a digitizing tablet, computersoftware, and an audible signal.This process has been successfully carried-out for decades andhas provided a reliable and accurate way of measuring airbornetransport of droplets. Still, it is very labor-intensive. Tests oftenrequire dozens and may require hundreds of papers. Consideringthe limited equipment and trained technicians required for thistask—not to mention the individual endurance for such tedium—it
Dudley J. Benton
The same manual counting methodology and statistical samplingcould be applied to the scanned papers. This would at least pre-serve them digitally from any degradation or contamination withmoisture during storage while they await processing. Given theubiquitous availability of computing power, the logical next step isdigital processing.Several scan resolutions were tested and 4800 dpi (dots per inch)was found to be adequate. At this resolution a 47 mm sensitivepaper results in an 8800x8800 pixel image. With default JPEG com-pression each scan produces a file of approximately 4 MB in size.In order to digitally determine the size and quantity of the droplets,it is essential to delineate what is and is not a droplet-formed stainand to distinguish one stain from another. Ultimately, the stainsmust be converted to individual closed polygons. A single poly-gon may represent more than one overlapping droplet; but thissituation exists whether the processing is optical/human or digital/automated. Once the stains are reduced to polygons, a variety ofstatistical tests can be performed. Additionally, the papers can beexamined exhaustively. Approximation by statistical sampling ofpart of the paper is no longer necessary.The ammonium blue on ferric yellow of the sensitive paper tech-nique is particularly well-suited to digital analysis, as this colorcombination provides excellent contrast; because ferric yellow andammonium blue are almost color counterparts. Simple black-and-white rendering does not adequately reveal just how fortuitousthis color combination is. Gray shade discrimination is inherently amater of degrees: How light is white? How dark is black? Ferricyellow/ammonium blue discrimination is much easier.
All Color Separations are EqualAs children we were taught that the three primary colors are: red,yellow, and blue. As well-intentioned as they might have been, ourteachers were misinformed. In fact, one set of primary colors is:magenta, yellow, and cyan. Another set of primary colors is: red,

CTI Journal, Vol. 31, No. 1 63

CTI Journal, Vol. 31, No. 164
green, and blue. Except that, if this green is the color of grass, thecorresponding red isn’t the color of fire trucks and the other isn’tthe color of the deep blue sea. [Realization of this foundationalmisconception can be quite disturbing for some people!]The fact is, that there are an infinite number of primary colors, inthat all other colors can be made from an infinite number of sets ofthree. The only requirement is that the colors comprising a set ofthree (triad) bear a certain relationship to each other. All color sepa-rations are equally valid, provided they are based on a proper triad.A CMY (cyan, magenta, yellow) color separation is just as valid asan RGB (red, green, blue) separation. Some color separations aremore useful than others depending on the availability of ink or thedesire to assure that the grass is always green on television.This is where the definitions of hue, saturation, and luminositybecome useful. The position of a color in HSL-space is defined inspherical coordinates. Hue is what we ordinarily think of as color.The hue axis is basically that of the rainbow and varies from 0 to360°. In spherical coordinates hue is analogous to longitude. Satu-ration is what we ordinarily think of as the purity of a color andvaries from 0 to 100%. The saturation axis is analogous to theradius: 0% being the center and 100% being the surface. Luminos-ity, which is what we ordinarily think of as brilliance, varies from -180° to +180°. The luminosity axis is analogous to latitude.The color sphere shown in Figure 1 was developed by Philipp OttoRunge (1810). Any simple, non-metallic color can be representedby its HSL coordinate triad. [Note: In computer systems it is com-mon to use a scale of 0255 for hue, saturation, and luminosity.]There is also an equivalent RGB coordinate triad for the same coloras well as a CMY coordinate triad. Simple relationships are readilyavailable for converting from one coordinate triad to the other.Most graphics programs provide the common color coordinate trans-formations internally. The formulae are available from many sources,including Wikipedia (2008).
Figure 1. P. O. Runge’s Color Sphere
The essential requirement for a valid color separation triad is thatthe three primary colors have 100% saturation, 0° luminosity, andbe 120° apart in hue. If you choose one color the other two areautomatically defined. Color television transmission is based ongreen so that the grass in a football field always looks good; be-cause it’s generated by the green color “gun,” which never re-quires hue adjustment. Red and blue naturally follow from the se-lection of green. Color ink cartridges are based on CMY; becauseyellow is the most difficult color to produce with blended ink, al-though some very old or specialized printers use RGB ink. Interest-ingly, the yellow pigment used in ink cartridges is ferric-based, justlike the sensitive papers.By transforming the color triad from one coordinate system to an-other, any desired color separation can be easily achieved. This isparticularly convenient for 24bit or 3byte color, which is the mostcommon storage format for digitized images. If a custom color sepa-ration is performed, based on a triad, one color of which exactlymatches the ferric yellow of the unstained sensitive paper, the dis-tinction between stained and unstained areas will be maximal. Theferric yellow has a hue of 56° (RGB: 255, 240, 1). Banana yellow hasa hue of 60° (RGB: 255, 255, 0). The other two colors in this sensi-tive paper-tailored color separation triad are turquoise at 176° (RGB:1, 255, 240) and lavender at 296° (RGB: 240, 255, 1). Ammonium bluehas a hue of 190° (RGB: 1, 210, 255); whereas cyan has a hue of 180°(RGB: 128, 255, 128). The difference in hues between ferric yellowand ammonium blue is then 134°. [Exact color counterparts are 120°apart.]
Figure 2. Gray-Scale
The effect of this custom color separation can be achieved digitallyby several means. Custom software is one method and is the obvi-ous choice considering the subsequent identification and analysisof the polygons. The same effect can be achieved using the photo-graph manipulation software that comes with most scanners byrotating the hue of the scanned image by +4° and performing aCMY color separation or by rotating it -56° and performing an RGB

CTI Journal, Vol. 31, No. 1 65

CTI Journal, Vol. 31, No. 166
color separation. [Rotation is accomplished using the “hue adjust-ment” feature.] The advantage of performing this specialized colorseparation can be seen by comparing the relative contrast availablein a gray-scale vs. the three color separations as shown in Figures3 through 6.
Figure 3. Ferric Yellow Separation
Figure 4. Turquoise Separation
For this particular paper the degree of unadjusted contrast be-tween the ferric yellow and turquoise (unstained and stained) im-ages obtained by custom color separation is 1.8 times that of the
contrast between white and black (unstained and stained) in thegray-scale image (c.f., Figures 2 and 5). For the papers analyzed thiscontrast enhancement varied from 1.6 to 2.3 with an average of 1.9.Recognizing and utilizing the fortuitous contrast between the ferricyellow and ammonium blue colors basically doubles the distinctionbetween unstained and stained areas. [The degree of contrast istypically displayed on the luminance histogram and varies from 0to 100%.]
Reduction to PolylinesThe next step in the process of digital analysis is reducing thestained areas to closed, continuous polygons (polylines). This isaccomplished by the color transformation known as “solarization”followed by taking the negative of solarized image and performinga logical NOT operation on the two images (solarized and non-solarized). The solarization transformation is defined by a thresh-old value: pixels having a luminosity above the threshold value arechanged to black while those below the threshold are changed towhite. Either the ferric yellow or turquoise separated images can beused. The turquoise image is preferable, as it always has less noise.Stray marks, fingerprints, and dust on the scanner are much lesslikely to have a predominantly ammonium blue color componentthan is an actual stain (c.f., Figures 3 and 5). [There is little usefulinformation in the lavender image; so it is discarded.]While this process doesn’t necessarily require custom software, itcan be very helpful and greatly speed the process. Selection of thethreshold value is critical, as exposure varies from one scannedpaper to the next. Photographic manipulation software, such asthat which typically comes with the scanner, can perform thesesteps sequentially and the optimum threshold value can be se-lected by trial-and-error in a multi-step process. Custom softwaredeveloped by the author allows a technician to quickly select thethreshold value with a slider and see the results immediately inenhanced color rather than black-and-white. The unstained areas
Figure 5. Lavender Separation

CTI Journal, Vol. 31, No. 1 67

CTI Journal, Vol. 31, No. 168
are displayed as pure ferric yellow (below the user-defined thresh-old luminosity) and the stained areas are displayed as pure ammo-nium blue (above the threshold) with black borders separating thetwo (equal to the threshold). The black borders become thepolylines. A simple contour collection algorithm is then used toconcatenate the contiguous black pixels into digital line segments.A typical processed image is shown in Figure 6 with a close-up inFigure 7.
Dealing with AnomaliesIf all of the stains were circular and non-overlapping, the rest of theprocess would be quite simple: compute the diameters and countthe stains. There are, however, several common anomalies whichmust be addressed, including: irregularly-shaped stains and over-lapping stains. These must be considered, regardless of the meth-odology, whether optical/manual or digital/automated.Streaked or elongated stains as identified in Figure 7 were investi-gated experimentally by the Environmental Systems Corporation(Webb and Culver 1979). These experiments indicated that the mi-nor diameter should be used, as the extent of elongation was in-dicative of impingement rather than size.Overlapping stains are also identified in Figure 7. These can behandled numerically and can optionally be highlighted for atten-tion by a technician. A non-overlapping, elongated stain (e.g., oneshaped like a zucchini squash) will have an area closely equal tothat of an ellipse: the product of the major and minor diameterstimes ð/4; however, an overlapping stain (e.g., one shaped like apeanut or Mickey Mouse ears) will not; because the elongatedstain is convex; whereas, the overlapping stain is not. The locationof the stains on the paper is not of interest; therefore, the polygonscan be sorted and re-displayed in order of increasing size or con-vexity. Two common types of anomalies are shown in Figures 8 and9.
Of the 2249 polyline objects shown in Figure 6, only 13 (0.6%) aredegenerate. Upon examination these appeared to be scratches,streaks, or hairlines, rather than stains formed by droplets, andwere discarded as irrelevant artifacts. These degenerate objectswere easily identified; because they have an eccentricity (ratio ofthe minor to major diameters) much less than 1. [Eccentricity rangesfrom 0 to 1. Almost all of the objects have an eccentricity signifi-cantly greater than 0.1.]Convexity is the ratio of the polygonal area to the area of the in-scribed circle. If the polygon were a circle, the value would be 1. Ifthe polygon were a square, the value would be 4/ð. Convexityranges from 0 to 4/ð. Of the 2249 polyline objects shown in Figure
Figure 6. Typical Polylines
Figure 7. Common Anomalies
Figure 8. Overlapping Stains

CTI Journal, Vol. 31, No. 1 69

CTI Journal, Vol. 31, No. 170
Figure 9. Other Anomalies
6, only 28 (1.2%) exhibit the type of anomalous behavior illustratedin Figures 8 and 9. These all have a convexity less than 0.5. Almostall of the other objects have a convexity significantly greater than0.5; so these are also easily identified computationally. If the anoma-lies are sufficiently few, they could simply be discarded.There are several ways to interpret the anomalies shown in Figures8 and 9. One possible interpretation is to speculate as to the roundstains which might coalesce to form the resultant complex stain,then subdivide the polygon accordingly. This could be done manu-ally or possibly automated, provided some sufficiently accuratealgorithm could be developed. For the current analysis this wasdone manually using a polygon editor developed by the Author.
Size DistributionOnce the equivalent stain diameters have been determined, the sizedistribution is determined by first dividing the range of diametersinto equal intervals (or “bins”) based on the logarithm, then count-ing the number of stains that fall into each interval. More binsresult in greater resolution along the log(diameter) axis, but lessresolution along the count-per-bin axis, as the total number re-mains constant. The number of bins is a trade-off, especially whenthe total number of stains is small. The stain diameter distributionfor the paper shown in Figure 6 is given in Figure 10.
Two bin sizes are illustrated in Figure 10: 25 and 50. The actual(times 1) count is shown for the 25 bin curve. The count is doubled(times 2) for the 50 bin curve. The total number of stains is con-stant; so this makes the two lines have the same order of magni-tude. This completes the digital analysis of the sensitive paper.
SummaryIn summary, a digital method has been presented for analyzingwater droplet stains on sensitive paper. This method begins byscanning the paper at a resolution of approximately 4800 dpi. Acolor separation is then performed in order to maximize the contrastbetween the paper and the stains. A solarization filter is appliedalong with a logical pixel operation which eliminates everything butthe borders surrounding the stains. The borders are concatenatedto form continuous, closed polygons. The eccentricity and con-vexity of the polygons is used to eliminate extraneous objects andidentify anomalies such as incomplete and overlapping stains. Theanomalous polygons are corrected or discarded. The equivalentdiameters are divided into statistical bins and counted in order todetermine the size distribution.
ConclusionsThe digital method described herein is straight-forward and easilyimplemented using readily available, inexpensive equipment—atleast when compared to the traditional method, which involves amicroscope, projector, digitizing tablet, and much tedium. The soft-ware that comes with most scanners can be used to accomplish thegraphical tasks. Customized software can streamline this processand further reduce time and effort. Anomalous stains are relativelyfew and must be handled regardless of the method, whether tradi-tional or digital. Digital analysis of droplets on sensitive paper isthe logical next step for this measurement technique.
RecommendationsThe digital method described herein should be implemented andbecome the standard approach to analyzing sensitive paper data.Tests should be performed comparing this method to the tradi-tional one. This could be accomplished as part of a future datacollection effort or be based on a past effort, provided the sensitivepapers (or photographs) are available and in good condition. Acomputational algorithm should be developed to handle the anoma-lous stains, possibly eliminating this manual step.
ReferencesRunge, P. O. (1810) “FarbenKugel oder Construction desVerhältnisses aller Mischungen der Farben zu einander, und ihrervollständigen Affinität, mit angehängtem Versuch einer Ableitungder Harmonie in den Zusammenstellungen der Farben,” Hamburg:Friedrich Perthes (as quoted in Wikipedia 2008).Webb, R. O. and E. D. Culver (1979) “Calibration Study of SpecialWater Sensitive Paper Including Droplet Impaction at ObliqueAngles,” Environmental Systems Corporation Report for the Elec-tric Power Research Institute, RP 1260-3, Amendment No. 1.Wikipedia (2008) “HSL and HSV,” http://en.wikipedia.org/wiki/HSL_color_space
Figure 10. Stain Diameter Distribution

CTI Journal, Vol. 31, No. 1 71
Appendix: Drop vs. Stain SizeAs mentioned previously, experiments were performed by Womack,Culver, Webb, and others in order to quantify various aspects ofthe droplet/sensitive paper interactions. A key relationship is thatbetween initial droplet size and stain size. This is essential in orderfor the sensitive paper results to be useful. Precision droplet gen-erators were used to create drops which were captured on sensitivepapers and the stains measured. Webb and Culver (1979) providedthe following figure summarizing these data.
Figure 11. Droplet vs. Stain Size

CTI Journal, Vol. 31, No. 172
A Systematic Review of Biocides Usedin Cooling Towers for the Prevention andControl of Legionella spp. Contamination
Kelly RangelUniversity of TexasHealth and Science Center
AbstractIntroduction: The use of biocides is very impor-tant for controlling Legionella contamination inevaporative cooling systems. This study is asystematic review of research studies that evalu-ated the effectiveness of biocides in evaporativecooling systems for Legionella control.Methods: Published journal articles, dating from1980-2008, were included if theses studies werefield test of biocides against Legionella in oper-
9.2, a temperature range of 25oC to 45oC which pro-vides optimal growing conditions for Legionellaspecies (spp.) (Bartram, Chartier, Lee, Pond, &Surman-Lee, 2007). Biocides are only one smallpart of controlling the Legionella contamination.The objective of this study was to do a systematicreview of journal articles that investigated the effi-ciency of biocides to reduce the Legionella popu-lation in evaporative cooling systems.
MethodsA systematic review was conducted of journal ar-ticles published from 1980 to 2008. The journalarticles were found using the following search en-gines: PubMed, PubMed Central, Ovid Medline,
ating cooling systems or tests preformed in a model cooling systemthat was spiked with Legionella spp. or used actual cooling watercollected from an operating cooling system.Results: Of the 52 journals produced from the systematic review, 20articles meet the inclusion criteria. The types of biocide studiesincluded 9 articles that tested only chemical biocides, 3 articles thattested only non-chemical biocides, and 8 articles that comparedchemical and non-chemical biocides.Discussion: The common end point for most of these studies wasthe measured reduction in the Legionella count in the coolingwater after the addition of the biocide. There were not many stud-ies conducted on the same kinds of biocides. When the samebiocides were tested in more than one study, the results rarelyagreed. Also, scientific statistics were rarely applied to the out-comes in many of these studies.Future Research: Biocides need more field testing in order to gen-erate better scientific evidence as to their effectiveness againstLegionella spp. in operating evaporative cooling systems.
IntroductionLegionella is a family of bacteria that causes Legionnaires’ diseaseand Pontiac fever, collectively known as legionellosis. Many out-breaks of legionellosis have been attributed to infected evapora-tive cooling systems including the first recorded outbreak at theBellevue-Stratford hotel in Philadelphia, PA in 1979 (Respiratoryinfection- Pennsylania.1997). The Center for Disease Control andPrevention estimates 10,000 to more than 100,000 cases occur eachyear with a case-fatality rate of 8% (Hicks et al., 2007; Sheldon,Kerbel, Witherall, & Millar, 2000). Since the first recorded outbreakof legionellosis, an effort has been made to establish the best main-tenance practices in evaporative cooling systems to controlLegionella contamination and prevent further legionellosis out-breaks. Evaporative cooling systems operate at a pH range of 6.8 to
Google, Google Scholar, Highwire Press, Academic Universe, andSpringerlink. Key words used to locate these journals included:“Legionella and biocides”, “biocides and cooling towers”, “bio-cides and cooling water”, “Legionella and cooling towers”, “bio-cides and Legionella and cooling towers”, and Legionnaires’ dis-ease prevention”. Also, the bibliographies of any relevant pub-lished literature were also searched for other pertinent articles. Allstudy designs will be included as long as they meet the other inclu-sion criteria. The inclusion criteria consists of published studiesthat contain the following information: biocides used againstLegionella in cooling towers, experiments performed in a coolingtower or model cooling system, uses Legionella bacteria isolatedfrom the water of an operating cooling system or the water from anoperating cooling system, the studies must be written in English,and are readily available. Journals not in English, not readily avail-able, studies preformed with tap water infused with Legionellaspecies from the American Type Culture Collection (ATCC) cellbank were eliminated from the study. Study papers presented atconferences were included as long as they met the inclusion crite-ria. These references were organized using Refworks©.
ResultsThe journal search produced 489 papers. Of these, only 52 wererelevant to Legionella control in evaporative cooling systems.Applying the inclusion criteria produced 20 papers. The studytypes of these papers incorporated 16 experimental studies, 3 cross-sectional studies and one cost-effectiveness analysis. The typesof biocides studied were as follows: 9 articles that tested only chemi-cal biocides, 3 articles that tested only non-chemical biocides, and8 articles that compared chemical versus non-chemical biocides.Tables 1 through 3 provide a brief summary of each article by dis-playing the study design, sample size and description, the locationwhere the study was conducted, the type of biocides studied, andthe results of each study.
Kelly Rangel

CTI Journal, Vol. 31, No. 1 73

CTI Journal, Vol. 31, No. 174
Chemical BiocidesTable 1 describes the articles that only studied chemical biocides.The majority of these studies were conducted in the US, 2 wereconducted in the UK, one in South Australia, and one in Spain.Three of these studies were conducted in a lab setting. One ofthese lab studies used Legionella species isolated from coolingwater and tested 8 different biocides, both alone and in combina-tion (Garcia & Pelaz, 2008). The other two used Legionella speciesfrom ATCC in water samples collected from cooling towers andtested one biocide each (McCoy, Wireman, & Lashen, 1986; McCoy& Wireman, 1989). The endpoints of these studies were the fastestand most significant bacterial count reduction at different concen-trations of biocide and pH. Four of the chemical biocide studieswere long term field trials of biocides in cooling towers (Bentham &Broadbent, 1995; Fliermans & Harvey, 1984; Prince et al., 2002).Two of these studies collected water samples before biocide treat-ment within a 2 week to 5 month period, and then collected watersamples after the biocide treatment for an additional 4-5 months.The other two studies randomly selected 14 or 16 cooling towers totreatment or control groups. Both trials lasted for 4 weeks withwater samples taken from twice a week to every two weeks. Theremaining two studies were cross-sectional studies. The first studygathered 2590 water samples from 1000 cooling towers in nine USstates and reviewed the prevalence of Legionella and highLegionella counts in cooling towers utilizing eight different bio-cides both singly and in combination (Miller & Koebel, 2006). Theother cross-sectional study simply reviewed the prevalence of bio-cide use among refinery and power plant cooling systems (Veil,Rice, & Raivel, 1997).
Non-Chemical BiocidesTable 2 describes the articles that only tested non-chemical bio-cides. Non-chemical biocide studies were reported in 3 articles.Two of them used an experimental study design and one was across-sectional study. Among these studies, one was conductedin the US, one in Finland, and one in South Australia. Two of thesearticles were long term field trials: one testing the e-disinfector(electrolytic disinfection) and the other testing ultra-violet irradia-tion (Forstmeier, Wozny, Buss, & Tolle, 2005; Kusnetsov et al.,1994). The UV-lamp field trial lasted for 33 days while the e-disinfector field trial lasted for 7 weeks. In both of these trials,before treatment and after treatment water samples were taken andthe Legionella counts were compared. The remaining article was across-sectional study that collected 13 water samples from a singlecooling tower over an unspecified period of months. The goal ofthis study was to establish correlations between Legionella growthand one or more of the following variables: alkalinity, pH and cer-tain dissolved minerals.
Chemical versus Non-ChemicalThe last category of articles includes studies that compared chemi-cal biocides to non-chemical biocides in controlling Legionellapopulations (See Table 3). The majority of these studies wereconducted in the US, but one was conducted in Finland and an-other in Japan. Five of these studies were side-by-side field trialscomparing conventional chemical treatments to the non-chemicaltreatments where the cooling towers were randomized to one treat-ment per tower (Bisbee, 2003; Kitzman, Mazaiara, Padgett,Blumenschein, & Smith, 2003; Kusnetsov, Tulkki, Ahonen, &
Martikainen, 1997; Pope, Eichler, Coates, Kramer, & Soracco, 1984;Yamamoto, Ezaki, Ikedo, & Yabuuchi, 1991). The study time framesfor these field trials ranged from 4 months to 2 years. The watersamples were taken from as little as once per month to as much as 5times per week. Two other studies gave one treatment for a lengthof time and then began the second treatment for another period oftime (Gilpin et al., 1985; McGrane & Ditzler, 1994). Each study timeframe for the alternating treatments ranged from 2 hr to 2 monthsper treatment. Gilpin et al. also conducted a cross-sectional studyon one cooling tower where water samples were collected every 2-3 days for 2 months. The goal of this survey was to monitor theLegionella population in this cooling tower which was under chemi-cal treatment (Gilpin et al., 1985). The remaining article was a cost-effectiveness analysis for chemical and non-chemical treatments(Envirometrics Staff, 2004). The goal of this article was to identifythe most useful and cost-effective biocides used in cooling towers.
General ResultsFor some biocides, a consensus on their overall effectivenessagainst Legionella and other heterotropic species simply does notexist. Bromo-chloro-dimethylhydantoin (BCD) was used in threestudies, however there is a not consensus among these studies forBCD (Bentham & Broadbent, 1995; Fliermans & Harvey, 1984;McCoy & Wireman, 1989). Two studies reported that BCD is effec-tive and one reported that it is not effective in reducing Legionellacounts. 2-bromo-2-nitro-propane-1,3-diol (BNPD) was used in threestudies (Bentham & Broadbent, 1995; Kusnetsov et al., 1997;Yamamoto et al., 1991). One study reported BNDP to be ineffective,one reported that it is only temporary effective, and a third studyreported that it was effective at reducing Legionella in coolingwater. Chlorine was used in four studies as a comparison group inthe form of sodium hypochlorite or calcium hypochlorite althoughVeil et al. found it to be the most prevalent among biocides used inpower plants and refineries (Envirometrics Staff, 2004; Garcia &Pelaz, 2008; Gilpin et al., 1985; McGrane & Ditzler, 1994; Veil et al.,1997). These studies found that chlorine was effective in reducingthe Legionella count to 1000CFU/mL or less, but it was ineffectivein reducing the total bacterial count. Five studies used the non-oxidizing biocide iosthiozolone in which two of these studies claimthat it is effective and three which claim that iosthiozolone is inef-fective for controlling Legionella and THC (Garcia & Pelaz, 2008;Kitzman et al., 2003; McCoy et al., 1986; Prince et al., 2002; Yamamotoet al., 1991). Pulse-power system disinfection and ozone were usedin three studies each. PPS and ozone were individually comparedto chemical treatments and found to be more effective than thechemical biocides (Bisbee, 2003; Kitzman et al., 2003; McGrane &Ditzler, 1994; Pope et al., 1984). However, the UV irradiation wasfound to be effective in one study and ineffective in three studiesdue to the fact that the basin was not subjected to the UV-light andthus was able to harbor the proliferating Legionella (Kusnetsov etal., 1994; Yamamoto et al., 1991). Miller et al. reported that all of thecooling towers included in their study harbored Legionella regard-less of the type of chemical biocides used (Miller & Koebel, 2006).The most consistent feature of all the articles was that they all usedthe standard Legionella culture test.
DiscussionThe studies included in this review revealed many different studydesigns and study lengths. The common endpoint was basically

CTI Journal, Vol. 31, No. 1 75
the reduction of Legionella species and, for some, totalheterotrophic species counts (THC) during the time al-lowed. The study designs varied from laboratory ex-periments to randomized field trials to cross-sectionalstudies. For the laboratory studies, the study lengthranged from 1hr to 24hrs. Also the number of biocidesstudied ranged from one, at varying pH levels, to 8, in-cluding all combinations of the 8 biocides. The random-ized field trials also varied in length, frequency of sam-pling, and the use of different biocides. The frequencyof the sampling has recently been proven to be a criticalissue. Bentham and Broadbent in 2000 showed that thesampling of 28 cooling towers twice a week for sixteenweeks yielded means of less than 100 CFU/mL for mostof the cooling towers, but the standard deviations weretypically three times the means. These results showthat the level of Legionella in cooling water is con-stantly in flux (Bentham, 2000). These data question theaccuracy of sampling for Legionella once a week as ameasure of the effectiveness of the biocides.Of the articles included in this study, only a few of themused any actual statistics to report their data and in-stead reported only observational data. The “beforeand after” studies could have used a paired t-test toevaluate whether or not the reduction in the Legionellacounts was truly significant.The studies also varied types of biocides used. Veryfew of the articles incorporated the same biocides andthe results often varied greatly. Many variables in thefield can affect the efficiency of the various types ofbiocides. Some of these include: the turbidity of themake-up water, the pH must be in the correct range, theuse of other chemicals (i.e. anti-corrosion agents andbiodispersants), the total amount of dissolved solids,the amounts of dissolved organic chemicals, and eventhe season (Prince et al., 2002). Other factors for con-trolling Legionella growth include removal of organicand inorganic materials and deposits that can harborLegionella as well as other bacterium and promote theirgrowth (Cooling Technology Institute, 2008). Legionellaspp. have the virus-like ability to reproduce inside ofprotozoa and amoebae (Atlas, 1999; Barbaree, Fields,Feeley, Gorman, & Martin, 1986). So biocides that didnot significantly reduce the THC, allow for the rapid re-colonization of Legionella. Most of these studies onlyfocused on the Legionella count but not the THC.Srikanth and Berk have found that some non-oxidizingbiocides actually stimulate the growth of amoebae incooling towers, and amoebae containing Legionella mayadapt to these biocides (Atlas, 1999; Srikanth & Berk,1993; Srikanth & Berk, 1994). Moreover, most of thesestudies included an initial cleaning phase followed byeither continuous or slug doses of biocide without anyadditional treatments.
Future ResearchAlthough Legionella species are ubiquitous in evapo-rative cooling systems and nearly impossible to elimi-
nate totally, the level of contamination can be controlled to a be-nign state (Bentham, 2000). Deciding which biocides are well suitedto this task is difficult since there is limited field research available.There are many biocides that are commercially available, but few ofthem have been field tested by unbiased parties or compared toother biocides to assess their efficiency. Some biocides, such aschlorine dioxide, have been found to be effective in potable watersystems, but this system has not been fully applied or studied incooling towers (Envirometrics Staff, 2004). According to Yu, manycooling system guidelines recommend conscientious maintenanceto prevent Legionella proliferation, yet there is little data to sup-port “the claim that maintenance minimizes colonization byLegionella and that control measures are useful in preventing out-breaks of Legionnaires’ disease from cooling towers” (Yu, 2008).Clearly, this field of research is still wide open. Science has onlybegun to understand the best practices for Legionella control andprevention. More scientific evidence is needed to back up claimsthat one water treatment program is better than another. In thefuture, well designed scientific studies need to be conducted inorder to establish what the best practices for Legionella controltruly are.

CTI Journal, Vol. 31, No. 176
Table 1: Chemical Biocides, continued
1 Chlorinated phenolic thioether (CPTE), 2-bromo-2-nitro-propane-1,3-diol (BNPD), bromo-chloro-dimethylhydantoin (BCD)2 Minimal bactericidal effect (MBE): The lowest concentration of the disinfectant able to induce bactericidal effect in all of the strains within 24 hours.3 Fastest bactericidal effect (FBE): The lowest concentration of the disinfectant able to induce bactericidal effect in all of the strains within 1 hour.4 2-2-dibromo-3-nitropropionamide (DBNPA), tetra-(hydroxymethyl)phosphonium sulfate (THPS)5 Free residual chlorine
Table 2: Non-chemical biocides Only
1 Total bacteria count (TBC)2 Legionella counts <10 CFU/mL are below the detectable amount for the test.

CTI Journal, Vol. 31, No. 1 77
Table 3: Chemical versus non-chemical biocides
1 Polyhexmethylene-bigluanidechloride (PHMB)2Total Bacterial Count (TBC)3Total Heterotropic bacterical Count (THC)

CTI Journal, Vol. 31, No. 178
ReferencesAtlas, R. M. (1999). Legionella: From environmental habitats todisease pathology, detection, and control. Environmental Micro-biology, 1(4), 283-293.Barbaree, J. M., Fields, B. S., Feeley, J. C., Gorman, G. W., & Martin,W. T. (1986). Isolation of protozoa from water associated with alegionellosis outbreak and demonstration of intracellular multipli-cation of Legionella pneumophila. Applied and EnvironmentalMicrobiology, 51(2), 422-424.Bartram, J., Chartier, Y., Lee, J. V., Pond, K., & Surman-Lee, S. (Eds.).(2007). Legionella and the prevention of legionellosis. India:World Health Organization.Bentham, R. H. (2000). Routine sampling and control of Legionellaspp. in cooling tower water systems. Current Microbiology, 41,271-275.Bentham, R. H., & Broadbent, C. R. (1995). Field trial of biocidesfor control of Legionella in cooling towers. Current Microbiol-ogy, 30, 167-172.Bisbee, D. (2003). Pulse-power water treatment systems for cool-ing towers. Sacramento, CA: Sacramento Municipal Utility Dis-trict.Cooling Technology Institute. (2008). Legionellosis related prac-tice for evaporative cooling water systems (No. STD-159). Hous-ton, TX: Cooling Technology Institute.Envirometrics Staff. (2004). Alternatives to chlorine for cleaningcooling towers. Retrieved 7-29, 2008, fromwww.environmetrics,com/abstracts/main.html
Fliermans, C. B., & Harvey, R. S. (1984). Effectiveness of 1-bromo-3-chloro-5,5-dimethylhydantoin against Legionella pneumophila ina cooling tower. Applied and Environmental Microbiology, 47(6),1307-1310.Forstmeier, M., Wozny, G., Buss, B., & Tolle, J. (2005). Legionellacontrol in cooling towers by electrolytic disinfection. ChemicalEngineering Technology, 28(7), 761-765.Garcia, M. T., & Pelaz, C. (2008). Effectiveness of disinfectants usedin cooling towers against Legionella pneumophila. Chemotherapy,54, 107-116.Gilpin, R. W., Dillon, S. B., Keyser, P., Androkites, A., Berube, M.,Carpendale, N., et al. (1985). Disinfection of circulating water sys-tem by ultraviolet light and halogenation. Water Research, 7, 839-848.Hicks, L. A., Rose, C. E., Fields, B. S., Drees, M. L., Engel, J. P.,Jenkins, P. R., et al. (2007). Increased rain fall is associated withincreased risk for legionellosis. Epidemiology and Infection, 135,811-817.Kitzman, K. A., Mazaiara, E. F., Padgett, B., Blumenschein, C. D., &Smith, A. (2003). Chemical vs. non-chemical cooling water treat-ments- a side-by-side comparison. IWC-03-22, 1-17.Kusnetsov, J. M., Keskitalo, P. J., Ahonen, H. E., Tulkki, A. I.,Mettinen, I. T., & Martikainen, P. J. (1994). Growth of Legionellaand other heterotrophic bacteria in a circulating cooling water sys-tem exposed to ultraviolet irradiation. Journal of Applied Bacteri-ology, 77, 461-466.

CTI Journal, Vol. 31, No. 1 79
Kusnetsov, J. M., Tulkki, A. I., Ahonen, H. E., & Martikainen, P. J.(1997). Efficacy of three prevention strategies against Legionellain cooling water systems. Journal of Applied Microbiology, 82,763-768.Kutz, J. B., Bartlett, C. L. R., Newton, U. A., White, R. A., & Jones, N.L. (1982). Legionella pneumophila in cooling water systems: Re-port of a survey of cooling towers in London and pilot trial of selectbiocides. Journal of Hygiene, 88, 369-381.McCoy, W. F., & Wireman, J. W. (1989). Efficacy ofbromochlorodimethylhydantoin against Legionella pneumophilain industrial cooling water. Journal of Industrial Microbiology, 4,403-408.
McCoy, W. F., Wireman, J. W., & Lashen, E. S.(1986). Efficacy of methylchloro/methylisothiazolone biocide against Legionellapneumophila in cooling tower water. Journal ofIndustrial Microbiology, 1, 49-56.McGrane, W. K., & Ditzler, L. (1994). Cooling towerLegionella pneumophila study: CDC joint re-search project March 28-Aug. 15, 1994. Houston,TX.Miller, R. D., & Koebel, D. A. (2006). Legionellaprevalence in cooling towers: Association withspecific biocide treatments. ASHRAE Journal,112, 700-708.Pope, D. H., Eichler, L. W., Coates, T. F., Kramer, J.F., & Soracco, R. J. (1984). The effect of ozone onLegionella pneumophila and other bacterial popu-lations in cooling towers. Current Microbiology,10, 89-94.Prince, E. L., Muir, A. V. G., Thomas, W. M., Stollard,R. J., Sampson, M., & Lewis, J. A. (2002). An evalu-ation of the efficacy of Aqualox for microbiologi-cal control of industrial cooling tower systems.Journal of Hospital Infection, 52, 243-249.Respiratory Infection- Pennsylvania. (1997). Mor-bidity and Mortality Weekly Report, 46(3), 49-56.Sheldon, B. G., Kerbel, W., Witherall, L., & Millar,J. D. (2000). Review of Legionnaires’ disease.AIHAJ, 61, 738-742.Srikanth, S., & Berk, S. G. (1993). Stimulatory ef-fect of cooling tower biocides on amoebae. Ap-plied and Environmental Microbiology, 59(10),3245-3249.Srikanth, S., & Berk, S. G. (1994). Adaptation ofamoebae to cooling tower biocides. Microb Ecol,27, 293-301.States, S. J., Conley, L. F., Towner, S. G., Wolford,R. S., Stephenson, T. E., McNamara, A. M., et al.(1987). An alkaline approach to treating coolingtowers for control of Legionella pneumophila..Applied and Environmental Microbiology, 53(8),1775-1779.
Veil, J. A., Rice, J. K., & Raivel, M. E. S. (1997). Biocide usage incooling towers in the electric power and petroleum refining in-dustries. (No. W-31-109-ENG-38). Washington, DC: U.S. Depart-ment of Energy.Yamamoto, H., Ezaki, T., Ikedo, M., & Yabuuchi, E. (1991). Effects ofbiocidal treatment to inhibit the growth of Legionellae and othermicroorganisms in cooling towers. Microbiology and Immunol-ogy, 35(9), 795-802.Yu, V. L. (2008). Cooling towers and legionellosis: A conundrumwith proposed solutions. International Journal of Hygiene andEnvironmental Health, 211, 229-234.

CTI Journal, Vol. 31, No. 180
Cooling Technology InstituteLicensed Testing Agencies
For nearly thirty years, the Cooling Technology Institute hasprovided a truly independent, third party, thermal performancetesting service to the cooling tower industry. In 1995, the CTIalso began providing an independent, third party, driftperformance testing service aswell. Both these services areadministered through the CTIMulti-Agency Tower Perfor-mance Test Program and providecomparisons of the actual operat-ing performance of a specifictower installation to the designperformance. By providing suchinformation on a specific towerinstallation, the CTI Multi-Agency Testing Program standsin contrast to the CTI CoolingTower Certification Programwhich certifies all models of aspecific manufacturer's line of cooling towers perform inaccordance with their published thermal ratings.To be licensed as a CTI Cooling Tower Performance Test
Licensed CTI Thermal Testing AgenciesLicense Agency Name Contact Person TelephoneType* Address Website / Email Fax
A,B Clean Air Engineering Kenneth Hennon 800.208.61627936 Conner Rd www.cleanair.com 865.938.7569
Powell, TN 37849 [email protected]
A, B Cooling Tower Technologies Pty Ltd Ronald Rayner 61 2 9789 5900PO Box N157 [email protected] 61 2 9789 5922
Bexley North, NSW 2207AUSTRALIA
A,B Cooling Tower Test Associates, Inc. Thomas E. Weast 913.681.002715325 Melrose Dr. www.cttai.com 913.681.0039
Stanley, KS 66221-9720 [email protected]
A, B McHale & Associates, Inc Thomas Wheelock 865.588.26546430 Baum Drive www.mchale.org 425.557.8377
Knoxville, TN 37919 [email protected]
* Type A license is for the use of mercury in glass thermometers typically used for smaller towers. Type B license is for the use of remote data acquisition devices which can accommodate multiple measurement locations required by larger towers.
Licensed CTI Drift Testing AgenciesAgency Name Contact Person Telephone
Address Website / Email Fax
Clean Air Engineering Kenneth Hennon 800.208.61627936 Conner Rd www.cleanair.com 865.938.7569
Powell, TN 37849 [email protected]
McHale & Associates, Inc. Thomas Wheelock 865.588.26546430 Baum Drive www.mchale.org 425.557.8377
Knoxville, TN 37919 [email protected]
Agency, the agency must pass a rigorous screening process anddemonstrate a high level of technical expertise. Additionally, itmust have a sufficient number of test instruments, all meetingrigid requirements for accuracy and calibration.
Once licensed, the Test Agenciesfor both thermal and drift testingmust operate in full compliancewith the provisions of the CTILicense Agreements and TestingManuals which were developedby a panel of testing expertsspecifically for this program. In-cluded in these requirements arestrict guidelines regarding conflictof interest to insure CTI Tests areconducted in a fair, unbiasedmanner.Cooling tower owners and manu-facturers are strongly encouraged
to utilize the services of the licensed CTI Cooling TowerPerformance Test Agencies. The currently licensed agencies arelisted below.

CTI Journal, Vol. 31, No. 1 81
As stated in its opening paragraph, CTI Standard 201... “sets forth a pro-gram whereby the Cooling Technology Institute will certify that all modelsof a line of water cooling towers offered for sale by a specific Manufacturerwill perform thermally in accordance with the Manufacturer’s published rat-ings...” By the purchase of a “certified” model, the User has assurance thatthe tower will perform as specified, provided that its circulating water is nomore than acceptably contaminated-and that its air supply is ample andunobstructed. Either that model, or one of its close design family members,will have been thoroughly tested by the single CTI-licensed testing agencyfor Certification and found to perform as claimed by the Manufacturer.CTI Certification under STD-201 is limited to thermal operating conditionswith entering wet bulb temperatures between 12.8°C and 32.2°C (55°F to90°F), a maximum process fluid temperature of 51.7°C (125°F), a coolingrange of 2.2°C (4°F) or greater, and a cooling approach of 2.8°C (5°F) or
greater. The manufacturer may set more restrictive limits if desired or publish less restrictive limits if the CTI limits are clearly defined andnoted in the publication.Following is a list of cooling tower models currently certified under STD-201. They are part of product lines offered by Advance GRP(Advance) Cooling Towers, Pvt, Ltd.; Aggreko Cooling Tower Services; Amcot Cooling Tower Corporation; AONE E&C Corporation Ltd;Baltimore Aircoil Company, Inc.; Delta Cooling Towers, Inc.; Evapco, Inc.; Fabrica Mexicana De Torres, S.A.; HVAC/R International, Inc.;KIMCO (Kyung In Machinery Company, Ltd.); King Sun Industry Company, Ltd.; Liang Chi Industry Company, Ltd.Mesan CoolingTower, Ltd; Nihon Spindle Manufacturing Company, Ltd.; Polacel b.v.; Protec Cooling Towers; RSD Cooling Towers; Ryowo (Holding)Company, Ltd; SPX Cooling Technologies; Ta Shin F.R.P. Company, Ltd.; The Cooling Tower Company, L.C; The Trane Company; TowerTech, Inc; Waltco Systems Limited; and Zhejiang Jinling Refrigeration Engineering Company who are committed to the manufacture andinstallation of full-performance towers. In competition with each other, these manufacturers benefit from knowing that they each achievetheir published performance capability. They are; therefore, free to distinguish themselves through design excellence and concern for theUser’s operational safety and convenience.Those Manufacturers who have not yet chosen to certify their product lines are invited to do so at the earliest opportunity. You cancontact Virginia A. Manser, Cooling Technology Institute, PO Box 73383, Houston, TX 77273 for further information.
Cooling Towers Certified by CTI Under STD-201

CTI Journal, Vol. 31, No. 182

CTI Journal, Vol. 31, No. 1 83

CTI Journal, Vol. 31, No. 184

CTI Journal, Vol. 31, No. 1 85

CTI Journal, Vol. 31, No. 186

CTI Journal, Vol. 31, No. 1 87

CTI Journal, Vol. 31, No. 188
Aggreko Cooling Tower Services ............ 44-45AHR Expo ....................................................... 67Amarillo Gear Company ............................. IBCAmcot Cooling Tower .................................... 21American Cooling Tower, Inc. ..................... 27AMSA, Inc. ...................................................... 17Bailsco Blades & Casting, Inc. ...................... 78Baltimore Aircoil Company ...................... OBCBedford Reinforced Plastics .......................... 41Brentwood Industries ....................................... 9ChemTreat, Inc. ............................................. 33CleanAir Engineering ..................................... 69CTI Certified Towers ............................... 81-85CTI License Testing Agencies ...................... 80CTI ToolKit .............................................. 86-87Composite Cooling Solutions, LP ................ 11Cooling Tower Resources ............................... 43Dynamic Fabricators ...................................... 35Fibergrate Composite Structures ................... 29Gaiennie Lumber Company ............................. 2Gas Turbine Users Symposium (GTUS) ....... 25GEA Polacel Cooling Towers LLC ............... 63Glocon ................................................................ 3Howden Cooling Fans ....................................... 5Hudson Products Corporation ...................... 31IMI Sensors a PCP Piezotronics Div .......... 53Industrial Cooling Towers ....................... IFC, 6International Chimney .................................. 65C.C. Jensen ....................................................... 79KIMCO ............................................................. 59McHale & Associates ..................................... 13Midwest Towers, Inc. ..................................... 23Moore Fans ...................................................... 51Paharpur Cooling Towers Ltd ....................... 37Power Gen ........................................................ 73Revak ................................................................ 75Rexnord Industries .......................................... 49C.E. Shepherd Company, LP ........................ 39Spraying Services, Inc. ................................... 61SPX Cooling Technologies ............................ 55Strongwell ......................................................... 15Swan Secure Products, Inc. ............................ 71Tower Performance, Inc. ............................... 88Tower Tech, Inc. ............................................... 7Walter P Moore .............................................. 57
Zincobre Ingenieria, SLU .............................. 19
Index of Advertisers