Embed Size (px)
Citation preview

International Journal of Scientific and Research Publications, Volume 4, Issue 12, December 2014 1 ISSN 2250-3153
www.ijsrp.org
CT Evaluation and Study: Anthropometric Measurement
of Knee Joint in Asian Population
Suryanarayan P*, Navneet Jain
**, Ashok P.
* Senior consultant, Department of Orthopaedics ,Apollo hospitals, Chennai
** Max Superspeciality hospital, New Delhi
Abstract- Published studies have shown variation in sizes and
angles of various anthropometric measurement namely tibial
torsion, proximal femur geometry, distal femur and proximal
tibia dimensions etc. This is an anthropometric study of proximal
tibia and distal femur to identify variations in the subset of Indian
population undergoing total knee replacement.
Femur:-
1. Mean AP length 69.92 (SD 4.7).
2. Mean ML width 70.46 (SD 5.8).
3. Mean aspect ratio (ML / AP) was 0.97 (SD 0.18).
Similarly, Tibia:-
1. Mean AP length 43.16 (SD 3.7).
2. Mean ML width 66.92 (SD 5.33).
Material and methods: We studied the morphology of 28
knee joints by c.t. scan in the Department of Orthopaedics, Joint
Replacement Unit, Apollo hospitals, Chennai between October
2011 to December 2012.
Results : Measurements of tibial sections in both AP(43.i6)
and ML(66.92) dimensions, seem to be lower when compared to
average measurements of other studies. There was no significant
difference in aspect ratio seen in genders. Femoral sizes were
ML (70.46) and AP(69.62) divided into subgroup in 5mm
increments (Table VIII), the aspect ratio seen to be closer to the
overall cohort with no significant variation.
Discussion : The ML width of femur was found to be 70.46
(SD 5.8). It was significantly greater than (P < 0.01) in female
than in male. The tibial medial lateral diameter was 66.92 (SD
5.33) and anterior posterior diameter was 43.16 (SD 3.71)
Conclusion : The measured dimensions were smaller as
compared to Caucasian population
Index Terms- anthropometry ,knee,c.t.scan ,India,Caucasian
I. INTRODUCTION
nthropometry (Greek word anthropos "man" and metron
"measure") refers to the measurement of the human
individual. It has been used for identification, for the
purposes of understanding human physical variations,
in palaeoanthropology and in various attempts to correlate
physical with racial and psychological traits.
Today, anthropometry plays an important role in industrial
design, clothing design, ergonomics and architecture. Statistical
data about the distribution of body dimensions in the
population are used to optimize size and shape of the various
products manufactured in bulk for the population at large.
Additionally changes in life-styles, nutrition and ethnic
composition of populations lead to changes in the distribution
of body dimensions (e.g. the obesity epidemic the current
concern of an obesity epidemic in developed world), these
justifies periodic updating of anthropometric data collections and
understand the variations seen in size, shape, features etc., an
important consideration especially for products that are designed
for global consumption. There is increasing evidence to suggest,
today, that the premise “one size fits all” is untrue and it is
essential to factor the morphologic variations in tailoring
products across races and ethnic communities, and require
regular updating of anthropometric data collections.
Caucasian population has been known to have higher
morphometric values (1,2,3,4,5,6,7,8,9)
.
Following Table -1. Shows the variations reported between Caucasian population and Asian population and Indian
population.
PARAMETERS INDIAN POPULATION
(mm)
ASIAN POPULATION
(mm)
CAUCASIAN
POPULATION (mm)
A

International Journal of Scientific and Research Publications, Volume 4, Issue 12, December 2014 2
ISSN 2250-3153
www.ijsrp.org
Femoral ML canal
width, 20mm above the
lesser tronchanter
36.78
Rawal et al(10)
- 51.5
Noble et al(11)
ML canal width at the
isthmus as 12mm
9.02
Rawal et al(10)
10.5
Mahaisavariya et al(12)
12
Noble et al(11)
Distal Femoral
(MLwidth)
- 65.0
Ewe et al(13)
88.6
Terzidis et al(9)
Distal Femoral AP
Diameter
61
Vaidya et al(14)
59.9
Ewe et al(13)
58.7
Terzidis et al(9)
Tibial Torsion (Degree) 21.6
Mullaji et al(15)
- 38.9
Hovinga et al(7)
Coronal bowing of femur
(Degree)
8.15
Rawal et al(10)
5.75
Mahaisavariya et al(12)
9
Noble et al(11)
A difference of 16.8% was found in the femoral head offset
between Indian and Swiss populations(10)
.
Only few publications have focused at anthropometric
measurements in Indian population ( Vaidya et al(14)
, Rawal et
al (10)
, Siwach et al (16)
, Mullaji et al (15)
, Mullaji et al (37)
). In rest
of the Asian subcontinent and Middle-East again, some authors
have reported differences ( Cheng et al(1)
, Chaichankul et al(2)
,
Ewe et al(13)
, Mahaisavariya et al (12)
) . The region of interest
revisiting the subject has been given to the increasing number of
Total Knee Replacements being performed today. The currently
available implants have been designed on data obtained from
Caucasian studies and some issues with regard to size and design
have been reported by the surgeons in the Asian belt.
Published studies have used different measurement like
Vernier calipers(14,16)
, Ultrasonography (8,18)
, CT scan (14,10,19,20)
, MRI (2,21)
. This study was based on measurements obtained
from CT scan being performed for patients awaiting total knee
replacement surgery. In addition, the source of these dimensional
measurements have ranged from X-ray, CT scan, MRI to
cadaveric bones, intraoperative. Each of these techniques may
have a potential fallacy. CT scan on the other hand, is non-
invasive method and enables much more precise measurements
with digital scale. Also it is a reproducible technique.
Most dimensional measurements of knee joints had been
done with respect to cadaveric and intra operative measurements.
CT scan measurements are bone-specific and gives accurate
values of required dimensions so that it can provide a reliable,
reproducible database for further studies, sizing and manufacture
of implants.
II. AIMS AND OBJECTIVES
Aims:1. To Study anthropometrically knee joint
2. Compare differences in measurements in males and
female.
OBJECTIVES : 1.To study the anthropometric data of a
population group from within the region (India) and to compare
it with the published reports of the other regional ethnic groups
namely Chinese, Japanese and the Caucasians.
III. MATERIAL AND METHODS
We studied the morphology of knee joints in the
Department of Orthopaedics, Joint Replacement Unit, Apollo
hospitals, Chennai between October 2011 to December 2012.
Inclusion criteria:
1 All patients undergoing Total Knee Arthroplasty.
2 Age more than 40 years.
Exclusion criteria:
1. Previous fracture or bony surgery to knee, arthroscopy
excluded
2. Any epiphysio-metaphyseal disease
3. Any bone tumor near knee joint
4. Any congenital abnormality affecting knee joint
Subjects and Method:
A total of 28 patients with osteoarthritis awaiting T.K.R
(Total Knee Replacement) surgery having age > 40years
underwent CT scan. All CT scan were performed by making
patient supine in an extended position with their patella facing
towards the ceiling so that similar images can be collected. CT
scan machines used were 64-MDCT AQULLION and 320-
MDCT AQULLION (MD-MultiDetector) giving 0.5mm
thickness slices.
All patients were demonstrated and instructed to keep their
lower limbs in extended and neutral position through out the CT
scan duration.
After making the position, name, age, sex, were entered in
each CT scan.
The image selected for distal femur is one at
transepicondylar level showing most prominent epicondyles (13)
.
Following image shows the measurements of femoral
medial lateral (fML), femoral medial condyle anterior-posterior
(fMAP), femoral lateral condyle anterior-posterior diameter
(fLAP).

International Journal of Scientific and Research Publications, Volume 4, Issue 12, December 2014 3
ISSN 2250-3153
www.ijsrp.org
Figure - 7: Showing measurement at transepicondylar level. The horizontal line is the distance between most prominent points
over epicondyles and called as fML (medial-lateral) diameter. Another vertical line starting from most anterior point on medial
condyle to most posterior point in medial condyle is called as fMAP (medial condyle anterior-posterior) diameter. The vertical line
starting from most anterior point on lateral condyle to most posterior point in lateral condyle is called as fLAP (lateral condyle
anterior-posterior) diameter.
Following image shows measurement of overall anterior-posterior (fAP) diameter of femur.

International Journal of Scientific and Research Publications, Volume 4, Issue 12, December 2014 4
ISSN 2250-3153
www.ijsrp.org
Figure-8: The oblique line starting from most prominent point in between both condyles and the lower most in between both
condyles crossing obliquely on fML diameter is fAP(Anterior-posterior).
The basis for choosing tibia measurement was referred to the transepicondylar (2)
axis of the distal femur. Following image shows
measurement of tibial medial- lateral dimension (tML).

International Journal of Scientific and Research Publications, Volume 4, Issue 12, December 2014 5
ISSN 2250-3153
www.ijsrp.org
Figure-9: The horizontal line is the distance between most prominent points referring to the transepicondylar axis of femur
called as tML (medial-lateral) diameter.
Following image shows measurement of tibia anterior-posterior diameter (tAP).

International Journal of Scientific and Research Publications, Volume 4, Issue 12, December 2014 6
ISSN 2250-3153
www.ijsrp.org
Figure-10: The vertical line bisecting tML diameter is called as tAP (Anterior-posterior).
Following image shows measurement of tibial medial condyle anterio-posterior (tMAP), tibial lateral condyle anterior-posterior
(tLAP).

International Journal of Scientific and Research Publications, Volume 4, Issue 12, December 2014 7
ISSN 2250-3153
www.ijsrp.org
Figure-11: The vertical line starting from most anterior point on medial condyle to most posterior point in medial condyle is
called as tMAP (medial condyle anterior-posterior) diameter.The vertical line starting from most anterior point on lateral condyle to
most posterior point in lateral condyle is called as tLAP (lateral condyle anterior-posterior) diameter.
All measurements were recorded in millimeters using the DICOM (Digital Imaging and Communication in Medicine) imaging
software manually with the help of radiology technicians and implant engineers.
IV. STATISTICAL DATA ANALYSIS
We used standard SPSS-14.0 version (Statistical Product and Service Solutions) software and t-test, ANOVA to analyse our data.
Following tables shows the analysed parameters.
Table – I. Average values of the tibia morphology measurement (mm).
Parameters Male Female Combined
tML 72.18 + 4.35 64.43 + 3.7 66.92 + 5.33
tAP 46.60 + 2.35 41.53 + 3.07 43.16 + 3.71
tML /tAP 1.56 + 0.12 1.57 + 0.11 1.57 + 0.11
+ - Stands for Standard Deviation.
Table – II. Average values of the tibia morphology measurement (mm).
N MIN MAX MEAN S.D
t MAP 28 34 50.80 43.58 3.33
International Journal of Scientific and Research Publications, Volume 4, Issue 12, December 2014 8
ISSN 2250-3153
www.ijsrp.org
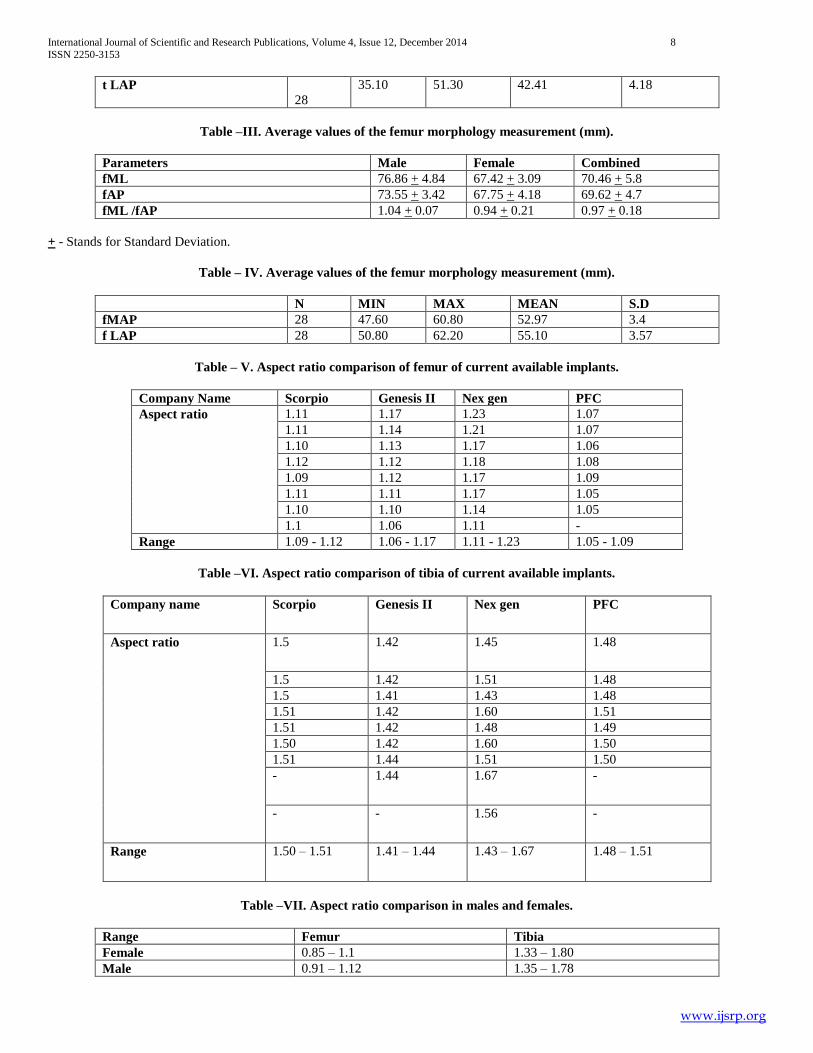
t LAP
28
35.10 51.30 42.41 4.18
Table –III. Average values of the femur morphology measurement (mm).
Parameters Male Female Combined
fML 76.86 + 4.84 67.42 + 3.09 70.46 + 5.8
fAP 73.55 + 3.42 67.75 + 4.18 69.62 + 4.7
fML /fAP 1.04 + 0.07 0.94 + 0.21 0.97 + 0.18
+ - Stands for Standard Deviation.
Table – IV. Average values of the femur morphology measurement (mm).
N MIN MAX MEAN S.D
fMAP 28 47.60 60.80 52.97 3.4
f LAP 28 50.80 62.20 55.10 3.57
Table – V. Aspect ratio comparison of femur of current available implants.
Company Name Scorpio Genesis II Nex gen PFC
Aspect ratio 1.11 1.17 1.23 1.07
1.11 1.14 1.21 1.07
1.10 1.13 1.17 1.06
1.12 1.12 1.18 1.08
1.09 1.12 1.17 1.09
1.11 1.11 1.17 1.05
1.10 1.10 1.14 1.05
1.1 1.06 1.11 -
Range 1.09 - 1.12 1.06 - 1.17 1.11 - 1.23 1.05 - 1.09
Table –VI. Aspect ratio comparison of tibia of current available implants.
Company name Scorpio Genesis II Nex gen PFC
Aspect ratio 1.5 1.42 1.45 1.48
1.5 1.42 1.51 1.48
1.5 1.41 1.43 1.48
1.51 1.42 1.60 1.51
1.51 1.42 1.48 1.49
1.50 1.42 1.60 1.50
1.51 1.44 1.51 1.50
- 1.44 1.67 -
- - 1.56 -
Range 1.50 – 1.51 1.41 – 1.44 1.43 – 1.67 1.48 – 1.51
Table –VII. Aspect ratio comparison in males and females.
Range Femur Tibia
Female 0.85 – 1.1 1.33 – 1.80
Male 0.91 – 1.12 1.35 – 1.78

International Journal of Scientific and Research Publications, Volume 4, Issue 12, December 2014 9
ISSN 2250-3153
www.ijsrp.org
There is no statistical significant difference between aspect ratio in females and males. (using t-tests)
Table –VIII. Medial – Lateral Variations.
We divided our femoral data on the basis of anterior-posterior diameter (AP) into three groups .
Group I
(AP 61-65)
Group II
(AP 65.1-70)
Group III
(AP >70)
Males Females Males Females Males Females
Mean ML 66.39 67.19 77.09 69.98
SD 3.02 2.28 5.13 5.41
n 5 1 11 8 3
95% of CI 66.62 – 70.15 65.66 -68.72 72.79 – 81.38 56.53 – 83.43
Aspect Ratio 1.04 + 0.04 0.89 + 0.28 1.03 + 0.07 0.93 + 0.06
+ - Stands for Standard Deviation.
Base of AP = mean of FAPL (left side) and FAPR (right side).
CI-Confidential Intervals.
V. OBSERVATIONS AND RESULTS
The study involved a total of 28 adult patients (19 females
and 9 males) who were subjected to CT scan preoperatively. The
CT scan measurements were taken from 64 MDCT AQUILLION
and 320 MDCT AQUILLION machines.
Measurements of tibial sections in both AP and ML
dimensions seem to be lower when compared to average
measurements of other studies. There was no significant
difference in aspect ratio seen in genders.
Ethnic femoral sizes were divided into subgroup in 5mm
increments (Table VIII), the aspect ratio seen to be closer to the
overall cohort with no significant variation.
VI. DISCUSSION
This is the study done to measure AP (Anterior Posterior)
and ML (Medial Lateral) dimensions of distal femur and
proximal tibia in knee joint.
Various studies in Caucasian and Asian population
suggested the anthropometric variations. The measurements of
our study were more representative of the distal femur, as it took
into consideration the distance between the most anterior and the
most posterior points, in addition to the length of the lateral
condyle.
Following table shows measurements on distal femur in various studies
Study fML fAP AR fMAP fLAP
Mensch et al (29)
76.8 + 7.2
Berger et al (5)
80.2 + 4.1
64.1 1.24 64.1+ 3.0 63.0
Trezidis et al (9 )
88.6 + 4.2 58.7 1.50 58.7 + 4.1 58.5 + 4.0
Ewe et al (13)
65.0 + 5.0 59.9 + 4.8 1.09 + 0.07 - -
Chaichankul et al (2)
64.06 + 6.3 45.43 + 4.5 1.41 + 0.12 - -
Cheng et al (1)
71.0 + 3.0 64.1 + 2.7 1.11+ 0.02 51.1 + 3.3 50.7 + 4.0
Our study 70.46 + 5.8 69.62 + 4.7 0.97 + 0.18 52.97 + 3.4 55.10 + 3.5
+ - Stands for Standard Deviation.

International Journal of Scientific and Research Publications, Volume 4, Issue 12, December 2014 10
ISSN 2250-3153
www.ijsrp.org
The ML width of femur was found to be 70.46 (SD 5.8). It
was significantly greater than (P < 0.01) in female than in male.
It is the most frequently measured anatomic parameter of the
distal femur. However, there is great variability between studies
regarding the definition of measuring points as well as the
measurement techniques and the type of sample. As a result, any
comparison would provide unreliable conclusions. We measured
the bicondylar width of the femur according to the definition of
Farrally and Moore which is the maximum distance across the
condyles in the transverse plane (17)
. They reported an average of
83.1mm in Caucasian femur which is similar to another
Caucasian study (9)
83.9mm (SD 0.63) our value seems to be
similar to other Asian studies.
The mean medial condyle diameter of femur was 52.97 mm
(SD 3.4) and mean lateral condyle diameter was 55.10 (SD 3.5)
which were lower than Caucasian studies namely Berger et al (5)
,
Terzidis et al (9)
, but seems close to Chinese study Cheng et al (1)
. The aspect ratio of our study was 0.97 (0.18) which seems to
be much less than Caucasian (29,5,9)
and other Asian studies (13,1,2)
.
Following table shows measurements on proximal tibia in various studies
Study tML tAP AR tMAP tLAP
Mensch et al (29)
74.9 + 6.1 48.9 1.53 48.9 + 4.3 45.3 + 3.7
Uehera et al (25)
74.3 + 6.6
48.3+ 5.4 1.53 - -
Kwak et al (3 )
71.9 + 5.6 45.7 +3.8 1.57 - -
Cheng et al (1)
73.0 + 4.6 48.8 + 3.4 1.49 - -
Our study 66.92 + 5.3 43.16 + 3.7 1.57 + 0.11 43.58 + 3.33 42.41 + 4.1
+ - Stands for Standard Deviation.
The tibial medial lateral diameter was 66.92 (SD 5.33) and
anterior posterior diameter was 43.16 (SD 3.71) which seems to
be smaller than Caucasian study Mensch et al (29)
and other
Asian studies (1,3,25)
. The aspect ratio was 1.57 (0.11) which
seems to be similar to the other studies.
In Caucasian and diverse ethnic Asian population groups, various
studies (1,2,3,4,5,6,7,8,9)
addresses the anthropometric measurement.
This study is focused on measurements of distal femur and
proximal tibia. Different methods have been employed (14,10,2,19,20,18,21)
to measure actual sizes. They range from plain X-
rays, cadaveric measurements to CT scan and MRI
measurements.
Seedhom et al (34)
in their study concluded that the
measurements were more precise at the level of epicondyles.
Identification of exact epicondylar points with the help of CT
scans is precise. Hence, we performed our measurements on CT
section availability of CT slices (0.5mm thickness from 64
MDCT and 320 MDCT AQUILLION) enable identification of
widest points which use feel minimal inherent error possible in
plain X-ray and clinical measurements.
The measurements were derived from CT scans done as part
of evaluation of patients undergoing Total Knee Replacement
Surgery. Method of measurement necessicitate identification of
most anterior and most posterior points and similarly most
medial and most lateral points, which is more precise on well-
performed CT scan, the reason being that it is possible to
approximate the measurement upto two decimal with the help of
digital scale. This enables a more accurate measurement with
minimal error.
The values in the finding of this study is of importance
clinically in surgical treatment of arthritic knee of prosthetic
joints. Surgeons in this part of the world have time and again
mentioned and pointed out to the difficulties in obtaining proper
sized implant. Most of the currently available designs have been
manufactured in accordance to the sizes with respect to
Caucasian database. This accounts for difficulties faced by the
surgeons in this continent. The findings of this study closely
confess to finding reported in studies by other authors (1,2,13)
.
Aspect ratio seems definitely smaller especially in females when
compared to Caucasians. The clinical implication of the same is
overhang of prosthesis at time of surgery and its implications.
Availability of more intermediate size is one solution offered
today’s its stands to reason. This enables a more precise
execution of the surgical procedure with respect to component
sizing thereby avoiding implant overhang beyond bone margins
and better restoration of flexion and extension gaps.
Recent studies have shown that gender differences of distal
femur morphometry depend on other morphometric
measurements of femur, such as the femur length and width (35)
.
In the study by Dargel et al (36)
2011, when gender differences
were corrected for differences in femur length, medial-lateral
dimensions of knees were still significantly larger in men than in
women; however matched paired analysis did not prove those
differences to be consistent.

International Journal of Scientific and Research Publications, Volume 4, Issue 12, December 2014 11
ISSN 2250-3153
www.ijsrp.org
There are instances of extreme outlines with significant
morphologic variation seen in some patients. Hence probably the
use of these values in various ethnic subgroups during
manufacture of implants would be a solution to the concern of
performing surgeons.
VII. CONCLUSION
Variations exist in anthropometric measurements of distal
femur and proximal tibia when compared with Caucasian
database. It was also observed in this study, our size resemble
close to that have been reported by Cheng et al (1)
, Chaichankul
et al (2)
, Ewe et al (13)
.
Females have smaller aspect ratio and dimension as
compared to males of similar age. One advantage of this study
has been the precise measurement of broadest dimension based
on CT scan. It is fair to assume that these measurements are close
to the true values. A further study with a larger cohort of cases
with same methodology could be helpful in establishing a
regional anthropometric database for ethnic Indians.
REFERENCES
[1] Cheng FB, Ji XF, Lai Y, Feng JC, Zheng WX, Sun YF, Fu YW, Li YQ. Three dimensional morphometry of the knee to design the Total Knee Arthroplasty for Chinese population. Knee. 2009 Oct; 16(5):341-7.
[2] Chaichankul C, Tanavalee A, Itiravivong P. Anthropometric measurements of knee joints in Thai population: correlation to the sizing of current knee prostheses. Knee. 2011 Jan; 18(1):5-10.
[3] Kwak DS, Surendran S, Pengatteeri YH, Park SE, Choi KN, Gopinathan P, Han SH, Han CW. Morphometry of the proximal tibia to design the tibial component of Total Knee Arthroplasty for the Korean population. Knee. 2007 Aug; 14(4):295-300.
[4] Le Damany P, La torsion du tibia, normale, pathologique, expérimentale. J Anat Physiol 1909; 45:598–615.
[5] Berger RA, Rubash HE, Seel MJ, Thompson WH, Crossett LS. Determining the rotational alignment of the femoral component in Total Knee Arthroplasty using the epicondylar axis. Clin Orthop Relat Res. 1993 Jan; (286):40-7.
[6] Malekafzali S, Wood MB. Tibial torsion--a simple clinical apparatus for its measurement and its application to a normal adult population. Clin Orthop Relat Res. 1979 Nov-Dec; (145):154-7.
[7] Hovinga KR, Lerner AL. Anatomic variations between Japanese and Caucasian populations in the healthy young adult knee joint. J Orthop Res. 2009 Sep; 27(9):1191-6.
[8] Hudson D, Royer T, Richards J. Ultrasound measurements of torsions in the tibia and femur. J Bone Joint Surg Am. 2006 Jan; 88(1):138-43.
[9] Terzidis I, Totlis T, Papathanasiou E, Sideridis A, Vlasis K, Natsis K. Gender and Side-to-Side Differences of Femoral Condyles Morphology: Osteometric Data from 360 Caucasian Dried Femori. Anatomy Research International. 2012.
[10] Rawal B, Ribeiro R, Malhotra R, Bhatnagar N. Anthropometric measurements to design best-fit femoral stem for the Indian population. Indian J Orthop. 2012 Jan; 46(1):46-53. doi: 10.4103/0019-5413.91634.
[11] Noble PC, Alexander JW, Lindahl LJ, Yew DT, Granberry WM, Tullos HS. The anatomic basis of femoral component design. Clin Orthop Relat Res. 1988 Oct; (235):148-65.
[12] Mahaisavariya B, Sitthiseripratip K, Tongdee T, Bohez EL, Vander Sloten J, Oris P. Morphological study of the proximal femur: a new method of geometrical assessment using 3-dimensional reverse engineering. Med Eng Phys. 2002 Nov; 24(9):617-22.
[13] Ewe TW, FRCS, HL Ang, MB BCh, EK Chee, WM Ng. An Analysis of the Relationship between the Morphometry of the Distal Femur, and Total Knee Arthroplasty Implant Design. Malaysian Orthopaedic Journal 2009; 3(2):24-28.
[14] Vaidya SV, Ranawat CS, Aroojis A, Laud NS. Anthropometric measurements to design total knee prostheses for the Indian population. J Arthroplasty. 2000 Jan; 15(1):79-85.
[15] Mullaji AB, Sharma AK, Marawar SV, Kohli AF. Tibial torsion in non-arthritic Indian adults: A computer tomography study of 100 limbs. Indian J Orthop. 2008 Jul-Sep; 42(3): 309–313.
[16] Siwach RC, Dahiya S. Anthropometric study of proximal femur geometry and its clinical application. Indian J Orthop. 2003; 37:247–51.
[17] Farrally MR, Moore WJ. Anatomical differences in the femur and tibia between Negroids and Caucasoids antheir effects upon locomotion. Am J Phys Anthropol. 1975 Jul; 43(1):63-9.
[18] Joseph B, Carver RA, Bell MJ, Sharrard WJW, Levick RK, Aithal V, Chacko V, Murthy SV. Measurement of tibial torsion by ultrasound. J Pediatr Orthop (1987) 7(3): 317- 323.
[19] Jakob RP, Haertel M, Stüssi E. Tibial torsion calculated by computerised tomography and compared to other methods of measurement. J Bone Joint Surg Br. 1980 May; 62-B (2):238-42.
[20] Ho WP, Cheng CK, Liau JJ. Morphometrical measurements of resected surface of femurs in Chinese knees: correlation to the sizing of current femoral implants. Knee. 2006 Jan; 13(1):12-4.
[21] Schneider B, Laubenberger J, Jemlich S, Groene K, Weber HM, Langer M. Measurement of femoral antetorsion and tibial torsion by magnetic resonance imaging. Br J Radiol. 1997 Jun; 70(834):575-9.
[22] Khermosh 0, Lior G,Weissman SL. Tibial torsion in children. Clin Orthop1971; 79:25-31.
[23] Rosen H, Sandick H.The measurement of tibiofibular torsion.J Bone Joint Surg [Am]. 1955 Jul; 37-A (4):847-55.
[24] Dunn DM. Anteversion of the Neck of the Femur: A Method of Measurement. J Bone Joint Surg [Br]. 1952; 34-B: 181-6.
[25] Uehara K, Kadoya Y, Kobayashi A, Ohashi H, Yamano Y.Anthropometry of the proximal tibia to design a total knee prosthesis for the Japanese population. J Arthroplasty. 2002 Dec; 17(8):1028-32.
[26] Urabe K, Miura H, Kuwano T, Matsuda S, Nagamine R, Sakai S, Masuda K, Iwamoto Y. Comparison between the shape of resected femoral sections and femoral prostheses used in Total Knee Arthroplasty in Japanese patients: simulation using three-dimensional computed tomography. J Knee Surg. 2003 Jan; 16(1):27-33.
[27] Hitt K, Shurman JR 2nd, Greene K, McCarthy J, Moskal J, Hoeman T, Mont MA. Anthropometric measurements of the human knee: correlation to the sizing of current knee arthroplasty systems. J Bone Joint Surg Am. 2003; 85-A Suppl 4:115-22.
[28] Westrich GH, Haas SB, Insall JN, Frachie A. Resection specimen analysis of proximal tibial anatomy based on 100 Total Knee Arthroplasty specimens. J Arthroplasty. 1995 Feb; 10(1):47-51.
[29] Mensch JS, Amstutz HC. Knee morphology as a guide to knee replacement. Clin Orthop Relat Res. 1975 Oct; (112):231-41.
[30] Rubin PJ, Leyvraz PF, Aubaniac JM, Argenson JN, Estève P, de Roguin B.The morphology of the proximal femur. A three-dimensional radiographic analysis. J Bone Joint Surg Br. 1992 Jan; 74(1):28-32.
[31] Husmann O, Rubin PJ, Leyvraz PF, de Roguin B, Argenson JN.Three-dimensional morphology of the proximal femur. J Arthroplasty. 1997 Jun;12(4):444-50.
[32] Griffin FM, Math K, Scuderi GR, Insall JN, Poilvache PL. Anatomy of the epicondyles of the distal femur: MRI analysis of normal knees. J Arthroplasty. 2000 Apr; 15(3):354-9.
[33] Leung KS. The early experience with gamma nails in the treatment of peritrochanteric fractures. Trans HongKong Orthop Association 1989;33.
[34] Seedhom BB, Longton EB, Wright V, Dowson D. Dimensions of the knee. Radiographic and autopsy study of sizes required by a knee prosthesis. Ann Rheum Dis. 1972 Jan; 31(1):54-8.
[35] Yazar F, Imre N, Battal B, Bilgic S, Tayfun C. Is there any relation between distal parameters of the femur and its height and width? Surg Radiol Anat. 2012 Mar; 34(2):125-32.
[36] Dargel J, Michael JW, Feiser J, Ivo R, Koebke J. Human knee joint anatomy revisited: morphometry in the light of sex-specific Total Knee Arthroplasty. J Arthroplasty. 2011 Apr; 26(3):346-53.
[37] Mullaji AB, Sharma AK, Marawar SV, Kohli AF, Singh DP. Distal femoral rotational axes in Indian knees. J Orthop Surg (Hong Kong). 2009 Aug; 17(2):166-9.

International Journal of Scientific and Research Publications, Volume 4, Issue 12, December 2014 12
ISSN 2250-3153
www.ijsrp.org
AUTHORS
First Author – Dr. Suryanarayan P.,Senior consultant,
Department of Orthopaedics ,Apollo hospitals, Chennai
Second Author – Dr. Navneet Jain, Max Superspeciality
hospital, New Delhi
Third Author – Dr. Ashok P.
Correspondence Author – Dr. Navneet Jain, Department of
orthopaedics, Max Superspeciality hospital, New Delhi, E
mail- [email protected] .Contact no. 08800330482