Embed Size (px)
Citation preview

cSAD
CSR Report
Reviewer Surveys – Peer Review Using the Zoom Video Meeting Platform Office of the Director July 27, 2021
Introduction
The National Institutes of Health (NIH) depends on the Center for Scientific Review’s (CSR) peer review
process to ensure that all NIH grant applications receive fair, independent, expert, and timely reviews
that are free from inappropriate influences. When the COVID-19 pandemic hit in mid-March 2020, CSR
shifted most review meetings online, using the Zoom.gov video meeting platform. The purpose of these
surveys was to assess the reviewers’ observations on the quality of the review and their experiences as
reviewers for the Summer 2020 (Survey 1) and Winter 2021 (Survey 2) review meetings, compared to
the normal face-to-face review meetings. Survey 2 added two questions that had been used to assess
reviewer perceptions of quality of review pre-COVID (2018-early 2020).
Major findings
• A large majority of reviewers rate quality of review in Zoom meetings as the same as face-to-
face.
• Comparison of absolute ratings of quality of review show Zoom meetings are rated well, almost
identically to pre-pandemic face to face meetings.
• Just over 40% of reviewers prefer the face to face meeting format; about 30% prefer Zoom.
• Substantial numbers of respondents raise concerns about problems with maintaining attention
and reduced engagement in Zoom meetings.
• The data generally do not reveal differences in perception or preferences according to reviewer
demographics or from Survey 1 to Survey 2.
See Appendix for Methods and additional analyses
Results
Survey 1 was administered to 8,083 reviewers, 3403 (42%) completed it, and of those, 3288 had
participated in a Zoom meeting. Analysis was confined to those 3288 Zoom meeting respondents.
Survey 2 was administered to 8,069 reviewers; 4,045 (50%) completed it. See Table 1 for reviewer
characteristics.
cSAD
Table 1. Reviewer Characteristics of Survey Respondents who used Zoom
Reviewer Characteristics Survey Respondents
Survey 1 (n = 3288)
Survey 2 (n = 4045)
Gender
Female 59% 42% Male 39% 56% Unknown -- -- Withheld 2% 2%
Race
American Indian or Alaskan <1% <1% Asian 19% 21% Black or African American 2% 3% More than one race <1% 2% Native Hawaiian or Pacific Islander <1% <1% White 69% 67% Unknown -- --
Withheld 8% 7%
Ethnicity
Hispanic/Latino 5% 6% Non-Hispanic 90% 90% Unknown -- -- Withheld 5% 4%
URM
No 84% 90% Yes 8% 10% Withheld 8% --
Career Stage
Professor 56% 52% Associate Professor 30% 33% Assistant Professor 9% 12% Other 5% 3%

cSAD
Meeting Format Preferences
• As shown in Figure 1, reviewers overall prefer F2F meetings, but preference varies with meeting type.
• A higher percentage of men than women preferred F2F meetings, while the percent preferring
Zoom is nearly the same between genders.
• A higher percentage of professors than assistants/associates preferred F2F meetings, but
professors were no less likely than other ranks to prefer Zoom.
• Non-academic reviewers were substantially more likely to prefer Zoom over F2F meetings.
Figure 1. Meeting Format Preference by Meeting Type
0
10
20
30
40
50
60
F2F
Zoo
m/v
ideo
No
pre
fere
nce
F2F
Zoo
m/v
ideo
No
pre
fere
nce
F2F
Zoo
m/v
ideo
No
pre
fere
nce
F2F
Zoo
m/v
ideo
No
pre
fere
nce
F2F
Zoo
m/v
ideo
No
pre
fere
nce
Chartered Member Conflict Recurring Small Business Recurring Fellowship All Study Sections
Per
cen
t
Meeting Format Preference
Wave 1 Wave 2

Perceived Quality of Review (relative to F2F)
• Figure 2 shows reviewer perceptions of the quality of Zoom meetings compared to F2F.
• About 60% of reviewers thought the overall quality of Zoom meeting was the same as that of F2F.
Some concerns are raised by the finding that roughly 35-55% of reviewers rated quality of discussion
and level of reviewer engagement worse compared to that in F2F meetings.
Figure 2. Reviewers’ Assessments of Peer Review Quality for All Study Sections
Note: Survey questions were on a scale from 1 (much better) to 5 (much worse), with lower scores indicating a more favorable view of the Zoom meeting compared to F2F meetings
0
10
20
30
40
50
60
70
Mu
ch b
ette
r
Slig
htl
y b
ette
r
Sam
e
Slig
htl
y w
ors
e
Mu
ch w
ors
e
Mu
ch b
ette
r
Slig
htl
y b
ette
r
Sam
e
Slig
htl
y w
ors
e
Mu
ch w
ors
e
Mu
ch b
ette
r
Slig
htl
y b
ette
r
Sam
e
Slig
htl
y w
ors
e
Mu
ch w
ors
e
Mu
ch b
ette
r
Slig
htl
y b
ette
r
Sam
e
Slig
htl
y w
ors
e
Mu
ch w
ors
e
Productive Discussion Reviewer Engagement Meeting Management Overall Quality
Per
cen
t
Quality of Review for All Study Sections
Wave 1 Wave 2
Survey 1 M = 3.11 Survey 2 M = 3.12
Survey 1 M = 2.84Survey 2 M = 2.79
Survey 1 M = 3.47 Survey 2 M = 3.56
Survey 1 M = 3.23 Survey 2 M = 3.23
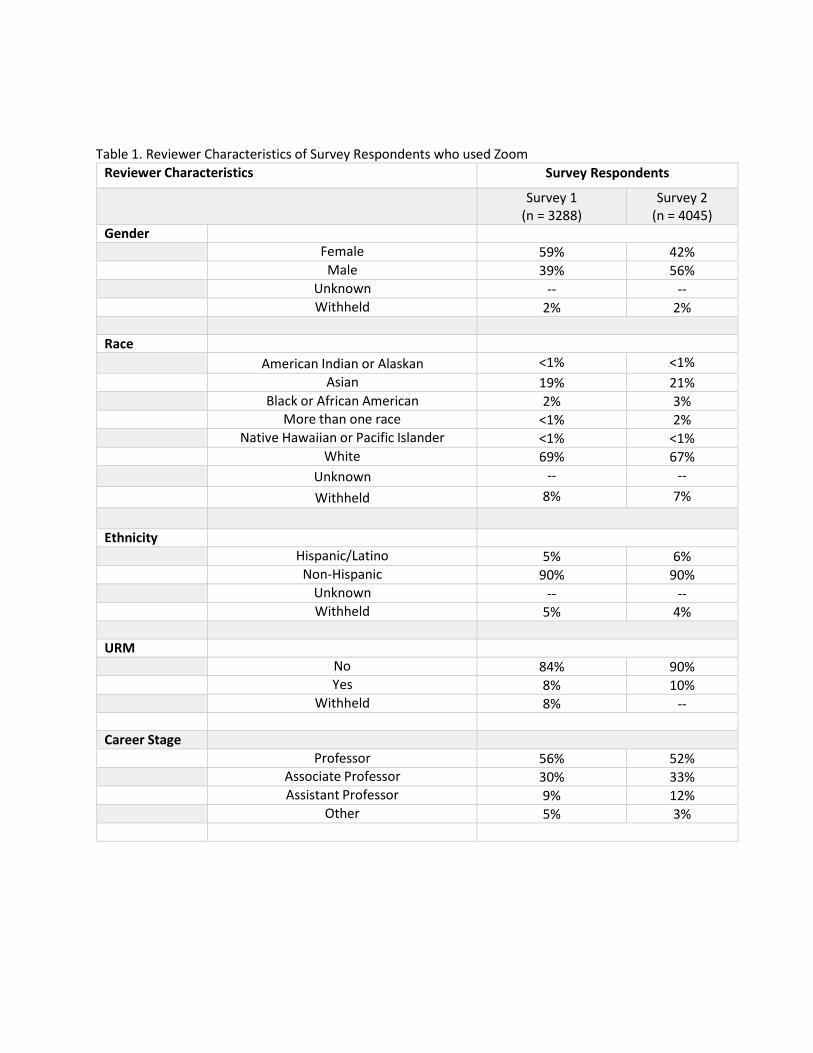
Self-report of Meeting Participation
• Figure 3 shows reviewer ratings of their own ability to participate in Zoom meetings compared to F2F.
• Overall, the ratings show reviewers generally felt able to participate in Zoom meetings similarly to F2F.
• Points of concern are that about a third said they contributed less to discussion, and about half said their
attention faded more quickly in Zoom meetings, a pattern that was mirrored in ratings across all kinds of
meetings, and especially for meetings of chartered study sections.
Figure 3. Reviewers’ Meeting Participation for All Study Sections
Note: Survey questions were on a scale from 1 (much more) to 5 (much less), with lower scores indicating a more favorable view of the Zoom meeting compared to F2F meetings
0
10
20
30
40
50
60
70
80
90
Mu
ch m
ore
Slig
htl
y m
ore
Sam
e
Slig
htl
y le
ss
Mu
ch le
ss
Mu
ch m
ore
Slig
htl
y m
ore
Sam
e
Slig
htl
y le
ss
Mu
ch le
ss
Mu
ch m
ore
Slig
htl
y m
ore
Sam
e
Slig
htl
y le
ss
Mu
ch le
ss
Mu
ch m
ore
Slig
htl
y m
ore
Sam
e
Slig
htl
y le
ss
Mu
ch le
ss
Mu
ch m
ore
Slig
htl
y m
ore
Sam
e
Slig
htl
y le
ss
Mu
ch le
ss
Mu
ch m
ore
Slig
htl
y m
ore
Sam
e
Slig
htl
y le
ss
Mu
ch le
ss
Contributed toDiscussion
Confident VoicingOpinions
Others Responsive toMy Feedback
Clearly CommunicatedOpinions
Comfort VotingOutside Range
Attention SpanLasted
Per
cen
t
Reviewer Participation for All Study Sections
Wave 1 Wave 2
Survey 1 M =
3.06
Survey 2 M =
3.05
Survey 1 M =
2.98
Survey 2 M =
2.95
Survey 1 M =
3.44
Survey 2 M =
3.52
Survey 1 M = 3.06
Survey 2 M = 3.07
Survey 1 M =
3.00
Survey 2 M =
2.98
Survey 1 M = 3.32
Survey 2 M = 3.26

Perceived Quality of Review: Direct Comparison of Survey 2 Zoom Meetings to 2018-2020 F2F Meetings
• Figures 4-5 show data capturing reviewers’ perceptions of the panels ability to evaluate the applications. Data
concern chartered meetings only and come from the Survey 2 Zoom surveys (n = 2715) and surveys from F2F
meetings during 2018-2020 (pre-COVID; n = 1106).
• Reviewers rated the panel’s ability to prioritize applications according to their impact and scientific merit
essentially the same in Zoom and F2F meetings.
• Reviewers also thought that the scientific discussions at the Zoom meetings and F2F meetings were
equivalently useful in helping them evaluate applications.
Figure 4. Reviewers’ Assessments of the Panels Ability to Prioritize Applications in Zoom and Face-to-Face Meetings
Figure 5. Reviewers’ Assessments of the Discussions Help with Evaluations in Zoom and Face-to-Face Meetings
Note: Survey questions were on a scale from 1 (strongly agree) to 7 (strongly disagree), with lower scores indicating a more favorable view of the review meeting
0
10
20
30
40
50
60
70
Strongly agree Agree Somewhatagree
Neutral Somewhatdisagree
Disagree Stronglydisagree
Per
cen
t
Ability to Prioritize Applications
Zoom F2F
M (SD) = 1.53 (.79) M (SD) = 1.62 (1.10)
0
10
20
30
40
50
60
70
Strongly agree Agree Somewhatagree
Neutral Somewhatdisagree
Disagree Stronglydisagree
Per
cen
t
Discussions Helped with Evaluations
Zoom F2F
M (SD) = 1.56 (.86) M (SD) = 1.60 (1.11)

Supplemental Analyses Analyses of Format Preference, Quality of Review, and Meeting Participation by Reviewer Characteristics and Meeting Type
Meeting Format Preference and Reviewer Characteristics
• Figures 6-8 show the meeting format preferences of reviewers by their socio-demographic characteristics
Table 2. Meeting Format Preference by Reviewer Characteristics
Reviewer Characteristics Meeting Format Preference
Face-to-Face Zoom No Preference
Survey 1 Survey 2 Survey 1 Survey 2 Survey 1 Survey 2
n (%) n (%) n (%) n (%) n (%) n (%)
Gender
Male 881 (46) 1096 (49) 578 (30) 595 (26) 462 (24) 551 (25) Female 501 (39) 658 (39) 408 (33) 543 (32) 368 (29) 505 (29)
URM
No 1191(43) 1478 (44) 858 (31) 971 (29) 724 (26) 904 (27) Yes 108 (41) 181 (48) 81 (31) 103 (27) 72 (28) 96 (25)
Career Stage
Assistant Professor 117 (41) 194 (40) 84 (29) 139 (29) 87 (30) 147 (31) Associate Professor 420 (42) 554 (42) 304 (30) 380 (29) 275 (28) 386 (29) Professor 835 (46) 1001 (48) 548 (30) 596 (29) 433 (24) 491 (23) Other 49 (27) 51 (33) 75 (42) 50 (33) 55 (31) 53 (34)
Figure 6. Meeting Format Preference by Gender and Survey
0
10
20
30
40
50
60
Male Female Male Female
Surv
ey
Survey 1 Survey 2
Meeting Format Preference by Gender
Face-to-Face Zoom No preference

Figure 7. Meeting Format Preference by Minority Status and Survey
Figure 8. Meeting Format Preference by Career Stage and Survey
0
10
20
30
40
50
60
URM Not URM URM Not URM
Per
cen
t
Survey 1 Survey 2
Meeting Format Preference by Minority Status
Face-to-Face Zoom No preference
0
10
20
30
40
50
60
Asst. Prof Assoc. Prof Professor Other Asst. Prof Assoc. Prof Professor Other
Per
cen
t
Survey 1 Survey 2
Meeting Format Preference by Career Stage
Face-to-Face Zoom No preference

Survey respondents and Meeting Type
• Table 3 shows the count of meetings represented according to type and number of survey respondents. The bulk of responses come from chartered study section meetings; member conflict SEPs, SBIR, and fellowship meetings combined account for ~40% of responses.
Table 3. Study Section Type and Number of Respondents
Study Section Type Survey 1 Number of Study Sections (Number of respondents)
Survey 2 Number of Study Sections (Number of respondents)
Chartered 154 (2166) 165 (2715) Member Conflict 42(283) 57 (416)
Recurring Small Business 36 (534) 35 (476)
Recurring Fellowships 21 (277) 27 (438) Total 253 (3260)* 284 (4045) *Only 28 reviewers came from two Recurring Special Topics study sections bringing the total number of study
sections to 255 and the total number of respondents to 3288. Due to these low numbers, separate analyses for
this type of study section were not examined, but these reviewers are included with the main analyses examining
the full sample.
Perceived Quality of Review and Meeting Type
• Figures 9-12 show reviewers’ perceptions of the quality of the review broken by meeting type.

Per
cen
t
Figure 9. Reviewers’ Assessments of Peer Review Quality Figure 10. Reviewers’ Assessments of Peer Review Quality for Chartered Meetings for Member Conflict Meetings
Figure 11. Reviewers’ Assessments of Peer Review Quality Figure 12. Reviewers’ Assessments of Peer Review Quality
for Recurring Small Business Meetings for Recurring Fellowship Meetings
010203040506070
Mu
ch b
ette
r
Slig
htl
y b
ette
r
Sam
e
Slig
htl
y w
ors
e
Mu
ch w
ors
e
Mu
ch b
ette
r
Slig
htl
y b
ette
r
Sam
e
Slig
htl
y w
ors
e
Mu
ch w
ors
e
Mu
ch b
ette
r
Slig
htl
y b
ette
r
Sam
e
Slig
htl
y w
ors
e
Mu
ch w
ors
e
Mu
ch b
ette
r
Slig
htl
y b
ette
r
Sam
e
Slig
htl
y w
ors
e
Mu
ch w
ors
e
ProductiveDiscussion
ReviewerEngagement
MeetingManagement
Overall Quality
Per
cen
t
Wave 1 Wave 2
S1 M = 2.90
S2 M = 2.83
S1 M = 3.16
S2 M = 3.15S1 M = 3.52
S2 M = 3.60
S1 M = 3.29
S2 M = 3.23
010203040506070
Mu
ch b
ette
r
Slig
htl
y b
ette
r
Sam
e
Slig
htl
y w
ors
e
Mu
ch w
ors
e
Mu
ch b
ette
r
Slig
htl
y b
ette
r
Sam
e
Slig
htl
y w
ors
e
Mu
ch w
ors
e
Mu
ch b
ette
r
Slig
htl
y b
ette
r
Sam
e
Slig
htl
y w
ors
e
Mu
ch w
ors
e
Mu
ch b
ette
r
Slig
htl
y b
ette
r
Sam
e
Slig
htl
y w
ors
e
Mu
ch w
ors
e
ProductiveDiscussion
ReviewerEngagement
MeetingManagement
Overall Quality
Per
cen
t
Wave 1 Wave 2
S1 M = 2.67
S2 M = 2.72
S1 M = 3.00
S2 M = 3.14
S1 M = 3.32
S2 M = 3.48
S1 M = 3.17
S2 M = 3.22
0
10
20
30
40
50
60
70
Mu
ch b
ette
r
Slig
htl
y b
ette
r
Sam
e
Slig
htl
y w
ors
e
Mu
ch w
ors
e
Mu
ch b
ette
r
Slig
htl
y b
ette
r
Sam
e
Slig
htl
y w
ors
e
Mu
ch w
ors
e
Mu
ch b
ette
r
Slig
htl
y b
ette
r
Sam
e
Slig
htl
y w
ors
e
Mu
ch w
ors
e
Mu
ch b
ette
r
Slig
htl
y b
ette
r
Sam
e
Slig
htl
y w
ors
e
Mu
ch w
ors
e
ProductiveDiscussion
ReviewerEngagement
MeetingManagement
Overall Quality
Per
cen
t
Wave 1 Wave 2
S1 M = 2.96
S2 M = 2.95
S1 M = 2.73
S2 M = 2.60
S1 M = 3.32
S2 M = 3.29
S1 M = 3.02
S2 M = 2.95
0
10
20
30
40
50
60
70
Mu
ch b
ette
r
Slig
htl
y b
ette
r
Sam
e
Slig
htl
y w
ors
e
Mu
ch w
ors
e
Mu
ch b
ette
r
Slig
htl
y b
ette
r
Sam
e
Slig
htl
y w
ors
e
Mu
ch w
ors
e
Mu
ch b
ette
r
Slig
htl
y b
ette
r
Sam
e
Slig
htl
y w
ors
e
Mu
ch w
ors
e
Mu
ch b
ette
r
Slig
htl
y b
ette
r
Sam
e
Slig
htl
y w
ors
e
Mu
ch w
ors
e
ProductiveDiscussion
ReviewerEngagement
MeetingManagement
Overall Quality
Per
cen
t
Wave 1 Wave 2
S1 M = 3.09S2 M = 3.19
S1 M = 3.53S2 M = 3.66
S1 M = 2.81S2 M = 2.82
S1 M = 3.26S2 M = 3.32
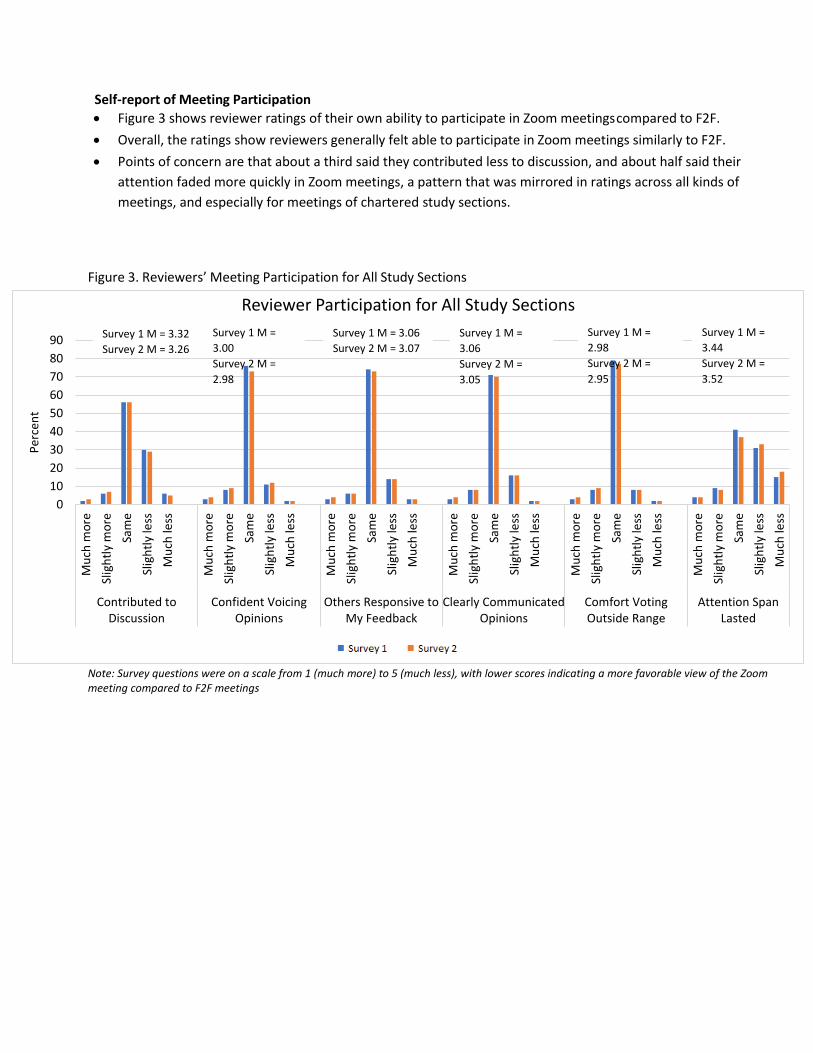
Self-report of Meeting Participation and Meeting Type
• Figures 13-16 shows reviewers’ participation in the review meeting by meeting type.
Figure 13. Reviewers’ Meeting Participation for Chartered Meetings
Figure 14. Reviewers’ Meeting Participation for Member Conflict Meetings
0102030405060708090
100
Mu
ch m
ore
Slig
htl
y m
ore
Sam
e
Slig
htl
y le
ss
Mu
ch le
ss
Mu
ch m
ore
Slig
htl
y m
ore
Sam
e
Slig
htl
y le
ss
Mu
ch le
ss
Mu
ch m
ore
Slig
htl
y m
ore
Sam
e
Slig
htl
y le
ss
Mu
ch le
ss
Mu
ch m
ore
Slig
htl
y m
ore
Sam
e
Slig
htl
y le
ss
Mu
ch le
ss
Mu
ch m
ore
Slig
htl
y m
ore
Sam
e
Slig
htl
y le
ss
Mu
ch le
ss
Mu
ch m
ore
Slig
htl
y m
ore
Sam
e
Slig
htl
y le
ss
Mu
ch le
ss
Contributed toDiscussion
Confident VoicingOpinions
Others Responsive toMy Feedback
Clearly CommunicatedOpinions
Comfort VotingOutside Range
Attention SpanLasted
Per
cen
t
Wave 1 Wave 2
S1 M = 3.51
S2 M = 3.58S1 M = 3.03
S2 M = 2.97S1 M = 3.10
S2 M = 3.07
S1 M = 3.09
S2 M = 3.07
S1 M = 3.04
S2 M = 3.00
S1 M = 3.37
S2 M = 3.29
0
10
20
30
40
50
60
70
80
90
100
Mu
ch m
ore
Slig
htl
y m
ore
Sam
e
Slig
htl
y le
ss
Mu
ch le
ss
Mu
ch m
ore
Slig
htl
y m
ore
Sam
e
Slig
htl
y le
ss
Mu
ch le
ss
Mu
ch m
ore
Slig
htl
y m
ore
Sam
e
Slig
htl
y le
ss
Mu
ch le
ss
Mu
ch m
ore
Slig
htl
y m
ore
Sam
e
Slig
htl
y le
ss
Mu
ch le
ss
Mu
ch m
ore
Slig
htl
y m
ore
Sam
e
Slig
htl
y le
ss
Mu
ch le
ss
Mu
ch m
ore
Slig
htl
y m
ore
Sam
e
Slig
htl
y le
ss
Mu
ch le
ss
Contributed toDiscussion
Confident VoicingOpinions
Others Responsive toMy Feedback
Clearly CommunicatedOpinions
Comfort VotingOutside Range
Attention SpanLasted
Per
cen
t
Wave 1 Wave 2
S1 M = 2.93
S2 M = 3.02
S1 M = 3.14
S2 M = 3.25S1 M = 2.97
S2 M = 2.95
S1 M = 3.00
S2 M = 3.02
S1 M = 2.91
S2 M = 2.91S1 M = 3.11
S2 M = 3.15

Figure 15. Reviewers’ Meeting Participation for Recurring Small Business Meetings
Figure 16. Reviewers’ Meeting Participation for Recurring Fellowships Meetings
Associations between reviewer characteristics and meeting participation
We also examined associations between reviewer characteristics and reviewer ratings of
their participation in meetings. There were a number of statistically significant, but small
effect size differences.
0
10
20
30
40
50
60
70
80
90
100
Mu
ch m
ore
Slig
htl
y m
ore
Sam
e
Slig
htl
y le
ss
Mu
ch le
ss
Mu
ch m
ore
Slig
htl
y m
ore
Sam
e
Slig
htl
y le
ss
Mu
ch le
ss
Mu
ch m
ore
Slig
htl
y m
ore
Sam
e
Slig
htl
y le
ss
Mu
ch le
ss
Mu
ch m
ore
Slig
htl
y m
ore
Sam
e
Slig
htl
y le
ss
Mu
ch le
ss
Mu
ch m
ore
Slig
htl
y m
ore
Sam
e
Slig
htl
y le
ss
Mu
ch le
ss
Mu
ch m
ore
Slig
htl
y m
ore
Sam
e
Slig
htl
y le
ss
Mu
ch le
ss
Contributed toDiscussion
Confident VoicingOpinions
Others Responsive toMy Feedback
Clearly CommunicatedOpinions
Comfort VotingOutside Range
Attention SpanLasted
Per
cen
t
Wave 1 Wave 2
S1 M = 2.99
S2 M = 2.94S1 M = 3.31
S2 M = 3.30
S1 M = 2.86
S2 M = 2.80S1 M = 3.01
S2 M = 3.00
S1 M = 2.91
S2 M = 2.84 S1 M = 3.23
S2 M = 3.11
0
10
20
30
40
50
60
70
80
90
100
Mu
ch m
ore
Slig
htl
y m
ore
Sam
e
Slig
htl
y le
ss
Mu
ch le
ss
Mu
ch m
ore
Slig
htl
y m
ore
Sam
e
Slig
htl
y le
ss
Mu
ch le
ss
Mu
ch m
ore
Slig
htl
y m
ore
Sam
e
Slig
htl
y le
ss
Mu
ch le
ss
Mu
ch m
ore
Slig
htl
y m
ore
Sam
e
Slig
htl
y le
ss
Mu
ch le
ss
Mu
ch m
ore
Slig
htl
y m
ore
Sam
e
Slig
htl
y le
ss
Mu
ch le
ss
Mu
ch m
ore
Slig
htl
y m
ore
Sam
e
Slig
htl
y le
ss
Mu
ch le
ssContributed to
DiscussionConfident Voicing
OpinionsOthers Responsive to
My FeedbackClearly Communicated
OpinionsComfort VotingOutside Range
Attention SpanLasted
Per
cen
t
Wave 1 Wave 2
S1 M = 3.50
S2 M = 3.60S1 M = 2.92
S2 M = 2.92
S1 M = 3.06
S2 M = 3.12
S1 M = 2.95
S2 M = 2.99 S1 M = 3.31
S2 M = 3.34
S1 M = 3.03
S2 M = 3.10

Open-ended, Qualitative Responses
Survey 1 Zoom Meetings: Reviewers Qualitative Feedback
The major themes from respondent comments in free fields asking for positive and negative aspects of
Zoom review meetings are summarized in Table 4.
Table 4. Major Themes
Positive Negative
No travel No social interactions/Camaraderie missing
Saves time, cost and energy Prefer face-to-face meeting
Reduces carbon footprint Less discussion
Better than teleconference or virtual
meeting (Chat-based)
Physical cues missing
Recommendations from Reviewers
▪ Have one face-to-face meeting out of 3 meetings for social interactions and camaraderie
▪ Have a timer for discussions to avoid long meetings
▪ Provide more breaks to reduce Zoom fatigue
▪ Include a social hour for networking
Survey 2 Zoom Meetings: Reviewers Qualitative Feedback
Reviewers were asked to share any comments (positive or negative) about their experience or general
thoughts on having their review meeting over Zoom. There were 2,186 comments submitted for this
question. Below categorizes the most commonly listed advantages and disadvantages of Zoom reviews,
followed by other salient comments.
Advantages of Zoom Reviews
▪ Travel
o No travel; more convenient
o Saves time, saves money, saves energy
▪ Equity
o Opens participation for parents, caregivers, disabled reviewers, industry workers
▪ Comfort
o Participate from comfort of home or office
o Access to resources such as multiple computer screens, coffee, bathroom

Disadvantages of Zoom Reviews
▪ Quality of Discussion
o Lower quality; less developed and productive (than F2F)
o Less discussion from non-assigned reviewers
o Less effective communication (e.g. difficult to see and read non-verbal cues, have back and
forth interactions, jump into the discussion/interrupt, ask questions, circular talking)
▪ Reviewer Engagement
o Less engagement and participation (than F2F)
o Attention span limitations and decreased concentration
o Fatigue
o Distractions/split attention/multitasking
▪ Social Networking and Camaraderie
o Unable to assess confidence and trust in peer reviewers’ judgements and competency
(especially for and towards new reviewers and junior colleagues)
o Stifles the building of relationships with new reviewers (e.g. mentoring, socializing)
o Hurts ability to build study section community and culture/missed social interactions
o No opportunity to use or solicit peer reviewers to help with one’s own research and career
growth
▪ Meeting Times
o Longer meetings
o Too short breaks
o Start times not friendly to reviewers in Pacific time zone
Other Salient Comments
▪ Support for a hybrid model—alternating between in-person and virtual meetings
▪ Most reviewers enjoyed the meeting and thought it ran smoothly
▪ SROs did a great job
Appendix
Methods Participants
Reviewers who participated in 276 CSR study section meetings (n = 3403; n for those
using Zoom = 3288) between May 27th to August 4th, 2020 (Survey 1). For Survey 2,
reviewers who participated in 293 CSR study section meetings on Zoom (n = 4045)
between January 28th to April 8th, 2021. The study section meetings included chartered
panels, recurring special emphasis panels (SEP) such as small business and fellowship
reviews, as well as member conflict SEPs.
Survey Administration
Reviewers were asked for their participation in a survey via email on the last day of the
study section meeting. The email contained a weblink to the survey. Reviewers were told in
the email that their responses would be kept confidential and that the survey would take
less than five minutes to complete. All surveys returned by August 6th, 2020 (Survey 1) and
May 10th, 2021 (Survey 2) were included for analysis. Copies of the surveys are appended.
Measures
Application Evaluation (Survey 2 only)
Two items asked participants to rate on a scale from 1 (strongly agree) to 7 (strongly disagree) the panel’s ability to evaluate the applications: 1) the panel was able to prioritize applications according to their impact and scientific merit, and 2) the scientific discussion helped the panel evaluate the applications being reviewed.
Peer Review Quality
Four items asked participants to rate on a scale from 1 (much better) to 5 (much worse)
how their Zoom review meeting compared to their normal face-to-face review meetings for
the following items: 1) overall quality of review, 2) productivity of discussions, 3) level of
reviewer engagement, and 4) meeting management.
Individual Participation and Perceptions
Six items asked participants to rate on a scale from 1 (much more) to 5 (much less) how
their Zoom review meeting compared to their normal face-to-face review meetings for the
following items: 1) I contributed to the discussion, 2) I felt confident voicing my opinions, 3) I
felt others were receptive and responsive to my feedback, 4) I was able to clearly
communicate opinions, 5) I felt comfortable voting outside the range, and 6) My attention
span at the meeting lasted.
Format Preference
One question asked participants if there were no or minimal health risks from COVID-19,
would they be more likely to participate in a review meeting if it was held face to face or
over Zoom/video? Response options included: face-to face, Zoom/video, and no
preference.
Demographic Information
Four questions were used to collect the demographic characteristics of respondents. 1)
Gender: male, female, I prefer not to respond; 2) Race: American Indian or Alaskan Native,
Asian, Black or African American, Native Hawaiian or Pacific Islander, White, I prefer not to
respond; 3) Ethnicity: Are you Hispanic? Yes, No, I prefer not to respond; 4) Career stage:
Assistant Professor, Associate Professor, Professor, Other.
Participants’ race and ethnicity were used to determine whether they were an
underrepresented minority or not. Non-Hispanic Asians and Non-Hispanic Whites were
coded as “not URM” and all other participants were coded as “URM”. For participants who
identified with more than one racial group, if one racial identity was not White or Asian,
they were coded as “URM”. Participants who identified as both White and Asian were
coded as “not URM”1.
Open-ended Response Options
Reviewers were also given the opportunity to provide any additional comments on overall
quality of Zoom review meeting and any comments (positive or negative) about their
experience in two text boxes: 1) How was the overall quality of your virtual review meeting
compared to your normal face-to- face meetings? (Survey 1 only), 2) Please share any
comments (positive or negative) about your experience or general thoughts on having your
review meeting over Zoom?
1 According to OMB standards, individuals who identify with an Asian racial group, other than Chinese, Filipino, Japanese,
Korean, Asian Indian or Thai are considered an under-represented minority (URM). However, the current data does not allow for this level of group specificity, and therefore only Asian participants who identify as Asian and another racial group (other than White) or as Asian and Hispanic are coded as URM.