Embed Size (px)
Citation preview

INSTITUTE OF
SERVICE EXCELLENCESINGAPORE MANAGEMENT UNIVERSITY
CSISG 2016 Q3 RESULTS Food & Beverage and Tourism

INSTITUTE OF
SERVICE EXCELLENCESINGAPORE MANAGEMENT UNIVERSITY
CSISG Methodology

3
Customer Satisfaction
CSISG (Scale of 0-100)
1. Overall Satisfaction 2. Ability to Meet Expectations
3. Similarity to Ideal
The CSISG Score

Qn. Overall Satisfaction Qn. Ability to Meet Expectations Qn. Similarity to Ideal
CSISG Structural Model For Q3 Sectors
Qn. Repurchase Intention Qn. Price Tolerance
Qn. Complaint Behaviour
Qn. Perceived Product Quality Qn. Perceived Product Customisation Qn. Perceived Product Reliability
Qn. Perceived Service Quality Qn. Perceived Service Customisation Qn. Perceived Service Reliability
Perceived Service Quality
Perceived Product Quality
Customer Expectations
Perceived Overall Quality
Perceived Value
Customer Satisfaction
Customer Complaints
Customer Loyalty
Qn. Price / Quality Qn. Quality / Price
Qn. Expected Overall Quality Qn. Expected Customisation Qn. Expected Reliability
4

Overview of the CSISG Main FieldworkSingapore citizens and PRs are interviewed at their homes.
Homes are selected from a random address listing that matches the housing profile of Singapore resident population.
Departing tourists are interviewed at Changi Airport.
(Applicable to all sub-sectors except Online Travel Agencies)
Typically 100-200 respondents per company would have answered the CSISG questionnaire.
Each respondent answers up to 21 CSISG questions and about 24 touchpoint questions about a company they had recent experiences with.
5

6
Sectors Covered F&B Tourism
Survey Period Jul to Oct 2016
Total Questionnaires Completed 8,563
Face-to-Face (Locals) 4,121
Tourists at Changi Airport 4,442
Distinct entities measured 59
Entities with published scores 631
CSISG 2016 Q3 Quick Facts

7
CSISG 2016 Q3 Sub-sectors
F&B Sector
• Restaurants
• Fast Food Restaurants
• Cafes & Snack Bars
• Bars & Pubs
• Food Courts
Tourism Sector
• Attractions
• Hotels
• Travel & Tour Services
• Online Travel Agencies NEW
REVISED
REVISED
Note: • Restaurants sub-sector was measured at holdings level prior to 2016. From 2016, Restaurants sub-sector is
measured at company level. • Hotels sub-sector was evaluated by both Locals and Tourists prior to 2016. From 2016, Hotels sub-sector is
evaluated only by Tourists. As scores are not directly comparable, no year-on-year comparisons will be made.
8
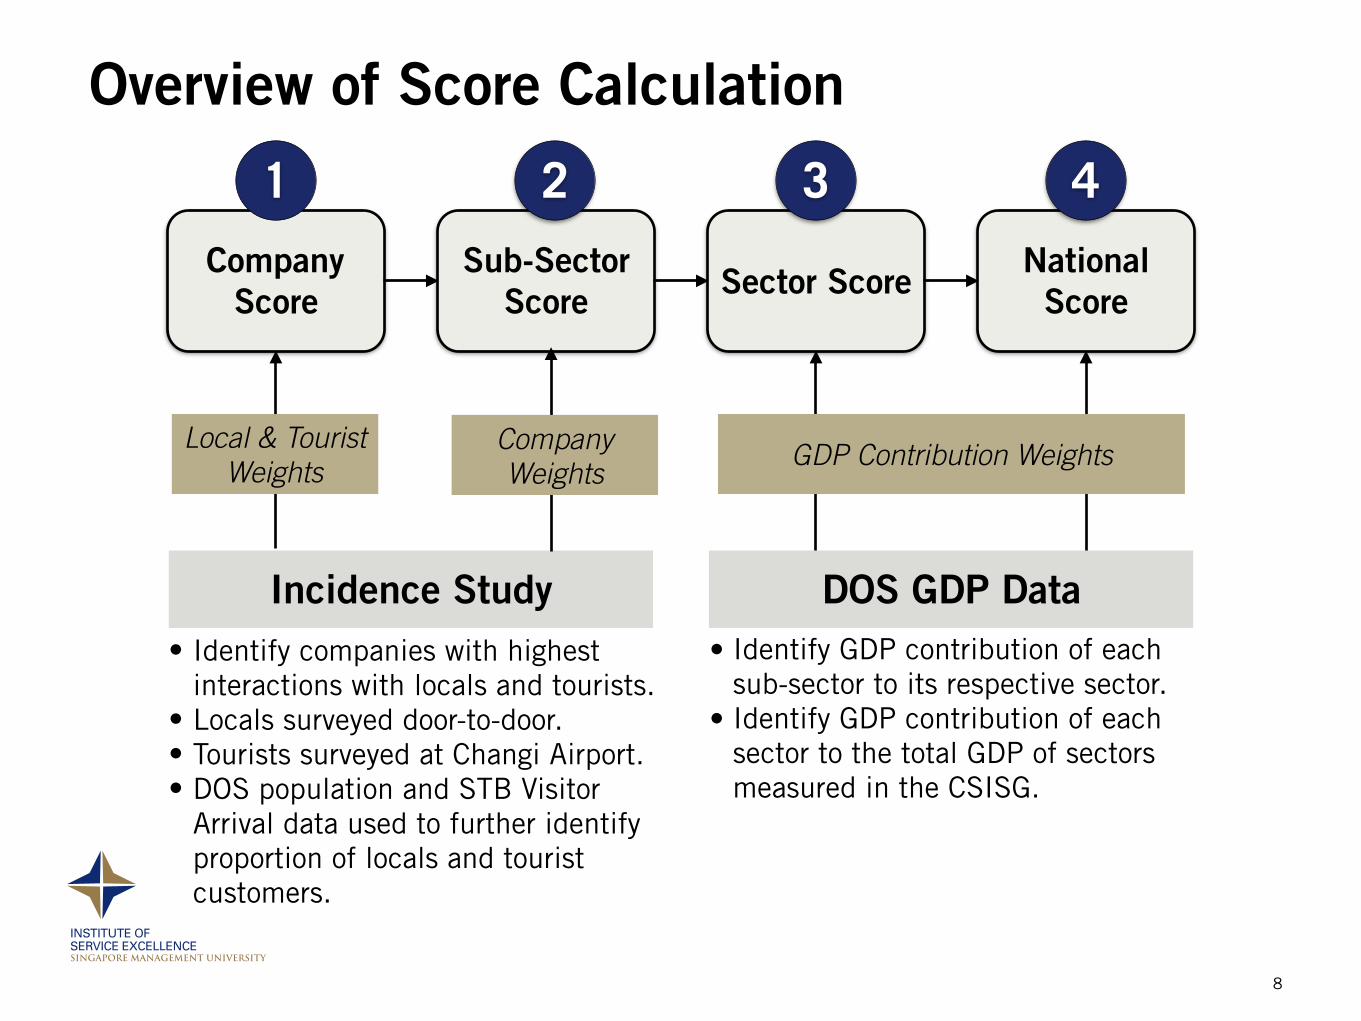
Overview of Score Calculation
Company Score
Sub-Sector Score
National ScoreSector Score
Incidence Study• Identify companies with highest
interactions with locals and tourists. • Locals surveyed door-to-door. • Tourists surveyed at Changi Airport. • DOS population and STB Visitor
Arrival data used to further identify proportion of locals and tourist customers.
Local & Tourist Weights
Company Weights
GDP Contribution Weights
• Identify GDP contribution of each sub-sector to its respective sector.
• Identify GDP contribution of each sector to the total GDP of sectors measured in the CSISG.
1 2 3 4
DOS GDP Data

INSTITUTE OF
SERVICE EXCELLENCESINGAPORE MANAGEMENT UNIVERSITY
CSISG 2016 Q3 RESULTS

10
CSISG 2016 Results Overview: F&B
2016 Q3 SCORES FOOD & BEVERAGE AND TOURISM
The sparklines indicate the satisfaction score of their respective sectors, sub-sectors and companies over the past few years.
statistically significant increase in customer satisfaction from 2015 to 2016
statistically significant decrease in customer satisfaction from 2015 to 2016
no significant year-on-year change in customer satisfaction score
This chart summarises the results of the CSISG 2016 satisfaction scores in the Food & Beverage, and Tourism sectors at the sector, sub-sector and company levels. Tracking of scores for Restaurants and Hotels sub-sectors will start from 2016 due to revision of survey methodology.
The sector scores (in gold) represents a weighted average of their respective sub-sector scores (in blue). Satisfaction scores for sub-sectors with individual company scores are weighted averages of these individual company scores.
All scores displayed are accurate to one-decimal place. Entities are presented in decreasing levels of satisfaction.
* Companies indicated with an asterisk(*) are companies that have performed significantly above their sub-sector average.
* Sub-sectors indicated with an asterisk(*) are sub-sectors that have performed significantly above their sector average.
71.1 Tourism
72.8 Attractions*74.3 Sentosa73.3 Singapore Zoo73.1 Universal Studios72.8 S.E.A. Aquarium72.6 Jurong Bird Park72.3 River Safari72.2 Night Safari72.1 Gardens By The Bay71.2 MBS Skypark71.1 Adventure Cove70.1 Singapore Discovery Centre70.5 Other attractions
72.5 Hotels*77.2 Marina Bay Sands*75.6 Shangri-La*74.9 The Ritz-Carlton*73.9 Marina Mandarin73.9 Pan Pacific Singapore73.6 Swissotel the Stamford73.3 Mandarin Orchard73.0 Grand Hyatt67.8 Hotel 8166.8 Fragrance Hotel72.5 Other hotels
68.7 Travel & Tour Services
67.7 Online Travel Agencies
70.1 Food & Beverage
72.7 Bars & Pubs*
70.7 Fast Food Restaurants72.3 McDonalds71.0 Burger King70.4 KFC69.5 Mos Burger68.8 Subway67.9 Other fast food restaurants
70.7 Cafes & Snack Bars72.7 Starbucks72.2 Delifrance70.2 Coffee Bean & Tea Leaf70.1 Ya Kun69.6 Toast Box68.6 Other cafes and snack bars
69.8 Restaurants71.7 Fish & Co 71.4 Boon Tong Kee 71.3 Din Tai Fung 71.2 Sushi Tei71.1 Tung Lok Signatures70.9 Crystal Jade Kitchen 70.8 Dian Xiao Er 70.6 Pizza Hut 70.4 Thai Express 70.2 Swensen’s 70.1 Manhattan Fish Market 70.1 Jack’s Place 70.1 Aston’s70.0 Nando’s70.0 Ajisen Ramen 69.8 Sakae Sushi 69.7 Crystal Jade La Mian Xiao Long Bao 69.6 Seoul Garden 69.3 Xin Wang Hong Kong Cafe 68.3 Imperial Treasure Noodle & Congee 68.0 Other restaurants 69.2 Food Courts70.6 Food Republic70.5 Food Junction70.0 NTUC Foodfare68.7 Kopitiam67.9 Koufu66.4 Other food courts
* Refers to companies/sub-sectors significantly above their sub-sector/sector scores
2016 Q3 SCORES FOOD & BEVERAGE AND TOURISM
The sparklines indicate the satisfaction score of their respective sectors, sub-sectors and companies over the past few years.
statistically significant increase in customer satisfaction from 2015 to 2016
statistically significant decrease in customer satisfaction from 2015 to 2016
no significant year-on-year change in customer satisfaction score
This chart summarises the results of the CSISG 2016 satisfaction scores in the Food & Beverage, and Tourism sectors at the sector, sub-sector and company levels. Tracking of scores for Restaurants and Hotels sub-sectors will start from 2016 due to revision of survey methodology.
The sector scores (in gold) represents a weighted average of their respective sub-sector scores (in blue). Satisfaction scores for sub-sectors with individual company scores are weighted averages of these individual company scores.
All scores displayed are accurate to one-decimal place. Entities are presented in decreasing levels of satisfaction.
* Companies indicated with an asterisk(*) are companies that have performed significantly above their sub-sector average.
* Sub-sectors indicated with an asterisk(*) are sub-sectors that have performed significantly above their sector average.
71.1 Tourism
72.8 Attractions*74.3 Sentosa73.3 Singapore Zoo73.1 Universal Studios72.8 S.E.A. Aquarium72.6 Jurong Bird Park72.3 River Safari72.2 Night Safari72.1 Gardens By The Bay71.2 MBS Skypark71.1 Adventure Cove70.1 Singapore Discovery Centre70.5 Other attractions
72.5 Hotels*77.2 Marina Bay Sands*75.6 Shangri-La*74.9 The Ritz-Carlton*73.9 Marina Mandarin73.9 Pan Pacific Singapore73.6 Swissotel the Stamford73.3 Mandarin Orchard73.0 Grand Hyatt67.8 Hotel 8166.8 Fragrance Hotel72.5 Other hotels
68.7 Travel & Tour Services
67.7 Online Travel Agencies
70.1 Food & Beverage
72.7 Bars & Pubs*
70.7 Fast Food Restaurants72.3 McDonalds71.0 Burger King70.4 KFC69.5 Mos Burger68.8 Subway67.9 Other fast food restaurants
70.7 Cafes & Snack Bars72.7 Starbucks72.2 Delifrance70.2 Coffee Bean & Tea Leaf70.1 Ya Kun69.6 Toast Box68.6 Other cafes and snack bars
69.8 Restaurants71.7 Fish & Co 71.4 Boon Tong Kee 71.3 Din Tai Fung 71.2 Sushi Tei71.1 Tung Lok Signatures70.9 Crystal Jade Kitchen 70.8 Dian Xiao Er 70.6 Pizza Hut 70.4 Thai Express 70.2 Swensen’s 70.1 Manhattan Fish Market 70.1 Jack’s Place 70.1 Astons70.0 Nando’s70.0 Ajisen Ramen 69.8 Sakae Sushi 69.7 Crystal Jade La Mian Xiao Long Bao 69.6 Seoul Garden 69.3 Xin Wang Hong Kong Cafe 68.3 Imperial Treasure Noodle & Congee 68.0 Other restaurants 69.2 Food Courts70.6 Food Republic70.5 Food Junction70.0 NTUC Foodfare68.7 Kopitiam67.9 Koufu66.4 Other food courts

11
CSISG 2016 Results Overview: Tourism
2016 Q3 SCORES FOOD & BEVERAGE AND TOURISM
The sparklines indicate the satisfaction score of their respective sectors, sub-sectors and companies over the past few years.
statistically significant increase in customer satisfaction from 2015 to 2016
statistically significant decrease in customer satisfaction from 2015 to 2016
no significant year-on-year change in customer satisfaction score
This chart summarises the results of the CSISG 2016 satisfaction scores in the Food & Beverage, and Tourism sectors at the sector, sub-sector and company levels. Tracking of scores for Restaurants and Hotels sub-sectors will start from 2016 due to revision of survey methodology.
The sector scores (in gold) represents a weighted average of their respective sub-sector scores (in blue). Satisfaction scores for sub-sectors with individual company scores are weighted averages of these individual company scores.
All scores displayed are accurate to one-decimal place. Entities are presented in decreasing levels of satisfaction.
* Companies indicated with an asterisk(*) are companies that have performed significantly above their sub-sector average.
* Sub-sectors indicated with an asterisk(*) are sub-sectors that have performed significantly above their sector average.
71.1 Tourism
72.8 Attractions*74.3 Sentosa73.3 Singapore Zoo73.1 Universal Studios72.8 S.E.A. Aquarium72.6 Jurong Bird Park72.3 River Safari72.2 Night Safari72.1 Gardens By The Bay71.2 MBS Skypark71.1 Adventure Cove70.1 Singapore Discovery Centre70.5 Other attractions
72.5 Hotels*77.2 Marina Bay Sands*75.6 Shangri-La*74.9 The Ritz-Carlton*73.9 Marina Mandarin73.9 Pan Pacific Singapore73.6 Swissotel the Stamford73.3 Mandarin Orchard73.0 Grand Hyatt67.8 Hotel 8166.8 Fragrance Hotel72.5 Other hotels
68.7 Travel & Tour Services
67.7 Online Travel Agencies
70.1 Food & Beverage
72.7 Bars & Pubs*
70.7 Fast Food Restaurants72.3 McDonalds71.0 Burger King70.4 KFC69.5 Mos Burger68.8 Subway67.9 Other fast food restaurants
70.7 Cafes & Snack Bars72.7 Starbucks72.2 Delifrance70.2 Coffee Bean & Tea Leaf70.1 Ya Kun69.6 Toast Box68.6 Other cafes and snack bars
69.8 Restaurants71.7 Fish & Co 71.4 Boon Tong Kee 71.3 Din Tai Fung 71.2 Sushi Tei71.1 Tung Lok Signatures70.9 Crystal Jade Kitchen 70.8 Dian Xiao Er 70.6 Pizza Hut 70.4 Thai Express 70.2 Swensen’s 70.1 Manhattan Fish Market 70.1 Jack’s Place 70.1 Aston’s70.0 Nando’s70.0 Ajisen Ramen 69.8 Sakae Sushi 69.7 Crystal Jade La Mian Xiao Long Bao 69.6 Seoul Garden 69.3 Xin Wang Hong Kong Cafe 68.3 Imperial Treasure Noodle & Congee 68.0 Other restaurants 69.2 Food Courts70.6 Food Republic70.5 Food Junction70.0 NTUC Foodfare68.7 Kopitiam67.9 Koufu66.4 Other food courts
* Refers to companies/sub-sectors significantly above their sub-sector/sector scores

INSTITUTE OF
SERVICE EXCELLENCESINGAPORE MANAGEMENT UNIVERSITY
Verbatim Word Clouds Segmented by Satisfaction

13
animals
beautifulfunclean
viewlotsridesenjoy
park niceinteresting
excitingfamily
birdsflowe
rs
nightride
singaporestaffenjoyedlove
photos
shows
day
visit
fisheszoo
attraction
experienceisland
kids
maintained
exhibits
lot
show
activities
interactive
organised
sentosathings
bird
feel
water
friendly
children
full
learn
taking
variety
close
plants
play
ages
animal
cool
cute
sea
tram
big
city
designed
safari
safe
visitors
wonderful
world
colourful
easy
engage
fresh
huge
nature
pool
slides
air
felt
laid
life
make
move
top
beach
care
display
dome
eye
free
train
wide
aircon
amazon
area
bay
bring
bus
filled
found
games
hang
rare
tank
them
etravel
walk
centre
eat
lives
real
river
set
tastytrip
longexpensive
limitedboring
worth
makingmoneyqueuerides
waitingwalk
attraction
easy photoprice
ride
ticket
animals
bigcrowded exhibits
express
floor
lack
parkpeople
quality
queues
signages
smallspent
staff
things
visit
visitors
wait
activities
affordable
birds
change
clear
common
dome
eateriesexciting
fishes
location
lot
lousy
made
minutes
move
optionsoverpricedphotography
poolpoorly
purchase reach
rip
service
simple
sit
slide
spacestations
tickets
zoo
Attractions
Respondents With CSISG 0 - 50 PointsRespondents With CSISG 75 - 100 points

14
chickenfast
staff love
order
burgerdelicious
tasty
service
pricecounter
quality
taking
big
friedfriendly
healthiermeal
outletpolite
waiting
cheap
choiceeatfresh
juicy
portion
sandwich
taste
affordableburgers
choose
crispy
healthy
onion
ordering
process rings
served
vegetables
clean
customer
fries
lot
quick
rice
sauce
serving
sweet
tables
burgerschicken
orderexpensive
fries
price
service
slow
smaller
staffbeef
bigcounter
crew
eating
find
higher likingordering
porridge
prefer
prices
sauce
small
smell
stingy
strong
Fast Food
Respondents With CSISG 0 - 50 PointsRespondents With CSISG 75 - 100 points

15
badcrowd
drinksended
likingpub
servicesound
staff system
wine
working
musicnice
drinksfriendly
funservice
staffatmosphere
band
bar
live
wide
ambience
beer
big
chill
chooseclub
fast
songs
wine
Bars & Pubs
Respondents With CSISG 0 - 50 PointsRespondents With CSISG 75 - 100 points

16
coffeenice
staff
taste
tasty
bread
cafe..
love
comfortable
kaya
toast
chill
delicious
drinksfriendly
relaxing
order
sandwiches
choose
enjoyed
environm
ent
fast
flavour
polite
tea
affordable
cakesclean
crispy
customers
dine
eatfresh
full
ice
pastry
puff
puffs
served
service
welcoming
addictive
aroma
atmosphere
big
buttercosy
courteous
eating
egg
feel
local
music
ordering
outlet
perfect
pricequiet
reasonabletoasted
staff
coffeebread
drinksorder
overpriced
service
dirty
expensive
freshtaste
bad
chocolates
coffeeshop
cold
longorders
overcrowded
pricerude
slowtaking
tastes
tasty
wrong
Cafes & Snack Bars
Respondents With CSISG 0 - 50 PointsRespondents With CSISG 75 - 100 points

17
agentstaffdelaypushy
friendlystaff
agentpackage
prom
otions
agencyattractive
courteous
Travel & Tour Services
Respondents With CSISG 0 - 50 PointsRespondents With CSISG 75 - 100 points

18
websitebooking
easycheaper
convenient
moneysave
service
accommodationcheap
information
make
provide accurate
book
friendly
hotels
user
book
ing
webs
ite
not easy
arrivedlot
bookingsexpecteduser−friendly
hidden
rooms
Online Travel Agencies
Respondents With CSISG 0 - 50 PointsRespondents With CSISG 75 - 100 points

19
staffroom long
small rude
servicebed
night
slow
things
aircon
back bad
busy
checking
efficient
hardhear
helpfulirritating
makingneeded
noises
orchard process
settlesleep
toilet
wait
roomstaff
comfortablecleanfriendly
niceview
spacious
shopping
service
helpful
maintainedbed
location
malls
poollocated
beautiful
facilities
stay
convenient
efficient
free
restaurants
big
attentive
polite
breakfast
excellentfind
price
singaporeeateries
fast
shops
courteous
easily
money
room
s
station
area
mrt
accessible
amenities
casino
design
grand
lots
nearby
professional
provide
served
sleep
awesomeconveniently
night
orchard
reasonable
swimming
toilettrain
accommodating
attractions
enjoy
love
perfect
process
provided
affordable
bay buffet
business
checking
city
complimentary
decorated
easy
fantastic
infinity
loved
lovelyluxurious
minutes
quick
relaxing
services
staffs
variety
visit
wide
wifi
wonderful
ambience
central
cheap
checkin
customersdecent
feel
front
gym
makes
making
pillow
receptionist
serveshower
soft
spread
strong
thoughtful
travel
welcom
ing
access
aircon
areas
asked
assistance
centrally
channelscheck
clear
comfy
delicacies
delicious
desk
everyday
greet
hotels
local
marina
meetneeded
phone
prom
pt
road
serving
spectacular
tasty
top
trained
warm
airport
approachable
basic
bathroom
cake
centre
chinatown
class
close
club
connected
convention dining
district
drinks
extremely
gardengave helping
huge
kids
kind
make
names
neat
offers
oriented
personalised
play
pleasant
privacy
proximity
rate
ready
rest
retail
situated
smartphone
smell
stayingsurprised
surrounding
things
told
town
tub
views
Hotels
Respondents With CSISG 0 - 50 PointsRespondents With CSISG 75 - 100 points

20
cleanchoose
choicesvariety
environmentcomfortablelocal
delicious
price
stalltable
tables
tasty
bigcard
eat
find
aircon
cheap convenient
cuisines dine
eating
nice
order
prices
reasonable
seat
staffstalls
wide
affordable
cheaper
easy
enjoy
lots
make
mix
options
qualityacceptable
chinese
cleaners cleaningcompareddelicacies
easiereasily
fastfeel
fresh
hot
money
noodles portionserved
varieties
expensivefresh
price
nice
portion
bad
increasinglong
priceschoices
coffee
drinks
easy
eat friendly
hawkerorder
seat
smaller
stall
table
bit
centre
cheaper
clean
clear
cleared
compared
customers
find handlingmalay
operators
pricing
service
shop
small
staff
sweet
tables
tasty
wait
Food Courts
Respondents With CSISG 0 - 50 PointsRespondents With CSISG 75 - 100 points

21
servicelongstaff
expensiveslow
qualityprice
overpriced
liking
serving
smallwaiting
fresh
served
bitorderstaffs
taste
average
customers meat
normal portionseated
table
bad
dry
orders
salty
sweet
tasty
wait
attentive
authentic
bill
cheap
delicious
duckeat
extra
lot
moneynice
people
pizza
portionsqueue
refill
rude
serve
soggy
soupsteaks
waitedworth
wrong
arranged
asked
buffet
buns
chicken
choices
cold
compared
cooked
crowded
difficultdishes
eating
fish
fishy
handling horrible
ice
inattentivemeal
menu
mins
minutes
paid
pastapaying
pick
rice
seats
side
talk
water
staffdelicious
tastynice
service
servedfresh
friendly
love
choose
chicken
tastepriceclean
money
attentive
quality
ricevariety
reasonableaffordable
fast
meal
noodles
polite
soup
sushi
widepizza
prepared
ambience
eat
order
portion
big
cooked
menu
dishes environment
set
fishlot
meat
spicy
waiting
dine
longserving
tender
cream
excellent
icejuicy
ramen
seafood
seated
choices
crews
dim
duck
helpfullots
oilyoptionsquickly
sashimi
serve
steak
sweet
waitxiao
bao
cheap
decent
freehot
salty
sum
waiter
chilli
dish
find
meals
seat
soft
topaccommodate
assist
belly
belt
buffet
desserts
ducks
flavour
flow
lunch
priced
quiet
size
skinthai
Restaurants
Respondents With CSISG 0 - 50 PointsRespondents With CSISG 75 - 100 points
INSTITUTE OF
SERVICE EXCELLENCESINGAPORE MANAGEMENT UNIVERSITY
Food & Beverage Sector Results

70
78Food & Beverage Sector
Restaurants
Cafes & Snack Bars
55
65
75Bars & Pubs
Fast Food
Food Courts
2007 2016
F&B Sector CSISG Trends
23

24
Satisfaction Up - Driven by Movements in Quality & Value
CSISG Customer Expectations
Perceived Quality
Perceived Value
Restaurants (No YoY Comparison) 69.8 72.0 71.2 70.1
Fast Food Restaurants 70.7 73.3 72.0 71.6
Cafes & Snack Bars 70.7 71.7 71.9 70.6
Bars & Pubs 72.7 74.1 74.0 73.5
Food Courts 69.2 69.0 70.5 69.4
▲▲
▲▼ Statistically significant year-on-year increase/drop at 90% confidence ◼ No statistically significant year-on-year change at 90% confidence
▲
▲
▲
▲
▲
▲
▲
▲
▲
▲

25
Satisfaction Up - Driven by Movements in Quality & Value
Customer Expectations
Perceived Quality
Perceived Value CSISG
Complaints
Customer Loyalty CSISG Customer
ExpectationsPerceived Quality
Perceived Value
Restaurants (No YoY Comparison) 69.8 72.0 71.2 70.1
Fast Food Restaurants 70.7 73.3 72.0 71.6
Cafes & Snack Bars 70.7 71.7 71.9 70.6
Bars & Pubs 72.7 74.1 74.0 73.5
Food Courts 69.2 69.0 70.5 69.4
▲▲
▲
▲
▲
▲
▲
▲
▲
▲
▲
▲

26
General Rise in Tourist Perception of Quality & Value
Locals Tourists
CSISGCustomer
ExpectationsPerceived Quality
Perceived Value CSISG
Customer Expectations
Perceived Quality
Perceived Value
Restaurants (No YoY
Comparison)66.8 69.5 67.9 67.1 73.9 75.4 75.7 74.3
Fast Food Restaurants 69.3 71.4 69.6 69.7 72.4 75.6 74.8 74.0
Cafes & Snack Bars 69.2 70.1 70.0 69.4 72.2 73.5 73.8 71.9
Bars & Pubs 69.0 71.4 69.2 69.5 74.6 75.4 76.4 75.6
Food Courts 67.1 67.1 68.1 67.4 74.5 74.5 76.3 74.4▲ ▲
▲
▲
▲
▲
▲
▲
▲
▲
▲
▲▼ Statistically significant year-on-year increase/drop at 90% confidence ◼ No statistically significant year-on-year change at 90% confidence

27
Fast Food Restaurants
Mcdonald's 72.2
KFC 67.5
Burger King 67.6
Other fast food restaurants 64.3
72.3 Mcdonald's
70.4 KFC
71.0 Burger King
69.5 Mos Burger
68.8 Subway
67.9 Other fast food restaurants
CSISG
2015
CSISG
2016
2007 201655
65
75Fast Food
New fast food restaurants measured in 2016: Mos Burger, Subway
70.7
70
78
Food & Beverage Sector

28
Cafes and Snack Bars
Coffee Bean & Tea Leaf 68.4
Starbucks 70.1
Other cafes and snack bars 67.7
72.2 Delifrance
70.2 Coffee Bean & Tea Leaf
72.7 Starbucks
70.1 Ya Kun 69.6 Toast Box
68.6 Other cafes and snack bars
CSISG
2015
CSISG
2016
2007 2016
Cafes & Snack Bars
55
65
75
New Cafes and Snack Bars measured in 2016: Delifrance, Ya Kun, Toastbox
70.7
70
78
Food & Beverage Sector

29
Food Courts
Kopitiam 65.9
Koufu 67.0
Food Republic 67.7
NTUC Foodfare 69.0
Other food courts 66.2
68.7 Kopitiam
67.9 Koufu
70.5 Food Junction
70.6 Food Republic
70.0 NTUC Foodfare
66.4 Other food courts
CSISG
2015
CSISG
2016
55
65
75Food Courts
New food court measured in 2016: Food Junction
69.2
70
78
Food & Beverage Sector
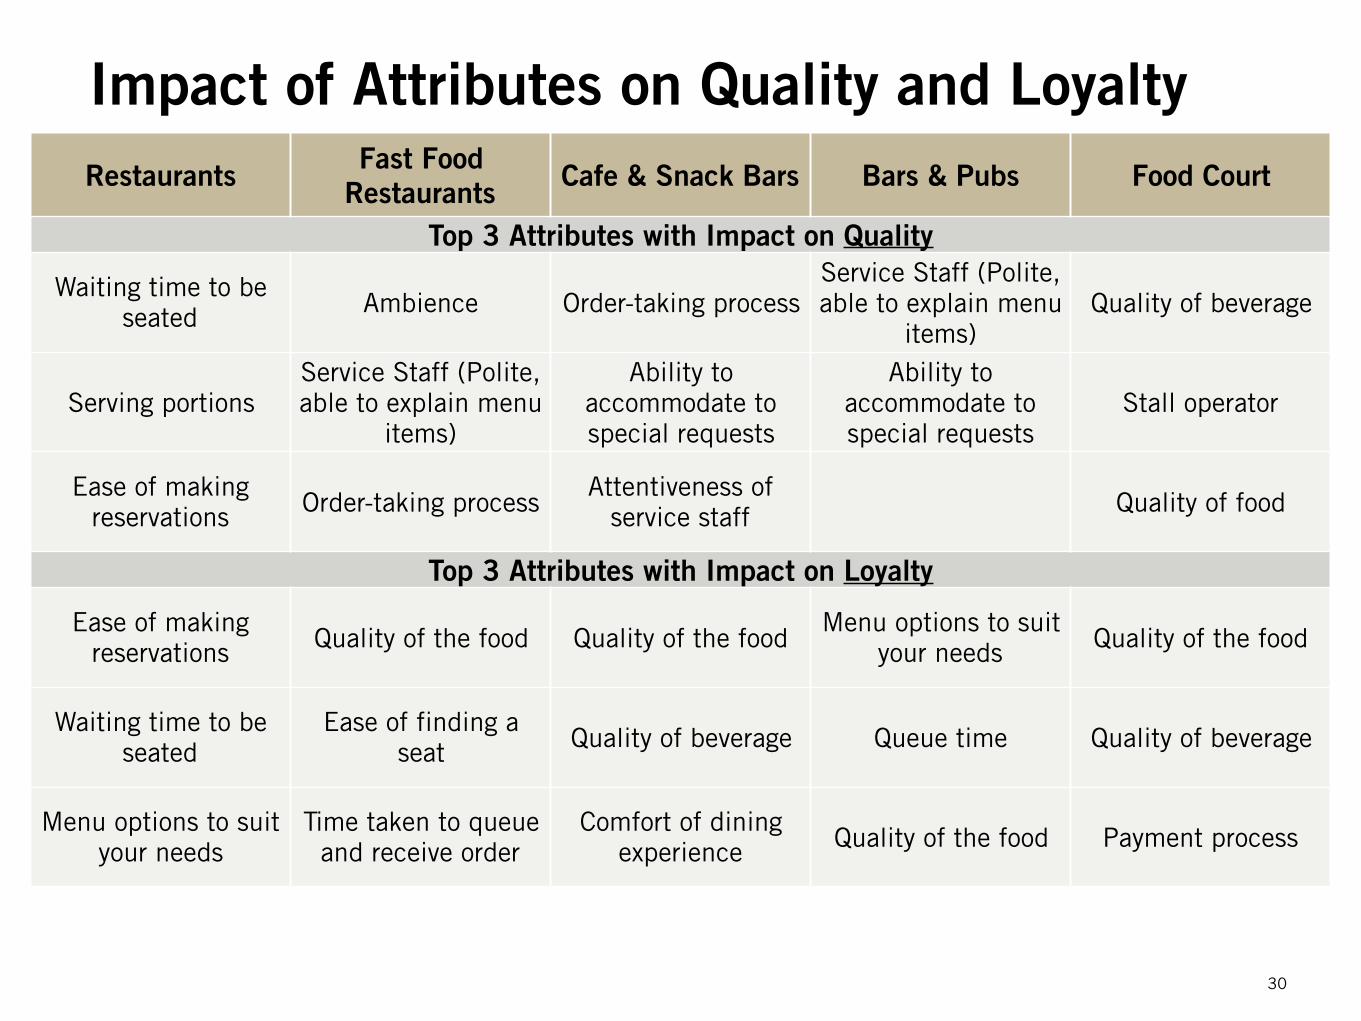
30
Impact of Attributes on Quality and LoyaltyRestaurants Fast Food
Restaurants Cafe & Snack Bars Bars & Pubs Food Court
Top 3 Attributes with Impact on Quality
Waiting time to be seated Ambience Order-taking process
Service Staff (Polite, able to explain menu
items)Quality of beverage
Serving portionsService Staff (Polite, able to explain menu
items)
Ability to accommodate to special requests
Ability to accommodate to special requests
Stall operator
Ease of making reservations Order-taking process
Attentiveness of service staff Quality of food
Top 3 Attributes with Impact on Loyalty
Ease of making reservations Quality of the food Quality of the food
Menu options to suit your needs Quality of the food
Waiting time to be seated
Ease of finding a seat Quality of beverage Queue time Quality of beverage
Menu options to suit your needs
Time taken to queue and receive order
Comfort of dining experience Quality of the food Payment process

31
Beyond Product, Service Elements A Key DifferentiatorRestaurants Fast Food
Restaurants Cafe & Snack Bars Bars & Pubs Food Court
Top 3 Attributes with Impact on Quality
Waiting time to be seated Ambience Order-taking process
Service Staff (Polite, able to explain menu
items)Quality of beverage
Serving portionsService Staff (Polite, able to explain menu
items)
Ability to accommodate to special requests
Ability to accommodate to special requests
Stall operator
Ease of making reservations Order-taking process
Attentiveness of service staff Quality of food
Top 3 Attributes with Impact on Loyalty
Ease of making reservations Quality of the food Quality of the food
Menu options to suit your needs Quality of the food
Waiting time to be seated
Ease of finding a seat Quality of beverage Queue time Quality of beverage
Menu options to suit your needs
Time taken to queue and receive order
Comfort of dining experience Quality of the food Payment process
Service Staff
ProductLegend: Service Process

32
Different Parts of the Journey MatterRestaurants Fast Food
Restaurants Cafe & Snack Bars Bars & Pubs Food Court
Top 3 Attributes with Impact on Quality
Waiting time to be seated Ambience Order-taking process
Service Staff (Polite, able to explain menu
items)Quality of beverage
Serving portionsService Staff (Polite, able to explain menu
items)
Ability to accommodate to special requests
Ability to accommodate to special requests
Stall operator
Ease of making reservations Order-taking process
Attentiveness of service staff Quality of food
Top 3 Attributes with Impact on Loyalty
Ease of making reservations Quality of the food Quality of the food
Menu options to suit your needs Quality of the food
Waiting time to be seated
Ease of finding a seat Quality of beverage Queue time Quality of beverage
Menu options to suit your needs
Time taken to queue and receive order
Comfort of dining experience Quality of the food Payment process
Front of Customer JourneyLegend:

Ease of making reservations
Waiting time to be seated
Menu options to suit your needs
Attentiveness of service staff
Service Staff (Polite, able to explain menu items)
Ability to accommodate to special requests
Ambience of the restaurant
Cleanliness of restaurant
Time taken to receive the food
Quality of the food
Quality of the beverage
Serving portions
Comfort of dining experience
Promotions and discounts offered
Payment process
6.5 7 7.5 8
TouristsLocals
Restaurants: Front End of Journey Key Differentiator to Both Satisfaction & Loyalty
33
Attributes with Impact on Quality Attributes with Impact on Loyalty

Ease of finding a seat
Time taken to queue and receive order
Menu options to suit your needs
Order-taking process
Service Staff (Polite, able to explain menu items)
Attentiveness of service staff
Ability to accommodate to special requests
Promotions and discounts offered
Payment process
Ambience
Cleanliness of the dining area
Quality of the food
Quality of beverage
Serving portions
Comfort of dining experience
34
Cafes & Snack Bars: Service Key Differentiator to Satisfaction But Quality Key to Loyalty
6.5 7 7.5 8
TouristsLocals
Attributes with Impact on Quality Attributes with Impact on Loyalty

INSTITUTE OF
SERVICE EXCELLENCESINGAPORE MANAGEMENT UNIVERSITY
Tourism Sector Results

60
70
80Attractions Hotels
Travel & Tour Services
2007 2016
70
78
Tourism Sector
Tourism Sector CSISG Trends
Online Travel Agencies
36

37
Rise In Attractions Score Due to Increase in Perceived Quality & Value
CSISG Customer Expectations
Perceived Quality
Perceived Value
Attractions 72.8 73.0 74.2 73.1
Hotels (Tourist only)
72.5 73.1 73.8 72.8
Travel & Tour Services 68.7 70.7 71.0 69.3
Online Travel Agencies
(New Sub-sector)67.7 71.4 68.3 68.4
▲▼ Statistically significant year-on-year increase/drop at 90% confidence ◼ No statistically significant year-on-year change at 90% confidence
▲
▲▲▲
▲

38
Attractions
Sentosa 71.6
Jurong Bird Park 70.7
Singapore Zoo 71.6
Night Safari 70.7
River Safari 71.4
Universal Studios 71.0
Adventure Cove 69.9
S.E.A. Aquarium 72.1
Other attractions 68.7
74.3 Sentosa
72.6 Jurong Bird Park
73.3 Singapore Zoo
72.2 Night Safari 72.3 River Safari
73.1 Universal Studios
70.1 Singapore Discovery Centre
71.1 Adventure Cove 71.2 MBS Skypark
72.1 Gardens By The Bay
72.8 S.E.A. Aquarium
70.5 Other attractions
CSISG
2015
CSISG
2016
Attractions
60
70
80
New attractions measured in 2016: Gardens by the Bay, MBS Skypark, Singapore Discovery Centre
72.8
70
78
Tourism Sector

39
Impact of Attributes on Quality and Loyalty
Attractions Hotels Travel & Tour Services Online Travel Agencies
Top 3 Attributes with Impact on Quality
Ease of getting around Hotel FacilitiesPromotions and
discounts Ease of navigating
Cleanliness of attraction In-Room AmenitiesAbility to provide
information and adviceRange of products
available
Staff knowledge about the attraction
Efficiency of check-in/check-out process
Ease of making reservation / booking
Information provided by website
Top 3 Attributes with Impact on LoyaltyFood and beverage
optionsEfficiency of check-in/
check-out processEase of making
reservation / bookingPromotions and
discounts
Clarity of directions Internet connectivityAbility to accommodate
to special requestsEase of making
reservation / booking
Cleanliness of attractionAbility to accommodate
to special requestsEase of indicating special requests

40
Attractions: Environment & Way Finding Key Differentiators
Attractions Hotels Travel & Tour Services Online Travel Agencies
Top 3 Attributes with Impact on Quality
Ease of getting around Hotel FacilitiesPromotions and
discounts Ease of navigating
Cleanliness of attraction In-Room AmenitiesAbility to provide
information and adviceRange of products
available
Staff knowledge about the attraction
Efficiency of check-in/check-out process
Ease of making reservation / booking
Information provided by website
Top 3 Attributes with Impact on LoyaltyFood and beverage
optionsEfficiency of check-in/
check-out processEase of making
reservation / bookingPromotions and
discounts
Clarity of directions Internet connectivityAbility to accommodate
to special requestsEase of making
reservation / booking
Cleanliness of attractionAbility to accommodate
to special requestsEase of indicating special requests
Way Finding CleanlinessLegend:

41
Hotels: Amenities & Check-in/out Process Key Differentiators
Attractions Hotels Travel & Tour Services Online Travel Agencies
Top 3 Attributes with Impact on Quality
Ease of getting around Hotel FacilitiesPromotions and
discounts Ease of navigating
Cleanliness of attraction In-Room AmenitiesAbility to provide
information and adviceRange of products
available
Staff knowledge about the attraction
Efficiency of check-in/check-out process
Ease of making reservation / booking
Information provided by website
Top 3 Attributes with Impact on LoyaltyFood and beverage
optionsEfficiency of check-in/
check-out processEase of making
reservation / bookingPromotions and
discounts
Clarity of directions Internet connectivityAbility to accommodate
to special requestsEase of making
reservation / booking
Cleanliness of attractionAbility to accommodate
to special requestsEase of indicating special requests
Check-in/out process
AmenitiesLegend:

42
Travel Services: Similar Attributes Differentiator for Loyalty
Attractions Hotels Travel & Tour Services Online Travel Agencies
Top 3 Attributes with Impact on Quality
Ease of getting around Hotel FacilitiesPromotions and
discounts Ease of navigating
Cleanliness of attraction In-Room AmenitiesAbility to provide
information and adviceRange of products
available
Staff knowledge about the attraction
Efficiency of check-in/check-out process
Ease of making reservation / booking
Information provided by website
Top 3 Attributes with Impact on LoyaltyFood and beverage
optionsEfficiency of check-in/
check-out processEase of making
reservation / bookingPromotions and
discounts
Clarity of directions Internet connectivityAbility to accommodate
to special requestsEase of making
reservation / booking
Cleanliness of attractionAbility to accommodate
to special requestsEase of indicating special requests

43
Service Elements Key Differentiator for Loyalty
Attractions Hotels Travel & Tour Services Online Travel Agencies
Top 3 Attributes with Impact on Quality
Ease of getting around Hotel FacilitiesPromotions and
discounts Ease of navigating
Cleanliness of attraction In-Room AmenitiesAbility to provide
information and adviceRange of products
available
Staff knowledge about the attraction
Efficiency of check-in/check-out process
Ease of making reservation / booking
Information provided by website
Top 3 Attributes with Impact on LoyaltyFood and beverage
optionsEfficiency of check-in/
check-out processEase of making
reservation / bookingPromotions and
discounts
Clarity of directions Internet connectivityAbility to accommodate
to special requestsEase of making
reservation / booking
Cleanliness of attractionAbility to accommodate
to special requestsEase of indicating special requests
Service Staff
ProductLegend: Service Process

44
• Overall, Food & Beverage and Tourism saw significant increases in satisfaction in 2016.
• Food & Beverage:
• Lower predicted quality scores (Customer Expectations) for locals.
• Beyond the obvious product itself, service elements are also key differentiators.
• Different parts of the service journey matter to quality and loyalty.
• Tourism:
• Beyond the product, service process and interactions are key differentiators.
Summary


![CSISG 2016 Q4 [FINAL] - ise.smu.edu.sg · 71.7 NTUC Fairprice 71.1 Giant 67.6 Other supermarkets 71.1 e-Commerce ... This above chart summarises the results of the CSISG 2016 satisfaction](https://img.dokumen.tips/doc/110x75/5b3ffe857f8b9a5e528cc8ba/csisg-2016-q4-final-isesmuedusg-717-ntuc-fairprice-711-giant-676-other.jpg)