Embed Size (px)
Citation preview

CSC Proprietary 9/7/2006 7:46:00 AM 0736kg 0
CSC Balanced Scorecard ProcessSM
Measuring For Success
Albert Hoefer IIIComputer Sciences Corporation2100 East Grand AvenueEl Segundo, California 90245USA
Transform and manage business relationships

CSC Balanced Scorecard ProcessSM
© 2002 CSC. All Rights Reserved. CSC Proprietary 9/7/2006 7:46:00 AM 0736kg 1
Agenda• Overview• Building the scorecard
– Process– Work Products
• Examples• Tools

CSC Balanced Scorecard ProcessSM
© 2002 CSC. All Rights Reserved. CSC Proprietary 9/7/2006 7:46:00 AM 0736kg 2
End of the trilogy• Stan Rifkin (2002: San Antonio)
– “Why is it (so) Difficult to Implement a Function Point Analysis or Measurement Program?”
– Failure of GQM to examine organizational strategy and focus on business goals
– The Discipline of Market Leaders, Michael Treacy and Fred Wiersema• Customer Intimacy• Operational Excellence is more or less a solved problem.• Product Innovativeness
• John Tittle (2003: Scottsdale)– “You are Already an Expense, Are You an Asset?”
• The Squeeze Play (Cost, Value pressures in FP counts)– Application Sizing technique– International Widget Users Group (IWUG)
• CSC Balanced Scorecard Process SM
– Understand org change mechanisms and how measurement drives behavior

CSC Balanced Scorecard ProcessSM
© 2002 CSC. All Rights Reserved. CSC Proprietary 9/7/2006 7:46:00 AM 0736kg 3
Business Situation
“You’re making my job harder
instead of helping me”
“You’re only interested in avoiding Penalties”
Metrics don’t measure what I want
“Where’s the innovation you promised ?”
Everything is a priority 1!
“Mainframe may have been up, but we couldn’t
get to it, so it was really down to me”
“You reported 16 minutes of a TSO outage
but it’s not reflected in the SLA metric”
“You need to round the SLA computations to 3
digits, not 2”
Contract is never put away
Focused on getting the data not the actual performance
Don’t know where you are because you have no
measures of performance
Solution: The CSC Balanced Scorecard ProcessSM

CSC Balanced Scorecard ProcessSM
© 2002 CSC. All Rights Reserved. CSC Proprietary 9/7/2006 7:46:00 AM 0736kg 4
Why Manage your Organization using a Balanced Scorecard?Provides a framework which
–Enables organizations to identify business goals –Translates business goals into measures that drive
the right behavior –Aligns day to day activities to achieve goals –Communicates performance to the organization– Identifies and enables continuous improvement of
performance to meet goals– Evolves as the business situation changes
The CSC Balanced Scorecard ProcessSM
drives organizational behavior to meet business objectives

CSC Proprietary 9/7/2006 7:46:00 AM 0736kg 5
Building the scorecard

CSC Balanced Scorecard ProcessSM
© 2002 CSC. All Rights Reserved. CSC Proprietary 9/7/2006 7:46:00 AM 0736kg 6
The Process Month 1-2 Month 3
Development Time Maintain currency with annual review
KeyResults Decision Matrix Metric
Specifications
• Saaty Analytic Hierarchy Process
• Expert Choice• IMA Accelerating
Change
Select the metrics that symbolize
and clarify the relationship
(step 3)
Determine expectations
that characterize the long-term relationship
(step 1)
Rank the most
important factors and
criteria
(step 2)
Monitor and addressbehavior using theVital Signs
Report
(step 4)
Tools andTechniques
• Kaplan & Norton Balanced Scorecard
• CSC CatalystSM
• SEI definition template • CSC Metrics Program• Piecewise Linear
Modeling • Statistical Process Control• SEI Goal Question Metric
• Visual Display of Information
Vital Signs Report Format

CSC Balanced Scorecard ProcessSM
© 2002 CSC. All Rights Reserved. CSC Proprietary 9/7/2006 7:46:00 AM 0736kg 7
Measuring more than one business perspective ensures that appropriate attention is given to each requirement and that overall expectations are met
instead of focusing on a single point of service
Business Goals &
ExpectationsFuture ValueFuture Value
QualityQualityCommitmentsCommitments
Deliver to CommitmentsGet it Right the First Time,
Better the Next Time
ProductivityProductivity
Working Smarter,Not Harder
Working Smarter,Not Harder
Customer SatisfactionCustomer
Satisfaction
Invest in the FutureToday
Earning Your TrustEarning Your Trust

CSC Balanced Scorecard ProcessSM
© 2002 CSC. All Rights Reserved. CSC Proprietary 9/7/2006 7:46:00 AM 0736kg 8
Weighting ensures that appropriate attention is given to your most critical goals and expectations
Business Goals &
Expectations
Commitments38.5%
Commitments38.5%
Quality14%
Quality14%
Customer Satisfaction
31.3%
Customer Satisfaction
31.3%
Future Value6.3%
Future Value6.3%
Productivity9.9%
Productivity9.9%
Most critical
Lower priority

CSC Balanced Scorecard ProcessSM
© 2002 CSC. All Rights Reserved. CSC Proprietary 9/7/2006 7:46:00 AM 0736kg 9
Metrics are defined that drive the desired behaviors; their relative importance is captured by weighting the individual metrics in order of priority
Business Goals &
Expectations
Commitments38.5%
Commitments38.5%
Quality14%
Quality14%
Customer Satisfaction
31.3%
Customer Satisfaction
31.3%
Future Value6.3%
Future Value6.3%Productivity
9.9%Productivity
9.9%
Deliver to Commitments Deliver to Commitments
• Responsiveness 24%• Severity 1 (16%)• Severity 2 (8%)
• Projects on Budget 10.7%• Projects on schedule 3.8%
• Responsiveness 24%• Severity 1 (16%)• Severity 2 (8%)
• Projects on Budget 10.7%• Projects on schedule 3.8%
• Defects 8.5%• Compliance to Procedures 5.5%• Defects 8.5%• Compliance to Procedures 5.5%
Get it Right the First Time,Better the Next Time
Invest in the FutureToday
Invest in the FutureToday
• Training Hours 1.8%• Innovative Proposals 1.8%• Key Employee Succession 2.7%
• Training Hours 1.8%• Innovative Proposals 1.8%• Key Employee Succession 2.7%
Earning Your trustEarning Your trust
• Post Implementation Survey 18.8%• IT Survey 12.5%• Post Implementation Survey 18.8%• IT Survey 12.5%
Working Smarter,Not Harder
Working Smarter,Not Harder
• Portfolio Efficiency 5.5%• Skill Mix Index 1.4%• Reduction in Small Jobs 3.0%
• Portfolio Efficiency 5.5%• Skill Mix Index 1.4%• Reduction in Small Jobs 3.0%
CSC Balanced Scorecard ProcessSM
© 2002 CSC. All Rights Reserved. CSC Proprietary 9/7/2006 7:46:00 AM 0736kg 10
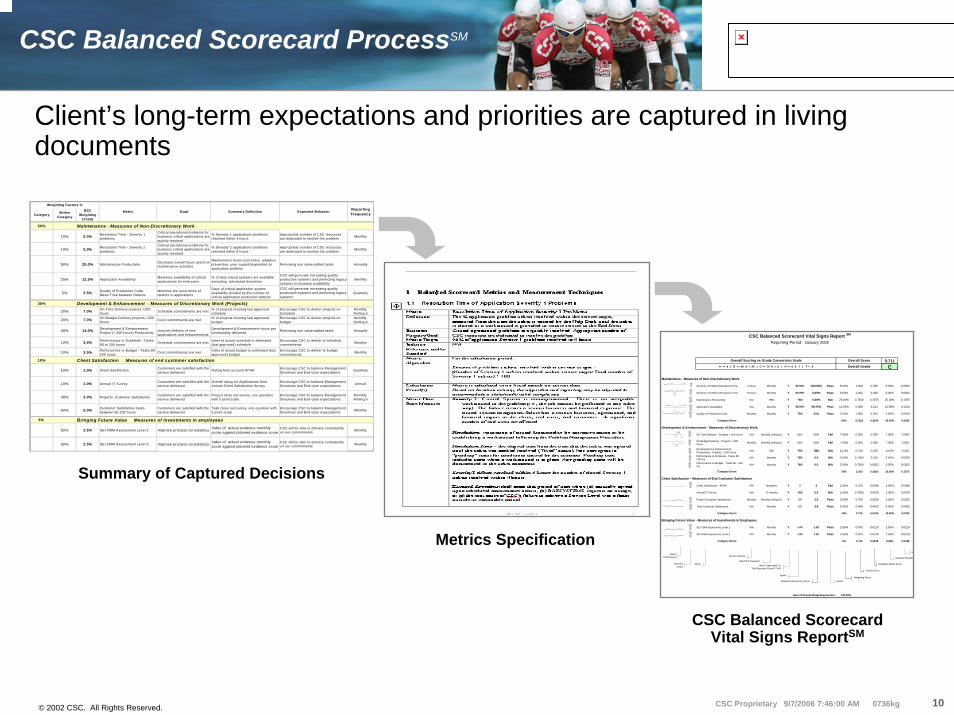
Client’s long-term expectations and priorities are captured in living documents
Weighting Factors %
50% Maintenance - Measures of Non-Discretionary Work
10% 5.0% Resolution Time - Severity 1 problems
Critical operational problems for business critical applications are quickly resolved
% Severity 1 applications problems resolved within 4 hours
Appropriate number of CSC resources are dedicated to resolve the problem Monthly
10% 5.0% Resolution Time - Severity 2
problems
Critical operational problems for business critical applications are quickly resolved
% Severity 2 applications problems resolved within 8 hours
Appropriate number of CSC resources are dedicated to resolve the problem Monthly
50% 25.0% Maintenance Productivity Decrease overall hours spent on maintenance activities
Maintenance hours (corrective, adaptive, preventive, user support)expended on application portfolio
Removing non value-added tasks Annually
25% 12.5% Application Availability Maximize availability of critical applications for end-users
% of time critical systems are available excluding scheduled downtime
CSC will generate increasing quality production systems and perfecting legacy systems to increase availability
Monthly
5% 2.5% Quality of Production CodeMean Time between Defects
Minimize the occurrence of defects in applications
Days of critical application system availability divided by the number of critical application production defects
CSC will generate increasing quality production systems and perfecting legacy systems
Quarterly
35% Development & Enhancement - Measures of Discretionary Work (Projects)20% 7.0% On Time Delivery projects >200
hours Schedule commitments are met % of projects meeting last approved schedule
Encourage CSC to deliver projects on Schedule
Monthly, Rolling 6
20% 7.0% On Budget Delivery projects >200 hours Cost commitments are met % of projects meeting last approved
budgetEncourage CSC to deliver projects on budget
Monthly, Rolling 6
40% 14.0% Development & Enhancement Project (> 200 hours) Productivity Improve delivery of new
applications and enhancements
Development & Enhancement hours per functionality delivered Removing non value-added tasks Annually
10% 3.5% Performance to Schedule - Tasks 80 to 200 hours Schedule commitments are met Index of actual schedule to estimated
(last approved) schedule Encourage CSC to deliver to schedule commitments Monthly
10% 3.5% Perforamnce to Budget - Tasks 80-200 hours Cost commitments are met Index of actual budget to estimated (last
approved) budgetEncourage CSC to deliver to budget commitments Monthly
10% Client Satisfaction Measures of end customer satisfaction
10% 1.0% Client Satisfaction Customers are satisfied with the service delivered Rating from account APAR Encourage CSC to balance Management
Directives and End-User expectations Quarterly
10% 1.0% Annual IT Survey Customers are satisfied with the service delivered
Overall rating for Applications from Annual Client Satisfaction Survey
Encourage CSC to balance Management Directives and End-User expectations Annual
30% 3.0% Projects Customer Satisfaction Customers are satisfied with the service delivered
Project close out survey, one question with 5 point scale
Encourage CSC to balance Management Directives and End-User expectations
Monthly, Rolling 6
50% 5.0% Customer Satisfaction tasks between 80-200 hours
Customers are satisfied with the service delivered
Task close out survey, one question with 5 point scale
Encourage CSC to balance Management Directives and End-User expectations Monthly
5% Bringing Future Value Measures of investments in employees
50% 2.5% SEI CMM Assessment Level 2 Improve process consistency Index of actual evidence monthly score against planned evidence score
CSC will be able to delivery consistently on our commitments Monthly
50% 2.5% SEI CMM Assessment Level 3 Improve process consistency Index of actual evidence monthly score against planned evidence score
CSC will be able to delivery consistently on our commitments Monthly
Category Within Category
BSC Weighting
(Total)
Metric Summary Definition Expected Behavior ReportingFrequencyGoal
Summary of Captured Decisions
Metrics Specification
CSC Balanced Scorecard Vital Signs Report SM
Reporting Period: January 2002
0.711C
Maintenance - Measures of Non-Discretionary Work
Severity 1 Problem Resolution Time 4 hours Monthly Y 90.00% 100.00% Pass 5.00% 1.000 0.050 5.00% 0.0500
Severity 2 Problem Resolution Time 8 hours Monthly Y 80.00% 0.00% Pass 5.00% 1.000 0.050 5.00% 0.0500
Maintenance Productivity N/A TBD Y TBD 0.00% N/A 25.00% 0.7500 0.1875 25.00% 0.1875
Application Availability N/A Monthly Y 98.00% 99.75% Pass 12.50% 0.968 0.121 12.50% 0.1210
Quality of Production Code Monthly Monthly Y TBD 23.5 Pass 2.50% 1.000 0.025 2.50% 0.0250
50% 4.7182 0.4335 50.00% 0.4335
Development & Enhancement - Measures of Discretionary Work
On Time Delivery - Projects > 200 hours N/A Monthly (rolling 6) Y 80% 50% Fail 7.00% 0.000 0.000 7.00% 0.000
On Budget Delivery - Projects > 200 hours Monthly Monthly (rolling 6) Y 80% 50% Fail 7.00% 0.000 0.000 7.00% 0.000
Development & Enhancement Productivity - Projects > 200 hours N/A TBD Y TBD TBD N/A 14.0% 0.750 0.105 14.0% 0.105
Performance to Schedule - Tasks 80 - 200 hrs N/A Monthly Y TBD 0.0 N/A 3.50% 0.7500 0.105 3.50% 0.0263
Performance to Budget - Tasks 80 - 200 hrs N/A Monthly Y TBD 0.0 N/A 3.50% 0.7500 0.0263 3.50% 0.0263
35% 2.250 0.2363 35.00% 0.1575
Client Satisfaction - Measures of End Customer Satisfaction
Client Satisfaction - APAR N/A Quarterly Y 3 2 Fail 1.00% 0.375 0.0038 1.00% 0.0038
Annual IT Survey N/A 12 months Y TBD 0.0 N/A 1.00% 0.7500 0.0075 1.00% 0.0075
Project Customer Satisfaction Monthly Monthly (rolling 6) Y 3.0 3.0 Pass 3.00% 0.750 0.0225 3.00% 0.0225
Task Customer Satisfaction N/A Monthly Y 3.0 3.8 Pass 5.00% 0.845 0.0422 5.00% 0.0422
10% 2.720 0.0760 10.00% 0.0760
Bringing Future Value - Measures of Investments in Employees
SEI CMM Assesment Level 2 N/A Monthly Y 1.00 1.10 Pass 2.50% 0.875 0.0219 2.50% 0.0219
SEI CMM Assesment Level 3 N/A Monthly Y 1.00 1.10 Pass 2.50% 0.875 0.0219 2.50% 0.0219
5% 1.750 0.0438 5.00% 0.0438
Sum of Scored Weighting Factors: 100.00%
Overall Score
Overall Grade
Overall Scoring vs Grade Conversion ScaleA => .9 | B => .80 & < .90 | C => .70 & < .8 | D => .6 & .7 | F < .6
Category Score
Category Score
Category Score
Category Score
Metric
Service Window
Reporting Frequency
Metric Applicable For This Reporting Period? (Y/N)
Target
Balanced ScoreCard ScoreWeighting Factor
Scaled Score
Weighted Metric Score
Result
Adjusted Weightin
Ad
Desired Trend
Metirc Performance
CSC Balanced ScorecardVital Signs ReportSM

CSC Balanced Scorecard ProcessSM
© 2002 CSC. All Rights Reserved. CSC Proprietary 9/7/2006 7:46:00 AM 0736kg 11
The resulting Vital Signs Report communicates expectations and behaviors, providing an at-a-glance summary of performance
C S C B a la n c e d S c o r e c a r d V ita l S ig n s R e p o r ts
0 .8 9 8B
P e r fo r m a n c e M e tr icS e r v ic e
L e v e lR e p o r t in g F r e q u e n c y T a rg e t A c tu a l
P a s s /F a il
W e ig h t in gF a c to r
S c a le dS c o re
W e ig h te dS c o r e
C o m m itm e n ts " D e l iv e r o n C o m m itm e n ts "
S e v e r ity 1 P ro b le m R e s o lu t io n T im e 4 h o u rs M o n th ly Y 9 0 % 1 0 0 % P a s s 1 6 .0 % 1 .0 0 0 0 .1 6 0
S e v e r ity 2 P ro b le m R e s o lu t io n T im e 8 h o u rs M o n th ly Y 8 0 % 1 0 0 % P a s s 8 .0 % 1 .0 0 0 0 .0 8 0
O n T im e D e liv e ry N /A M o n th ly ( ro l l in g 6 ) Y 8 0 % 9 8 % P a s s 1 0 .7 % 0 .9 7 2 0 .1 0 4
O n B u d g e t D e l iv e ry N /A M o n th ly ( ro l l in g 6 ) Y 8 0 % 9 8 % P a s s 3 .8 % 0 .9 7 2 0 .0 3 7
3 9 % 3 .9 4 3 0 .3 8 1
Q u a l i t y " G e t i t r ig h t th e f i r s t t im e , b e t te r th e n e x t t im e "
Q u a l ity o f C o d e R e le a s e 2 4 x 7 M o n th ly Y 1 0 % 1 9 .6 % P a s s 8 .5 % 0 .9 9 0 0 .0 8 4
C o m p lia n c e to P ro c e d u re s N /A M o n th ly Y 9 0 % 9 8 % P a s s 5 .5 % 0 .9 9 0 0 .0 5 4
1 4 % 1 .9 8 0 0 .1 3 8 6
F u tu r e V a lu e " In v e s t in th e fu tu r e to d a y "
T ra in in g H o u rs N /A M o n th ly Y 9 0 % 9 2 % P a s s 1 .8 % 0 .8 2 0 0 .0 1 5
In n o v a t iv e P ro p o s a ls N /A M o n th ly Y 8 0 % 8 3 % P a s s 1 .8 % 0 .8 1 0 0 0 .0 1 5
K e y E m p lo y e e S u c c e s s io n N /A M o n th ly Y 9 5 % 9 6 % P a s s 2 .7 % 0 .8 0 5 0 0 .0 2 2
6 .3 % 2 .4 4 0 .0 5 1 1
C u s to m e r S a t is f a c t io n " E a r n in g y o u r t r u s t "
P o s t Im p le m e n ta t io n S u rv e y N /A M o n th ly ( ro l l in g 6 ) Y 3 .0 3 .9 P a s s 1 8 .8 0 % 0 .8 9 4 0 .1 6 8
IT S u rv e y N /A Q u a r te r ly Y 3 .0 3 .8 P a s s 1 2 .5 0 % 0 .9 0 0 0 .1 1 3
3 1 % 1 .7 9 0 .2 8 0 5
P r o d u c t iv i t y " W o r k s m a r te r , n o t h a r d e r "
P o r t fo l io E f f ic ie n c y N /A Q u a r te r ly Y 3 .7 5 % 0 .3 7 % F a i l 5 .5 0 % 0 .1 0 0 0 .0 0 6
S k i l l M ix In d e x N /A Q u a r te r ly Y 3 .0 3 .0 P a s s 1 .4 0 % 0 .8 0 0 0 .0 1 1
R e d u c t io n in S m a l l J o b s N /A M o n th ly Y 5 % 2 5 % P a s s 3 .0 % 1 .0 0 .0 3 0
1 0 % 1 .9 0 0 0 .0 4 6 7
O v e r a l l S c o r in g v s G r a d e C o n v e r s io n S c a le O v e r a l l S c o r e
A = > .9 | B = > .8 0 & < .9 0 | C = > .7 0 & < .8 | D = > .6 & .7 | F < .6 O v e r a l l G r a d e
C a te g o r y S c o r e
C a te g o r y S c o r e
C a te g o r y S c o r e
C a te g o r y S c o r e
C a te g o r y S c o r e
0.898B
Overall ScoreOverall Grade

CSC Proprietary 9/7/2006 7:46:00 AM 0736kg 12
Examples

CSC Balanced Scorecard ProcessSM
© 2002 CSC. All Rights Reserved. CSC Proprietary 9/7/2006 7:46:00 AM 0736kg 13
Transform and Manage Business Relationships
Behaviors changed and aligned to business objectivesA
F
Troubled relationship: started at an “F” and 12 months later scored an “A”
Turned-around from being competitive to sole source
$$ Removed penalty
Building alignment within a fractured customer community

CSC Balanced Scorecard ProcessSM
© 2002 CSC. All Rights Reserved. CSC Proprietary 9/7/2006 7:46:00 AM 0736kg 14
How the process works - Applications
• Business Goal– Increase production system availability
• What is the expected behavior?– Generate quality production systems and perfect legacy
systems– Critical operational problems are quickly resolved– Satisfied customers
• Metrics to drive required behavior– % reduction in the number of defect problem tickets
reported for code released into production compared to the baseline (Quality)
– % application problem tickets resolved within the service target (Commitments)
– IT satisfaction survey (Customer Satisfaction)

CSC Balanced Scorecard ProcessSM
© 2002 CSC. All Rights Reserved. CSC Proprietary 9/7/2006 7:46:00 AM 0736kg 15
How the process works - Infrastructure• Business Goal
– Improve e-Mail system customer acceptance
• What is the expected behavior?– Maintain and improve server uptime (outside scheduled
maintenance windows)– Critical operational problems are quickly resolved– Root cause analysis to eliminate problem source
• Metrics to drive required behavior– % of e-Mail server availability (Productivity)– Reduction in the number of repeated problems (Quality)– % of e-Mail problem tickets resolved within the service
target (Commitments)

CSC Balanced Scorecard ProcessSM
© 2002 CSC. All Rights Reserved. CSC Proprietary 9/7/2006 7:46:00 AM 0736kg 16
How the process works – Business Process
• Business Goal – Real-time accounts receivable information
• What is the expected behavior?– Receipts are processed quickly and accurately
• Metrics to drive required behavior– Duration from check receipt to ledger posting (Productivity)– % checks processed with no errors (Quality)

CSC Proprietary 9/7/2006 7:46:00 AM 0736kg 17
Tools

CSC Balanced Scorecard ProcessSM
© 2002 CSC. All Rights Reserved. CSC Proprietary 9/7/2006 7:46:00 AM 0736kg 18
Decision Matrix

CSC Balanced Scorecard ProcessSM
© 2002 CSC. All Rights Reserved. CSC Proprietary 9/7/2006 7:46:00 AM 0736kg 19
Decision Matrix (cont)

CSC Balanced Scorecard ProcessSM
© 2002 CSC. All Rights Reserved. CSC Proprietary 9/7/2006 7:46:00 AM 0736kg 20
Specification Sheet

CSC Balanced Scorecard ProcessSM
© 2002 CSC. All Rights Reserved. CSC Proprietary 9/7/2006 7:46:00 AM 0736kg 21
Integration of a variety of disciplines and tools
CSC Balanced Scorecard Vital Signs Report SM
0.894B
Performance MetricServiceLevel
ReportingFrequency Target Actual
Pass/Fail
WeightingFactor
ScaledScore
WeightedScore (0-1)
AdjustedWeighting
FactorAdjusted
Score
Development & Enhancement - Measures of Discretionary Work
On Time Delivery - Projects > 200 hours N/A Monthly (rolling 6) Y 80% 100% Pass 14.50% 1.000 0.145 15.26% 0.153
On Budget Delivery - Projects > 200 hours Monthly Monthly (rolling 6) Y 80% 100% Pass 14.50% 1.000 0.145 15.26% 0.153
Development & Enhancement Productivity - Projects > 200 hours Monthly Monthly N TBD N/A N/A 5.0% N/A N/A N/A N/A
34% 2.000 0.2900 30.53% 0.3053
Maintenance - Measures of Non-Discretionary Work
Severity 1 Problem Resolution Time 4 hours Monthly Y 90.00% 100.00% Pass 10.00% 1.000 0.100 10.53% 0.1053
Severity 2 Problem Resolution Time 8 hours Monthly Y 80.00% 0.00% Pass 10.00% 1.000 0.100 10.53% 0.1053
Application Availability N/A Monthly Y 98.00% 99.75% Pass 12.50% 0.968 0.121 13.16% 0.1274
Quality of Production Code Monthly Monthly Y TBD 23.5 Pass 7.00% 1.000 0.070 7.37% 0.0737
40% 3.9682 0.3910 41.58% 0.4116
Client Satisfaction - Measures of End Customer Satisfaction
Client Satisfaction - APAR N/A Quarterly Y 3 2 Fail 1.00% 0.375 0.0038 1.05% 0.0039
Project Customer Satisfaction Monthly Monthly (rolling 6) Y 3.0 3.0 Pass 3.00% 0.750 0.0225 3.16% 0.0237
Task Customer Satisfaction N/A Monthly Y 3.0 3.8 Pass 5.00% 0.845 0.0422 5.26% 0.0445
9% 1.970 0.0685 9.47% 0.0721
Bringing Future Value - Measures of Investments in Employees
SEI CMM Assesment Level 2 N/A Monthly Y 1.00 1.04 Pass 6.25% 0.800 0.0500 6.58% 0.0526
SEI CMM Assesment Level 3 N/A Monthly Y 1.00 1.04 Pass 6.25% 0.800 0.0500 6.58% 0.0526
13% 1.600 0.1000 13.16% 0.1053
Category Score
Category Score
Category Score
Category Score
Overall Score
Overall Grade
Overall Scoring vs Grade Conversion Scale
A => .9 | B => .80 & < .90 | C => .70 & < .8 | D => .6 & .7 | F < .6
Kaplan & Norton
Balanced Scorecard
Categories
Goal Question
Metric
Saaty Analytic Hierarchy Process & Expert Choice
IMA Accelerating Change
Piecewise LinearModeling
SEI Definition Template
Metrics Program
Statistical Process Control
TargetMetric WeightingFactor
Score

CSC Balanced Scorecard ProcessSM
© 2002 CSC. All Rights Reserved. CSC Proprietary 9/7/2006 7:46:00 AM 0736kg 22
Vital Signs Tab

CSC Balanced Scorecard ProcessSM
© 2002 CSC. All Rights Reserved. CSC Proprietary 9/7/2006 7:46:00 AM 0736kg 23
Performance Targets and Scoring
Performance TargetsStatistical Process Control (SPC)
0
20
40
60
80
100
120
140
Feb-01
Mar-01
Apr-01
May-01
Jun-01
Jul-01 Aug-01
Sep-01
Oct-01
Nov-01
Dec-01
Jan-02
Reporting Month
Cal
enda
r Day
s
0.5 0.6 0.7 0.8 0.9 1.0
Piecewise Linear Theorem
60708090
100110120
HighLow Pass
Scoring

CSC Balanced Scorecard ProcessSM
© 2002 CSC. All Rights Reserved. CSC Proprietary 9/7/2006 7:46:00 AM 0736kg 24
References
• Edward Tufte– http://www.edwardtufte.com/tufte/
• Expert Choice– http://www.expertchoice.com/
• Implementation Management Associates (IMA)– http://www.imaworldwide.com/home.asp
• Dr. Donald J. Wheeler (Statistical Process Control)– http://www.spcpress.com/
• Software Engineering Institute– http://www.sei.cmu.edu/sei-home.html/
• Survey Monkey– http://www.surveymonkey.com/

CSC Balanced Scorecard ProcessSM
© 2002 CSC. All Rights Reserved. CSC Proprietary 9/7/2006 7:46:00 AM 0736kg 25
Summary
• Captures the executives’ fundamental expectations• Reflects a set of meaningful metrics• Changes organizational behavior by focusing on desired
outcomes• Communicates actual performance and highlights
improvement areas• Focuses and balances effort on what’s important
Winner 2002 CSC Technical Excellence Award see “Measuring Value in Client-Vendor Relationships” CSC World Spring/Summer 2002 for additional information

CSC Balanced Scorecard ProcessSM
© 2002 CSC. All Rights Reserved. CSC Proprietary 9/7/2006 7:46:00 AM 0736kg 26
Questions?

CSC Proprietary 9/7/2006 7:46:00 AM 0736kg 27
Experience. Results.