Embed Size (px)
Citation preview
1
www.orataiao.org.nz 17 April 2015 Wellington City Council Submission on WCC’s Draft Long Term Plan 2015-2025 Primary contact point for correspondence and feedback: Liz Springford phone 04 9709 126 or 021 0617 638, email: [email protected] OraTaiao: The New Zealand Climate and Health Council includes more than 300 senior doctors and other health professionals across New Zealand advocating climate action for important health and equity gains now – and over the decades ahead. Thank you for this opportunity for OraTaiao to make a written submission on the Council’s Draft Long Term Plan. We would also like to make an oral presentation to the Council. Yours sincerely, Liz Springford, BA, MPP(merit), Policy Analyst, Wellington Executive Board Member, OraTaiao: The New Zealand Climate and Health Council Dr R Scott Metcalfe, MB ChB, DComH, FNZCPHM, Public Health Medicine Specialist/Chief Advisor, Wellington; Executive Board Member, OraTaiao: The New Zealand Climate and Health Council
Mr Russell Tregonning, MB ChB, FRACS, FNZOA, Orthopaedic Surgeon/Senior Lecturer School of Medicine, Wellington; Executive Board Member, OraTaiao: The New Zealand Climate and Health Council
for OraTaiao: The New Zealand Climate and Health Climate Council www.orataiao.org.nz
2
1. Changing climate context Do you support the broad approach taken in this plan of investing for growth, in addition to providing
current levels of service? Oppose
Do you support our plan to limit rates increases to 3.9% on average over ten years to fund investment
for growth, as opposed to a 3.1% increase to provide ‘business as usual’? Oppose
OraTaiao welcomes the Council’s energy and concern for Wellington’s future, and effort to create conversations, involving as many Wellingtonians as possible in this planning process. OraTaiao strongly supports the Council in planning for a positive future for Wellingtonians – a city that’s good to raise a family, where everyone feels welcome and can be part of a community, where it’s easy to do business and find good staff, where households can be supported by decent stable jobs that pay at least a living wage, where learning is rewarding and valued, keeping healthy and active is easy, where everyone can have fun and relax, enjoying the arts and the outdoors, and maybe even our wind – these are aspirations to share as a city. The challenge is choosing the right projects to fund at the right level to get there.
Climate wellbeing OraTaiao strongly opposes funding or supporting in any way those projects that will increase our climate-damaging greenhouse gas emissions. We strongly believe the Council’s priority must be creating the infrastructure to support the just transition to a low emissions economy, with particular attention to the most vulnerable households in Wellington. We consider better understanding the implications of climate changes – not just sea level rises and extreme weather events – for our Wellington economy and communities as critical. This will help determine how much financial risk to take with financing new projects over this decade and beyond. At the moment, the Long Term Plan projects seem to be considered within a business-as-usual approach, including rating capacity. We suggest taking a broader approach to Wellington’s future growth, not just relying on gross domestic product (GDP) changes that are simply a measure of money flows, not whether the profits are flowing offshore, nor whether stable living wage jobs are created. GDP was never intended as a measure of city health, wealth or wellbeing, and other measures such as the Genuine Progress Indicator (GPI) have evolved instead. Obviously, climate emissions are another complementary measure in plans to future-proof Wellington.
Why Wellington? From a climate perspective, taking the pressure off Auckland as NZ’s most popular place to move to, set up business, and find a job, could help reduce urban sprawl and transport pressures. ‘Why Wellington?’ is a question worth exploring – what could encourage moving to Wellington as a positive alternative to Auckland for overseas arrivals, businesses and other NZers? Wellington already has a story worth telling of a welcoming compact city where it’s easy to get around and enjoy a diverse range of cultural activities. How can we make our city even more attractive – and ensure that with a growing population, we contain the city, concentrating living close to the centre with people-friendly space to move easily around? How do we encourage movement from Auckland without inheriting Auckland’s housing and transport problems? How do we reduce the need for air travel and the consequent wasted hours and high emissions? Could Wellington become a centre of international excellence for teleconference connectivity? Is Wellington an easy city to quickly settle into, welcoming diversity? What connections do we need to make with businesses and potential migrants to tell our story? Can we play our part in welcoming climate refugees?
3
Climate changes integral to planning Although the airport runway and cycleway projects drew the greatest online feedback, we believe the top priority for the Council’s Long Term Plan is the project to better understand the implications of our changing global climate. This is urgent – and integral to decisions about the runway extension, cycleways, Council borrowing, rating capacity, and other infrastructure projects and priorities. Climate change impacts on Wellington are likely to be much more than the physical changes of rising seas and more extreme weather events. We agree with Mayor Wade-Brown’s statements back on 16 May 2013: “Cities rather than countries are taking the lead on climate change issues,” and “We need to take a climate change lens to all of Council’s activities and programmes.”i
Climate change impacts more than extreme weather events Climate changes are increasingly affecting the global economy and society. Climate changes have much wider implications than local extreme weather events – although we already know these can be costly. Much bigger economic and societal impacts on the Wellington region are likely to result from the economic fall-out and heightened conflicts arising from a world struggling with extreme weather events, crop failures, water shortages, changes in disease patterns and resource shortages.
NZ exposed to global economic and security impacts New Zealand is vulnerable to climate changes both here and amongst our trading partners – we are a small open economy heavily dependent on stable environmental and climate conditions and thriving economies able to buy our products. As the home of NZ’s capital city with much of the public service employed here, what happens to NZ’s economy affects our region’s economy and residents. Looking just at the cost of extreme weather events here misses the interconnectedness and wider implications of our changing climate. That is why better understanding the implications of climate changes for this city, NZ and globally, and how these impacts could interact is critical to making decisions about increasing debt levels and ratepayer liabilities.
Health gains in short and longer term Climate change has profound adverse effects on human health, which is widely recognised by a
number of renowned authorities in health1,2,3. The Lancet, one of world’s leading medical journals, calls climate change ‘the biggest threat to global health in the 21st century’4,5 – climate change certainly threatens our economic and societal wellbeing. Conversely, well-designed climate action means better health and wellbeing in the short and longer term, from helping keep us keep active to warming our homes, and significantly reducing taxpayer-funded health care costs.6,7
Cheaper to mitigate now Internationally recognised economists Lord Nicholas Stern8 and Ross Garnaut9 have already established that the cheaper option is to mitigate, adaptation is more expensive and ultimately impossible – there are physical, physiological, societal and economic limits to adaptation. We don’t have a choice, we must rapidly reduce emissions as our best chance of securing our region’s future.
Invest in low emissions infrastructure The Council decides significant investment in long-lived infrastructure that potentially locks the city into GHG-intensive pathways which will be costly in the long-term (for example transport infrastructure, public buildings and land use choices). This also makes early action with a long-term view a highly cost-effective option. The World Bank notes: ‘Decisions taken today lock in the futures
i http://wellington.govt.nz/your-council/news/2013/05/wellington-city-energises-smart-climate-action
4
of many cities. The infrastructure of 2050 is being built today, yet the world of 2050 will be very
different from today.’10
Mitigate fast so that we can still adapt The longer we delay emission reductions the harder it will be to adapt – and less likely that we can reduce emissions in time to prevent severe economic and societal impacts. The bottom line is how to implement major emissions reductions soon enough so that it is still possible (albeit challenging and expensive) to adapt to climate changes. There is a 20-30 year time lag from emissions we release into the atmosphereii,11 – this means the impact of this year’s emissions will be experienced by most Wellington residents alive today. In other words, most of us have a direct stake in rapidly reducing emissions.
Future-proof businesses and households The Long Term Plan must ensure that Wellington plays a fair part in rapidly reducing global emissions. This also means Wellington will future-proof businesses and households as a smart, innovative low-emissions economy, and with careful policy design, enable important health co-benefits for everyone. A realistic approach to climate changes in this Long Term Plan is essential, including a prudent approach to increasing ratepayer financial liabilities.
Triple mitigation action We believe the Council’s mitigation action must be three-pronged:
(i) rapidly reducing the Council’s own emissions footprint (and using this experience to work with businesses and other organisations);
(ii) helping create regional infrastructure to support low-emissions living; and (iii) actively and vocally opposing all infrastructure, initiatives and investments that will lock
in high emissions living and risk escalating emissions regionally, nationally and globally.
Emission reductions globally The internationally agreed limit is 2’C average global warming. The Intergovernmental Panel on
Climate Change (IPCC)’s Fifth Assessment Report released in September 201312,13
presented a global carbon budget of less than half a trillion tonnes till 2050 for a two-thirds chance of staying within the 2’C limit. Public safety planning usually involves better odds than two-third. Small island states (including our Pacific relatives and neighbours) threatened with eviction by rising sea levels are calling for a limit of 1.5’C average warming. This suggests the preferred global budget is much much lower than a half trillion tonnes. This also reminds us that what matters is the total quantity of emissions. So the faster we reduce emissions, the better. The global atmosphere has real physical limits for a safe and adaptable climate.
A global justice approach to NZ emissions reductions One approach to global fairness is the Greenhouse Development Rights framework14,15,16,17, which aligns with the latest IPCC Fifth Assessment Report18 and is based on the principle of justice that NZ’s (and indeed Wellington’s) climate action should not increase world poverty. The GDR results assume that around half NZ’s emissions reductions will happen domestically, and half will be offshore
ii Perhaps 60% of global warming from emissions occurs within 25 to 50 years (Hansen et al. Science. 2005). Within their
lifetimes, people currently aged in their early 30s and younger – some 45% of New Zealanders – may therefore experience around 2/3
rds of adverse climate effects from this year’s excess emissions.
5
reductions funded by NZ. International aviation and shipping emissions are excluded from the calculator. The GDR Climate Equity Reference calculator (http://climateequityreference.org/calculator/) gives various options to calculate ‘fair share’ including extent of historic emissions (past culpability) and per capita levels of income (current capability). Choosing a mid-range option, plus conservatively limiting historic ‘polluter-pays’ responsibility to 1990 onwards, and choosing a strong 2’C pathway (good odds – i.e. better than two-thirds – that we limit global warming to 2’C and undefined odds of limiting warming to 1.5’C), the GDR gives NZ a target of 34Mt CO2-equivalents for 2020. This appears to equate to a 58% reduction on NZ’s 2013 gross emissions by 2020iii – with half the emissions reductions within NZ and half offshore funded by NZ, so NZ needs to plan for a 29% reduction in gross emissions within NZ by 2020.
What’s Wellington’s share of emissions reductions? Wellington has shown leadership by developing a Climate Change Plan back in 2010, and updating the Plan in 2013. But there are two key limitations with the base data:
(i) International aviation & shipping emissions are left out – which for the Wellington region is like Waikato not measuring its dairy emissions. This makes it hard to conclude that although as of 2010 the city’s emissions had roughly stabilised at 2001 levels (despite GDP and population growth of 29% and 20% respectively), that Wellington is on the path to a lower-emissions economy yetiv. Given the high emissions impact of international travel and the rise in cruise ships and overseas flights, our Wellington emissions may be increasing substantially, but we just don’t know.
International travel emissions were left out of the original Kyoto international treatyv, but because of international aviation and shipping’s disproportionately high emissions and role in our Wellington economy, these need to be estimated and included, even if this is simply halving the arrival and departures statistics to share emissions allocation between Wellington and the overseas destination/departure location. Wellington airport should be able to easily provide this data for the Council.
(ii) The other limitation is that emissions are measured from 2000/01, not 1990. We
understand that data was not easily available for the 1990s. But this later baseline makes it difficult to quickly compare the Council’s city targets of 30% reductions by 2020 and 80% reductions from 2000/01 levels with targets that use 1990 baselines (eg GDR’s NZ ‘fair shares’ calculations of 2014’s mid-range 44%vi reduction on 1990 emission levels by 2020vii (49% using the latest NZ 1990 emissions figure of 66.7Mt from NZ’s 2013 Greenhouse Gas Inventory) or 2009’s 40% emissions reduction on 1990 levels by 202016,19 – or indeed NZ’s current unconditional commitment to 5% emissions reductions from 1990 levels by 2020viii).
iii NZ actual gross GHG-e 2013 = 81.0Mt CO2e (NZ Greenhouse Gas Inventory 1990-2013
http://www.mfe.govt.nz/sites/default/files/media/Climate%20Change/ghg-inventory-1990-2013.pdf), GDR 2020 allocation = 34Mt; required reduction 2020 allocation vs 2013 actual = (81.0-34)/81.0 = -47 ÷ 81 = -58% iv
http://wellington.govt.nz/your-council/news/2013/05/wellington-city-energises-smart-climate-action v Likewise, international transport emissions do not appear to be included in GDR ‘fair shares’ framework, but globally for
the small proportion of the world’s population who can afford to fly, the emissions impact is big. vi
49% at NZ’s latest revised 1990 66.7Mt from NZ’s 2013 Greenhouse Gas Inventory released 10 April 2015 vii
http://climateequityreference.org/calculator/ viii
On the latest NZ Greenhouse Gas Inventory figures released on 10 April 2015 for 2013, NZ 5% conditional reduction commitment on 1990 levels now equates to reducing 2013 gross emissions by 28.5% by 2020. Because of our projected
6
As a rough back-of-envelope calculation, if we assume Wellington’s emissions increased at a similar rate as NZ’s from 1990 to 2000/01 (we estimate 19.2%ix), this gives a base rate of emissions of 1.10Mt in 1990 for Wellington city.x Assuming Wellington reduces emissions at the same rate as NZ (although there are potentially good arguments for Wellington doing more), this means the GDR fair shares approach is a reduction of 22% (0.24Mt) within Wellington on its assumed 1990 levels, to reach 865,800 tonnes by 2020 (0.87Mt)xi – the other 22% (0.24Mt) half of the above 44% GDR ‘fair share’ reduction being offshore funded by NZ. This equates to 34% reduction within Wellington on its 2000/01 levelsxii – compared with the Council’s current city target of 30% reductions by 2020xiii, with ‘fair shares’ requiring further 34% of emissions reductions funded offshore, at an unknown cost per tonne, probably by central government. These calculations however do not count Wellington’s sizeable emissions from international shipping and especially international aviation which are projected to grow considerably.
Internationally, local government has a critical role in ensuring a successful, equitable and timely transition to a low emissions future and adaptable climate changes. We believe studying international innovations is essential for developing Wellington’s future policies and actions –especially studying those cities making serious emissions reductions and/or moving quickly to emissions neutrality. This is an ongoing project well-worth ratepayer funding, and fits with Wellington’s involvement in the UN 100 Resilient Cities project (http://www.100resilientcities.org). To some extent, whether the Council chooses to increase our current emissions target for 2020 to a fairer share or not, is probably irrelevant over the ten year life of the Long Term Plan, as in either case, the policy action will be the same. Rapid reduction of gross emissions is needed – and prudence in considering any projects that increase rates without contributing to future-proofing Wellington as a low emissions economy or strengthening vulnerable households. Projects that increase emissions are obviously off the table.
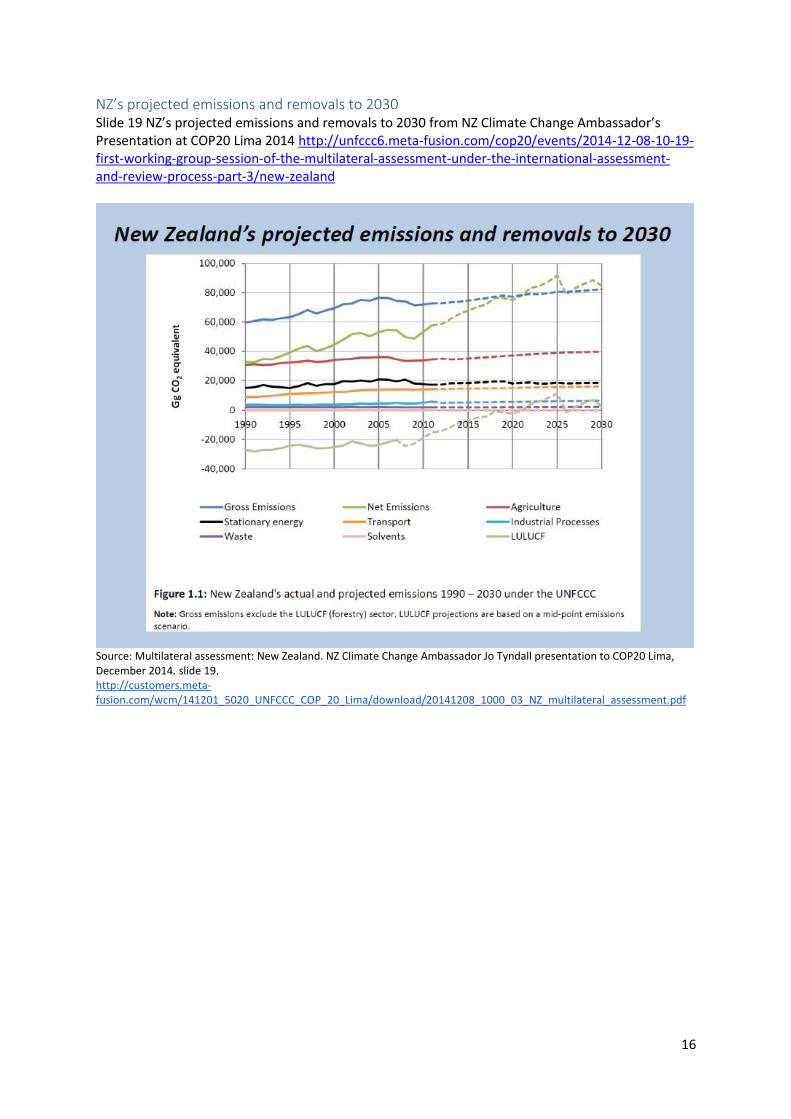
forest harvesting, net emissions become increasingly irrelevant to the point where around 2020, net emissions equal gross emissions, then net emissions exceed gross emissions through to 2025 or so (from graph presented at COP21 Lima late 2014 by NZ Climate Change Ambassador Jo Tyndall – refer Appendix 1) ix New Zealand's Greenhouse Gas Inventory 1990-2012 (http://www.mfe.govt.nz/publications/climate-change/new-
zealands-greenhouse-gas-inventory-1990%E2%80%932012) 60.6Mt total GHGe in 1990, 70.9 in 2000, 73.6 in 2001, change 2000/01 vs 1990 = mean(70.9,73.6)-60.6 = +11.6Mt, % change +11.6÷60.6 = +19.2% x Wellington city GHGe 1.3107Mt CO2-equivalents in 2000/01 (URS New Zealand Ltd. Greenhouse Gas Inventory for the
Wellington Region, 2014. http://wellington.govt.nz/~/media/services/environment-and-waste/environment/files/greenhouse-gas-inventory-web.pdf); NZ 1990 GHGe 83.9% of 2000/01 (60.6 ÷ mean(70.9,73.6)); estimated Wellington city 1990 GHGe = 1.3107 × 83.9% = 1.100Mt. xi Wellington city est. 1.1Mt CO2-e GHGe in 1990, GDR ‘fair shares’ -44% for NZ by 2020 compared with 1990 baseline
(http://climateequityreference.org/calculator) with half funded offshore and half within NZ (ie -22%), 1.1Mt × (1-22%) = 0.87Mt within Wellington emissions target at 2020. xii
Wellington city 1.31Mt CO2-e GHGe in 2000/01, GDR ‘fair shares’ 0.87Mt emissions within Wellington at 2020, emissions reduction within Wellington by 2020 vs 2000/01 = 0.87Mt – 1.31Mt = -0.445Mt, % reduction = -0.445/1.31 = -34%. xiii
For interest, using the assumed Wellington 1990 baseline of 1.1Mt, 80% reductions on 1990 levels by 2050 become 222,000 tonnes by 2050 – which is 83% on 2000/01 levels by 2050 rather than the Council’s current city target of 80% reductions from 2000/01 levels by 2050.
7
2. Airport runway extension (3) Should Council take action to improve our international air connections? Strongly oppose
OraTaiao strongly opposes the Council helping the airport finance a runway extension. Although we note the Council’s Climate Action Plan 2013 outlines intentions by the international aviation industry to reduce aviation emissions over the coming decades, the bottom line is that right now each overseas flight adds enormously to the overall emissions footprint of each passenger. And increasing overseas and domestic flights is the only way the airport is going to be able to repay its share of runway expansion costs – at the cost of much more greenhouse gas emissions. Aviation causes perhaps near 4%-5% of global warming (through both CO2, non-CO2 greenhouse gas emissions, and altitude effects) and aviation GHG emissions will likely double or even quadruple by 2050.xiv,20 And it is but a minority of people in the world who can afford to fly.
Comparing emissions numbers To put this in perspective, we calculate from the region’s Greenhouse Gas Inventory’s Appendix B that 19% of Wellington City’s emissions come from domestic aviation (0.244521 Mt ÷ 1.301739 Mt = 0.18784 for 2012/13). The Climate Action Plan likewise states 18% (for 2009/10). The region’s Greenhouse Gas Inventory reports Wellington City’s per capita emissions were 6.6 tonnes in 2012/13 (5.8 tonnes in 2009/10, according to the 2013 Climate Action Plan). So for the average Wellingtonian, 1.23 tonnes of their emissions came from domestic flights in 2012/13 (19% × 6.6t). The Greenhouse Gas Inventory does not include international aviation or shipping – the same as if Waikato was to exclude dairy from its emissions calculations.
Planning for rapid emissions reductions for Wellington - or expansion? The goal of Wellington’s Climate Action Plan 2013 is to reduce city emissions by 30% on 2000/2001 levels by 2020, and 80% of 2000/2001 levels by 2050. But at the same time, the Council is proposing to help fund a runway extension that will mean a much greater volume of international and domestic aviation emissions to pay for it – the airport expects passenger numbers to double from 5 million to 10 million per year. This is aside from the considerable carbon costs of runway extension work needed for the larger planes wanted. Although Air NZ has made efforts to reduce emissions and direct flights are more fuel efficient, the bottom line is that each return flight to Hong Kong is 4.0 tonnes per person and Singapore 3.6 tonnesxv – compared with the average Wellingtonian’s annual emissions of 5.8 tonnes in 2009/10 which the Climate Change Plan targets to radically reduce by 2020 through to 2050. Yet the emissions impacts of return flights to Singapore and Hong Kong are 12-22 times more than our domestic flights at 0.29 tonnes return to Auckland per person or 0.18 tonnes to Christchurch return. The numbers matter.
xiv
International shipping contributes 2% of global greenhouse gas emissions, while according to analysis for the UN International Civil Aviation Organization (ICAO), aviation currently contributes around 2.0-2.5% of current total annual global CO2 emissions, but says “discussions over such proportions are of limited value. What is important is the total of emissions over time.” They project, in the absence of policy intervention, aviation CO2 emissions alone increasing 2 to 4.5 times by 2050 (“aviation emissions of CO2 are projected to increase over 2005 levels of 0,2 Gt C yr-1 by 1.9 to 4.5 fold (0.37 to 0.89 Gt C yr-1 ) by 2050”). In addition, with high-altitude flights near or in the stratosphere means non-CO2 altitude-sensitive effects may increase the total impact on human-made climate change significantly, perhaps close to a 4-5% cumulative effect (ie near 4-5% of radiative forcing). The IPCC has estimated that aviation’s total climate impact is some 2-4 times that of its direct CO2 emissions alone (excluding the potential impact of cirrus cloud enhancement). UK government policy statements have stressed the need for aviation to address its total climate change impacts and not simply the impact of CO2. See ICAO 2010, IPCC 1999, Environmental Change Institute Oxford University 2005, Owen et al 2010, HMSO 2003. xv
Return flights to Beijing or Los Angeles are 4.5 tonnes per person, Heathrow 7.9 tonnes. source of return flight CO2 emissions per passenger calculations: http://www.carbonzero.co.nz/EmissionsCalc/tourismeditor.aspx.

8
False economy to create jobs by climate damage Subsidising high emissions industries (and in the case of airlines, an extremely high emissions industry) in the name of jobs is giving with one hand and taking with the other. Climate changes are bad for our environment-based NZ economy and bad for the global economy (which also means bad for our NZ economy) – and that means bad for jobs, especially in Wellington with public service jobs financed by NZ taxpayers. Climate changes are also worse for those who are already vulnerable – and surely those are the high priority households we want to create decent living wage jobs for? Subsidising industries for jobs is only justifiable for industries that are low or zero emissions – and even then, carefully scrutinised as a sound investment.
Doubtful investment even for climate deniers Even for ratepayers who are convinced that climate change is not happening and is just a very strange and complicated UN conspiracy, the numbers still don’t seem to stack up on this investment. Why isn’t a commercial bank lending money if it’s such a good financial investment? The runway extension does not have the support of central Government (despite funding other emissions-intensive projects like RONS and off-shore oil exploration).
Airport already at financial edge? The airport already seems to be pushing the boundaries on how much it can charge for services, and was recently forced to reduce charges (albeit to upper limit of charging) after a Commerce Commission case relating excessive profits. As well as increasing emissions from a much greater tonnage of flights needed to pay for the runway, this may well increase the numbers of Wellingtonians flying overseas and spending their discretionary income offshore, blunting the impact of any increased tourism on admittedly low-wage jobs.
It’s not just about size Air NZ has recently pulled long-haul flights from Christchurch, and there are factors governing airline decisions other than length of runway or Wellington’s difficult wind (where extensions will not mitigate hazardous turbulence over Newlandsxvi). Ultimately there will be increasing pressure to rapidly reduce international aviation emissions. It’s not that long ago since the British government attempted to tax long-haul flights out of the UK to discourage these flights and reduce emissions. The Council needs to think very seriously about the climate impact, financial liability and physical viability of this proposed runway extension over the decades to come. Globally, we expect to be living in a world by 2050 where annual climate-damaging emissions are close to zero – as does the Council with a Climate Action plan to reduce emissions by 80% by 2050. Building a runway extension, before renewably-powered planes are here, totally undermines the Council’s good climate work.
Prime seaside location – for climate changes and rising seas There are also serious questions about the viability of building any extension out into the tumultuous Cook Strait – we’ve already seen in the last few years and days, the damage from stormy seas to seawalls and car-parks. Given the lag time of 20-30 years from increasing emissions to climate impacts, these storms will get worse. Estimates of sea level rises are also rising with better modelling and delays in emissions reductions – flooding of the existing runway may be likely before this century ends.
xvi
https://www.niwa.co.nz/publications/wa/water-atmosphere-9-december-2013/fear-of-flying-into-wellington

9
3. Healthy transport, healthy city (14) Do you support proposed improvements to transport that will allow for safer, faster and more
reliable journeys? Strongly support active and public transport improvements, strongly oppose expansion of private vehicle transport
Zero emissions transport system? OraTaiao supports the rapid expansion of active and public transport networks so that more Wellingtonians are able to use their legs and/or share transport for more trips more often. We would like to see ambitious targets set for active and public transport use, together with a rapid move to renewably-powered public transport and provision of a fleet of car share cars in every suburb. We would like to challenge the Council to use this Long Term Plan to move towards a zero emissions transport system by around 2025.
Green light for cycleways ready to build What that means now is rapid progress towards a safe segregated cycle network across our city. Projects like Island Bay that are ready (or close) to be built should be given the green light. These are important demonstration models for Wellington of what safe segregated cycleways look like, how they work and how they encourage more cycling by a wider range of people. We need safe cycling for both commuters and community cyclists – especially school children. Bike tracks in schools is a great initiative to build confidence, but we also need safe cycling to and from school which increases children’s physical activity and independence without crowding the school curriculum.
Support and speed up the cycling revolution Safer traffic speeds can be introduced now for the CBD and other key routes where cycleways are needed because of high speeds or volume of traffic at peak periods. At the same time, speed up the funding and building of a cycleway network for all Wellington’s major routes. On-road cycling in quieter streets can also be made more attractive by careful design, as well as excellent initiatives such as the Lyall Bay Leonie Gill pathway. Perceptions of safety are essential to encouraging more and more Wellingtonians to get active, get healthy and feel great. There’s clearly a revolution building as more of our city takes to cycling – the Council has the chance to support and speed this up, by creating a much safer cycling environment for everyone.
An easy and attractive city to live and move around Looking forward to 2025, what will Wellington feel like? A modern city where people can enjoy walking easily around the CBD, it’s easy to get anywhere by bike, families and children enjoy being active, attractive reliable renewably-powered public transport serves most needs of most people most of the time, a car share car is within 5-10 minutes’ walk away, there is less private car ownership and use (so less congestion and streets and buildings clogged with infrequently-used parked cars), less physically mobile Wellingtonians are well-supported to move round more easily, and with sensible urban planning, distances between work, home and study are reducing.
Everyone wins from putting public and active transport first Or will Wellington become more car-dominated like Auckland, with more household time and finance caught up in commuting and car ownership? We have a stark choice in transport planning, which is hidden by the WCC LTP transport question. By basing transport planning around car use, everyone loses – as increasing road space for cars encourages more cars and more congestion over time, space for safe attractive cycling and walking is reduced, and public transport, which depends on numbers for viability and range, is undermined. Conversely, basing transport planning on an attractive, safe, comprehensive network of public and active transport reduces the numbers of moving and parked vehicles, so that travel by car becomes faster and easier for the journeys when a private car makes the most sense.
10
Three-way transport action The Council also has a three-way role in rapidly reducing land transport emissions:
(i) rapidly reducing the Council’s own emissions footprint (and using this experience to work with businesses and other organisations);
(ii) helping create regional infrastructure to support low-emissions living; and (iii) actively and vocally opposing all infrastructure, initiatives and investments that will lock
in high emissions living and risk escalating emissions regionally, nationally and globally. This includes actively and vocally opposing plans to expand roading from Ngauranga to Wellington Airport (including the Basin flyover) and calling for at least some of those funds to invest in renewably-powered public transport and attractive cycling and walking infrastructure. Otherwise, roading expansion simply increases car dependence and undermines the viability of the Council’s public transport initiatives.
Actively opposing unhealthy roading expansion The proportion of NZTA funding allocated to encouraging greater private vehicle use in Wellington far outshadows funding for public transport, walking and cycling. Yet concentrating on public and active transport is the best way to create less car dependence and more road space. Research shows high health returns on cycling infrastructure investment.xvii,21 Conversely, we are designing physical activity out of transport systems, creating very real health concerns where around half of adult New Zealanders do not get even a healthy minimum of 30 minutes of physical activity daily, with major costs.xviii,22
Reclaiming Wellington OraTaiao would like to see the Council work with Wellingtonians to reclaim Wellington transport and create a city that’s attractive, active and easy to move around, a city that’s more about community than cars. Rather than waiting on NZTA’s court battles and years of congestion-causing roadworks, let’s look at better solutions for eastern suburb people commuting into the city. Let’s trial cheaper fares for the eastern suburbs and see how much we can grow the demand for public transport. Could extra express buses be put on in peak times? What about smaller buses much earlier in the morning and late at night for shift workers? How about guided bike trips round the bays for new cyclists to gain confidence? Could parking charges be reduced in the CBD for drivers who are car-pooling with two or more passengers? Would a traffic light system work at the Wellington Road/Ruahine Street intersection to give drivers confidence and certainty in moving across during peak periods? Most importantly, how about surveying eastern suburb residents about their travel choices, what would make a difference, what are the incentives and barriers for active and public transport?
xvii
Comprehensive modelling published by OraTaiao members indicates that transforming New Zealand’s urban roads over the next 40 years, using best practice physical separation on main roads and bicycle-friendly speed reduction on local streets, would yield benefits 10-25 times greater than costs (Macmillan et al. 2014 http://ehp.niehs.nih.gov/1307250/). xviii
A study by the Wellington Regional Strategy Committee with Auckland and Waikato Councils examining the full costs of physical inactivity in their regions indicated that physical inactivity is costing New Zealand approximately $1.3 billion, or 0.7% of total GDP (2010), including $140 million in Wellington. The study concluded “Physical inactivity is as serious a risk factor as smoking or obesity in causing a range of chronic diseases like heart disease, cancer and diabetes. Physical inactivity is globally recognised as the fourth-leading cause of death and a global public health priority. Local government plays an important role in motivating and providing the infrastructure for people’s physical activity, including providing transport infrastructure, active transport opportunities such as cycling, walking, public transport, walking buses, urban design and land use planning.”
11
Demand renewably-powered public transport Shared transport should be electric transport, renewably powered with zero emissions to run. The timeframe for rapidly reducing emissions, over this decade and the next, means that it makes no sense to buy diesel-powered buses in 2017, even if these are hybrids. Wellington needs a transport system from now on that is renewably-powered and has the capacity to be the spine of our transport system, the main means of transport around most of Wellington. Dismantling the current renewably-powered trolley buses, before a renewably-powered alternative is purchased, is a move in the wrong direction. The Council must be vocal on behalf of Wellingtonians’ future transport security.
4. Encouraging industries (4) Do you think Council should be supporting the tech sector to stimulate it to grow?
Strongly support (5) Do you think Council should be supporting the film industry to enable it to stay local and grow?
Mostly Neutral OraTaiao supports the Council supporting low/zero emissions industries that are soundly managed, subject to the future rating capacity for finance. The technology sector appears to offer potential for ‘weightless’ job growth.
5. Smart, resilient and prudent city (12) Do you support Council’s activities to optimise infrastructure to realise savings and better cope
with adverse events? Support
(13) Do you support the Council’s transition to the use of smart technology such as parking sensors
and LED streetlights? Support OraTaiao supports smart use of infrastructure and developing greater resilience as a city to cope with adverse events. We also support the use of smart technology that will both reduce emissions and make the city work better for Wellingtonians – ie win-win solutions.
Transport resilience plans As an example, a potential resilience project could be setting up a rapid alternative transport plan for all the Council’s staff, so that when winter storms (or other events) temporarily take the region’s trains offline, networks of staff living in similar locations are already set up so all staff and Council vehicles can be fully packed with passengers to get to and from work over the disruption period. This transport resilience plan could include pre-arranged set-ups for some staff to work from home, to stagger hours of work into offpeak, for bikes to be shared effectively, and for some staff to buddy up for longer walks home. The project learning could be used to actively build emergency transport resilience plans with the major employers in Wellington, and share the approaches online with smaller employers. Wellingtonians are already strongly reliant on public transport which is great – and this would build resilience into our transport system at low cost, help our city run smoothly with less interruption, and avoid the hours of congestion that happen when the trains are offline.
12
6. Quake-proofing (6) Do you believe Council should support private owners with the strengthening of heritage
buildings? Neutral (7) Should Council strengthen its key Civic Square buildings, and offset the cost where possible?
Neutral
OraTaiao is neutral on these questions, except to note that approaches to climate change mitigation and adaptation should be broadly consistent with earthquake strengthening work with respect to levels of public safety and risk. It may be prudent to also consider the location of buildings to be quake-proofed relative to exposure to known and readily predictable sea level rises and/or extreme weather events. The extent of quake-proofing cost-sharing may set a precedent for future adaptation cost-sharing with residents and businesses likely to be affected by flooding, sea level rises and extreme weather events (and thus bearing the costs of property repair, repeated repair, and/or retreat, as well as increasing insurance costs).
7. Amenities for Wellingtonians and visitors (8) Should Wellington seek to remain the events capital of New Zealand? Mostly neutral (9) Do you support our plan to provide a new and improved venue for concerts? Mostly neutral (10) Do you support upgrading sports facilities where need has been demonstrated? Mostly neutral (11) Do you support the development of new tourism experiences to attract new visitors and get
them to stay for longer? Mostly neutral OraTaiao has a mostly neutral response to these questions. We strongly believe the Council’s priority must be creating the infrastructure to support the just transition to a low emissions economy, with particular attention for the most vulnerable households in Wellington. We do suggest caution around modelling demand from likely overseas tourism numbers, given the very high emissions impact of both international aviation and cruise ships, NZ’s location as a long-haul destination, and the urgency in reducing global emissions. Hospitality tends to be low wage work, and we need to concentrate on encouraging low-emissions industries that can pay Wellingtonians living wages and provide reliable hours.
8. Urban development (15) Do you support the Council funding and taking action to regenerate inner-city precincts?
Strongly support (16) Do you support our proposal to improve public spaces such as laneways? Strongly support
(17) Do you support Council’s plan for strengthening suburban town centres including work in
Johnsonville, Karori and Tawa? Support
(18) Do you generally agree with the priority projects identified in the Urban Growth Implementation Plan?
With a growing population and increasing need to reduce emissions, containing the city, concentrating living close to the centre, with attractive people-friendly spaces to move freely around and enjoy, is a priority.
13
Appendix One:
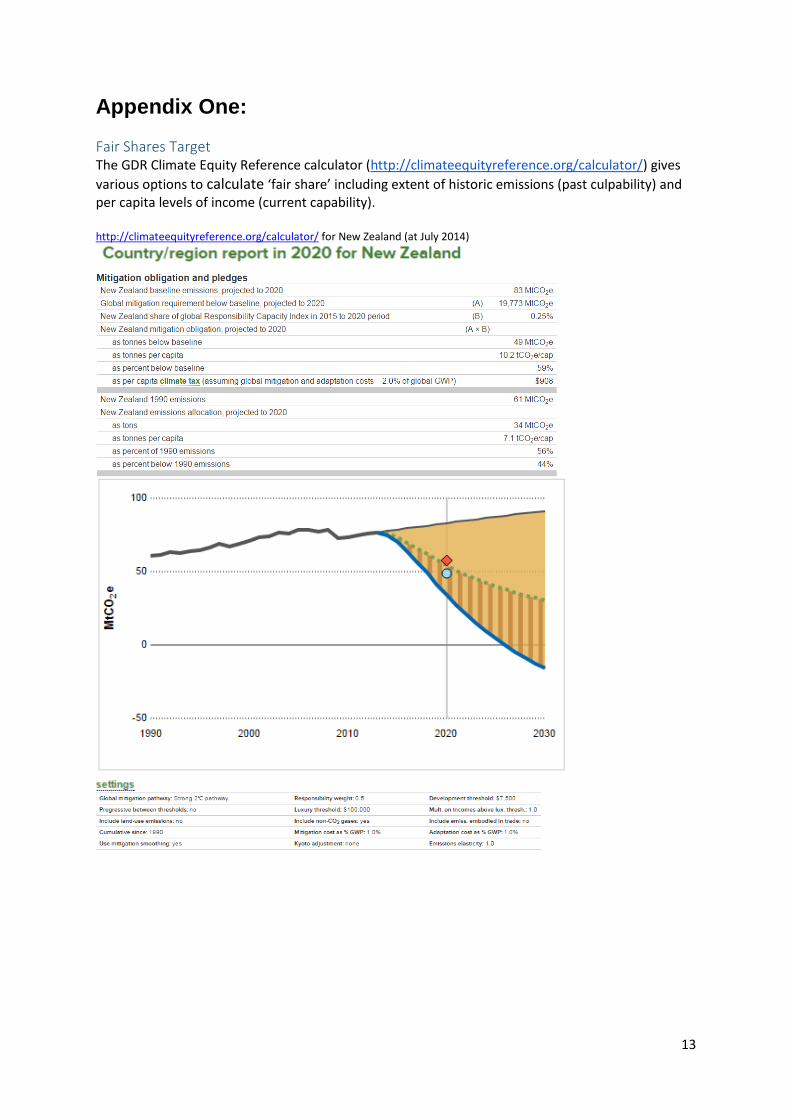
Fair Shares Target The GDR Climate Equity Reference calculator (http://climateequityreference.org/calculator/) gives
various options to calculate ‘fair share’ including extent of historic emissions (past culpability) and per capita levels of income (current capability). http://climateequityreference.org/calculator/ for New Zealand (at July 2014)
14
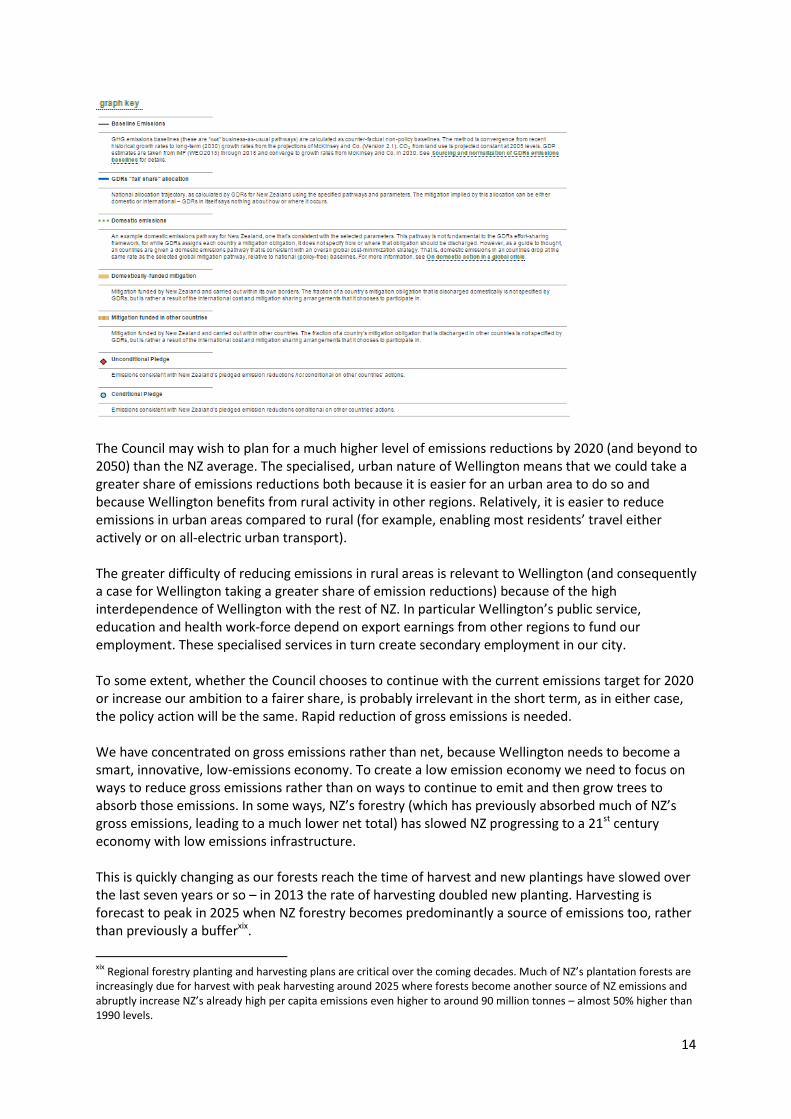
The Council may wish to plan for a much higher level of emissions reductions by 2020 (and beyond to 2050) than the NZ average. The specialised, urban nature of Wellington means that we could take a greater share of emissions reductions both because it is easier for an urban area to do so and because Wellington benefits from rural activity in other regions. Relatively, it is easier to reduce emissions in urban areas compared to rural (for example, enabling most residents’ travel either actively or on all-electric urban transport). The greater difficulty of reducing emissions in rural areas is relevant to Wellington (and consequently a case for Wellington taking a greater share of emission reductions) because of the high interdependence of Wellington with the rest of NZ. In particular Wellington’s public service, education and health work-force depend on export earnings from other regions to fund our employment. These specialised services in turn create secondary employment in our city. To some extent, whether the Council chooses to continue with the current emissions target for 2020 or increase our ambition to a fairer share, is probably irrelevant in the short term, as in either case, the policy action will be the same. Rapid reduction of gross emissions is needed. We have concentrated on gross emissions rather than net, because Wellington needs to become a smart, innovative, low-emissions economy. To create a low emission economy we need to focus on ways to reduce gross emissions rather than on ways to continue to emit and then grow trees to absorb those emissions. In some ways, NZ’s forestry (which has previously absorbed much of NZ’s gross emissions, leading to a much lower net total) has slowed NZ progressing to a 21st century economy with low emissions infrastructure. This is quickly changing as our forests reach the time of harvest and new plantings have slowed over the last seven years or so – in 2013 the rate of harvesting doubled new planting. Harvesting is forecast to peak in 2025 when NZ forestry becomes predominantly a source of emissions too, rather than previously a bufferxix.
xix
Regional forestry planting and harvesting plans are critical over the coming decades. Much of NZ’s plantation forests are increasingly due for harvest with peak harvesting around 2025 where forests become another source of NZ emissions and abruptly increase NZ’s already high per capita emissions even higher to around 90 million tonnes – almost 50% higher than 1990 levels.

15
To quote the Regional Council’s draft Climate Change Strategy: ‘Local governments have to deal with the problem as it’s on their doorstep – whether there is global agreement between national governments or not.’ Delayed mitigation action in Wellington will contribute to even greater need in Wellington for adaptation action. Delayed mitigation action in NZ with increasing gross emissions since 1990, an Emissions Trading Scheme that has locked in existing high emissions practices, encouraged new coal-powered milk-treatment plants and discouraged forestry planting by a virtually zero price on emissions, and economic expansion based on new fossil fuel extractive industries, has put even greater pressure on local government to act decisively and quickly.
Central government context Central government is expected to table New Zealand’s Intended Nationally Determined Contribution (INDC) by June this year in preparation for the 2015 United Nations climate change conference (UNFCCC 21st Conference of the Parties (COP21)) in Paris during December to negotiate a global treaty on climate action beyond 2020. The INDC will show how NZ will play its part beyond 2020 in reducing global emissions quickly enough to limit global warming to the internationally agreed limit of 2’C. Details will be available in coming weeks as to the precise timeframe and public consultation process. According to central government officials, there are three objectives for NZ’s INDC:
(i) credible domestically and internationally (ii) costs are managed to economy and society (iii) NZ is guided over the long term to a low emissions future.
Furthermore, the NZ delegation stated during COP20 in Lima late last year that NZ intends to meet our target of reducing our emissions by 5% on 1990 levels by 2020xx, and will develop a carbon budget for the period of 2013 to 2020. During October this year the IPCC secretariat will evaluate the total impact of the INDCs tabled by the world’s nations to determine whether these will sufficient to limit global warming to the international agreed 2’C limit. Other agencies are also likely to assess the warming impact of the INDCs as nations table these over this year. This means we will have independent evaluation of the adequacy of NZ’s INDC to be tabled in June. To repeat the words of GWRC’s draft Climate Change Strategy: ‘Local governments have to deal with the problem as it’s on their doorstep – whether there is global agreement between national governments or not.’ We don’t know how ambitious NZ’s INDC will be, nor whether COP21 in Paris this December will reach an agreement capable of at least limiting global warming to 2’C in time – although global momentum is building for COP21 to be the breakthrough with significant moves already by both US and China, and INDCs covering half the world’s emissions have already been tabled. What we do know is that the sooner the Wellington region moves to zero net emissions, the better our future will be economically and socially. We also know that a managed transition which shares the changes will be better for our region, than an abrupt lurch to slash emissions because further delays have forced a faster rate of change.
xx
The delegation noted that NZ’s population has already increased by 30% since 1990. But the key to limiting climate changes is the quantity of emissions over time – atmospheric physics is oblivious to the emissions intensity of our economy, population changes, or other factors we are tempted to label as ‘exogenous’.
16
NZ’s projected emissions and removals to 2030 Slide 19 NZ’s projected emissions and removals to 2030 from NZ Climate Change Ambassador’s Presentation at COP20 Lima 2014 http://unfccc6.meta-fusion.com/cop20/events/2014-12-08-10-19-first-working-group-session-of-the-multilateral-assessment-under-the-international-assessment-and-review-process-part-3/new-zealand
Source: Multilateral assessment: New Zealand. NZ Climate Change Ambassador Jo Tyndall presentation to COP20 Lima, December 2014. slide 19. http://customers.meta-fusion.com/wcm/141201_5020_UNFCCC_COP_20_Lima/download/20141208_1000_03_NZ_multilateral_assessment.pdf
17
References 1 Chan M, Director-General World Health Organization. Climate change and health: preparing for
unprecedented challenges. The 2007 David E. Barmes Global Health Lecture, Bethesda, Maryland, USA, 10 December 2007. http://www.who.int/dg/speeches/2007/20071211_maryland/en/
2 World Medical Association. WMA Declaration of Delhi on Health and Climate Change. Adopted by the 60th
WMA General Assembly, New Delhi, India, October 2009. http://www.wma.net/en/30publications/10policies/c5/index.html
3 McMichael AJ. Globalization, climate change, and human health. N Engl J Med. 2013;36814:1335-43. doi:
10.1056/NEJMra1109341. http://www.nejm.org/doi/full/10.1056/NEJMra1109341
4 Costello A, Abbas M, Allen A, Ball S, Bell S, et al. Managing the health effects of climate change: Lancet and
University College London Institute for Global Health Commission. Lancet 2009,373:1693-1733. http://www.thelancet.com/journals/lancet/article/PIIS0140-6736(09)60935-1/fulltext
5 [Joint letter from The Royal College of Physicians and 17 other international professional bodies published
simultaneously in The Lancet and the British Medical Journal] Lim V, Stubbs JW, Nahar N, Amarasena N, et al; Gilmore I. Politicians must heed health effects of climate change. Lancet. 2009;374:973; BMJ. 2009;339:b3672. http://www.thelancet.com/journals/lancet/article/PIIS0140-6736%2809%2961641-X/fulltext, http://www.bmj.com/content/339/bmj.b3672
6 New Zealand College of Public Health Medicine. Policy Statement on Climate Change. Wellington: New
Zealand College of Public Health Medicine, 2013. http://www.nzcphm.org.nz/media/74098/1._nzcphm_climate_change_policy__final_comms_version2_.pdf
7 Bennett H, Jones R, Keating G, Woodward A, Hales S, Metcalfe S. Health and equity impacts of climate change
in Aotearoa-New Zealand, and health gains from climate action. N Z Med J. 2014 Nov 28;127(1406):16-31. http://www.nzma.org.nz/journal/read-the-journal/all-issues/2010-2019/2014/vol-127-no-1406/6366
8 Stern N. The economics of climate change: the Stern review. Cambridge: Cambridge University Press, 2007.
http://webarchive.nationalarchives gov.uk/20130129110402/http:/www.hm-treasury.gov.uk/stern_review_report.htm
9 Garnaut R. The Garnaut climate change review, final report. Melbourne: Cambridge University Press, 2009.
http://www.garnautreview.org.au/index.htm
10 The World Bank. Cities and climate change: an urgent agenda. Urban DSeries Knowledge Papers Vol.10
December 2010. Washington DC: The International Bank for Reconstruction and Development/The World Bank, 2010. http://siteresources.worldbank.org/INTUWM/Resources/340232-1205330656272/CitiesandClimateChange.pdf
11 Hansen J, Nazarenko L, Ruedy R, Sato M, Willis J, et al. Earth's energy imbalance: confirmation and
implications. Science. 2005;308(5727):1431-1435. http://www.sciencemag.org/content/308/5727/1431.full
12 IPCC, 2013. IPCC WGI AR5. Twelfth Session of Working Group I. Approved Summary for Policymakers. 27
September 2013. http://www.climatechange2013.org/images/uploads/WGIAR5-SPM_Approved27Sep2013.pdf
13 IPCC, 2013. Climate Change 2013: The Physical Science Basis. Working Group I Contribution to the IPCC Fifth
Assessment Report. Final Draft Underlying Scientific-Technical Assessment. Accepted by the 12th Session of Working Group I and the 36th Session of the IPCC on the 26th September, 2013, Stockholm, Sweden. http://www.ipcc.ch/
14 Baer P, Kartha S, Athanasiou T, Kemp-Benedict E. The Greenhouse Development Rights framework: drawing
attention to inequality within nations in the global climate policy debate. Development & Change. 2009;40(6):1121-38. DOI: 10.1080/13668790903195495 http://sei-us.org/Publications_PDF/SEI-ISS-GDRDrawingAttention-09.pdf
15 Baer P, Athanasiou T, Kartha S, Kemp-Bennedict E. The right to development in a climate constrained world:
the Greenhouse Development Rights framework 2nd edition. Heinrich Böll Foundation / Christian Aid / EcoEquity / Stockholm Environment Institute, 2008. http://gdrights.org/wp-content/uploads/2009/01/thegdrsframework.pdf
18
16
Oxfam International. Hang together or separately? How global co-operation is key to a fair and adequate climate deal at Copenhagen. Briefing Paper 128, 2009. http://www.oxfam.org/en/policy/fair-climate-deal-copenhagen, http://policy-practice.oxfam.org.uk/publications/hang-together-or-separately-how-global-cooperation-is-key-to-a-fair-and-adequat-114525
17 Baer P. The greenhouse development rights framework for global burden sharing: reflection on principles and
prospects. WIREs Clim Change 2012. doi: 10.1002/wcc.201
18 Three salient global mitigation pathways, assessed in light of the IPCC carbon budgets. Greenhouse
Development Rights project (EcoEquity, Stockholm Environment Institute) – Climate Equity Reference Project. http://www.climateequityreference.org/gdrs-scorecard-calculator-information/mitig-path-overview/
19 Metcalfe S, Woodward A, Macmillan A, Baker M, Howden-Chapman P, et al. New Zealand Climate and Health.
Why New Zealand must rapidly halve its greenhouse gas emissions. N Z Med J. 2009;122:72-95. http://www.orataiao.org.nz/file/view/Metcalfe%20et%20al%20NZMJ%202009.pdf
20 UN International Maritime Organization (IMO). Third IMO GHG Study 2014.
http://www.imo.org/OurWork/Environment/PollutionPrevention/AirPollution/Pages/Relevant-links-to-Third-IMO-GHG-Study-2014.aspx Aviation‘s contribution to climate change. International Civil Aviation Organization (ICAO), 2010. http://www.icao.int/environmental-protection/Documents/EnvironmentReport-2010/ICAO_EnvReport10-Ch1_en.pdf IPCC. Aviation and the Global Atmosphere: A Special Report of the Intergovernmental Panel on Climate Change. Cambridge University Press, 1999. http://www.grida.no/publications/other/ipcc_sr/?src=/climate/ipcc/aviation/index.htm Jardine CN. Calculating the environmental impact of aviation emissions. Environmental Change Institute Oxford University Centre for the Environment, 2005. http://climatecare.org/wordpress/wp-content/uploads/2013/07/Calculating-the-Environmental-Impact-of-Aviation-Emissions.pdf Owen B, Lee DS, Lim L, Flying into the future: aviation emissions scenarios to 2050. Environ. Sci. Technol. 2010;44 (7):2255–60. http://pubs.acs.org/doi/pdf/10.1021/es902530z The Future of Air Transport White Paper. HMSO, 2003, citation 26 at http://en.wikipedia.org/wiki/Environmental_impact_of_aviation.
21 Macmillan A, Connor J, Witten K, Kearns R, Rees D, Woodward A. The societal costs and benefits of
commuter bicycling: simulating the effects of specific policies using system dynamics modeling. Environ Health Perspect 2014; DOI:10.1289/ehp.1307250. http://ehp.niehs.nih.gov/1307250
22 The costs of physical inactively: towards a regional full-cost accounting perspective. Auckland Council,
Waikato Regional Council, Wellington Regional Strategy Committee, 2013. http://www.gw.govt.nz/assets/About-GW-the-region/News-and-media-releases/Physical-inactivity-costs-report.pdf