Embed Size (px)
Citation preview
CS 6453Network Fabric
Presented by Ayush Dubey
Based on:
1. Jupiter Rising: A Decade of Clos Topologies and Centralized Control in Google’s Datacenter Network. Singh et al. SIGCOMM15.
2. Network Traffic Characteristics of Data Centers in the Wild. Benson et al. IMC10.
3. Benson’s original slide deck from IMC10.

Example – Facebook’s Graph Store Stack
Source: https://www.facebook.com/notes/facebook-engineering/tao-the-power-of-the-graph/10151525983993920/

Example - MapReduce
Source: https://blog.sqlauthority.com/2013/10/09/big-data-buzz-words-what-is-mapreduce-day-7-of-21/

Performance of distributed systems depends heavily on the datacenter interconnect

Evaluation Metrics for Datacenter Topologies
• Diameter – max #hops between any 2 nodes• Worst case latency
• Bisection Width – min #links cut to partition network into 2 equal halves
• Fault tolerance
• Bisection Bandwidth – min bandwidth between any 2 equal halves of the network
• Bottleneck
• Oversubscription – ratio of worst-case achievable aggregate bandwidth between end-hosts to total bisection bandwidth
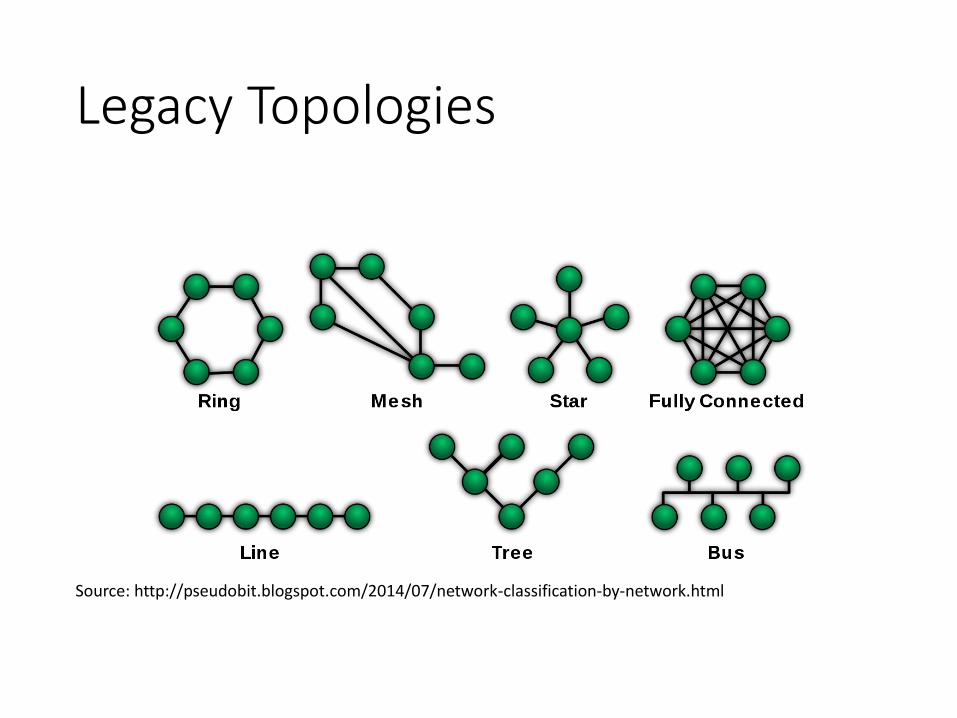
Legacy Topologies
Source: http://pseudobit.blogspot.com/2014/07/network-classification-by-network.html

3-Tier Architecture
Server racks
TOR switches -Edge
Tier-2 switches - Aggregation
Load balancer
Load balancer
B
1 2 3 4 5 6 7 8
A C
Border router
Access router
Internet
Tier-1 switches - Core
Source: CS 5413, Hakim Weatherspoon, Cornell University
Congestion!

Big-Switch Architecture
Source: Jupiter Rising, Google
Cost $O(100,000)!
Cost $O(1,000)!

Goals for Datacenter Networks (circa 2008)• 1:1 oversubscription
ratio – all hosts can communicate with arbitrary other hosts at full bandwidth of their network interface
• Google’s Four-Post CRs offered only about 100Mbps
• Low cost – cheap off-the-shelf switches
Source: A Scalable, Commodity Data Center Network Architecture. Al-Fares et al.

Fat-Trees
Source: Francesco Celestino, https://www.systems.ethz.ch/sites/default/files/file/acn2016/slides/04-topology.pdf

Advantages of Fat-Tree Design
• Increased throughput between racks
• Low cost because of commodity switches
• Increased redundancy

Case Study: The Evolution of Google’s Datacenter Network(Figures from original paper)

Google Datacenter Principles
• High bisection bandwidth and graceful fault tolerance
• Clos/Fat-Tree topologies
• Low Cost• Commodity silicon
• Centralized control

Firehose 1.0
• Goal – 1Gbps bisection bandwidth to each 10K servers in datacenter

Firehose 1.0 – Limitations
• Low radix (#ports) ToR switch easily partitions the network on failures
• Attempted to integrate switching fabric into commodity servers using PCI
• No go, servers fail frequently
• Server to server wiring complexity
• Electrical reliability

Firehose 1.1 – First Production Fat-Tree• Custom enclosures with dedicated single-board
computers• Improve reliability compared to regular servers
• Buddy two ToR switches by interconnecting• At most 2:1 oversubscription
• Scales up to 20K machines
• Use fiber rather than Ethernet for longest distances (ToR to above)
• Workaround 14m CX4 cable limit improves deployability
• Deployed on the side with legacy four-post CR

Watchtower
• Goal – leverage next-gen 16X10G merchant silicon switch chips
• Support larger fabrics with more bandwidth
• Fiber bundling reduces cable complexity and cost

Watchtower – Depopulated Clusters• Natural variation in
bandwidth demands across clusters
• Dominant fabric cost is optics and associated fiber
• A is twice as cost-effective as B

Saturn and Jupiter
• Better silicon gives higher bandwidth
• Lots of engineering challenges detailed in the paper

Software Control
• Custom control plane• Existing protocols did not support multipath, equal-cost
forwarding• Lack of high quality open source routing stacks• Protocol overhead of running broadcast-based
algorithms on such large scale• Easier network manageability
• Treat the network as a single fabric with O(10,000) ports
• Anticipated some of the principles of Software Defined Networking

Issues – Congestion
High congestion as utilization approached 25%
• Bursty flows
• Limited buffer on commodity switches
• Intentional oversubscription for cost saving
• Imperfect flow hashing

Congestion – Solutions
• Configure switch hardware schedulers to drop packets based on QoS
• Tune host congestion window
• Link-level pause reduces over-running oversubscribed links
• Explicit Congestion Notification
• Provision bandwidth on-the-fly by repopulating
• Dynamic buffer sharing on merchant silicon to absorb bursts
• Carefully configure switch hashing to support ECMP load balancing

Issues – Control at Large Scale
• Liveness and routing protocols interact badly• Large-scale disruptions
• Required manual interventions
• We can now leverage many years of SDN research to mitigate this!
• E.g. consistent network updates addressed in “Abstractions for Network Update” by Reitblatt et al.

Google Datacenter Principles –Revisited• High bisection bandwidth and graceful fault
tolerance• Clos/Fat-Tree topologies
• Low Cost• Commodity silicon
• Centralized control

Do real datacenter workloads match these goals?(Disclaimer: following slides are adapted from Benson’s slide deck)

The Case for Understanding Data Center Traffic
• Better understanding better techniques
• Better traffic engineering techniques• Avoid data losses
• Improve app performance
• Better Quality of Service techniques• Better control over jitter
• Allow multimedia apps
• Better energy saving techniques• Reduce data center’s energy footprint
• Reduce operating expenditures
• Initial stab network level traffic + app relationships

Canonical Data Center Architecture
Core (L3)
Edge (L2)
Top-of-Rack
Aggregation (L2)
Application
servers

Dataset: Data Centers Studied
DC Role DC
Name
Location Number
Devices
Universities EDU1 US-Mid 22
EDU2 US-Mid 36
EDU3 US-Mid 11
Private
Enterprise
PRV1 US-Mid 97
PRV2 US-West 100
Commercial
Clouds
CLD1 US-West 562
CLD2 US-West 763
CLD3 US-East 612
CLD4 S. America 427
CLD5 S. America 427
10 data centers
3 classes Universities
Private enterprise
Clouds
Internal users Univ/priv
Small
Local to campus
External users Clouds
Large
Globally diverse

Dataset: Collection
• SNMP• Poll SNMP MIBs
• Bytes-in/bytes-out/discards
• > 10 Days
• Averaged over 5 mins
• Packet Traces• Cisco port span
• 12 hours
• Topology• Cisco Discovery Protocol
DC
Name
SNMP Packet
Traces
Topology
EDU1 Yes Yes Yes
EDU2 Yes Yes Yes
EDU3 Yes Yes Yes
PRV1 Yes Yes Yes
PRV2 Yes Yes Yes
CLD1 Yes No No
CLD2 Yes No No
CLD3 Yes No No
CLD4 Yes No No
CLD5 Yes No No

Canonical Data Center Architecture
Core (L3)
Edge (L2)
Top-of-Rack
Aggregation (L2)
Application
servers
Packet
Sniffers
SNMP & Topology
From ALL Links

Topologies
Datacenter Topology Comments
EDU1 2-Tier Middle-of-Rack switches instead of ToR
EDU2 2-Tier
EDU3 Star High capacity central switch connecting racks
PRV1 2-Tier
PRV2 3-Tier
CLD Unknown

Applications
• Start at bottom• Analyze running applications • Use packet traces
• BroID tool for identification• Quantify amount of traffic from each app

Applications
• Cannot assume uniform distribution of applications
• Clustering of applications• PRV2_2 hosts secured portions of applications
• PRV2_3 hosts unsecure portions of applications
0%
20%
40%
60%
80%
100%
AFS
NCP
SMB
LDAP
HTTPS
HTTP
OTHER

Analyzing Packet Traces
• Transmission patterns of the applications
• Properties of packet crucial for
• Understanding effectiveness of techniques
• ON-OFF traffic at edges
• Binned in 15 and 100 m. secs
• We observe that ON-OFF persists
34

Data-Center Traffic is Bursty• Understanding arrival process
• Range of acceptable models
• What is the arrival process?
• Heavy-tail for the 3 distributions
• ON, OFF times, Inter-arrival,
• Lognormal across all data centers
• Different from Pareto of WAN
• Need new models
35
Data
Center
Off Period
Dist
ON periods
Dist
Inter-arrival
Dist
Prv2_1 Lognormal Lognormal Lognormal
Prv2_2 Lognormal Lognormal Lognormal
Prv2_3 Lognormal Lognormal Lognormal
Prv2_4 Lognormal Lognormal Lognormal
EDU1 Lognormal Weibull Weibull
EDU2 Lognormal Weibull Weibull
EDU3 Lognormal Weibull Weibull

Packet Size Distribution
• Bimodal (200B and 1400B)
• Small packets• TCP acknowledgements• Keep alive packets
• Persistent connections important to apps

Intra-Rack Versus Extra-Rack
• Quantify amount of traffic using interconnect
• Perspective for interconnect analysis
Edge
Application
servers
Extra-Rack
Intra-Rack
Extra-Rack = Sum of Uplinks
Intra-Rack = Sum of Server Links – Extra-Rack
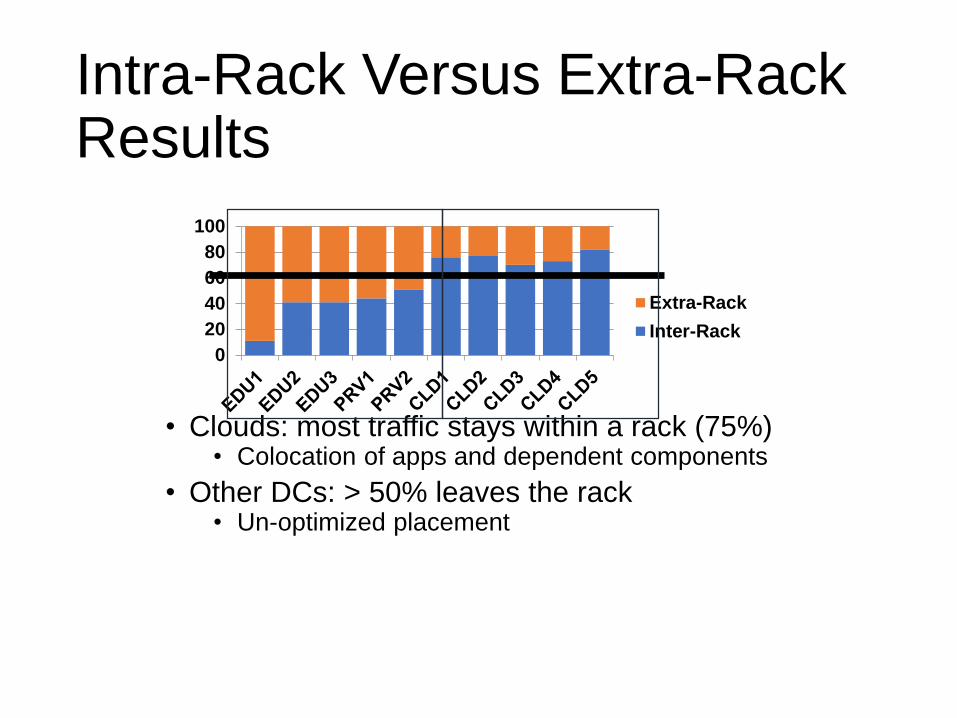
Intra-Rack Versus Extra-Rack Results
• Clouds: most traffic stays within a rack (75%)• Colocation of apps and dependent components
• Other DCs: > 50% leaves the rack• Un-optimized placement
0
20
40
60
80
100
Extra-Rack
Inter-Rack

Extra-Rack Traffic on DC Interconnect
• Utilization: core > agg > edge
• Aggregation of many unto few
• Tail of core utilization differs
• Hot-spots links with > 70% util
• Prevalence of hot-spots differs across data centers

Persistence of Core Hot-Spots
• Low persistence: PRV2, EDU1, EDU2, EDU3, CLD1, CLD3
• High persistence/low prevalence: PRV1, CLD2
• 2-8% are hotspots > 50%
• High persistence/high prevalence: CLD4, CLD5
• 15% are hotspots > 50%

Prevalence of Core Hot-Spots
• Low persistence: very few concurrent hotspots
• High persistence: few concurrent hotspots
• High prevalence: < 25% are hotspots at any time
0 10 20 30 40 50Time (in Hours)
0.6%
0.0%
0.0%
0.0%
6.0%
24.0%

Observations from Interconnect
• Links utils low at edge and agg
• Core most utilized• Hot-spots exists (> 70% utilization)
• < 25% links are hotspots
• Loss occurs on less utilized links (< 70%)• Implicating momentary bursts
• Time-of-Day variations exists• Variation an order of magnitude larger at core
• Apply these results to evaluate DC design requirements

Assumption 1: Larger Bisection
• Need for larger bisection• VL2 [Sigcomm ‘09], Monsoon [Presto ‘08],Fat-Tree
[Sigcomm ‘08], Portland [Sigcomm ‘09], Hedera [NSDI ’10]
• Congestion at oversubscribed core links

Argument for Larger Bisection
• Need for larger bisection• VL2 [Sigcomm ‘09], Monsoon [Presto ‘08],Fat-
Tree [Sigcomm ‘08], Portland [Sigcomm ‘09], Hedera [NSDI ’10]
• Congestion at oversubscribed core links• Increase core links and eliminate congestion

Calculating Bisection DemandCore
Edge
Aggregation
Application
servers
Bisection
Links
(bottleneck)
App
Links
If Σ traffic (App ) > 1 then more device
are
Σ capacity(Bisection needed at the
bisection

Bisection Demand
• Given our data: current applications and DC design
• NO, more bisection is not required• Aggregate bisection is only 30% utilized
• Need to better utilize existing network• Load balance across paths• Migrate VMs across racks

Related Works
• IMC ‘09 [Kandula`09]• Traffic is unpredictable
• Most traffic stays within a rack
• Cloud measurements [Wang’10,Li’10]• Study application performance
• End-2-End measurements

Insights Gained
• 75% of traffic stays within a rack (Clouds)• Applications are not uniformly placed
• Half packets are small (< 200B)
• Keep alive integral in application design
• At most 25% of core links highly utilized
• Effective routing algorithm to reduce utilization
• Load balance across paths and migrate VMs
• Questioned popular assumptions
• Do we need more bisection? No
• Is centralization feasible? Yes

Are Fat-Trees the last word in datacenter topologies?(Figures from original papers/slide decks)

Fat-Tree – Limitations
• Incremental expansion hard
• Structure in networks constrains expansion• 3-level Fat-Tree: 5k2/4 switches
• 24 port switches 3,456 servers
• 48 port switches 27,648 servers

Jellyfish – Randomly Connect ToRSwitches• Same procedure for construction and expansion

Jellyfish – Higher Bandwidth than Fat-Trees

Jellyfish – Higher Bandwidth than Fat-Trees

Fat-Trees – Limitations
• Perform well in average case
• Core layer can have high-persistence, high-prevalence hotspots

Flyways – Dynamic High Bandwidth Links• 60GHz low cost wireless technology
• Dynamically inject links where needed
Figure 5: A 60GHz link in our data center.
0 5
10 15 20 25 30 35 40 45
0 6 12 18 24
SN
R (
dB
)
Time (hrs)
0
200
400
600
800
1000
0 6 12 18 24
Thro
ug
hp
ut (M
bps)
Time (hrs)
Figure 6: SNR and TCP are stable for 24 h in a data center.
an aisle (Figure 5). We ran a long-lived TCP flow (using
iperf) for 24 hours across two normal workdays, measuring
throughput and SNR information every second. During the
last 5 minutes of the simulation, one of the authors repeat-
edly walked under the link.
Figure 6 shows the link SNR and TCP throughput over
the 24 hour period. TCP throughput achieves the full 1 Gbps
rate provided by the Vendor A equipment. We see almost no
variation. In fact, none of the 1s RSSI samples was off the
average by more than 0.1 dB. The throughput curve shows
that all the end-to-end components, not just the wireless link,
are stable as perceived by the application. Even in the last
five minutes, there is no variation in the throughput.
To provide a counterpoint to these results, we set up a link
with the same hardware, but at 3 feet above the ground. We
then walked across it. Figure 7 shows the resulting variation
due to line-of-sight obstruction.
These results show that in a typical DC, line-of-sight 60GHz
links set up at rack height provide stable performance.
3.4 Interference (Spatial reuse)
So far, we have studied wireless link properties in isola-
tion. However, our system will require multiple flyways to
be active simultaneously. Interference between flyways must
then be mitigated for good performance. This can be accom-
plished in a number of ways: by using multiple channels, by
using directional antennas at both the sender and the receiver,
and by carefully controlling which flyways are activated. We
use all these techniques in our system design, but the bulk of
interference mitigation happens due to directional antennas.
We now run an experiment to show that directionality en-
ables good spatial reuse in a small space.
We configured two parallel links using Vendor A devices
equipped with NB antennas. Recall that these links use fre-
quency division to support bidirectional communication; we
configured the links so that nodes facing in the same di-
rection used the same frequency to maximize interference.
We separated source and destination by a fixed 85 inches to
mimic the width of an aisle, and varied the separation be-
tween the links in small increments. At each position, each
source sends a greedy TCP flow to its destination. The cumu-
lative throughput, shown in Figure 8, indicates whether the
two links interfere with each other. Note that this prototype
hardware has no MAC and uses no physical- or link-layer
backoff. We see that parallel links closer than 24 inches in-
terfere, but directional antennas enable them to coexist per-
fectly with slightly more separation. Note that 24 inches is
about 1 rack wide, and with 3 available 802.11ad channels,
a large number of flyways can operate simultaneously.
These results show that directional antennas can isolate
links and enable spatial reuse.
3.5 Signal leakage
A concern with using wireless in a data center environ-
ment is that the signal may leak outside the data center and
be picked up by an attacker. To show that this concern is
unfounded, we ran the following experiment. We set up a
60 GHz link using Vendor A devices. The devices were set up
about 6 inches apart. We then inserted a variety of obstacles
in between the devices. The attenuation due to various mate-
rials is shown in Figure 9. We see that common construction
materials such as wood, glass and metal significantly attenu-
ate the signal by a large margin. Coupled with normal free-
space attenuation, this margin makes it very unlikely that the
signal can be decoded outside the data center, even with a
highly directional antenna.
3.6 Power consumption
Our experimental Vendor A devices consume 25 Watts of
power. Several startups report devices that consume at most a
few Watts [24, 27]. As a typical server rack draws thousands
of watts of power, a few additional wireless devices per rack
increase consumption by a negligible fraction.
3.7 Summary
We used measurements of real 60 GHz devices to char-
acterize 60 GHz links in data centers. We found that link
quality and performance are stable in this line-of-sight envi-
ronment. The use of directional antennas effectively negates
the impacts of multi-path and mitigates interference to en-
able spatial reuse.
4. 60GHz PERFORMANCE AT SCALE
We must rely on simulation to study the performance of
many 60 GHz links in the data center. To do so with confi-
dence that our simulations are a good reflection of reality, we
base wireless effects directly on the physical layer measure-
ments we took in (§3) and the WiGig/802.11ad PHY and
MAC design [32]. We will also release our code after the
TPC meeting.1
1To preserve anonymity.
4

Fat-Trees – Limitations
• High maintenance and cabling costs
• Static topology has low flexibility

Completely Wireless Datacenters
• Cayley (Ji-Yong, Hakim, EGS, Darko Kirovski, ANCS12) uses 60GHz wireless
• Firefly (Hamedazimi et al., SIGCOMM14) and ProjecToR (Ghobadi et al., SIGCOMM16) use free-space optics
Source: Hamedazimi et al., SIGCOMM14