Embed Size (px)
Citation preview

CRYSTAL STRUCTURE OF PAC1R EXTRACELLULAR
DOMAIN: INSIGHTS OF HORMONE RECOGNITION
SHIVA KUMAR
A THESIS SUBMITTED FOR THE DEGREE OF DOCTOR OF PHILOSOPHY
DEPARTMENT OF BIOLOGICAL SCIENCES NATIONAL UNIVERSITY OF SINGAPORE
2010

CRYSTAL STRUCTURE OF PAC1R EXTRACELLULAR
DOMAIN: INSIGHTS OF HORMONE RECOGNITION
SHIVA KUMAR (B.Tech Bioinformatics)
A THESIS SUBMITTED FOR THE DEGREE OF
DOCTOR OF PHILOSOPHY
DEPARTMENT OF BIOLOGICAL SCIENCES NATIONAL UNIVERSITY OF SINGAPORE
2010

“I insist upon the view that 'all is waves'.” quoted by Walter Moore in
Schrödinger: Life and Thought (1989)

Acknowledgements
i
ACKNOWLEDGMENT
Erwin Schrodinger had once said “No self is of itself alone”. This work would
have been impossible without the effort and perseverance of my supervisor Dr.
Kunchithapadam Swaminathan. I owe a lot to Dr. Swami for providing me with
excellent guidance and motivation for both the professional and personal aspects of
this journey. I am thankful to him for patiently tolerating my mistakes and politely
pointing them out to me and, in the process, moulding me into a better researcher. I
also want to thank him for keeping his door always open, both literally and
metaphorically, to listen to my problems and provide solutions.
I also express supreme gratitude and thanks to Dr. Eric Xu of Van Andel
Institute, USA (VAI), for hosting me in his lab and providing with excellent
infrastructure and guidance. Dr. Xu’s motivation for his work was very infectious and
an example for me to look up to. Dr. Xu also taught me how to think as a researcher
and how to ask scientifically relevant questions. Dr. Augen Pioszak taught me a
number of experimental techniques. He also expertly showed me how to design
experiments and communicate the results. I want to thank a lot all the wonderful
people with whom I could spend my most memorable moments during this time,
especially, Avi and Krishna for very stimulating discussions on all aspects, from
science to philosophy. I should also thank them for hosting me on innumerable
lunches and dinners at their homes in Grand Rapids and being my only source of
delicious home cooked food far away from my own home. Life was made so much
easier and enjoyable in Grand Rapids by other wonderful friends and colleagues:
Amanda, Jenn, Karsten, Jasmine and LiMei.

Acknowledgements
ii
Most of my time was spent in NUS and I am lucky to have had so many
wonderful friends there. My seniors Dileep and Asha have been very approachable
and a perpetual source of advice on the scientific as well as professional front. Present
and former members of SBL5 Rajesh, Jobi, Keith, Cherlyn and Lissa have been very
helping and I have learned a lot from discussions with them. I also owe a lot to
present and former members of SBL4 Anupama, Vindhya, Toan, Umar, Fengxia,
Kanmani, Jikun, Deepthi and many others who have come and gone for creating a
wonderful and congenial work environment. I want to thank friends Thangavelu,
Manjeet, Abhilash, Rishi, Vamsi, Karthik and Moorthy who shared with me
numerous lunches and dinners, experimental reagents, experiences and advise.
In the end I want to reserve this space for people who were not only my batch
mates but also happened to be my closest friends during this time Vinod, Kuntal,
Sunil and Veeru. I would like to thank Vinod for all the good times and also for
listening to and letting me vent out all my thoughts, worries and frustrations. I want to
thank Kuntal for all the fun and memorable times in Singapore and US. Sunil for
teaching me molecular biology right from agarose gel analysis onwards and also for
all the advise on life and living. Veeru for all the wonderful times and being a
constant source of inspiration and spiritual advice.

Table of contents
iii
TABLE OF CONTENTS
Page
Acknowledgement i
Table of contents iii
Summary vii
List of abbreviations viii
List of figures ix
List of tables xi
CHAPTER 1. X-RAY CRYSTALLOGRAPHY 1
1.1 INTRODUCTION 1
1.2 UNIT-CELL 7
1.3 POINT GROUP AND SPACE GROUP 8
1.4 RECIPROCAL LATTICE AND EWALD SPHERE 10
1.5 STRUCTURE FACTOR 12
1.5.1 Structure factors as a complex number 13
1.5.2 Electron density 13
1.6 METHODS TO SOLVE PHASE PROBLEM 15
1.6.1 Multiple isomorphous replacement (MIR) 16

Table of contents
iv
1.6.1.1 Patterson Function 18
1.6.2 Multiwavelength anomalous dispersion (MAD) 19
1.6.3 Molecular replacement (MR) 20
1.7 REFINEMENT 22
CHAPTER 2. PITUITARY ADENYLATE CYCLASE ACTIVATING POLYPEPTIDE RECEPTOR 1: A CLASS B G-PROTEIN COUPLED RECEPTOR 24
2.1 INTRODUCTION 24
2.2 THE RECEPTORS 25
2.2.1 Classification 25
2.2.1.1 Class-A (Rhodopsin-like) 26
2.2.1.2 Class-B (Secretin receptor-like) 27
2.2.1.3 Class-C (Glutamate receptor-like) 27
2.2.1.4 Class D (Adhesion receptor-like) 28
2.2.1.5 Class E (Frizzled/Taste2 receptor-like) 28
2.3 TRANDUCERS 29
2.4 EFFECTORS 30
2.5 MECHANISM OF SIGNALLING 32
2.5.1 Ligand binding and receptor activation 32
2.5.2 Gα activation 34
Table of contents
v
2.5.3 Activation of receptors 35
2.5.4 Signal deactivation 35
2.6 PITUITARY ADENYLATE CYCLASE ACTIVATING
POLYPEPTIDE 1 RECEPTOR: CLASS B GPCR 36
2.6.1 Discovery 36
2.6.2 Structure of the Pac1R gene 38
2.6.3. Pharmacology of PACAP:PAC1R interaction: structure of PACAP 40
CHAPTER 3. MATERIALS AND METHODS 45
3.1 PROTEIN PRODUCTION 45
3.2 DSBC PURIFICATION 49
3.3 CRYSTALLIZATION, DATA COLLECTION AND STRUCTURE
DETERMINATION 50
3.4 PEPTIDE BINDING ASSAY 52
3.5 DOCKING OF PACAP8-27 TO PAC1R-ECD 54
CHAPTER 4. RESULTS 57
4.1 PROTEIN PRODUCTION 57
4.1.1 Disulphide shuffling 59
4.2 HORMONE BINDING ASSAY 62
4.3 CRYSTALLIZATION OF PAC1R 65

Table of contents
vi
4.4 STRUCTURE OF MBP-PAC1R(25-140)-H6 67
4.4.1 Crystal Packing 67
4.4.2 Fold of Pac1R-ECD 70
4.4.3 Molecular determinants of Pac1R:PACAP interaction 75
4.4.4 Peptide docking to receptor ECD 76
CHAPTER 5. DISCUSSION 80
REFERENCES 87

Summary
vii
SUMMARY
Pituitary adenylate cyclase activating polypeptide (PACAP) is a member of
the PACAP/glucagon family of peptide hormones, which controls many physiological
functions in the immune, nervous, endocrine, and muscular systems. It activates
adenylate cyclase by binding to its receptor, PAC1R, a member of class B G-protein
coupled receptors (GPCR). Crystal structures of a number of Class B GPCR
extracellular domains (ECD) bound to their respective peptide hormones have
revealed a consensus mechanism of hormone binding. However, the mechanism of
how PACAP binds to its receptor remains controversial as an NMR structure of the
PAC1R ECD/PACAP complex reveals a different topology of the ECD and a distinct
mode of ligand recognition. Here a 1.9 Å crystal structure of the PAC1R ECD is
reported, which adopts the same fold as commonly observed for other members of
Class B GPCR. Binding studies with alanine-scanned peptides and mutated receptor
ECD support a model that PAC1R uses the same conserved fold of Class B GPCR
ECD for PACAP binding, thus unifying the consensus mechanism of hormone
binding for this family of receptors.

List of abbreviations
viii
LIST OF ABBREVIATIONS
AC Adenylate Cyclase BME β-Mercapto ethanol bR Bacteriorhodopsin CNS Central Nervous System CRD Cystein Rich Domain DsbC Disulphide bond chaperone C ECD Extra Cellular Domain GEF Guanosine nucleotide Exchange Factor GPCR G-Protein Coupled Receptor GRK G-protein Receptor Kinase GSH Glutathione (reduced) GSSG Glutathione (oxidised) IC Intra Cellular IP3 Inositol-1,4,5-triphosphate LSQ Least Squared MAD Multiwavelength Anomalous
Displacement MBP Maltose Binding Protein MCS Multiple Cloning Site MIR Multiple Isomorphous Replacement ML Maximum Likelihood MR Molecular Replacement NA Numerical Apperture PAC1R Pituitary Adenylate Cyclase Activating
Polypeptide Receptor 1 PACAP Pituitary Adenylate Cyclase Activating
Polypeptide PHI Peptide Histidine Isoleucine RAMP Receptor Activity Modifying Protein RGS Regulators of G-protein Signalling SEC Size Exclusion Chromatography TLS Translation Libration Screw TM Trans Membrane TMR Trans Membrane Region UV Ultra Violet VFTM Venus Fly Trap Module VIP Vasoactive Intestinal Peptide PTH1R Parathyroid hormone receptor CRFR Corticotropin releasing factor receptor GIP1R Gastric inhibitory peptide receptor GLP1R Glucagon like peptide receptor

List of figures
ix
LIST OF FIGURES
Figure 1.1 …2
Figure 1.2 …4
Figure 1.3 …5
Figure 1.4 …6
Figure 1.5 …7
Figure 1.6 …8
Figure 1.7 …9
Figure 1.8 …11
Figure 1.9 …12
Figure 1.10 …13
Figure 1.11 …17
Figure 2.1 …32
Figure 2.2 …36
Figure 2.3 …41
Figure 2.4 …42
Figure 2.5 …43
Figure 3.1 …45
Figure 3.2 …52
Figure 4.1 …58
Figure 4.2 …59
Figure 4.3 …61
Figure 4.4 …61
Figure 4.5 …62
List of figures
x
Figure 4.6 …63
Figure 4.7 …64
Figure 4.8 …66
Figure 4.9 …68
Figure 4.10 …70
Figure 4.11 …71
Figure 4.12 …72
Figure 4.13 …74
Figure 4.14 …74
Figure 4.15 …75
Figure 4.16 …77
Figure 4.17 …78
Figure 5.1 …83

List of tables
xi
LIST OF TABLES
Table 1.1 …10
Table 2.1 …29
Table 2.2 …31
Table 2.3 …38
Table 2.4 …40
Table 3.1 …54
Table 3.2 …55
Table 4.1 …65
Table 4.2 …67

1
CHAPTER 1. X-RAY CRYSTALLOGRAPHY
1.1 INTRODUCTION
Objects in our world exist in a wide array of sizes, ranging from the cosmic scale to
the atomic and sub-atomic scales. In order to see an object, we, usually, illuminate the object
and then focus, with the help of a lens, the scattered light onto a detector. Light, or any
electromagnetic radiation, scatters when it interacts with matter. This interaction, which
causes scattering, can be of two types: 1) elastic, in which the kinetic energy of the incident
and the scattered light is same and 2) inelastic, in which the kinetic energy of the scattered
light is not conserved with respect to the incident light. Elastic scattering can be further
divided into different types, based on certain properties. The kind of elastic scattering that
describes the scattering of X-rays by crystals in the bio-molecular crystallography paradigm
is called as Thomson scattering. Thomson scattering was originally formulated by Joseph
John Thomson, who won an unshared Noble Prize in 1906 for his ‘theoretical and
experimental investigation on the conduction of electricity by gases’. It deals with the
behaviour of electromagnetic radiation scattered by free charged particles. As we will see
later, X-rays are scattered by the electrons of atoms that make crystal, bringing bio-molecular
crystallography to the realm of Thomson scattering. While we are able to use the scattering of
visible light to view most objects in our daily life, it suffers from some fundamental
limitations that limit its use for protein structure determination.
There is a lower limit to the size of the detail that can be observed by this method.
Two points that are separated from each other by a distance smaller than λ/2 (where λ is the
wavelength of the used incident light) cannot be viewed as separate points. Visible light
denotes a small range of wavelengths in a wide spectrum of electromagnetic radiation, Fig.
1.1.

Chapter 1. X-ray crystallography
2
Figure 1.1. The entire electromagnetic spectrum of light, which comprises of a large range of wavelengths. Visible light forms a very small portion within it, comprising of wavelengths between 390 to 750 nm. The scale at the bottom shows the objects that have comparable dimensions with the wavelengths. Adapted from http://ds9.ssl.berkeley.edu/LWS_GEMS/pdfs/em-spectrum.pdf
The human eye can sense wavelengths in a narrow range of 3900-7500 Å. The lower
limit of the distance between two points which can be measured is called the resolution limit
(dmin) of observation. This dmin is dependent on two factors: the wavelength of the light used
and the numerical aperture (NA) of the lens used to focus the scattered light (Eq. 1)
𝑑𝑚𝑖𝑛 = λ2 NA
NA of the lens in our eyes defines the resolution of objects we are able to separate
with our naked eyes. In order to peer deeper into the microscopic scale, we artificially extend
the NA by making use of external lenses. NA of a man-made lens can even be given a
theoretical value of 1, which then imposes a restriction on dmin to depend solely on the
wavelength of the light being used. Therefore, the theoretical limit of dmin for visible light is
100-200 Å. In order to achieve atomic resolution, dmin should be in the range of the van der
Waals radius of atoms and it is impossible to use visible light for achieving this. Although the
use of higher frequency radiation was proposed long time back, progress in this direction was
Eq. 1

Chapter 1. X-ray crystallography
3
impaired by the practical limitations of using frequencies in the ultraviolet (UV) range, due to
its property to rupture chemical bonds. Bio-molecular crystallography, therefore, became
plausible when Wilhelm Conrad Roentgen reported the discovery of X-rays in 1895. X-rays
have a wavelength of 0.1-100 Å and are deemed appropriate for atomic resolution. Photons
with longer wavelengths (such as ultraviolet radiation) do not have the ability to provide the
desired resolution. On the other side, higher energy radiations (such as gamma rays) have
practical difficulties in production and, in addition, interact destructively with matter
producing particle-antiparticle pairs, making them unsuitable for bio-molecular
crystallography. Therefore, X-rays provide an ideal compromise for determining the structure
of bio-molecules in their native form at atomic resolution.
The behaviour of light, when scattered by matter, is easily understood by the
Huygens-Fresnel principle, which states that every point in an advancing wave-front can be
assumed to be the source of another wave (Fig. 1.2). Connecting equivalent points from the
wave of all individual point sources gives back the shape of the original wave-front after
having advanced to the new position. Blocking this wave-front with an opaque screen having
a slit gives rise to an interesting behaviour characteristic of all waves. If the slit is much
larger than the wavelength (Fig. 1.2a) of the incoming wave then the shape of the original
wave-front can be formed on the other side of the slit. If, on the other hand, the diameter of
the slit is comparable in size to the wavelength of the incoming wave-front, then the shape of
the wave-front changes on the other side of the slit (Fig. 1.2b).

Chapter 1. X-ray crystallography
4
a b
Figure 1.2. (a) Every point on an advancing wave-front can be assumed to be a point source of another wave. Considering the waves from all the point sources gives us back the original wave-front, which has now advanced from the original position. Putting an opaque screen in front of the advancing wave-front would block it, unless there is a slit in the opaque screen. If this slit is very large then every point in the portion of the wave-front that manages to pass through acts as a point source to give us back the shape of the original wave-front. (b) If the slit is reduced in size such that its diameter is equal to the wavelength of the incoming radiation then only one point source can pass through. This then creates a wave-front that is much different in shape than the original wave-front.
Extending from this, if another slit (also comparable in diameter with the wavelength) is
made adjacent to the first slit then we get two point sources of radiation. The waves from
these two point sources would then interfere at points of varying phase difference to result in
a smear of radiation at the detector. The question then is, how to arrange the array of slits
such that the wavelets from each of the point sources precisely add up at certain points and
nullify at certain points to result in an alternating pattern of maxima and minima (Fig. 1.3)?

Chapter 1. X-ray crystallography
5
Figure 1.3. The slits, having diameter in the range of the incident light’s wavelength, made on an opaque screen act as point sources of radiation. The waves from these point sources interfere with each other depending on their phase differences. By making the slits at certain regular intervals it is possible to make sure that all the wave-fronts from the new point sources add-up at certain points called as ‘max’ and nullify at certain points called as ‘min’ to give rise to a diffraction pattern (figure adapted from Rupp, 2009).
It is interesting to note that due to the comparable sizes of the van der Waals radius of atoms
and the wavelength of X-rays, atoms scatter X-rays in a manner analogues to Fig. 1.2b, in
which each atom acts as a point source of X-ray (albeit the structure factor of the scattered X-
ray varies for different atom types, vide infra, in a manner that it contains the imprint of the
atom that scattered it). The search for this pattern in which the atoms (or slits from Fig. 1.3)
have to be arranged in order to give an alternating pattern of maxima and minima that result
in a diffraction pattern led William Lawrence Bragg and William Henry Bragg to give the
most fundamental equation of X-ray crystallography, known as Braggs’s law (Eq. 2, Fig.
1.4).

Chapter 1. X-ray crystallography
6
𝑛 𝜆 = 2𝑑 sin 𝜃
Figure 1.4. Bragg’s law describes the relationship between the angle of incidence and distance between the planes of points to achieve constructive and destructive interference that forms a diffraction pattern.
Bragg’s law (Eq. 2) provides a quantitative relationship of the wavelength (λ), the
angle of the incident radiation (θ) and the distance between the planes of atoms (d), which
scatter the X-rays, in diffraction (while n= any integer 1,2,3…). Therefore, a precisely
ordered arrangement of atoms is a pre-requisite for diffraction. This enables us to use
diffraction images to study the underlying ordered arrangement of atoms, which produce it.
In other words, crystals are nearly perfect arrangement of atoms in three dimensions. Yevgraf
Fyodorov, Arthur Schoenflies, William Barlow and others had formulated a classical theory
of atomic arrangement in crystals, known as the space group theory, even before the
discovery of X-rays (and their use in crystals). This theory is also applicable to bio-molecular
crystallography. As would be elaborately discussed later, the arrangement of diffraction spots
that emanate from the diffraction of X-rays by a crystal is indicative of the arrangement of
atoms in the crystal, while the intensity and phase of the diffraction spots carry an imprint of
Eq. 2

Chapter 1. X-ray crystallography
7
the identity and location of atoms. This knowledge can be used to build a 3-dimensional
model of a molecular structure.
1.2. UNIT-CELL
When solute molecules arrange in an ordered manner to enter a crystalline state, they
adopt one among a limited number of orientations. An ordered arrangement entails a fixed
orientation of each molecule in relation to its neighbours. Therefore, it is possible to
fractionate a crystal into a minimum volume, which, when repeated multiple times, will
generate the whole crystal. This minimal building block is defined as the unit-cell. The unit-
cell has three non coplanar lattice vectors a, b and c, with interaxial angles α, β and γ, Fig 1.5.
Figure 1.5. The unit-cell is the translationally repeating building block that generates a crystal.
The magnitude of the lattice vectors a, b and c along with the angles α, β and γ are known as
the unit-cell parameters. Based on the unit-cell parameters (which usually supports
symmetry, vide infra), every crystal can be divided into one among the following crystal
systems (Fig. 1.6). Taking this classification a step further and allowing unit-cells to form
interlaced arrangement (known as unit-cell centering), the 7 crystal systems form 14 Bravais
lattices (Fig. 1.7), named after the French physicist Auguste Bravais, who first proposed it in
1845.

Chapter 1. X-ray crystallography
8
Figure 1.6. Based on the unit-cell parameters (which usually support the demands of symmetry), all the crystals can be divided into 7 systems. The primitive lattice of each crystal system is shown on the rightmost column.
1.3 POINT GROUP AND SPACE GROUP
The spatial relations that relate neighbouring motifs are called symmetry operations.
Crystals follow three classes of symmetry operations known as (1) inversion, (2) reflection
and (3) translation. The allowable combinations of these crystallographic symmetry
operations in the primitive unit-cell of the 7 crystal systems are known as the crystallographic
point groups.

Chapter 1. X-ray crystallography
9
Figure 1.7. The 14 Bravais lattices of crystals.
There are 32 point groups. Expanding these point groups by allowing translations for the
basic symmetry elements rotation and reflection and including the lattice types will make 230
possible types of crystallographic packing, known as space groups. Of these 230 space
groups, many entail the inclusion of enantiomeric motifs. The fact that all proteins are made
up of only L-amino acids and do not have any enantiomeric D-amino acids restricts the
ability of natural proteins to crystallize only in 65 chiral space groups (Hahn, 2006), Table.
1.1 (Rupp, 2009).

Chapter 1. X-ray crystallography
10
Table 1.1. The 65 chiral space groups in which proteins crystallize.
Lattice properties
Minimum internal symmetry
Crystal system
Point group m
Bravais type B
Lattice type
Chiral space groups
z,M
a≠b≠c α≠β≠γ≠90°
None Tricilinic 1 1 P 1 aP P1 1
a≠b≠c α=γ=90° β≠90°
2-fold rotation axis parallel to unique axis b
Monoclinic 2 2 P 1 mP P2, P21 2
C 2 mC C2 4
a≠b≠c α=β=γ=90°
3 perpendicular, non-intersecting 2-fold axes
Orthorhombic
222 4 P 1 oP P222, P2221, P21212, P212121
4
I 2 oI I222,I212121 8
C 3 oC C2221, C222 8
F 4 oF F222 16
a=b≠c α=β=γ=90°
4-fold rotation axis parallel to c
Tetragonal 4 4 P 1 tP P4, P41, P42, P43 4
I 2 tI I4, I41 8
422 8 P 1 tP P422, P4212, P4122, P41212, P4222, P42212, P4322, P43212
8
I 2 tI I422, I4122 16
a=b≠c α=β=90° γ=120°
3-fold rotation axis parallel to c
Trigonal 3 3 P 1 hP P3, P31, P32 3
R 3 hR R3 6
32 6 P 1 hP P312, P321, P312, P3121, P3212, P3221
9
R 3 hR R32 18
6-fold rotation axis parallel to c
Hexagonal 6 6 P 1 hP P6, P61, P65, P62, P64, P63
6
622 12
P 1 hP P622, P6122, P6522, P6222, P6422, P6322
12
a=b=c α=β=γ=90°
Four 3-fold axes along space diagonals
Cubic 23 12
P 1 cP P23, P213, 12
I 2 cI I23, I213 24
F 4 cF F23 48
432 24
P 1 cP P432, P4232, P4332, P4132
24
I 2 cI I432, I4132 48
F 4 cF F432, F4132 96
1.4 RECIPROCAL LATTICE AND THE EWALD SPHERE
Working with crystal geometry and Bragg reflections can be enormously simplified
for mathematical calculations and illustration of diffraction by using the concept of
‘reciprocal lattice’. A crystal, or the array of unit-cells, can be reduced to a set of repeating

Chapter 1. X-ray crystallography
11
lattice points. The whole 3-dimentional lattice can be sliced using a set of parallel imaginary
planes in a periodic fashion. The planes are then named as h, k, l, known as Miller indices,
which are the integral number of parts into which the plane divides each unit-cell parameter
a, b and c, respectively. Therefore, an infinite set of planes can be made through the real-
space lattice, with each set having a unique value for h, k and l. The distance between two
adjacent parallel planes is then represented by the vector ‘dhkl’ and is called as the interplanar
distance. To convert this real space lattice into a reciprocal lattice, a lattice point should be
drawn from each point in the real-space at a distance of 1/dhkl (represented as d*hkl) and
normal to the hkl plane. The set of points drawn in this manner form the reciprocal lattice.
The reciprocal lattice was used by physicist Paul Ewald to give the general geometric
interpretation of diffraction, known as the Ewald sphere (Fig. 1.8) (Ewald, 1969).
Figure 1.8. The Ewald construction of X-ray diffraction.
If a sphere of radius ‘r’ = 1/λ is drawn and the incident beam of X-rays hits the real space
plane (hkl) at ‘O’ at an angle ‘θ’ and gets reflected making an equivalent angle COB then AC
= sinθ/λ. By geometry, AC=BC, therefore, AB=2AC. Now, as shown above 2AC = 2(sinθ/λ).
According to Bragg’s law 2(sinθ/λ) = 1/dhkl. As described earlier, 1/dhkl is equal to d*hkl.
Therefore, point ‘B’ can be assumed to be a point in the reciprocal lattice and if it coincides
with the Ewald sphere then Bragg’s law is satisfied.
According to the Ewald construction, diffraction from a hkl plane will only occur
when the corresponding d*hkl lies on the Ewald sphere. Therefore, upon exposing a crystal to

Chapter 1. X-ray crystallography
12
X-rays, only a few of the reciprocal lattice points will be sampled. The crystal is, hence,
rotated so that the reciprocal lattice also rotates and more points intersect with the Ewald
sphere and be recorded in the detector (Fig. 1.9).
Figure 1.9. In geometric interpretation of a diffraction experiment, a crystal can be assumed to be at the centre of the Ewald sphere. The detector is placed behind the crystal to record diffraction spots (figure adapted from Rupp, 2009).
1.5 STRUCTURE FACTOR
Using Bragg’s law and the Ewald construction it is possible to determine where the
spot from each hkl plane will get collected on the detector. Once the reciprocal lattice has
been constructed in this manner, it can be converted to a real space lattice. However, the real
space lattice obtained in this manner will only be a collection of points forming the unit-cell
with no information about the molecular contents of the unit-cell. In order to learn about the
molecular contents of a unit-cell, the contribution of each atom in the crystal towards each
observed Bragg reflection needs to be calculated. To do this, each observed reflection is
deconvoluted into the partial contribution of the individual atomic scattering factors (of all
atoms in the unit-cell) in the direction of the observed reflection. The deconvolution into
partial contribution of individual scattering factors is done with the aide of the mathematical
concept of complex numbers.

Chapter 1. X-ray crystallography
13
1.5.1 Structure factors as a complex number
Working with scattering factor of waves can be simplified for mathematical
calculations and diagrammatic interpretation by representing them as complex numbers. A
complex number can be represented as ‘a + ib’ where ‘a’ is called the ‘real’ component and
‘ib’ is called the imaginary component, where ‘i’ is √−1. In the complex number system, the
contribution of the imaginary component lies in an orthogonal direction to the real number.
The complex number a+ib would then represent ‘a’ units in the x direction (real axis) and b
units in the y direction (imaginary axis), Fig. 1.10.
Figure 1.10. The complex number system. A wave can be represented by a complex number.
Waves can be conveniently represented using this system. The amplitude of a wave
can be represented by ‘r’ and ‘θ’ can be used to represent the phase angle of the wave, Fig.
1.10. This ‘a+ib’ representation is called the rectangular form of the wave and can be used to
calculate the properties of waves using the rules of the complex number mathematics.
1.5.2 Electron density
Each spot on the detector is the total scattering factor in the direction hkl and is called
as the structure factor Fhkl (Eq. 3).
θ a
b
x
r
y

Chapter 1. X-ray crystallography
14
𝐅ℎ𝑘𝑙 = �𝑓𝑗 𝑒2𝜋𝑖(ℎ𝑥𝑗+𝑘𝑦𝑗+𝑙𝑧𝑗)𝑛
𝑗=1
where ‘fj’ represents the atomic scattering factor of atom ‘j’, hkl represent the Miller indices
of the plane that is forming the Bragg reflection while x, y and z represent the fractional
coordinates of atom j in the unit-cell. The atomic scattering factor is a close approximation of
the Gaussian function having its centre at sinθ = 0. The scattering factor decays rapidly with
increase in the diffraction angle.
After calculating the contribution of scattering in the direction of each hkl for all the
atoms, it is now desirable to interpret the electron density at each point within the unit-cell.
Calculation of the electron density in the unit-cell provides us a picture of the electron cloud
of each atom, thereby locating the atom in the unit-cell. The problem of obtaining the
electron density at any point of the unit-cell is a problem of switching from the reciprocal
space of structure factors to the real space of unit-cell contents. The relationship of the two
domains is explained by the mathematical formulation of Fourier transformation, developed
by the French mathematician Jean Baptiste Joseph Fourier. Using the principles of Fourier
analysis, the calculation of electron density is a reverse Fourier transform of structure factors
(Eq. 4), where V= volume of the entire unit cell.
𝜌(𝑥,𝑦, 𝑧) = 1𝑉
���𝐅ℎ𝑘𝑙𝑒−2𝜋𝑖(ℎ𝑥+𝑘𝑦+𝑙𝑧)
𝑙𝑘ℎ
The task of visualizing the 3-dimentional structure of a protein is reduced to
determining the location of each atom in the unit-cell of a protein crystal. As is evident from
Eqs. 3 and 4, the problem of calculating the location of each atom in the unit-cell depends on
determining the structure factor of the reflecting planes, where the structure factor of the
reflecting planes can be calculated by summing up the atomic scattering contribution in the
particular direction, which in turn depends on the position of the atom in the unit-cell
Eq. 3
Eq. 4

Chapter 1. X-ray crystallography
15
bringing us back to the original problem. The structure factors of a crystal are determined
experimentally in a diffraction experiment and the information is fed to the problem loop to
determine the location of each atom in the unit-cell and visualize the 3-dimentional structure
of the protein molecule. However, a technological inability limits the complete determination
of experimental structure factors. This is due to the fact that structure factors are composed of
amplitude as well as phase angles of the diffraction waves. While the detector is able to
measure the amplitude of the diffraction spot the information about the phase angle is
immeasurable. The problem of crystallography, in both small molecular and macromolecular,
therefore, is reduced to the problem of accurately estimating the phase of X-rays.
1.6 METHODS TO SOLVE THE PHASE PROBLEM
While it is not possible to experimentally obtain the phase angle for all the spots
recorded on the detector, it is possible to estimate and derive them indirectly or directly from
the reflections. The method or strategy chosen for solving the phase problem depends on
some considerations. However, all methods help to obtain enough initial phase angles to
enable the formation of interpretable electron density maps. Once an interpretable electron
density map has been obtained, a partial model of the protein can be built which then needs to
be refined to optimize selected parameters iteratively. Additional phases are then obtained
from the partial model to further improve the electron density maps and build more regions of
the structure. Statistical parameters from the model are analysed at each step of model
building and refinement to verify conformity with the experimentally obtained data. Iterative
cycles of model building and refinement, while comparing the conformity with
experimentally obtained data, therefore, gradually improves the electron density maps to
yield the final structure. The final structure is, hence, a model whose conformity has
adequately been refined using the experimental data.

Chapter 1. X-ray crystallography
16
1.6.1 Multiple isomorphous replacement (MIR)
MIR is one of the earliest methods used by bio-molecular crystallographers to obtain
near accurate phase information for some of the reflections and to enable the generation of
initial electron density maps. The principle of MIR lies in the fact, as explained earlier, that
all atoms in the crystal contribute towards each observed reflection. When a few heavy atoms
(like Au, Pt etc.) are added to the protein crystal then the changes in the reflection intensities
can be used to obtain initial phases. First it is important to emphasize here that the changes in
reflections should come only from the added atoms and not due to other perturbations.
Therefore, it is essential that the additional atoms do not alter the unit-cell dimensions of the
crystal. In addition, the added atom should be heavy enough that it does not get drowned in
the contributions from other protein atoms to a reflection and leads to measurable changes in
the observed reflection intensity.
Every Fhkl in a heavy atom derivatized crystal should have a different intensity
compared to the native (underivatized) crystal. In a derivative, the phase angle of a reflection
is shown to be dominated by the heavy atom(s) and in order to determine the phase angle, the
location of the heavy atom in the unit-cell need to be determined. The location of the heavy
atom can be determined using the Patterson function (Patterson, 1934), as explained in the
next section. Using the location of the heavy atom and using them in Eq. 3, Fhkl can be
calculated. Let us refer the structure factor of the derivative as FHP, and that from the native
protein crystal can be called as FP while that from the heavy atom alone (heavy atom sub-
structure) can be referred as FH. As these structure factors are additive,
𝐅HP = 𝐅H + 𝐅P
or,
𝐅P = 𝐅HP − 𝐅H
Eq. 5
Eq. 6

Chapter 1. X-ray crystallography
17
Fig. 1.11 represents the above equation. From the co-ordinates of the heavy atom and Eq. 3
FH can be determined. Since, the value of the complex number FH is known, the amplitude
and phase can be represented as the length and angle, respectively, of the vector FH. In order
to determine FP, first -FH is drawn from the origin. From the head of the -FH vector, another
vector FHP can then be drawn. We can measure the amplitude of FHP as it is equal to �IHP,
but we cannot measure its phase. Therefore, we can represent FHP as a circle of radius |FHP|
centred on the head of -FH (Fig. 1.11). Then, the phase angle of FP is given by the intersection
of the two circles. It is evident that we get two phase solutions for FP. In order to obtain a
unique solution, this process can be repeated again with another heavy atom, which labels at
a separate position. Drawing the third circle from the head of another vector –FH2, we will get
two solutions, of which one of them will be nearly identical to one of the two solutions from
the first heavy atom and using the set of Fps, an electron density map can be computed.
Figure 1.11. Pictorial representation of the multiple isomorphous replacement method. Note that a single heavy atom derivative gives two phase angles for every reflection Fp. Hence, at least two heavy atom derivatives are needed to break this phase ambiguity.

Chapter 1. X-ray crystallography
18
1.6.1.1 Patterson Function
The Patterson function is crucial for determining the sub-structure of heavy atoms and
is analogous to Eq. 4, which is used to calculate electron density from structure factors, albeit
with a variation. It is a Fourier series that uses only the amplitude of the structure factors and
does not use the phase (Eq. 7). As the structure factor amplitudes can be directly derived from
spot intensities, no additional information is required for calculating a Patterson map.
𝑃(𝑢, 𝑣,𝑤) = 1V���|𝐅ℎ𝑘𝑙2 | 𝑒−2𝜋𝑖(ℎ𝑢+𝑘𝑣+𝑙𝑤)
𝑙𝑘ℎ
A Patterson map constructed using Eq. 7 produces peaks at the head of vectors drawn
from every atom to all atoms, including itself, in the unit-cell. The peaks in the Patterson map
are also referred as Patterson atoms. Therefore, if there are n atoms in a unit-cell, then there
would be n(n-1) Patterson atoms in the Patterson unit-cell. The enormity of the peaks makes
interpretation of the Patterson map extremely difficult. However, interpretation can be
simplified if the Patterson map has been calculated from only a few atoms. Hence, the
Patterson map of only the heavy atoms is calculated in the MIR method. To calculate the
Patterson map of the heavy atoms, a difference Patterson function is used. The amplitudes of
the difference Patterson function are obtained from Eq. 8.
(∆𝐅)2 = (|𝐅HP| − |𝐅P|)2
Now, applying the Patterson function from Eq. 7 the difference Patterson function can be
given as (where V= unit cell volume),
∆𝑃(𝑢, 𝑣,𝑤) = 1𝑉
���∆𝐹ℎ𝑘𝑙2 𝑒−2𝜋𝑖(ℎ𝑢+𝑘𝑣+𝑙𝑤)
𝑙𝑘ℎ
Eq. 7
Eq. 8
Eq. 9

Chapter 1. X-ray crystallography
19
For example, if there is a heavy atom A in the unit-cell, and if B is its symmetry mate,
then the Patterson map will have peaks at the head of vectors AB and BA. These two vectors
are equal in amplitude but opposite in direction. Therefore, if AB is represented by the
Patterson coordinates u,v,w, then BA will be represented as -u,-v,-w, which shows that the
Patterson map is always centrosymmetric. In addition a Patterson map has two other
properties: (1) the lattice type of the Patterson cell is the same as that of the real crystal lattice
and (2) the space group of the Patterson lattice can be derived from the space group of the
real space lattice by replacing all the translational symmetry elements by their corresponding
non-translatory ones and by adding a centre of symmetry.
It can be shown that the vectors between atoms related by symmetry have one or two
constant coordinates. Once the Patterson atoms have been obtained for the heavy atoms using
the difference Patterson function, the real heavy atom positions in the unit-cell can be
calculated largely by a procedure proposed by Harker, known as Harker sectioning, which
uses the space group information.
1.6.2 Multiwavelength anomalous dispersion (MAD)
Phase information can also be extracted by using the property of elements to absorb
X-rays at a particular wavelength. The absorption of X-rays by atoms drops suddenly close to
a characteristic wavelength(s), known as the absorption edge(s) of the element. When data is
collected at the absorption edge, Freidel’s rule does not hold good and Ih,k,l ≠ I-h,-k,-l. Certain
heavy atoms, selenium and sulphur absorb at wavelengths that can be easily generated in
today’s synchrotron radiation facilities and can be effectively used in labelling a crystal for
solving a structure with the MAD method.
The scattering at the absorption edge is called anomalous scattering and can be
characterised as,

Chapter 1. X-ray crystallography
20
𝐅HP𝜆2 = 𝐅HP
𝜆1 + ∆𝐅𝑟 + ∆𝐅𝑖
where ΔFr and ΔFi are the real and imaginary components of the scattering contribution. 𝐅HP𝜆2
and 𝐅HP𝜆1 are structure factors of the heavy atom derivatized protein crystal at a wavelength
where it does and does not show anomalous scattering respectively. Representing Freidel
pairs with superscripts + and – it can be shown that in the absence of anomalous scattering
|F|+ = |F|- while αhkl+ = - αhkl
-. It can also be shown that in Eq. 10, ∆𝐅𝑟+ and ∆𝐅𝑟− are mirror
images of each other at the anomalous wavelength. In addition, the imaginary contributions
are inverted reflections of each other i.e. ∆𝐅𝑖+ is a reflection of ∆𝐅𝑖− with the direction
reversed. A Patterson function can be used to locate the heavy atoms in the unit-cell and
obtain the complete values of ∆𝐅𝑟 and ∆𝐅𝑖. Using the laws of vector addition in Eq. 10 and a
construct analogous to Fig 1.11, two solutions for 𝐅HP𝜆2 (equivalent to FP in MIR). In order to
break the phase ambiguity, data from another wavelength is needed. To achieve this, help is
taken from the fact that the real and imaginary anomalous scattering factors, ∆𝐅𝑟 and ∆𝐅𝑖,
vary greatly at the absorption edge. Close to the absorption edge ∆𝐅𝑟 reaches a minimum
value and as it begins to ascend, ∆𝐅𝑖 reaches a maximum value. These two wavelengths,
therefore, can be used for anomalous behaviour while a wavelength far from the absorption
edge can be used for non-anomalous behaviour of atoms during diffraction.
1.6.3 Molecular replacement (MR)
MIR and MAD are powerful techniques to obtain experimental phases for structure
determination, but both of them suffer from the major drawback of having the necessity to
label the protein with heavy atoms and requiring more than one dataset. As more and more
protein structures are being solved, another technique, called Molecular Replacement (MR),
is gaining importance. MR makes use of the fact that if the structure of a target protein is
likely to be similar to an already known structure then the phases from the known structure
Eq. 10

Chapter 1. X-ray crystallography
21
will be a close approximation of the actual phases from the target structure. Proteins that
share high degree of sequence similarity also tend to share significant structural similarity.
Therefore, the calculated phases from a model structure can be combined with the measured
intensities of the target protein to obtain interpretable electron density maps. After repeated
cycles of iterative model building and refinement, the phases of the target structure will
become more accurate.
In order to obtain meaningful phases from the phasing model, it is required to orient it
similar to the target protein’s orientation in the unit-cell. In the absence of the structure of the
target protein, the correct orientation to choose is unknown. Space group considerations place
some restrictions on the orientation of the phasing model inside the unit-cell of target protein.
However, the number of possible orientations are still very large and extremely computer
intensive for a brute force search. The criteria used for search is that the calculated structure
factor intensities from the phasing model at a particular location should be similar to the
observed structure factor intensities from a diffraction experiment. For a brute force approach
to search for the best orientation, the phasing model needs to be rotated around and translated
along 3 axes, producing 6 parameters for optimization. Exhaustively trying different values
for these 6 parameters at random is an extremely computer intensive task as the number of
possible combinations will be extremely large. However, the task can be made less intensive
if the rotation and translational searches are performed separately (Rossmann and Blow,
1962). In order to enable separate searches for the rotation and translation of the phasing
model, the Patterson function is used. The unique property of the Patterson function is that it
is the same for a phasing model with the same rotation axis values, irrespective of the
translation axis values. This implies that two models will give the same Patterson function
wherever they are located in the unit-cell as long as they have the same rotation values. Using
this feature of the Patterson function, the correct values for the rotation axis can be estimated.

Chapter 1. X-ray crystallography
22
Once these values are known, they can be applied along with different values of the
translational axis to calculate structure factor intensities. These calculated values are then
matched with experimental values to arrive at optimal translational axis values.
1.7 REFINEMENT
Building the molecular model of a protein is closely intertwined with model
refinement. Model refinement refers to adjusting the variable parameters of the model such
that it optimally fits the experimentally obtained data. Refinement can be performed either in
the real space or reciprocal space. Fitting the residues of the molecule to the electron density
maps and regularizing the geometry is referred as real space refinement. On the other hand,
reciprocal space refinement refers to optimising all the adjustable parameters of the model
such that its calculated values in the reciprocal space are consistent with the experimentally
obtained data. Since the incapacity to obtain complete phases limits the ability to obtain error
free electron density maps, fitting residues to them cannot yield accurate models. Therefore,
once the model has been fit to electron density maps, it is refined against the experimental
data in the reciprocal space. As the model keeps improving during the iterative cycles of
building and refinement, more accurate phases are available, which, in-turn, improve the
electron density map. As the density maps improve, more residues can be added to the model
to generate further accurate phases. The overall fit between the model and the experimental
data is measured using the R-factor, Eq. 11, where Fobs= experimentally determined structure
factors and Fcalc= structure factors calculated from the target structure.
𝑅 =∑ |𝐹𝑜𝑏𝑠 − 𝐹𝑐𝑎𝑙𝑐 |
∑𝐹𝑜𝑏𝑠
The target function that is usually used for refinement is based on maximum likelihood
(ML). ML target functions, in most cases, tend to give better refinement as they are less
Eq. 11
Chapter 1. X-ray crystallography
23
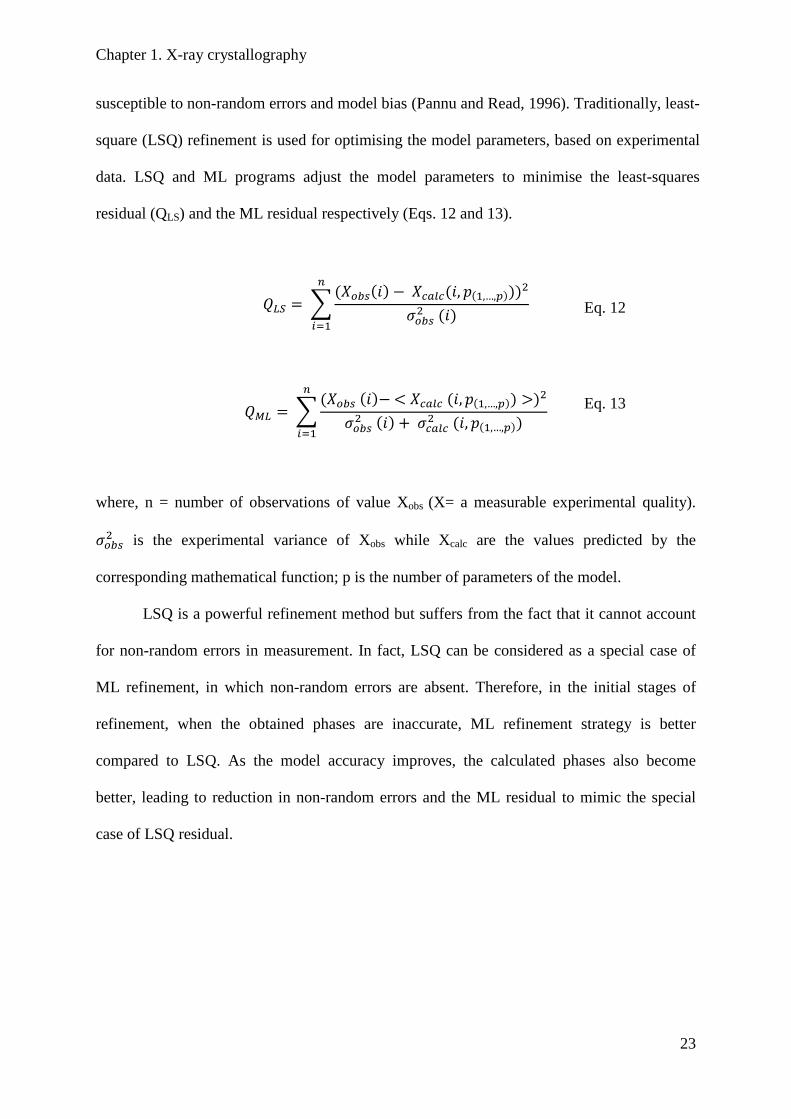
susceptible to non-random errors and model bias (Pannu and Read, 1996). Traditionally, least-
square (LSQ) refinement is used for optimising the model parameters, based on experimental
data. LSQ and ML programs adjust the model parameters to minimise the least-squares
residual (QLS) and the ML residual respectively (Eqs. 12 and 13).
𝑄𝐿𝑆 = �(𝑋𝑜𝑏𝑠(𝑖) − 𝑋𝑐𝑎𝑙𝑐(𝑖, 𝑝(1,…,𝑝)))2
𝜎𝑜𝑏𝑠2 (𝑖)
𝑛
𝑖=1
𝑄𝑀𝐿 = �(𝑋𝑜𝑏𝑠 (𝑖)− < 𝑋𝑐𝑎𝑙𝑐 (𝑖,𝑝(1,…,𝑝)) >)2
𝜎𝑜𝑏𝑠2 (𝑖) + 𝜎𝑐𝑎𝑙𝑐2 (𝑖, 𝑝(1,…,𝑝))
𝑛
𝑖=1
where, n = number of observations of value Xobs (X= a measurable experimental quality).
𝜎𝑜𝑏𝑠2 is the experimental variance of Xobs while Xcalc are the values predicted by the
corresponding mathematical function; p is the number of parameters of the model.
LSQ is a powerful refinement method but suffers from the fact that it cannot account
for non-random errors in measurement. In fact, LSQ can be considered as a special case of
ML refinement, in which non-random errors are absent. Therefore, in the initial stages of
refinement, when the obtained phases are inaccurate, ML refinement strategy is better
compared to LSQ. As the model accuracy improves, the calculated phases also become
better, leading to reduction in non-random errors and the ML residual to mimic the special
case of LSQ residual.
Eq. 12
Eq. 13

24
CHAPTER 2. PITUITARY ADENYLATE CYCLASE ACTIVATING POLYPEPTIDE RECEPTOR 1: A CLASS B G-PROTEIN COUPLED RECEPTOR.
2.1 INTRODUCTION
Life is characterised by ‘awareness’. An awareness of the surroundings and an
‘active’ response to it lies at the core of any life. Millions of years ago, during their
abiotic to biotic transition, primitive life particles became enveloped in lipid bilayer
through mechanisms still debated about. The lipid bilayer created a favourable
environment inside as compared to outside but did not completely insulate them from
their surroundings. The bilayer was interspersed with molecules which allowed them
to communicate with the surroundings and become ‘aware’ of it so as to modulate
themselves in response. This was the inception of life. Throughout evolution, by
replication and natural selection, one class of receptors which is the most favoured
and prolifically used is the G Protein Coupled Receptors (GPCRs). The importance of
GPCRs can be gauged by the fact that the human genome contains more than 800
genes belonging to this class (Fredriksson et al., 2003) making it the largest, and
hence, most ubiquitous and versatile among cell surface receptors. They are known to
be the receptors of as wide ranging messengers as hormones, light, smell and taste. A
gene can be attributed as a GPCR if it fulfils two main requirements. The first
requirement is that it should encode for a polypeptide containing seven stretches, 25
to 35 amino acids each, of relatively high hydrophobicity. This directly derives from
the fact that the defining characteristic of a GPCR is that it should have seven cell-
membrane spanning α-helices, connected by alternating intracellular and extracellular
loops. The whole receptor is placed in such a way that the N-terminus is at the outside
of the cell while the C-terminus is at the cytoplasm. The second requirement is that

Chapter 2. PAC1R- A class B GPCR
25
the receptor encoded should interact with G-proteins. There exists an accepted
mechanism of GPCR action in which there is a receptor, an effector and mediating
between them is a transducer. The transducer in the case of GPCRs is a heterotrimeric
G-protein, from which GPCRs derive their name. For many of the newly identified
GPCR genes there is no direct evidence for the existence or non-existence of a G-
protein transducer. The second requirement to classify such a gene as GPCR is only
loosely adhered to and some researchers prefer to refer to them only as 7 trans-
membrane receptors (7-TMR) instead.
Due to the overwhelming number of GPCR genes in the mammalian genome,
it is essential to have a lucid classification for them. Various criterions have been used
to classify GPCRs into different groups. Some are based on their ligand binding
properties while others rely on their phylogenetic and structural features to arrive at a
classification scheme. The enormity of the GPCR superfamily and the added
complexity of large sequence variation between invertebrates and mammals have
made this task more difficult. The classification scheme that has been used throughout
this thesis, and which is largely being followed in the research community as well, is
based on the work of Fredriksson et al (Fredriksson et al., 2003).
2.2 THE RECEPTORS
2.2.1 Classification
Gene relationships are often identified from sequence similarities. In the
evolutionary timescale, genes often get duplicated either individually or in entire
blocks as part of a chromosome. Gene duplication events are known to have produced
variation and an increase in the repertoire of the genome. Based on this, the 2R
hypothesis, first proposed by Ohno (Ohno, 1970) and later developed by Holland et al

Chapter 2. PAC1R- A class B GPCR
26
(Holland et al., 1994), says that there were two complete genomic duplications during
vertebrate development, leading to four copies of all genes in the human genome.
Assuming the validity of the hypothesis to search for paralogous genes in the human
genome and examining them for evolutionary relationships through phylogenetic
analysis, the GPCR genes have been clustered into five groups. These five groups
form the major classes into which human GPCRs have been classified and are as
described below.
2.2.1.1 Class-A (Rhodopsin-like)
This class comprises the largest number of receptors in the GPCR super-
family. Due to the enormous size of this class of receptors, sequence similarity among
members is not very high. There are still some characteristically conserved regions in
the receptors of this class because of which they have been grouped in one cluster.
Most of the members of this class have a conserved motif made of NSxxNPxxY in
trans-membrane (TM) region 7. In intracellular loop (IL) 2, near the TM-3 helix, there
is another conserved motif having the sequence Asp/Glu-Arg-Thy/Phe in most of the
members. Although the structure of bacteriorhodopsin (bR) (PebayPeyroula et al.,
1997), which also is a 7TMR, was known beforehand and was used to model the
structure of GPCRs, bR itself is not classified as a GPCR. This is due to the reason
that bR does not share any sequence similarity with other 7-TMRs found in
vertebrates. In addition to this, bR does not interact with any G-protein for its activity.
Structural information for this class was first obtained when Palczewski et al
(Palczewski et al., 2000) solved the structure of bovine rhodopsin. It is now known
that class A GPCRs usually have a disulphide bridge between cysteine residues from
extracellular loop 1 and 2 which is another ‘fingerprint’ of this class.

Chapter 2. PAC1R- A class B GPCR
27
2.2.1.2 Class-B (Secretin receptor-like)
This class comprises a small number of genes. There are approximately 20
known members for this class. Their endogenous ligands are usually large peptides,
which act as paracrine hormones. Due to this fact, class B receptors control a variety
of important physiological processes, making them very important drug targets.
Secretin was the first member of this group to be identified and characterised and,
therefore, this class is also referred to as secretin-like receptors. They typically have a
large N-terminal extra cellular domain (ECD) comprising of approximately 120
amino acids. The ECDs usually possess multiple potential glycosylation sites. All
ECDs in this class also have six conserved cysteines that form three disulphide
bridges. Formation of these disulphide bridges is essential for proper folding of the
ECD as well as its ability to bind its endogenous peptide hormone. In addition to this,
the members of this class also form a disulphide bridge between the first and second
extra cellular loop. The binding of ligands to the ECD can also be modified by certain
single trans-membrane spanning domain proteins, known as receptor activity
modifying proteins (RAMP) (Möhler and Fritschy, 1999).
2.2.1.3 Class-C (Glutamate receptor-like)
This class comprises of receptors that also possess a large ECD. The ECD
length in this group typically ranges from 280 to 580 amino acids and is comprised of
a large Venus fly trap module (VFTM). VFTM is a bilobular domain having a ligand
binding site in the middle of the two lobes. Upon binding of the ligand, the two lobes
come together and close the binding site akin to a Venus fly trap. This closed VFTM
is then presented to the extracellular loops for activation of the receptor. The VFTM is
Chapter 2. PAC1R- A class B GPCR
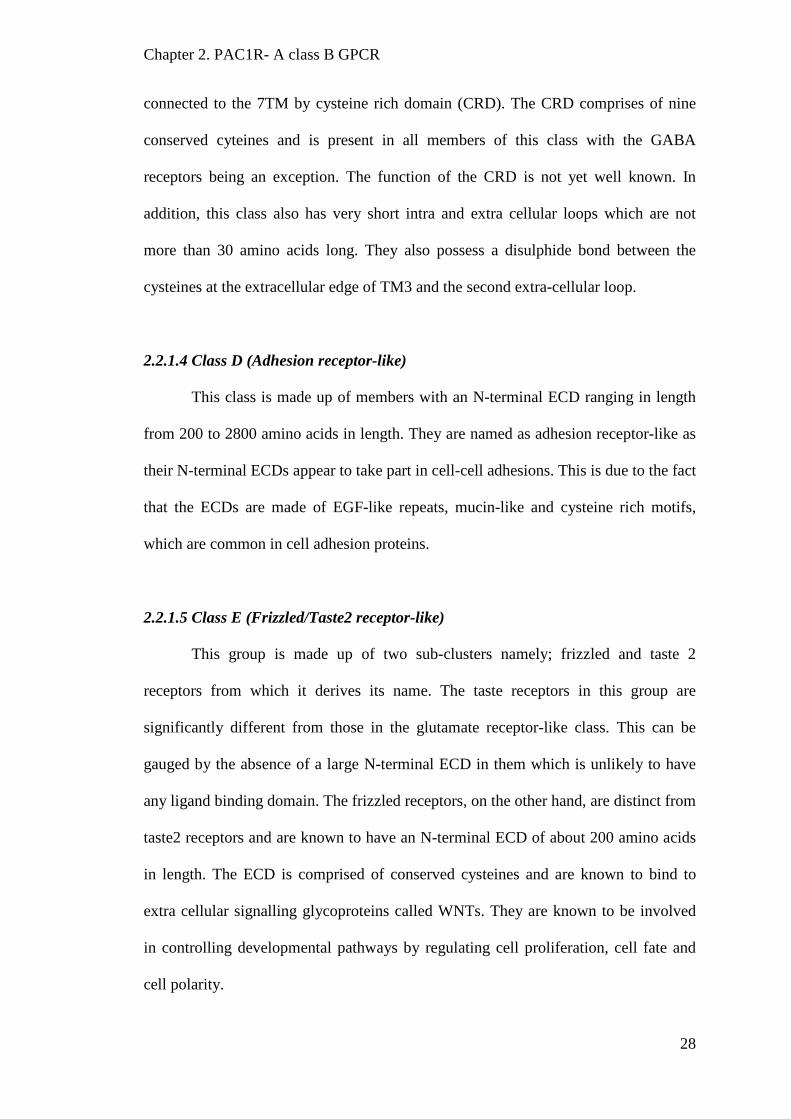
28
connected to the 7TM by cysteine rich domain (CRD). The CRD comprises of nine
conserved cyteines and is present in all members of this class with the GABA
receptors being an exception. The function of the CRD is not yet well known. In
addition, this class also has very short intra and extra cellular loops which are not
more than 30 amino acids long. They also possess a disulphide bond between the
cysteines at the extracellular edge of TM3 and the second extra-cellular loop.
2.2.1.4 Class D (Adhesion receptor-like)
This class is made up of members with an N-terminal ECD ranging in length
from 200 to 2800 amino acids in length. They are named as adhesion receptor-like as
their N-terminal ECDs appear to take part in cell-cell adhesions. This is due to the fact
that the ECDs are made of EGF-like repeats, mucin-like and cysteine rich motifs,
which are common in cell adhesion proteins.
2.2.1.5 Class E (Frizzled/Taste2 receptor-like)
This group is made up of two sub-clusters namely; frizzled and taste 2
receptors from which it derives its name. The taste receptors in this group are
significantly different from those in the glutamate receptor-like class. This can be
gauged by the absence of a large N-terminal ECD in them which is unlikely to have
any ligand binding domain. The frizzled receptors, on the other hand, are distinct from
taste2 receptors and are known to have an N-terminal ECD of about 200 amino acids
in length. The ECD is comprised of conserved cysteines and are known to bind to
extra cellular signalling glycoproteins called WNTs. They are known to be involved
in controlling developmental pathways by regulating cell proliferation, cell fate and
cell polarity.
Chapter 2. PAC1R- A class B GPCR
29
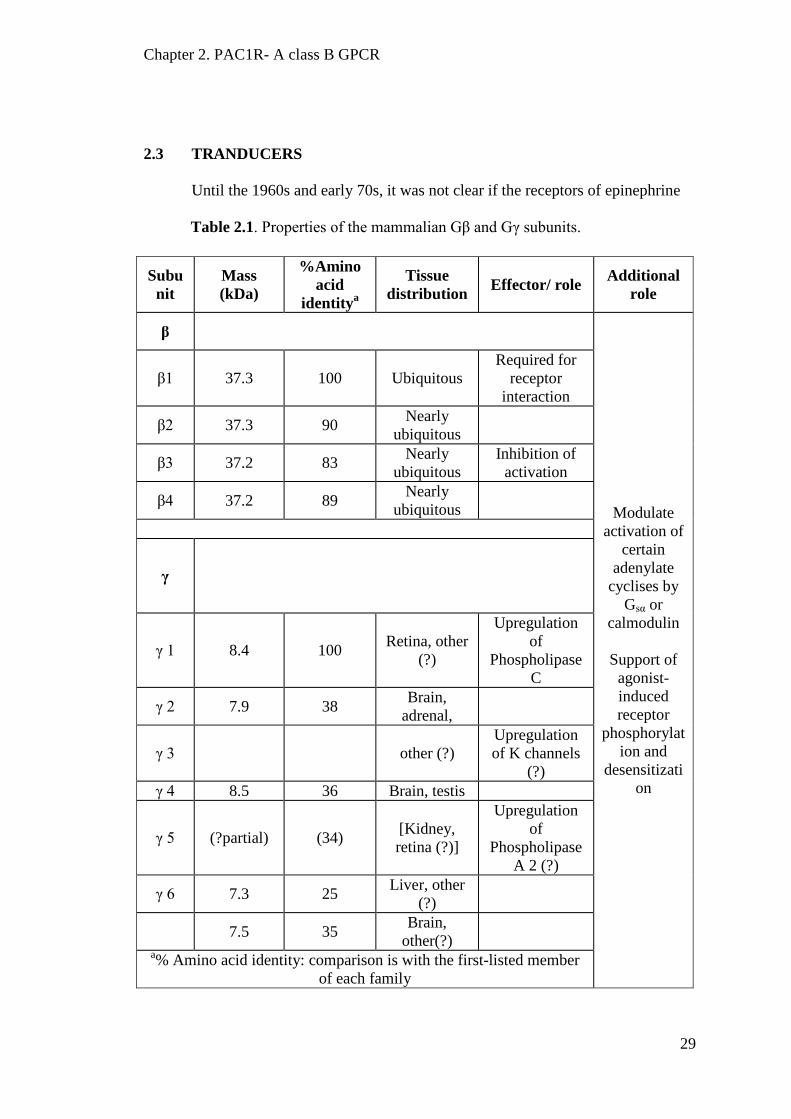
2.3 TRANDUCERS
Until the 1960s and early 70s, it was not clear if the receptors of epinephrine
Table 2.1. Properties of the mammalian Gβ and Gγ subunits.
Subunit
Mass (kDa)
%Amino acid
identitya
Tissue distribution Effector/ role Additional
role
β
Modulate activation of
certain adenylate
cyclises by Gsα or
calmodulin
Support of agonist-induced receptor
phosphorylation and
desensitization
β1 37.3 100 Ubiquitous Required for
receptor interaction
β2 37.3 90 Nearly ubiquitous
β3 37.2 83 Nearly ubiquitous
Inhibition of activation
β4 37.2 89 Nearly ubiquitous
γ
γ 1 8.4 100 Retina, other (?)
Upregulation of
Phospholipase C
γ 2 7.9 38 Brain, adrenal,
γ 3 other (?) Upregulation of K channels
(?) γ 4 8.5 36 Brain, testis
γ 5 (?partial) (34) [Kidney, retina (?)]
Upregulation of
Phospholipase A 2 (?)
γ 6 7.3 25 Liver, other (?)
7.5 35 Brain, other(?)
a% Amino acid identity: comparison is with the first-listed member of each family

Chapter 2. PAC1R- A class B GPCR
30
(which we now know as members of class A GPCRs) were separate from the effectors
adenylate cyclase.
It was assumed that they both are one and the same molecule. The Nobel prize
winning work of Martin Rodbell (Rodbell et al., 1971) and Alfred Gillman (Gilman,
1987, Ross and Gilman, 1977) established the existence of guanine nucleotide
regulatory proteins that act as a transducer of information from the receptor to the
adenylate cyclase. It is now known that these transducers are a complex of three
proteins and are known as heterotrimeric G-proteins or Gαβγ. Gαβγ always remain
anchored to the cytoplasmic side of the plasma membrane. The Gα subunit has
GTPase activity while the Gβ and Gγ subunits always remain as a tight complex. The
Gα subunit has further been divided into four different subfamilies. Gβ and Gγ are
comprised of several members, Table 2.1, and, therefore, there can possibly be many
different combinations of the Gαβγ heterotrimer complex. Both the Gα and Gβγ
complexes are known to activate effectors. Tables 2.1 and 2.2 summarise the different
types of Gα, Gβ and Gγ subunits.
2.4 EFFECTORS
The signal from an activated receptor, via a transducer, results in a cellular
response that is brought about by certain effector molecules. GPCRs activate a variety
of effector molecules, leading to a cascade of downstream reactions. One of the
effectors regulated by GPCRs is adenylate cyclase. Adenylate cyclase catalyses the
formation of the secondary messenger cAMP and, therefore, has been implicated in a
lot of downstream effects. GPCRs, via different mechanisms, can both activate and
deactivate adenylate cyclase. They can also activate cyclic GMP

Chapter 2. PAC1R- A class B GPCR
31
Table 2.2. Properties of the mammalian Gα subunit (Hepler and Gilman, 1992).
phosphodiesterase. cGMP phosphodiesterases then effect cellular response by
controlling the levels of cGMP second messenger. The amount of cGMP in the retina
is crucial for visual transduction pathways (Levitzki, 1986). Another effector
activated by GPCRs is phospholipase C. Phospholipase C effects cellular responses
by producing the second messenger inositol-1,4,5-triphosphate (IP3). IP3 then
mobilises intracellular stores of Ca2+ to result in a variety of effects. GPCRs are also
known to exert direct control over ion-channels, which are also important effectors of
several cellular functions.

Chapter 2. PAC1R- A class B GPCR
32
2.5 MECHANISM OF SIGNALLING
The whole cascade of GPCR signalling can be divided into certain broad
steps, which are described in greater detail below. Figure 2.1 illustrates the important
steps in the mechanism.
Figure 2.1 The G-protein cycle begins with the binding of the ligand (in magenta) to the receptor (in green). This activates the receptor and the Gαβγ complex can now interact with the activated receptor via the Gα subunit. The activated receptor acts like a nucleotide exchange factor and enables the Gα subunit to exchange its GDP with GTP. The Gα now comes to an active state, which results in the disassociation of the Gαβγ trimer into Gα and Gβγ. Both Gα and Gβγ can then act by binding to their respective effectors to initiate different signalling cascades. Gα has an intrinsic GTPase activity, which can be accentuated by the binding of Regulators of G-protein Signalling (RGS). Hydrolysis of Gα bound GTP to GDP deactivates the Gα and it now associates with Gβγ dimer to form the inactive Gαβγ heterotrimer. Figure taken from (Jones et al., 2004).
2.5.1 Ligand binding and receptor activation
The obvious first step is ligand recognition. GPCRs, being cell surface
receptors, recognise chemical messengers outside the cell at their extracellular
surface. Binding of a specific ligand (L) at the extracellular surface, or the
transmembrane region via a path having an opening at the extracellular side, causes
conformational changes in the inactive receptor (R), making it attain an active
conformation or become active (R*). This series of events can be depicted in the
following flow-chart.

Chapter 2. PAC1R- A class B GPCR
33
R + L R*L
The precise mode of the ligand receptor interaction depends on the class of the
receptor. In class A receptors, the ECD is small and does not contribute much in
ligand binding. Biogenic amine ligands bind within the helical bundle in the lipid
bilayer of class A receptors (Ji et al., 1998). Peptide ligands that bind class A
receptors are not postulated to typically dock deep inside the helical bundle but are
thought to remain near the extracellular side and secure assistance from extracellular
loops for binding.
In class B receptors the large ECD plays an important role in ligand binding.
The ligands for these receptors are large peptides. Ligand recognition is thought to
follow a two step process (Hoare, 2005). In this two step process, the C-terminal part
of the peptide hormone first binds to the peptide recognition cleft in the ECD. This
binding creates an ‘affinity trap’ after which the N-terminal part of the peptides binds
extracellular loops to activate the receptor. The class B GPCR ECD offers an exciting
target for structure based drug development as the possible sites of endogenous
peptide recognition as well as the sites in the ECD interacting with the extracellular
loops can possibly be modulated by small molecule drugs. In addition to this, the
large ECD of this class offers large number of sites that can be used for allosterically
modulating either the peptide binding or the association of ECD with extracellular
loops. This kind of allosteric modification of the ECD by a small molecule has been
shown with Glp1R, a member of class B GPCR (Tibaduiza et al., 2001).
In class C also, the large ECD, as expected, plays an important role in ligand
binding. The large ECD, also known as the Venus fly trap module, is made up of two
globular domains connected by a central hinge region. Binding of a ligand closes the
two globular domains, like a trap, via the central hinge region. The closed trap then

Chapter 2. PAC1R- A class B GPCR
34
presents the ligand to the extracellular regions to activate the receptor. Dimerization
of class C receptors in membrane is also a central theme in modulating the activation
of the receptor.
2.5.2 Gα activation
The Gα subunit has high affinity for an activated receptor-ligand complex than
an inactive receptor. The Gα, therefore, binds to the receptor ligand complex, which
in-turn acts as a guanosine nucleotide exchange factor (GEF). Due to the property of
an activated GPCR to act as a GEF, the Gα subunit exchanges its bound GDP with
GTP, which is usually at a 10-fold higher concentration in the cytoplasm. The GTP
bound Gα is called ‘active’ Gα as it can now disassociate from the GPCR and the Gβγ
heterodimer and bind to the effectors to activate them.
R*-L R*L-Gα
This step in the GPCR activation mechanism is very intriguing, as it acts as a relay
junction, which biases the outcome of GPCR activation towards one among a few
possible downstream events. This happens due to the preferential binding of the
activated GPCR to certain types of Gα over others. At the molecular level, a structural
understanding of how this preferential binding is actuated is still lacking. There is still
no structure of an intact Gα bound to a GPCR which could shed some light on the
molecular determinants of this step. Although some progress has been made in this
direction by the structure of a peptide of Gα bound to opsin (Scheerer et al., 2008),
elucidation of a GPCR-Gαβγ complex structure remains the next biggest target in the
unravelling of the GPCR activation mechanism.
GDP GTP

Chapter 2. PAC1R- A class B GPCR
35
2.5.3 Activation of receptors
In the third step, an active Gα migrates laterally in membrane and interacts
with its effectors, including adenylate cyclase (AC), phosphilipase C, retinal cGMP
phosphodiesterse and ion channels.
Gα-GTP + AC Gα-GTP-AC*
The activated receptor can then cause a cascade of events inside the cell. The structure
of the active Gα, in complex with the cytoplasmic domain of adenylate cyclase has
shed light on the molecular determinants of this activation (Tesmer et al., 1997). Due
to the GTPase activity of the Gα subunit, the GTP bound to it is quickly degraded to
GDP. In this deactivated state, the Gα binds to Gβγ to form an inactivated
heterotrimer.
2.5.4 Signal deactivation
The cascade of events, actuated by the active receptor-ligand conformation, is
stopped by the deactivation of GPCR signalling which constitutes the fourth step. The
Gβγ dimer binds to and recruits G-protein receptor kinases (GRK) from the cytosol.
GRKs very specifically interact with those GPCRs, which are in an active
conformation. Specific phophorylation of the active GPCRs paves the way for β-
arrestin binding. The conformational changes that occur in the activated GPCR, as a
result of phosphorylation, result in the stabilisation of the β-arrestin-GPCR complex.
This complex is then targeted to clathrin coated pits for internalization. The
internalized GPCRs can later be reactivated and recycled back to membrane. Due to
the lack of much structural information of these processes a GPCR-GRK complex or
a GPCR-β-arrestin complex structure is also the next biggest target in the elucidation

Chapter 2. PAC1R- A class B GPCR
36
of the GPCR signalling mechanism. The various conformations, through which the G-
proteins are cycled during the GPCR action mechanism, are summarised in Fig. 2.2.
Figure 2.2 The heterotrimeric G-protein cycle. The Gαβγ complex (PDB Code:1GG2) is shown at the top. Gα, Gβ and Gγ are shown in cyan, blue and green respectively. GDP is shown in gray with magenta dot surface. Switch II in Gα (represented in red), an important structural determinant shown in red, is sequestered away from the cytoplasmic milue by the Gβγ heterodimer. Right shows active Gα (PDB Code:1AZT). The γ phosphate makes important contacts with Switch II and Gβγ can now no longer bind with Gα. Bottom shows active Gα in complex with cytoplasmic domains of Adenylate Cyclase represented in brown and dark green (PDB Code: 1AZS). Switch II again plays an important role by interacting with AC. Right shows the deactivated state of Gα in the GDP bound form after the GTPase activity of active Gα. Switch II in this deactivated state is disordered and incapable of binding to any effectors. Deactivated Gα has high affinity with Gβγ and binds to it to form the Gαβγ heterotrimer again. Figure taken from Tesmer, 2010.
2.6 PITUITARY ADENYLATE CYCLASE ACTIVATING POLYPEPTIDE
1 RECEPTOR: CLASS B GPCR
2.6.1 Discovery
The ligand for Pituitary Adenylate Cyclase activating polypeptide (PACAP) 1
Receptor was discovered first by Akira Arimura in 1989 (Miyata et al., 1989). A
novel polypeptide, isolated from the ovine hypothalamus, was able to stimulate

Chapter 2. PAC1R- A class B GPCR
37
Adenylate Cyclase activity in a culture of rat anterior pituitary cells. Sequencing a
pure form of the extract revealed that it was a C-terminally amidated 38 amino acid
long polypeptide and was aptly named as Pituitary Adenylate Cyclase Activating
Polypeptide (PACAP). PACAP can also exist in a shortened form in which only the
first 27 amino acids are present (Buscail et al., 1990). Both forms are C-terminally
amidated. The different properties of these peptides will be discussed later.
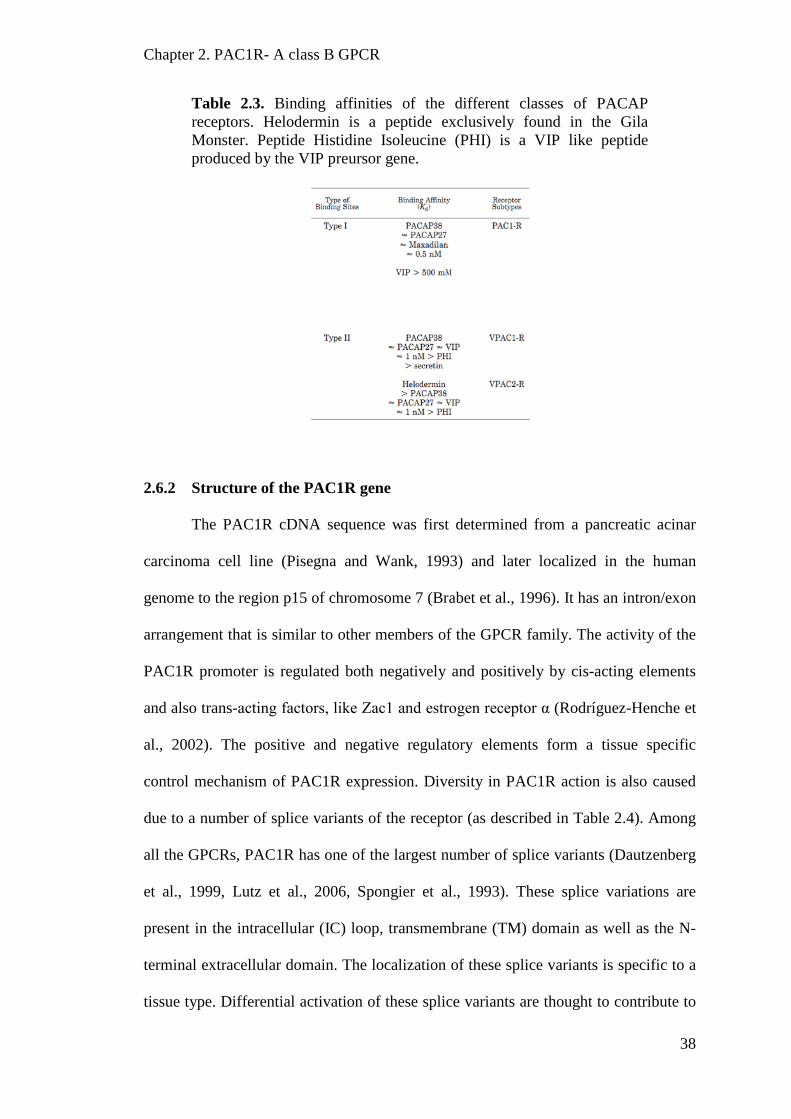
PACAP binds to two different GPCR receptors (Buscail et al., 1990, Ohtaki et
al., 1990). It also shares 68% identity with another peptide, Vasoactive Intestinal
Peptide (VIP). Due to this high degree of similarity between them, there is an overlap
between the receptors they recognise. Based on their relative affinity, the receptors
recognising them have been classified into two main types. The receptors that have
high affinity for PACAP38 and PACAP27, while much lesser for VIP, are classified
as type I receptors or PAC1R (Cauvin et al., 1990, Gottschall et al., 1990, Lam et al.,
1990, Suda et al., 1992). Type II receptors are those that have same affinity for both
PACAP and VIP (Gottschall et al., 1990, Lam et al., 1990). They are also known as
VPACR. VPACR can be further divided into two sub-classes in which the receptors
with a higher affinity for Secretin (another peptide hormone) are called as VPAC1R
or VIP1R and the receptors with lower affinity for Secretin are called as VPAC2R or
VIP2R. The binding affinities of the receptors for these peptides are summarised in
the following table.
Chapter 2. PAC1R- A class B GPCR
38
Table 2.3. Binding affinities of the different classes of PACAP receptors. Helodermin is a peptide exclusively found in the Gila Monster. Peptide Histidine Isoleucine (PHI) is a VIP like peptide produced by the VIP preursor gene.
2.6.2 Structure of the PAC1R gene
The PAC1R cDNA sequence was first determined from a pancreatic acinar
carcinoma cell line (Pisegna and Wank, 1993) and later localized in the human
genome to the region p15 of chromosome 7 (Brabet et al., 1996). It has an intron/exon
arrangement that is similar to other members of the GPCR family. The activity of the
PAC1R promoter is regulated both negatively and positively by cis-acting elements
and also trans-acting factors, like Zac1 and estrogen receptor α (Rodríguez-Henche et
al., 2002). The positive and negative regulatory elements form a tissue specific
control mechanism of PAC1R expression. Diversity in PAC1R action is also caused
due to a number of splice variants of the receptor (as described in Table 2.4). Among
all the GPCRs, PAC1R has one of the largest number of splice variants (Dautzenberg
et al., 1999, Lutz et al., 2006, Spongier et al., 1993). These splice variations are
present in the intracellular (IC) loop, transmembrane (TM) domain as well as the N-
terminal extracellular domain. The localization of these splice variants is specific to a
tissue type. Differential activation of these splice variants are thought to contribute to

Chapter 2. PAC1R- A class B GPCR
39
the different, and sometimes opposing, functions of PAC1R in different tissues. The
different patterns of these splice variants to stimulate AC or PLC possibly act to fine
tune the mechanism of signal transduction.
In addition, the different splice variants of PAC1R also localize differently in
different tissues. In the central nervous system (CNS), for example, while PAC1Rs
and PAC1R-hop are expressed in cerebellar granule cells, the cerebellar glial cells
have only PAC1Rs. The activation of PAC1R and choice of the downstream
signalling pathway, therefore, is tightly regulated at multiple levels starting from
binding ligand, isoform localized in the specific tissue, to the effector molecule
activated in response to ligand recognition. This probably provides a clue as to how
one receptor has been implicated in such a wide array of pathways.
PAC1R is present in many areas of the central nervous system (CNS).
Analysis of type I binding sites reveal high concentrations in many brain structures,
including the olfactory bulb, the cerebral cortex, the septum and amygdala, the
hippocampus, the thalamus, the hypothalamus, and the substantia nigra (Cauvin et al.,
1991, Masuo et al., 1991, Masuo et al., 1992, Suda et al., 1991, Zawilska et al., 2003).
The PACAP and/or VIP receptors are not only present in neurons but can also be
expressed in glial cells (Martin et al., 1992, Tatsuno et al., 1990). Analysis of the
expression of PAC1R-mRNA shows particularly high intensity in the olfactory bulb,
the dentate gyrus of the hippocampus, the supraoptic nucleus of the hypothalamus, the
cerebellar cortex, and the area postrema (Hashimoto et al., 1996, Nomura et al., 1996,
Otto et al., 1999, Shioda et al., 1997), particularly in high neurogenic areas like
subventricular zone of the olfactory bulb or the dentate gyrus of the hippocampus.

Chapter 2. PAC1R- A class B GPCR
40
Table 2.4. The different splice variants of PAC1R and sequence alterations in them. The table is adapted from a review by Dickson and Finlayson, 2009.
2.6.3. Pharmacology of PACAP:PAC1R interaction: structure of PACAP
Based on primary structure, the peptide ligands of class-B GPCRs can be
divided into different superfamilies. PACAP is placed in a superfamily often referred
to as PACAP/glucagon superfamily. The PACAP/glucagon superfamily is highly
sequentially conserved and differs from the calcitonin superfamily, due to the absence
of the N-terminal six or seven amino acid ring. Fig. 2.3 shows a multiple sequence
alignment of the members of the PACAP/glucagon superfamily. Phylogenetic

Chapter 2. PAC1R- A class B GPCR
41
analysis of the superfamily reveals that PACAP is the most ancient and tightly
conserved member (Sherwood et al., 2000).
Figure 2.3. Multiple sequence alignment of PACAP/glucagon superfamily of peptide hormones. Residues conserved throughout the superfamily are indicated with red font and enclosed in blue box.
The secondary structure of these peptides has been studied in aqueous as well
as organic solvents. The peptides tend to be disordered when present in an unbound
form in aqueous solutions. Addition of secondary structure inducing elements, like
organic solvents or mimicking the membrane environment with micelles causes the
peptides to assume a largely helical structure. The three dimensional structures of the
peptides, bound to the N-terminal domain of class B receptors, show that the peptides
assume an α-helical orientation in the bound form (Pioszak and Xu, 2008). The
peptides are composed of amphipathic amino acids. The conformation of these
amphipathic amino acids gets stabilized upon addition of organic solvents. Binding of
the peptide to the N-terminal domain of receptors can also lead to the stabilization of
the helical structure, as the hydrophobic amino acids face the receptor while the
hydrophilic amino acids are oriented towards the outer face in the bound form.
Class B receptor activation is believed to follow a two domain model, Fig. 2.4.
In this two-domain model the N-terminal ECD of the receptor first interacts with the
C-terminal portion of the peptide ligand. This interaction forms an ‘affinity trap’,
which then makes the N-terminal portion of the peptide to interact with the

Chapter 2. PAC1R- A class B GPCR
42
extracellular loops of the 7-TMR (Hoare, 2005). The recognition of the C-terminal
portion of the peptide by the N-terminal ECD of the receptor might lead to changes in
the orientation of the extracellular loops and/or the N-terminal portion of the peptide.
This might then trap the N-terminal portion of the peptide to bind to the extracellular
loops which then in-turn leads to the interaction of the Gα subunit at the intracellular
face of the GPCR.
Figure 2.4. The overall scheme of the two domain model. In step 1, the Receptor (R) and ligand (L) are separate. L is usually a disordered peptide. In step 2, L assumes a largely α-helical structure in which the C-terminus interacts with the N-terminal domain of the receptor forming a complex in which contacts are made only by the N-terminal receptor ECD (RLN). In step 3, the peptide N-terminus makes contacts with the juxta-membrane portion of the receptor (RLNJ). In step 4, the RLNJ complex interacts with the Gα subunit at the intracellular face of the receptor and leads to the activation of the G-protein cycle. Figure adapted from Hoare, 2005.
Most receptor:peptide interactions are electrostatic and hydrophobic in nature.
The structure of receptor ECD:peptide complex available for Parathyroid hormone
receptor (Pth1R), corticotropin releasing factor receptor (CrfR), gastric inhibitory
peptide receptor (Gip1R) and glucagon like peptide receptor (Glp1R) show that the
peptides interact at the surface of the receptor ECD as opposed to fitting into any
groove on the ECD surface. At the residue level, the interactions are mainly
hydrophobic and the amphipathic helix of the peptide interacts with receptor surface
to bury its hydrophobic residues. The interaction is further supported by contributions

Chapter 2. PAC1R- A class B GPCR
43
from some electrostatic forces between the usually electropositive peptide and the
electronegative ECD. The peptides of the PACAP/glucagon superfamily bind in a
very similar fashion. Fig. 2.5 illustrates the binding of some selected known
ECD:peptide complexes from this superfamily.
Figure 2.5. Ligand orientation in class B GPCRs. The ligands incretin of Gip1R, glucagon, exendin-4 of Glp1R, Pth of Pth1R and PACAP of PAC1R (from NMR structure) are shown in black, orange, red yellow and magenta respectively. For simplicity, the surface diagram of PAC1R ECD alone is shown in white with the trace of PAC1R in green. All class B ligands of the PACAP/glucagon superfamily follow the same binding site and orientation. This hints a possibility of a unified consensus mechanism of hormone recognition and binding for the entire superfamily.
The complex structures lack a binding groove and the interaction is largely
superficial. All peptides in this superfamily bind in the same region. A part of the N-
terminal portion of the peptides does not interact with the ECD in these structures and
is available to bind to the extracellular loops, in accordance with the two-domain
model.
Moreover, there is a bit of redundancy in these receptors to recognise a
particular hormone and vice-versa. The peptides that are closely related by sequence
can be recognised by the same receptor. The binding of different peptides to the same
receptor varies in affinity and downstream activity. In addition, while some of the
sequentially related receptors are highly selective in binding to related hormones,
some are not. This adds to the complexity of the GPCR activation mechanism as the

Chapter 2. PAC1R- A class B GPCR
44
selectivity at the extracellular level can influence the downstream pathways that are
activated.
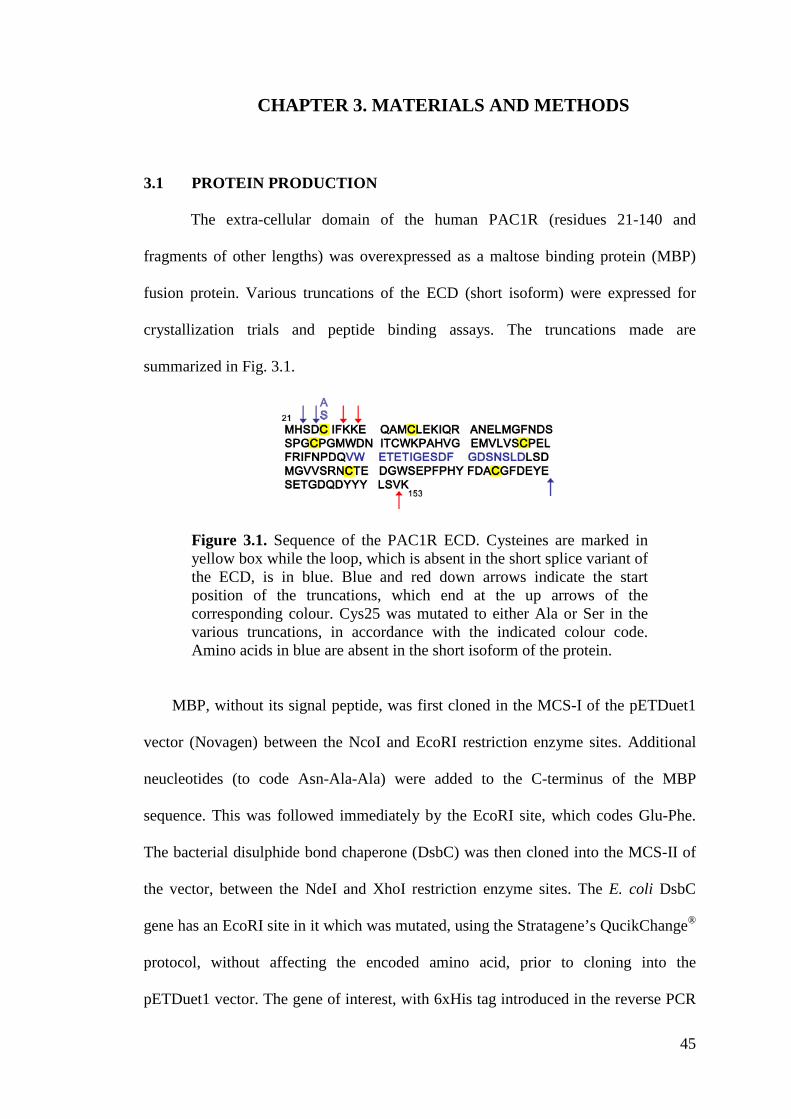
45
CHAPTER 3. MATERIALS AND METHODS
3.1 PROTEIN PRODUCTION
The extra-cellular domain of the human PAC1R (residues 21-140 and
fragments of other lengths) was overexpressed as a maltose binding protein (MBP)
fusion protein. Various truncations of the ECD (short isoform) were expressed for
crystallization trials and peptide binding assays. The truncations made are
summarized in Fig. 3.1.
Figure 3.1. Sequence of the PAC1R ECD. Cysteines are marked in yellow box while the loop, which is absent in the short splice variant of the ECD, is in blue. Blue and red down arrows indicate the start position of the truncations, which end at the up arrows of the corresponding colour. Cys25 was mutated to either Ala or Ser in the various truncations, in accordance with the indicated colour code. Amino acids in blue are absent in the short isoform of the protein.
MBP, without its signal peptide, was first cloned in the MCS-I of the pETDuet1
vector (Novagen) between the NcoI and EcoRI restriction enzyme sites. Additional
neucleotides (to code Asn-Ala-Ala) were added to the C-terminus of the MBP
sequence. This was followed immediately by the EcoRI site, which codes Glu-Phe.
The bacterial disulphide bond chaperone (DsbC) was then cloned into the MCS-II of
the vector, between the NdeI and XhoI restriction enzyme sites. The E. coli DsbC
gene has an EcoRI site in it which was mutated, using the Stratagene’s QucikChange®
protocol, without affecting the encoded amino acid, prior to cloning into the
pETDuet1 vector. The gene of interest, with 6xHis tag introduced in the reverse PCR

Chapter 3. Materials and methods
46
primer, was then cloned between the EcoRI and NotI sites. This ensured that in all the
different truncations of the receptor, the expressed protein had an N-terminal MBP
tag, followed by a six residue linker (NAAAEF), which is connected to the PAC1R-
ECD. This was followed by a 6xHis tag at the C-terminus. These constructs were
expressed in the Origami B (DE3) cell (Novagen). The Origami B (DE3) cell contains
trxB/gor mutations, which create an oxidising environment in the cytoplasm,
favouring the formation of disulphide bridges. DsbC has the ability to act both as a
disulphide bond isomerase as well as a chaperone. Therefore, DsbC was co-expressed
with the gene of interest to assist proper folding of the protein of interest in the
expression host. The cells that were transformed with the construct were grown
in LB media containing 50 µg/ml ampicillin at 37 °C until mid log phase, measured as
0.6 < OD600 <0.8. The culture was then cooled to 16 °C and the OD600 was allowed to
increase to 0.9-1.0. The cultures were then induced with 200 μM IPTG for 18 hrs. The
cells were harvested by centrifugation at 3000 g. The cell pellets were either stored at
-80 °C for future use or resuspended in buffer A [50 mM Tris (pH 7.5), 150 mM
NaCl, 25 mM imidazole and 10% glycerol] for immediate lysis. Buffer A was added
at the ratio of 35 ml per litre of the culture being lysed. Cells were lysed at 10,000 psi
using a French press at 4 °C. The cell lysate was then centrifuged at 39,000 g for 20
minutes at 4 °C and the supernatant was loaded onto a 50 ml Ni chelating sepharose
column, which was pre-equilibrated with buffer A. The column was then washed with
600 ml buffer A and then the bound protein was eluted with 50% buffer A and 50%
buffer B [50 mM Tris (pH 7.5), 150 mM NaCl, 500 mM imidazole and 10% glycerol]
using an AKTA FPLC system The eluted sample was then loaded onto a 50 ml
amylose column. The column was then washed with 150 ml buffer C [50 mM Tris
(pH 7.5), 150 mM NaCl] and then subsequently the protein was eluted using a

Chapter 3. Materials and methods
47
gradient of buffer C and buffer D [50 mM Tris (pH 7.5), 150 mM NaCl, 10 mM
maltose] from 0 to 100 % over 200 ml volume.
To ensure homogenous intramolecular disulphide bond formation and to
eliminate any intermolecular disulphide bridges, the eluted protein was subjected to
disulphide bond shuffling, in which, the eluted protein was mixed with purified DsbC
(Sec. 3.2) in a 1:1 molar ratio, in addition to 1 mM reduced and 1 mM oxidized
glutathione (GSH and GSSG, respectively) at 20 °C for 12-14 hrs. Various parameters
involved in the re-shuffling reaction had to be optimised to achieve best results for the
protein of interest. The final conditions for re-shuffling were chosen after performing
an initial trial using the following parameters:
i) Protein – DsbC + 1mM GSH + 1mM GSSG
ii) Protein – DsbC + 1mM GSH + 10mM GSSG
iii) Protein – DsbC + 10mM GSH + 1mM GSSG
iv) Protein + DsbC + 1mM GSH + 10mM GSSG
v) Protein + DsbC + 1mM GSH + 1mM GSSG
vi) Protein + DsbC + 10mM GSH + 1mM GSSG
The final concentration of the protein was 1 mg/ml. DsbC was added at a
molar ratio ratio of 1:1. 1 M Tris (pH 7.5) and 5 M NaCl were added such that after
adding water to top-up the reaction mixture to 100 µl, the final concentrations of Tris
and NaCl were 50 and 150 mM, respectively. The 100 µl reaction tubes were then
divided into two tubes of 50 µl each. One set was incubated at 4 °C while the other
was incubated at 20 °C for 12-16 hrs before analysing the results by running a native
PAGE. Each lane of the native PAGE was loaded with exactly 5 µg of the protein to
enable accurate comparison of the band intensities.

Chapter 3. Materials and methods
48
Based on the gel (Fig. 4.2), the condition chosen for large scale re-shuffling of
the protein for all purifications was: 1 mM GSH + 1 mM GSSG + DsbC at 20 °C. For
purifying any new truncation, the protein samples were initially analyzed in a similar
manner before performing a large scale re-shuffling. As most of the truncations and
mutations designed on the ECD were only for a few amino acids, no major change in
the most favourable re-shuffling condition was observed.
The shuffled protein was then loaded onto the 50 ml Ni chelate column to
remove untagged DsbC. After washing the column with 150 ml buffer A, the bound
protein was eluted with 50% buffer B. The protein was then concentrated and loaded
onto an S200 column, equilibrated with buffer E [10 mM Tris (pH 7.5), 50 mM NaCl,
1 mM maltose and 1 mM EDTA] for size exclusion chromatography. The obtained
protein was >95% pure and homogenously folded as confirmed by SDS- and native
PAGE.
The non-conserved Cys25 in the PAC1R-ECD was mutated to either Ser or Ala in
order to prevent it from forming any intra- or inter-molecular disulphide bond. The
QuickChange site-directed mutagenesis kit from Stratagene was used to make point
mutations in the ECD gene. Fully overlapping primers, which contained the desired
point mutation to change the codon for Cys25 to the most preferred codon for either
Ser or Ala, were used to PCR the entire expression plasmid. Phusion High-fidelity
DNA polymerase from Finnzymes was used for the PCR reaction. In the first step, the
PCR was run with ~20 ng of template to make copies of the clone containing the
mutation using the following protocol.
1. 98 °C 30 sec, 1 cycle
2. 98 °C 10 sec, 55 °C 20sec, 72 °C 4.5 min 20 cycles
3. 72 °C 10 min, 1 cycle

Chapter 3. Materials and methods
49
4. 4 °C hold
After PCR, 12 µl of the product was digested with 0.8 µl of the restriction
enzyme DpnI (NewEngland Biolabs) for 2 hrs. The digestion with DpnI ensured
removal of the PCR template which does not contain the mutations. 2 µl of the
digested product was then transformed into competent Omnimax™ cells from
Invitrogen. The plasmids from the colonies that were obtained next day were
sequenced to confirm the presence of the mutation.
3.2 DSBC PURIFICATION
The DsbC gene was cloned into the pETSUMO vector (Invitrogen) with an
additional N-terminal His tag to the DsbC protein. The clone was transformed into
BL21 (DE3) competent cells. The cells were grown in LB media until the OD600
reached 0.8. The cells were then cooled to 16 °C and were induced with 100 µM
IPTG before the OD600 reached 1.0. After induction, the cells were cultured at 16 °C
for 12-16 hrs. Cells were then harvested by centrifugation at 3000 g. The cell pellets
were then either frozen at -80 °C for later use or resuspended with buffer F [50 mM
Tris (pH-7.5), 150 mM NaCl and 2 mM β-mercaptoethanol (BME)]. In general, 35ml
of buffer F was used for 1 L of cell culture. The cells were then lysed using the
French press at 10,000 psi. The cell lysate was then centrifuged at 39,000 g at 4 °C.
The supernatant was loaded onto a Ni-chelating column for affinity purification. The
column was then washed with 600 ml of buffer F and then the protein was eluted
using 50% buffer F and 50% buffer G [50 mM Tris (pH-7.5), 150 mM NaCl, 2 mM
BME and 500 mM imidazole]. Sumo-protease (in-house supply) was then added to
the protein at a weight (protease):weight (DsbC) ratio of 1:1000 and kept for dialysis
at against 4 L of buffer H [50 mM Tris (pH 7.5), 150 mM NaCl, 2 mM dithio-threitol
Chapter 3. Materials and methods
50
and 50% glycerol). After dialysis for 12-16 hrs, the protein was frozen in small
aliquots at -80 °C until required.
3.3 CRYSTALLIZATION, DATA COLLECTION AND STRUCTURE
DETERMINATION
The purified PAC1R protein was concentrated to 30 mg/ml and screened for
crystallization using commercial screens (Hampton Research, Jena Biosciences and
Qiagen) with a Phoenix robot (Art Robbins Instruments). The reservoir was filled
with 75 µl of the solution and 0.2 µl of the protein at 30 mg/ml with equal amount of
the crystallization condition was added onto the sitting-drop well. CrystalMation
Intelli-Plate 96-3 plates, which have been designed for sitting drop vapour diffusion
crystallization experiments, were used for initial screening. Initial crystals were
obtained in a few conditions but the condition that gave the best data and which was
ultimately used to solve the structure of PAC1R-ECD was identified in condition D9
of JCSG++L from Jena Biosciences. After the identification of the condition in the
96-well plate, grid screens were set in hanging drop as well as sitting drop vapour
diffusion plates, using VDX plates with sealant from Hampton Research, at 20 °C.
The structure was solved with crystals grown in 25.5% PEG4000, 15% glycerol and
170 mM ammonium sulphate. Crystals first appeared after three days and grew for
one week, after which they were transferred to a fresh drop and allowed to equilibrate
by vapour diffusion against 1 ml of reservoir solution overnight. The crystals were
then flash cooled, without any additional cryo-protectant, by plunging directly in
liquid nitrogen. X-ray diffraction data were collected at the LS-CAT sector beamline
21ID-F (LS-CAT), Advanced Photon Source synchrotron (USA). The data were
processed by HKL2000 (Otwinowski and Minor, 1997). C-truncate was then used to
Chapter 3. Materials and methods
51
generate the structure factors (Padilla and Yeates, 2003). The structure was solved by
molecular replacement using the previously reported structure of MBP-PTH1R
(PDBId: 3C4M) as a model in the PHASER program (McCoy et al., 2007) of CCP4
(Bailey, 1994, Potterton et al., 2003). Only the MBP domain was first used as a search
model. After a solution for MBP was chosen the PTH1R-ECD was used as the search
model in the next step. Performing the search with MBP revealed clear electron
density for the ECD region as well which then further improved after the ECD search.
The ECD of PTH1R was truncated in accordance with the corresponding residues in
PAC1R-ECD in order to avoid atom clashes during the acceptance of the results. Coot
(Emsley et al., 2010) and Refmac5 (Murshudov et al., 1997) were subsequently used
for iterative model building and refinement, respectively. The residues of PTH1R-
ECD, which was used as search model in Phaser, were mutated and the linker
connecting ECD with MBP were added during iterative refinement and build cycles.
Restrained refinement was used in Refmac5 to refine the initial models. Waters were
added in the model using Coot. After the model reached an Rfree of 25% the
subsequent refinements were performed using Translation, Libration and Screw (TLS)
and restrained refinement in Refmac5 (Winn et al., 2001). The radius of convergence
can be increased by adding restraints like rigid-body refinement, density averaging
(Kleywegt and Read, 1997), non-crystallographic symmetry constraints (Kleywegt,
1996) and torsion-space refinement (Rice and BrüNger, 1994) to the model. In small
molecular crystallography, thermal parameters are refined anisotropically (6 thermal
parameters per atom), owing to a small number of atoms and a favourable parameters
to reflection ratio. However, in protein crystallography, only isotropic thermal
refinement is possible for medium resolution structures. TLS parameterization,
however, provides an ideal compromise between the two cases and a true

Chapter 3. Materials and methods
52
representation of the model would be possible. It assumes regions/domains in the
protein to behave as a pseudo-rigid body. It, therefore, considers collective rather than
independent atomic variables to represent the model to reduce the refinement
parameters. The entire model was divided into two TLS groups for performing the
TLS refinement. Based on the knowledge of other MBP-ECD structures (Pioszak et
al., 2008, Pioszak and Xu, 2008) MBP and maltose were kept as one TLS group while
the ECD was made the second TLS group. The residue in the linker region between
MBP and ECD which displayed a sharp bend was chosen as the junction point of the
two TLS groups. All other hetero atoms were excluded from TLS refinement.
ANISOU factors were generated, after the final round of refinement, using TLSANL
(Howlin et al., 1993). The geometry of the final model was verified using
PROCHECK (Laskowski et al., 1993).
3.4 PEPTIDE BINDING ASSAY
The binding of PAC1R with a 35 residue PACAP peptide was analysed using
the histidine detection kit of AlphaScreen luminescent proximity assay from
PerkinElmer, Fig. 3.2. All binding assays were performed without cleaving the MBP
tag from the receptor ECD to ensure maximum correlation between the observed
structure and the functional assays.
a b
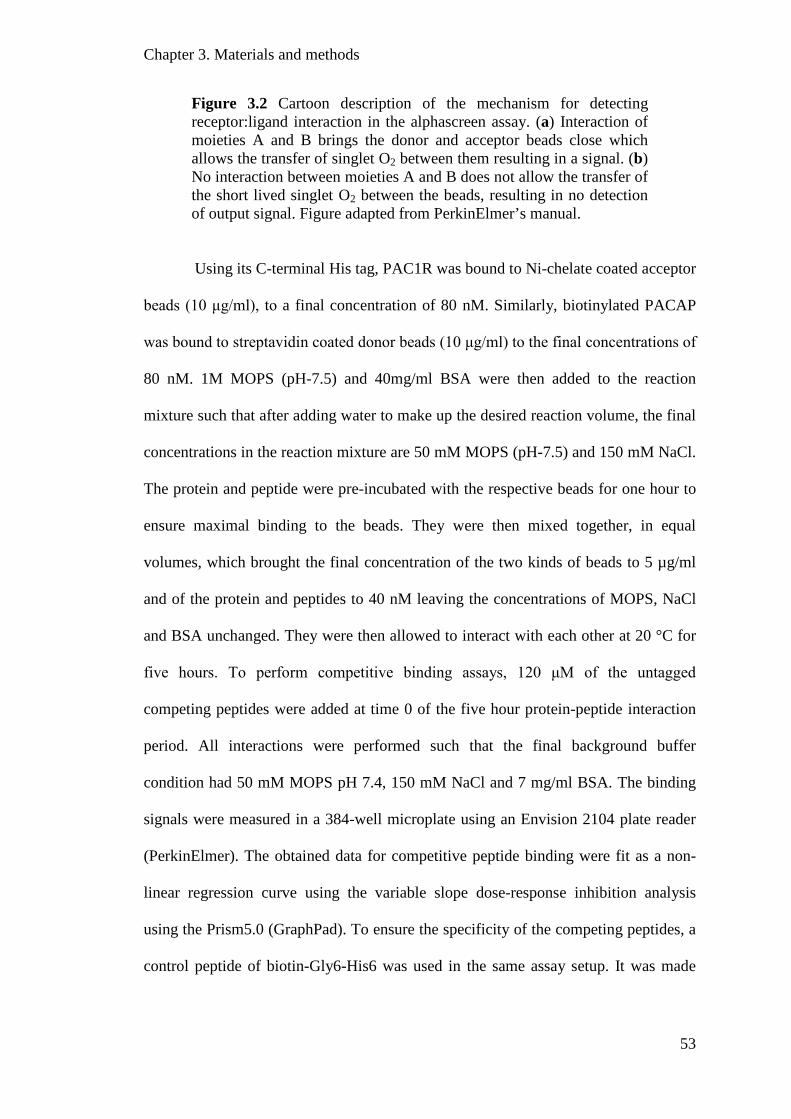
Chapter 3. Materials and methods
53
Figure 3.2 Cartoon description of the mechanism for detecting receptor:ligand interaction in the alphascreen assay. (a) Interaction of moieties A and B brings the donor and acceptor beads close which allows the transfer of singlet O2 between them resulting in a signal. (b) No interaction between moieties A and B does not allow the transfer of the short lived singlet O2 between the beads, resulting in no detection of output signal. Figure adapted from PerkinElmer’s manual.
Using its C-terminal His tag, PAC1R was bound to Ni-chelate coated acceptor
beads (10 μg/ml), to a final concentration of 80 nM. Similarly, biotinylated PACAP
was bound to streptavidin coated donor beads (10 μg/ml) to the final concentrations of
80 nM. 1M MOPS (pH-7.5) and 40mg/ml BSA were then added to the reaction
mixture such that after adding water to make up the desired reaction volume, the final
concentrations in the reaction mixture are 50 mM MOPS (pH-7.5) and 150 mM NaCl.
The protein and peptide were pre-incubated with the respective beads for one hour to
ensure maximal binding to the beads. They were then mixed together, in equal
volumes, which brought the final concentration of the two kinds of beads to 5 µg/ml
and of the protein and peptides to 40 nM leaving the concentrations of MOPS, NaCl
and BSA unchanged. They were then allowed to interact with each other at 20 °C for
five hours. To perform competitive binding assays, 120 μM of the untagged
competing peptides were added at time 0 of the five hour protein-peptide interaction
period. All interactions were performed such that the final background buffer
condition had 50 mM MOPS pH 7.4, 150 mM NaCl and 7 mg/ml BSA. The binding
signals were measured in a 384-well microplate using an Envision 2104 plate reader
(PerkinElmer). The obtained data for competitive peptide binding were fit as a non-
linear regression curve using the variable slope dose-response inhibition analysis
using the Prism5.0 (GraphPad). To ensure the specificity of the competing peptides, a
control peptide of biotin-Gly6-His6 was used in the same assay setup. It was made

Chapter 3. Materials and methods
54
sure that the competing peptide, at concentrations even higher than those used in the
actual assay, does not affect the binding signal of the control peptide.
3.5 DOCKING OF PACAP8-27 TO PAC1R-ECD
The coordinates of PACAP (residues 8-27, hereafter PACAP8-27) were
obtained from the NMR structure of the micelle bound form of the peptide (PDB
code:2d2p). A course grid, covering the entire PAC1R-ECD, was used in a blind
search for the binding site of the rigid peptide (Table 3.1). The grid box was kept
large enough to allow Autodock 4.2 (Morris et al., 2009) to search all possible ECD
interacting orientations.
Table 3.1. Grid parameters used for AutoGrid during the initial blind search for the peptide binding site.
Grid Parameters Description
npts 126 117 112 # num.grid points in xyz
gridfld 3N94ECD_ss_noaltconfig.maps.fld # grid_data_file
spacing 0.269444444444 # spacing(A)
receptor_types A C HD N OA SA # receptor atom types
ligand_types A C OA N SA HD # ligand atom types
receptor 3N94ECD_ss_noaltconfig.pdbqt # macromolecule
gridcenter 2.567 12.875 -8.029 # xyz-coordinates or auto
smooth 0.5
# store minimum energy w/in
rad(A)
map 3N94ECD_ss_noaltconfig.A.map # atom-specific affinity map
map 3N94ECD_ss_noaltconfig.C.map # atom-specific affinity map
map 3N94ECD_ss_noaltconfig.OA.map # atom-specific affinity map
map 3N94ECD_ss_noaltconfig.N.map # atom-specific affinity map
map 3N94ECD_ss_noaltconfig.SA.map # atom-specific affinity map
map 3N94ECD_ss_noaltconfig.HD.map # atom-specific affinity map
elecmap 3N94ECD_ss_noaltconfig.e.map # electrostatic potential map

Chapter 3. Materials and methods
55
dsolvmap 3N94ECD_ss_noaltconfig.d.map # desolvation potential map
dielectric -0.1465
# <0, AD4 distance-dep.diel;>0,
constant
The Lamarkian GA was used as the search algorithm to locate the peptide
docking site. 100 GA runs, having a population size of 300, were performed before
clustering the obtained solutions (Table 3.2). The top cluster having rank 1 comprised
of 23/100 solutions, the highest among the 10 obtained clusters. In this cluster,
PACAP was positioned at the same site as in other class B GPCR:ligand complex
structures.
Table 3.2. Docking parameter file describing the parameters used to
perform the Lamarkian Genetic Algorithm search in AutoDock4.2.
Docking Parameter Description
tran0 random # initial coordinates/A or random
axisangle0 random # initial orientation
dihe0 random # initial dihedrals (relative) or random
tstep 2.0 # translation step/A
qstep 50.0 # quaternion step/deg
dstep 50.0 # torsion step/deg
torsdof 90 # torsional degrees of freedom
rmstol 2.0 # cluster_tolerance/A
extnrg 1000.0 # external grid energy
e0max 0.0 10000 # max initial energy; max number of retries
ga_pop_size 300 # number of individuals in population
ga_num_evals 2500000 # maximum number of energy evaluations
ga_num_generations
27000 # maximum number of generations
ga_elitism 1 # number of top individuals to survive to next

Chapter 3. Materials and methods
56
generation
ga_mutation_rate 0.02 # rate of gene mutation
ga_crossover_rate 0.8 # rate of crossover
ga_window_size 10 #
ga_cauchy_alpha 0.0 # Alpha parameter of Cauchy distribution
ga_cauchy_beta 1.0 # Beta parameter Cauchy distribution
set_ga # set the above parameters for GA or LGA
sw_max_its 300 # iterations of Solis & Wets local search
sw_max_succ 4 # consecutive successes before changing rho
sw_max_fail 4 # consecutive failures before changing rho
sw_rho 1.0 # size of local search space to sample
sw_lb_rho 0.01 # lower bound on rho
ls_search_freq 0.06 # probability of performing local search on
individual
set_psw1 # set the above pseudo-Solis & Wets
parameters
unbound_model bound # state of unbound ligand
ga_run 50 # do this many hybrid GA-LS runs
analysis # perform a ranked cluster analysis
The grid was then made finer and smaller. The new grid was still made to
cover the entire face of ECD where PACAP docked in the first run. The bonds in the
side chains of Lys20'and Tyr13' in PACAP8-27 were made rotatable to allow for a
better fit. This yielded a total of 7 rotatable bonds. The new run was performed using
a search criterion similar to the first run except that the number of GA runs was raised
to 200. Guided by the knowledge of the other ECD:peptide complex structures, a
cluster with rank 5 (among 17) was chosen as the proposed model.

57
CHAPTER 4. RESULTS
4.1 PROTEIN PRODUCTION
The extracellular domain (ECD, residues 21-153) of human PAC1R was
expressed in Origami B (DE3) cells. All members of the class B GPCRs have six
conserved cysteines (Fig. 4.1). These six conserved cysteines form three disulphide
bridges as discussed in the previously solved GIP1R structure (Parthier et al., 2007).
These disulphide bridges hold the conformation of ECD tightly, with minimum
structural flexibility. In addition to the conserved cysteines, PAC1R has one more
cysteine residue at a non-conserved position.
To avoid any unessential or misformed disulphide bond, the non-conserved
Cys25 was mutated to either serine or alanine in all our constructs. The gene for the
variable lengths of human the PAC1R ECD used for all experiments was cloned
downstream of the maltose binding protein (MBP) tag in the multiple cloning site 1
(MCS1) of the pETDuet-1 vector. In summary, the final expressed protein was MBP-
NAAAEF-PAC1R-H6, which contains the underlined linker between MBP and the
main protein. A bacterial disulphide bond chaperone (DsbC) was cloned in MCS2 of
the vector to assist proper folding of the protein of interest during expression. The
protein was purified with affinity chromatography using affinity tags at both ends.
This was essential to ensure the removal of prematurely truncated proteins, which
arise due to the translational stops that are common when human proteins are
expressed in E. coli. In addition, having affinity tags at both ends also prevents co-
purification of truncation products, which could be formed during or after cell lysis.
The recombinant protein was first purified using Ni-chelation chromatography and
then followed by amylose column purification.

Chapter 4. Results
58
Figure 4.1. Multiple sequence alignment of all class B GPCR ECDs. The invariant residues are shown in white with black background. Conserved residues are shown in bold inside black bordered box. The alignment clearly shows that all ECDs have six conserved cysteines. PAC1R has one extra cysteine at position 25 which was mutated to alanine (PAC1Rs numbering). Alignment was performed with MAFFT (http://www.ebi.ac.uk/Tools/mafft/) and the figure was prepared using ESPript (Gouet et al., 1999).

Chapter 4. Results
59
4.1.1 Disulphide shuffling
(a) (b)
Figure 4.2. Native gel of the re-shuffling conditions incubated at (a) 20 °C and (b) 4 °C. Lane 1 is DsbC + 1mM GSH and 1mM GSSG. Lanes 2-7 of (a) are conditions i-vi from above. (b) Lane 8 contains DsbC. Lanes 9-14 are conditions i-vi mentioned above. Lane 15 is the protein without performing any re-shuffling. Lane 16 is the protein incubated with 2mM DTT for 30 mins. prior to loading. Red bordered boxes indicate DsbC and the black bordered boxes indicate single conformation of PAC1R-ECD.
Analysis of all the lanes in fig 4.2 showed that lane 6 gave the best results.
Lane 6 has only a single band of PAC1R-ECD (indicated by black bordered box). In
addition, there are no smears or minor bands of a different conformation similar to the
band of the major conformation. All the other lanes, except lane 7, showed the
presence of small amounts of heterogenous conformation. The only bands of
heterogenous conformation in lane 6 were at a level of very high molecular weight.
These can easily be separated using size exclusion chromatography (SEC). Lane 16
shows a completely reduced conformation of PAC1R-ECD which migrates slower on
the native PAGE due to its relaxed conformation.
High protein purity is a primary prerequisite for crystallization. Also, equally
pivotal for crystallization is the conformational homogeneity of a sample. Proteins,

Chapter 4. Results
60
being conformationally flexible and dynamic, can fold into more than one
conformation. Proteins expressed recombinantly in foreign hosts have a higher
tendency to misfold due to non-native micro-environment and mechanisms of protein
processing. Therefore, in order to check the conformational homogeneity of PAC1R,
5 µg of the protein was run in a Native PAGE. The sample showed a smear, which
clearly confirmed the presence of multiple conformations. This smearing was
attributed to misformation of disulphide bonds. To assure proper protein folding, an in
vitro re-shuffling of disulphide bonds was performed. The refolded protein was
further purified using size exclusion chromatography to separate minute amounts of
non-homogenous conformations. The gel filtration profile gave a comparatively much
larger peak at the size of a monomer and relatively small (approximately 20% of the
larger peak) peak at a very high molecular weight range, which, when analysed on
native PAGE, appeared to be non-homogenous high molecular weight aggregates
(Figs. 4.3 and 4.5).
The conformational homogeneity of the finally obtained protein was analysed
in non-reducing native PAGE for improvements during the steps of purification and
disulphide reshuffling (Fig. 4.4). It is apparent that initially the protein had multiple
conformations and appeared as a smear in native PAGE but after refolding it gives a
single band with no smear. The ability of all molecules in the protein sample to
migrate together in a native PAGE indicates its conformational homogeneity, which,
in turn, is indicative of this conformation being the global minimum in the energy
landscape of all possible conformations.

Chapter 4. Results
61
(a) (b)
(c) (d)
Figure 4.3. Chromatograms of PAC1R purification. (a) Ni-chelate affinity column1 (b) Amylose affinity column (c) Ni-chelate affinity column 2 (d) Size-exclusion chromatography column.
(a) (b)
Figure 4.4. (a) Native PAGE of MBP-PAC1R-H6 during various stages of purification. The lanes are labelled. Homogenous conformation of the protein sample could not be obtained without reshuffling its disulphide bonds. The few bands of less intensity in the lane containing Ni-column 2 elute were separated from the major band of much larger intensity by size exclusion chromatography. (b) SDS-

Chapter 4. Results
62
PAGE of the SEC column fractions. Lanes 1-8 are from the first, minor, peak which show some high molecular weight contaminants. Lanes 9-14 are from the second, major, peak which show approximately >95% pure protein.
The homogeneity and quality of the final protein after SEC was judged by the
native PAGE in Fig 4.5.
Figure 4.5. Native PAGE of the SEC fractions. The final SEC peak is completely conformationally homogenous.
4.2 HORMONE BINDING ASSAY
Further verification of the quality of the final protein was performed by
analysing its activity and comparing it with the previously reported values of ligand
affinity. The AlphaScreen assay (PerkinElmer), which provides an elegant way of
measuring IC50 values, was used to test the activity of the protein. IC50 is the measure
of the ability of a compound to inhibit the biological or biochemical activity of a
protein molecule. It is an important criterion to evaluate and compare the
pharmacokinetics of different compounds in the drug development industries. The
IC50 value of a compound is defined as the half maximal concentration required to
inhibit a biological or biochemical function. In an AlphaScreen assay setup a labelled

Chapter 4. Results
63
peptide / ligand and its receptor can be immobilized onto donor and acceptor beads.
The proximity of the two beads upon receptor:peptide interaction can then be assayed.
An unlabelled peptide, when added, then competes for binding with the immobilized
peptides, at the receptor’s active site, thus, inhibiting the signal. Plotting the dose-
response curve for the unlabelled peptide gives its IC50 value. Higher values of IC50
would typically mean low affinity and vice versa.
Figure 4.6. Interaction of B-PACAP with MBP-PACAP(25-140)-H6 assayed using alphascreen. Concentration of B-PACAP was kept constant at 40nM while the concentration of the MBP-PACAP(25-140)-H6 was increased from 40nM to 202.3nM with an increment of 1.5 times each. Photon counts are plotted on the y-axis. As the concentration of the receptor increases the binding signal also increases and then reaches saturation.
The ability of the C-terminal domain of PACAP to bind the ECD (in
accordance with the two domain model) was first tested to ensure the functional
activity of the receptor. Fig. 4.6 shows the concentration dependant interaction of
PACAP with PAC1R ECD. In this experiment, the concentration of biotin-PACAP
(residues 6-38) was kept constant at 40 nM in all reaction conditions. The
concentration of MBP-PAC1R(25-140)-H6 was increased as 40, 60, 90, 135 and 200
nM. The ability of the peptide:receptor complex to form a complex in a concentration
dependant manner and then to reach saturation at higher amounts indicates that the

Chapter 4. Results
64
purified protein is functional and retains its biochemical activity. Furthermore, the
pattern was also indicative of the fact that the signal recorded in this setup of
Alphascreen assay had little contribution from any non-specific interaction between
the donor and acceptor beads.
Figure 4.7. Competitive Alphascreen assay with unlabelled PACAP as a competitor for binding to 40 nM biotin-PACAP (6-38)-NH2 and 40 nM MBP-PAC1R (25-140)-His6 in the presence of 5 μg/ml beads. Dashed, dotted and solid curves represent un-labelled PACAP (8-38), PACAP (12-27) and PACAP (15-31) as competitors, respectively.
Biotin-PACAP(6-38) binds with the ECD, bringing the donor and acceptor
beads close to each other. In the Alphascreen assay, the proximity of the beads gives a
maximal signal. Due to the nature of the assay, the intensity of the signal by itself is
not an accurate indicator of the affinity of the peptide with the hormone. Nevertheless,
the assay provides an elegant setup to test the ability of inhibitors to inhibit this
interaction in a concentration dependent manner. This ability allows the Alphascreen
assay to be used to estimate the affinity of an inhibitor towards its receptor.
Unlabelled ligands can be used to compete with labelled ligands for interaction with a
receptor and act as inhibitors of the measured signal. Different truncations of PACAP,
each still retaining the essential ECD binding region, were used to compete for

Chapter 4. Results
65
binding with the ECD to draw a dose response inhibition curve, Fig 4.7. This allowed
more rigorous analysis of the binding pattern of the peptide ligands.
The concentration of competing ligands that was required to bring half-
maximal inhibition were used to calculate IC50 values using GraphpadPrism 5.0. The
obtained IC50 values are summarised in Table 4.1.
Table 4.1. Summary of the IC50 values of PACAP 8-38, 12-27 and 15-31. The indicated peptides were used to compete with labelled MBP-ECD and PACAP6-38 to obtain dose response curves.
PACAP8-38 PACAP12-27 PACAP15-31
LogIC50 -5.647 -5.232 -5.132 IC50 2.25E-06 5.86E-06 7.38E-06 Degrees of
Freedom 30 30 30
R² 0.9513 0.9915 0.9788 Absolute Sum of
Squares 1930 383.5 975.8
Number of points analyzed
33 33 33
The IC50 values of different truncations were very similar to each other. This
correlates with previous studies, which have indicated that this region contributes
towards affinity of receptor interaction, as reviewed by (Vaudry et al., 2009). Gradual
truncation of the N-terminus of a peptide ligand also gradually decreases the affinity
of the hormone for the receptor. The obtained values of IC50 for MBP-PAC1R (25-
140)-H6 were in the range of 1-10 µM, which also correlates well with similar values
from other class B GPCR ECDs (Parthier et al., 2007).
4.3 CRYSTALLIZATION OF PAC1R
MBP-PAC1R (25-140)-H6 was crystallized at 20 °C by the vapour diffusion
hanging drop method. The initial conditions for crystallization were identified using

Chapter 4. Results
66
commercial screens from Hampton Research, Qiagen and Jena Biosciences. The final
crystals used for structure determination were grown using a grid screen based on
condition D9 of the Jena Biosciences JCSG++L sparse matrix screen, with 25.5%
PEG4000, 15% glycerol and 170 mM ammonium sulphate. These components, in the
grid screen, were varied one at a time while keeping the other parameters constant.
PEG4000, glycerol and ammonium sulphate were varied from 20-28%, 10-17% and
120-200mM, respectively to optimize the size and shape of the crystals.
Figure 4.8. Crystals of MBP-PAC1R (25-140)-H6 grown in 25.5% PEG4000, 15% glycerol and 170 mM ammonium sulphate at 20 °C using the vapour diffusion hanging drop technique.
The crystals appeared after three days and grew in size for about a week. The
best diffraction quality crystals were obtained by picking the one week old crystals
and soaking them in fresh reservoir solution for about two to three days. Crystals
grew as a cluster of thick needles or plates joined in the middle and radiating out in all
directions (Fig 4.8). Single crystals were separated from the cluster. The
crystallization solution itself, with its high concentrations of glycerol and PEG 4000,
acted as a cryo-protectant. A crystal of suitable size was flash-cooled in liquid N2.
Diffraction data (360° data with 1° oscillation per frame) were collected at beamline
LS-CAT 21ID-F at the Advance Photon Source in Argonne National Laboratory.

Chapter 4. Results
67
4.4 STRUCTURE OF MBP-PAC1R (25-140)-H6
4.4.1 Crystal packing
The structure of MBP-PAC1R(25-140)-H6 was solved in the P212121 space
group. The data collection, structure determination and refinement statistics are
summarized in Table 4.2. There is one molecule in the asymmetric unit. The solvent
content in the crystal, as determined by Mathew’s coefficient, is 40%. The data were
scaled until a resolution of 1.9 °A using I/σ(I) and Rsym as criteria. MBP, in addition
to being highly soluble, aids in the process of crystallization. MBP has the ability to
make numerous crystal contacts which increases the probability of obtaining crystals
for MBP-tagged proteins.
Table 4.2. Data collection, structure determination and refinement details. Values in parentheses are for the last shell (1.98-1.9 Å).
Space group P212121 Unit-cell parameters (Å): a = 45.98, b = 92.15, c = 105.41 Data collection
Wavelength (Å) 0.98972 Resolution range (Å) 50.0-1.9 Total no. of observed reflections 579,761 Total no. of unique reflections 42,645 Redundancy 13.6 (12.0) Completeness (%) 100 (100) Rsym
a 0.090 (0.570) Overall I/σ(I) 28.8 (4.7)
Structure determination
Method Molecular replacement Model PDB ID: 3C4M
Refinement Resolution range (Å) 50.0-1.9 Rwork
b 0.176 Rfree
c 0.216 RMSD bond lengths (Å) 0.020 RMSD bond angles (º) 1.7 Average B-factors (Å2): Protein atoms (5724 atoms) 34.04
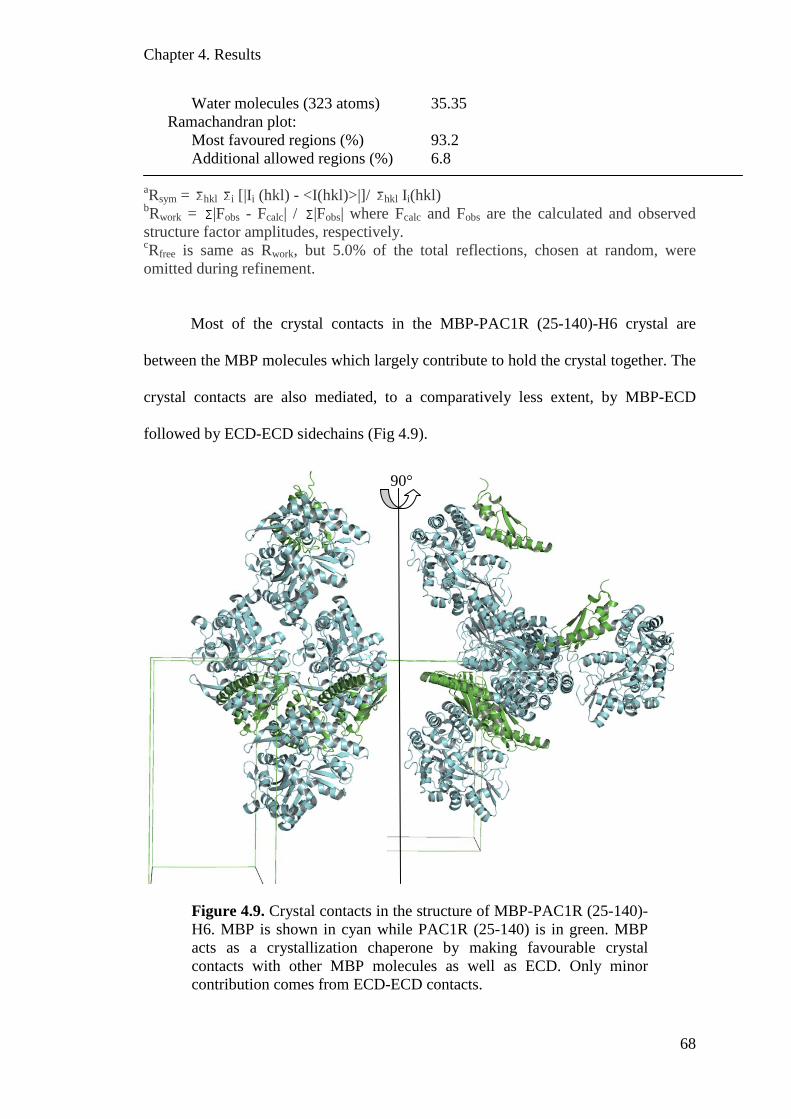
Chapter 4. Results
68
Water molecules (323 atoms) 35.35 Ramachandran plot: Most favoured regions (%) 93.2 Additional allowed regions (%) 6.8
aRsym = hkl i [|Ii (hkl) - <I(hkl)>|]/ hkl Ii(hkl) bRwork = |Fobs - Fcalc| / |Fobs| where Fcalc and Fobs are the calculated and observed structure factor amplitudes, respectively. cRfree is same as Rwork, but 5.0% of the total reflections, chosen at random, were omitted during refinement.
Most of the crystal contacts in the MBP-PAC1R (25-140)-H6 crystal are
between the MBP molecules which largely contribute to hold the crystal together. The
crystal contacts are also mediated, to a comparatively less extent, by MBP-ECD
followed by ECD-ECD sidechains (Fig 4.9).
Figure 4.9. Crystal contacts in the structure of MBP-PAC1R (25-140)-H6. MBP is shown in cyan while PAC1R (25-140) is in green. MBP acts as a crystallization chaperone by making favourable crystal contacts with other MBP molecules as well as ECD. Only minor contribution comes from ECD-ECD contacts.
90°

Chapter 4. Results
69
The flexibility of the linker between MBP and ECD is also very crucial for the
formation of crystal. Gradual truncation of the N-terminal portion of the ECD had to
be performed in order to find a construct that allowed favourable flexibility. Several
truncations of the N-terminal portion (from 21 to 26) were tried. Cys25 was mutated
to either Ala or Ser using the QuickChange site-directed mutagenesis kit (Stratagene).
Altering the length of the N-terminal portion of the receptor changes the helical
propensity of the polypeptide stretch comprising the C-terminal helix of MBP, linker
between MBP and ECD, and the N-terminal helix of ECD. This can be gauged by the
fact that while the structures of 3 different truncation constructs gave no apparent
differences in the structures of MBP or ECD, the relative orientation of these two
domains was different. PAC1R 30-150-H6 had two molecules in the ASU in which
the relative orientation of MBP and ECD was different in the two molecules. PAC1R
26-140, on the other hand, formed a contiguous and straight helix extending from the
C-terminal helix of MBP to the N-terminal helix of ECD, which included the 5 amino
acid linker between them. The best data and structure was ultimately obtained with
PAC1R 25-140, and this was ultimately used to interpret the structural features of
PAC1R-ECD. This protein packed in the crystal such that the contiguous helix
extended from MBP to ECD but with a sharp bend in the linker, bringing the ECD
close to the MBP domain.

Chapter 4. Results
70
4.4.2 Fold of PAC1R-ECD
Figure 4.10. Cartoon representation of the overall fold of PAC1R-ECD. The three disulphide bonds are shown as sticks. Major structural elements are labelled.
The overall crystal structure of PAC1R (Fig. 4.10) is very similar to other
previously determined ECD structures of CRFR1 (Pioszak et al., 2008), GLP1R
(Runge et al., 2008), GIP1R (Parthier et al., 2007) and PTH1R (Pioszak and Xu,
2008). The three conserved disulphide bonds hold the core of the PAC1R polypeptide
together in a sandwich like configuration (Parthier et al., 2007). The N terminus starts
with an α-helix that begins from Ala25 and continues until Asn48. This is followed by
a short anti-parallel β sheet, held below the helix by a disulphide bridge. This is
sandwiched from below by another anti-parallel β-sheet and held by a disulphide
bond that bridges β5 to the loop just preceding β1. The orientation of the loop
between β3 and β4, relative to α-helix 2, is constrained by the third disulphide bridge
between Cys77 and Cys113. The loop between β3 and β4 contains two 310 helices.
The sequentially invariant amino acids (Fig. 4.1), among the class B GPCR ECDs
(apart from the disulphide bonded cysteines), Asp59, Trp64, Pro78, Gly101 and
Trp102, are placed in the structural core of PAC1R (Fig 4.11).

Chapter 4. Results
71
Figure 4.11. Superimposition of the sequentially conserved amino acids in the class B GPCR. Only the backbone of PAC1R is traced in green, for clarity. The residues of Gip1R (black, PDB code:2QKH), Glp1R (red, PDB code:3C5T), PAC1R (green, PDB code:3N94) and VIP2R (blue, PDB code:2X57) align remarkably well, depicting structural conservation, in spite of the absence of high sequential conservation in the family.
The structure is further stabilized by an important interaction cluster formed
by Asp59, Trp64, Val93, Arg95, Trp102 and Tyr109 (Figs. 4.11 and 4.12). Most of
the residues in this cluster, Asp59, Trp64, Arg95, Trp102, are highly conserved.
Residues Val93 and Tyr109 of this cluster are sequentially less conserved but still
appear to make very important interactions.

Chapter 4. Results
72
Figure 4.12. Stereo image of the electron density of the residues that form an important interaction cluster, which holds the core of the ECD together, in addition to the three disulphide bonds. Arg95 and Asp59 make an important salt bridge, which is absent in most other ECD structures.
Particularly, Tyr109 bends inward to contribute to hydrophobic interactions at
the core through its aromatic ring while making a hydrogen bond with Asp59 through
its hydroxyl group. Asp59, with its side chain bends towards the β-turn below helix 1,
making important contacts with the backbone amides of Asn60, Ile61 and Thr62, to
form a β-turn. Although the side chain of Asp59 bends towards the β-turn, it is still
able to make a salt bridge with Arg95. This salt bridge is not observed in GIP1R and
PTH1R. This is possible because the long side-chain of Arg95 is pushed down and
towards Asp59 by the protruding side-chain of Met57. Furthermore, an interesting
feature is that the peptidyl-prolyl bond at Phe106 is in the cis conformation. It

Chapter 4. Results
73
interacts with the backbone amide of Ser94, causing a turn at Pro107, just before the
beginning of helix 2, thus, constraining its orientation further, in addition to the third
disulphide bridge.
The conserved residues overlap remarkably well in the structural alignment
(Figs. 4.11 and 4.13), depicting their importance in holding the core domain together.
The side chains of Arg95 (of PAC1R) and the corresponding lysine in VIP2R are
positioned differently. Conformation of the conserved Asp(59) of VIP2R is slightly
different when compared with other class B structures. This difference might be due
to its interaction with a non VIP2R residue from an NCS partner rather than an
inherent difference in the VIP2R structure. The different conformation of Arg95 in
PAC1R brings it close to this conserved Asp, allowing the formation of a salt bridge
between them which is absent in other structures. Formation of this salt bridge
between residues from strands β1 and β4 provides additional stability to the core fold
which is evident from the low B-factors in this region (Fig. 4.14).
Superimposition of the PAC1R crystal structure with that of other class B
GPCRs (Fig. 4.13) depicts that the sandwich fold is well conserved in this family,
even though sequence alignment of the family members shows relatively less
conservation (Fig. 4.1).

Chapter 4. Results
74
Figure 4.13. Superimposition of the backbone of the ECD of class B members GIP1R (black, PDB code:2QKH), GLP1R (red, PDB code:3C5T), PAC1R (green, PDB code:3N94) and VIP2R (blue, PDB code:2X57). The disulphide bridges C34-C63, C54-C97 and C77-C113 are labelled.
In addition, the B-factor plot of PAC1R does not show any region of large
conformational flexibility (Fig. 4.14). The B-factor for Cα residues throughout the
ECD polypeptide is low, which is indicative of a stable conformation. High B-factors
can be seen only for 3 amino acids at the C-terminus due to terminal flexibility.
Figure 4.14 B-factor plot of PAC1R-ECD. The B-factors are indicated using a colour spectrum ranging from dark blue for 19.5 to red for 64.1 Å2.

Chapter 4. Results
75
4.4.3 Molecular determinants of PAC1R:PACAP interaction
In accordance with the studies on the effects of N-terminal PACAP
truncations on PAC1R binding and adenylate cyclase activation (Hou et al., 1994) and
the two domain model of receptor activation (Hoare, 2005) the C-terminal domain of
PACAP is sufficient to bind the receptor ECD. Furthermore, in the absence of
experimental conformation of the binding of PACAP truncations to the isolated
receptor ECD, Alphascreen assays with different PACAP truncations were performed
to test a sufficient interaction region (Fig 4.7). Although, the three different peptides
that were used had minor differences in receptor binding, they still showed adequate
interaction. One of the peptides among these was chosen for alanine scan analysis to
test for the molecular determinants of receptor binding.
To determine the contribution of each amino acid for receptor interaction,
every residue of PACAP (15-31) was mutated to alanine, one at a time. The residues
that were alanine or glycine in the wild type peptide were left unchanged. The
peptides having the mutated residue were used to compete with the wild type peptide
for binding (Fig. 4.15).
Figure 4.15. Alanine scan Alphascreen of PACAP (15-31). The bar with no peptide for competition gives the maximum signal. Addition of

Chapter 4. Results
76
the wild type peptide as competitor reduces the signal to almost zero. Some of the mutant peptides are unable to compete with the wild type peptide for binding to the receptor and are, therefore, unable reduce the Alphascreen signal.
The assay identified three Ala mutations that affect the binding to PAC1R the most.
The K20A' mutation almost completely abolishes the ability of the peptide to bind the
receptor ECD. The other important residues for binding are Lue27' and Val19'. This
suggests that the major contribution to binding comes from a possible ionic
interaction while other hydrophobic interactions might contribute to increase the
binding capacity of the peptide. In the case of PTH1R and GIP1R also, the authors
observe that the interaction of the receptor ECD and the corresponding peptide is
mediated by positively charged residues on the peptide with further assistance from
hydrophobic interactions. Due to the nature of the assay, in which high concentrations
of the competing peptides are being used, there is a possibility that minor effects of
the mutations will not be detected and only the large effects get detected. Therefore,
although there is a possibility of getting false negatives in this assay, there is almost
no possibility of obtaining a false positive signal. Lowering the concentration of the
competing peptides would give signal for minor changes as well but would also
simultaneously increase the possibility of false positives. Hence, in order to preferably
avoid false positives, in lieu of false negatives, only high concentrations of the
competing peptides were used.
4.4.4 Peptide docking to receptor ECD
Based on the results of the alanine scan, we tried to discern the mechanism of
PACAP binding. AutoDock4.2 (Morris et al., 2009) offers a good means for searching
all possible configurations and calculating the binding energy of the peptide and ECD.

Chapter 4. Results
77
To obtain a sterically and electrostatically plausible orientation of PACAP, we
initially started with a blind search for the peptide binding site in our structure using
the essential region (residues 8-27) of the PACAP structure (residues 1-38, PDBId:
2D2P) in AutoDock 4.2. Guided by the putative peptide binding site, a solution of the
blind search was chosen for further examination. The sidechains of the peptide
residues at the interface with ECD were then made flexible and the search was
repeated using a finer grid. The results were consistent with the hypothesis that
PACAP 8-27 docks with PAC1R at the putative binding site, as observed in other
ECD:hormone complex structures.
Figure 4.16. Stereo view of the peptide:ECD interface. The PACAP peptide is represented in cyan while the ECD is represented in green. Important sidechains are labelled. The distance between E104 and K20' is 2.6 Å, indicating an ionic interaction between them.

Chapter 4. Results
78
The docking results correlate well with those of the Alphascreen assay. The
PACAP residues that are identified to be important for binding, according to the
assay, are oriented towards the ECD (Fig. 4.16). Val19' and Leu27' make hydrophobic
interactions with the ECD. More importantly, Lys20' makes a salt bridge with Glu104
of the ECD. This important interaction appears to explain the ability of the K20A'
mutation to almost completely abrogate the peptide binding.
(a) (b)
Figure 4.17. (a) Alphascreen assay of mutations in PAC1R affect the binding to PACAP. All the mutations were made on the outer surface of the receptor so that the structural core of PAC1R is unaffected. The mutants and the wildtype receptor ECDs were assayed for interaction with biotin-PACAP (6-38) at increasing equimolar concentration to enable the reading of the assay to reach saturation. (b) The location of the mutated residues on the surface of PAC1R ECD. ECD is coloured in green while the side chains of the mutated residues are shown as blue sticks.
This interaction between the receptor and the peptide implies that mutating
E104 should also affect PACAP binding in a reciprocal manner. Fig. 4.17 shows that
the E104R mutation of the PAC1R ECD does reduce its binding to PACAP in an
Alphascreen assay. In contrast, mutation in the surface hydrophobic residue (F84A)
does not affect PACAP binding (Fig. 4.17). The point mutations are on the surface of
the ECD and, therefore, are not expected to affect the fold of the protein. F84A acts as

Chapter 4. Results
79
a control to show that mutation of the residues that do not appear to make contacts
with the receptor in the docking model do not affect peptide interaction in the assay.
F110A affects PACAP binding, but to an extent much less than E104R. The side-
chain of F110 is oriented such that it forms the surface of the hydrophobic cluster,
which has been implicated for ligand binding in other structures as well. Mutating
F110 to alanine shows slight reduction in binding, thus, supporting its role in
hydrophobic interactions with the peptide. Together, these data support the docking
model of PACAP binding to the PAC1R ECD.
80
CHAPTER 5. DISCUSSION
GPCRs have been implicated in a variety of cellular processes. As regulators
of extracellular signal transduction their modulation can result in significant effects in
cellular functions. Among the major classes of GPCRs, class B has proven to be the
most structurally elusive, as no full length structure is yet available. The only
available structures are those of partial domains of class B GPCRs. One of these
domains, the N-terminal extracellular domain (ECD), has attracted significant interest
as it is the site of hormone recognition. Attempts have been made to understand this
process at the extracellular surface. In the absence of a structure of a full length
receptor, structural studies on hormone recognition have been concentrated on the
ECD. From the various studies on the PTH-calcitonin chimeras (Bergwitz et al.,
1996) and the receptors for glucagon and glucagon-like peptide (Runge et al., 2003,
Runge et al., 2003), the role of ECD in ligand recognition has been well established.
In addition, photo-affinity crosslinking studies on PTH (Gensure et al., 2003) and
similar studies with CRFR1 (Assil-Kishawi and Abou-Samra, 2002) have displayed
the role of juxtamembrane domains (J domain) in binding to the N-terminal region of
the ligand. From all these studies, the ‘two-domain’ model of hormone binding has
emerged. According to this model, the C-terminus of the ligand first interacts with the
receptor ECD. This creates an ‘affinity trap’, which then allows the N-terminus of the
ligand to interact with the J-domain (Fig. 5.1). Interaction with the J-domain activates
the receptor and leads to downstream signalling. Molecular modelling has provided
some insight into the possible interactions of PTH1 with the J-domain of its receptor
(Monticelli et al., 2002). The NMR structure of the receptor bound form of PACAP
shows a β-turn in the N-terminal region (Inooka et al., 2001). This prompts the fact

Chapter 5. Discussion
81
that the precise structural features of interactions at the J-domain might vary for
different hormones, based on their sequence variation. Moreover, peptide hormones
are thought to be unstructured in aqueous solution. Structural studies of isolated
peptide hormones are impossible without the addition of either structure inducing
polar solvents or the creation of membrane like environments using lipids. Molecular
modelling has been employed using Class A structures to understand how peptides
dock to the receptor (Ceraudo et al., 2008, Gensure et al., 2005). The previously
reported ECD:hormone complex structures show a continuous α-helical structure in
the C-terminal region of peptide. These studies suggest that peptide hormones adopt a
mainly helical structure, only in the membrane environment or when binding to the
ECD and remain largely unstructured in the extracellular matrix. The amphipathic
nature of the peptide helices also supports this conjecture. In addition, N-terminal
helix capping residues have also been suggested to facilitate receptor activation upon
ligand docking (Neumann et al., 2008). Therefore, the mechanism of hormone
binding to the receptor is considered to have contributions form hydrophobic burial of
amphipathic helix its cooperative folding and helical propensity. Sequence variation
among the peptides can provide a wide variation of these factors and is thought to
contribute to the specificity and selectivity of ECD:hormone interaction. The precise
mechanism, however, is further complicated by the possible oligomerization of
receptors under native conditions. A Recent study explains the mechanism of GPCR
dimerization which is disrupted upon ligand binding (Pioszak et al., 2010).
Furthermore, some studies elucidate the mechanism of receptor activity modifying
proteins (RAMPs) in hormone binding (ter Haar et al., 2010).
However, the hormone recognition of PAC1R has remained controversial as a
different binding mode has been suggested for it. In addition, a slight variation in the

Chapter 5. Discussion
82
otherwise conserved ECD fold has been suggested in the case of PAC1R (Sun et al.,
2007). The conflicting reports do not enable us to unite the mechanism of peptide
binding and GPCR activation and, therefore, produce a gap in our understanding of
class B GPCR biochemistry. Investigations on this discrepancy have been attempted
in this thesis.
The fold of PAC1R has been revealed by a crystal structure of the PAC1R
ECD at 1.9 Å resolution. Even though the NMR structure of PAC1R has been
highlighted to have certain unique features among this class of receptors, there have
been some differing views (Parthier et al., 2009). The crystal structure of PAC1R
ECD reveals the same overall fold as of other class B GPCR ECDs. In our X-ray
crystallographic structure, PAC1R follows the conserved α+β fold as seen for other
GPCRs of this class (Fig. 4.10). This fold is similar to the glucagon/VIP family due to
the presence of a C-terminal helix. The previously reported NMR structure of PAC1R
differs in the Cα tracing between β3 and β4 and a different topology of disulfide bond
arrangement, as discussed in a review earlier (Parthier et al., 2009). While
crystallographic structures enable us to observe only a snapshot of a dynamic protein
structure, NMR structures have the ability to capture the dynamics in solution.
However, the NMR structure of PAC1R is unlikely to be an alternate conformation in
solution. Such an arrangement would be impossible without the disruption of the
Cys77-Cys113 disulphide bond. The conformation of ~120 amino acid long ECDs is
restrained by three conserved disulphide bonds. Of these, one disulphide linkage is
between Cys77, in the Cα trace between β3 and β4, and Cys113 in α-helix 2. The
presence of this disulphide bond restrains the conformation of the region between β3
and β4, making local conformational flexibility extremely unlikely. Moreover, the Cα
atoms in the β3 and β4 loop have been recognised to be very important for ligand
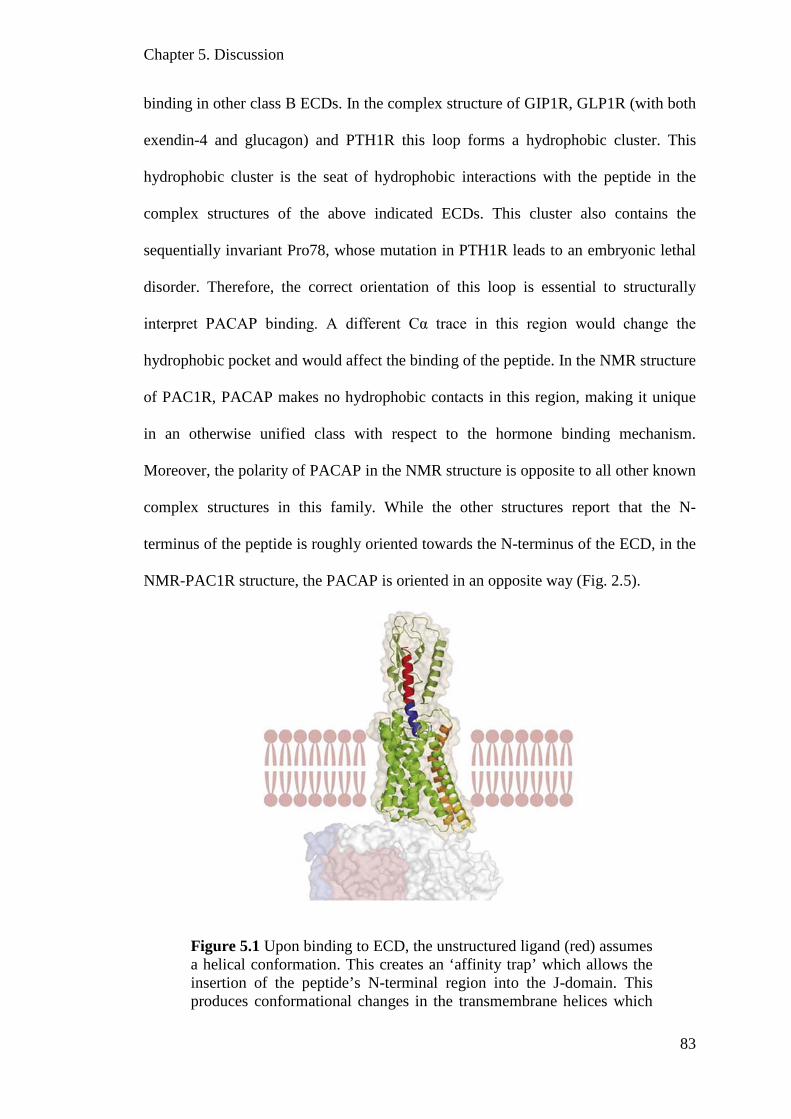
Chapter 5. Discussion
83
binding in other class B ECDs. In the complex structure of GIP1R, GLP1R (with both
exendin-4 and glucagon) and PTH1R this loop forms a hydrophobic cluster. This
hydrophobic cluster is the seat of hydrophobic interactions with the peptide in the
complex structures of the above indicated ECDs. This cluster also contains the
sequentially invariant Pro78, whose mutation in PTH1R leads to an embryonic lethal
disorder. Therefore, the correct orientation of this loop is essential to structurally
interpret PACAP binding. A different Cα trace in this region would change the
hydrophobic pocket and would affect the binding of the peptide. In the NMR structure
of PAC1R, PACAP makes no hydrophobic contacts in this region, making it unique
in an otherwise unified class with respect to the hormone binding mechanism.
Moreover, the polarity of PACAP in the NMR structure is opposite to all other known
complex structures in this family. While the other structures report that the N-
terminus of the peptide is roughly oriented towards the N-terminus of the ECD, in the
NMR-PAC1R structure, the PACAP is oriented in an opposite way (Fig. 2.5).
Figure 5.1 Upon binding to ECD, the unstructured ligand (red) assumes a helical conformation. This creates an ‘affinity trap’ which allows the insertion of the peptide’s N-terminal region into the J-domain. This produces conformational changes in the transmembrane helices which
Chapter 5. Discussion
84
leads to the activation of the GPCR. The model has been made from the structure of transmembrane helices of opsin (PDB code: 3DQB) (Scheerer et al., 2008) and the ECD of GIP1R (PDB code: 2QKH) (Parthier et al., 2009). It has been proposed before that the N-terminal domain might also be able to
act as an endogenous ligand (Dong et al., 2006). The mechanism suggested for it
postulates that structural changes upon ligand binding might expose an intrinsic
epitope corresponding to the tri-peptide Trp-Asp-Asn in the secretin receptor. Similar,
mechanism has also been proposed for other members of the family having the
corresponding Trp-Asp-Asn sequence. PAC1R also possesses this tri-peptide at
position Trp58-Asp59-Asn60. From our structure it is very clear that Aps59 is tightly
constrained with an intra-molecular salt bridge. On one side it forms a contact with
the backbone amide of Thr62 while on the other side it forms a salt bridge with the
terminal N of Arg95. Arg95 itself is very tightly constrained with both its side-chain
N atoms, involving in forming contacts. The N atom, on the other side of Asp59,
forms a hydrogen bond with the carboxyl group of the peptide bond between Ser103
and Glu104. This constrains the arrangement in this region to a very tight
conformation. It appears hard, from this structural point of view, that ligand binding
could expose the endogenous epitope as the ΔG cost would be too high. Further
experimental corroboration would be required to accept the endogenous epitope
mechanism.
Studying the properties and mechanisms of receptors are greatly simplified by
the use of, preferably, non-peptide agonists/antagonists. Non-peptide antagonists are
available for CRF1, CGRP, glucagon and GLP-1 receptors and have greatly aided in
their study. Non-peptide antagonists can act by directly binding at the peptide binding
site or allosterically by binding at a different site. In the case of CRFR1, the non-
peptide antagonist binds to the J-domain (Hoare et al., 2004). Antagonists can also

Chapter 5. Discussion
85
interact with RAMPs, as with CGRP and its inhibitor BIBN4096BS, to regulate
receptor activation (Mallee et al., 2002). On the other hand, in GLP1R, with which
PAC1R shares high sequence similarity, the antagonist T-0632 binds to the ECD and
inhibits the binding of the peptide allosterically (Tibaduiza et al., 2001). The most
important use of non-peptide antagonists is the ability to modify them for pathway
specific inhibition. Such inhibitors promise the ability to provide deep insight into the
pathway selectivity of receptor activation. The importance of the availability of high
resolution structures cannot be over emphasized for the design and engineering of
inhibitors with desired properties.
Based on our crystal structure and the docking results, we propose a model for
the PACAP binding to PAC1R which complies with the two domain model. In this
model, the PAC1R ECD adopts the same conserved fold as other class B GPCRs, and
the PACAP peptide adopts as a single helix that docks into the similar peptide binding
site as observed in GLP1 and PTH peptides. This model highlights several critical
features that are supported by structures and biology of Class B GPCRs. First, PAC1R
belongs to the same subfamily of receptors as glucagon and GLP1. Thus, it is
expected that their ECDs adopt the same topology in their structures as confirmed by
their crystal structures (Runge et al., 2008, Underwood et al., 2009). Second, PACAP
also shares high degree sequence homology to glucagon and GLP1. Given this
conservation and the conserved fold in their receptor ECD structures, it is reasonable
to predict that PACAP adopts the same binding mode as GLP1 (Underwood et al.,
2009), thereby allowing its N-terminal residues to face the receptor TM domain to
activate the receptor. Finally, the proposed model is consistent with the mutagenesis
data, including the PACAP alanine scanning peptides and mutation in the PAC1R
ECD, particularly the K20A' and E104R, respectively. These mutations stress a

Chapter 5. Discussion
86
charge complementary mechanism for the binding of PACAP to PAC1R. The same
charge complementary mechanism has also been revealed for a number of Class B
GPCRs, including PTH1R, GLP1R, and CRFR1. Together, the results from the
structural, biochemical, and modelling studies highlight a consensus structural fold
and mechanism of hormone recognition by Class B GPCRs, and should have
important implications in hormone binding by several other members of Class B
GPCRs, whose structures are yet to be determined.

87
REFERENCES
Assil-Kishawi, I. and Abou-Samra, A.B. (2002). Sauvagine Cross-links to the Second Extracellular Loop of the Corticotropin-releasing Factor Type 1 Receptor. Journal of Biological Chemistry, 277, 32558-32561.
Bailey, S. (1994). The CCP4 suite- Programs for protein crystallogrpahy. Acta
Crystallographica Section D-Biological Crystallography, 50, 760-763. Bergwitz, C., Gardella, T.J., Flannery, M.R., Potts, J.T., Kronenberg, H.M., Goldring,
S.R. and Jüppner, H. (1996). Full Activation of Chimeric Receptors by Hybrids between Parathyroid Hormone and Calcitonin. Journal of Biological Chemistry, 271, 26469-26472.
Brabet, P., Diriong, S., Journot, L., Bockaert, J. and Taviaux, S. (1996). Localization
of the Human Pituitary Adenylate Cyclase-Activating Polypeptide Receptor (PACAP1-R) Gene to 7p15-p14 by Fluorescencein SituHybridization. Genomics, 38, 100-102.
Buscail, L., Gourlet, P., Cauvin, A., De Neef, P., Gossen, D., Arimura, A., Miyata, A.,
Coy, D.H., Robberecht, P. and Christophe, J. (1990). Presence of highly selective receptors for PACAP (pituitary adenylate cyclase activating peptide) in membranes from the rat pancreatic acinar cell line AR 4-2J. Febs Letters, 262, 77-81.
Buscail, L., Gourlet, P., Cauvin, A., Deneef, P., Gossen, D., Arimura, A., Miyata, A.,
Coy, D.H., Robberecht, P. and Christophe, J. (1990). Presence of highly selective receptors for PACAP (Pituitary Adenylate-Cyclase Activating Peptide) in membranes from the Rat pancreatic acinar cell-line AR-4-2J. Febs Letters, 262, 77-81.
Cauvin, A., Buscail, L., Gourlet, P., Deneef, P., Gossen, D., Arimura, A., Miyata, A.,
Coy, D.H., Robberecht, P. and Christophe, J. (1990). The novel VIP-like hupothalamic polypeptide PACAP interacts with high-affinity receptors in the human neuroblastoma cell-line NB-OK. Peptides, 11, 773-777.
Cauvin, A., Robberecht, P., De Neef, P., Gourlet, P., Vandermeers, A., Vandermeers-
Piret, M.-C. and Christophe, J. (1991). Properties and distribution of receptors for pituitary adenylate cyclase activating peptide (PACAP) in rat brain and spinal cord. Regulatory Peptides, 35, 161-173.
Ceraudo, E., Murail, S., Tan, Y.-V., Lacapere, J.-J., Neumann, J.-M., Couvineau, A.
and Laburthe, M. (2008). The Vasoactive Intestinal Peptide (VIP) {alpha}-Helix Up to C Terminus Interacts with the N-Terminal Ectodomain of the Human VIP/Pituitary Adenylate Cyclase-Activating Peptide 1 Receptor: Photoaffinity, Molecular Modeling, and Dynamics. Mol Endocrinol, 22, 147-155.

References
88
Dautzenberg, Mevenkamp, Wille and Hauger (1999). N-Terminal Splice Variants of the Type I PACAP Receptor: Isolation, Characterization and Ligand Binding/Selectivity Determinants. Journal of Neuroendocrinology, 11, 941-949.
Dickson, L. and Finlayson, K. (2009). VPAC and PAC receptors: From ligands to
function. Pharmacology & Therapeutics, 121, 294-316. Dong, M., Pinon, D.I., Asmann, Y.W. and Miller, L.J. (2006). Possible Endogenous
Agonist Mechanism for the Activation of Secretin Family G Protein-Coupled Receptors. Molecular Pharmacology, 70, 206-213.
Emsley, P., Lohkamp, B., Scott, W.G. and Cowtan, K. (2010). Features and
development of Coot. Acta Crystallographica Section D-Biological Crystallography, 66, 486-501.
Ewald, P. (1969). Introduction to the dynamical theory of X-ray diffraction. Acta
Crystallographica Section A, 25, 103-108. Fredriksson, R., Lagerstrom, M.C., Lundin, L.G. and Schioth, H.B. (2003). The G-
protein-coupled receptors in the human genome form five main families. Phylogenetic analysis, paralogon groups, and fingerprints. Molecular Pharmacology, 63, 1256-1272.
Gensure, R.C., Gardella, T.J. and Jüppner, H. (2005). Parathyroid hormone and
parathyroid hormone-related peptide, and their receptors. Biochemical and Biophysical Research Communications, 328, 666-678.
Gensure, R.C., Shimizu, N., Tsang, J. and Gardella, T.J. (2003). Identification of a
Contact Site for Residue 19 of Parathyroid Hormone (PTH) and PTH-Related Protein Analogs in Transmembrane Domain Two of the Type 1 PTH Receptor. Mol Endocrinol, 17, 2647-2658.
Gilman, A.G. (1987). G-PROTEINS - TRANSDUCERS OF RECEPTOR-
GENERATED SIGNALS. Annual Review of Biochemistry, 56, 615-649. Gottschall, P.E., Tatsuno, I., Miyata, A. and Arimura, A. (1990). Characterization and
distribution of binding-sites for the hypothalamic peptide,Pituitary Adenylate Cyclase-Activating Polypeptide. Endocrinology, 127, 272-277.
Gouet, P., Courcelle, E., Stuart, D.I. and Métoz, F. (1999). ESPript: analysis of
multiple sequence alignments in PostScript. Bioinformatics, 15, 305-308. Hahn, T., ed. International Tables for Crystallography Volume A: Space-group
symmetry. 2006, International Union of Crystallography. Hashimoto, H., Nogi, H., Mori, K., Ohishi, H., Shigemoto, R., Yamamoto, K.,
Matsuda, T., Mizuno, N., Nagata, S. and Baba, A. (1996). Distribution of the mRNA for a pituitary adenylate cyclase-activating polypeptide receptor in the

References
89
rat brain: An in situ hybridization study. The Journal of Comparative Neurology, 371, 567-577.
Hepler, J.R. and Gilman, A.G. (1992). G-PROTEINS. Trends in Biochemical
Sciences, 17, 383-387. Hoare, S.R.J. (2005). Mechanisms of peptide and nonpeptide ligand binding to class
B G-protein coupled receptors. Drug Discovery Today, 10, 417-427. Hoare, S.R.J., Sullivan, S.K., Schwarz, D.A., Ling, N., Vale, W.W., Crowe, P.D. and
Grigoriadis, D.E. (2004). Ligand Affinity for Amino-Terminal and Juxtamembrane Domains of the Corticotropin Releasing Factor Type I Receptor: Regulation by G-Protein and Nonpeptide Antagonists. Biochemistry, 43, 3996-4011.
Holland, P.W.H., Garciafernandez, J., Williams, N.A. and Sidow, A. (1994). Gene
duplications and the origins of vertebrate development. Development, 125-133.
Hou, X., Vandermeers, A., Gourlet, P., Vandermeers-Piret, M.C. and Robberecht, P.
(1994). Structural requirements for the occupancy of rat brain PACAP receptors and adenylate cyclase activation. Neuropharmacology, 33, 1189-1195.
Howlin, B., Butler, S.A., Moss, D.S., Harris, G.W. and Driessen, H.P.C. (1993).
TLSANL: TLS parameter-analysis program for segmented anisotropic refinement of macromolecular structures. Journal of Applied Crystallography, 26, 622-624.
Inooka, H., Ohtaki, T., Kitahara, O., Ikegami, T., Endo, S., Kitada, C., Ogi, K., Onda,
H., Fujino, M. and Shirakawa, M. (2001). Conformation of a peptide ligand bound to its G-protein coupled receptor. Nat Struct Mol Biol, 8, 161-165.
Ji, T.H., Grossmann, M. and Ji, I.H. (1998). G protein-coupled receptors I. Diversity
of receptor-ligand interactions. Journal of Biological Chemistry, 273, 17299-17302.
Jones, M.B., Siderovski, D.R. and Hooks, S.B. (2004). The G beta gamma dimer as a
novel source of selectivity in G-protein signaling: GGL-ing at convention. Molecular Interventions, 4, 200-214.
Kleywegt, G. (1996). Use of Non-crystallographic Symmetry in Protein Structure
Refinement. Acta Crystallographica Section D, 52, 842-857. Kleywegt, G.J. and Read, R.J. (1997). Not your average density. Structure, 5, 1557-
1569. Lam, H.C., Takahashi, K., Ghatei, M.A., Kanse, S.M., Polak, J.M. and Bloom, S.R.
(1990). Binding sites of a novel neuropeptide pituitary-adenylate-cyclase-

References
90
activating polypeptide in the rat brain and lung. European Journal of Biochemistry, 193, 725-729.
Laskowski, R.A., Macarthur, M.W., Moss, D.S. and Thornton, J.M. (1993).
PROCHECK - A program to check the sterechemical quality of protein structures. Journal of Applied Crystallography, 26, 283-291.
Levitzki, A. (1986). BETA-ADRENERGIC RECEPTORS AND THEIR MODE OF
COUPLING TO ADENYLATE-CYCLASE. Physiological Reviews, 66, 819-854.
Lutz, E.M., Ronaldson, E., Shaw, P., Johnson, M.S., Holland, P.J. and Mitchell, R.
(2006). Characterization of novel splice variants of the PAC1 receptor in human neuroblastoma cells: Consequences for signaling by VIP and PACAP. Molecular and Cellular Neuroscience, 31, 193-209.
Mallee, J.J., Salvatore, C.A., LeBourdelles, B., Oliver, K.R., Longmore, J., Koblan,
K.S. and Kane, S.A. (2002). Receptor Activity-modifying Protein 1 Determines the Species Selectivity of Non-peptide CGRP Receptor Antagonists. Journal of Biological Chemistry, 277, 14294-14298.
Martin, J.-L., Feinstein, D.L., Yu, N., Sorg, O., Rossier, C. and Magistretti, P.J.
(1992). VIP receptor subtypes in mouse cerebral cortex: evidence for a differnntial localization in astrocytes, microvessels and synaptosomal membranes. Brain Research, 587, 1-12.
Masuo, Y., Ohtaki, T., Masuda, Y., Nagai, Y., Suno, M., Tsuda, M. and Fujino, M.
(1991). Autoradiographic distribution of pituitary adenylate cyclase activating polypeptide (PACAP) binding sites in the rat brain. Neuroscience Letters, 126, 103-106.
Masuo, Y., Ohtaki, T., Masuda, Y., Tsuda, M. and Fujino, M. (1992). Binding sites
for pituitary adenyloate cyclase activating polypeptide (PACAP): comparison with vasoactive intestinal polypeptide (VIP) binding site localization in rat brain sections. Brain Research, 575, 113-123.
McCoy, A.J., Grosse-Kunstleve, R.W., Adams, P.D., Winn, M.D., Storoni, L.C. and
Read, R.J. (2007). Phaser crystallographic software. Journal of Applied Crystallography, 40, 658-674.
Miyata, A., Arimura, A., Dahl, R.R., Minamino, N., Uehara, A., Jiang, L., Culler,
M.D. and Coy, D.H. (1989). Isolation of a novel-38 residue-hypothalamic polypeptide which stimulates Adenylate-Cyclase in Pituitary-cells. Biochemical and Biophysical Research Communications, 164, 567-574.
Möhler, H. and Fritschy, J.-M. (1999). GABAB receptors make it to the top - as
dimers. Trends in Pharmacological Sciences, 20, 87-89.

References
91
Monticelli, L., Mammi, S. and Mierke, D.F. (2002). Molecular characterization of a ligand-tethered parathyroid hormone receptor. Biophysical Chemistry, 95, 165-172.
Morris, G.M., Huey, R., Lindstrom, W., Sanner, M.F., Belew, R.K., Goodsell, D.S.
and Olson, A.J. (2009). AutoDock4 and AutoDockTools4: Automated docking with selective receptor flexibility. Journal of Computational Chemistry, 30, 2785-2791.
Murshudov, G.N., Vagin, A.A. and Dodson, E.J. (1997). Refinement of
macromolecular structures by the maximum-likelihood method. Acta Crystallographica Section D-Biological Crystallography, 53, 240-255.
Neumann, J.-M., Couvineau, A., Murail, S., Lacapère, J.-J., Jamin, N. and Laburthe,
M. (2008). Class-B GPCR activation: is ligand helix-capping the key? Trends in Biochemical Sciences, 33, 314-319.
Nomura, M., Ueta, Y., Serino, R., Kabashima, N., Shibuya, I. and Yamashita, H.
(1996). PACAP type I receptor gene expression in the paraventricular and supraoptic nuclei of rats. NeuroReport, 8, 67-70.
Ohno, S., ed. Evolution by gene duplication. 1970, Springer-Verlag: New York. Ohtaki, T., Watanabe, T., Ishibashi, Y., Kitada, C., Tsuda, M., Gottschall, P.E.,
Arimura, A. and Fujino, M. (1990). Molecular identification of receptor for pituitary adenylate cyclase activating polypeptide. Biochemical and Biophysical Research Communications, 171, 838-844.
Otto, C., Zuschratter, W., Gass, P. and Schütz, G. (1999). Presynaptic localization of
the PACAP-typeI-receptor in hippocampal and cerebellar mossy fibres. Molecular Brain Research, 66, 163-174.
Otwinowski, Z. and Minor, W., Processing of X-ray diffraction data collected in
oscillation mode, in Macromolecular Crystallography, Pt A. 1997. p. 307-326. Padilla, J.E. and Yeates, T.O. (2003). A statistic for local intensity differences:
robustness to anisotropy and pseudo-centering and utility for detecting twinning. Acta Crystallographica Section D, 59, 1124-1130.
Palczewski, K., Kumasaka, T., Hori, T., Behnke, C.A., Motoshima, H., Fox, B.A., Le
Trong, I., Teller, D.C., Okada, T., Stenkamp, R.E., Yamamoto, M. and Miyano, M. (2000). Crystal structure of rhodopsin: A G protein-coupled receptor. Science, 289, 739-745.
Pannu, N.S. and Read, R.J. (1996). Improved Structure Refinement Through
Maximum Likelihood. Acta Crystallographica Section A, 52, 659-668. Parthier, C., Kleinschmidt, M., Neumann, P., Rudolph, R., Manhart, S., Schlenzig, D.,
Fanghanel, J., Rahfeld, J.U., Demuth, H.U. and Stubbs, M.T. (2007). Crystal structure of the incretin-bound extracellular domain of a G protein-coupled

References
92
receptor. Proceedings of the National Academy of Sciences of the United States of America, 104, 13942-13947.
Parthier, C., Reedtz-Runge, S., Rudolph, R. and Stubbs, M.T. (2009). Passing the
baton in class B GPCRs: peptide hormone activation via helix induction? Trends Biochem Sci, 34, 303-10.
Patterson, A.L. (1934). A Fourier Series Method for the Determination of the
Components of Interatomic Distances in Crystals. Physical Review, 46, 372. PebayPeyroula, E., Rummel, G., Rosenbusch, J.P. and Landau, E.M. (1997). X-ray
structure of bacteriorhodopsin at 2.5 angstroms from microcrystals grown in lipidic cubic phases. Science, 277, 1676-1681.
Pioszak, A.A., Harikumar, K.G., Parker, N.R., Miller, L.J. and Xu, H.E. (2010).
Dimeric Arrangement of the Parathyroid Hormone Receptor and a Structural Mechanism for Ligand-induced Dissociation. Journal of Biological Chemistry, 285, 12435-12444.
Pioszak, A.A., Parker, N.R., Suino-Powell, K. and Xu, H.E. (2008). Molecular
Recognition of Corticotropin-releasing Factor by Its G-protein-coupled Receptor CRFR1. Journal of Biological Chemistry, 283, 32900-32912.
Pioszak, A.A. and Xu, H.E. (2008). Molecular recognition of parathyroid hormone by
its G protein-coupled receptor. Proceedings of the National Academy of Sciences, 105, 5034-5039.
Pisegna, J.R. and Wank, S.A. (1993). Molecular cloning and functional expression of
the pituitary adenylate cyclase-activating polypeptide type I receptor. Proceedings of the National Academy of Sciences of the United States of America, 90, 6345-6349.
Potterton, E., Briggs, P., Turkenburg, M. and Dodson, E. (2003). A graphical user
interface to the CCP4 program suite. Acta Crystallographica Section D-Biological Crystallography, 59, 1131-1137.
Rice, L.M. and BrüNger, A.T. (1994). Torsion angle dynamics: Reduced variable
conformational sampling enhances crystallographic structure refinement. Proteins: Structure, Function, and Bioinformatics, 19, 277-290.
Rodbell, M., Birnbaum.L, Pohl, S.L. and Krans, H.M.J. (1971). GLUCAGON-
SENSITIVE ADENYL CYCLASE SYSTEM IN PLASMA MEMBRANES OF RAT LIVER .5. OBLIGATORY ROLE OF GUANYL NUCLEOTIDES IN GLUCAGON ACTION. Journal of Biological Chemistry, 246, 1877-&.
Rodríguez-Henche, N., Jamen, F., Leroy, C., Bockaert, J. and Brabet, P. (2002).
Transcription of the mouse PAC1 receptor gene: cell-specific expression and regulation by Zac1. Biochimica et Biophysica Acta (BBA) - Gene Structure and Expression, 1576, 157-162.

References
93
Ross, E.M. and Gilman, A.G. (1977). RESOLUTION OF SOME COMPONENTS OF ADENYLATE-CYCLASE NECESSARY FOR CATALYTIC ACTIVITY. Journal of Biological Chemistry, 252, 6966-6969.
Rossmann, M.G. and Blow, D.M. (1962). The detection of sub-units within the
crystallographic asymmetric unit. Acta Crystallographica, 15, 24-31. Runge, S., Gram, C., Bräuner-Osborne, H., Madsen, K., Knudsen, L.B. and Wulff,
B.S. (2003). Three Distinct Epitopes on the Extracellular Face of the Glucagon Receptor Determine Specificity for the Glucagon Amino Terminus. Journal of Biological Chemistry, 278, 28005-28010.
Runge, S., Thøgersen, H., Madsen, K., Lau, J. and Rudolph, R. (2008). Crystal
Structure of the Ligand-bound Glucagon-like Peptide-1 Receptor Extracellular Domain. Journal of Biological Chemistry, 283, 11340-11347.
Runge, S., Wulff, B.S., Madsen, K., Bräuner-Osborne, H. and Knudsen, L.B. (2003).
Different domains of the glucagon and glucagon-like peptide-1 receptors provide the critical determinants of ligand selectivity. British Journal of Pharmacology, 138, 787-794.
Rupp, B. (2009). Biomolecular Crystallography: Principles, Practice, and
Application to Structural Biology, Garland Science, New York. Scheerer, P., Park, J.H., Hildebrand, P.W., Kim, Y.J., Krauß, N., Choe, H.-W.,
Hofmann, K.P. and Ernst, O.P. (2008). Crystal structure of opsin in its G-protein-interacting conformation. Nature, 455, 497-502.
Scheerer, P., Park, J.H., Hildebrand, P.W., Kim, Y.J., Krausz, N., Choe, H.-W.,
Hofmann, K.P. and Ernst, O.P. (2008). Crystal structure of opsin in its G-protein-interacting conformation. Nature, 455, 497-502.
Sherwood, N.M., Krueckl, S.L. and McRory, J.E. (2000). The origin and function of
the pituitary adenylate cyclase-activating polypeptide (PACAP)/glucagon superfamily. Endocr. Rev., 21, 619-670.
Shioda, S., Shuto, Y., Somogyvári-Vigh, A., Legradi, G., Onda, H., Coy, D.H.,
Nakajo, S. and Arimura, A. (1997). Localization and gene expression of the receptor for pituitary adenylate cyclase-activating polypeptide in the rat brain. Neuroscience Research, 28, 345-354.
Spongier, D., Waeber, C., Pantaloni, C., Holsboer, F., Bockaert, J., Seeburgt, P.H. and
Journot, L. (1993). Differential signal transduction by five splice variants of the PACAP receptor. Nature, 365, 170-175.
Suda, K., Smith, D.M., Ghatei, M.A. and Bloom, S.R. (1992). Investigation of the
interaction of VIP binding sites with VIP and PACAP in human brain. Neuroscience Letters, 137, 19-23.

References
94
Suda, K., Smith, D.M., Ghatei, M.A., Murphy, J.K. and Bloom, S.R. (1991). Investigation and characterization of receptors for pituitary adenylate cyclase-activating polypeptide in human brain by radioligand binding and chemical cross-linking. Journal Name: Journal of Clinical Endocrinology and Metabolism; (USA); Journal Volume: 72:5, Medium: X; Size: Pages: 958-964.
Sun, C., Song, D., Davis-Taber, R.A., Barrett, L.W., Scott, V.E., Richardson, P.L.,
Pereda-Lopez, A., Uchic, M.E., Solomon, L.R., Lake, M.R., Walter, K.A., Hajduk, P.J. and Olejniczak, E.T. (2007). Solution structure and mutational analysis of pituitary adenylate cyclase-activating polypeptide binding to the extracellular domain of PAC1-RS. Proceedings of the National Academy of Sciences, 104, 7875-7880.
Tatsuno, I., Gottschall, P.E., Köves, K. and Arimura, A. (1990). Demonstration of
specific binding sites for pituitary adenylate cyclase activating polypeptide (PACAP) in rat astrocytes. Biochemical and Biophysical Research Communications, 168, 1027-1033.
ter Haar, E., Koth, C.M., Abdul-Manan, N., Swenson, L., Coll, J.T., Lippke, J.A.,
Lepre, C.A., Garcia-Guzman, M. and Moore, J.M. (2010). Crystal Structure of the Ectodomain Complex of the CGRP Receptor, a Class-B GPCR, Reveals the Site of Drug Antagonism. Structure (London, England : 1993), 18, 1083-1093.
Tesmer, J.J.G. (2010). The quest to understand heterotrimeric G protein signaling.
Nature Structural & Molecular Biology, 17, 650-652. Tesmer, J.J.G., Sunahara, R.K., Gilman, A.G. and Sprang, S.R. (1997). Crystal
structure of the catalytic domains of adenylyl cyclase in a complex with G(s alpha).GTP gamma S. Science, 278, 1907-1916.
Tibaduiza, E.C., Chen, C. and Beinborn, M. (2001). A small molecule ligand of the
glucagon-like peptide 1 receptor targets its amino-terminal hormone binding domain. J Biol Chem, 276, 37787-93.
Tibaduiza, E.C., Chen, C. and Beinborn, M. (2001). A small molecule ligand of the
glucagon-like peptide 1 receptor targets its amino-terminal hormone binding domain. Journal of Biological Chemistry, 276, 37787-37793.
Underwood, C.R., Garibay, P., Knudsen, L.B., Hastrup, S., Peters, G.H., Rudolph, R.
and Reedtz-Runge, S. (2009). Crystal Structure of Glucagon-like Peptide-1 in Complex with the Extracellular Domain of the Glucagon-like Peptide-1 Receptor. Journal of Biological Chemistry, 285, 723-730.
Vaudry, D., Falluel-Morel, A., Bourgault, S., Basille, M., Burel, D., Wurtz, O.,
Fournier, A., Chow, B., Hashimoto, H., Galas, L. and Vaudry, H. (2009). Pituitary adenylate cyclase-activating polypeptide and its receptors: 20 years after the discovery. Pharmacol Rev, 61, 283-357.

References
95
Winn, M.D., Isupov, M.N. and Murshudov, G.N. (2001). Use of TLS parameters to model anisotropic displacements in macromolecular refinement. Acta Crystallographica Section D, 57, 122-133.
Zawilska, J.B., Niewiadomski, P. and Nowak, J.Z. (2003). PAC1 receptors in chick
cerebral cortex: characterization by binding of pituitary adenylate cyclase-activating polypeptide, [125I]-PACAP27. Neuroscience Letters, 338, 155-158.


![Synthesis of CeO2-based core/shell nanoparticles …...The synthesis of the core/shell nanoparticles was reported by Kanmani and Ramachandran [18]. Briefly, the prepared MO x nanoparticles](https://img.dokumen.tips/doc/110x75/5f261b274659702f97322079/synthesis-of-ceo2-based-coreshell-nanoparticles-the-synthesis-of-the-coreshell.jpg)