Embed Size (px)
Citation preview

Cryosat-2ProductHandbookBaselineD1.0
C2-LI-ACS-ESL-5319

CryoSat-2ProductHandbook C2-LI-ACS-ESL-5319
P a g e 2 BaselineD1.0draft
TableofContents1 INTRODUCTION ................................................................................................................................................ 6
1.1 PURPOSE AND SCOPE OF THIS USER GUIDE .................................................................................................................. 6 1.2 THE CRYOSAT-2 MISSION AND ITS CHARACTERISTICS ..................................................................................................... 6 1.3 SIMPLIFIED PRINCIPLES OF MODES OF OPERATION ......................................................................................................... 8
1.3.1 Low Resolution Mode .................................................................................................................................... 8 1.3.2 Synthetic Aperture Radar Mode .................................................................................................................... 8 1.3.3 SAR Interferometry Mode ........................................................................................................................... 10
1.4 SIRAL CHARACTERISTICS ....................................................................................................................................... 12 1.5 DATA ACCESS AND DATA PROCESSING TOOLS ............................................................................................................ 13
2 DATA PARAMETERS AND CORRECTIONS ......................................................................................................... 14
2.1 SPACECRAFT ORBIT AND ORIENTATION ..................................................................................................................... 14 2.1.1 Drifting orbit and long repeat cycle ............................................................................................................ 14 2.1.2 Orbit processing .......................................................................................................................................... 15 2.1.3 Reference Frame Processing ....................................................................................................................... 15
2.2 SPACECRAFT TIME AND LOCATION ........................................................................................................................... 18 2.2.1 Reference Ellipsoid ...................................................................................................................................... 18 2.2.2 Some Basic Altimetry Terms ........................................................................................................................ 18 2.2.1 Geoid and Mean Sea Surface ...................................................................................................................... 20 2.2.2 Sea Surface Height Anomaly ....................................................................................................................... 21 2.2.3 Freeboard .................................................................................................................................................... 21 2.2.4 Timestamps ................................................................................................................................................. 21 2.2.5 Latitude, Longitude and Altitude ................................................................................................................. 21 2.2.6 DORIS Ultra Stable Oscillator Drift .............................................................................................................. 21 2.2.7 Satellite Velocity Vector .............................................................................................................................. 22 2.2.8 Reference Orbit ........................................................................................................................................... 22 2.2.9 Ground Tracks ............................................................................................................................................. 22 Illuminated Areas ............................................................................................................................................ 24 2.2.10 ....................................................................................................................................................................... 24
2.3 INSTRUMENT CORRECTIONS AND NOISE .................................................................................................................... 27 2.3.1 Automatic Gain Control .............................................................................................................................. 28 2.3.2 Signal Phase Corrections ............................................................................................................................. 28 2.3.3 Phase Slope Correction ................................................................................................................................ 28 2.3.4 Hamming Weighting Function for SAR Azimuth FFT ................................................................................... 29 2.3.5 Noise ........................................................................................................................................................... 34 2.3.6 Echo Saturation ........................................................................................................................................... 34 2.3.7 Doppler Correction ...................................................................................................................................... 34
2.4 RETRACKING AND PARAMETERS DERIVED FROM ECHO SHAPE ....................................................................................... 34 2.4.1 Range Window and Window Delay ............................................................................................................. 34 2.4.2 Reception Period ......................................................................................................................................... 34 2.4.3 Range Window Sampling ............................................................................................................................ 34 2.4.4 Echo Positioning and Scaling ....................................................................................................................... 37 2.4.5 Retracking ................................................................................................................................................... 37

CryoSat-2ProductHandbook C2-LI-ACS-ESL-5319
P a g e 3 BaselineD1.0draft
2.4.6 Backscattering ............................................................................................................................................ 39 2.4.7 Peakiness ..................................................................................................................................................... 39 2.4.8 Effects of Terrain ......................................................................................................................................... 40 2.4.1 Interferometric Mode .................................................................................................................................. 40 2.4.2 Significant Wave Height .............................................................................................................................. 41 2.4.3 Sea State Bias .............................................................................................................................................. 41 2.4.4 Wind Speed ................................................................................................................................................. 41
2.5 RANGE CORRECTIONS FOR ATMOSPHERIC EFFECTS ..................................................................................................... 41 2.5.1 Dry and Wet Tropospheric Corrections ....................................................................................................... 41 2.5.2 Inverse Barometric Correction .................................................................................................................... 42 2.5.3 Dynamic Atmospheric Correction ................................................................................................................ 42 2.5.4 Ionospheric Correction ................................................................................................................................ 42 2.5.5 Derivation of Corrections ............................................................................................................................ 42 2.5.6 Application of Corrections to Range ............................................................................................................ 43
2.6 RANGE CORRECTIONS FOR TIDAL EFFECTS ................................................................................................................. 43 2.6.1 Ocean Tide .................................................................................................................................................. 43 2.6.2 Ocean Loading Tide ..................................................................................................................................... 43 2.6.3 Solid Earth Tide ........................................................................................................................................... 43 2.6.4 Geocentric Polar Tide .................................................................................................................................. 43 2.6.5 Application of Corrections to Range ............................................................................................................ 44
2.7 DERIVING RANGE ................................................................................................................................................. 44 2.7.1 Geophysical Corrections by Surface ............................................................................................................ 44 2.7.2 Surface Type ................................................................................................................................................ 45 2.7.3 Level-2 Application ...................................................................................................................................... 45
2.8 MODELS USED ..................................................................................................................................................... 46 2.8.1 Static Auxiliary Data Files ............................................................................................................................ 46 2.8.2 Dynamic Auxiliary Data Files ....................................................................................................................... 48
3 CRYOSAT-2 DATA SUPPLY ............................................................................................................................... 50
3.1 CRYOSAT-2 GROUND SYSTEM ................................................................................................................................. 50 3.2 CRYOSAT-2 USER PRODUCTS .................................................................................................................................. 50
3.2.1 Level-2 Geophysical Data Record ................................................................................................................ 50 3.2.2 Freeboard Processing .................................................................................................................................. 50 3.2.3 Slope Correction .......................................................................................................................................... 51 3.2.4 Level-1b Data .............................................................................................................................................. 51 3.2.5 Near Real Time Data ................................................................................................................................... 52 3.2.6 Fast Delivery Marine Mode Data ................................................................................................................ 52
3.3 FILE STRUCTURE ................................................................................................................................................... 52 3.4 FILE NAMING CONVENTION .................................................................................................................................... 53 3.5 OTHER CONVENTIONS ........................................................................................................................................... 54
3.5.1 Latitude and Longitude Limits ..................................................................................................................... 54 3.5.2 Range Correction Sign Convention .............................................................................................................. 55 3.5.3 Timestamp Format ...................................................................................................................................... 55 3.5.4 Time in L2 GDR Records .............................................................................................................................. 55

CryoSat-2ProductHandbook C2-LI-ACS-ESL-5319
P a g e 4 BaselineD1.0draft
4 REFERENCES AND ACRONYMS ........................................................................................................................ 57
4.1 REFERENCE DOCUMENTS ....................................................................................................................................... 57 4.2 ACRONYMS AND ABBREVIATIONS ............................................................................................................................ 58
TableofFigures
Figure1:Examplemodemask,uploadedtoCryoSat-2inApril2011......................................................................8Figure2:Geometryofmeasurementforasingleburst..................................................................................................9Figure3:Geometryofmulti-looking....................................................................................................................................10Figure4:SARinmodeacross-trackangledetermination...........................................................................................11Figure5:ExampleoftracksofCryoSat-2'sorbitoverathree-dayperiod..........................................................14Figure6:SatelliteReferenceFrame.....................................................................................................................................16Figure7:Basicaltimetrytermsandapplicablecorrectionsoveropenocean...................................................20Figure8:Variationoffootprintwithlatitude...................................................................................................................25Figure9:ComparisonofAIRwithandwithoutHammingwindow.......................................................................29Figure10:ComparisonofAIRwithandwithoutHammingwindow(fullrange)............................................30Figure11:Hammingweightingfunction............................................................................................................................31Figure12:AzimuthFFTofasingleburst:thenadirclutteristhe'line'inthemiddle...................................32Figure13:AzimuthFFTofasingleburstwithhamming:thenadirclutterisreduced.................................32Figure14:Stack60withouthamming:heretheparabolaisthenadirclutter..................................................33Figure15:Stack60withhamming:thenadirclutterhasdisappeared................................................................33Figure16:Idealisedpulse-limitedwaveforminwindow...........................................................................................38Figure17:Peakinessbylatitude............................................................................................................................................39Figure18:Proportionofspecularpointsbylatitude....................................................................................................40
TableofTables
Table1:Satellitemaincharacteristics....................................................................................................................................6 Table2:L2retrackers.................................................................................................................................................................37 Table3:Staticauxiliaryfiles....................................................................................................................................................46 Table4:RelevantFileTypes....................................................................................................................................................54

CryoSat-2ProductHandbook C2-LI-ACS-ESL-5319
P a g e 5 BaselineD1.0draft
DocumentChangelogRevision Date DetailsofchangesD1.0 3-APR-2018 BroughtuptodateforBaselineD.

CryoSat-2ProductHandbook C2-LI-ACS-ESL-5319
P a g e 6 BaselineD1.0draft
1 Introduction
1.1 PurposeandScopeofthisProductHandbookThisdocumentisintendedtogiveCryosat-2datausersaconciseoverviewoftheCryosat-2level-2(L2)iceandoceanproducts.ThisrevisionofthedocumenthasbeenreleasedtoaccompanythedeliveryofBaseline-DCryosatproducts.More informationaboutCryosatproductbaselinesmaybe foundherehttps://earth.esa.int/web/guest/missions/cryosat/ipf-baseline.
TheBaseline-Dand laterproducts are in a self-describingnetCDF format, and canbe read into anyprogramthatsupportsreadingnetCDFdata.Thisdocumentisintendedtohelpinunderstandingandusingthecontentsoftheproducts.Foracompletelistofthecontentsandstructureoftheproducts,seetheproductformatdocuments:
• CRYOSATGroundSegmentInstrumentProcessingFacilityL1BProductsSpecificationFormatCS-RS-ACS-GS-5106
• CRYOSATGroundSegmentInstrumentProcessingFacilityL2ProductsSpecificationFormatCS-RS-ACS-GS-5123
A global attribute in the netCDF product named reference_document gives the specific productdocumentIDandrevisionthatappliestothatproduct.
1.2 TheCryosat-2MissionanditscharacteristicsCryosat-2isafour-yearradaraltimetrymission,launchedon8April2010,tomonitorvariationsinthethicknessoftheEarth’smarineicecoverandcontinentalicesheets.Itsprimaryobjectiveistomeasurethe extent of thinning Arctic ice due to climate change. However, beyond the core of the missionobjective,CryoSat-2alsorepresentsavaluablesourceofdatafortheoceanographiccommunity.
TheCryoSat-2satellitereplacestheoriginalCryoSat,whichwaslostduetoalaunchfailureinOctober2005.Itsmaincharacteristicsaresummarizedinthetablebelow:
Table1:Satellitemaincharacteristics
Launch Missionduration Orbit Payload Mass Dimensions
08April2010
Extensionuntil2017approved
- LowEarthOrbit- NonSun-synchronous- Altitude:730km- Inclination:92degree- Repeatcycle:369days
(5344orbits)with30-daysub-cycle
- SARInterferometricRadarALtimeter(SIRAL)
- DORISreceiver- Laserretro-
reflector- 3Startrackers
720kg
4.60m
x
2.4m
x
2.2m

CryoSat-2ProductHandbook C2-LI-ACS-ESL-5319
P a g e 7 BaselineD1.0draft
Fromanaltitudeofjustover700kmandreachinglatitudesof88°,Cryosat-2monitorsprecisechangesinthethicknessofthepolaricesheetsandfloatingseaice.Theobservationsmadeoverthefour-yearlifetime of the mission have provided conclusive evidence of rates at which ice cover may bediminishing.
SIRAL is the primary instrument on-board CryoSat-2 and has extended capabilities to meet themeasurementrequirementsforice-sheetelevationandsea-icefreeboard.
Derivedfromthewell-knownPoseidonoceanaltimeterontheJasonsatellite,SIRALisaverycompactassembly, weighing just 90 kilograms. It combines three measurement modes to determine thetopographyofoceans,landandseaicemasses,aswellasicefloesandsignificantelevationtransitions,especiallybetweenlandandicefields:
Ø Overtheoceansandicesheetinteriors,Cryosat-2generallyoperateslikeatraditionalradaraltimeterinLowResolutionMode(socalledLRM).
Ø Overseaiceandfewoceanographicareas,coherentlytransmittedechoesarecombinedviaSyntheticApertureRadarMode(socalledSARprocessing,toreducetheilluminatedsurfacearea.Thismodeismainlyusedtocarryouthigh-resolutionmeasurementsoffloatingseaiceandlandicesheets,enablingtheindirectmeasurementofthesheets’thickness.
Ø CryoSat's most advancedmode is used around the ice sheetmargins and overmountainglaciers.Here,thealtimeterperformsSyntheticApertureRadarprocessingandusesasecondantennaasaninterferometertodeterminetheacross-trackangletotheearliestradarreturns.Thismode(so-calledSINorSARinprovidestheexactsurfacelocationbeingmeasuredwhenthesurfaceisslopingandcanbeusedtostudymorecontrastedterrains, liketheveryactiveareaslocatedatthejunctionoftheicesheetandtheAntarcticcontinentorGreenland.
Themodeofoperationisselectedfromamaskofgeographicalzones.Themaskisupdatedeverytwoweekstoallowforchangesinseaiceextent.Thegeographicalmaskisconvertedintoaweeklytimelineofinstrumentcommandsbythemissionplanningfacility,takingintoaccounttheCryosat-2referenceorbit. An example of the mode mask, downloaded from the ESA website at the URLhttps://earth.esa.int/web/guest/-/geographical-mode-mask-7107isshowninFigure1.

CryoSat-2ProductHandbook C2-LI-ACS-ESL-5319
P a g e 8 BaselineD1.0draft
Figure1:Examplemodemask
1.3 Simplifiedprinciplesofmodesofoperation
1.3.1 LowResolutionModeConventionalradaraltimetersoperateinpulse-limitedmodeforwhichtheareaofthesurfaceseenbytheinstrumentislimitedbythelengthoftheradarpulsetransmittedbythealtimeter.InCryoSat-2thismodeisoftenreferredtoasLRMasthedatarateismuchlowerthanfortheothermeasurementmodes.Inpulse-limitedmoderadarpulsesaresentatintervalsofabout500µs(~2000Hz)ensuringthatthereturningechoesareuncorrelated.Manyuncorrelatedechoescanbeaveragedtoreducespeckle.Thismodeofmeasurementissuitableovertherelativelysmoothicesheetinteriorsoroverocean(redonFigure1,andalsowherenoothermodeisshown).
1.3.2 SyntheticApertureRadarModeTheSARmode(green inFigure1) ismainlyusedoverrelatively flatareasofsea ice.TheCryoSat-2altimeter sends aburst of pulseswith an interval of only50µs (~20,000Hz)partitioning thepulse-limitedfootprint.Giventhattheobservedsurfaceisinmovementrelativetothesatellite,theechoesreceived by the radar include amix of Doppler frequencies corresponding to all surface directionscoveredbytheradarantennabeam,fromthefronttotheback,seeFigure2.Inthisfigure,only8beamsareshownforclarity(insteadofthe64whicharegenerated)andthedivergenceanglebetweenthemisexaggerated.

CryoSat-2ProductHandbook C2-LI-ACS-ESL-5319
P a g e 9 BaselineD1.0draft
Figure2:Geometryofmeasurementforasingleburst.
Asthereturningechoesarecorrelated,andbytreatingthewholeburstatonce,thedataprocessorcanseparate the echo into64 stripsperpendicular to the trackby exploiting the slight frequency shiftscausedbytheDopplereffect.
Eachstripisabout250mwideandtheintervalbetweenburstsisarrangedsothatthesatellitemovesforwardby80meachtime.Thus,eachgroundlocationislookedmultipletimes(seeFigure3).Inthisfigure,thebluerectangleisthemulti-lookedfootprint.
Thestripslaiddownbysuccessiveburstscanthereforebesuperimposedoneachothertocreateastackofechoeswhichareaveragedtoreducenoise.

CryoSat-2ProductHandbook C2-LI-ACS-ESL-5319
P a g e 1 0 BaselineD1.0draft
Figure3:Geometryofmulti-looking
1.3.3 SARInterferometryModeSARinterferometry,orSINorSARIn,mode(purpleinFigure1)isusedacrossicesheetmarginswheretheicesurfacemaybesloping.SIRALhastwoantennae,mountedabout1mapart,whichreceivetheechoalmostsimultaneously.Iftheechocomesfromanywherebutdirectlybelowthesatellite,thenthereisadifferenceinthepathlengthsofthesignaltravellingtobothantennas.Bycomparingthedifferingsignalphases,theangleofarrivalandhencetheechoorigincanbederived.

CryoSat-2ProductHandbook C2-LI-ACS-ESL-5319
P a g e 1 1 BaselineD1.0draft
If one SIRAL receive chain should fail then the instrument can operate in SINmodewith only onechannel.ThisisreferredtoasSINdegradedmode,orSID.Insteadofinterferometrymethod,theslopemodelintendedforLRMmodeisusedtotrytoimprovetheresultbyestimatingtheacross-trackangle.Alongsidetheseoperatingmodestherearespecificinstrumentcalibrationmodes,thepulseresponsecalibration,thereceivechaincalibrationandtheinterferometricexternalcalibration.Informationfromtheseisfedintothehigher-leveldataproductsandcontainedinthelevel-1bdataproducts.
Furthergeneralinformationisgiveninreferences1,2andespecially3.AnoverviewofSIRALisgiveninreference15.
Figure4:SARinmodeacross-trackangledetermination

CryoSat-2ProductHandbook C2-LI-ACS-ESL-5319
P a g e 1 2 BaselineD1.0draft
1.4 SIRALCharacteristicsRadiofrequency 13.575GHz(singlefrequencyKu-bandradar)
Pulsebandwidth 320MHz(40MHzfortrackingonlyinSIN)
PulseRepetitionFrequency(PRF) 1.97kHzinLRM18.181kHzinSARandinSIN;coherentpulsetransmissionforDopplerprocessing
BurstmodePRF Pulses/burst1970HzinLRM,85.7HzinSARand21.4HzinSIN
N/AinLRM,64inSARandinSIN
Compressedpulselength 3.125ns
Pulseduration 44.8µs
Timing RegularPRFinLRM,burstmodeinSARandSIN
Samplesinecho 128inLRMandSAR,512inSIN
RFpeakpower 25W
Antennasize 2reflectors1.2mx1.1m,side-by-side
Antennabeamwidth(3dB) 1.06º(along-track)x1.1992º(across-track)
Antennafootprint 15km
Rangebinsample 0.2342mforSARandSIN,0.4684mforLRM
Datarate 60kbit/sforLRM,12Mbit/sinSAR,2x12Mbit/sinSIN
Instrumentmass(withantennas) 90kgredundant
Instrumentpower 149W
Trackingcycle 47.17ms(notamultipleofPRF)
Burstrepetition 11.8ms(notamultipleofPRF)
Antennabaselinelength 1167.6mm
Thealong-tracksamplingresolutioninSARandSINmodesisvariablearoundtheorbit.Itis,forexample,278mbasedonanaltitudeof750km, flatEarthandhalfpowerof theazimuthbeam.This is then

CryoSat-2ProductHandbook C2-LI-ACS-ESL-5319
P a g e 1 3 BaselineD1.0draft
affectedbytheazimuthhammingweightingfunctionwhichdegradestheresolution.Thesamplingoftheprocessorisdifferenttotheresolution.WiththeeffectofacurvedEarthinsteadofaflatone,thentheDopplercellwidthonthegroundisabout290malongtrack;however,itisafunctionofaltitude,soitvaries.IncludingalsothebeamwideningeffectofthehammingwindowappliedbeforetheazimuthFFTintheprocessor,thentheeffective"resolution"ofthebeamsiswidenedbyafactorofroughly1.3.Sothe"resolution"(asopposedtosampling)inthealong-trackdirectionismorelike380meters,butthisisplusorminusseveralpercentasthealtitudevaries.
Thewidthintheacross-trackdirectionoftheareaoverwhichechoesarecollectedbytheantenna(theantenna-limited illuminated area) is approximately equal to 15 km since it can be computed as2*h*tan(theta/2)beinghthealtitudeandtheta=1.2°theantennabeamwidthacross-track.Thewidthintheacross-trackdirectionof thearea illuminatedbythe leadingedgeof thepulseuntil thetimethetrailingedgefirstintersectsthesurface(thepulse-limitedilluminatedareaaroundthepointofclosestapproach),incaseofalmostflatsurfaceresponse,isequalto2*sqrt(c*h/B),approximately1.6kmforCryoSat,beingBthepulsebandwidth.
Formoredetails,theinterestedreadermayrefertotheESAwebpageat
http://www.eoportal.org/directory/pres_CryoSat2EarthExplorerOpportunityMission2.html
1.5 DataAccessandDataProcessingToolsAccess to Cryosat-2 data is controlled by a registration system. To register, or to download data ifalreadyregistered,visitESA‘EarthnetOnline’Cryosat-2portalat:
https://earth.esa.int/web/guest/missions/esa-operational-eo-missions/cryosat
AveryusefulwebsiteisESAradaraltimetrytutorialsite,whichincludeslinkstotoolsavailablefordataanalysisaswellasageneraldiscussionofradaraltimetryprinciples:
http://earth.eo.esa.int/brat/
BeginningwithBaselineD,Cryosat-2L1BandL2productsareproducedinstandardnetCDFformats.For older baselines, a set of API routines to read Cryosat-2 data products is available through ESA‘Earthnet Online’ web site under the link under ‘Software Routines’. The API libraries have beensuppliedbyUCLandprovideingestionroutineswritteninANSICandIDLthatcanbeusedtoreadtheL1BandL2Cryosat-2products.Thedownloadpackageincludesareferencemanualandexamples.
All Cryosat-2 science products, available on the Cryosat-2 dissemination server (ftp://science-pds.cryosat.esa.int)areprocessedwiththeDORISpreciseorbitsandaregeneratedwithadelayofabout30daysafterSIRALacquisition.

CryoSat-2ProductHandbook C2-LI-ACS-ESL-5319
P a g e 1 4 BaselineD1.0draft
2 DataparametersandcorrectionsPleasenotethattherelevantfieldsinthedatarecordsarereferencedbytheirvariablenamestakenfromtheBaselineDnetCDFproductsandarepresentedinmonospacedfont.
2.1 SpacecraftOrbitandOrientation
2.1.1 DriftingorbitandlongrepeatcycleThechoiceoftheCryoSat-2orbitistheresultoftradeoffbetweenthedesiredhighdensityofcrossoverpointinordertomeetthemissionrequirementsandtheneedtosufficientlycoverthesouthGreenland.For this, theCryoSat-2'sorbithasameanaltitudeof717kmandahigh inclinationof92°,allowingmeasurementsathighlatitudes(upto88°).Thisorbit isnot-sun-synchronousanddriftsthroughallanglestotheSuninapproximately16months.Furtherinformationisgiveninreference4.
The repeat cycle for Cryosat-2 orbit should be 369 days, corresponding to 5344 revolutions. It ishoweverimportanttonotethattheCryosatorbitdoesnotexactlyrepeataftereachcycle,asitisusually the case for previous ocean-oriented altimetric mission. CryoSat's ascending nodes arerepeating fromcycle to cyclewithin few tenmeters inorder tohave equidistant ascending equatorcrossingsinthereferencegroundtrack.Thedescendingnodesarehowevernolongerequidistantduetoaresidualrotationoftheeccentricityvector.EvenifthisissuehasbeenaddressedaftertheLaunchandEarlyOrbitPhase(LEOP),fluctuationsuptonearly4kmcanstillbeobservedonthedescendingnodefromcycletocycle.
Figure5:ExampleoftracksofCryoSat-2'sorbitoverathree-dayperiod

CryoSat-2ProductHandbook C2-LI-ACS-ESL-5319
P a g e 1 5 BaselineD1.0draft
2.1.2 OrbitprocessingInordertomeasureaccurately,thepositionofthesatellite,CryoSat-2carriessomespecificequipment:
• DORIS (Doppler Orbit and Radiopositioning Integration by Satellite) is a trackingsystem carried by CryoSat-2 to detect and measure the Doppler shift on signalsbroadcastfromanetworkofover50radiobeaconsaroundtheworld.Thesesignalsareusedfororbitdetermination,downtomillimetrelevel,andareessentialforaccuratelymeasuringtheheightoftheicesurface.DORISstandsfor.Thesystemhasbeenusedonpreviousaltimetrymissions. http://www.aviso.oceanobs.com/en/doris/index.html
• Asmalllaserretro-reflectorreflectslightbackinexactlythedirectionitcamefrom.AglobalnetworkoflasertrackingstationsfireshortlaserpulsesatCryoSat-2andtimethe interval before the pulse is reflected back, providing independent referencemeasurementsofCryoSat-2position.The InternationalLaserRangingService(ILRS)provides tracking from its global network of laser ranging stations to support themission.
Themainorbit information fordataprocessing is taken from theDORISPreciseOrbit (POE)or theDORISNavigatorLevel-0Data.
SystematicprocessingreliesonthePOE,whichbecomesavailabletothePayloadDataSystemaround30daysafteracquisition.NearRealTimeprocessingpreferablyusestheDORISNavigatorlevel-0datageneratedon-boardthesatelliteanddownlinkedtogroundduringstationvisibility.
Orbitformatsaredescribedinreferences5and6.
Precise orbital details used during processing of a given dataset are found in the instrumentcharacterizationdatafile,andthenameofthefileusedduringprocessingislistedinthenetCDFglobalattributesoftheproductfile,seereferences12and13fordetails.
2.1.3 ReferenceFrameProcessingKnowledgeofthepreciseorientationofthebaselineandthetworeceivingantennasisessentialforthesuccessofthemission.CryoSat-2measuresthisbaselineorientationusingthepositionofthestarsinthesky.Threestar-trackersaremountedonthesupportstructurefortheantennas.Eachcontainsacamera,whichtakeuptofivepicturespersecond.Theimagesareanalysedbyabuilt-incomputerandcomparedtoacatalogueofstarpositions.
TheCryoSat-2spacecraftfliesinanose-downattitudeinclinedat6degreestothepositiveXaxis.Thenadirdirectionisinclined6degreesfromthenegativeZaxis.Theoriginofthesatellitereferenceframeisatthecentreofthesatellitemountingplaneonthelaunchvehicle.Theradarantennasaremountedsuchthattherealbeamdirectionisalongthenadirdirection.

CryoSat-2ProductHandbook C2-LI-ACS-ESL-5319
P a g e 1 6 BaselineD1.0draft
Fulldetailsaregiveninreference7.
This illustrationcomes fromreference7andshowsCryoSat-2,without its thermalcontrolmaterial.NotethatthenegativeZaxisisshowninordertodisplaytheoffsettothenadirdirection.
Level-2andlevel-1bproductsuseaCryosat-2processingreferenceframe(notthesatellitereferenceframe) to describe the interferometric antenna baselineinter_base_vec_20_ku and real antennaboresight(realbeam)directionvectorsbeam_dir_vec_20_ku.Thisreferenceframehasitsoriginatthesatellitecentreofmass(CoM).CryoSat-2'sCoMiscolocatedwithitscentreofgravity(CoG)andhasbeendesignedsothattheCoMcorrespondstothecentreofthesingle,sphericalfueltank.Thefuelisgaseous nitrogen, which uniformly fills the tank. CryoSat-2 has nomoving parts. Consequently thecentreofmasswillnotmoveduringthesatellitelifetime.Overalldesignconcernsaregiveninreference4.
TheXaxisisdirectedfromtheframeoriginandisparallelwiththenormalincidencetothereferenceellipsoid. The Y axis is in the plane defined by the X axis and the spacecraft velocity vector V. It isdeterminedby
Y=(V–X(X.V))/|V–X(X.V)| (Equation2.1)
TheremainingaxisisdeterminedbyZ=YxX (Equation2.2)
Allreferenceframesusedduringprocessingaredescribedindetailinreference20.
Inotherwords, theantennabaselineandrealbeamvectorsaredefined in theCryosat-2processingreferenceframe(CoG,X,Y,Z)orthonormalbutleft-handed,whereXistheunitvectorpointingtonadir
Figure6:SatelliteReferenceFrame

CryoSat-2ProductHandbook C2-LI-ACS-ESL-5319
P a g e 1 7 BaselineD1.0draft
inthe"along-track'plandefinedbytheCOGandthevelocityvector,andYistheunitvectoralmostinthesamedirectionasthevelocityvector.
Theinterferometricbaselinevectorandtherealbeamvectorcomponentsarenormalizedtomakeaunitvector and scaledbyonemillion to get integer components inmicrometres.These components aremeasuredby thestar trackersanglesonboard. In theperfect situation, thebaselinevector is [0;0;-1000000]andthebeamvectoris[1000000;0;0].
Sinceonevectorelementisnominallyoneunitandtheanglesareverysmall,theroll,pitch,andyawanglesoftheantennabenchintheCryosat-2processingreferenceframecanbeapproximatedwith:
roll =+(baseline_vector_x) inmicrorad,whererollisrelativetoaxisYdefinedabove.
yaw =-(baseline_vector_y) inmicrorad,whereyawisrelativetoaxisXdefinedabove.
pitch =-(beam_vector_y) inmicrorad,wherepitchisrelativetoaxisZdefinedabove.
These angles are presented in the variables off_nadir_roll_angle_str_20_ku,off_nadir_pitch_angle_str_20_ku, off_nadir_yaw_angle_str_20_ku, at a resolution of 0.1microdegreesandwithallapplicablecorrectionsandbiasesapplied.
Positive/negativerollcorrespondstorightantennadown/uprespectively.
Positive/negativeyawcorrespondstospacecraftnoseontheright/leftrespectively.
Positive/negativepitchcorrespondstospacecraftnosedown/uprespectively.
InordertolookatEarth,thesatelliteturnsonerevolutionininertialspaceforeachrevolutionthatitmakesaroundtheEarth.SincearevolutionaroundtheEarthtakesroughly6000seconds,therotationrateisabout360degrees/6000seconds,orabout0.06degreespersecond.ItismainlythepitchwhichmustturnininertialspacetofollowtheEarth.Therefore,ifthereisatimingerrorinadatationoracalculation,onecanexpectpitch,inparticular,tobeaffectedbyanamountoforder0.06degrees/sectimeswhateveristhedeltatime.
The SIN phase difference waveforms inL1B data ph_diff_waveform_20_ku do includea phasedifferencebiasinstr_ext_ph_cor_20_ku,whichaccountsfortherollfixedbiascomponentonly,butdonotincludetherollvariablecomponent,whichcanbeextractedintheproductitselfaccordingtotheaboveformulaandshouldbeused,asshownbelow,tocorrecttheinferredangle.
The variable roll off_nadir_roll_angle_str_20_ku can be applied to the inferred angle as avariablecorrection.TheinferredanglealphaisobtainedfromtheretrackedSINL1Bphasedifferencewaveform ph_diff_waveform_20_ku with: alpha [rad] = lambda * retrack_PD / (2*pi*baseline),where retrack_PD is the retracked phase difference in radians, baseline = 1.1676m and lambda =0.022084m
Thenthevariablerollcorrectioncanbeappliedtotheinferredanglewith:alpha-roll.

CryoSat-2ProductHandbook C2-LI-ACS-ESL-5319
P a g e 1 8 BaselineD1.0draft
Notethatthephasedifferencevaluesph_diff_waveform_20_kuareprovidedbetween–piand+pimicroradians.Apositive/negativephasedifference(andacross-trackinferredangle)correspondstoasignalcomingfromtheright/lefthandsideoftheobserversittingontheantennabenchwithitsdorsalspinealignedwiththenadirdirectionandlookingforwardinthealong-trackflightdirection.
Themispointingangleistheanglebetweentheantennapointing,i.e.thedirectionoftheactualbeam,andthenadirdirection.Nominallythisshouldbezerodegree.
2.2 SpacecraftTimeandLocation
2.2.1 ReferenceEllipsoidSatellitealtimeterheightmeasurementsareusuallyreferencedtoanellipsoid,asimplemathematicalfigurethatdescribesaroughapproximationofthegeoid.ThegeoidistheshapethatwouldhavetheseasurfaceunderthesingleinfluenceofEarths’sgravitationandwithoutanysignatureassociatedtotheoceancirculationandtideeffects.ForCryoSat,thereferenceellipsoidisWGS84,definedbytheNationalGeospatialIntelligenceAgencyoftheUSA.Thiscanbeexploredonlineat
https://www1.nga.mil/ProductsServices/GeodesyandGeophysics/Worldgeodeticsystem/Pages/default.aspx
2.2.2 SomeBasicAltimetryTermsBasictermsusedintheCryosat-2missionare(seeFig2.3):
Range:theone-waydistancefromthesatellitetothesensedsurfacebelow.
Altitude:thedistanceofthesatellitecentreofmassabovethereferenceellipsoid.
Corrections:ValuestobesubtractedtotheRangeinordertoavoidundesirableeffectsduetothedelayof the echopropagation through the atmosphere layers, the temporally subsampledhigh frequencygeophysicalsignalsandtheinstrumentalnoise.
Height:DifferencebetweentheAltitudeandthecorrectedRange,i.e.theinstantaneouselevationofthesurfaceobservedabovethereferenceellipsoid.
MeanSeaSurface:TemporalaverageoftheseaHeightoveragivenperiodwhichcontainsboththesignatureofmarinegeoidandoftheseaelevationduetothemeanoceaniccirculation.
SeaHeightAnomaly:DifferencebetweentheHeightandtheMeanSeaSurfacecorrespondingtothevariablecomponentoftheinstantaneouselevation.
MeanDynamicTopography:DifferencebetweentheMeanSeaSurfaceandtheGeoid,correspondingthesurfacesignatureofthesinglemeanoceaniccirculation.

CryoSat-2ProductHandbook C2-LI-ACS-ESL-5319
P a g e 1 9 BaselineD1.0draft
AbsoluteDynamictopography:MeanDynamicTopographyplusSeaHeightAnomaly(orequivalentlyHeight minus Geoid) containing the surface signature of both the mean circulation and transientoceanographicprocesses.
Notethatmostradaraltimetersobservethesurfaceatnadir,butCryosat-2canobserveoff-nadirwhenitoperatesinSARinmode.Iftheobservationisoff-nadirthenthelatitudeandlongitudeoftheactualobservedpointobservedisprovidedinthedataproducts.
At level 1b, only the engineering corrections (including the USO), the Doppler corrections and thecentre-of-massoffset(explainedinsections2.2.6,2.3.7and2.4.1)areappliedtotherangemeasurement(givenasatimedelaywindow_del_20_ku).Thealtitudeisgivenasalt_20_ku.
Atlevel2,theatmosphericandtidalcorrections(explainedinsections2.5and2.6)arealsoappliedtotherangebeforeitisusedtocomputeheight.TheheightspresentedintheL2productsarecontainedinvariablesthathavethestring‘height’inthename,e.g.height_1_20_ku.

CryoSat-2ProductHandbook C2-LI-ACS-ESL-5319
P a g e 2 0 BaselineD1.0draft
Figure7:Basicaltimetrytermsandapplicablecorrectionsoveropenocean
2.2.1 GeoidandMeanSeaSurfaceInthelevel-2dataproduct,valuesofthegeoid(overlandandlandice)oralternativelyofthemeanseasurface(MSSoveropenoceanorclosedsea)arespatiallyinterpolatedatthegroundtracklocations.Themodels used are EGM96 (geoid) geoid_20_ku and UCL13 (mean sea surface MSS)mean_sea_surf_sea_ice_20_ku.
EGM96canbeexploredmorefullyathttp://cddis.nasa.gov/926/egm96/egm96.html.
UCL13 is a hybrid globalmodel compiled fromCryoSat sea-surface heightmeasurements above 60degreesnorthandtheCLS2011MSS(http://www.aviso.oceanobs.com/index.php?id=1615)below50degrees North. Between those two latitudes, a linear blend is performed between themodels. ThepurposeofthemodelistoprovidebetteraccuracyintheArcticocean.Modeldetailsarealsogiveninsection2.8.1andreference8.

CryoSat-2ProductHandbook C2-LI-ACS-ESL-5319
P a g e 2 1 BaselineD1.0draft
2.2.2 SeaSurfaceHeightAnomalySeasurfaceheightanomaly(SSHA)isthedifferencebetweenthelong-termaverageseasurfaceheight,i.e.theMSS,andtheoceanheightactuallyobservedbythesatellite.Thismustbedeterminedinordertoaccuratelycalculatetheseaicefreeboard.Atlevel2,theSSHAisfoundbycomparingtheoceanheightwiththeUCL13MSStogettheoceanheightanomalyssha_20_ku,andthenusinglinearinterpolationtogettheSSHAssha_interp_20_ku.TheSSHAqualityflaggivestheRMSoftheresidualsofthelinearfit ssha_interp_rms_20_ku. Technically another MSS may be chosen if desired, as choice isconfigurable.Modeldetailsarealsogiveninsection2.8.1andreference8.
2.2.3 FreeboardSeaicefreeboardfreeboard_20_kuistheheightbywhichanicefloeextendsabovetheseasurface.Level 2 data includes climatological snow depth snow_depth_20_ku and density valuessnow_density_20_kuforeachrecord.Thesnowdepthvaluesareextractedfromastaticclimatology,UCL04, and can be used to adjust the freeboard estimate to account for snow load. Note that thefreeboardcanpossiblybenegativeifthereisheavysnowloadonthinice.Thereisaseparateclimatologyfileforeachmonthoftheyear,whichprovidessnowdepthvaluesfortheArcticregion.NoclimatologyfortheAntarcticregionisavailable.Snowdensityisprovidedasasingleglobalconstantaverage.Thecurrentvalueis400kg/m3.Modeldetailsarealsogiveninsection2.8.1andreference8.
2.2.4 TimestampsIn LRM, the timestamptime_20_ku for eachmeasurement dataset record is the time atwhich themiddleoftheaveragedgroupofpulsesimpactstheground.InSARandSINmodes,itisthetimeatwhichthesatelliteoverfliesthesurfacesamplelocation.
2.2.5 Latitude,LongitudeandAltitudeThe latitude lat_20_ku, longitude lon_20_ku and altitude alt_20_ku measurements are thoseinterpolatedfromtheorbitattheexacttimerecordedinthetimestamp.Allofthemaremeasuredfromthereferenceellipsoidatnadirtothesatellitecentreofgravity.
2.2.6 DORISUltraStableOscillatorDriftTheDORISUSOdriftuso_cor_20_kuisrequiredtoaccuratelyconverttheSIRALaltimetertimeandrangecountsintoUTCtimetagandrangedelaymeasurements.SIRALderivesallitsradarfrequenciesfromtheDORISUltraStableOscillatorwhosefrequency,intermsofdeviationsfromnominalvalue(onemeasurementevery24hours),ismadeavailableinaDORISLevel1bproduct,whichisanincrementalfile.Thisisdescribedinreference6.
TheUSOcorrectionisappliedtothewindowdelayatL1b.ThecorrectionappliedisgivenintermsofrangeatL2asuso_cor_applied_20_ku.

CryoSat-2ProductHandbook C2-LI-ACS-ESL-5319
P a g e 2 2 BaselineD1.0draft
2.2.7 SatelliteVelocityVectorThesatellitevelocityvectorsat_vel_vec_20_ku isgiven in the InternationalTerrestrialReferenceFrame(ITRF),whichisdefinedandmaintainedbytheInternationalEarthRotationService(IERS).Seetheironlinepresenceat
http://www.iers.org/IERS/EN/Science/science.html
2.2.8 ReferenceOrbit
TwophaseshavebeenincludedintheCryosat-2ReferenceOrbitFilebecauseduringtheperiodbetweenlaunchandJune2010theCryosat-2cyclewasnotconsistentduetocontinuousorbitalmanoeuvreswhichneededtobeperformedinordertoobtainastableorbit.ThesemanoeuvreswereplannedaspartoftheCommissioningPhaseactivities.FromJuly2010onwards,astableorbitwasmaintainedandconsequentlytherearePhase1intheReferenceOrbitFile,whichincludestheperiodbetweenlaunchinApril2010toJune2010,andPhase2whichincludestheperiodfromJuly2010onwards.
Initially,theReferenceOrbitFileuseduntilOctober2011wasincorrectsuchthatitonlycontainedPhase1andasaresultalldataproductswithvalidityupuntilOctober2011currentlycontainthewrongcyclenumberandlengthwhichdoesnotcorrespondwiththeactualdataandisthecauseofthediscrepancyobservedbytheusers.InearlyOctober2011,theOrbitScenarioFilewasupdatedwiththetwophasesdescribedabove.OnecannoticethattheorbitparametershavechangedinOctober2011.ThisiscorrectedinallprocessingbaselinesfromBonwards.
PleasenotethatdatabetweenlaunchandJuly2010willnotbereprocessedasithasbeendecidedthatatthisearlystageofthemissionthedatawereoflittlescientificuseduetothemanoeuvers.
2.2.9 GroundTracksThescopeofthissectionistoexplaintheretrievalandanalysisofCryosat-2orbitsandgroundtracksfiles.Themaininterestofthisanalysisistoinvestigatethedifferencesinthegroundtrackswhenusingdifferentpredictionsoftheorbit.InformationanddescriptionaboutavailablefilescanbefoundontheESACryosat-2webpages.
Thefollowinginformationisextractedfromthiswebsite:
The Reference Orbit file contains information on the orbits over a full repetition cycle (369 days),generatedatthestartofeveryorbitalrepetitioncycle.
TheReferenceGroundTrackfileisgeneratedfromtheReferenceOrbitfile.
ThePredictedOrbitfileisahighaccuracyorbitprediction,generatedclosertothetimeoftheoverpass.Itisgeneratedeveryday,andcontainsoneOrbitStateVector(OSV)perorbit,locatedat(orverynearto)theAscendingNode.Thecoverageisfor30daysstartingatthegenerationtime.
Asaresult,theorbitsforagivendaycanbeevaluatedfromtheReferenceOrbitfileorfrom30differentPredictedOrbitfileswhichallcontainthatday,butwithincreasinglyaccuratepredictions.

CryoSat-2ProductHandbook C2-LI-ACS-ESL-5319
P a g e 2 3 BaselineD1.0draft
The following paragraphs show the differences among these predictions, and furthermore set adocumentedexampleofhowtheinformationcanbeextractedandanalysed.
Inparticular,theReferenceGroundTracksareanalysed,theReferenceOrbitandPredictedOrbitfilesarecomparedandthedifferencesamong30consequentgroundtracks,retrievedfromthepredictedorbits,areassessed.
AllthementionedfilescanberetrievedfromtheFTPserver:
FTPserver:ftp://calval-pds.cryosat.esa.int Username:ground Password:tracks
UponconnectiontotheFTPserver,thefollowingdatastructurecanbeobserved:
• 3ReferenceOrbitfiles,oneperyear(2010,2011,2012,etc.)• PredictedOrbitfiles,about30filespermonth• GroundTracks,availableonamonthlyoryearlybasisandwiththreedifferentsamplingsteps
(2,10or60seconds)• Softwarefolder,whichcontainsthenecessarytoolstogenerategroundtracksfromtheorbit
filesandotherfunctionalities.
TheGroundTracksfileisasimple.txtfile.ForJanuary2012,thisfilecontainsallthereferencegroundtracksfrom01January2012to31January2012sampledevery10seconds.
InordertocompareReferenceOrbitsandPredictedOrbitsfor2012,thefollowingfilescanberetrievedfromtheFTPserver:
TheReferenceOrbitsspanfrom17June2011to19June2012.
ThePredictedOrbitsspanfrom02January2012to01February2012
ThetimesamplingoftheReferenceOrbitsfileis100minutes,thereforeonlyoneOSVisgivenforeachorbit (100minutes is approximately the orbit period) for the local ascending node. The orbit filescontentisfullydescribedintheCryosat-2groundsystemMissionFilesFormatSpecifications(pages9-27).There,thetime,numberoforbitandstatevectorarestored.TheX,YandZcoordinatescanbeusedtocalculatetheOrbitHeightH=(X*X+Y*Y+Z*Z)1/2-Requator
The differences on X, Y and Z coordinates, comparing the reference and the predicted orbits, inpercentage,arealways<5%.
Alltheinformationtocalculatethegroundtracksfromtheorbitfilesisinthedocument:

CryoSat-2ProductHandbook C2-LI-ACS-ESL-5319
P a g e 2 4 BaselineD1.0draft
“CRYOSAT-2: TRANSPONDER PASS TOOLS - FILETRANSFER DOCUMENT” from EOCFI-FTD-004_1_5.zip
Startingwith a ReferenceOrbit or PredictedOrbitfile,theexecutablefunctionreturnsthegroundtrackpoints(atatemporalsamplingdefinedinTimeStep)which are contained in the area defined in ZoneDatabase,foragivensetoforbitsorforagiventimeinterval.
Thegroundtracksamplesretrievedfromtheoldestpredictedorbit(onemonthbefore)andthegroundtracksamplesretrievedfromthenewestpredictedorbit (one day before) can be a bit different. Thisdifferencemainlydependson the timeordistancefromthelastorbitmaneuver.Thespatialdifferencebetween the tracks cannot be calculated as thesimple distance between two samples of thedifferentgroundtracks,becausethereisatimedelaywhichturnsintoaspatialshift.However,theacross-track distance can be easily calculated with somegeometry. Nominally, the across-track distanceneverexceeds1kmandrarelyexceeds500minpolarareas.
2.2.10 IlluminatedAreas
2.2.10.1 Beam-limitedfootprint
Thebeam-limitedilluminatedareaisdefinedasthewholeareaontheEarthsurfaceonwhichabeamechoiscollected.Itdependsmainlyontheantennailluminationpattern,asaconsequenceitdoesnotvarywiththeacquisitionmode.Itcanbedescribedbyitswidthsinthealong-trackdirectionandintheacross-trackdirection,thatdependontheantennapattern.Being𝝑theantennabeamwidthat-3dB,𝜽𝑩theangleofthecentralbeamdirectionwithrespecttothenadirandhthealtitudeofthesatellite,thewidthofthebeam-limitedfootprintresultsin𝑫 = 𝒉 ∙ tan(𝜽𝑩 + 𝝑 𝟐⁄ ) − 𝒉 ∙ tan(𝜽𝑩 − 𝝑 𝟐⁄ )wheretheflatEarthapproximationisused.
Consideringanaltitudeof730km,𝝑=1.06degreesand𝜽𝑩=0degreesalongtrack,while𝝑=1.1992degrees and 𝜽𝑩 = 0 degrees across track, the beam-limited illuminated area for SIRAL can bedecomposedin:
h
J
Bq
D

CryoSat-2ProductHandbook C2-LI-ACS-ESL-5319
P a g e 2 5 BaselineD1.0draft
• widthofthebeam-limitedareaalongtrackapproximatelyequalto13.5km
• widthofthebeam-limitedareaacrosstrackapproximatelyequalto15.3km
Both the along and across beam-limited areas are not constant but are dependent on the orbitcharacteristicsandthereforetheychangewithlatitude.Thewidthofthebeam-limitedareaalongtrackvariesbetween13.2and14.0kmwhilethebeam-limitedareaacrosstrackvariesbetween14.9and15.8km.
Figure8:Variationoffootprintwithlatitude
2.2.10.2 Pulse-limitedfootprint
Thepulse-limited illuminatedarea isdefinedas the illuminatedareaongroundaroundthepointofclosestapproachanditcorrespondstotheareailluminatedbytheleadingedgeofthepulseuntilthetimethetrailingedgefirstintersectsthesurface.
For LRM, the pulse-limited footprint depends only on the compressed pulse duration, since LRMacquisitionhasonlyoneindependentvariable(thetimedelay).
TheDopplerbeamformationinSARandSINmodesallowsdiscriminatingthedirectionofarrivaloftheechoesinthealong-trackdirection,sothatapulse-Dopplerfootprintcanbedefined.ThisisduetothefactthatinSARandSINmodestherearetwoindependentvariables,thealong-trackpositionandtheacross-trackposition,relatedtotimedelay.
ThewidthoftheilluminatedareaforLRMandSAR/SINmodesisdefinedbelowusingtheflatEarthapproximationandassumingaquasi-flatgroundsurface.
CryoSat-2ProductHandbook C2-LI-ACS-ESL-5319
P a g e 2 6 BaselineD1.0draft
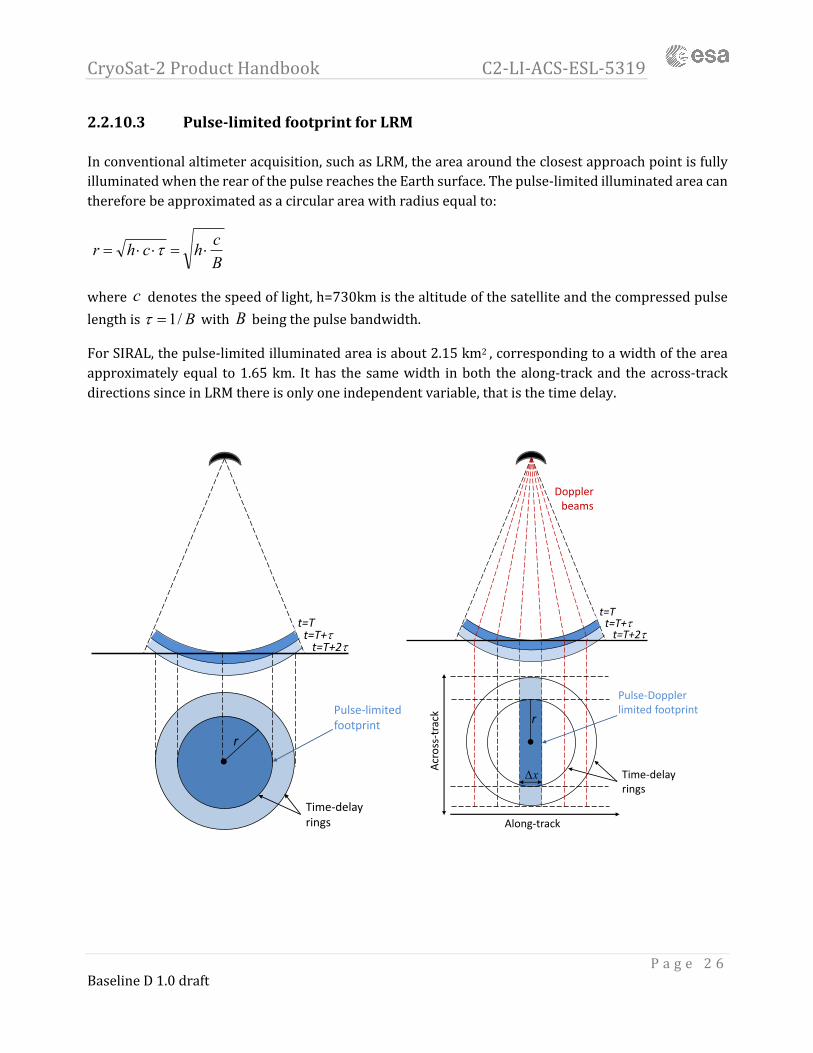
2.2.10.3 Pulse-limitedfootprintforLRM
Inconventionalaltimeteracquisition,suchasLRM,theareaaroundtheclosestapproachpointisfullyilluminatedwhentherearofthepulsereachestheEarthsurface.Thepulse-limitedilluminatedareacanthereforebeapproximatedasacircularareawithradiusequalto:
where denotesthespeedoflight,h=730kmisthealtitudeofthesatelliteandthecompressedpulselengthis with beingthepulsebandwidth.
ForSIRAL,thepulse-limitedilluminatedareaisabout2.15km2,correspondingtoawidthoftheareaapproximatelyequal to1.65km. Ithas thesamewidth inboth thealong-trackand theacross-trackdirectionssinceinLRMthereisonlyoneindependentvariable,thatisthetimedelay.
Bchchr ×=××= t
cB/1=t B
t=Tt=T+tt=T+2t
r
Pulse-limited footprint
Time-delay rings
t=Tt=T+tt=T+2t
Doppler beams
Along-track
Acro
ss-t
rack
Pulse-Doppler limited footprint
Time-delay rings
r
xD

CryoSat-2ProductHandbook C2-LI-ACS-ESL-5319
P a g e 2 7 BaselineD1.0draft
2.2.10.4 Pulse-Doppler-limitedfootprintforSARandSINmodes
InSAR/SINacquisitionmodes,theprocessorallowstosharpentheareaofthepulseinthealong-trackdirection.Asstatedbefore,theDopplerbeamformationinSAR/SINmodeallowstodiscriminatethedirectionofarrivaloftheechoesinthealong-trackdirectioninadditiontothemeasureofthetimedelay.Thiswaytheilluminatedareawidthisdefinedindependentlyinbothindependentdirections,thealong-trackandtheacross-trackdirections.
Intheacross-trackdirection,theilluminatedareawidthforSIRALisdefinedasthepulse-limitedwidthinLRM.However,inthealong-trackdirection,theilluminatedareawidthforSIRALisdefinedasthesharpenedbeam-limitedarea.Thepulse-Doppler-limitedareaforSAR/SINcanbeapproximatedbyarectangleareagivenbythepulse-limitedareawidthacrosstrackandbythesharpenedbeam-limitedareawidthalongtrack.
SincethebandofDopplerfrequenciesthatisunambiguouslysampledbythePRFgoesfrom–PRF/2to+PRF/2,and64differentsharpenedbeamsareequallyspacedintheDopplerdomain,thewidthofthesharpenedbeam-limitedarearesultsin
where isthealtitudeofthesatellite, isthewavelength, isthevelocityofthespacecraftand isthePulseRepetitionFrequency.
ForCryoSat,thepulse-limitedareawidthintheacrosstrackdirectionisapproximatelyequalto1.65kmwhilethesharpenedbeam-limitedareawidthinthealong-trackdirectionisapproximatelyequalto305m,whichinturncorrespondstoanalong-trackresolutionapproximatelyequalto401m,usingflatEarthapproximation.Hence,thepulse-Doppler-limitedareaforSAR/SINisabout0.5km2.
2.3 InstrumentCorrectionsandNoiseErrorcomponentscanbecharacterisedaccordingtotheirtimedependenceasfollows:
Abiaserrorisaresidualfixedoffseterror,whichisstablethroughoutthemissionbydefinition.Biasesareassumedtohaveauniformdistribution.
Adrifterrorisavariationduetoageing,orothereffects,whichappearsasaslowchangewithtime,havingnoperiodiccharacter,withthepossibilityofdiscretesteps.
Aharmonicerrorvariesperiodically,wheretheperiod is typicallyof theorderof theorbitalorhalforbitalperiodbutmaybemuchsmallerormuchlonger.Theerrorhasameanofzero.
Arandomerrorvariesinanunpredictablemanner,relativelyquicklyinrelationtoanorbitalperiod,inwhichthereisnocorrelationbetweensuccessiverealisations.TheseerrorscanbeassumedashavingaGaussiandistributionwithzeromeanandgivenstandarddeviation.
642PRFv
hx l=D
h l v PRF

CryoSat-2ProductHandbook C2-LI-ACS-ESL-5319
P a g e 2 8 BaselineD1.0draft
Instrumentcorrectionsarederivedfromcharacterisationandcalibrationdata.Thealtimeterelectronicsystemintroducesfixedbiasesthatcanbedeterminedduringgroundcalibration.Perturbationsduetoe.g.differentialheatingaroundtheorbit,causecyclicandlong-termdrift,andduringthemissionareestimated using data from periodic on-board calibrations. The internal path delay correction is acombinationofbothafixedpartandfrequentcalibrations.TheinternalpathdelayiscomputedusingaspecificcalibrationcalledCAL1,whichisperformedabout10timesperweek,andperformedforeachSIRALmode.Physically thepathdelay is thesame forLRMandSARmodes.HoweverLRMdataareprocessedonboardwhereasmallshiftisaddedequalto1/64rangebin≈7mm.SotheLRMpathdelayisdifferentfromtheSARone,itisactuallysmallerby1/64rangegate:thisdoescompensatetheshiftintroducedbytheLRMon-boardprocessor.ThevaluesareprovidedintheL1Bproducts.However,theL1Bproductcontainsinadditionanothercomponentofthepathdelayrelativetothewaveguides,whichisaconstantvalue,measuredbeforelaunchandcommontoallmodes.
Bothantennaeneedseparatecorrectionforinstrumenteffectsonrangeinstr_cor_range_rx_20_kuand instr_cor_range_tx_rx_20_ku and on gain instr_cor_gain_rx_20_ku andinstr_cor_gain_tx_rx_20_ku.
2.3.1 AutomaticGainControlCryoSat-2usesautomaticgaincontrol(AGC),whereinformationabouttheprevioussignallevelisusedtoadjustthegaininanticipationofthenext.Theaimistokeepthesignallevelasconstantaspossible.Theactualsettingoftheon-boardreceiverattenuatorattheobservationtimeiswhatisrecordedinthedataagc_ch1_20_kuandagc_ch2_20_ku.TheAGCisconstantwithintheradarcycle.
2.3.2 SignalPhaseCorrectionsSignalphasecorrectionsaresplitintointernalandexternaltypes,internalfortheelectronicsystemandexternal for antenna subsystem andwaveguide effects. Signal phase is used in SINmode only. Thecorrections are derived from in-flight calibration data. The internal phase correctioninstr_int_ph_cor_20_kuistheinternalphasecorrectioncomputedfromtheCAL-4packetsduringtheazimuthimpulseresponseamplitude(SINonly).ItissetfromthelatestavailableCAL-4packet.Theexternalphasecorrectioninstr_ext_ph_cor_20_kuisanexternalphasecorrectiontakenfromtheIPF database file (SIN mode only) to be added to the internal phase correction term. This is thetemperature-averaged component of external inter-channel phase difference derived from phasedifferencesensitiveantennasubsystem,waveguidesandinstrumentwaveguideswitches.Itdoesnotcontaininternalinstrumenttemperaturedependenteffectsofcalibrationcouplerandduplexer,whicharedealtwithbytheCAL-4signalanditssubsequentprocessingandisreportedintheinternalphasecorrectionparameter.
2.3.3 PhaseSlopeCorrectionAcrossthewholebandwidththereisaconstantchangeinphasedifference.Someofthiswasmeasuredbeforelaunch;therestiscalibratedat1Hz.Bothmeasurementsarecombinedtogivethephaseslopecorrectionph_slope_cor_20_ku.Sincethehighestdatarateis20Hz,theclosestcorrectionvalueintimetothatofthesampleistheoneused.

CryoSat-2ProductHandbook C2-LI-ACS-ESL-5319
P a g e 2 9 BaselineD1.0draft
2.3.4 HammingWeightingFunctionforSARAzimuthFFTAhammingwindowoflengthN=”numberofechoesinburst”(always64forSARandSIN)isgeneratedonceatthebeginningoftheSARprocessing,andappliedinazimuthdirection,toallsamplesofallechoesofeveryburstattheverybeginningofthebeam-formingstep.
Thewindowingprocessisperformedwiththefollowingparametersfromtheprocessorconfigurationfile:
• Apply_Azimuth_Hamming:whichdefineswhetherornotapplythewindow.• Azimuth_Hamming_c1andAzimuth_Hamming_c2:whichareusedtochangetheshape
ofthewindowo H(x)=c1+c2(cos((πx/N)–(π/2)))2
• IntheIPF1processorreleaseVK1.0(February2012)theaboveparametersaresetto:o Apply_Azimuth_Hamming:ono Azimuth_Hamming_c1:0.08o Azimuth_Hamming_c2:0.92
forbothSARandSINspecializedprocessors.Whenthehammingwindowisapplied,thepowerisnotcompensatedbyany factor.Seebelowtheazimuth impulseresponseofaCAL1SARburst,withandwithouthammingwindow(zero-padding=64).
Figure9:ComparisonofAIRwithandwithoutHammingwindow

CryoSat-2ProductHandbook C2-LI-ACS-ESL-5319
P a g e 3 0 BaselineD1.0draft
Figure10:ComparisonofAIRwithandwithoutHammingwindow(fullrange)

CryoSat-2ProductHandbook C2-LI-ACS-ESL-5319
P a g e 3 1 BaselineD1.0draft
Figure11:Hammingweightingfunction
Themainbeamwideningfactorisabout1.5sotheazimuthresolutionisdecreased.Thepeakpowerdecreaseisabout5.4dBbutthisshouldnothaveanyimpactontheL2data.Theweightingfunctionaimistoreducethesidelobes.Thisalwayshasthesideeffectsofincreasingthemainbeamwidth(whichmeansa lossinresolution),anddecreasingthemainbeampowerlevel.Thereareseveralweightingfunctions.Hamminghasthecharacteristicofmakingthefirstsidelobesverylow,reducedbyabout-42dB.Hammingiscurrentlyusedintheprocessor,inazimuthprocessingbeforebeamforming(64beamsarecreatedfromeachburstof64waveforms),butthiscouldbechangedinthefuture,ifamoresuitableoneisrecommended.Itisneededforspecularsurfaceswherethenadirechoisverystrong,andbeamspointingoffnadircontainastrongenergyfromnadir,whichistheclutterinthiscase.Thiscanbeseenin the following four figures forsea ice,showinghowthenadirclutter, removedbywindowing,canimpacttheL1Bwaveformshapeandmainlytheleadingedge.

CryoSat-2ProductHandbook C2-LI-ACS-ESL-5319
P a g e 3 2 BaselineD1.0draft
Figure12:AzimuthFFTofasingleburst:thenadirclutteristhe'line'inthemiddle
Figure13:AzimuthFFTofasingleburstwithhamming:thenadirclutterisreduced

CryoSat-2ProductHandbook C2-LI-ACS-ESL-5319
P a g e 3 3 BaselineD1.0draft
Figure14:Stack60withouthamming:heretheparabolaisthenadirclutter
Figure15:Stack60withhamming:thenadirclutterhasdisappeared
NotethattheL1Bwaveformisobtainedaveragingallthesebeamsinthestack.

CryoSat-2ProductHandbook C2-LI-ACS-ESL-5319
P a g e 3 4 BaselineD1.0draft
2.3.5 NoiseNoiseontheechosignalisalsomeasuredduringin-flightcalibrationnoise_power_20_ku.Atlevel1b,anestimateof thenoise isgivenas thenoisepowermeasurement,but it isnotsubtracted fromthewaveforms.At level2,noise is re-estimatedaspartof the retrackingcalculations. InSINmode, thisestimateissubtractedfromthebinspowerbeforetheretrackingisdone.
2.3.6 EchoSaturationEchosaturationoccurswhenthepowerinthepulsevariesmorethanthedynamicrangeofthereceiver,causingdistortionsintheechowaveform.Thismostlyoccursinhigh-amplitudeechoesfromflatbrightsurfacessuchasleadsinseaiceormeltpondsonicesheets.ThisconditionisflaggedintheMCDwordflag_mcd_20_kuusingbitecho_saturated
2.3.7 DopplerCorrectionWhenthereisacomponentofsatelliteorbitalvelocityvectordirectedalongthelineofsightfromthesatellitetotheechoingpointonthesurface,theradarechoundergoesacorrespondingDopplershift.Thisiscompensatedbyarangecorrectiondop_cor_20_ku.Allrangecorrectionsaredefinedsuchthattheywereaddedtotherangemeasurementtogivethetruerange.
2.4 RetrackingandParametersDerivedFromEchoShape
2.4.1 RangeWindowandWindowDelayThedistancebetweenthesatelliteandtheEarthsurfacevariesarounditsorbitbyseveralkilometres.However, in the vertical dimension the altimeter can only receive echoeswithin a 'rangewindow'specifiedbythewidthofthefrequencyspectrum.Inordertoreceiveechoesallaroundtheorbit,thetimeofthereceptionperiodmustbecontinuouslyadjustedtotrytokeepaspecificpointontheleadingedgeoftheechowaveformatareferencepositionwithinthewindow.TheCryosat-2referencepositionisconfigurable,butitisfornowcentrallylocated,atbin64oftherangewindowinLRMmode,bin128in SAR mode, and at bin 512 in SIN mode. Bins are counted from bin 0. The window delaywindow_del_20_kureferstothe2-waytimebetweenthepulseemissionandthereferencepointatthecentreoftherangewindow.
2.4.2 ReceptionPeriodInformationaboutthereceptionperiodtimeisrepresentedintwoways.Eitheraninitialheightisgivenh0_applied_20_ku, followed by the rate of change in this height per tracking cyclecor2_applied_20_ku, or a coarse height h0_lai_word_20_ku and fine height adjustmenth0_fai_word_20_ku aregiven,whichmustbeadded together.The trackingcycle isa fundamentalintervalcommontoallmodes,of47.2ms.
2.4.3 RangeWindowSamplingInLRM,therangewindowexploredisabout60m,coveredby128datasamples.InSARmodeitisabout60m,againcoveredby256datasamples.InSINmode,duetotheslopevariationinicesheetmargins,

CryoSat-2ProductHandbook C2-LI-ACS-ESL-5319
P a g e 3 5 BaselineD1.0draft
therangewindowisincreasedtoabout240m,andiscoveredby1024samples.Duringprocessingtheexact,calibrated,lengthofthedatabinsisretrievedfromtheinstrumentcharacterisationdatafile,thefilenameofwhichisfoundinthedatasetdescriptionheaderwithinthedatafile,asdescribedinsection6.5.
TherearetwotypesofwaveformsprovidedintheLRM,SARandSINlevel-1bproducts.
1.WaveformsderivedfromclassicalLRMorthosegeneratedfromSAR/SINazimuthprocessingthatareprovidedinthewaveformgroupofthelevel-1bproducts(L1BProductSpecTable2.3.4-1fields71,76and82).
2. Pulse-width limited data extracted from all modes averaged over 1 second and provided in theaveragewaveformgroupofthelevel-1bproduct(L1BProductSpecTable2.3.4-1fields56and66).
Itisafactthatradaraltimeterpowerechowaveformsarealiased(see“Radaraltimetergatetracking:theoryandextension”,J.R.Jensen,IEEETransactionsonGeoscienceandRemoteSensing,Vol37,No2,March1999,sectionIIIB.)
DuringCryoSat-2commissioningphase,itbecameclearthatSARprocesseddataoverspecularsurfaceswasaliasedandthiswasparticularlyevidentwhenthesatelliterateofchangeofaltitudewaslarge.TheresultrenderedSAR(andSIN)level-1bdatahighlydegradedoverspecularsurfaces.
Ingeneral, thealiasingeffectappearsminoroverdiffuse surfaces suchasoceanbut isneverthelesspresent.Inordertoavoidaliasing,rawcomplexSARandSINechoesarenowoversampled(since01February2012,productsversionB)intheFBRtolevel-1bprocessorandasaresultanyuserofthedataneedstotakethisintoaccountwhenusingwaveformsanddeterminingrange.However,althoughthesamplinghaschanged,theresolutionhasnotsinceitisfixedbytheinstrumentimpulseresponse.
LRMsamplingremainsthesameasinearlierversionsoftheCryosat-2processorsassamplingisfixedon-boardandoversamplingof theon-boardcomplexdata isnotpossible.However, theLRMdata isaffectedbyaliasingasinotheraltimetermissions.
Whatfollowsisadescriptionofhowtocomputerangetoagivenrangebinforallcases.
ForALLLRM20Hz,ALL1Hz,andforALLBaseline-Adata,andforanydatagatheredbefore01-FEB-2012,use
Giventhewaveformarray, (pwr_waveform_avg_01_kuorpwr_waveform_20_kuwhere isthewaveformsamplenumberwithavalue (anyvaluebetween0and )and isthemodedependentnumberofsamplesinanywaveform:
€
Φ n( )
€
n
€
∀n∈[0,Ns −1]
€
Ns −1
€
Ns
Ns =
128, LRM128, SAR512, SIN
!
"#
$#

CryoSat-2ProductHandbook C2-LI-ACS-ESL-5319
P a g e 3 6 BaselineD1.0draft
Therange towaveformsample isgivenby meters
where isthewindowdelayconvertedtosecondswindow_del_avg_01_kuorwindow_del_20_ku
referencedtothecentralrangebin ,thefirstrangebinbeing ,
is the speed of light in vacuum, c=299792458 m/s, is the measured chirp bandwidth,B=320000000Hz.
Hence,therangetothefirstwaveformsample, , meters.
Eachwaveformsamplecoversarangeof oradelayof
ForSAR&SIN20HzoversampledechoesinproductsversionB,gatheredafter01-FEB-2012
Given the oversampled power echowaveform array, pwr_waveform_20_ku where is thewaveformsamplenumberwithavalue (anyvaluebetween0and )and isthemodedependentnumberofsamplesinanywaveform:
Therange towaveformsample isgivenby [m]
where is thewindowdelayconverted tosecondswindow_del_20_ku referenced to thecentral
rangebin ,thefirstrangebinbeing ,
is the speed of light in vacuum, c=299792458 m/s, is the measured chirp bandwidth,B=320000000Hz.
Hence,forexample,therangetothefirstwaveformsample, , meters.
Eachwaveformsamplecoversarangeof oradelayof
ForSAR&SIN20HzoversampledechoesinproductsversionCandlater,gatheredafter01-FEB-2012
Asabove,butforSARmode𝑁3 = 256,andforSARinmode𝑁3 = 1024.
€
R n( )
€
n
€
R n( ) =Twc2
−Nsc4B
+nc2B
=c2B
TwB −Ns
2+ n
#
$ %
&
' (
€
Tw
€
n = Ns2
€
n = 0
€
c
€
B
€
n = 0
€
R(0) =Twc2
−Nsc4B
€
Δr =c
2B= 46.84 cm Δt = 1
B= 3.125 ns
€
Φ n( )
€
n
€
∀n∈[0,Ns −1]
€
Ns −1
€
Ns
Ns =128, SAR512, SIN
!"#
$#
€
R n( )
€
n
€
R n( ) =Twc2
−Nsc8B
+nc4B
=c8B
4TwB − Ns + 2n( )
€
Tw
€
n = Ns2
€
n = 0
€
c
€
B
€
n = 0
€
R(0) =Twc2
−Nsc8B
Δros =c
4B= 23.42 cm Δtos =
12B
=1.5625 ns

CryoSat-2ProductHandbook C2-LI-ACS-ESL-5319
P a g e 3 7 BaselineD1.0draft
2.4.4 EchoPositioningandScalingInthedataproductsthepositionoftheechowithintherangewindowvarieswithSIRALmode.TheinstrumentdynamicallysetstherangewindowandinLRMthewindowpositionisnotchangedbythedataprocessing.InSARandSINmodesechoesareaveragedduringdataprocessingonthegroundandthepositionofthewindowisthenselectedtobestaccommodatetheresultantwaveform.
Inordertoretainasmuchinformationaspossible,theindividualsamplesofeachechowaveformarescaledtofitwithintherange0to65535.Theycanbeconvertedtopowerinwattsusingequation4.2-1with the parameters echo_scale_pwr_20_ku and echo_scale_factor_20_ku (orecho_scale_pwr_avg_01_kuandecho_scale_factor_avg_01_ku)
2.4.5 RetrackingAtlevel2,aprocedurecommonlyreferredtoasretrackingisperformed.Aspecificpointontheecho'sleadingedge, knownas the retrackingpoint, is used tomark thepointofmeasurementof range tosurface.Theretrackingpointisdefinedrelativetotheshapeofthewholeechoandfoundusingamodel-fittingmethod.Theoffsetoftheretrackingpointfromareferencepoint,whichforCryosat-2isinthecentreoftherangewindow,isthencalculated.Thisistheretrackingcorrection.
Thealgorithmsusedforretrackingvarywithmode,seeTable2below.ForLRMandFDM(anysurfacetype),theamplitudeandepochreturnedbytheOCOGretrackperformeduponthewaveform,areusedastheinitialguessesforthefitsperformedbytheCFIandland-iceretrackers.Theprimaryresultsarereturnedinthevariablesheight_1_20_ku,height_1_20_ku,andheight_1_20_ku.
Table2:L2retrackers
RetrackerID ModeLRM ModeSAR ModeSARin1 OceanCFImodelfit Diffuseecho–CPOMthresholdoffirstpeak Wingham/Wallismodelfit
Specularecho–Gilesmodelfit2 UCLland-ice notused notused3 OCOG notused notused
Furtherdetailsaregiveninreference18,andbackgroundinformationinreferences4and19,however(inbrief)theCLSoceanretrackerandUCLland-iceretrackersaremodel-fitstotheLRMwaveform.TheoceanretrackerfitsaHaynemodelwaveformthatisnotadaptedforCryoSat2andtheUCLretrackerfitsaBrownmodeladaptedforCryoSat2.OCOGiswelldescribedintheliterature.
ForSARmode,theGilesretrackerisamodelfitforspecularleadwaveforms,andathresholdretracktothe first peak of a smoothed waveform for diffuse echoes from sea-ice. In SARin mode, theWingham/Wallisretrackerfitsatheoreticalmodeltotheportionofthepowerwaveformthatexhibitsthemaximumcoherence.Thephasedifferenceisestimatedattheretrackingpointtogivetheacross-track angle. The SARmode retracking is also performed on the SARinwaveforms,with the resultsappearinginheight_sea_ice_floe_20_ku(diffuse)andheight_sea_ice_lead_20_ku(specular)

CryoSat-2ProductHandbook C2-LI-ACS-ESL-5319
P a g e 3 8 BaselineD1.0draft
Figure16:Idealisedpulse-limitedwaveforminwindow
In the L2I, the variables retracker_1_cor_20_ku, retracker_1_cor_20_ku, andretracker_1_cor_20_kuholdthecorrectiontorangeappliedduetotheretrackingforeachofthe(upto)threeretrackers.
ItisnotpossibletolocatetheretrackingpointwiththeL2productsonly.OnewouldneedtouseL1BandL2intandemandinordertoachievethis:
1)ConvertL2heighttorangeusingthealtitudeat20HzfromtheL1B
2)Removethegeophysicalcorrections
3)RemovetheL1Brange(thewindowdelayconvertedtorange)
Overocean,whatisleftfollowingthestepsaboveistheactionoftheretracker.Thisisslightlymorecomplicatedovericeduetotheactionoftheslope.
The L2I also contain the range with only retracking and instrumental corrections applied (nogeophysicalcorrections)inthevariablesrange_1_20_ku,range_1_20_ku,andrange_1_20_ku.Thisallowstheusertoapplytheirowngeophysicalcorrections.

CryoSat-2ProductHandbook C2-LI-ACS-ESL-5319
P a g e 3 9 BaselineD1.0draft
2.4.6 BackscatteringTheradarbackscatteringcoefficient(sigma-0)providesinformationabouttheobservedsurface.Itisafunction of the radar frequency, polarisation and incidence angle and the target surface roughness,geometric shape and dielectric properties. A discussion of all these factors is given online athttp://earth.esa.int/applications/data_util/SARDOCS/spaceborne/Radar_Courses/Radar_Course_III/parameters_affecting.htm
Atlevel2,thebackscattercoefficientisfullycorrected,includinginstrumentgaincorrectionsandbias.Ameasurementismadeforeachretrackersig0_1_20_ku,sig0_2_20_ku,andsig0_3_20_ku.
2.4.7 PeakinessPeakinessisameasureofhowsharplypeakedanechoispeakiness_20_ku.Itisessentiallytheratioofthehighestbinvaluetothemeanvalueofallbinsabovetheretrackingpoint.Thehighertheratio,themorepeakedtheecho.Highpeakinessindicatesaveryspecularreflection,suchasthatfromleadsinseaice.
Furtherinformationisgiveninreference18.
Figure17:Peakinessbylatitude
Aboveshowsthetotalnumberofpointsavailableperdegreelatitude,between140Wand180WforMarch 2011 alongwith the number of pointswith ‘Pulse Peakiness’ (PP) above certain thresholds.HigherPPindicatesmore‘specular’waveformsi.e.moreliketooriginatefromleads.ThetotalnumberofCryosat-2measurementsbetween75Nand88N(between140Wand180W)is515000.
0100002000030000400005000060000700008000090000
75.5 76.5 77.5 78.5 79.5 80.5 81.5 82.5 83.5 84.5 85.5 86.5 87.5Center latitude (deg N)
Number of points per degree latitude between 140W and 180W, March 2011
Total points
Points PP>0.15
Points PP>0.20
Points PP>0.25

CryoSat-2ProductHandbook C2-LI-ACS-ESL-5319
P a g e 4 0 BaselineD1.0draft
BelowshowsthenumberofpointswithPPgreaterthancertainthresholdsasaproportionofthetotalnumber of points recorded, per degree latitude, forMarch 2011. The number of points varieswithlatitudeaccordingtotheproportionofseaicecover,aswellas,presumably,climatologicalconditions.
Figure18:Proportionofspecularpointsbylatitude
2.4.8 EffectsofTerrainSincethetypeofsurfaceaffectstheradarechoshape,adescriptionofthesurfaceatnadir,derivedfromthe TerrainBase digital terrain model from the NOAA, is also given surf_type_01, andsurf_type_20_ku.Seealsosection2.7.2andreference8.
2.4.1 InterferometricModeThe purpose of the SIN mode is to allow the across-track angle offset of the echoing point to bedetermineddirectly(using interferometricphase information). IntheL2SINdata, the20Hz latitudelat_poca_20_kuandlongitudelon_poca_20_kuvaluesprovidetheestimatedpositionofthepointofclosestapproach(ascomputedfromthephasedifference)andnotthenadir.ThenadirlocationisonlypresentintheL2dataat1Hzlat_01andlon 01.Each20Hzsampleproducesonlyonelocationontheground.
Itisimportanttonotethatphase-wrappingcanoccurwhentheacrosstrackoffsetisgreatenoughandthiscanhavetheeffectoftheechoappearingtocomefromtheothersideofthegroundtrack.Normally,this is flagged flag_sarin_ambiguity_warning_20_ku by use of an ambiguity DEMdem_height_20_kuthatshowswherethiseffectislikelytohaveoccurred,howevertheseDEMsareonlyavailableforGreenlandandAntarctica.Iftheuserobservesasequenceofrecordswithincreasing
0%
5%
10%
15%
20%
25%
75.5
76.5
77.5
78.5
79.5
80.5
81.5
82.5
83.5
84.5
85.5
86.5
87.5
Center latitude (deg N)
Proportion of 'specular' points per degree latitude between 140W and 180W, March 2011
Points PP>0.15
Points PP>0.20
Points PP>0.25

CryoSat-2ProductHandbook C2-LI-ACS-ESL-5319
P a g e 4 1 BaselineD1.0draft
across-track offset and then an abrupt switch to the other side of the track, it is likely that phase-wrappinghasoccurred.
2.4.2 SignificantWaveHeightSignificantwaveheight(SWH)swh_ocean_20_ku istheaveragewaveheight,troughtocrest,oftheone-thirdlargestwavesinaparticulargeographiclocation.SWHcanbederivedfrominspectionoftheecho waveform. The reflection from the wave crest is returned earlier than that from the trough,'stretching' the leadingedgeof thewaveform.Thestretching increaseswith increasingwaveheight.Althoughnotphysicalbutonlynumerical,negativevaluesofSWHarepreserved.
2.4.3 SeaStateBiasSeastatebiassea_state_bias_20_kuisacombinationofeffectsdependentonthewaveheightatthesurface. The electromagnetic (EM) bias effect arises because wave troughs are better reflectors ofenergy thanwavecrests,due to theirdifferentdistributionsofspecular-reflecting facets.This is thecorrectiongivenunderthetitleofseastatebiasinthelevel-2data.SeastatebiasisderivedfromamodelprovidedbyCLStoESA.Forageneraltreatmentofseastatebiasseereference14.
2.4.4 WindSpeedThe Abdalla2007 model is used to calculate wind speed wind_speed_alt_20_ku from the radarbackscatteringcoefficient.Seereference8.
2.5 RangeCorrectionsforAtmosphericEffectsAnaltimeterpulseisslowedslightlyasitpassesthroughtheEarth'stroposphereduetotherefractiveindexof the atmosphere.The conversionof timedelay to rangeusing the speedof light in vacuumthereforehastobecorrectedforthissmalladditionaldelay.Thespeedoflightusedintheprocessoris299792458.0metrespersecond.
2.5.1 DryandWetTroposphericCorrectionsThe dry tropospheric correction mod_dry_tropo_cor_01 compensates for the effect of non-polargasessuchasoxygenandnitrogen.Ithasatypicalrangefrom1.7to2.5m.
Thewettroposphericcorrectionmod_wet_tropo_cor_01compensatesfortheeffectofpolargases,mainlywatervapour.Ithasatypicalrangefrom0to50cm.
The dry and wet corrections rely on knowledge of the atmospheric pressure and temperatureobservationsmadeon theEarth surface.Theseare suppliedbyMeteoFrancevia theCNESSSALTOsystem,asdescribedinsection2.8andreference8.
TheWetTroposphericCorrectionisretrieveddirectlyfromECMWFanalysedgrids.Thesecorrectionfiles are then simply formatted to theCryosat-2PDS file standardbeforebeingdirectlyused in theprocessor.TheDryTroposphericCorrectiondoesnotcomefromanauxiliaryfilebutiscomputedbytheprocessorusingECMWFsurfacepressurefiles.Overwater(openwater,semi-enclosedseasorenclosed

CryoSat-2ProductHandbook C2-LI-ACS-ESL-5319
P a g e 4 2 BaselineD1.0draft
seasandlakes),thesurfacepressureisequaltothemeanpressureminustheclimatology(computedwiththepressuregrids).PhasesandamplitudesofS1andS2tidewavesprovidedasStaticAuxiliaryDatafilesarealsotakenintoaccount.Overland,theconsideredsurfacepressureisthemeanpressuresotheDryTroposphericCorrectionoverlandiscomputedwiththissolemeanpressure.
2.5.2 InverseBarometricCorrectionTheinversebarometriccorrectioninv_bar_cor_01compensatesforvariationsinseasurfaceheightduetoatmosphericpressurevariations,whichisknownasatmosphericloading.Ithasatypicalrangefrom-15to+15cmandiscalculatedfromdataprovidedbyMeteoFranceviatheCNESSSALTOsystem,asdescribedinsection2.8andreference8.ThiscorrectionisonlyusedinSARmodeandwherethesurfacetypeis“openocean”.
2.5.3 DynamicAtmosphericCorrectionThe dynamic atmospheric correction hf_fluct_total_cor_01 compensates for variations in seasurfaceheightduetoatmosphericpressureandwinds.Ithasatypicalrangefrom-15to+15cmandistakenfromtheMOG2DmodeldataprovidedbyMeteoFranceviatheCNESSSALTOsystem,asdescribedinsection2.8andreference8.ThiscorrectionisusedbySIN,SID,LRMandFDMwhenthesurfacetypeis“openocean”.
2.5.4 IonosphericCorrectionThe ionospheric correction, also called the ionospheric bias correction, compensates for the freeelectrons intheEarth's ionosphereslowingtheradarpulse.Solarcontrolof the ionosphere leadstogeographicandtemporalvariationsinthefreeelectroncontent,whichcanbemodelled,ormeasured,forexampleusingtheGPSsatellitenetwork.Thecorrectionhasatypicalrangefrom0.06to0.12m.Thelevel-1b data product contains values derived from the Global Ionospheric Map (GIM)iono_cor_gim_01,whichusesGPSmeasurements,andfromtheBentmodeliono_cor_01.TheGIMisthenominalchoicewiththeBentmodelavailableasaalternativesolutionifGIMdataisnotavailable.TheGIMisdescribedonlineat:
http://iono.jpl.nasa.gov/gim.html
The Bentmodel is based on knowledge of a solar activity index, such as sunspot numbers, and isdescribedonlineat:
http://modelweb.gsfc.nasa.gov/ionos/bent.html
Thesolaractivityindexused(theR12index)isissuedmonthlyandisdefinedinreference5.
2.5.5 DerivationofCorrectionsMostoftheabovecorrectionsareprovidedonameteogrid,agroupof6dynamicfilescontaininggridsofsurfacepressure,oceanmean-sea-levelpressure,wetanddrytroposphericcorrectionsandU(east-west)andV(south-north)windcomponents.Inadditionastaticfileforthegriddefinitionisrequired.ThisistheGaussianAltimetricCorrectionGrid.Ameteogridcoversatimespanof6hours,andtwo

CryoSat-2ProductHandbook C2-LI-ACS-ESL-5319
P a g e 4 3 BaselineD1.0draft
meteogrids,onebeforeandoneaftertherequesteddateforthecorrection,areneeded.Thegridsareinterpolatedintimeandspacetoderiveacorrectionvalueforeachmeasurement.
Thesefilesarefurtherdefinedinreference8.
2.5.6 ApplicationofCorrectionstoRangeTheabovecorrectionsareaddedtotherangemeasurementtogivethetruerange.
Furtherbackgroundinformationisgiveninreferences9and10.
2.6 RangeCorrectionsforTidalEffectsAlltidalcorrectionsadjusttherangetoappearasifitcamefromthemeanlandicesurface,ortide-freeseasurface.ThefieldTotalGeocentricOceanTide(field#55)intheFDMproductsisnotthesameastheOceanTidefieldinthenominalL1BandL2products.WiththeFDMproducts,thesameconventionasmanyotheraltimetryproducts, suchas forEnviSat, Sentinel-3and Jason-2, isused,where the totalgeocentric ocean tide provided in the products includes the loading tide and the long period tide.HoweverinthenominalL1Bproducts,the“oceantide”fielddoesnotincludetheloadingtideorthelongperiodtide.FortheL2product,theusersdonotneedtoapplyanytidesastheyareappliedduringthecomputation of height. However, if they areworkingwith the L1B product and deriving their ownsurfaceheightthentheyshouldapplythesetoftidesandmeteorologicalcorrectionsintheL1Bthatissuitablefortheirspecificusage.
2.6.1 OceanTideTheoceantidecorrectionocean_tide_01removestheeffectsof localtides i.e. thosecausedbytheMoon,andthelong-periodequilibriumoceantidecorrectionocean_tide_eq_01removestidaleffectsduetotheSun.Typicallythiscorrectionrangesfrom-50to+50cm.TheFES2004oceantidemodelisusedforthiscorrection.Thisisfurtherdescribedinsection2.8andreference8.
2.6.2 OceanLoadingTideTheoceanloadingtidecorrectionload_tide_01removesthedeformationoftheEarth'scrustduetotheweightoftheoverlyingoceantides.Typicallythiscorrectionrangesfrom-2to+2cm.TheFES2004loadingtidemodelisusedforthiscorrection.Thisisfurtherdescribedinsection2.8andreference8.
2.6.3 SolidEarthTideThesolidEarthtidecorrectionsolid_earth_tide_01removesthedeformationoftheEarthduetotidalforcesfromtheSunandMoonactingontheEarth'sbody.Typically,thiscorrectionrangesfrom-30to+30cm.TheCartwrightmodelisusedforthiscorrection.Itisfurtherdescribedinsection2.8andreference8.
2.6.4 GeocentricPolarTideThegeocentricpolar tide correctionpole_tide_01 removesa long-perioddistortionof theEarth’scrust caused by variations in centrifugal force as the Earth’s rotational axis moves its geographic

CryoSat-2ProductHandbook C2-LI-ACS-ESL-5319
P a g e 4 4 BaselineD1.0draft
location.Typically,thiscorrectionrangesfrom-2to+2cm.Itisderivedfromthepolelocationfiles.Itisfurtherdescribedinsection2.8andreference8.
2.6.5 ApplicationofCorrectionstoRangeTheabovecorrectionsareaddedtotherangemeasurementtogivethetruerange.
Forfurtherinformationseereferences9and11.
2.7 DerivingRangeThewindowdelayismeasuredfromthesignalemissiontimetothecentreoftherangewindow.Atlevel1btheengineeringcalibrationsarealreadyappliedtothewindowdelay,astheDopplercorrectionandtheCOMoffset. Thus, the rangemeasurementhas its origin atCryoSat-2COM (asdoes the altitudemeasurement),andendsat thecentreof therangewindow,point(b) in fig2.5.5-1.Thegeophysical(atmospheric and tidal corrections) are not applied at level 1b. Range can be calculated using theparametersinthedataproduct,takingintoaccountthesurfacetype.
Thefollowingequationisapplicable:
range=(0.5*c*windowdelay)+retrackingcor.+surface-dependentgeophysicalcor. (Eqn2.7-1)
wherecisthespeedoflightinvacuum.
AtL2,20measurementshavebeencorrectedusingthe1Hzcorrections.Nofurtherinterpolationisdoneandthesame1Hzcorrectionisusedforall20measurementsasthecorrectionsareslowlyvarying.The20Hzand1Hzmeasurementscanbeassociatedviatheindexvariablesind_first_meas_20hz_01andind_meas_1hz_20_ku.
2.7.1 GeophysicalCorrectionsbySurfaceSurface height w.r.t. reference ellipsoid = altitude - (retracked range + corrections), where thegeophysicalcorrectionsnecessaryovereachsurfaceareasfollows:
• SeaIce:o Tides:
§ Oceantide§ Longperiodequilibriumoceantide§ Oceanloadingtide§ SolidEarthtide§ Geocentricpolartide
o Atmosphere:§ Drytroposphericcorrection§ Wettroposphericcorrection§ Ionosphericcorrection

CryoSat-2ProductHandbook C2-LI-ACS-ESL-5319
P a g e 4 5 BaselineD1.0draft
§ Inversebarometriccorrection
• LandIce:o Tides:
§ Oceanloadingtide§ SolidEarthtide§ Geocentricpolartide
o Atmosphere:§ Drytroposphericcorrection§ Wettroposphericcorrection§ Ionosphericcorrection
• Ocean:
o Tides: § Oceantide§ Longperiodequilibriumoceantide§ Oceanloadingtide§ SolidEarthtide§ Geocentricpolartide
o Atmosphere:§ Drytroposphericcorrection§ Wettroposphericcorrection§ Ionosphericcorrection§ Dynamicatmosphericcorrection
o Other: § Seastatebias
2.7.2 SurfaceTypeNotethatalthoughaflagforsurfacetypeexistsatbothL1bsurf_type_01andL2surf_type_20_ku,atL1bitisonlyprovidedat1Hzresolution,whichislowerthanthe20Hzmeasurementresolution.Usersmustbecarefulininterpretingthisflaginboundarieswhenselectingtherangecorrectionsneeded.TheDTM2000staticgridprovidesfourstatesoftheflag:0=openoceansorsemi-enclosedseas;1=enclosedseasorlakes;2=continentalice;3=land.
2.7.3 Level-2ApplicationAt level 2, altitude and height are given, as well as uncorrected range. All corrections are alreadyincorporatedintheheightmeasurement.Theyarelistedinthedatasetsothattheycanberemovedorreplacedifrequired.

CryoSat-2ProductHandbook C2-LI-ACS-ESL-5319
P a g e 4 6 BaselineD1.0draft
2.8 ModelsUsed
2.8.1 StaticAuxiliaryDataFilesThistableliststhestaticauxiliarydatafilesusedinprocessingthedata.Thesecontainthemodelsused,aslistedinreference8fordataprovidedviatheEarthExplorerGeoCorrectionsCFI.
Theslopemodeldata(AUX_SLPMSL)iscreatedfromthefollowingDEMs:
• Helm,Veit;Humbert,Angelika;Miller,Heinz(2014):ElevationModelofAntarcticaderivedfromCryoSat-2 in the period 2011 to 2013, links to DEM and uncertainty map as GeoTIFF.https://doi.org/10.1594/PANGAEA.831392
• Helm,Veit;Humbert,Angelika;Miller,Heinz(2014):ElevationModelofGreenlandderivedfromCryoSat-2 in the period 2011 to 2013, links to DEM and uncertainty map as GeoTIFF.https://doi.org/10.1594/PANGAEA.831393
TheambiguityDEMs(AUX_DEMMSL)arecreatedfrom:
• Bamber,JonathanL.,JoseLuisGomez-Dans,andJenniferA.Griggs.2009.Antarctic1kmDigitalElevation Model (DEM) from Combined ERS-1 Radar and ICESat Laser Satellite Altimetry.Boulder,ColoradoUSA:NationalSnowandIceDataCenter
• HowatI.M.,A.NegreteandB.E.Smith,2014,TheGreenlandIceMappingProject(GIMP)landclassificationandsurfaceelevationdatasets,TheCryosphere,8,1509-1518
Filesof'grid'typehavedatadistributedonageographicalgrid.Filesof'data'typearenon-geographical.
Table3:Staticauxiliaryfiles
TypeString
(inFilename)
Description Type Parameters(gridonly)
Alllongitudecoverageis[0,360]degrees
AUX_GEOID_ EGM96geoidvalues grid Latcoverage[-88,88]degrees
Stepinlatitude:0.25degrees
Stepinlongitude:0.25degrees
AUX_MICOEF Bent ionospheric coefficientsfile
data
AUX_DIPMAP
BentModifiedDipMapfile grid Lat.coverage:[-88,88]degrees
Stepinlatitude:2degrees
Stepinlongitude:2degrees

CryoSat-2ProductHandbook C2-LI-ACS-ESL-5319
P a g e 4 7 BaselineD1.0draft
AUX_MSSURF
UCL13MeanSeaSurfacevalues grid Lat.coverage:[-80,88]degrees
Stepinlatitude:0.0625degrees
Stepinlongitude:0.0625degrees
AUX_SDC_nn
UCL04SnowDepthClimatologymodel(nn=monthnumber)
grid Lat.coverage:[0,90]degrees
Stepinlatitude:0.0625degrees
Stepinlongitude:0.0625degrees
AUX_SICCnn
UCL04 Sea Ice ConcentrationClimatology (nn= monthnumber)
grid Lat.coverage:[-90,90]degrees
Stepinlatitude:0.0625degrees
Stepinlongitude:0.0625degrees
AUX_SLPMSL MSSL High resolution Slopemodels of Greenland andAntarctica
grid CartesiangridscoveringAntarctica,grid step = 1km, and Greenland,gridstep=800m
AUX_DEMMSL MSSL high-resolution DEMs ofGreenlandandAntarctica
grid CartesiangridscoveringAntarctica,grid step = 1km, and Greenland,gridstep=800m
AUX_OCTIDE
FES2004 ocean tide modelvalues
grid Lat.coverage:[-90,90]degrees
Stepinlatitude:0.125degrees
Stepinlongitude:0.125degrees
AUX_TDLOAD
FES2004 loading tide modelvalues
grid Lat.coverage:[-90,90]degrees
Stepinlatitude:0.25degrees
Stepinlongitude:0.25degrees
AUX_ODLE__ MACESS Ocean Depth/LandElevationvalues
grid Lat.coverage:[-90,90]
StepinLatitude:1/30degrees
Stepinlongitude:1/30degrees
AUX_CARTWR CartwrightandEddentables data
AUX_LS_MAP
Four states surfaceidentification grid created byCLS/CNES from GMT,GlobCover, Modis Mosaic of
grid Lat.coverage:[-90,90]
StepinLatitude:1/30degrees
Stepinlongitude:1/30degrees

CryoSat-2ProductHandbook C2-LI-ACS-ESL-5319
P a g e 4 8 BaselineD1.0draft
Antarctica, and Water bodyoutlinesfromLEGOS.
AUX_PRSS00
AUX_PRSS06
AUX_PRSS12
AUX_PRSS18
Climatologypressuregrids,fourperday,for0h,6h12hand18h.Each grid point contains 12values of climatologicalpressure,oneforeachmonthoftheyear
grid Latcoverage:[-90,90]degrees
Stepinlatitude:0.5degrees
Stepinlatitude:0.5degrees
AUX_S1AMPL
AUX_S2AMPL
The S1 and S2 tide grids ofmonthly means of globalamplitude. Each grid pointcontains12valuesofamplitude,oneforeachmonthoftheyear
grid Latcoverage:[-90,90]degrees
Stepinlatitude:1.125degrees
Stepinlatitude:1.125degrees
AUX_S1PHAS
AUX_S2PHAS
The S1 and S2 tide grids ofmonthlymeansofglobalphase.Each grid point contains 12values of phase, one for eachmonthoftheyear.
grid Latcoverage:[-90,90]degrees
Stepinlatitude:1.125degrees
Stepinlatitude:1.125degrees
AUX_WNDCHE Abdalla2007windspeedtable data Sigma0coverage:[5,19.6]
StepinSigma0:0.2
2.8.2 DynamicAuxiliaryDataFilesThedynamicauxiliarydatafilesusedaremainlysuppliedbySSALTO,SystèmeauSold'ALTimétrieetd'Orbitographie.Theyhaveawebpresenceat:
http://www.aviso.oceanobs.com/es/data/product-information/ssalto/index.html
Theysupply:
• theDORISUSOdriftcorrection• themeteorologicalfiles,sourcedfromMeteo-FranceviaSSALTO,basedondatafromECMWF• thehistoricalpolelocationfiles,usedtoderivethegeocentricpolartide• thesolaractivityR12indexfiles,usedintheBentmodelionosphericcorrections• thedailyGIMfiles(GIMistheGlobalIonosphericMap)• thedailyMOG2Dfiles(MOG2Disabarotropicmodelusedfordynamicatmosphericcorrection)
Thedynamicsea-iceconcentrationfilesareprovidedbyUniversityCollegeLondon,andareonlineathttp://cryosat.mssl.ucl.ac.uk/dsicTheseconcentrationsarederivedfromtheNRTDMSPSSMIdataofNSIDC.

CryoSat-2ProductHandbook C2-LI-ACS-ESL-5319
P a g e 4 9 BaselineD1.0draft
DORISUSODrift CS_OPER_AUX_DORUSOGPSIonosphericMap CS_OPER_AUX_IONGIM(dailyfile)InstantaneousPolarLocation CS_OPER_AUX_POLLOC(dailyincrement)DynamicSeaIceConcentration CS_OPER_AUX_SEA_IC(eachfilehasavalidityof3days)SolarActivityIndex CS_OPER_AUX_SUNACT(monthlyincrement)SurfacePressure CS_OPER_AUX_SURFPS(dailymeteofilesfor00,06,12,18h)OceanMeanPressure CS_OPER_AUX_SEAMPS(dailymeteofilesfor00,06,12,18h)WEWindComponent CS_OPER_AUX_U_WIND(dailymeteofilesfor00,06,12,18h)SNWindComponent CS_OPER_AUX_V_WIND(dailymeteofilesfor00,06,12,18h)WetTroposphereCorrection CS_OPER_AUX_WETTRP(dailymeteofilesfor00,06,12,18h)Dynamic Meteo Correction fromGravityWaveModel
CS_OPER_AUX_MOG_2D(dailymeteofilesfor00,06,12,18h)
GaussianAltimetricGrid CS_OPER_AUX_ALTGRD(updatedonlywhenthehorizontalspatialresolutionoftheECMWFmodelchanges)

CryoSat-2ProductHandbook C2-LI-ACS-ESL-5319
P a g e 5 0 BaselineD1.0draft
3 Cryosat-2DataSupply
3.1 Cryosat-2GroundSystemThe operational ground system (PayloadData System) is located at the Kiruna receiving station inSweden.Cryosat-2dataproductsaredistributedbyFTPfromthissite.
3.2 Cryosat-2UserProducts
3.2.1 Level-2GeophysicalDataRecordThemainuserproductisthelevel-2GDR(GeophysicalDataRecord),whichfulfilstheneedsofmostscientificresearchers.TheGDRcontainsthetimeofmeasurement,thegeolocationandtheheightofthesurfaceabovethereferenceellipsoid.Theheightisfullycorrectedforinstrumenteffects,propagationdelays,measurementgeometry, andothergeophysical effects suchas atmospheric and tidal effects.AdditionallytheGDRcontainssomemodeandqualityflagginginformationandincludesthegeophysicalcorrectionsthatwereusedtocomputetheheightmeasurement.FormeasurementsmadeinSARmodeafreeboardheight,i.e.theheightbywhichanicefloeextendsabovethewatersurface,iscomputedoversea ice. For measurements made in SINmode the location includes any across-track offset due totopography.Theorbitlocationisalsoincluded.Measurementsarecomputedalongtrackatintervalsofapproximatelyevery300metres.
TheGDRissuppliedinfull-orbitsegmentsstartingandendingattheequator.Thismeansthatallthemeasurementsmadeineachmode,andprocessedbydifferentchains,areconsolidated,incorrecttimeorder,andsharethesamerecordformat.
The frequency of consolidated L2 data records is approximately one per second, but each recordcontainsablockof20higher-ratemeasurements.ConsolidatedL2datafilesarepartitionedintowhole-orbitsegmentscutattheascendingequatorcrossingnode(ANX)andthereforeeachconsolidatedL2productisapproximately4948secondslong.
L2dataarealsoavailablebymode.ThishasexactlythesamefileandrecordformatastheGDRbutthedatafilesaresegmentedbymeasurementmodeandtheirlengthisvariable.
3.2.2 FreeboardProcessingPrevioustobaselineCproducts,twoflavoursofGDRexisted, identifiedbythestringSIR_GDR_2AorSIR_GDR_2Binthefilename.Inthe‘2A’versionthefinalstageofprocessingoverseaicehadnotbeenrunandthefreeboardfieldisfilledwith-9999.The‘2B’versionwasusedtovalidatetheprocessing.
Now the freeboardmeasurements are validated, the identification stringwill switch to SIR_GDR_2_,whichwillbetheonlyflavourofGDRdistributedforbaselineCandlater

CryoSat-2ProductHandbook C2-LI-ACS-ESL-5319
P a g e 5 1 BaselineD1.0draft
3.2.3 SlopeCorrectionIngeneral,overlandicethelevel-2SINandLRMdataareslope-corrected.TheSINslopecorrectioniscalculatedfromtheinterferometricphaseandtheLRMfromadigitalelevationmodel(DEM).Detailsaregiveninreference3.
ForSINmode,theechoinglongitudeandlatitudedifferfromnadiraccordingtotheacross-trackoffsetcomputedfromthephasedifference.InLRMmode,theydifferfromnadiraccordingtotheresultoftheslope-correctionalgorithmandtheslopemodelisusedintheprocessortodeterminewherethefirstreturncamefrom.ThemethodusedforthisissimilartoENVISAT.Pleasenote,inSINmode,theDEMisnotusedtodeterminewheretheechocamefrom.Instead,itisusedtoprovideaflagthatstateswhethertheechomaybeambiguousduetophasewrapping.
The DEM used for LRM slopemodel creation is not the same as the DEM used for SIN ambiguitydetection.
FortheslopemodelintheLRMprocessing,thefollowingDEMsareusedtocreatetheslopemodels:
• Helm,Veit;Humbert,Angelika;Miller,Heinz(2014):ElevationModelofAntarcticaderivedfromCryoSat-2 in the period 2011 to 2013, links to DEM and uncertainty map as GeoTIFF.https://doi.org/10.1594/PANGAEA.831392
• Helm,Veit;Humbert,Angelika;Miller,Heinz(2014):ElevationModelofGreenlandderivedfromCryoSat-2 in the period 2011 to 2013, links to DEM and uncertainty map as GeoTIFF.https://doi.org/10.1594/PANGAEA.831393
FortheambiguitydetectionintheSARinmodeprocessing,thefollowingDEMsareused:
• Antarctica: Bamber,JonathanL.,JoseLuisGomez-Dans,andJenniferA.Griggs.2009.Antarctic1km Digital Elevation Model (DEM) from Combined ERS-1 Radar and ICESat Laser SatelliteAltimetry.Boulder,ColoradoUSA:NationalSnowandIceDataCenter.Digitalmedia.
• Greenland:Howat,I.M.,A.Negrete,B.E.Smith,2014,TheGreenlandIceMappingProject(GIMP)land classification and surface elevation datasetsThe Cryosphere, 8, 1509-1518,doi:10.5194/tc-8-1509-2014
3.2.4 Level-1bDataLevel-1bdataarereceivedbysomeusersinterestedintheSIRALinstrumentperformance,andbysomeinterested in algorithm development. It contains time and geolocation information and the SIRALmeasurementsinengineeringunits.Calibrationcorrectionsareincludedandhavebeenappliedtothewindowdelaycomputations.Signalpropagationdelaysandothergeophysicalcorrectionsareincludedintheproductbuthavenotbeenappliedtotherangeortimedelay.
L1Bdataissegmentedaccordingtomeasurementmodeandeachmodehasaslightlydifferentrecordformattoaccommodatethedifferenceintheechoes.

CryoSat-2ProductHandbook C2-LI-ACS-ESL-5319
P a g e 5 2 BaselineD1.0draft
Inpulse-limited(orLRM)modeaveragedpowerechoesareincludedasforpreviousaltimetermissions.Echoesare128samples(or‘bins’)long.
InSARmodetheechoeswhichresult fromDopplerbeamformationareincludedandconsistof256samples.ThereareadditionalparameterswhichcharacterisethedistributionofenergyacrossthesetofDopplerbeamswhicharedirectedatacommonsurfacelocation.
InSINmodetheechoesresultingfromtheDopplerbeamformationprocessconsistof1024samples.Fromtheinterferometricprocessingthereisalsoanarrayof1024phasedifferences,andanarrayof1024coherenceterms,computedbycomparingtheechoesreceivedbybothantennas.
3.2.5 NearRealTimeDataNear-real-timedataisderivedfromthesciencedatastream.Itcanbeusedforoperationaloceanographyandmeteorology,andtoallowmonitoringofsatellitehealthandsafetybeyondthelimitsofthenormalhousekeeping telemetry. It is sometimes tailored to specific requirements during calibration andvalidationcampaigns,anddetailsmustbeobtainedonacampaignbycampaignbasis.Seereference3.
NearReaTimeproductsderivingfromStarTrackerRefinedproductsareavailableafter24hoursfromthedataacquisition,becauseofthedependencyfromtheStarTrackerRefining.
To allow availability of “real” Near Real Time SAR and SARIN products, a different chain has beendedicatedtothespecificoperationalmodetoallowthegenerationofSAR/SARINNRTproductsinshorttime(2/3hours):theStarTrackerRefinedproductisreplacedbytheStarTrackerLevel0products,availableatthetimeofthedownlink.
Backgroundinformationisgiveninreferences4and12.
3.2.6 FastDeliveryMarineModeDataFastDeliveryMarineMode(FDM)dataproductsareproducedfromLRMdataonly,processedassoonaspossibleafteracquisition.
3.3 FileStructureCryosat-2productsarecomprisedoftwofiles,anXMLheaderfile,alwaysnamedwitha.HDRextension,andaproductfile,alwaysnamedwitha.DBLextension.
Foragenericuser,theDBLfileshouldbeenoughtoperformscientificuseofthedata,withouttheneedofthecorrespondingHDRfile.TheHDRfileisanauxiliaryASCIIfilewhichisdesignedtoallowtheusertoquicklyidentifytheproductwithoutlookinginsidetheDBL,howeveritisnotmandatoryforscientificuseofthedata.
EachCryosat-2productiscomposedoftwofiles:
-XMLHeaderFile(.HDR);thisconsistsofaFixedHeaderandaVariableHeader

CryoSat-2ProductHandbook C2-LI-ACS-ESL-5319
P a g e 5 3 BaselineD1.0draft
-ProductFile(.DBL);thisisinnetCDFformat.
AlloftheinformationprovidedintheFixedHeaderoftheHDRfileislistedbelowandmostofthisisactuallyalsoavailableintheDBLfilesasglobalattributes:
<File_Name>;<File_Description>;<Notes>;<Mission>;<File_Class>;<File_Type>;<Validity_Start>;<Validity_Stop>;<File_Version>;<System>;<Creator>;<Creator_Version>;<Creation_Date>
It should be noted that the fields in the Fixed Header of the HDR are named and orderedslightlydifferentlyintheDBLbutthecorecontentofeachfieldisthesame.
TheVariableHeaderoftheHDRconsistsofanXMLMPHandanXMLSPHwhichhaveactuallybeenderivedfromthecorrespondingattributesfromtheDBLfile,consequentlyalltheinformationprovidedinthisVariableHeaderofbothHDRandDBListhesame.
TheXMLheaderfilehasafixedportionandavariableportion.ThefixedportionhasthesameformatinallCryosat-2files.ThevariableportioncontainsmuchofthesameinformationastheglobalattributesintheproductfilebutinXMLformat.
3.4 FileNamingConventionFilenamesareconstructedaccordingtostandardguidelinesforEarthExplorermissions.Allfollowtheconventionalform
MM_CCCC_TTTTTTTTTT_yyyymmddThhmmss_YYYYMMDDTHHMMSS_vvvv.ttt
where:
MM=themissionidentifier,whichisCSforCryosat-2
CCCC=fileclasswhichcanbe:OFFL(Off-LineSystematicProcessing),NRT_(NearRealTime),RPRO(ReProcessing),TEST(Testing),LTA_(LongTermArchive)
TTTTTTTTTT=filetypeasdefinedinTable4below
yyyymmddThhmmss=starttimewindowasextractedfromJobOrder
YYYYMMDDTHHMMSS=stoptimewindowasextractedfromJobOrder
AvvvorBvvv=theversionnumberofthefile.Thiscanbeincrementedinthecaseofreprocessing.“A”correspondstoIPF1versionJandIPF2versionIorpreviousversions.“B”correspondstoIPF1versionKandIPF2versionJ.
ttt=theextension:tgzforagzippedtarfile,HDRforanextractedheaderandDBLforextractedbinarydata.

CryoSat-2ProductHandbook C2-LI-ACS-ESL-5319
P a g e 5 4 BaselineD1.0draft
Table4:RelevantFileTypes
Filetype Description
SIR_LRM_1B SIRALLRMlevel1b
SIR_SAR_1B
SIR_SARN1B
SIRALSARmodelevel1b
SIRALSARNRTmodelevel1b
SIR_SIN_1B
SIR_SINN1B
SIRALSINmodelevel1b
SIRALSINNRTmodelevel1b
SIR_LRM_2_ SIRALLRMlevel2
SIR_SAR_2_
SIR_SARN2_
SIRALSARmodelevel2withicefreeboardmeasurements
SIRALSARNRTmodelevel2withicefreeboardmeasurements
SIR_SIN_2_
SIR_SINN2_
SIRALSINmodelevel2
SIRALSINNRTmodelevel2
SIR_SID_2_ SIRALdegradedSINmodelevel2
SIR_GDR_2_ SIRALgeophysicaldatarecordwithicefreeboardmeasurements
Thistableshowsonlythefiletypesrelevanttothescientificdata.Calibrationmodesandintermediatefiles(FBRandL2I)areexcluded.
Thegeophysicaldatarecords(GDR)meetmostscientificneeds.AGDRcoversafullorbit,startingandendingattheascendingnodeattheequator,andcontainstime-orderedrecordsofdatafromallSIRALsystematicmodes(hencenoFDM).
3.5 OtherConventionsBackgroundinformationonallsectionsbelowcanbefoundinreference12.
3.5.1 LatitudeandLongitudeLimitsLongitudeisexpressedfrom-180to+180degrees.Positiveeastdoesnotcontain180.0,negativewestdoescontain-180.0.ThisisthesamedefinitionasusedbyEnviSat.

CryoSat-2ProductHandbook C2-LI-ACS-ESL-5319
P a g e 5 5 BaselineD1.0draft
3.5.2 RangeCorrectionSignConventionThesignconventionforallrangecorrectionsisthattheyareaddedtorange.
Sincesatellitealtitude–rangemeasurement=surfaceheight (Eqn3.5.2-1)
itfollowsthat
satellitealtitude–(rangemeasurement+ionosphericcorrection)=surfaceheightcorrectedfortheionosphereeffect (Eqn3.5.2-2)
3.5.3 TimestampFormatThetimestampsinthemeasurementdatasetrecordsareTAItimesinsecondspast00:00:00on1-JAN-2000.
Notethat:
i)ThetimeinthemainandspecificproductheadersisinUTCandnotinTAI
ii)TimecorrelationsbetweenUTCandTAIareprovidedviatheorbitfiles-thesemustaccountforthecorrectoffsetsduetoleapseconds
iii)1Jan2000at00:00UTC=1Jan2000at00:32TAI
See the Hong Kong Time Service website for a detailed discussion of time measurement.http://www.hko.gov.hk/wservice/tsheet/timeserv.htm
3.5.4 TimeinL2GDRRecordsIn L2 products a record contains a group of 20measurements together with a single set of otherparameters.Thisgivesadatarateofapproximatelyonerecordpersecond,or1Hz,withmeasurementsatapproximately20Hz.Timestampsforbothareprovidedasabove.
Itisimportanttonotethatthe1Hztimecorrespondstothefirstofthe20measurementsandnotthemiddle. This is different from previous altimetry missions, such as ERS and EnviSat, but for goodreasons.
Unlike previous missions the instrument telemetry does not create the block of 20 high-ratemeasurementswith the1Hzparameters. In thecaseofCryosat-2 this ispurelya choicewithin thegroundprocessingsystemtoreducetheL2datavolume.ThetimestampforrecordsintheSARandSINmodes is a functionof theDopplerbeamprocessingandnot associatedwith aparticular telemetrypacket.Ifagroupof20measurementsspansameasurementmodechange(oreven2)thentheintervalbetweeneachofthe20blockswillnotberegular.Thiswouldmakeaconsistentdefinitionofa‘middle’timeratherdifficult.Furthermore,ameasurementstreammayendatanypointwithintheblockof20.Inwhichcasetheunusedblocksarezero-filledandonlyservetopadoutthedatarecord.Onecanonlybesurethatthereisatleastonemeasurementinarecordof20.

CryoSat-2ProductHandbook C2-LI-ACS-ESL-5319
P a g e 5 6 BaselineD1.0draft
Forthesereasonsthe1Hztimeisprovidedcorrespondingtothefirstmeasurementofthe20.

CryoSat-2ProductHandbook C2-LI-ACS-ESL-5319
P a g e 5 7 BaselineD1.0draft
4 ReferencesandAcronyms
4.1 ReferenceDocuments[1] Anglemeasurementwith a phasemonopulse radar altimeter, J.R. Jensen, IEEE Transactions onAntennasandPropagation,Vol47,No4,April1999
[2]Cryosat-2IPF1InputandOutputDefinitionDocumentCS-IS-MSL-GS-0001
[3]Cryosat-2MissionandDataDescriptionCS-RP-ESA-SY-0059
[4]CryoSat:AmissiontodeterminethefluctuationsinEarth'slandandmarineicefields,Winghametal,AdvancesinSpaceResearch,Volume37,Issue4,2006,Pages841-871
[5]PDS-SSALTOInterfaceControlDefinitions,CS-ID-ACS-GS-0123
[6]SpecificationD'InterfacesInternesSSALTO:OrbitographieMissionSMM-IF-M6-EA-20174-CN
[7]CryoSat2PreciseOrbitContextCS-TN-ESA-SY-0239
[8]EarthExplorerGeoCorrectionsUserManualCS-MA-CLS-GS-0001
[9]Correctionsforaltimeter low-levelprocessingattheEarthObservationDataCentre,Cudlipetal,InternationalJournalofRemoteSensing,Volume15,Issue4,March1994,pages889-914
[10]IPF1DetailedProcessingModelCS-TN-ACS-GS-5105version5.1
[11]D.E.CartwrightandA.C.Edden,Corrected tablesof tidalharmonics.Geophysical Journalof theRoyalAstronomicalSociety,Volume33,1973,pages253-264
[12]CryoSatIcenetCDFL1BProductFormatSpecificationC2-RS-ACS-ESL-5364
[13]CryoSatIcenetCDFL2ProductFormatSpecificationC2-RS-ACS-ESL-5265
[14]SeaStateBiasinRadarAltimetryRevisited,HausmanandZlotnicki,MarineGeodesy33(S1):336-347,2010
[15]SIRAL,aHighSpatialResolutionRadarAltimeterfortheCryosat-2Mission,Reyetal,GeoscienceandRemoteSensingSymposium,2001.IGARSS2001.IEEE2001International,vol7,pages3080-3082
[16]EarthExplorerMissionCFIOrbitSoftwareUserManualEE-MA-DMS-GS-0004
[17]EarthExplorerFileFormatStandardsPE-TN-ESA-GS-0001
[18]Cryosat-2L2ProcessorDesignSummaryDocumentCS-DD-MSL-GS-2002
[19]TheMeanEchoandEchoCrossProductFromaBeamformingInterferometricAltimeterandTheirApplicationtoElevationMeasurement,Winghametal,IEEETransactionsOnGeoscienceAndRemoteSensing,Volume42,No10,October2004,pages2305-2323

CryoSat-2ProductHandbook C2-LI-ACS-ESL-5319
P a g e 5 8 BaselineD1.0draft
[20]Cryosat-2IPF1DesignSummaryDocumentCS-DD-MSL-GS-0008
[21]BrownModelDerivativesWalter,Smith09June2009;revised19May2011.
[22]Cryosat-2IPF2Sigma-zeroTechnicalNote,CS-TN-MSL-GS-6005
4.2 AcronymsandAbbreviationsAGC AutomaticGainControl
ANX AscendingequatorcrossingNode
API ApplicationProgrammingInterface
ASCII AmericanStandardCodeforInformationInterchange
CAL1-4 Calibrationmodes
CFI CustomerFurnishedItem
CoG CentreofGravity
CoM CentreofMass
DAC DynamicAtmosphericCorrection
DAD DynamicAuxiliaryData
DEM DigitalElevationModel
DFCB Dataformatcontrolbook
DORIS DopplerOrbitandRadiopositioningIntegrationbySatellite
DS DataSet
DSD DataSetDescriptor
DSR DataSetRecord
DTM DigitalTerrainModel
EM Electromagnetic
ESA EuropeanSpaceAgency

CryoSat-2ProductHandbook C2-LI-ACS-ESL-5319
P a g e 5 9 BaselineD1.0draft
ESL ExpertSupportLaboratory
FOS FlightOperationsSystem
GDR GeophysicalDataRecord
GIM GlobalIonosphericMap
GPS GlobalPositioningSystem
IBC InverseBarometricCorrection
IERS InternationalEarthRotationService
IPFDB InstrumentProcessingFacilitydatabase
ITRF InternationalTerrestrialReferenceFrame
L1B Level1b
L2 Level2
LRM LowRateMode(synonymouswithPulseLimitedMode)
LTA LongTermArchive
MDS MeasurementDataSet
MDSR MeasurementdatasetRecord
MJD ModifiedJulianDate
MOG2D Modèle2Dd'OndesdeGravité
MPH MainProductHeader
MSS MeanSeaSurface
MSSL MullardSpaceScienceLaboratory(UCL)
NOAA NationalOceanicandAtmosphericAdministration
NRT NearRealTime
ODLE OceanDepth/LandElevation
PDS PayloadDataSystem

CryoSat-2ProductHandbook C2-LI-ACS-ESL-5319
P a g e 6 0 BaselineD1.0draft
POE DORISPreciseOrbitEphemeris
RMS RootMeanSquared
Rx Receiver
SAD StaticAuxiliaryData
SAR SyntheticApertureRadar
SIN SARInterferometry
SBT SatelliteBinaryTime
SID SINdegradedmode
SIRAL SARInterferometricRadarAltimeter
SP SourcePacket
SPH SpecificProductHeader
SS SpaceSegment
SSALTO SystemeauSold'ALTimétrieetd'Orbitographie
SSHA SeaSurfaceHeightAnomaly
SWH SignificantWaveHeight
TAI InternationalAtomicTime(fromtheFrench,TempsAtomiqueInternational)
TEC TotalElectronContent
UCL UniversityCollegeLondon
USO Ultra-StableOscillator
UTC CoordinatedUniversalTime
XML ExtensibleMarkupLanguage