Embed Size (px)
Citation preview

CryogeniC TargeTs: CurrenT sTaTus and FuTure developmenT
LLE Review, Volume 114 57
IntroductionTwenty years ago the beta-layering mechanism was proposed for achieving a uniformly thick deuterium–tritium (DT)-ice layer in an inertial confinement fusion (ICF) capsule.1 Experi-ments with DT-filled capsules confirmed the feasibility of that mechanism,2 but only now have DT cryogenic targets been demonstrated to be reliably produced with the inner surface of the DT layer possessing the quality required for achieving ignition: a roughness better than 1.0-nm root mean square (rms). Importantly, these results were accomplished in equip-ment that interfaces with the OMEGA laser, which enables the targets to be imploded in ignition-relevant experiments. Achieving the ice-quality milestone demonstrated the feasibil-ity and adequacy of the beta-layering method, but repeatedly achieving high-quality ice layers is equally important since it allows ICF implosion experiments to be performed where other critical parameters can be varied.3 This article discusses the process and presents the important issues that affect the quality of the ice layer.
While targets with DT-ice layers are required to achieve ignition, targets with pure-deuterium (D2)-ice layers make it possible to (1) diagnose the areal density3 and (2) increase the throughput of cryogenic targets for experiments that could otherwise be achieved with DT because of the radiological complications with handling tritium. In the absence of heating from the decay of tritium, an alternative volumetric heating technique in D2 is based on the absorption of IR radiation.4 However, achieving uniform illumination of the capsule while minimizing the effect of energy absorbed in the support struc-ture of the target made it substantially more difficult to achieve the 1.0-nm-rms specification for D2 than for DT. Nevertheless, as our understanding of the ice layer’s sensitivity to the thermal environment has improved, so has our ability to better control the D2-ice quality; currently we are very close to the ice-quality requirement. The issues and complexities associated with layer-ing D2 are discussed here.
As our ability to reliably provide high-quality cryogenic targets for implosion experiments has progressed to a produc-
Cryogenic Targets: Current Status and Future Development
tion process, new technical challenges for producing cryogenic targets have presented themselves. The greatest challenge is to provide new types of targets for use on the National Ignition Facility: plastic shells that incorporate a foam ablator, targets that are filled through a fill tube rather than by permeation, and targets that are sub-cooled below the liquid–solid transition (19.7 K). These new research opportunities and issues associ-ated with them are presented in this article.
Cryogenic Target Production and CharacterizationThe design philosophy, equipment, capabilities, and opera-
tions used to produce cryogenic targets have been reviewed extensively.5 In summary, 0.9-mm plastic shells (2- to 10-nm wall) are mounted on very thin (1-nm-diam) spider silks and filled with D2, or DT, via permeation at 300 K, to a pressure of 1000 atm. The targets are subsequently cooled to 20 K, where the gas pressure is <1 atm, and transferred individually at cryogenic temperatures to portable equipment that contains the functionality to form the ice layer (60 to 100 nm thick) shown schematically in Fig. 114.1. Those aspects of the process
T2374JRC
5 nm CD
95 nm D2/DT
330 nm D2/DT
Ice
Gas
Figure 114.1Schematic of an OMEGA-scale cryogenic target.

CryogeniC TargeTs: CurrenT sTaTus and FuTure developmenT
LLE Review, Volume 11458
that relate directly to the quality of the ice layer are expounded upon in more detail in the following sections.
The method used to image and quantify the smoothness of the ice layer has also been reported previously,6 but the salient points are summarized because they are relevant to this discus-sion. The cryogenic target is rotated around its north–south axis and is viewed by two cameras elevated 12° and 26° above the equator and displaced 100° azimuthally. These viewing angles are defined by the pre-existing viewing angles for the OMEGA target chamber. Typically an image of the target is acquired for each 15° rotational increment, as shown in Fig. 114.2(a). Two concentric circles are evident—the outer circle is the limb of the plastic capsule and the inner circle corresponds to the interface between the ice layer and the inner gas void. From these images the radial position of the ice and plastic surfaces is measured to better than 1-nm precision. By combining all the images, the center of the sphere can be calculated, and the rms devia-tion of the measured position of the ice-layer position from the averaged sphere radius is the first estimate of the ice roughness [see Fig. 114.2(b)]. A more precise analysis involves fitting the data to spherical-harmonic coefficients to determine the power in the low modes ( < 12) [see Fig. 114.1(c)]. This analysis is inappropriate for quantifying higher-mode roughness because the surface is not uniformly sampled, and the northern and southern poles of the surface (<6% by area) are not sampled at all. Both conditions are a consequence of the inclined viewing angles of the camera and the rotational axis of the target. These higher modes are determined by averaging the Fourier modes obtained from the individual images. Together, a representative power spectrum is determined for the whole surface.
Cryogenic DT TargetsThe ice-roughness specification for a NIF cryogenic target
is shown in Fig. 114.2(b). This value along with the associated power spectrum presumes that the outer-surface ice layer is substantially smoother than the inner surface, so the rough-ness value is effectively a measure of the uniformity of the ice wall thickness.
Achieving the roughness specification requires forming a high-quality ice crystal to (1) minimize light scattered within the crystal that degrades the sharpness and continuity of the bright band and affects the accuracy of the shadowgraphic analysis and (2) achieve a constant thermal conductivity throughout the shell. A high-quality crystal is one without any features in the shadowgram image that are either crystal-lographic dislocations (facets, grain boundaries) within the ice or cracks at the inner surface of the ice, both of which can develop during the crystal growth phase.
1. Seed Crystal and Ice-Layer FormationCrystal formation involves initially freezing the liquid and
then allowing 1 h for the beta-layering process to establish an ice layer, which invariably has a polycrystalline structure. That layer is melted (temperature raised in 0.050-K increments at 1-h intervals) until only a small ice crystal (<200-nm diam) remains at the north pole, as shown in Fig. 114.3. The tempera-ture ramp is rapidly reversed (lowered 0.08 K in one step) and then lowered 0.02 K at the rate of 0.001 K every +20 min. The time lapse between the decrements is a qualitative judgment that is based on the rate the crystal grows. When the layering process appears to have stalled, the temperature is lowered
T2427JRC
(b)(a)
10–2
Pn
(nm
2 )
10–4
10–6
10–81 10
Mode
1001 10
Mode
100
Pow
er (n
m2 )
100
10–1
10–2
10–5
10–4
10–3
2-DFourier �ts
3-D Ylm �t
(c)
Ice 0.2-nm rms
NIF spec 1.0-nm rms
Figure 114.2(a) A shadowgraph image of a cryogenic target and (b) the Fourier power spectrum of the ice layer (the dotted line is the specification and the solid line the best recorded result of a single view of the target). (c) The spectral analysis of the 3-D surface is shown using a spherical-harmonic fit for the lower modes and an average of the 2-D Fourier fits for the higher modes.

CryogeniC TargeTs: CurrenT sTaTus and FuTure developmenT
LLE Review, Volume 114 59
another 0.02 K at the same rate. Once a contiguous ice layer exists, the temperature is decreased another 0.05 K at a constant rate (1 mK every 30 min), leaving an ice layer that is a single crystal, as shown in Fig. 114.4. Once all the liquid has solidified, the target is cooled another 0.1 K to complete the formation of a uniformly thick ice layer. The timing of the reversal of the temperature ramp is critical: if the seed crystal expands too rapidly, multiple dislocations and grain boundaries will develop
within the ice; alternatively, reversing the temperature ramp too late will melt the seed crystal because there is a thermal lag between the target and the layering sphere, which is the temperature-controlled surface.
While the protocol described above has been demonstrated to produce a desirable crystal structure, the dynamics of the crystal-growth phase is dependent on the environment around the target, the dimensions of the target and the layering sphere, and the amount of DT inside the capsule. A different protocol will be needed for forming ice layers in NIF-scale targets, especially when using the cryogenic equipment envisioned for the NIF, which requires that targets be filled through fill tubes. In the future, a NIF-scale target will be permeation filled with DT to determine whether the geometry and isothermal characteristics of the present layering sphere are sufficient for achieving the ice-roughness specification for the larger target. Separately, a newly constructed cryogenic system will be used to determine how to process targets possessing a fill tube (see Future Development, p. 69). Together, these data will guide the design of the front end of the NIF’s Target Insertion Cryo-stat to field direct-drive targets.
2. DT-Ice-Layer QualitySince DT cryogenic operations began in 2006, 21 target-
filling operations have been undertaken and 39 targets have been produced for implosions and to study the layering pro-cess. The average ice roughness of 31 targets studied (without foam ablators) is 1.0 nm (rms) with a range from 0.6 nm to
Figure 114.4Images of the target shown in Fig. 114.3 after layering were acquired using polarized light. The absence of any contrast suggests that the ice layer is composed of a single crystal. Images (a) and (b) are from separate cameras looking at the same target. Image (c) is an ice crystal grown in a cylindrical cell viewed through polarizing optics and showing three separate grains.
T2443JR
0
Pixe
ls
200
400
600
800
1000 (a)
0 200 400 600
Pixels
800 1000 0 200 400 600
Pixels
800 1000 6 mm
(b) (c)
T2428JRC
00 200 400 600
Pixels
Pixe
ls
800 1000
200
400
600
800
1000
Figure 114.3A cryogenic target containing liquid DT is shown at the beginning of the crystal formation phase. The small crystal at the top of the target seeds the ice layer.

CryogeniC TargeTs: CurrenT sTaTus and FuTure developmenT
LLE Review, Volume 11460
2.0 nm. The protocol for forming and then characterizing the ice requires approximately 12 h to complete, and there is a 60% probability that the ice-roughness specification can be achieved within 24 h of receiving the target.
Good repeatability of the layering process was demon-strated by repeatedly melting and re-layering the ice in the same capsule using the same protocol, as shown in Fig. 114.5,
and then repeating this with different capsules. The variation in the ice roughness when the layer was melted and reformed was very small (<0.4 nm), and the location of the thicker and thinner regions of the ice in each layer was different after the melt–relayer cycle. The residual roughness present in all of the targets studied showed that there was no statistical correlation between the ice roughness and the plastic capsule or the thermal environment surrounding the target.
3. FractionationA consideration when using DT is the possibility that the
deuterium and tritium fractions in the fuel will solidify at different temperatures because the heavier isotopes freeze at a slightly higher temperature (pure T2 at 20.62 K and DT at 19.79 K). We may expect tritium (T2 and DT) to freeze dispro-portionately early on during the cooling ramp, leaving excess tritium at the top of the target and closer to the plastic. This effect would be observed as a repeatable thickness variation in the ice (regions with excess tritium would be thinner due to heat generation from the tritium decay). The lack of any pattern in the ice-thickness distribution suggests that any fractionation that may occur is very small or that subsequent solid diffusion may minimize early-time fractionation.
4. Effect of Tritium Decay to 3He The decay of tritium to form 3He can affect both the ice-
layer quality and implosion performance. If helium entrapped within the ice has sufficient mobility to agglomerate into bubbles larger than 0.5 nm, the resulting perturbation will seed instabilities during the implosion.7 These larger-sized bubbles may also buckle the ice, adding to the intrinsic roughness. Alternatively, helium that diffuses through the ice into the central void will increase the gas density, and the additional work required to compress the gas during implosions can have a marginal effect on the performance of ignition experiments. While either possibility has an adverse effect, the time scale over which these events occur is important and the data pre-sented here are an attempt to better understand what happens to the 3He produced.
A cryogenic-DT-ice layer was aged for 19 days at a tem-perature close (within 0.2 K) to the triple-point temperature (19.79 K). Figures 114.6(a) and 114.6(b) show the ice-layer distribution before and after the aging, respectively. No bubbles or voids were observed. Another set of experiments were performed by lowering the temperature to induce grain boundaries, dislocations, and fractures into an ice layer. Inducing disturbances in the ice is expected to enhance 3He diffusion and provide voids where the gas could accumulate.
T2377JR
First ice layer
0.69-nm rms
Second ice layer
0.65-nm rms
Third ice layer
1.00-nm rms
–2 –1 0 1 2
Thickness variation (nm)
Figure 114.5The variation in the thickness of three separate ice layers (shown in an Aitoff projection) formed in the same cryogenic target shows the repeatability of the process.

CryogeniC TargeTs: CurrenT sTaTus and FuTure developmenT
LLE Review, Volume 114 61
Moreover, lowering the temperature increases the strain in the ice-crystal structure, which enhances the diffusivity of helium within the crystal.8 A cryogenic-DT layer aged for two days at 2 K below the triple point [Fig. 114.7(a)] showed no evidence of bubble formation, but small clusters of voids attributed to 3He were observed in another cryogenic-DT-ice layer [shown in Figs. 114.7(b) and 114.7 (c)], aged for seven days under the same conditions.
The appearance of bubbles many days after the ice layer was formed, and only when the ice was strained and fractured, suggests that the helium has limited mobility within a DT-ice crystal. The other possibility is that helium is highly mobile within the ice and diffuses rapidly to the center void; that eventuality would require helium atoms to be more mobile in defect-free, unstrained ice, which is counter to the observations and the general understanding of how gases diffuse through crystalline structures.8
Helium has very low solubility in hydrogen ice,9 and the size of the helium atom (0.3 Å) relative to the open structure of the DT-ice crystal (hexagonally close-packed structure with a 2.2-Å interstitial radius) is expected to allow rapid diffusion. However, there are data that may support the notion that helium is effec-tively trapped in the ice, which would be very desirable since the unavoidable decay of tritium may not have the deleterious effect on the ICF implosion described at the beginning of the
T2379aJRC
–5
5
0
Thi
ckne
ss v
aria
tion
(out
of
95 n
m)
(a) Initial quality, 1.0-nm rms
Initial 19 days at 19.5 K
(b) 19 days later, 2.0-nm rms
Figure 114.6Images of a cryogenic DT target and the associated ice-thickness distribution (a) initially and (b) after 19 days.
T2429JRx-axis camera y-axis camera
40 h at 17.7 K—no bubbles
(a)
(b) (c)
Figure 114.7(a) A fresh DT-ice layer was cooled 2 K below the formation temperature and aged for two days. (b) and (c) When aged for seven days, 2 K below the forma-tion temperature, black spots presumed to be 3He bubbles were observed.

CryogeniC TargeTs: CurrenT sTaTus and FuTure developmenT
LLE Review, Volume 11462
section. The decay product of tritium is a (3HeD)+ or (3HeT)+ ion (Ref. 10) that initially remains bonded to neighboring DT, D2, or T2 molecules in the lattice. A fraction of these ions will be neutralized by the electrons produced by the decay of nearby tritium atoms (which have a range of +0.6 nm in the ice), and then dissociate into 3He and T or D atoms. The latter two atoms rapidly recombine and are re-adsorbed into the lat-tice. The remainder of the 3HeT+ (and 3HeD+) ions may become incorporated into the lattice at interstitial octahedral sites and unable to migrate.10 Experimental evidence for this eventuality is from muon-catalyzed fusion studies11 that measure the time-dependent change of the fusion–neutron disappearance rate in ice and liquid-DT mixtures. The disparity in the neutron disap-pearance rate between the liquid (where there was no change) and ice (where the change increased with time) was attributed to the accumulation of 3He within the ice lattice.11
To provide a scale to the helium production rate, approxi-mately 1010 3He atoms are produced per second in the 0.18-mm3 ice volume of an OMEGA-scale target; that equates to +5 # 104 He atom/s in every 10-nm3 voxel, which collectively would form a 0.1-nm-diam bubble every second. The 10-nm scale length was chosen to reflect the limited diffusion path of helium atoms and is based on the range of b electrons in the ice to neutralize ionic species into more-mobile neutral atoms. After 19 days, 1.6 # 1016 helium atoms would have been pro-duced and bubbles that are clearly visible would be expected. (The size of the bubble depends on the Laplace pressure and permeability of the ice.) As observed, there were fewer than 103 bubbles (with a less than 10-nm-diam size) after the ice was aged for seven days, and then only when the ice was faceted and strained. The most likely inference from all the data is that He has limited mobility. Because this inference has far-reaching implications for the acceptable “shelf-life” of a DT-ice layer, this interpretation needs to be supported with direct measure-ments of the diffusivity of the 3He by-product of tritium decay through hydrogenic ice.
What was noticeable in the DT target that had been allowed to age [see Fig. 114.7] was the progressive deterioration in the quality of the ice layer. Interestingly, the power in the added roughness was in the lower Legendre modes ( < 10). This phenomenon is attributed to the constant rearrangement of the DT structure caused by the high-energy b-decay elec-trons breaking and reforming the crystal bonding structure. Approximately 1010 tritium atoms disintegrate every second in an OMEGA-scale DT target, produces high-energy electrons (up to 18 keV) with each electron capable of rupturing up to 105 molecular bonds that hold the lattice together. Clearly these
bonds reform rapidly, as the lattice remains intact, but this constant realignment of the crystal will allow for sizeable dif-fusivity of deuterium and tritium through the lattice and, with time, a possible re-ordering, or fractionation, of the isotopes. If, due to gravity, the heavier tritium atoms diffuse away from the north pole, the resulting lower volumetric heating there would make the ice thicker—which is what was observed. Not only would this increase the rms roughness of the ice but it would also create a variable areal density around the target that would affect the dynamics of the implosion.
5. DT-Ice Layers in Foam Ablator TargetsEfforts to characterize ice layers formed in foam targets
using the same protocol that worked for standard plastic abla-tors were unsuccessful because the resulting ice/foam layer was opaque and the ice/gas interface could not be imaged. Although the foam alone was transparent (it possesses a small pore size, <0.2 nm) and remained transparent when filled with liquid, the target became opaque once the ice layer formed. The transpar-ency was improved by minimizing the number of freeze/melt cycles and not cooling the target below 18 K. This minimized mechanical damage to the foam structure (maintained the pores sizes) from the shear forces that develop due to the different densities of the ice and liquid phases.12
It remains critically important to form the ice layer slowly in order to preserve the single-crystal structure of the ice. The presence of the foam does not appear to change how the layer grows provided that the process proceeds in a sufficiently con-trolled manner with a stable and gradual temperature ramp. This greater sensitivity to the cooling rate compared to non-foam targets is presumed to be due to the viscous drag that the foam has on the movement of the liquid. If the target is cooled too rapidly, the liquid does not have enough time to move to the ice/liquid interface (the void that can develop there is caused by the density mismatch), and the liquid can nucleate a crystal at a foam filament rather than attaching to the existing crystal, which results in a higher void content and greater opacity. At the extreme—flash freezing the target—there is a 13% decrease in the molar volume of DT due to the phase change and the ice turns instantly opaque. The transparency improves marginally as the layering mechanism functions to redistribute and densify the ice, but the resulting small-grain polycrystalline structure cannot be annealed into a single crystal and the inner ice surface cannot be imaged using shadowgraphy. Figure 114.8 shows a series of images of a DT-filled foam target containing initially (a) liquid and then an ice layer formed slowly (b) or rapidly (c). The quality of the ice layer when properly formed is approaching what is achievable in non-foam DT targets: 0.9- to

CryogeniC TargeTs: CurrenT sTaTus and FuTure developmenT
LLE Review, Volume 114 63
2.6-nm rms. Current development is directed at understanding how imperfections and variability in the foam structure affect the quality of the ice layer and the ability to characterize it.
T2430JR
(a) (b)
(c)
Figure 114.8DT in a foam target (840-nm diameter; 0.5-nm-rms outer surface roughness; 0.73-nm-rms inner foam layer roughness; 47-nm-rms inner foam layer thick-ness): (a) liquid DT, (b) single-crystal ice layer, 54 nm thick, 1.2-nm rms, (c) rapidly cooled polycrystalline ice layer.
6. DT-Gas Density at ImplosionA special challenge with DT targets is to preserve the ice layer
when the shrouds are retracted to shoot the target. A complication arises because the helium gas that surrounds the target to remove the heat from the target must be removed prior to the shrouds retracting, and its elimination results in the target warming. While the shroud retraction process can be extremely rapid5 (<1 s total with the target exposed to ambient radiation for <60 ms), slower shroud retraction rates are used to allow more time for the mechanical impulses from the retraction process to attenuate in order to minimize target vibration. Currently there is a 6-s time lapse between the helium gas being exhausted and the target being imploded. During this time the temperature of the ice rises from 19.4 K to 19.7 K (the triple-point temperature). If the target is not initially sufficiently cold, the ice will begin to melt.
Cryogenic D2 TargetsDespite the success in providing DT cryogenic targets that
meet ice-roughness specifications, D2 targets are still required for implosion experiments to measure the areal density generated
in the implosion3 and to support additional cryogenic implosion experiments as the radiological issues associated with handling tritium complicates and slows the production of DT cryogenic targets. The best D2-ice layers produced so far are approaching the quality typically achieved in DT targets, but the process is subject to more variability. Improving D2 target layering has been a high priority and is described in this section.
Recent experiments with D2 cryogenic targets and the experience with DT targets, which provides a benchmark for comparison, strongly suggest that ice-roughness variation in D2 targets is caused by (1) nonuniform volumetric heating of the target and (2) the target-support structure distorting the spherical isotherms around the target. A surprising sensitivity of the ice roughness to even small thermal perturbations around the target has been observed. The sources of these perturba-tions must be identified and eliminated to reliably produce high-quality D2 targets.
Lacking the intrinsic beta-decay heating method of tri-tium, volumetric heating of deuterium targets is achieved by irradiating the target with mid-infrared (mid-IR) light at the wavelength of a strong D2 absorption resonance (3.16 nm) (Ref. 13). Uniform illumination is essential to achieve uniform volumetric heating required for high-quality ice layers, so the D2 targets are located at the center of an integrating sphere that also sets the spherical isotherms.
Figure 114.9 shows a schematic of the “layering sphere.” Mid-IR light is introduced by an optical fiber so that it does
T2431JRC
Figure 114.9A schematic of the lower hemisphere of the layering sphere showing the target mounted on the beryllium “C” support and two IR fibers projecting into the sphere. The cone of light from one of the fibers is projected and shown to intersect the beryllium support.

CryogeniC TargeTs: CurrenT sTaTus and FuTure developmenT
LLE Review, Volume 11464
not directly illuminate the target. The inner surface of the layering sphere is deliberately roughened and coated with gold to provide a highly reflective scattering surface. Ideally, this scattering would be isotropic and would uniformly illuminate the target after a few bounces. Subsequent experiments showed that the surface forward scatters the light with a cos9i angular distribution.14
Another limitation to forming high-quality D2-ice layers is the nonuniform thermal environment surrounding the target. Mid-IR light absorbed by the target support, the plastic abla-tor, and the glue used to hold the target perturbs the spherical isotherms sufficiently to exceed the 1-nm-rms-roughness specification. Efforts to mitigate these effects have improved the ice-layer quality and are presented here.
The result of these efforts produced a D2-ice layer with an rms roughness of 1.1 nm. This best D2-ice layer, shown in Fig. 114.10, was achieved in a layering sphere that had received all the upgrades described in subsequent sections. Importantly, this good quality was not an isolated event; similar targets that were layered using the same protocol achieved ice layers that ranged from 1.5- to 2.5-nm rms roughness, considerably bet-ter than the historical 3- to 5-nm rms roughness. A necessary requirement for improved ice smoothness is the plastic capsule itself, specifically, the thinness of the walls (2.0 nm—the thin-nest requested) and the composition of the plastic (low oxygen
content) because this reduces the sensitivity of the target to nonuniform illumination.
1. Effect of IR Heating on Ice-Layer Quality The strongest absorption bands in D2 correspond to the
Q1(1)+S0(0) and Q1(0)+S0(0) transitions that overlap at 3.16 nm and have a combined 10-nm bandwidth.13 The Q1(1) and Q1(0) components of the absorption band are due to vibration-only transitions in ortho- and para-deuterium, respectively, while the S0(0) component is a rotation-only transition. Absorption is due to a dipole moment induced by motion in two neighboring D2 molecules, where one molecule rotates (change in the rotational quantum number, DJ = 2) and the other vibrates (change in the vibrational quantum, Dv = 1). The absorption band possesses fine structure that varies according to the ratio of ortho- and para-deuterium (deuterium is 67% ortho and 33% para). The absorption coefficient is 4 cm–1, corresponding to +7% of the incident IR power being absorbed by the ice in a standard OMEGA-scale cryogenic target.
The current IR layering source is a tunable optical paramet-ric oscillator (OPO)15 with a bandwidth (0.03 to 0.3 nm) that is narrow compared to the D2 absorption band.13 The wavelength of the OPO can be adjusted in 10-nm steps that are compa-rable to the bandwidth of the strongest D2 absorption band at 3.16 nm. This combination of narrow OPO bandwidth and coarse tuning can result in the output wavelength being offset
T2432JRC
1 10
Mode number (l)
100
Pow
er (n
m2 )
100
10–1
10–2
10–5
10–4
10–3
(b)(a)
210
nm
–1–2
3-D Ylm �t
2-D Fourier �ts
Figure 114.10(a) The variation in the thickness of a 99-nm deuterium ice layer (860-nm-diam, 2.0-nm wall capsule) is shown (b) with the associated power spectrum for the entire surface. The rms roughness value for all modes is 1.1 nm.
CryogeniC TargeTs: CurrenT sTaTus and FuTure developmenT
LLE Review, Volume 114 65
from the deuterium absorption peak, which would reduce the heat deposited in the ice and make the volumetric heating very dependent on the spectral stability of the OPO. The stability of the wavelength depends on the temperature stability of the lithium niobate crystal in the OPO, where a 5°C change cor-responds to a 1-nm change in wavelength. The wavelength is not locked to a specific value; instead, the temperature of the crystal is closed-loop controlled using a chromel–alumel thermocouple. Consequently the spectral output depends on how well the crystal is thermally connected to the tempera-ture sensor, the standard error limits of the sensor (2.2°C), the bandwidth on the temperature control circuit logic (2°C), and the sensitivity of the temperature measurement (a millivolt thermocouple signal) to external noise.
OPO output power and wavelength must both be stable since both affect the volumetric heat load during the initial crystal growth phase (15-min duration), and the rate of growth of the crystal determines whether single, or multiple, crystals form, and the presence of facets and low-angle grain boundaries in an ice layer with multiple crystals increases the ice roughness.
Once the layer is formed and the target is transported to the OMEGA target chamber, small drifts in wavelength and power may result in the ice layer melting (a 1% change in OPO power will slump the ice layer in 30 min).
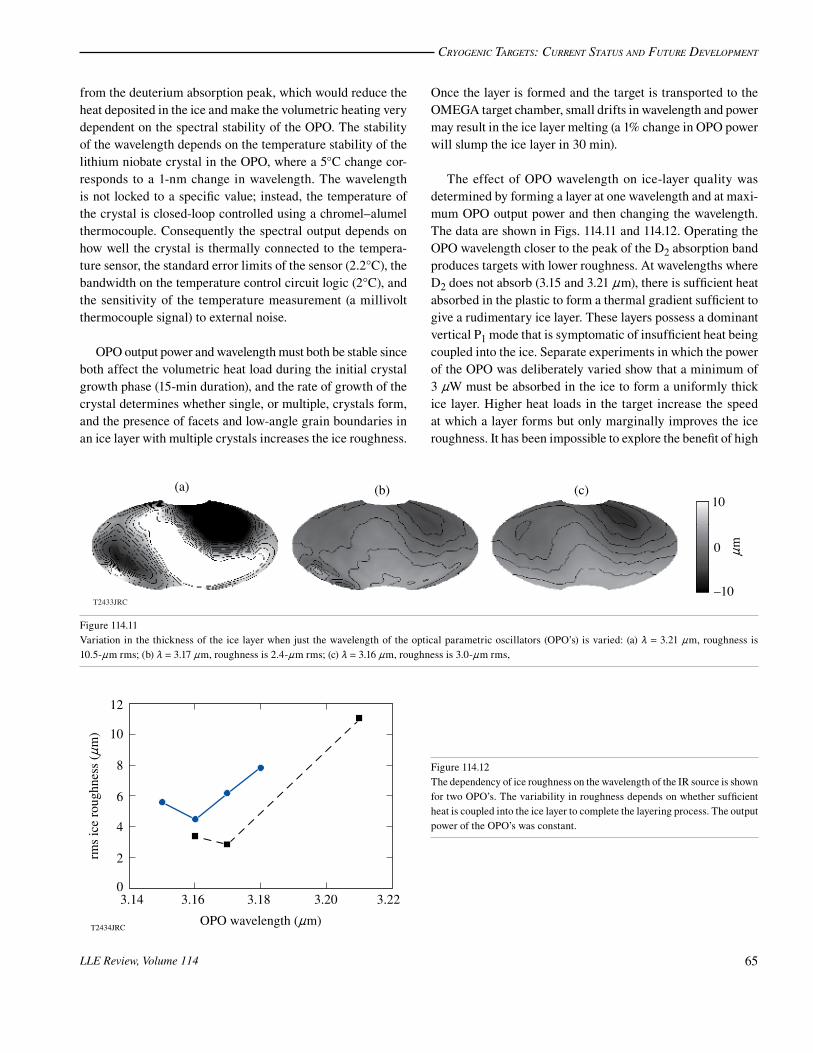
The effect of OPO wavelength on ice-layer quality was determined by forming a layer at one wavelength and at maxi-mum OPO output power and then changing the wavelength. The data are shown in Figs. 114.11 and 114.12. Operating the OPO wavelength closer to the peak of the D2 absorption band produces targets with lower roughness. At wavelengths where D2 does not absorb (3.15 and 3.21 nm), there is sufficient heat absorbed in the plastic to form a thermal gradient sufficient to give a rudimentary ice layer. These layers possess a dominant vertical P1 mode that is symptomatic of insufficient heat being coupled into the ice. Separate experiments in which the power of the OPO was deliberately varied show that a minimum of 3 nW must be absorbed in the ice to form a uniformly thick ice layer. Higher heat loads in the target increase the speed at which a layer forms but only marginally improves the ice roughness. It has been impossible to explore the benefit of high
T2433JRC
(a) (b) (c)10
0 nm
–10
T2434JRC
3.140
2
4
6
8
10
12
3.16 3.18
OPO wavelength (nm)
rms
ice
roug
hnes
s (n
m)
3.20 3.22
Figure 114.11Variation in the thickness of the ice layer when just the wavelength of the optical parametric oscillators (OPO’s) is varied: (a) m = 3.21 nm, roughness is 10.5-nm rms; (b) m = 3.17 nm, roughness is 2.4-nm rms; (c) m = 3.16 nm, roughness is 3.0-nm rms,
Figure 114.12The dependency of ice roughness on the wavelength of the IR source is shown for two OPO’s. The variability in roughness depends on whether sufficient heat is coupled into the ice layer to complete the layering process. The output power of the OPO’s was constant.

CryogeniC TargeTs: CurrenT sTaTus and FuTure developmenT
LLE Review, Volume 11466
IR power because the maximum power that can be achieved in the ice is +20 nW, which is twice the heat from beta decay in a comparably sized DT target.
2. IR Illumination UniformityFrom the beginning the importance of uniform IR illumi-
nation throughout the layering sphere was recognized, so the surface of the layering sphere was treated to provide Lambertian reflectance.16 The observed behavior of the D2 (and not DT) ice layers questioned that assumption of Lambertian reflectance, and tests of the layering sphere showed that the surface has a preferred forward scattering angle. Subsequent ray-trace model-ing17 showed large regions of the layering sphere volume where the IR intensity is substantially greater than elsewhere (see Fig. 114.13). A portion of these regions overlap the beryllium support, which is 22 mm long with a 7-mm radius of curvature and intersects a large portion of the cross-sectional area of the void in the layering sphere. The heat deposited in the beryllium structure perturbs the spherical isothermal structure around the target and, depending on how hot the beryllium becomes, determines how it will affect the ice (see Effect of the Target Support on the Ice-Layer Quality, p. 68).
IR uniformity was improved by adding a diffusive reflect-ing surface in front of the injection fiber to scatter the incident beam (5 to 20 mW) over a larger fraction of the layering-sphere surface and reduce the intensity of each subsequent reflection. This successfully eliminated the thermal influ-ence of the beryllium support on the ice layer, but the new
IR illumination pattern introduced a different and smaller perturbation to the ice layer that suggests that the target is no longer being uniformly illuminated—it appears that one of the multiple initial reflections of the beams is striking the target directly. This conclusion was reached by rotating the target and seeing the same ice-distribution pattern in the ice layer relative to the surface of the layering sphere regardless of the rotational position of the capsule. A similar ice distri-bution pattern is observed, at different magnitudes, in all the moving cryostats that were retrofitted with this modification to the IR injection fiber.
To estimate the ice layer’s sensitivity to nonuniform illumi-nation a finite-volume thermal calculation (FLUENT18) applied a 20%-larger volumetric heating load over two opposing sides of the target that total 14% of the target’s volume. That non-uniformity redistributed the ice and the resulting roughness was 17-nm rms. The pattern of roughness and distribution of power in the low Fourier modes was similar to experimentally observed ice layers (see Fig. 114.14), which shows that the ice layer is very sensitive to illumination uniformity.
3. Effect of the Plastic Ablator’s Composition on the Ice LayerThe effect of nonuniform IR illumination on the ice rough-
ness is compounded if appreciable light is absorbed by the ablator. If the heat absorbed in the plastic is uniform, the main effect is to increase the temperature difference between the layering sphere and the target; however, as the ratio of heat in the plastic relative to the heat required to form an ice layer
T2435JRC
–15
–10
–5
0
5
10
15
–2–6–10–14–18 –5–10–15–20 –6–10–14–18
mm
(a)
–15 –10 –5 0mm
5 10 15
(b)
–15 –10 –5 0mm
5 10 15
(c)
–15 –10 –5 0mm
5 10 15
Figure 114.13Calculated IR intensity distribution patterns shown in a logarithmic plot for discrete vertical planes through the layering sphere (a) 0°, (b) 60°, and (c) 120° (angles refer to OMEGA coordinates).

CryogeniC TargeTs: CurrenT sTaTus and FuTure developmenT
LLE Review, Volume 114 67
T2437JRC
2500
0 days4 days60 days
2700 2900 3300 3500 3700
(a)
3100
Wave number (cm–1)
D2 absorption wavelength (3.16 nm) D2 absorption wavelength (3.16 nm)
0
40
80
120
160
200
Abs
orpt
ion
coef
�cie
nt (
cm–1
)
Time (h)
–20 20 60 100 140
(c)
0.0
0.1
0.2
0.3
Abs
orba
nce
0.4
0.5
2500 2700 2900 3100
Wave number (cm–1)
3300 3500 3700
(b)
0 days4 days12 days
(+3 nW, or 1/3 QDT) increases and is not uniform throughout the plastic, the distortion to the spherical uniformity of the isotherms around the target increases.
The plastic ablator strongly absorbs IR light over the wave-length range of 2.85 to 3.4 nm, which includes the deuterium
absorption band at 3.16 nm. This absorption increases with time, as shown in Fig. 114.15(a), due to the uptake of ambient moisture and oxygen that become chemically bonded in the plastic as a hydroxyl molecule.19 The absorption coefficient increases markedly when a silicon dopant is added to the abla-tor, as shown in Fig. 114.15(b) (Ref. 20).
Gas
Ice
T2436JRC
2
Pow
er (n
m2 )
10–4
10–3
10–2
10–1
100
101
102(a) (b)
6 10 14 18
Mode
22 26 30
Figure 114.14The calculated effect of 20% illumination nonuniformity on the ice-thickness distribu-tion for a large volumetric heat load over a 14% volume at the north and south poles. (a) The ice is thinner at the poles (dashed line is a surface of constant radius for reference). (b) The Fou-rier power spectrum shows that the low-mode roughness (P1 through P4) is the greatest. The shape of the PSD is comparable to measured ice layers but the magnitude is +50% larger.
Figure 114.15(a) Infrared absorption spectrum of an 8-nm-thick carbon–deuterium plastic film. The spectrum overlaps the solid-deuterium spectrum and absorption increases with time due to the adsorption of moisture. (b) Adding silicon (6 at.%) to a 1.5-nm-thick plastic film increased the IR absorption. (c) The absorption coefficient of a silicon-doped plastic shell (5-nm wall, 6-at.% silicon) increases steadily with time.20

CryogeniC TargeTs: CurrenT sTaTus and FuTure developmenT
LLE Review, Volume 11468
The absorption coefficient of a standard plastic capsule is 5 to 26 cm–1 (one to six times that for D2) as fabricated and increases to 16 cm–1 and 35 cm–1 after 4 and 60 days, respec-tively.19,20 Absorption is due to the presence of the hydroxyl (–OH) species that possess a strong dipole moment that allows them to effectively absorb radiation. These species derive from the adsorption of moisture, or in the case of silicon-doped plastic, from the reaction of silicon free radicals present in the polymer with atmospheric oxygen. Free radicals within the plastic result from the plasma polymerization process. The presence of silicon in the CH ablator increases the absorption coefficient by a variable amount, depending on the fabrication conditions, up to a maximum measured value of +6000 cm–1, where 95% of the IR light is absorbed by the plastic ablator, effectively shielding the ice from the IR source. The problem with the presence of high-reactive silicon atoms was mitigated by heating the plastic to 300°C immediately following fabrica-tion. Heat treatment reduces the number of reactive sites in the plastic, and the measured absorption coefficients were reduced to +40 to 140 cm–1, depending on how long the capsules are exposed to the atmosphere [Fig. 114.15(c)]. Currently there remains a sizeable variability in the magnitude of the absorp-tion coefficient of the plastic.
The effect of the enhanced IR absorption in the plastic ablator on the ice-layer roughness is two-fold: (1) If the ablator absorbs the light so effectively that too little heat is absorbed in the ice, then insufficient heat density is available to drive the layering process, resulting in a roughness of +10-nm rms, as seen in Fig.114.16(a). This behavior was also observed in deuterium–tritium targets with a low (0.1 and 1 at.%) tritium content where the heat from tritium decay was insufficient to form a symmetri-cal ice layer, as well as when the OPO wavelength was detuned
Figure 114.16D2-ice thickness distribution in a silicon-doped plastic capsule. A large P1 vertical mode is present when (a) the capsule is not heat treated to minimize adsorp-tion of water (10-nm rms) and is reduced when (b) the capsule is heat treated (2.5-nm rms). (c) A third target shows two opposing thin regions of ice that lie on an inclined axis (30° from north and 50° azimuthally, in OMEGA coordinates), which suggests that the target is more strongly illuminated along this axis.
T2438JR
(a) (b) (c)
200–20 100nm nm
–10
from the D2 absorption maximum. Heat treating significantly improved the silicon-doped target (2.5-nm rms) ice roughness [Figure 114.16(b)]. (2) If the ablator is not uniformly thick, or the IR illumination is not uniform over the surface of the target, the variable volumetric heating load will be accentuated by a high absorption in the plastic and will degrade the uniformity of the ice layer. Since the thickness of the plastic wall is measured inter-ferometrically to vary less than 0.2 nm, illumination uniformity is the greatest concern. Figure 114.16(c) shows a silicon-doped target with two opposing regions of thinner ice that is presumed to be caused by a higher IR flux illuminating the target along this direction.
4. Effect of the Target Support on Ice-Layer QualityThe target is attached to four spider silks (<1-nm diam) on
a beryllium wire (250-nm diam) that is bent into a semicircle (7-mm radius). The beryllium wire was shown in earlier experi-ments21 to affect the ice layer: the thinnest region of the ice faced the beryllium support and this correlation was maintained when the target was rotated in the layering sphere, and when different targets were used. The cause was the beryllium sup-port absorbing IR light, as shown in Fig. 114.9, and heat from the hot wire imprinting into the ice. Conclusive proof of the IR-induced heating effect of the beryllium is the absence of any similar imprint in DT-ice layers for targets that use the same support structure.
Glue is used to attach the capsule to the spider silk. Manipu-lating extremely small quantities of glue is difficult as surface tension rapidly wicks the glue from the dispenser to the surface. The glue strongly absorbs IR light and becomes a localized heat source on the capsule. To test the effect, a capsule was mounted in silk and four glue spots of different sizes were

CryogeniC TargeTs: CurrenT sTaTus and FuTure developmenT
LLE Review, Volume 114 69
applied, as shown in Fig. 114.17. Glue spots smaller than 30-nm diam and 3 nm high (<1 ng) did not affect the ice, whereas a glue spot +100-nm diam and 7 nm high (47 ng) generated a 20-nm-deep hole in the ice and a 26-ng glue spot generated a 10-nm-deep crater. The two smallest glue spots had no observ-able effect on the ice layer. An alternative to using glue is to overcoat the target and silks with a thin film of parylene less than 1 nm thick. The capsule is held without glue between four silks during the vapor-deposition process. Experience shows that this satisfactorily supports the capsule and eliminates the need for glue.
T2439JR
(a) (b)
–20 –15 –10 –5 0 5nm
Figure 114.17(a) A target is shown mounted on silk with four glue spots of varying size. Starting in the top left-hand corner and proceeding clockwise, they have masses of <1, 26, 1, and 47 ng. (b) The variation in the thickness of a 95-nm ice layer is shown as an Aitoff projection. The 47-ng glue mass (height of the glue is 7 nm) causes a 20-nm crater. Diagonally opposite this feature is a 10-nm crater caused by the 26-ng glue spot. The smaller glue masses had no effect.
5. Current StatusSmooth D2-ice layers are feasible when sufficient heat is
deposited in the ice, minimal heat is deposited in the plastic ablator, and the target is uniformly illuminated. We have no diagnostic to evaluate these phenomena that is more sensitive to these effects than the target itself. So only by accumulating statistics of the ice layer for different targets and layering-sphere environments is it possible to evaluate and improve the performance of cryogenic equipment for producing high-quality ice layers. Anytime one of the critical components is changed, the performance of the equipment can change, and it requires over a month to reestablish the performance of the system. These critical components are the IR injection fiber, the layering sphere, and the target type (wall thickness, abla-tor composition). Currently there is one moving cryostat that produces good-quality ice layers and two cryostats that produce
moderate-quality layers. A concerted effort is underway to improve the design of a reflective optic for the injection fiber to improve the uniformity of IR illumination. Such a device should improve the repeatability of the layer quality in all the moving cryostats used for implosion experiments.
Future Development1. Achieving 0.3-mg/cc Gas Density in a Cryogenic Target
Experience shows that the ice-roughness specification can be achieved only by forming the ice layer at the triple point (0.5 mg/cc at 19.7 K for DT). Implosions performed using a low-adiabat (a < 2) laser pulse shape would benefit by lowering the gas density to 0.3 mg/cc, which corresponds to a temperature of 18 K for DT.22 The consequence of cooling the target by the required 1.7 K raises the density of the ice by 0.8%, which induces a strain of 0.1% along the a axis and 0.2% along the c axis of the hexagonally closed packed crystal. This strain exceeds the yield stress12 and plastically deforms the ice.
Experiments reported that this behavior can be minimized by rapidly cooling the ice layer, thereby creating a brief “time window” where the gas has the desired density (0.3 mg) and the ice-layer smoothness is preserved.23 Repeating those experi-ments here with the OMEGA Cryogenic System suggests that the solution is not so straightforward. Rapidly cooling a target with a thick ablator wall (10 nm) and a 95-nm D2-ice layer showed that a 10-s period existed during which the ice layer retained its roughness and the temperature was 1.7 K below the triple-point temperature, as seen in Fig. 114.18(a). The tempera-ture of the target is calculated from the measured temperature of the layering sphere and the thermal diffusivity of helium. The heat capacity and heats of fusion and sublimation of the D2 ice were included in the analysis.
Repeating this experiment with targets with thinner plastic ablators (2 to 5 nm) produced contradictory data. Features and roughness were observed in the ice once the temperature had dropped 1 K, as shown in Fig. 114.18(b). Sometimes the increased roughness was observed along only one viewing axis; other times the outer plastic surface roughened while the ice layer retained its smoothness. This observation confirms that the stresses induced when the ice contracts are substantial, as witnessed by the plastic and/or ice buckling. This raises the question of why targets with thicker plastic ablators did not show as rapid a degradation of ice quality as the targets with thinner ablators since the stresses should be similar. One possible explanation is that the ice layer may detach from the thicker plastic walls because the plastic is less likely to buckle to relieve the stress; the resulting higher thermal resistance

CryogeniC TargeTs: CurrenT sTaTus and FuTure developmenT
LLE Review, Volume 11470
between the wall and ice layer may cause the actual temperature of the ice and gas to be higher than calculated.
T2440JRC
00:00
15
16
01
2
3
4
5
6
7
17
18
Tem
pera
ture
(K
)
rms
roug
hnes
s (n
m)
rms
roug
hnes
s (n
m)
01:35 02:26 03:17
Time (min:s)
04:08 05:15 07:13
(a)
(b)
Plasticx-view
x-view
y-viewIce
00:000
1
2
3
4
15
18
17
16
Tem
pera
ture
(K
)
02:48 03:53 04:48 05:45 06:46
Time (min:s)
y-viewy-view
Plastic
Ice
Figure 114.18(a) Rapidly cooling a target with a 10-nm plastic wall shows that there is little change in the ice roughness until the temperature is 1.7 K below the triple point. Simultaneously there is no change in the roughness of the plastic ablator. In contrast, (b) rapidly cooling a thinner-wall (5 nm) capsule shows the ice roughness increased in one camera view and not the other. Concomitantly, the roughness of the plastic ablator increased in the camera view where the ice did not roughen and visa versa.
Current experience requires that we assume that disloca-tions and grain boundaries will develop in the ice as it cools and before it is imploded. What needs to be resolved is whether these features are crystallographic fractures within the ice or cracks at the inner ice surface. If they are the former, they would have nanometer scale lengths and would not be expected to affect the implosion; if they are the latter, they could affect the implosion if the total void volume due to the cracks were large. The current NIF specification for indirect-drive targets is that the void-volume in the cracks be less than 0.2% of the total ice volume. The features that form when the target is rapidly cooled appear circumferentially around portions of the target in discrete regions, as shown in Fig. 114.19, that appear to be correlated to a crystalline axis. Should there be a strong correlation between the
position and direction of these features and the crystallographic axis, then it is reasonable to assume that the features are a benign facet or low-angle grain boundary rather than a larger-scale crack at the inner ice surface. Current emphasis is to acquire those statistics to see if there is a correlation between the orientation of the growth crystal as determined from the solidification process and the fracture features observed during cooling.
T2441JR
(a) (b)
Strain-induced hoop stress facets
(c) (d)
Figure 114.19Images of the ice layer when it is rapidly cooled showing preferred orientation of cracks: (a) initial rms roughness is 2.2 nm; (b) +145 s and –1.4 K, 2.2 nm; (c) +180 s and –2 K, 2.3 nm; (d) +300 s and –2.6 K, 2.6 nm.
2. Cryogenic Fill-Tube Test FacilityTwo new cryogenic systems designed specifically to study tar-
gets that are filled via a tube are now operational. This capability is needed to study cryogenic-target science issues that cannot be addressed with the existing OMEGA Cryogenic Target Handling System (CTHS). Two goals for the system will be (1) to prototype the environs surrounding a NIF-scale target and demonstrate that the design of the layering sphere is suitable for producing NIF-scale targets that meet the ice-thickness and ice-roughness specifications, and (2) to support specific studies of cryogenic targets that cannot be performed using the OMEGA CTHS.
The new equipment has capabilities and features not avail-able on the CTHS, including (1) the ability to characterize a D2-ice layer using both x-ray phase contrast (see Fig. 114.20) and shadowgraphy to cross-calibrate these techniques; (2) a cryogenic rotation stage small enough to be included in the NIF CTHS to preserve the ability to rotate a target through the

CryogeniC TargeTs: CurrenT sTaTus and FuTure developmenT
LLE Review, Volume 114 71
field of view of the diagnostics to compile a 3-D analysis of the entire surface of the target; and (3) a layering sphere environ-ment that incorporates the target support structure and fill-tube accessories that will be used to field cryogenic targets on the National Ignition Facility (Fig. 114.21) (Ref. 24).
Targets to be tested in this equipment include fast-ignition, cone-in-shell OMEGA-scale targets; indirect-drive NIF-scale targets mounted in a transparent hohlraum; and foam NIF-scale targets in standard support structures and “Saturn-ring” support structures.24
The planned experiments include qualifying a thermal environment and protocol for forming targets that meet NIF specification, evaluating the dynamics of the targets’ support to ensure accurate pointing and target stability, and optimizing the trade-off between these competing requirements.
ConclusionThe ability to form cryogenic targets with radioactive DT
ice that meet the exacting specifications, and to deliver those targets for implosion experiments, demonstrates a substantial advancement in the capabilities of the OMEGA system. Current emphasis is on supplying these targets for experiments and on improving the operation, while simultaneously improving the consistency of D2 cryogenic target quality.
Beyond the scope of supporting ongoing experiments, we are supporting the National Ignition Campaign by studying issues relevant to indirect-drive cryogenic targets. We are also extending our capability to studying the requirements for mak-ing larger-sized targets intended to achieve ignition on the NIF using direct illumination.
ACKNOWLEDGMENTThis work was supported by the U.S. Department of Energy Office of
Inertial Confinement Fusion under Cooperative Agreement No. DE-FC52-08NA28302, the University of Rochester, and the New York State Energy Research and Development Authority. The support of DOE does not constitute an endorsement by DOE of the views expressed in this article.
REFERENCES
1. J. K. Hoffer and L. R. Foreman, Phys. Rev. Lett. 60, 1310 (1988).
2. J. Sater et al., Fusion Technol. 35, 229 (1999); J. D. Sheliak and J. K. Hoffer, Fusion Technol. 35, 234 (1999).
3. T. C. Sangster, J. A. Delettrez, R. Epstein, V. Yu. Glebov, V. N. Goncharov, D. R. Harding, J. P. Knauer, R. L. Keck, J. D. Kilkenny, S. J. Loucks, L. D. Lund, R. L. McCrory, P. W. McKenty, F. J. Marshall, D. D. Meyerhofer, S. F. B. Morse, S. P. Regan, P. B. Radha, S. Roberts, W. Seka, S. Skupsky, V. A. Smalyuk, C. Sorce, J. M. Soures, C. Stoeckl, K. Thorp, J. A. Frenje, C. K. Li, R. D. Petrasso, F. H. Séguin, K. A. Fletcher, S. Padalino, C. Freeman, N. Izumi, J. A. Koch, R. A. Lerche, M. J. Moran, T. W. Phillips, and G. J. Schmid, Phys. Plasmas 10, 1937 (2003).
4. G. W. Collins et al., J. Vac. Sci. Technol. A 14, 2897 (1996).
5. D. R. Harding, T. C. Sangster, D. D. Meyerhofer, P. W. McKenty, L. D. Lund, L. Elasky, M. D. Wittman, W. Seka, S. J. Loucks, R. Janezic, T. H. Hinterman, D. H. Edgell, D. Jacobs-Perkins, and R. Q. Gram, Fusion Sci. Technol. 48, 1299 (2005).
6. LLE Review Quarterly Report 109, 46, Laboratory for Laser Energet-ics, University of Rochester, Rochester, NY, LLE Document No. DOE/SF/19460-739 (2006).
Figure 114.21NIF-scale, 3.0-mm-diam direct-drive target showing the horizontal support and fill tube.
T2442JR
Fill tube
Support
Ge-doped plastic ablator
170 nm
Figure 114.20X-ray phase-contrast image of a 2.2-mm-diam NIF indirect-drive-scale capsule with a germanium-doped plastic ablator. The support for the target is horizontal and below it is the tube for filling the target.
T2444JRC
CryogeniC TargeTs: CurrenT sTaTus and FuTure developmenT
LLE Review, Volume 11472
7. T. J. B. Collins, A. Poludnenko, A. Cunningham, and A. Frank, Phys. Plasmas 12, 062705 (2005); LLE Review Quarterly Report 100, 227, Laboratory for Laser Energetics, University of Rochester, Roches-ter, NY, LLE Document No. DOE/SF/19460-578, NTIS Order No. PB2006-106672 (2004). (Copies may be obtained from the National Technical Information Service, Springfield, VA 22161.)
8. S. H. Leiden and F. A. Nichols, J. Nucl. Mater. 38, 309 (1971).
9. M. J. Hiza, Fluid Phase Equilib. 6, 203 (1981).
10. S. Raynor and D. R. Herschbach, J. Phys. Chem. 87, 289 (1983); R. H. Scheicher et al., Bull. Am. Phys. Soc. 48, 434 (2003), Paper H12.005.
11. N. Kawamura et al., Phys. Lett. B 465, 74 (1999).
12. P. C. Souers, Hydrogen Properties for Fusion Energy (University of California Press, Berkeley, 1986).
13. A. Crane and H. P. Gush, Can. J. Phys. 44, 373 (1966).
14. M. Alexander, 2002 Summer Research Program for High School Juniors at the University of Rochester’s Laboratory for Laser Energet-ics, University of Rochester, Rochester, NY, LLE Report No. 329, LLE Document No. DOE/SF/19460-479 (2003).
15. Aculight Corporation, Bothell, WA 98021.
16. Labsphere, Inc., North Sutton, NH 03260.
17. FRED, Photon Engineering, LLC, Tucson, AZ 85711.
18. ANSYS, Inc., Lebanon, NH 03766.
19. R. C. Cook et al., Fusion Sci. Technol. 45, 148 (2004).
20. A. Nikroo, General Atomics, private communication (2008).
21. D. R. Harding, D. D. Meyerhofer, S. J. Loucks, L. D. Lund, R. Janezic, L. M. Elasky, T. H. Hinterman, D. H. Edgell, W. Seka, M. D. Wittman, R. Q. Gram, D. Jacobs-Perkins, R. Early, T. Duffy, and M. J. Bonino, Phys. Plasmas 13, 056316 (2006).
22. E. Mapoles, Lawrence Livermore National Laboratory, private com-munication (2008).
23. M. Martin et al., Fusion Sci. Technol. 49, 600 (2006).
24. R. S. Craxton and D. W. Jacobs-Perkins, Phys. Rev. Lett. 94, 095002 (2005).