Embed Size (px)
Citation preview

Proceedings of 24th Annual Fellowship SymposiumUtah NASA Space Grant Consortium
May 7, 2018, Ogden, UT, USA
CRYOGENIC CAVITATION PERFORMANCE OF AN AXIAL INDUCER WITH ASTABILITY CONTROL DEVICE
D. Tate Fanning ∗
Dept. of Mechanical EngineeringBrigham Young University
Provo, UT 84062Email: [email protected]
ABSTRACTPerformance improvements in turbopump systems
pumping cold water have been obtained through implemen-tation of a recirculation channel called a stability controldevice. However, many turbopump systems use liquid hy-drogen as the working fluid. Additional thermodynamic ef-fects present in liquid hydrogen at low temperatures (∼ 20K) can limit cavitation formation and improve performancein liquid rocket turbopump systems. The performance ben-efits of an an inducer with and without an SCD using liquidhydrogen as the working fluid are considered here. Numer-ical simulations at both on and off design flow coefficientsare performed to determine how the thermodynamic effectsof cavitation at cryogenic temperatures affect SCD perfor-mance. Marginal head improvements are apparent withSCD implementation, but only at ∼ 60% of the design flowcoefficient. Additionally, a stabilizing effect with SCD uti-lization is observed at all considered flow coefficients andcorresponds to a reduction in backflow caused by the SCD.The SCD widens the operating range of the inducer, as theinducer is able to operate stably at flow coefficients far be-low design.
NOMENCLATUREALE Inducer Leading Edge AreaARc Cavitating Area RatioDtip Inducer Tip Diameter
∗Address all correspondence to this author.
g Acceleration due to GravityLp Backflow Upstream Penetration from Leading Edgemin Inlet Mass FlowNPSH Net Positive Suction HeadP Total PressurePinlet Inlet Total PressurePvapor Vapor PressureT SH Thermodynamic Suppression HeadTt Total TemperatureUtip Inducer Blade Tip Speedρ Densityφ Flow Coefficient, minlet/(ρALEUtip)
ψ Head Coefficient, (Poutlet −Pinlet)/(ρU2tip)
INTRODUCTIONInducers are often placed just upstream of a centrifugal
pump to improve cavitation performance. Figure 1 depictsa typical three blade flat plate inducer. While cavitatinginducers are designed to operate with vapor cavities on thesuction surfaces of the blades, cavity growth beyond theconsidered design point can reduce pump head and impartundesirable rotordynamic forces to the inducer.
At the cryogenic working temperatures (∼ 20 K) of liq-uid hydrogen, fluid properties vary significantly with smallchanges in temperature, and cavity formation introducesthermal effects. At these temperatures, the ratio of liquidto vapor density is low which requires a greater mass ofliquid to vaporize to form a cavity. This emphasizes the ef-
1
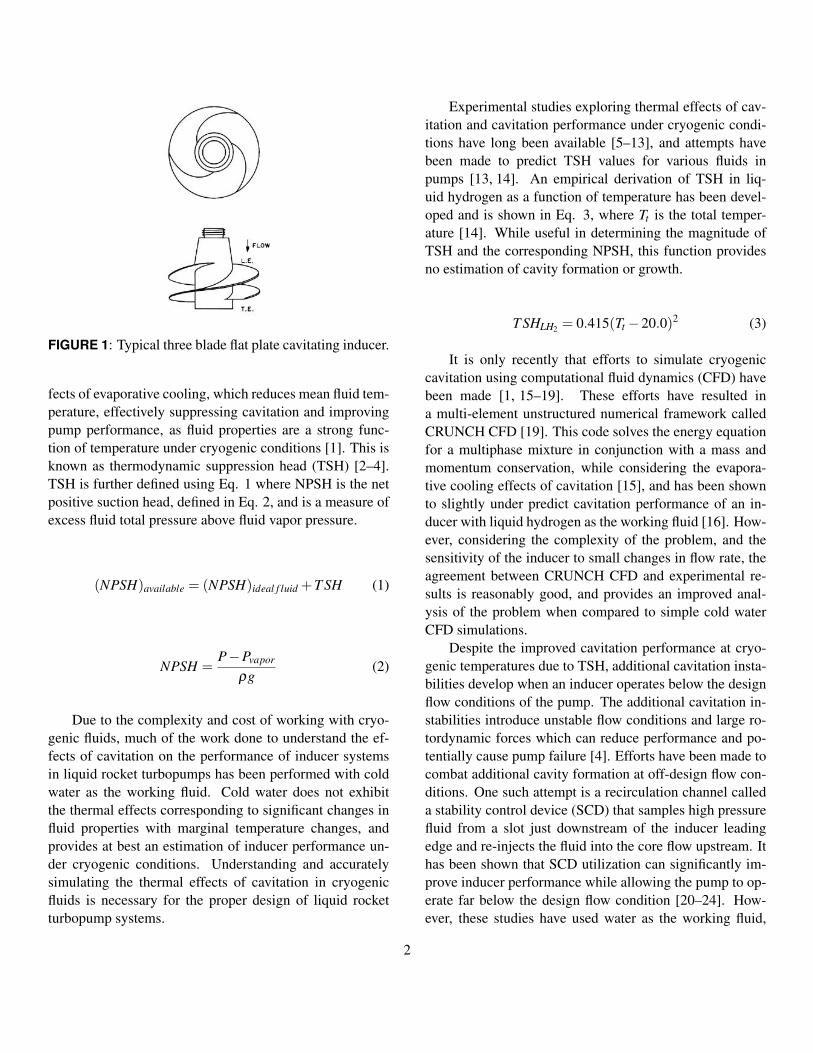
FIGURE 1: Typical three blade flat plate cavitating inducer.
fects of evaporative cooling, which reduces mean fluid tem-perature, effectively suppressing cavitation and improvingpump performance, as fluid properties are a strong func-tion of temperature under cryogenic conditions [1]. This isknown as thermodynamic suppression head (TSH) [2–4].TSH is further defined using Eq. 1 where NPSH is the netpositive suction head, defined in Eq. 2, and is a measure ofexcess fluid total pressure above fluid vapor pressure.
(NPSH)available = (NPSH)ideal f luid +T SH (1)
NPSH =P−Pvapor
ρg(2)
Due to the complexity and cost of working with cryo-genic fluids, much of the work done to understand the ef-fects of cavitation on the performance of inducer systemsin liquid rocket turbopumps has been performed with coldwater as the working fluid. Cold water does not exhibitthe thermal effects corresponding to significant changes influid properties with marginal temperature changes, andprovides at best an estimation of inducer performance un-der cryogenic conditions. Understanding and accuratelysimulating the thermal effects of cavitation in cryogenicfluids is necessary for the proper design of liquid rocketturbopump systems.
Experimental studies exploring thermal effects of cav-itation and cavitation performance under cryogenic condi-tions have long been available [5–13], and attempts havebeen made to predict TSH values for various fluids inpumps [13, 14]. An empirical derivation of TSH in liq-uid hydrogen as a function of temperature has been devel-oped and is shown in Eq. 3, where Tt is the total temper-ature [14]. While useful in determining the magnitude ofTSH and the corresponding NPSH, this function providesno estimation of cavity formation or growth.
T SHLH2 = 0.415(Tt −20.0)2 (3)
It is only recently that efforts to simulate cryogeniccavitation using computational fluid dynamics (CFD) havebeen made [1, 15–19]. These efforts have resulted ina multi-element unstructured numerical framework calledCRUNCH CFD [19]. This code solves the energy equationfor a multiphase mixture in conjunction with a mass andmomentum conservation, while considering the evapora-tive cooling effects of cavitation [15], and has been shownto slightly under predict cavitation performance of an in-ducer with liquid hydrogen as the working fluid [16]. How-ever, considering the complexity of the problem, and thesensitivity of the inducer to small changes in flow rate, theagreement between CRUNCH CFD and experimental re-sults is reasonably good, and provides an improved anal-ysis of the problem when compared to simple cold waterCFD simulations.
Despite the improved cavitation performance at cryo-genic temperatures due to TSH, additional cavitation insta-bilities develop when an inducer operates below the designflow conditions of the pump. The additional cavitation in-stabilities introduce unstable flow conditions and large ro-tordynamic forces which can reduce performance and po-tentially cause pump failure [4]. Efforts have been made tocombat additional cavity formation at off-design flow con-ditions. One such attempt is a recirculation channel calleda stability control device (SCD) that samples high pressurefluid from a slot just downstream of the inducer leadingedge and re-injects the fluid into the core flow upstream. Ithas been shown that SCD utilization can significantly im-prove inducer performance while allowing the pump to op-erate far below the design flow condition [20–24]. How-ever, these studies have used water as the working fluid,
2

and have neglected the thermal effects of cavitation at cryo-genic temperatures. Simulating inducer performance withan SCD using CRUNCH is a novel effort that offers a morerealistic view of the effects resulting from SCD implemen-tation.
The purpose of this work is to determine the effective-ness of SCD utilization on an inducer with liquid hydrogenas the working fluid, while considering the rapid changein fluid properties with temperature, and the correspondingthermal effects of cavitation.
METHODSA three bladed flat plate helical inducer with a tip he-
lix angle of 80.6◦ as measured from the axis of rotation isthe subject of numerical simulations here. The inducer tipdiameter is 12.65 cm and has a hub to tip ratio of 0.5. Tipand hub diameters are constant along the rotor. Note thisinducer matches that tested by Meng and Moore [5], whoprovide experimental cavitation performance results in liq-uid hydrogen, which are used to verify the accuracy of thenumerical CFD simulations.
The multi-element unstructured numerical frameworkCRUNCH CFD 3.0.0 was used to simulate the inducer flowover a range of flow coefficients (φ = 0.117,0.107,0.097,and 0.07) at an inlet temperature of 21.1 K and a rotationalspeed of 30,000 RPM. Flow coefficients of φ = 0.117 andφ = 0.107 were used to compare to experimental data todetermine the validity of the numerical simulations.
SCD effectiveness is limited near the design flow co-efficient, but can suppress cavitation instabilities and al-low for stable operation at flow coefficients far below de-sign [20, 23]. φ = 0.097 was simulated to test SCD effec-tiveness below design. Only two SCD simulations werecompleted for φ = 0.097, as this flow point was not farenough below design to exhibit the desired increase in cav-itation volume. Therefore, φ = 0.07 was also simulated,which is far below the design point, and is much lower thanany flow coefficient tested by Meng [5].
CRUNCH CFD has a variety of solver modules. Forthis work, the incompressible module was used. The in-compressible module neglects density changes and workdue to pressure. Instead, density changes are a function ofcavitation and fluid property variation due to thermal ef-fects [25]. This provides two distinct advantages to a moregeneral and complete compressible formulation, namely
the computational cost is significantly lower, and the sim-pler formation is more robust [25]. This is critical to re-solve the full 3D flow field of such a complex problem.The steady Reynolds-averaged Navier-Stokes equations aresolved with the standard high Reynolds number form of thek-ε equations to model turbulence. To handle cavitation, asimple finite rate model is employed.
The inducer computational domains are defined bymeshes generated in Autogrid. The meshes have 10.7∗106
and 12.9 ∗ 106 cells for the baseline inducer and the in-ducer with an SCD, respectively, with refinement near theinducer blades. The cell count difference stems from theadditional computational domain volume due to the SCDand the additional refinement near the SCD inlet and out-let. The average y+ for value for the baseline inducer was68, and 55 for the inducer with the SCD. Cross sections ofthe inducer meshes with and without the SCD are includedin Fig. 2. Convergence was determined case by case byevaluating the solution monitors of inlet mass flow, outletmass flow, inlet total pressure, head coefficient, and rotor-dynamic forces of the inducer blades.
RESULTSTest data taken from Meng [5] is used to benchmark
simulation accuracy. CRUNCH non cavitating simulationdata for both SCD and no SCD geometries is shown withthe experimental head-flow curve data from Meng [5] inFig. 3. At all flow coefficients, the CRUNCH no SCDhead coefficient is within 23% of the corresponding exper-imental head coefficient. Additionally, the SCD head coef-ficient is within 7% of the no SCD head coefficient at allφ > 0.097 with the no SCD head value being greater thanthe SCD value. However, at φ = 0.07, the SCD head co-efficient is 5% greater than the no SCD head coefficient,suggesting the SCD benefits of improved performance andstability extend to cryogenic fluids.
Cavitating performance curves illustrating inducer cav-itation breakdown are shown in Fig. 4. Experimentaldata for the no SCD inducer at φ = 0.117 and φ = 0.107are shown as solid and dashed lines in Fig. 4 respec-tively. Overall agreement between the CRUNCH and ex-perimental results is reasonable. The simulation data pro-files reasonably match the experimental data profiles, al-though magnitudes differ. At φ = 0.117, CRUNCH un-der predicts ψ for NPSH > 200 by 34%. However, the
3

(a) Unmodified inducer.
(b) Inducer modified with a stability control device.
FIGURE 2: Considered inducer geometries and corre-sponding meshes.
NPSH at which the inducer starts to break down predictedby CRUNCH is within ∼ 1% of the experimental value.While simulated head coefficient and NPSH magnitudeswould surely differ from experimentally obtained results,this data provides a relative comparison between an inducerwith and without an SCD. In this way, we can determinethe usefulness of an SCD while considering the thermody-namic effects of cavitation.
A different trend is seen at φ = 0.107. CRUNCH un-der predicts ψ for NPSH > 190 by only 2%, which is animprovement over the φ = 0.117 result. However, at thisflow coefficient, CRUNCH over predicts the NPSH wherebreakdown begins by ∼ 36%.
These are not unreasonable deviations from the exper-imental data, and a similar head coefficient under predic-tion and breakdown NPSH over prediction were noted byHosangadi [16] for a similar inducer although they did notconsider a SCD. The more important result is the similar-
ity of breakdown curve shapes between experimental dataand CRUNCH simulations seen in Fig. 4. Based on theφ = 0.117 and φ = 0.107 results, we can have reasonableconfidence in the φ = 0.097 and φ = 0.07 results, for whichno experimental data is available.
At φ = 0.117, head rise produced by the inducer withno SCD is 11% greater than that produced by the inducerwith the SCD above a NPSH of 200. Below this NPSH, thedifference grows to 43% increase over the SCD head rise.A similar trend is seen for φ = 0.107. The inducer with noSCD produces a head rise 5% greater than that producedby the inducer with an SCD above an NPSH of 160. Belowthis NPSH, the difference increases to 40%. These flowpoints are near the design point, and is not where the SCDis designed to improve performance.
The difference between the SCD and no SCD head co-efficients is reduced at φ = 0.097. Near the breakdownpoint, the inducer with no SCD produces a head rise 24%greater than that produced by the SCD. This flow coeffi-cient is only slightly below design, and the performancebenefits of the SCD are still not apparent.
0.06 0.07 0.08 0.09 0.1 0.11 0.12 0.13 0.14
Flow Coefficient φ
-0.05
0
0.05
0.1
0.15
0.2
0.25
HeadCoefficientψ
Meng Data
CRUNCH SCD Data
CRUNCH no SCD Data
FIGURE 3: Non cavitating performance curve of the con-sidered inducer over the range of considered flow coeffi-cients. Experimental results from Meng [5] are comparedto CRUNCH CFD results for both SCD and no SCD con-figurations.
4

0 100 200 300 400 500 600
NPSH (ft)
10-2
10-1
HeadCoeffi
cientψ
φ = 0.117 Meng Data no SCD
φ = 0.117 SCD
φ = 0.117 no SCD
φ = 0.107 Meng Data no SCD
φ = 0.107 SCD
φ = 0.107 no SCD
φ = 0.097 SCD
φ = 0.097 no SCD
φ = 0.07 SCD
φ = 0.07 no SCD
FIGURE 4: Cavitation breakdown curves for all considered flow coefficients. Experimental results from Meng [5] arecompared to CRUNCH CFD results for both SCD and no SCD configurations for ψ = 0.117 and ψ = 0.107. Meng did nottest the inducer at 21.1 K for ψ = 0.097 or ψ = 0.07.
5

It is only with a large decrease to ∼ 60% of the designflow coefficient that we see a performance improvementdue to the SCD. As this is still a work in progress, onlyone data point has been completed for the inducer with noSCD at φ = 0.07. The completed CRUNCH data pointsrepresent the culmination of hundreds of hours of simula-tion setup and run time. Additional points in the φ = 0.07no SCD curve at NPSH < 500 became unstable and didnot reach a converged solution. This could mean that theflow field in the no SCD inducer becomes too unstable andthe pump cannot run at this flow coefficient, or it could bea simulation setup error. Additional work to determine thecause of the no SCD simulation failure at φ = 0.07 is ongo-ing, but it is more likely simulation divergence is indicativeof pump failure. However, the single no SCD data pointis still valuable and hints at the trend that will be apparentwith the full breakdown curve, should it be possible. At thisflow point, the inducer with the SCD produces a 5% greaterhead rise near an NPSH of 400 where head rise differencebetween the two inducer geometries is minimal. Based onthe improvement at high NPSH and the breakdown curvesfor the other flow coefficients, it seems likely that in break-down the inducer with an SCD will produce a significantlyhigher head rise at lower NPSH, and delay the breakdownNPSH.
SCD implementation has also been shown to reducerotordynamic forces that can lead to structural failure [23].Figure 5 shows the root mean square (RMS) force coeffi-cient of the rotordynamic radial forces on the inducer as afunction of NPSH. All flow coefficients below φ = 0.117exhibit trends similar to the previously discussed break-down curves. That is, forces remain reasonably consistentuntil NPSH decreases to a certain point, below which forcesdecrease.
This trend is not seen at φ = 0.117. For the no SCDinducer at φ = 0.117, forces increase as NPSH decreasesuntil a NPSH of ∼ 250, below which forces decrease un-til a NPSH of ∼ 160, and then sharply increase. The SCDinducer at φ = 0.117 exhibits a completely different trend,where NPSH decreases until ∼ 260, below which forcessharply increase. The differences in these trends are over-stated with a logarithmic y-axis, as force coefficient magni-tude is very low for both geometries at this flow coefficient.Very little difference between the SCD and no SCD induc-ers is seen as force coefficient magnitude is very low.
As flow coefficient decreases to φ = 0.107, the RMS
0 100 200 300 400 500 600
NPSH (ft)
10-2
10-1
100
RMSForceCoeffi
cient
φ = 0.117 SCD
φ = 0.117 no SCD
φ = 0.107 SCD
φ = 0.107 no SCD
φ = 0.097 SCD
φ = 0.097 no SCD
φ = 0.07 SCD
φ = 0.07 no SCD
FIGURE 5: Root mean square of rotordynamic force curvesfor all considered flow coefficients. At all flow coefficientsbelow φ = 0.117, SCD implementation reduces rotordy-namic forces on the inducer.
force coefficient exhibits an average increase of 150% forthe case with no SCD and ∼ 180% for the SCD case, al-though this increase is hard to quantify as force coefficientvaries significantly. At this flow coefficient, the stabilizingeffects of the SCD are evident. The inducer with no SCDexhibits a greater force coefficient than the inducer with anSCD, with a maximum difference of 170% at a NPSH of100 at all points for φ = 0.107.
Overall force coefficient again increases as flow coeffi-cient decreases to φ = 0.097. The stabilizing effect of theSCD is still evident and provides a force coefficient reduc-tion up to 39% below the no SCD case.
Inducer forces increase by ∼ 110% with the decreasein flow coefficient to φ = 0.07. At this flow coefficient, theinducer with an SCD exhibits a 7% increase in force at anNPSH > 400 over the inducer with no SCD. However, thisis not a direct comparison as the no SCD data point is at aNPSH of 500, while maximum NPSH in the SCD curve is384. If a full force curve of the no SCD case was possibleat this flow coefficient, it is likely that the force reductiondue to the SCD seen at φ = 0.107 and 0.97 would continuefor φ = 0.07.
The improved stability resulting from SCD implemen-tation is directly related to the lack of backflow and theremoval of the tip vortex at the leading edge of the in-
6

ducer [23], which are functions of flow diffusion as fluidenters the inducer, also known as inlet diffusion [26]. Fig-ure 6 shows dimensionless backflow upstream penetrationas a function of the cavitating area ratio (ARc), which de-scribes inlet diffusion while considering flow area reduc-tion due to cavitation blockage [26]. At φ = 0.117, verylittle backflow is evident and both SCD and no SCD ge-ometries exhibit approximately the same upstream back-flow penetration. This is expected, as the critical area ra-tio for which an inducer will begin to develop backflow is1.5 [27,28]. All points in Fig. 6 at φ = 0.117 are below thecritical AR, so backflow has not yet developed.
ARc increases to ∼ 1.55 at φ = 0.107, which is slightlyabove the critical AR where backflow begins to develop.More backflow is evident than seen at φ = 0.117, but up-stream penetration is still low. Backflow generated in theno SCD geometry penetrates up to 136% further upstreamthan the SCD geometry. Additionally, the SCD seems togenerate a hard limit for backflow upstream propagation,as backflow varies very little with ARc, which is not evi-dent with the no SCD geometry. Backflow upstream prop-agation in the inducer with no SCD is highly dependenton the amount of cavitation blockage in the throat, as up-stream propagation varies significantly with small changesin ARc. This trend carries over to φ = 0.097, where again,the backflow in the SCD case varies little with cavitationblockage and penetrates up to ∼ 139% less than is seen inthe no SCD case. It is also evident that the SCD signifi-cantly limits cavitation formation as ARc in the SCD caseis higher and more consistent than in the no SCD case. Ascavitation volumes increase, the effective flow area in theinducer throat area is reduced, which decreases ARc.
A large increase in backflow upstream penetration isseen in both cases at φ = 0.07, due to the increased inletdiffusion described by a large increase in AR. SCD imple-mentation at this flow coefficient limits backflow upstreampenetration up to 166%. Significant reductions in backflowformation are evident with SCD usage at high AR, whichcorrespond to low flow coefficients.
CONCLUSIONSThis work explored the effects of implementing a
SCD in cryogenic liquid hydrogen. CRUNCH CFD wasshown to agree well with experimental data for non cavi-tating inducer performance. When considering cavitation,
1.2 1.4 1.6 1.8 2 2.2 2.4 2.6
ARc
10-3
10-2
10-1
100
101
Lp
Dtip
φ = 0.117 SCD
φ = 0.117 no SCD
φ = 0.107 SCD
φ = 0.107 no SCD
φ = 0.097 SCD
φ = 0.097 no SCD
φ = 0.07 SCD
φ = 0.07 no SCD
FIGURE 6: Upstream backflow penetration plotted as afunction of area ratio while considering the reduction inflow area due to cavitation blockage. The SCD signifi-cantly limits backflow penetration at all flow coefficientsbelow φ = 0.117.
the simulation results deviate from experimental data, butCRUNCH is able to reasonably simulate the inducer flowfield and model the thermodynamic effects of cavitation atcryogenic temperatures.
Other work has shown SCD implementation can im-prove pump performance with water as a working fluid.This work has shown that SCD implementation did not pro-vide an improvement in pump head with liquid hydrogen atflow coefficients near design. Only at very low flow coeffi-cients (∼ 60% of design) did the SCD seem to provide anincrease in head over the inducer with no SCD. However,the data set is incomplete, so the predicted SCD perfor-mance improvement must be verified and further quantifiedwith additional simulations as this work is still in progress.
The main benefit of SCD implementation in a liq-uid hydrogen inducer seems to be the reduction in up-stream backflow penetration. At flow coefficients belowφ = 0.117, the SCD significantly repressed backflow for-mation which provides myriad benefits in a pump. TheSCD reduces cavitation which maintains a more consistenteffective flow area in the throat, resulting in a lower AR,which corresponds to lower inlet diffusion which limitsbackflow. The reduction in backflow formation decreasesstructural forces on the inducer at all flow coefficients be-
7

low φ = 0.117, and is more apparent at flow coefficientsfar below design. SCD implementation allows an inducerto operate stably without backflow over a wider range offlow coefficients than is possible with no SCD, even withliquid hydrogen as the working fluid.
The benefits of employing an SCD in a pump systemhave been the topic of many recent studies and are reason-ably understood. However, none of these studies have usedliquid hydrogen, the actual working fluid to be used in thesepumps. While this is still a work in progress and needsmore simulations run at lower flow coefficients, some ofthe benefits seen in water have been verified to carry overto liquid hydrogen. SCD implementation is viable in real-world cryogenic pumps.
ACKNOWLEDGMENTThis work was funded in part by the Utah NASA Space
Grant Consortium and Concepts NREC.
REFERENCES[1] Hosangadi, A., Ahuja, V., and Ungewitter, R., 2004.
“Simulations of cavitating cryogenic inducers”. 40thAIAA/ASME/SAE/ASEE Joint Propulsion Conferenceand Exhibit.
[2] Jakobsen, J., 1971. Liquid Rocket Engine TurbopumpInducers.
[3] Japikse, D., Marscher, W., and Furst, R., 1997. Cen-trifugal Pump Design and Performance. ConceptsETI, Inc.
[4] Brennen, C., 1994. Hydrodynamnics of Pumps. Con-cepts ETI, Inc. and Oxford University Press.
[5] Meng, P., and Moore, R., 1969. “Cavitation perfor-mance of 80.6 helical inducer in liquid hydrogen”.NASA TM X-1808.
[6] Gross, L., and Miller, C., 1967. “A performance in-vestigation of an eight-inch hubless pump inducer inwater and liquid nitrogen”. NASA TN D-3807.
[7] G. Lewis, J., Sandercock, D., and Tysle, E., 1961.“Cavitation performance of an 83 helical inducer op-erated in liquid hydrogen”. NASA TM X-419.
[8] Stahl, H., and Stepanoff, A., 1956. “Thermodynamicaspects of cavitation in centrifugal pumps”. Trans.ASME, Series D., 78, November.
[9] Hollander, A., 1962. “Thermodynamic aspects of cav-
itation in centrifugal pumps”. ARS Journal, 32(10),October.
[10] Jakobsen, J., 1964. “On the mechanism of head break-down in cavitating inducers”. Journal of Basic Engi-neering, 86, June.
[11] Jacobs, R., and Martin, K., 1960. “Cavitation prob-lems in cryogenics”. Technical Briefs, Journal of Ba-sic Engineering, 82, September.
[12] Stepanoff, A., 1964. “Cavitation properties of liq-uids”. Journal of Engineering for Power, 86, April.
[13] R. Ruggeri, R. M., 1969. “Method for prediction ofpump cavitation performance for various liquids, liq-uid temperatures, and rotative speeds”. NASA TN D-4899.
[14] Veres, J., 1994. “Centrifugal and axial pump designand off-design performance prediction”. NASA TM106745.
[15] Hosangadi, A., and Ahuja, V., 2005. “Numericalstudy of cavitation in cryogenic fluids”. Journal ofFluids Engineering, 127, March.
[16] Hosangadi, A., Ahuja, V., Ungewitter, R., and Busby,J., 2007. “Analysis of thermal effects in cavitatingliquid hydrogen inducers”. Journal of Propulsion andPower, 23(6), November.
[17] Ahuja, V., Hosangadi, A., Shipman, J., Daines, R.,and Woods, J., 2006. “Multi-element unstructuredanalyses of complex valve systems”. Journal of Flu-ids Engineering, 128, July.
[18] Hosangadi, A., Ahuja, V., and Ungewitter, R., 2009.“Simulation of cavitation instabilities in inducers”.Proceedings of the 7th International Symposium onCavitation.
[19] Hosangadi, A., and Ahuja, V., 2003. “A general-ized multi-phase framework for modeling cavitationin cryogenic fluids”. 33rd AIAA Fluid Dynamics Con-ference.
[20] Japikse, D., and Baun, D., 1998. Design-Based De-velopment for Pump Cavitation Control. TechnicalMemorandum, Concepts ETI, Inc.
[21] Oliphant, K., 2005. High Suction Specific Speed In-ducers for Cryogenic Upper Stage. Technical Memo-randum, Concepts ETI, Inc.
[22] Sloteman, D., Cooper, P., and Dussourd, J., 1984.“Control of backflow at the inlets of centrifugalpumps and inducers”. Proceedings of the First In-ternational Pump Symposium, pp. 9–22.
8

[23] Lundgreen, R., 2015. “Improving the suction perfor-mance and stability of an inducer with an integratedinlet cover bleed system known as a stability controldevice”. PhD thesis, Brigham Young University.
[24] Krise, J., 2011. “Characterization of high inlet dif-fusion low flow coefficient inducer pumps for spacepropulsion in the presence of a cavitation control de-vice”. PhD thesis, Brigham Young University.
[25] Tech, C., 2013. CRUNCH CFD User Guide and InputManual. Combustion Research and Flow Technology,Inc.
[26] Fanning, T., Gorrell, S., Maynes, D., and Oliphant,K., 2018. “Inducer backflow related to tip leakageand inlet diffusion”. Unpublished.
[27] Japikse, D., 1984. “A critical evaluation of stall con-cepts for centrifugal compressors and pumps - studiesin component performance, part 7”. Stability, Stall,and Surge in Compressors and Pumps, pp. 1–10.
[28] Qiu, X., Japikse, D., and Anderson, M., 2008.“A meanline model for impeller flow recirculation”.ASME Turbo Expo 2008: Power for Land, Sea, andAir, American Society of Mechanical Engineers.
9


![Visualization of Unsteady Behavior of Cavitation in ... · cavitation state, transition-cavitation state, and super-cavitation state in the orifice throat [5]. Under relative high](https://img.dokumen.tips/doc/110x75/5b4f673e7f8b9a166e8c4c74/visualization-of-unsteady-behavior-of-cavitation-in-cavitation-state-transition-cavitation.jpg)


![Theoretical Analysis of Thermodynamic Effect of Cavitation ... · tion with Kato’s model. Tani and Nagashima [6]simulated the cavitating flow around a hydrofoil with cryogenic](https://img.dokumen.tips/doc/110x75/61092707975b3c45cb3d0d22/theoretical-analysis-of-thermodynamic-effect-of-cavitation-tion-with-katoas.jpg)