Embed Size (px)
Citation preview
CRYOENZYMOLOGICAL AND 13C-NMR STUDIES OF PAPAIN
Michael P. Gamcsik
A Thesis Presented for
the Degree of
Doctor of Philosophy
University of Edinburgh
1983
eOUR
n
1\
~-q
This thesis is the original composition
of the author's work, unless stated otherwise,
and has not been submitted for any other degree.
Certain results included in this thesis have
already been published.
1
Acknowledgments
I would especially like to thank Dr. Paul Malthouse,
Professor A. I. Scott, and Dr. R. L. Baxter for their help
and guidance during the course of this work.
I would also like to thank Dr. N. E. Mackenzie and
Mr. W. U. Primrose for the synthesis of substrates and
inhibitors, Dr. A. S. F. Boyd for his NMR expertise,
Dr. R. R. Ambler for the amino acid analyses, and
Dr. K. Brocklehurst and Mr. E. Salih for the stopped-flow
analysis.
11
11
111
Abstract
The feasibility of using 13C-NMR for the elucidation of
the mechanism of enzyme- catalys ed reactions has been evaluated.
The main limitation of applying 13C-NMR to the study of enzyme-
bound species is its low sensitivity which requires that the enzyme-
bound species be present for long periods, of time (0. 5 to 24 h) at
a concentration of '-1 mM. This presents no problem for stable
inhibitor complexes but is a major problem for the detection of
enzyme-substrate intermediates since for efficient catalysis
intermediates should not accumulate and turnover should be rapid.
To help overcome these problems, cryoenzymological techniques
in combination with 13C-NMR have been used to slow down the
enzyme- catalys ed reactions at low temperatures. 13C-NMR
evidence is presented for an acyl-papain formed in the reaction
of N-benzoylimidazole with papain under cryoenzyrnological
conditions. A distinct resonance, typical of a thio ester, was
detected. This resonance would not be detectable at room
temperature.
The structure of a papain-aldehyde inhibitor complex was
examined by 13C-NMR. Two resonances due to tetrahedral hemi-
thioacetals were detected. These were assigned to the two possible
diastereoisorneric hemithioacetals which can be formed by attack
of the papain thiolate ion on the aldehyde carbonyl. The detection
of these two hemithioacetal resonances shows that hemithioacetal
formation is not stereospecific. This also demonstrates the
potential of 13C-NMR for determining the stereochemistry of
enzyme adducts.
The irreversible inhibition of papain by CMK substrate
analogues was studied by 13C-NMR and an unusually low-field
resonance was observed for the inhibito r- enzyme complex. This
resonance, which is typical of cyclic ketones, may be due to
enzyme distortion and/or cyclization of the CMK bound to the enzyme.
iv
The cryoenzymological investigations were extended to
specific substrates. None of the ester substrates examined were
found to be amenable to a cryoenzymological- 13C-NMR investigation.
Even at temperatures down to -500C, the reactions in DMSO-water
cryosolvent were too rapid for detection by 13C-NMR. Lower
temperatures slowed the reactions but also caused a dramatic
increase in the viscosity of the solutions which precluded further
investigations by both UV and NMR at low temperatures.

Table of Contents
List of Abbreviations vi - vii
Introduction 1 - 61
Acyl Intermediate
5
Tetrahedral Intermediate
17
Additional Intermediates
24
pH Dependence
26
C ryo enzymology
28
13 C-NMR Spectroscopy
46
Materials and Methods
62 -.88
Ins trurnentation
63
Materials
66
Methods
71
Results and Discussion
89 - 214
Purification of Papain
90
Papain and N-Benzoylimidazole
94
Papain and N- Ac etyl- L- phenylalanylglyc inal
132
Papain and Ncz-CB Z- L-lysine- chioromethyl ketone 161
Absorption Spectra in Cryosolvent at
Low Temperature 173
Papain and Na-CBZ- L-lysine-p-nitrophenyl ester 184
Other Ester Substrate,-,3 210
References 215 - 230
Publication 231
List of lectures and seminars 235
V
vi
List of Abbreviations
A - absorbance at time = 0 0
A - absorbance at the completion of the reaction
A: - absorbance at a particular wavelength 'x'
Ac - acetyl
BAA - Na-benzoyl-argininamide
BAEE - Na-benzoyl-arginine ethyl ester
BAPNA - Na- benzoyl-arginine p-nitroanilide
GBZ - carbobenzyloxy-, Ph-CH 2-O-C- 0
GD - circular dichroism
CMK - chioromethyl ketone
GSA - chemical shift anisotropy
a - chemical shift parameter (in ppm )
DMF - N, N-dirnethylformamide
DMSO - dimethylsulphoxide
DTT - dithiothreitol
EDTA - ethylenediamine tetraacetic acid
- molar extinction coefficient at a particular wavelength 'x'
1E - difference molar extinction coefficient
FID - free-induction decay
P - gyromagnetic ratio
I - nuclear spin quantum number
Im - imidazole ( or IrnH +
for imidazolium )
CH - coupling constant between 3G and ' H
A. - wavelength
LW - linewidth
NMR - nuclear magnetic resonance
NOE - nuclear Overhauser effect *
pH - pH in aqueous-organic solvent
pNP - p-nitrophenol

f. - radiofrequency
RNA - ribonucleic acid
d. - standard deviation
SM - thiol group ( or S for thiolate ion)
S/N - signal-to-noise ratio
STI - soybean trypsin inhibitor
T 1 - spin-lattice relaxation time
T 2 - spin-spin or transverse relaxation time
THI - tetrahedral intermediate
TMS - tetrarnethyl silane
TR - rotational correlation time
Tris - tris(hydroxymethyl)aminomethane
vii

INTRODUCTION
Introduction
Papain (EC 3.4. 22. 2), one of the proteolytic enzymes
from the tropical fruit tree "carica papaya L", has undergone
extensive study since first isolated. Papaya latex contains many
proteolytic and other enzymes among which are the chymopapains,
papaya peptidases, and lysozyme. Balls et al. (1937), and Balls
and Lineweaver (1939), developed procedures for isolating crystalline
papain from fresh papaya latex. Later this procedure was modified
for dried papaya •latex by Kimmel and Smith (1954) and both this
method, and a similar procedure by Arnon (1970), have been widely
used for the isolation of the enzyme. Recently, Baines and
Brocklehurst (1979) have further modified the procedure to produce
chymopapain-free papain from spray dried latex. Using this
procedure, 80% active papain contaminated only by inactive and
unactivatable papain can be prepared.
Further purification can be achieved using various affinity
chromatography methods. Sluyterrnan and Wiidenes (1970) used
a column of p-aminophenylmercuric acetate bound to sepharose.
Proteins containing thiol groups are separated from other proteins
and stored as the mercuri- derivative. Blumberg et al. (1970),
and Burke et al. (1974), use a glycyl-glycyl-(O-benzyl)-L-tyrosyl-
L-arginine tetrapeptide inhibitor attached to sepharose. Brocklehurst
et al. (1973, 1974), and Stuchbury et al. (1975), have modified
sepharose with a mixed disuiphide moiety which reacts with the
thiol group on the enzyme by thiol-disulphide exchange and releases
2-thiopyridone which allows the reaction to be monitored. At low
pH, only the papain thiolate will be highly reactive and other thiol
containing molecules can be separated. Papain containing one
catalytic site per molecule of protein can be isolated.
2

3
Papain consists of a single polypeptide chain of 212 amino
acid residues (MW = 23406) whose sequence has been determined
(Husain and Lowe, 1969, 1970; Mitchell et al., 1970). There are
seven cysteine residues present six of which form internal disulphide
linkages and the seventh residue (Cys-25) is an essential part of the
active site.
The three dimensional structure of papain has been deter-
mined by x-ray crystallography (Drenth et al., 1967, 1968, 1970, 1971;
Glazer and Smith, 1971). The papain molecule is ellipsoidal with 0
rough dimensions 50x37x37 A. The molecule is binuclear, composed
of two lobes each containing a hydrophobic core with hydrophilic
residues at the surface. The lobes are connected by three sections
of the peptide chain which crosses from one lobe to the other at
residues 11, 111, and 208. Hydrogen bonding, electrostatic, and
hydrophobic interactions at the edge of the lobes maintain the position
of one lobe relative to the other. Along the cleft between the lobes
lies the active site region of the enzyme. 0
The active site is approximately 20 A long and contains Cys-25,
His-159, and Asp-158 charged residues. The N-i of His-159 is 0
3.4 A away from the sulphur of Cys-25 on opposite sides of the cleft
as shown by x-ray crystallography. This distance is the van der
Waals or hydrogen bonding distance. Husain and Lowe (1968) show
that this close proximity is maintained in the solution by connecting
the residues through the reaction of 1, 3-dibromoacetone. Further
analysis of the crystal structure shows the side chain carboxyl 0
of Asp-158 is 6.7 A away from the imidazole of His-159. His-159
is hydrogen bonded to the side chain of Asn-175 and in the hydrophobic
environment of Trp-177. The fluorescence spectrum of papain is
dominated by the contribution from the Trp-177 residue (Steiner, 1971;
Lowe and Whitworth, 1974).
Arguments supporting the relevance of the crystal structure
to the enzyme in solution are presented by Sluyterman and De Graaf
(1969). Crystals from 66% methanol-water solutions were cross-linked

4
and placed water. The methanol is exchanged out and the thin
crystals showed the same catalytic activity as the enzyme in
solution.
The active site of papain has been "mapped" by studying
the interaction of substrates and inhibitors of increasing length
and varying stereochemistry (Berger and Schechter, 197O;;
Schechter and Berger, 1967, 1968). Using diastereoisomeric
peptides of alanine from Ala 2 to Ala 6 Schechter and Berger (1967)
concluded that papain has an active site approximately 25 A long'
containing seven subsites capable of accommodating a single
amino acid residue of the substrate (Scheme 1). The subsites
are located on both sides of the catalytic site; four toward the
amino end of the substrate and three toward the carboxyl end.
substrate
H2N 4I 31
P4 P i P(P OOH
VI S3( zI S[ sjIs(s;j
enzyme
Scheme 1. Representation of the active site region of papain with subsites located on both sides of the catalytic site (t ). Also shown are the corresponding sites on the substrate
Schechter and Berger (1968) showed that peptides with
phenylalanine third or further from the C-terminal were hydro-
lysed particularly well and that the S 2 subsite on the enzyme
shows a strong preference for phenylalanine residues. This
defined a specificity represented -Phe-XY- where the bond of
the residue next to Phe is hydrolysed. N-Benzoyl, and N-benzoyl-
oxycarbonyl residues are also effective at promoting cleavage
by papain at the peptide bond of the adjacent amino acid residue
(Bergmann et al., 1935, 1936). The structural similarity of
these groups to phenylalanine is responsible (Lowe, 1970).
The S 1 subsite cannot be occupied by valine, possibly due
to its branched side chain (Berger and Schechter, 1970)., but
substrates with arginine and lysine residues in S 1 prove to be
good substrates (Kimmel and Smith, 1957; Lowe, 1970; Williams
et al., 1972b).
There is also evidence that binding of the leaving group
in S is an important factor in determining enzyme specificity.
The S subsite is stereospecific for L-amino acid residues
(Berger and Schechter, 1970), and shows a preference for hydro-
phobic residues, particularly isoleucine and tryptophan (Alecio et al.
1974). Although the concept of specific substrate-subsite inter-
actions discussed above implies a rigid active-site,., there is also
evidence of some conformational freedom of both the substrate
and the enzyme residues forming the active-site. This will be
discussed in a following section.
The mechanism of papain-catalysed hydrolysis has been
the subject of extensive investigations. Results consistent with
proposed acyl and tetrahedral intermediates have been presented
along with suggestions emphasizing the importance of conformational
changes to the catalytic mechanism. Unambiguous detection of
productive intermediates along the catalytic pathway is difficult.
The following sections contain a brief review of some of the earlier
work concerned with the elucidation of the mechanistic pathway of
papain-catalysed hydrolyses.
Acyl Intermediate
The formation of a thioacyl intermediate in the papain-
catalysed hydrolysis of peptides was proposed sfter some of the
earliest investigations into the reaction pathway (Weiss, 1937;
Smith et al. ,1955a; Stockell and Smith, 1957). Smith and
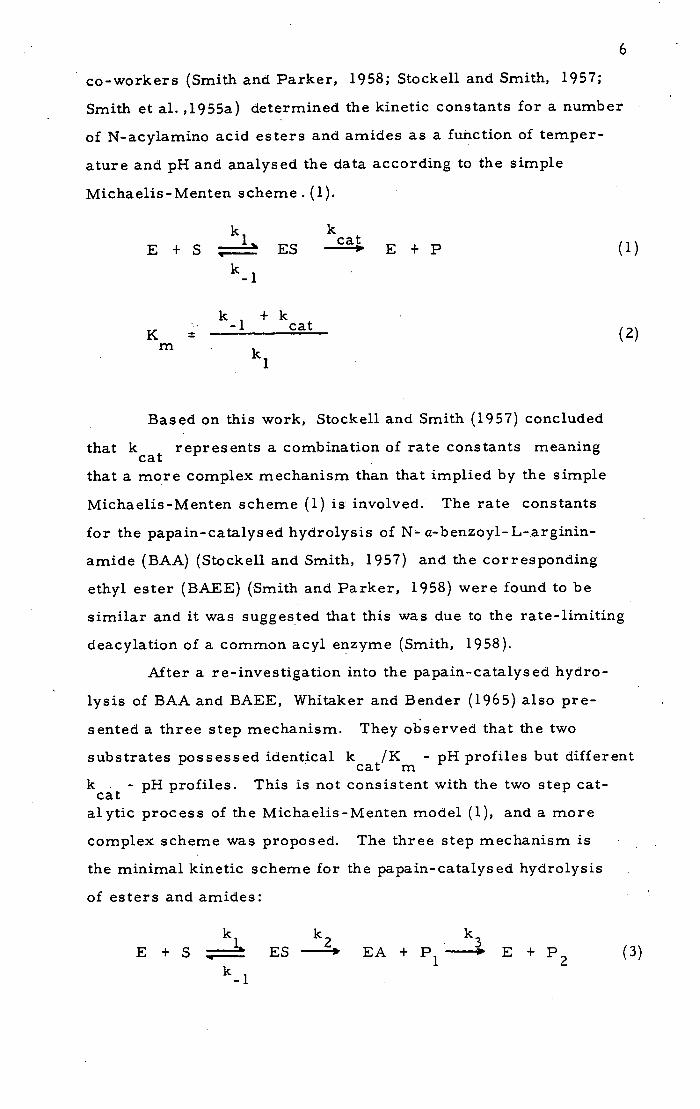
co-workers (Smith and Parker, 1958; Stockell and Smith, 1957;
Smith et al. ,1955a) determined the kinetic constants for a number
of N-acylamino acid esters and amides as a function of temper-
ature and p1-I and analysed the data according to the simple
Michaelis-Menten scheme. (1).
k k E + S ,.. L ES
cat __ E + P (1)
K = m
k+k -1 cat
k 1
(2)
Based on this work, Stockell and Smith (1957) concluded
that kcat represents a combination of rate constants meaning
that a more complex mechanism than that implied by the simple
Michaelis-Menten scheme (1) is involved. The rate constants
for the papain-catalysed hydrolysis of N- a-benzoyl-L-arginin-
amide (BAA) (Stockell and Smith, 1957) and the corresponding
ethyl ester (BAEE) (Smith and Parker, 1958) were found to be
similar and it was suggested that this was due to the rate-limiting
deacylation of a common acyl enzyme (Smith, 1958).
After a r e- investigation into the papain-catalysed hydro-
lysis of BAA and BAEE, Whitaker and Bender (1965) also pre-
sented a three step mechanism. They observed that the two
substrates possessed identjcal k cat m
/K - pH profiles but different
kcát - pH profiles. This is not consistent with the two step cat-
alytic process of the Michaelis-Menten model (1), and a more
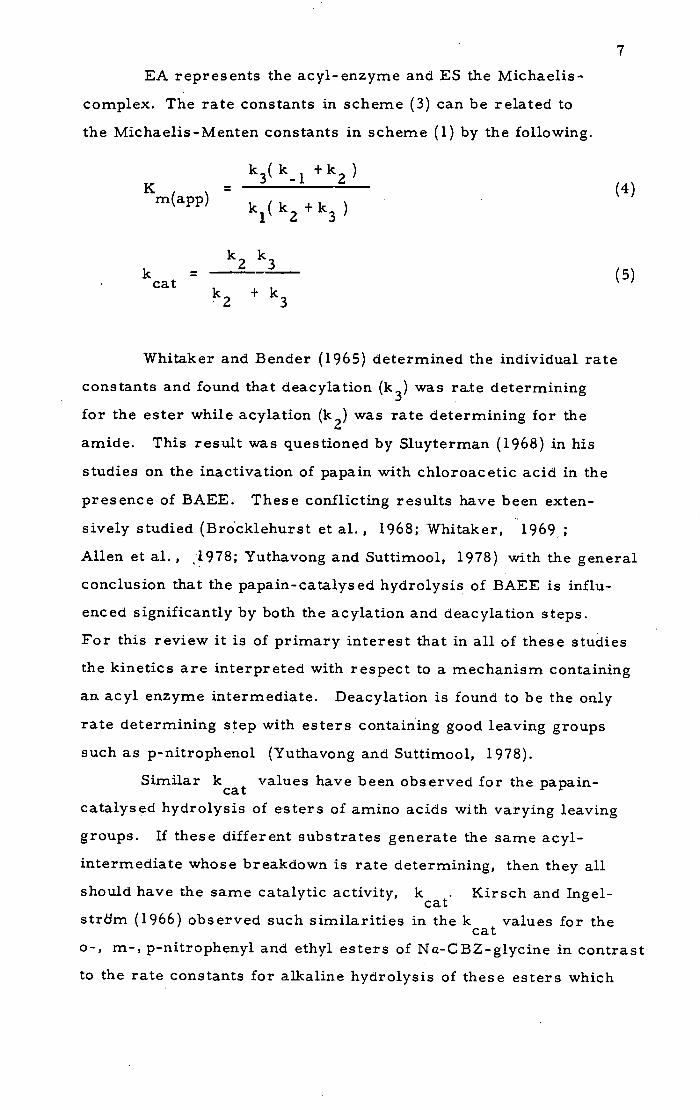
complex scheme was proposed. The three step mechanism is
the minimal kinetic scheme for the papain-catalysed hydrolysis
of esters and amides:
k 1 k 2 k 3 ___ E + S _ ES EA + P 1 E + P 2 (3)
7
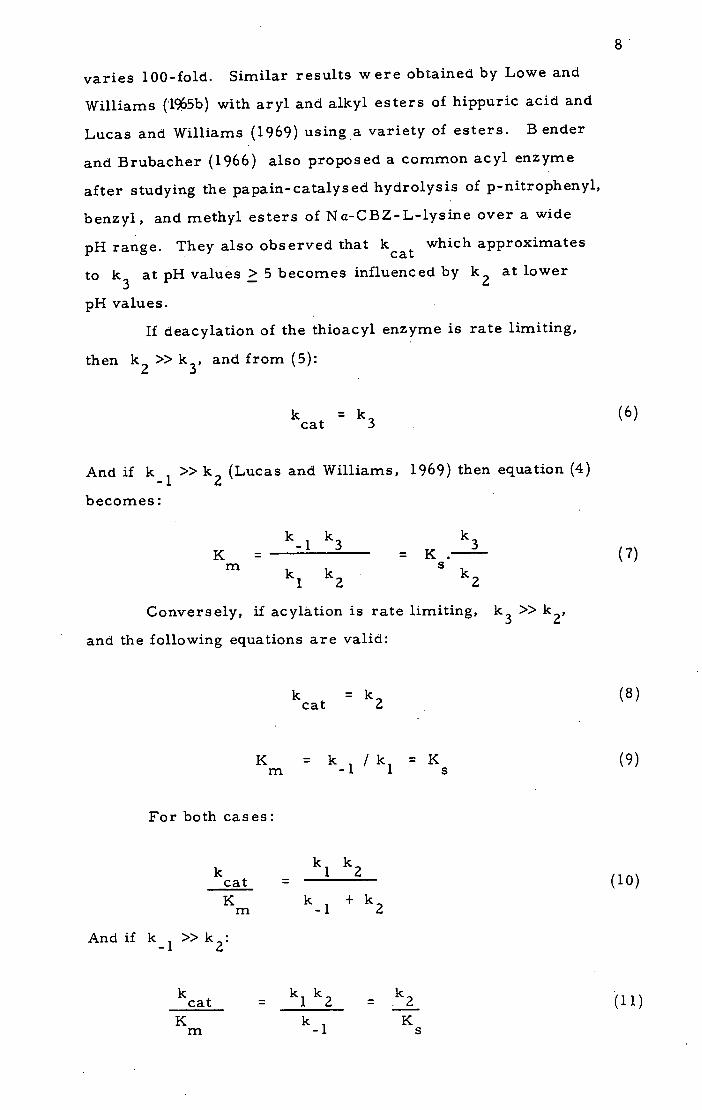
EA represents the acyl-enzyme and ES the Michaelis-.
complex. The rate constants in scheme (3) can be related to
the Michaelis-Menten constants in scheme (1) by the following.
K = m(app)
k 3 (k 1 +k 2 )
k 1 ( k 2 + k3
(4)
k k k
= 23 (5)
cat k +k
2 3
Whitaker and Bender (1965) determined the individual rate
constants and found that deacylation (k 3 ) was rate determining
for the ester while acylation (k 2) was rate determining for the
amide. This result was questioned by Sluyterman (1968) in his
studies on the inactivation of papain with chioroacetic acid in the
presence of BAEE. These conflicting results have been exten-
sively studied (Br6cklehurst et al., 1968; Whitaker, 1969;;
Allen et al., • 1978; Yuthavong and Suttimool, 1978) with the general
conclusion that the papain-catalysed hydrolysis of BAEE is influ-
enced significantly by both the acylation and deacylation steps.
For this review it is of primary interest that in all of these studies
the kinetics are interpreted with respect to a mechanism containing
an acyl enzyme intermediate. Deacylation is found to be the only
rate determining step with esters containing good leaving groups
such as p-nitrophenol (Yuthavong and Suttimool, 1978).
Similar kcat values have been observed for the papain-
catalysed hydrolysis of esters of amino acids with varying leaving
groups. If these different substrates generate the same acyl-
intermediate whose breakdown is rate determining, then they all
should have the same catalytic activity, k. Kirsch and Ingel-
strJm (1966) observed such similarities in the k cat
values for the
o-, m-, p-nitrophenyl and ethyl esters of Na-C BZ-glycine in contrast
to the rate constants for alkaline hydrolysis of these esters which
k 1 = k 2
+ k 2
k cat K
m
(10)
varies 100-fold. Similar results were obtained by Lowe and
Williams ('15b) with aryl and alkyl esters of hippuric acid and
Lucas and Williams (1969) using a variety of esters. B ender
and Brubacher (1966) also proposed a common acyl enzyme
after studying the papain-catalysed hydrolysis of p-nitrophenyl,
benzyl, and methyl esters of Na-CBZ-L-lysine over a wide
pH range. They also observed that kcat which approximates
to k 3 at pH values > 5 becomes influenced by k 2 at lower
pH values.
If deacylation of the thioacyl enzyme is rate limiting,
then k 2 >> k 3 , and from (5):
k =k cat 3
And if k 1 >> k 2 (Lucas and Williams, 1969) then equation (4)
becomes:
k k 2 k
K = -1
=K. m k 1 k2 •
Conversely, if acylätion is rate limiting, k 3 >> k 2 ,
and the following equations are valid:
k =k cat 2
K = k /k =K m -1 1 s
For both cases:
El
And if k 1 >> k 2
k cat
= k k k (11) 1 2 2 K k
- 1 K
m S
While the evidence presented is consistent with an acyl-
intermediate mechanism it can also be interpreted using other
schemes. Rate determining conformational changes, non-
enzymatic substrate reactions, or rate determining release of
product P 2 are possible alternative explanations of these results.
The effect of added amine or alcohol nucleophiles on
papain-catalysed reactions has been used in the detection of inter-
mediates as well as providing information on the nature of the
rate determining step. For example, if the rate determining
step in a papain-catalysed reaction is formation of an acyl enzyme,
and if the nucleophile reacts with the acyl enzyme after this rate
determining step, it will not increase the rate of reaction. If
the rate limiting step is hydrolysis of the acyl enzyme, added
nucleophiles would increase the breakdown of the acyl enzyme
and therefore the overall rate of the reaction (Fersht, 1977).
Since papain catalyses transesterification reactions (Glazer,
1966), then addition of an alcohol to a solution containing an
acyl enzyme should increase the rate of deacylation. Parti-
tioning of the acyl enzyme as expressed by the ratio of the
rate of hydrolysis to the rate of alcoholysis should then be
independent of the nature of the leaving group of the ester sub-
strate. Henry and Kirsch (1967) demonstrated this for the papain-
catalysed hydrolysis- - trans esterification of p-nitrophenyl and
ethyl hippurate in 10% ethanol. The ratio of the second order
rate constants kEQH / kH 2 0 was similar for both substrates.
Hinkle and Kirsch (1971.) took advantage of the fact that.rates
of deacylation are increased by added nucleophiles to change
the rate determining step for the hydrolysis of several esters
from deacylation to acylation. The initial rates of formation
of product (P 1 ) increasetj as the concentration of added amine
nucleophile increases. The rates finally reach a plateau level
at high concentrations of added amine where the rate is indepen-
dent of the nature of the nucleophile or its concentration. At

10
this point the rate constant for deacylation is greater than that
for acylation. At high concentrations of nucleophile where
acylation is rate determining, it was then possible to obtain values
of .k 2 and K under steady-state conditions. Previously
these constants were directly obtainable only by using stopped-
flow methods. Similar experiments with added nucleophiles
were used to determine the rate limiting steps in the BAEE
hydrolysis studies mentioned earlier (Allen et al. , 1978; Yuthavong
and Suttimool, 1978). All of these experiments with added nucleo-
philes provide convincing indirect evidence for the existence
of an acyl intermediate.
Experiments using C 8 O labelled ethyl hippurate as a
substrate for papain showed that hydrolysis occurred without
18 0 exchange (Kirsch and Katchalski, 1965). These results are
consistent with the formation of an acyl enzyme but not a free
tetrahedral intermediate. The results may also be explained
by a sterically hindered enzyme-substrate complex which pre-
vents exchange or a concerted process involving nucleophilic
attack and protonation of the alkoxide leaving group.
The assumption that there is a rapid accumulation of
an acyl-intermediate and a subsequent slow turnover rate has
been used in active-site titrations of papain (Bender et al., 1966).
If acylation is much faster than deacylation, a suitable substrate
may react with the enzyme to form stoichiometric amounts of
the acyl enzyme and product. If deacylation is negligible, a
measure of the product formed (P 1 in equation (3)) is easily
related to the enzyme concentration. More often deacylation is
not negligible and formation of product as shown by equation (3)
under steady-state conditions with S]>>[E is described by
equation (12) (Bender et al., 1966).

k [E} [SI [p1
= cat p
[S] +K o m(app)
k 2
t + [ELI_k2+k3
)
(1 +Km(app)
[5] 0
x
11
'1-(k 2 + 0 3
k 3) [ SI +k K s (1 - exp - K + [ s]
$ 0
(12)
In practice, the absorbance of a suitable chromophore liberated
as P 1 is measured as a function of time. Such a Itb ur stil titration
is represented below.
[F 1 ]
I I
time
Under these conditions a pre-steady-state corresponding
to acylation may first be observed followed by steady-state
deacylation. The exponential portion of equation(12), describing
acylation, may be too fast to observe, but as httu increases this
term approaches zero and the product concentration is described by
a linear function. The linear portion can be extrapolated to zero
time to obtain the magnitude of the burst, r, which is related
to the enzyme concentration. k2
2
= [E] k 2 +k3
(13)
i + Km(app)
[S] 0

12
In order to observe a burst equal to the enzyme concentration,
two conditions must be met; k >> k , and[S >> K 2 3 m(app)
If either of these conditions is not met the magnitude of the burst,
which represents the amount of acyl enzyme present, will be
dramatically reduced due to the squared relationship in equation
(13). Bender et al. (1966) observed an initial burst of p-nitro-
phenol in the papain-catalysed hydrolysis of Ncz-CBZ-L-tyrosine
and Ncz-CBZ-L-tryptophan p-nitrophenyl esters. In the presence
of 30% methanol the rate of turnover increased two-fold but no
measurable effect on the burst was observed. This indicated that
the term k 2/(k 2 + k 3 ) in equation (13) is close to unity and that
k 2 >> k 3 . The observation of burst kinetics with papain presents
'further evidence for the acyl enzyme intermediate.
Stopped-flow techniques have also been used for the detec-
tion of burst kinetics with papain and Na-CBZ-L-lysine p-nitro-
phenyl ester (Holloway and Hardman, 1973). Under conditions
where [S]o >> [E], , a burst proportional to enzyme concentration
is observed. With [Eb >> [S], , unexpected spectral changes
occurred. The authors concluded that although an acyl enzyme
does exist, deacylation may not be the rate limiting reaction.
Direct evidence for a thioacyl intermediate in papain-
catalysed hydrolyses has been presented by Lowe and Williams,
(1964,15a), Bender and Brubacher (1964), and Brubacher and
Bender (1966) with the spectrophotometric observation of dithio-
acyl and thioacyl papains.
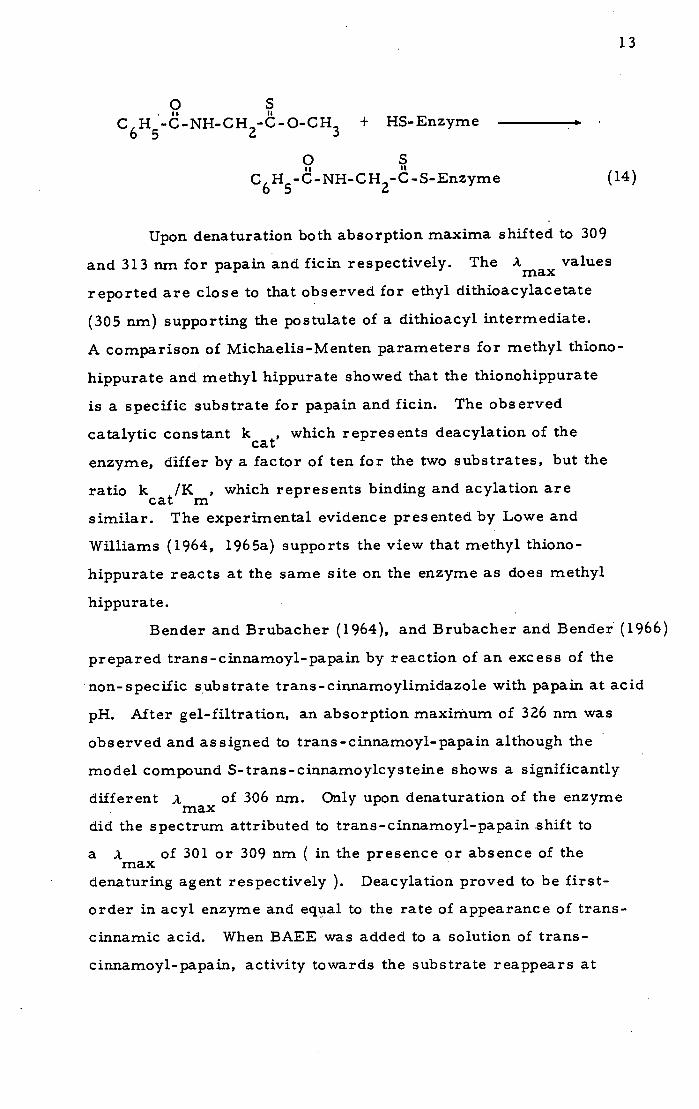
Lowe and Williams (1964,1965ä) utilized a substrate that
would exhibit a characteristic UV absorption distinguishable
from that of the enzyme upon formation of an acyl enzyme. The
papain- and ficin-catalysed hydrolysis mixtures of methyl thiono-
hippurate displayed transient absorptions at 313 and 315 nm
respectively. This absorption was assigned to the dithioester
formed upon reaction of the thiol group of the enzyme with the
thionohippurate (see scheme (14)).
13
0 C 6 H5 -C-NH-CH 2-C-0-CH 3 + HS-Enzyme
0 C 6 H5 -C-NH-CH 2-C-S-Enzyme (14)
Upon denaturation both absorption maxima shifted to 309
and 313 nm for papain and ficin respectively. The A valuesmax
reported are close to that observed for ethyl dithioacylacetate
(305 nm) supporting the postulate of a dithioacyl intermediate.
A comparison of Michaelis-Menten parameters for methyl thiono-
hippurate and methyl hippurate showed that the thionohippurate
is a specific substrate for papain and ficin. The observed
catalytic constantcat
'which represents deacylation of the
enzyme, differ by a factor of ten for the two substrates, but the
ratio k cat m
1K ,. which represents binding and acylation are
similar. The experimental evidence presented by Lowe and
Williams (1964, 1965a) supports the view that methyl thiono-
hippurate reacts at the same site on the enzyme as does methyl
hippurate.
Bender and Brubacher (1964), and Brubacher and Bender (1966)
prepared trans-cinnamoyl-papain by reaction of an excess of the
non-specific substrate trans-cinnamoylimidazole with papain at acid
pH. After gel-filtration, an absorption maximum of 326 nm was
observed and assigned to trans-cinnamoyl-papain although the
model compound S-trans - cinnamoylcysteine shows a significantly
different A max of 306 rim. Only upon denaturation of the enzyme
did the spectrum attributed to trans-cinnamoyl-papain shift to
a x max of 301 or 309 nm ( in the presence or absence of the
denaturing agent respectively ). Deacylation proved to be first-
order in acyl enzyme and equal to the rate of appearance of trans-
cinnamic acid. When BAEE was added to a solution of trans-
cinnamoyl-papain, activity towards the substrate reappears at

14
the same rate as the acyl enzyme deacylates. These studies
support the conclusion that the non-specific substrate reacts at
the same site which catalyses the hydrolysis of a specific substrate.
Added amine and alcohol nucleophiles increased the rate of deacyl-
ation of the acyl enzyme. The 700-fold increase in reactivity of
methyl amine to trans -cinnamoyl- papain as compared to trans-
cinnamoyl- a-chymotrypsin is consistent with the formation of a
thiolester as these have been shown to be more susceptible to
attack by nitrogen nucleophiles than the corresponding esters
(Bruice, 1961; Bruice and Benkovic, 1966).
Similar results were obtained by Hinkle and Kirsch (1970)
with furylacryloyl- and indolylacryloyl-papains. Both acyl
enzymes were prepared, isolated and extensively studied over
a wide range of pH, temperature, and varying concentrations
of organic cosolvents. The acyl enzyme s are all reported. tbe
characterized by red-shifted absorption maxima as compared
to the corresponding S-acylcysteine model compounds and the
denatured acyl enzymes. The PK for hydrolysis of furylacryloyl-
papain was determined to be 4. 63 as compared to 4. 7 for trans-
cinnamoyl-papain by Brubacher and Bender (1966). The effect
of organic solvents on the rate of deacylation of the furylacryloyl-,
indolylacryloyl, and trans - cinnamoyl- papains was much greater
than that observed for the specific Na-CBZ-glycyl and Na-CBZ-
L-lysyl papains. These results suggested an improvement in
the orientation of the acyl group with respect to the enzyme upon
addition of organic solvent which increases the rate of deacylation.
The more reactive Na-CBZ-glycyl and Ncz-CBZ-L-lysyl papains
presumably can assume an optimal orientation which is less subject
to improvement by added solvents. The acyl papains prepared
were also observed to be much more stable to variations in temp-
erature and pH as compared to the native enzyme.
Zannis and Kirsch (1978) used the same methods to study
the effects of substituents on the rates of deacylation of substituted
15
benzoyl-papaifls. At low pH a series of meta- and para-sub-
stituted benzoylimidazoleS in excess were reacted with papain.
The acyl papains isolated slowly recovered activity to Na-CBZ-
glycine p-nitrophenyl ester with a rate constant equal to that
determined by the decrease in absorbance of the acyl enzyme.
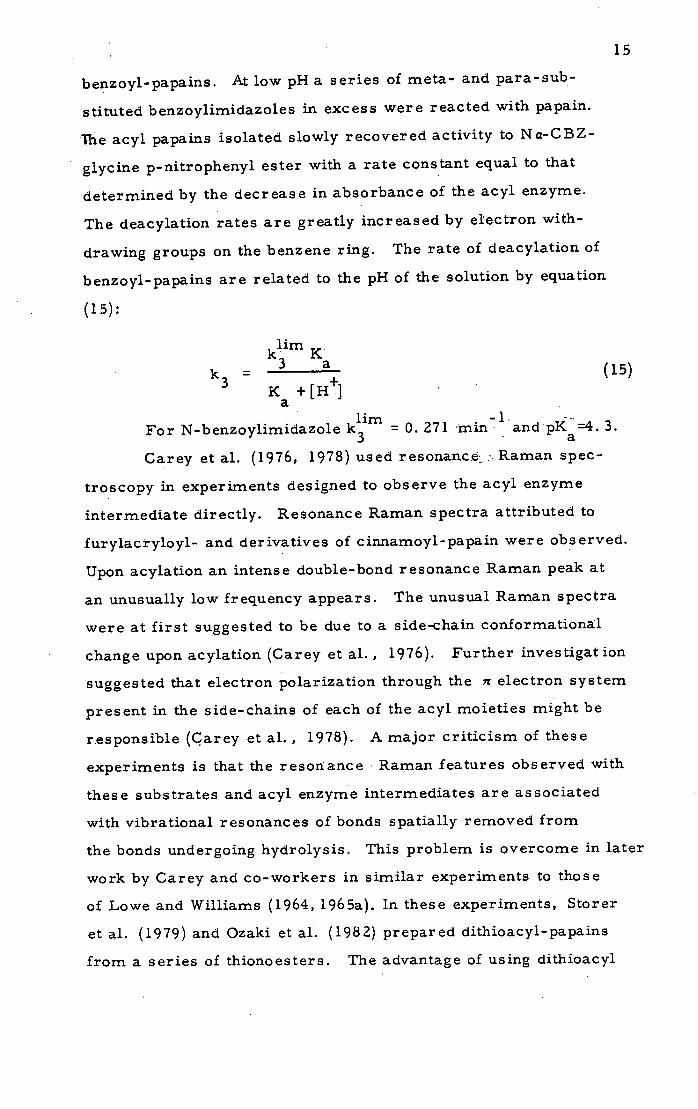
The deacylation rates are greatly increased by electron with-
drawing groups on the benzene ring. The rate of deacylation of
benzoyl-papains are related to the pH of the solution by equation
(15):
klim K
k3= 3 a (15)
K +[H.}
li For N-benzoylimidazole km = 0. 271 min andpK. 3.
Carey et al. (1976, 1978) used resonance. Raman spec-
troscopy in experiments designed to observe the acyl enzyme
intermediate directly. Resonance Raman spectra attributed to
furylacryloyl- and derivatives of cinnamoyl-papain were obs erved.
Upon acylation an intense double-bond resonance Raman peak at
an unusually low frequency appears. The unusual Raman spectra
were at first suggested to be due to a side-chain conformational
change upon acylation (Carey et al., 1976). Further investigation
suggested that electron polarization through the 7t electron system
present in the side-chains of each of the acyl moieties might be
responsible (Carey et al. , 1978). A major criticism of these
experiments is that the resonance Raman features observed with
these substrates and acyl enzyme intermediates are associated
with vibrational resonances of bonds spatially removed from
the bonds undergoing hydrolysis. This problem is overcome in later
work by Carey and co-workers in similar experiments to those
of Lowe and Williams (1964, 1965a). In these experiments, Storer
et al. (1979) and Ozaki et al. (1982) prepared dithioacyl-papains
from a series of thionoesters. The advantage of using dithioacyl

16
derivatives is that the dithioacyl group formed in the reaction is
observable by resonance Raman techniques. Transient resonances
associated with the CS and C-S stretching frequencies of a dithio-
acyl-papain intermediate were observed. Ozaki et al., (1982)
concluded that the vibrational properties of the dithioester centre
is perturbed. This perturbation is suggested to arise from an
intramolecular interaction between the N-acyl group and the
dithioester:
,CH2 HN CS
C=OOPapain
S I
They also suggested that this interaction is present in a
majority of the dithioacyl -papa in molecules but a small population,
of the acyl enzyme is in a conformation where this interaction
is absent. The intramolecular interaction is believed to arise from
dipole-dipole forces oramide 7relectrons interacting through
space with sulphur dr orbitals and does not involve simple hydrogen
bonding or enethiol tautomerism. As in the studies of Lowe and
Williams (1964,I965a) the results obtained with the dithioacyl-
papains may or may not be relevant to the investigations concerning
an actual acyl intermediate in the papain-catalysed hydrolysis of
ester and amide substrates.
Fink and co-workers have applied cryoenzymological
techniques to the study of papain- catalys ed hydrolyses (see
Cryoenzymology section). Fink and Angelides (1976) and
Angelides and Fink (1978) studied the papain-catalysed hydrolysis
of the methyl and p-nit•rophenyl esters of Na-CBZ-L-lysine at
low temperature and in aqueous-dimethylsulphoxide cryosolvents.
Both reports claim direct observation and trapping of Na-CBZ-
L-lysyl-papain. In addition, in the hydrolysis of the methyl ester,

17
evidence for the detection of two reactions preceeding formation
of the acyl enzyme are reported. (Fink and Angelides, 1978). A
more extensive discussion of this work is presented in a following
section.
There is an abundance of evidence in support of an acyl
enzyme intermediate in papain catalysis. Most of the indirect
evidence is very convincing but suffers an intrinsic limitation in
that it is indirect. Direct evidence, such as observation of the
dithioacyl intermediate by both UV and resonance Raman spectro-
scopy is also important, but thionohippurates are chemically
distinct from amide and ester substrates. Direct UV observation
of acyl enzymes from specific or non-specific substrates unfortu-
nately provides little information regarding the specific atomic
and/or molecular interactions of particular interest at the active-
site. The fact that there is a red shift of the absorption maxima
of the acyl enzymes as compared to the models:whichisnotfully
explained indicates that UV is not a good diagnostic probe of
thioester formation. The results do provide a wealth of information
regarding the catalytic mechanism of papairi-catalysed hydrolyses
but also emphasize the need for further investigations.
Tetrahedral Intermediate
The reaction pathway (3) previously presented is a relatively
simple summation. There is also evidence of other intermediates
involved in the reaction pathway. Tetrahedral intermediates, THI's,
have been proposed in thenon- enzymatic hydrolysis of amides and
esters (Bender, 1960). The possibility that the remarkable catalytic
efficiency of papain in hydrolysing peptide bonds is a result of
specific stabilization of a TI-il has received widespread interest.
In the OH catalysed hydrolysis of aryl esters and anilides, forma-
tion of the THI is rate limiting for the aryl esters (Bunton and
Spatcher, 1956) while breakdown is rate limiting for the anilides

18
(Bender and Thomas, 1961).
The search for evidence for the involvement of a THI in
the hydrolytic mechanism of the serine proteases has been most
extensive. Caplow and co-workers proposed a mechanism
involving rate limiting breakdown of a THI which accumulates
in a pre-equilibrium reaction prior to acyl enzyme formation
in the chymotrypsin-catalysed hydrolysis of anilides, (Caplow,
1969; Lucas and Caplow, 1972) and hydrazides (Lucas et al., 1973).
Fersht and Requena (1971), Fersht (1972), and Fastrez and Fersht
(1973), also presented mechanisms involving THI's for the chymo-
trypsin-catalysed hydrolyses but in this case they conclude
that the intermediate is present only in low steady-state concen-
tration and is not detectable. They also suggest that breakdown
of the THI is rate determining at high pH and formation is rate
determining at low pH. This is consistent with the results of
O'Leary and Kluetz (1972) who observed a change in the nitrogen
isotope effect with changes in pH in the chymotrypsin -catalysed
hydrolysis of Na-Ac-L-tryptophanamide.
Evidence for a tetrahedral adduct had been presented in
x-ray diffraction studies of the crystalline complexes formed
between trypsin and soybean trypsin inhibitor (Sweet et al., 1974)
and pancreatic trypsin inhibitor (Ruhlmann et al., 1973). These
inhibitors are thought to act like true substrates but do not
completely hydrolyse due to conformational constraints. Later
studies using refined x-ray (Huber et al., 1974; Huber and Bode,
1978) and 13C-NMR (1-lunkapillar et al., 1979, Baillargeon et al.,
1980; Tschesche and Wüthrich, 1980) techniques have shown no
evidence for a covalent fully tetrahedral adduct. The 13C-NMR.
studies found no evidence for the significant upfield shift of the
NMR resonance expected in changing from an sp 2 hybridized
carbonyl carbon to the sp 3 hybridized carbon of a tetrahedral
adduct. Such a shift was observed in the binding of a pepstatin
inhibitor analogue to porcine pepsin (Rich et al., 1982).

19
Direct observation of accumulated THFs in the serine
protease catalysed hydrolysis of specific substrates has also
been claimed. Hunkapillar et al. (1976) followed the a-lytic
protease and elastase catalysed hydiolyses of Na-Ac-L-Ala-
L-Pro- L-Ala-p-nitroanilide by stopped-flow spectrophotometry
and observed b.irst kinetics. This observation is attributed to
the rapid formation of a THI and its subsequent rate limiting
breakdown. Petkov (1978) obtained similar results with Na-Ac-
L-lysine-p-nitroanilide and trypsin. Both observations of burst
kinetics were based on the assumption that the THI has an absorp-
tion spectrum similar to p-nitroaniline (Robinson, 1970; Lowe
and Yuthavong, 1971b; Fastrez and Fersht, 1973).
Cryoenzymological techniques have also been used in the
study of the hydrolysis of specific anilide substrates by the serine
proteases. Claims for detection and accumulation of a THI in the
élastase (Fink and Meehan, 1979) and trypsin (Compton and Fink,
1980) catalysed hydrolyses of specific anilide substrates have
been presented. Both reports showed evidence of burst kinetics
purportedly due to the accumulation of a THI. These papers are
discussed further in the Cryoenzymology section.
Markley et al. (1981) reinvestigated the claims for burst
kinetics observed with the specific substrates just outlined above.
In each case, the authors presented alternative results inconsistent
with THI formation and accumulation and offered explanations for the
observation of artefactual burst kinetics in the previous studies.
For example, The non-linear kinetics reported by Hunkapillar et al.
(1976) and Fink and Meehan with Na-Ac-L-Ala-L-Pro-L-Ala-
p-nitroanilide can be explained by cis, trans heterogeneity about
the Ala-Pro peptide bond. Markley et al. (1981) conclude that
there is no spectroscopic evidence for the existence of a TI-lI
in amide hydrolysis by the serine proteases and reiterated the
conclusions of Fastrez and Fersht (1973), that if a tetrahedral
species is involved it is a transition state or an intermediate that
20
does not accumulate appreciably.
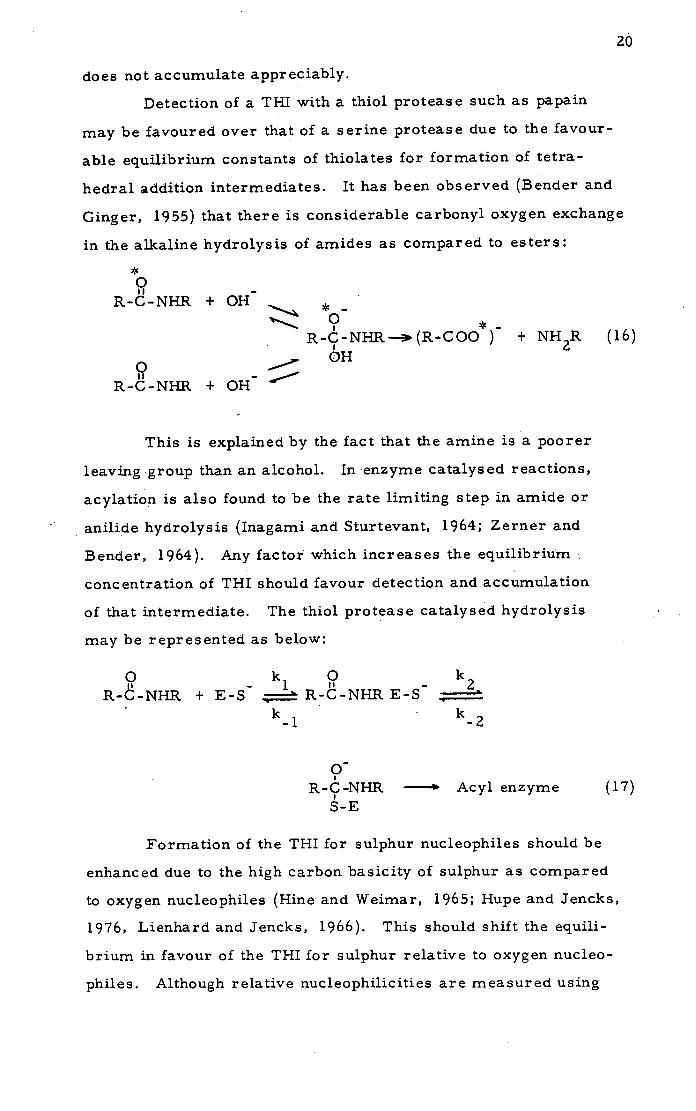
Detection of a THI with a thiol protease such as papain
may be favoured over that of a serine protease due to the favour-
able equilibrium constants of thiolates for formation of tetra-
hedral addition intermediates. It has been observed (Bender and
Ginger, 1955) that there is considerable carbonyl oxygen exchange
in the alkaline hydrolysis of amides as compared to esters:
* 0
R-d-NHR + OH * -
'..-. 9 R-C-NHR---(R-COO) + NH 2R (16)
- OH
R-C-NHR + OH
This is explained by the fact that the amine is a poorer
leaving group than an alcohol. In enzyme catalysed reactions,
acylation is also found to be the rate limiting step in amide or
anilide hydrolysis (Inagami and Sturtevant, 1964; Zerner and
Bender, 1964). Any factor which increases the equilibrium
concentration of THI should favour detection and accumulation
of that intermediate. The thiol protease catalysed hydrolysis
may be represented as below:
0 k 0 k
R--NHR + E-S R--NHR E-S 2
k 2
0
R-9-NHR Acyl enzyme (17)
S-E
Formation of the THI for sulphur nucleophiles should be
enhanced due to the high carbon basicity of sulphur as compared
to oxygen nucleophiles (Hine and Weimar, 1965; Hupe and Jencks,
1976, Lienhard and Jencks, 1966). This should shift the equili-
brium in favour of the THI for sulphur relative to oxygen nucleo-
philes. Although relative nucleophilicities are measured using
21
low molecular weight compounds it is reasonable to assume that
these results will be significant when applied to enzymatic systems.
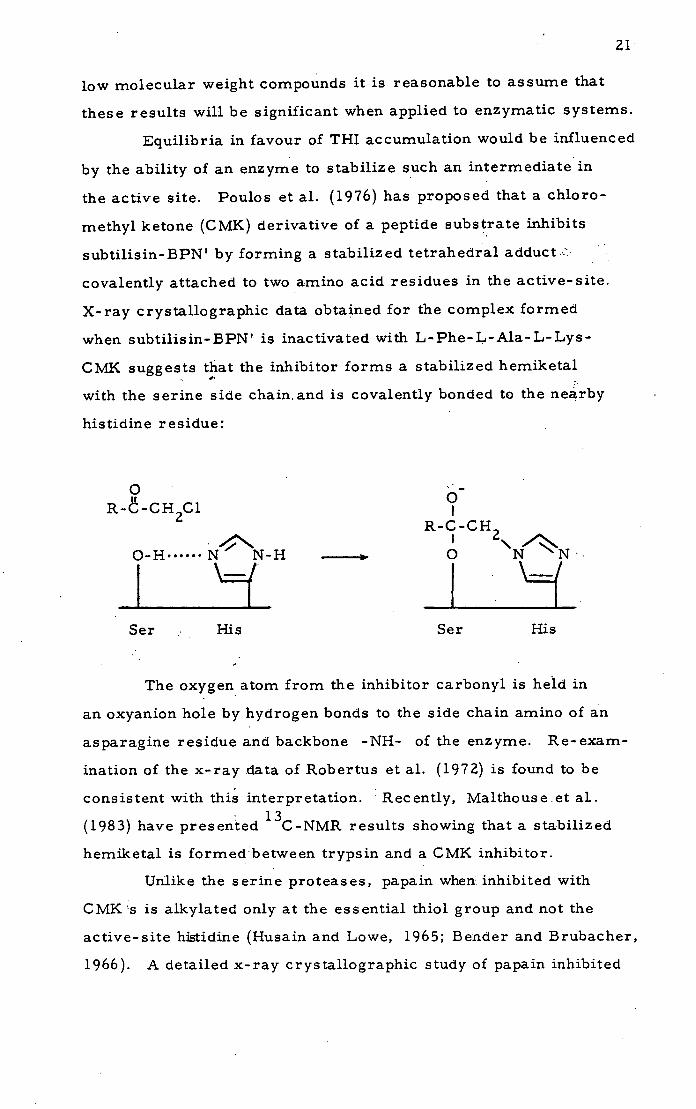
Equilibria in favour of THI accumulation would be influenced
by the ability of an enzyme to stabilize such an intermediate in
the active site. Poulos et al. (1976) has proposed that a chloro-
methyl ketone (CMK) derivative of a peptide substrate inhibits
subtilisin-BPN' by forming a stabilized tetrahedral adduct.::
covalently attached to two amino acid residues in the active-site.
X-ray crystallographic data obtained for the complex formed
when subtilisin-BPN' is inactivated with L-Phe-L-Ala-L-Lys-
CMK suggests that the inhibitor forms a stabilized hemiketal
with the serine side chain and is covalently bonded to the nearby
histidine residue:
0 R--CH 2Cl
0-H ...... NN-H
I I:::-- f ' - - Ser His
R-C-CH
Ser His
The oxygen atom from the inhibitor carbonyl is held in
an oxyanion hole by hydrogen bonds to the side chain amino of an
asparagine residue and backbone -NH- of the enzyme. Re-exam-
ination of the x-ray data of Robertus et al. (1972) is found to be
consistent with this interpretation. Recently, Malthouse.et al. 13
(1983) have presented C-NMR results showing that a stabilized
hemiketal is formedbetween trypsin and a CMK inhibitor.
Unlike the serine proteases, papain when. inhibited with
CMKs is alkylated only at the essential thiol group and not the
active-site histidine (Husain and Lowe, 1965; Bender and Brubacher,
1966). A detailed x-ray crystallographic study of papain inhibited

22
by chiorornethyl ketone substrate analogues has been presented
by Drenth et al. (1976). CBZ-L-Phe-L-Ala-CMK, CBZ-Gly-
L-Phe-CMK, and Ac-L-Ala-L-Ala-L-Phe-L-Ala-CMK were
prepared, reacted with papain, and crystallized. The authors
suggested that the binding of CMK's to papain is a good model
for substrate binding. The ketone carbonyl is found to be adjacent
to a backbone -NH- of Cys-25 and pointing toward the amino
group of Gln-19 although it is not located optimally for hydrogen
bonding. The phenylalanine side chain of the inhibitor lies
near Val-133 and Val-157 explaining the specificity of papain
for a hydrophobic residue at P 2 (Berger and Schechter, 1970).
A theoretical model for the acyl enzyme was constructed by
removing the extra methylene group and forming the thioester
linkage. This manipulation was predicted to cause only a slight
perturbation of the rest of the inhibitor. The carbonyl group
remains in the oxygen binding site in the region containing the
two potential hydrogen bonding groups. From this acyl enzyme
a model for a THI may be obtained by converting the carbonyl
carbon to a tetrahedrally arranged carbon atom. In this model,
the hypothetical leaving group is positioned optimally for
protonation by His-159 leading to acylation of the enzyme.
The model suggests that papain can potentially accommodate
and stabilize a THI which may be the important factor in being
able to accumulate and detect this intermediate..
Westerik and Wolfenden (1972) theorize that if catalysis
by papain is due to stabilization of a transition state or inter-
mediate resembling a THI, then the stability of adducts similar
to this intermediate should be enhanced. The formation of a
hemithioacetal resembling a THI has been proposed in the reversible
inhibition of papain with aldehydes (Westerik and Wolfenden, 1972;
Lewis and Wolfenden, 1977b; Bendall et al. 1977 ; Frankfater and
Kuppy, 1981). Deuterium isotope effects (Lewis and Wolfenden,
1977b) and 1 H-NMR results (Bendall et al., 1977; Clark et al., 1977)

23
are consistent with formation of a hemithioacetal between the
thiol group of Cys-25 and the aldehyde:
0 it
R-d-H OH + R-ç-H (19)
S - Enzyme Enzyrne-SH
Hernithioac etal
There is evidence consistent with formation of a THI in
the papain-catalysed hydrolysis of specific substrates. Lowe
and Williams, (1965b) studied the acylation reaction of papain
with a series of p-substituted phenyl esters of hippuric acid and
calculated a Hammett p +1. 2 for the process. This is inter-
preted to mean that acylation is subject to nucleophilic, or
general-base catalysis. Later, Lowe and Yuthavong (1972b)
studied the effects of substituents in the leaving groups on the
acylation of papain by hippuryl anilides. A Hammett p = -1.04
is obtained suggesting that the rate limiting process is electro-
philic or general-acid catalysed for the anilides. Both observations
are consistent with a mechanism involving a THI. The formation
of the intermediate is rate determining for the esters in a
general-base catalysed step, and breakdown is rate determining
for the anilides in a general-acid cathiysed step.
The papain-catalys ed hydrolysis of N a-benzoyl- L-arginin-
amide was shown to exhibit a nitrogen isotope effect close to the
upper limit indicating that the rate limiting step involves breaking
of the carbon to nitrogen bond (O'Leary et al., 1974; O'Leary and
Kluetz, 1971). The isotope effect observed for papain is larger
than that previously observed for chymotrypsin (O'Leary and
Kluetz, 1972). This is interpreted in terms of partitioning of
the THI. For chymotrypsin k 2 k 1 (equation (20)) so there is
a smaller nitrogen isotope effect as compared to papain where
24
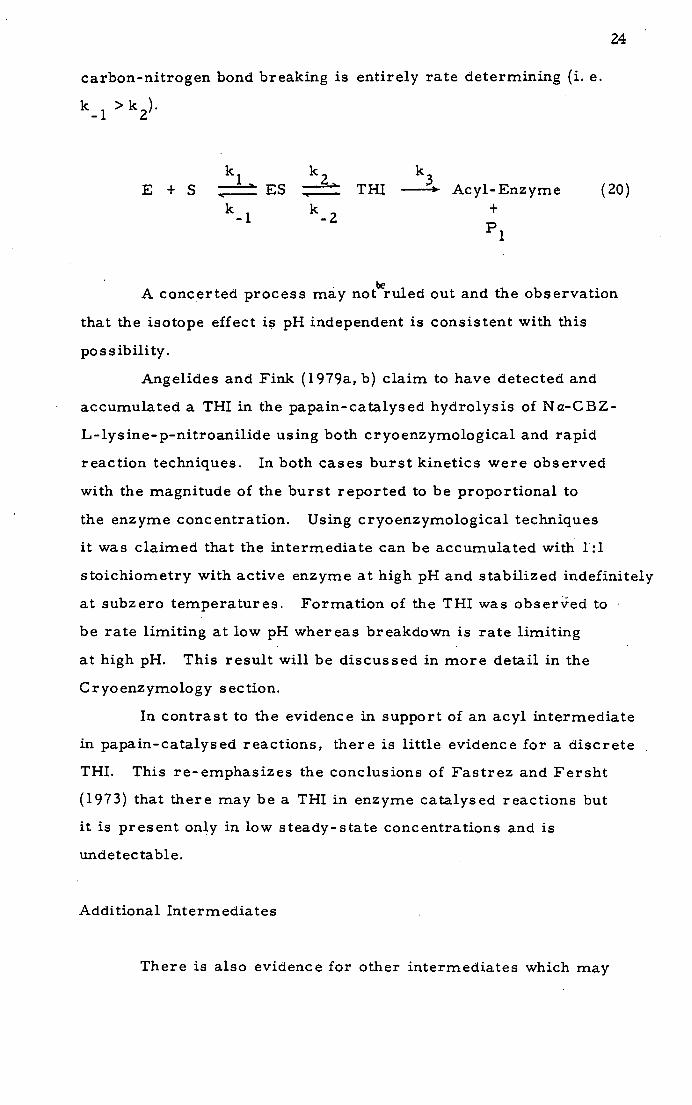
carbon-nitrogen bond breaking is entirely rate determining (i. e.
k 1 >k 2 ).
k k k E + S 1 ES 2, THI Acyl-Enzyme (20)
k 2 + P 1
A concerted process may notruled out and the observation
that the isotope effect is pH independent is consistent with this
possibility.
Angelides and Fink (1979a, b) claim to have detected and
accumulated a THI in the papain-catalysed hydrolysis of Na-CBZ-
L-lysine-p-nitroanilide using both cryoenzymological and rapid
reaction techniques. In both cases burst kinetics were observed
with the magnitude of the burst reported to be proportional to
the enzyme concentration. Using cryoenzymological techniques
it was claimed that the intermediate can be accumulated with 1:1
stoichiometry with active enzyme at high pH and stabilized indefinitely
at subzero temperatures. Formation of the THI was observed to
be rate limiting at low pH whereas breakdown is rate limiting
at high pH. This result will be discussed in more detail in the
Cryoenzymology section.
In contrast to the evidence in support of an acyl intermediate
in papain-catalysed reactions, there is little evidence for a discrete
THI. This re-emphasizes the conclusions of Fastrez and Fersht
(1973) that there may be a THI in enzyme catalysed reactions but
it is present only in low steady-state concentrations and is
undetectable.
Additional Intermediates
There is also evidence for other intermediates which may
25
be present in papain-catalysed hydrolyses. H:énry and Kirsch (1967)
suggest that departure of the leaving group may be an important
step in enzyme catalysed hydrolyses. Many other investigators
have also concluded that there is interaction of substrate leaving
groups with the enzyme (Brubacher and Bender, 1966; Bender and
Brubacher, 1966; Berger and Schechter, 1970; Lowe and Yuthavong,
1971a; Williams et al, 1972b; Mole and Horton, 1973; Alecio et al.
1974).
Stopped-flow experiments of the papain and ficin-catalysed
hydrolysis of Na-CBZ-L-lysine p-nitrophenyl ester under conditions
with [E]0) [ S]0indicated an extra step in addition to the three step
process (3) (Holloway and Hardman, 1973). This extra step is
proposed to be a conformational change in the enzyme-substrate
complex occurring prior to release of p-nitrophenol. They also
propose that different substrates are hydrolysed by different
pathways determined by the leaving group. Similar suggestions
have been made by Mole and Horton (1973). Lowe and Yuthavong
(1971a) predicted conformational changes in the enzyme-substrate
complex. They suggested a model for an enzyme-substrate complex
which implies a mutual distortion of the substrate and the enzyme.
The distortion facilitates binding and the stronger binding facilitates
distortion.
Similar conclusions suggesting enzyme- substrate conform-
ational changes after binding were presented as the result of steady-
state and pre- steady- state fluorescence experiments (Lowbridge
and Fruton, 1974; Mattis and Fruton, 1976). In these experiments,
a fluorescent probe on the amino terminus of peptide substrates
provided information on binding interactions. Later studies using
aldehyde derivatives as reversible competitive inhibitors also
showed evidence of a conformational change (Mattis et al. , 1977;
Henes et al., 1979).
Drenth et al. (1976) predicted a widening of the active-site
groove upon binding from the x-ray crystallographic study of a

26
papain-CMK complex. In addition, rotation of the imidazole of
His-159 in the active-site, from its position found in the crystal
structure, upon substrate binding is proposed.
Angelides and Fink (1978) presented a. detailed mechanism
also involving movement of the active-site imidazole. Two con-
formational states of the enzyme are proposed; one with the imidazole
hydrogen-bonded to Asn-175 (UP conformation), and the other
involving protonated imidazole interacting with the carboxylate
of Asp-i 58 and thiolate of Cys- 25 (DOWN conformation). This
mechanism was put forward after observation of three intermediate
reactions prior to the acyl enzyme in the papa in- catalys ed hydro-
lysis of Na-CBZ-L-lysine methyl ester at low temperature in
fluid aqueous cryosolvent.
These intermediates outlined in this section are proposed
in addition to the more commonly suggested acyl and tetrahedral
intermediates. Detection ofthese other intermediates is extremely
difficuitsince many of the transformations involved are associated
with non-covalent interactions of enzyme and substrate. These
interactions are not limited to a specific site on the enzyme as is
the case of tetrahedral and acyl intermediates which may occur
at a single catalytic centre.
pH Dependence
Papain is sufficiently stable to allow complete kinetic
analysis over a wide range of pH values (Stockell and Smith, 1957).
The pH dependence of the Michaelis-Menten parameters have
been determined for several substrates and the results obtained
are useful in. the determination of the catalytic mechanism
(Whitaker and Bender, 1965; Bender and Brubacher, 1966;
Williams and Whitaker, 1967; Lowe and Yuthavong, 1971b). From
these studies, the bimolecular acylation constant, k /K = cat m
k 2 /K shows bell-shaped pH dependence with apparent PKaIS of

27
approximately 4. 2 and 8. 2. These pK values represent ionization
of the His-159 and Cys-25 residues at the active-site. The ionic
forms of papain with both histidine and cysteine protonated, repre-
sented by [-SH HImt], is inactive at low pH, and the non-protonated
form represented [-S Im-] has low activity at high pH. The
catalytically active form at neutral pH is one of the monoprotonated
forms; [-SH Im-], [-S HImt], or an intermediate form
[_SF H SIm_] (Brocklehurst and Little, 1970, 1972, 1973; Shipton
et al., 1975; Shipton and Brocklehurst, 1978; Lewis,
et al. , 1976; Creighton et al., 1980). The interaction of thiol
and imidazole may be further affected by another group with a
pK 4 (Shipton et al., 1975; Bendall and Lowe, 1976; Shipton and
Brocklehurst, 1978; Lewis et al., 1978). The other group is
assumed to be the carboxyl group of Asp-158. The deacylation
step shows sigmoidal pH dependence with an apparent pK around
4 depending upon the nature of the acyl group. This PK is usually
attributed to the His-159 residue which has been suggested to act
as a general-base catalyst in deacylation (Brubacher and Bender,
1966).
Brocklehurst and co-workers illustrated the interaction
of the active site histidine, cysteine, and aspartic acid residues
through the use of two-protonic state reactivity probes; in particular
2, 2'-dipyridyl disulphide (2PDS). This two-protonic state electro-
phile is also useful as an active-site titrant since papain exhibits
high reactivity towards this irreversible inhibitor over •a range
of pH from 3 to 9 (Brocklehurst and Little, 1970; 1973). The
protonated form of the electrophile, present at low pH, is most
react.ve' which enables titration of the reactive papà.in thiol in the
presence of less reactive thiol groups in either low molecular
weight compounds or denatured papain. 2-PDS has also been used
in detecting chymopapain A and B contaminants commonly found
in some preparations of papain (Baines and Brocklehurst, 1978).
The thiol of papain reacts with 2-PDS by thiol disuiphide exchange
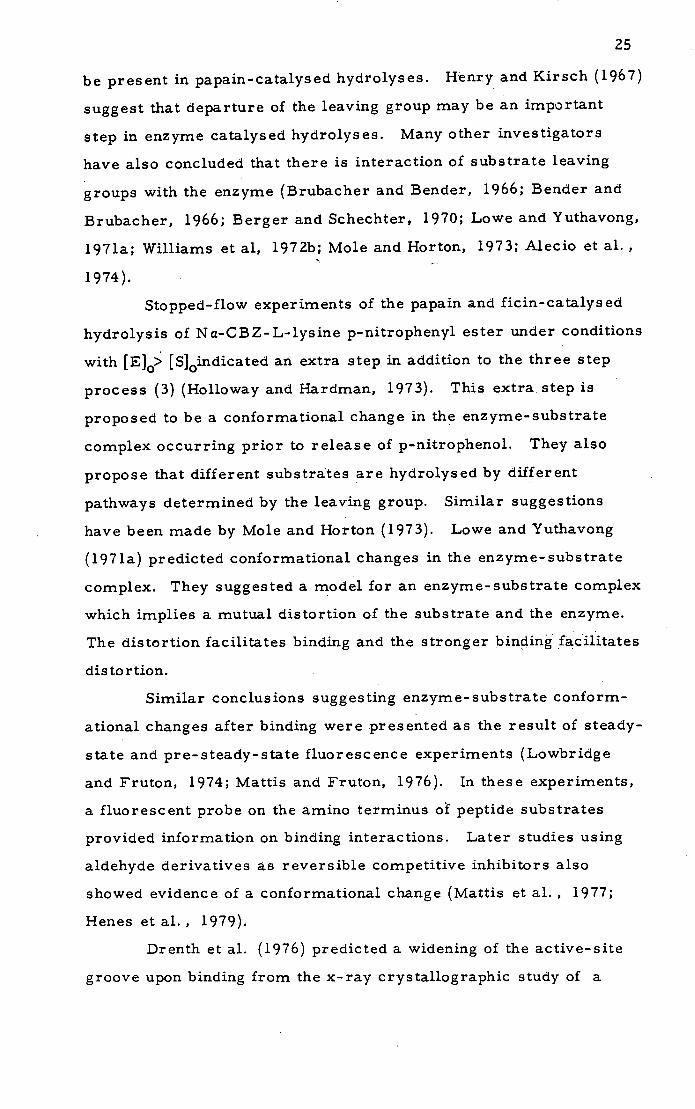
28
to form the blocked enzyme and release a 2-thiopyridone chromophore:
+ ,H
çss4) S HIm+
S-0 (21)
+ I
CN S'
E= 8080 M ' cm 1
Stuchbury et al. (1975)
The 2-thiopyridone released is stoichiometric with active enzyme.
Cryoenzymology
Enzymes, by their nature, are extremely efficient catalysts
with the majority having turnover numbers in the 10 3 to 106 s_i
range (Fersht, 1977). This in turn means that a given enzyme-
substrate complex or transient intermediate must have a life-
time of milliseconds or less. The existence and structure of such
short-lived intermediates, often present in very low concentrations,
must be observed and characterized before a detailed mechanism
can be proposed. An elucidation of the catalytic mechanism should
help explain the great catalytic efficiency of the enzyme.
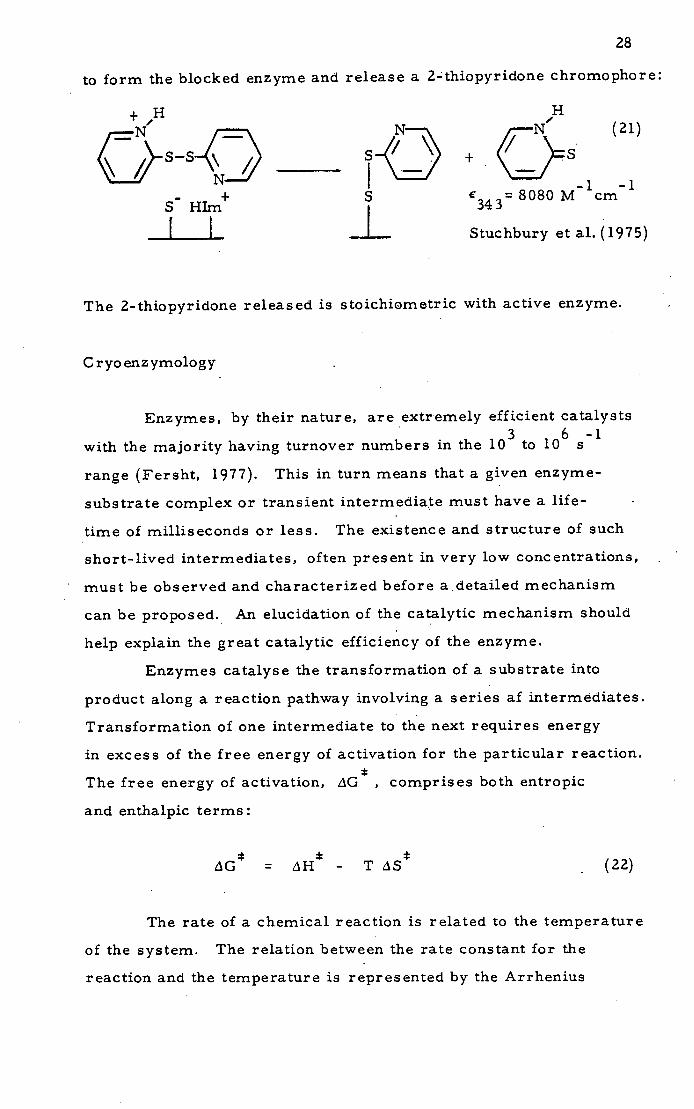
Enzymes catalyse the transformation of a substrate into
product along a reaction pathway involving a series af intermediates.
Transformation of one intermediate to the next requires energy
in excess of the free energy of activation for the particular reaction.
The free energy of activation, AG comprises both entropic
and enthalpic terms:
LG =AH - T AS (22)
The rate of a chemical reaction is related to the temperature
of the system. The relation between the rate constant for the
reaction and the temperature is represented by the Arrhenius

equation (23):
-E /RT
k = Ae a (23)
Where E is the activation energy which is related to the a
enthalpy of activation by the equation:
= E a + RT (24)
A decrease in temperature can therefore cause a dramatic
decrease in the reaction rate as illustrated in the table below
(Fink, 1976b).
Temp AH (kcal/mole)
5 8 11 15 20
298K 1 1 1 1 1
223 K 5.9x10 2 1.1x10 2.0x10 3 2.1x10 4 1.3x10 5
173 K I 2.4x10 3 6.7x10 5 1.8x10 6 1.4x10 8 3.5x01 (25)
The table shows the theoretical reduction in the relative
reaction rates (compared to 298 K) with the decrease in temperature
for different values of LH*. The higher the value of AH for a
particular reaction the greater the rate reduction upon lowering
the temperature.
A hypothetical energy diagram for an enzyme catalysed
reaction involving several intermediates is shown (Fink, 1976b).
7-1
Reaction coordinate
30
Starting with enzyme and substrate and using a suitably
low temperature, intermediates such as 12 and 1 4 could not be
accumulated although it may be possible to accumulate 1 4 by the
reverse reaction of enzyme with excess product. Cryoenzymology,
the use of low temperature techniques in the study of enzyme
mechanisms, has been developed to exploit the enthalpy differences
of the individual steps of an enzyme- catalys ed reaction in order
to accumulate and characterize the intermediates along the catalytic
pathway. P. Douzou and A. L. Fink have been instrumental in
developing and utilizing this technique and the subject has been
extensively reviewed (Douzou, 1973, 1974, 1977,1979;..Fink,
1976b,177; Fink and Geeves, 1979; Fink and Cartwright, 1981;
Fink and Petsko, 1981; Makinen and Fink, 1977).
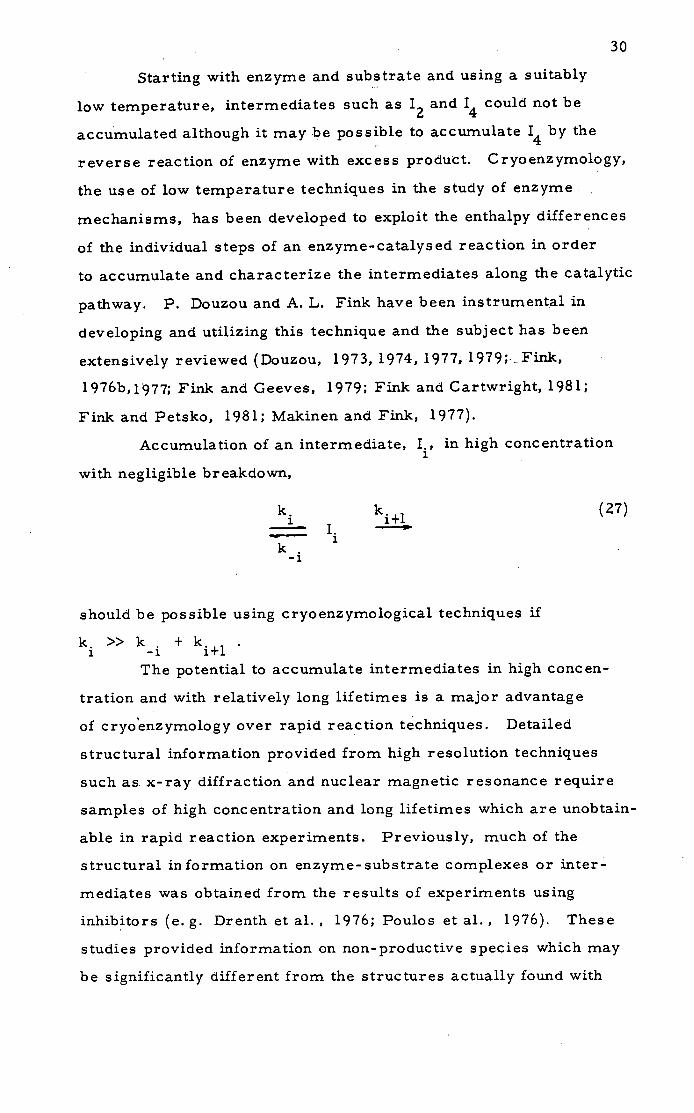
Accumulation of an intermediate, I in high concentration
with negligible breakdown,
k.+i (27)
k. 1
-1
should be possible using cryoenzymological techniques if
k. >> k . + k. 1 -1 i+1
The potential to accumulate intermediates in high concen-
tration and with relatively long lifetimes is a major advantage
of cryo'enzymology over rapid reaction techniques. Detailed
structural information provided from high resolution techniques
such as x-ray diffraction and nuclear magnetic resonance require
samples of high concentration and long lifetimes which are unobtain-
able in rapid reaction experiments. Previously, much of the
structural information on enzyme-substrate complexes or inter-
mediates was obtained from the results of experiments using
inhibitors (e.g. Drenth et al. , 1976; Poulos et al., 1976). These
studies provided information on non-productive species which may
be significantly different from the structures actually found with
31
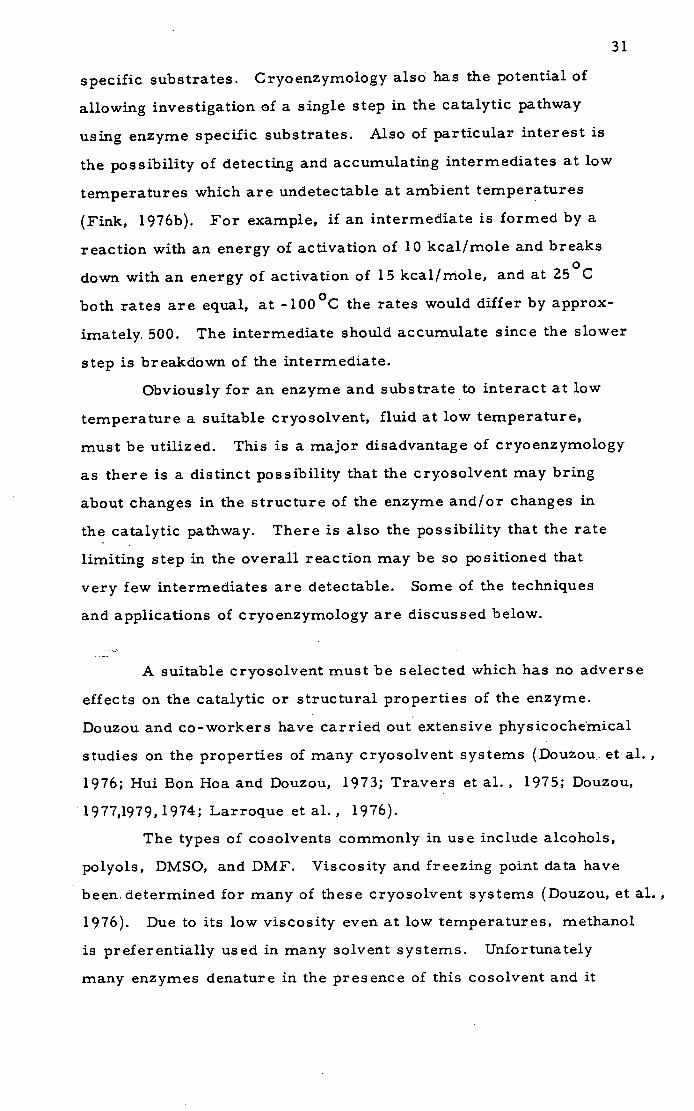
specific substrates. Cryoenzymology also has the potential of
allowing investigation of a single step in the catalytic pathway
using enzyme specific substrates. Also of particular interest is
the possibility of detecting and accumulating intermediates at low
temperatures which are undetectable at ambient temperatures
(Fink, 1976b). For example, if an intermediate is formed by a
reaction with an energy of activation of 10 kcal/mole and breaks
down with an energy of activation of 15 kcal/mole, and at 250
C
both rates are equal, at -1000C the rates would differ by approx-
imately. 500. The intermediate should accumulate since the slower
step is breakdown of the intermediate.
Obviously for an enzyme and substrate to interact at low
temperature a suitable cryosolvent, fluid at low temperature,
must be utilized. This is a major disadvantage of cryoenzymology
as there is a distinct possibility that the cryosolvent may bring
about changes in the structure of the enzyme and/or changes in
the catalytic pathway. There is also the possibility that the rate
limiting step in the overall reaction may be so positioned that
very few intermediates are detectable. Some of the techniques
and applications of cryoenzymology are discussed below.
A suitable cryosolvent must be selected which has no adverse
effects on the catalytic or structural properties of the enzyme.
Douzou and co-workers have carried out extensive physicochemical
studies on the properties of many cryosolvent systems (Douzou. et al.,
1976; Hui Bon Hoa and Douzou, 1973; Travers et al., 1975; Douzou,
1977,1979, 1974; Larroque et al., 1976).
The types of cosolvents commonly in use include alcohols,
polyols, DMSO, and DMF. Viscosity and freezing point data have
been determined for many of these cryosolvent systems (Douzou, et al.,
1976). Due to its low viscosity even at low temperatures, methanol
is preferentially used in many solvent systems. Unfortunately
many enzymes denature in the presence of this cosolvent and it
32
may not be desirable in reactions where it can compete with water
for an enzyme-bound species (e.g. as with the hydrolytic enzymes).
Polyols tend to be extremely viscous at low temperatures and
addition of an alcohol to produce a ternary solvent system may
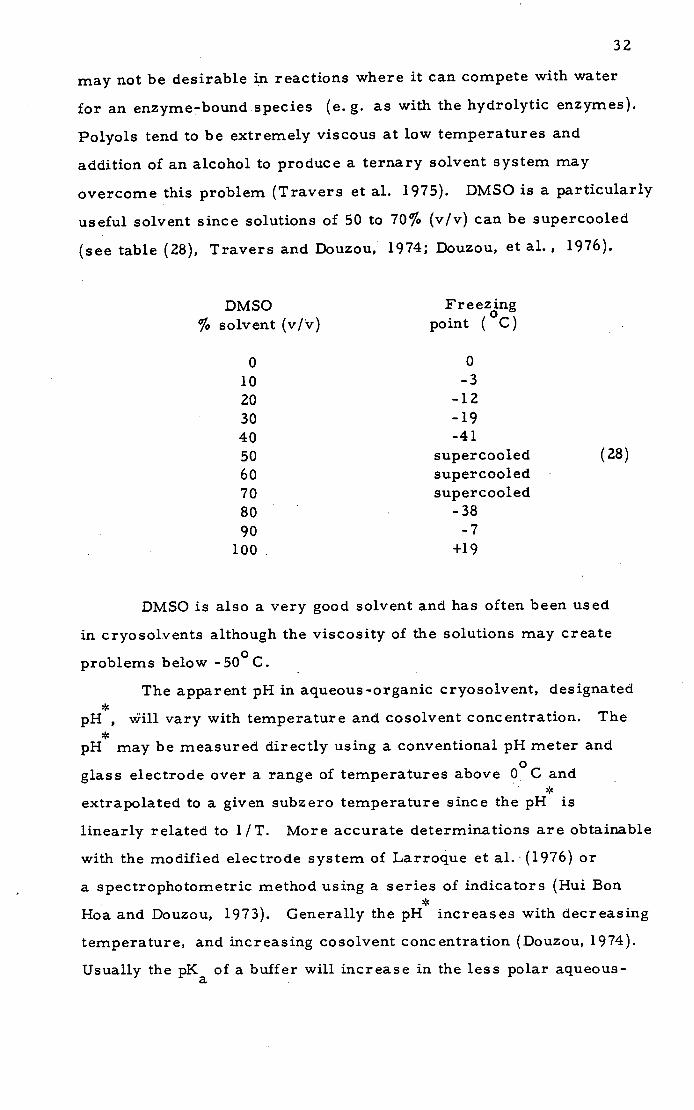
overcome this problem (Travers et al. 1975). DMSO is a particularly
useful solvent since solutions of 50 to 70% (v/v) can be supercooled
(see table (28), Travers and Douzou, 1974; Douzou, et al., 1976).
DMSO Freezing
% solvent (v/v) point ( C)
0 0 10 -3
20 -12
30 -19 40 -41
50 supercooled 60 supercooled 70 supercooled 80 -38
90 -7 100 +19
DMSO is also a very good solvent and has often been used
in cryosolvents although the viscosity of the solutions may create
problems below -50 0
C.
The apparent pH in aqueous-organic cryosolvent, designated *
pH , ill vary with temperature and cosolvent concentration. The *
pH may be measured directly using a conventional pH meter and
glass electrode over a range of temperatures above 00
C and
extrapolated to a given subzero temperature since the pH is
linearly related to l/T. More accurate determinations are obtainable
with the modified electrode system of Larroque et al. (1976) or
a spectrophotometric method using a series of indicators (Hui Bon *
Hoa and Douzou, 1973). Generally the pH increases with decreasing
temperature, and increasing cosolvent concentration (Douzou, 1974).
Usually the pK of a buffer will increase in the less polar aqueous-
(28)

33
organic solvent system.
The dielectric constant can affect many biochemical
processe8 since it influences the interaction between charged
species. Addition of most cosolvents lowers the dielectric constant
but a decrease in temperature is found to cause an increase (Travers
and Douzou, 1974). These effects may compensate and dielectric
constants for various solvent systems over a wide range of temperatures
have been determined (Douzou et al., 1976; Travers and Douzou, 1974).
Once an appropriate cryosolvent is selected the effect on
the conformational and catalytic properties of the enzyme must
be assessed. A wide range of enzymes are found to be active in
aqueous-organic solvent systems and have been studied using cryo-
enzymological techniques (see Fink and Geeves, 1979; Fink and
Cartwright, 1981). Fink and Geeves (1979) summarize the steps
involved in a complete cryoenzymological study which can be applied
to a variety of enzyme systems:
Preliminary tests (e. g. freezing point, viscosity) to identify possible cryosolvent(s).
Determine the effects of cosolvent and subzero temperatures on the catalytic and structural properties of the enzyme.
Detection of intermediates by initiating the enzyme-catalysed reaction at subzero temperatures.
Kinetic, thermodynamic and spectral characterization of any detected intermediates.
Correlation of the low temperature results with those results obtained in water at ambient temperatures.
High resolution structure determination of the trapped intermediates.
Since cryoenzymological studies have been applied to many diverse
enzyme systems, a review of this protocol as applied to some
serine and thiol proteases is most relevant.
a-Chymotrypsin has been found to be active at low
temperatures in methanol (Bielski and Freed, 1964), DMSO

34
(Fink, 1973a, b), and ethylene glycol (Kraicsovits and Douzou,
1973) containing cryosolvents; trypsin in DMSO (:Fink, 1974b),
1, 2-propanediol and ethylene glycol (Maurel et al., 1975); papain
in DMSO and ethanol (Fink and Angelides, 1976); and elastase
in DMSO and methanol (Fink and Ahmed, 1976) based cryo solvents.
The effects of the cosolvent on the structure of the protein
can be determined by observing the intrinsic spectral properties
of the enzyme (Fink,1973b, 1971b; Fink and Angelides, 1976).
Changes is the UV difference, circular dichroism, and fluorescence
emission spectra have all been shown to be useful in detecting
conformational changes in the enzyme as well as solvent perturbation
of the exposed amino acid chromophores (for a review see
Timasheff, 1970). Chymotrypsin (Fink,1973b), trypsin (Fink, 1974b),
and papain (Fink and Angelides, 1976) all exhibited an increase in
absorption intensity linearly related to an increase in DMSO
concentration, These results suggest that only solvent effects
on the exposed chromophoric side-chain residues are observed.
These effects would be expected to cause linear or smooth mono-
tonic changes with increasing DMSO concentration. Structural
perturbations cause sharp deviations with increasing co solvent.
This is illustrated with papain in that high concentrations of DMSO
(>60%v/v) cause sharp deviations in absorbance changes which
corresponded with the loss of catalytic activity (Fink and Angelides,
1976). Below 60% DMSO no sharp deviations were observed and
the circular dichroism and fluorescence emission spectra also
showed no evidence consistent with a structural change. With
papain and chymotrypsin there was no evidence for changes in
the tyrosine to tryptophan energy transfer (excitation at 260 rim,
emission at 330- 340 nm), as a function of solvent concentration,
indicating that the relative positions of these groups is unchanged.
A sharp break occurs in the plot of the relative fluorescence
emission of papain as a function of methanol concentration at about
10 M (50% v/v) cosolvent making this solvent unsuitable for
35
cryo enzymological experiments at that conc entration. Subz ero
temperatures similarly were found not to effect the structural
integrity of the enzymes. In each case, the transition involving
thermal denaturation of the proteins occurs at a lower temperature.
Papain was shown to reversibly denature above +5 °C in 60% (v/v)
DMSO at pH 3. 5 by a sharp change in the UV difference spectrum. S 0
Chymotrypsin is stable at temperatures <10 C in 65% DMSO and
trypsin at temperatures <6 0 C or at low pH. All of these enymes
must therefore be maintained at low temperature when in cryosolvent
solutions.
The most sensitive tests for determining the effects of
added cosolvent on the enzyme are those involving its catalytic
activity. Since enzymes require precise oriejitation and interaction
of its amino acid residues for catalysis to occur, minor structural
changes at the active site can produce significant effects on the
catalytic parameters.
Papain (Fink and Angelides, 1976) and trypsin (Fink, 1974b)
catalys ed hydrolyses of N a-CBZ- L-lysine p-nitrophenyl ester
both showed a decrease in k with an increase in DMSO concen- cat
tration. The same results were obtained for chmotrysin. and
Na-Ac-L-tryptophan p-nitrophenyl ester (Fink, 1973a,b). In
each case deacylation, the rate determining step, depends upon
water and the decrease in rate was attributable to the decrease
in the water concentration. Linear plots of log(k) vs. l/T cat
were obtained over the temperature ranges investigated.. This is
suggested to indicate that there is no change in the rate determining
step with decrease in temperature. Extrapolation of the linear
plots to 25 0 C, and allowing for the decreased water concentration,
resulted in calculated values of k cat
in reasonable agreement
with those obtained in the absence of DMSO at +25 0 C. These
results suggested that the DMSO cosolvent had no adverse effect
onk cat
In contrast, dramatic increases in the values of K were m
36
observed with an increase in DMSO concentration. With all three
enzymes mentioned above, an exponential increase in K m(app)
occurs with increasing DMSO concentration. Since in each case
a p-nitrophenyl ester was used, Km(app) ' k 3 s 2 (K 1k ), and the
exponential increase could be due to an increase in K and/or
a decrease in k 2 . The interaction of a competitive inhibitor,
proflavine, with chymotrypsin in DMSO solutions indicated that
the predominant effect is upon K (Fink, 1974a). The increase
was suggested to result from a combination of competitive inhibition
and dielectric effects on substrate and inhibitor binding. Maurel
(1978) studied the effects of various cosolvents on three enzyme-
substrate interactions and concluded that the effect of cosolvents
on K is due to the hydrophobic interactions in the binding step. m
The general rule proposed is that the larger the contribution of
hydrophobic interactions to the binding process, the larger the
effect an organic solvent will have upon Km• This is illustrated
by the observation that K m
for the interaction of ribonuclease
and RNA, where formation of the Michaelis-complex is predominately
due to electrostatic and not hydrophobic forces, is unaffected by
added cosolvent. With chymotrypsin, which relies on hydrophobic
interactions in the binding process, the values of Km are signifi-
cantly affected. Often the increased solubility of a substrate in
the cryosolvent will lower its affinity for the active-site which
increases the Km• The results imply that changes in the dielectric
constant have less of an effect upon K m
Temperature was shown to have little effect on proflavine-
chymotrypsin binding (Fink, 1974a). The effect of temperature
on K m m
is less well defined. Values of K for papain and Na-CBZ-
L-lysine p-nitrophenyl ester are reported to remain unchanged
at least over the range 0 to -200
C (Fink and Angelides, 1976).
With trypsin and the same substrate there is a significant decrease
with decreasing temperature.
Exponential increases in Km(app)
are of course undesirable
37
since increased concentrations of substrate are then required
to saturate the enzyme and make detection of an enzyme-bound
intermediate easier. Douzou and Ba]ny (1977) have shown that
the addition of water soluble polyelectrolytes to enzyme solutions
offers some protection against cosolvent effects on the kinetic
parameters. For example, K m(app)
for the hydrolysis of L-BAEE
by trypsin in 50% DMSO is reduced 10-fold by the addition of 10 p.g
of RNA. The strong electrostatic potential of these polyelectro-
lytes is thought to cause clustering of water molecules at the
expense of the organic solvent and preferentially solvating the
enzyme.
The evidence presented is consistent with the conclusion
that the structure and catalytic mechanism of the enzyme is not
significantly changed in some aqueous -organic cryo solvents.
Although K m(app)
is significantly affected, there is no evidence
that the catalytic pathway has been altered.
In light of the previous section on intermediates in the
reactions .cátalysed by the serine and thiol proteolytic enzymes,
cryoenzymology has found widespread application to the detection
and accumulation of such intermediates. After concluding that
a-chymotrypsin is stable and catalytically active in aqueous ]DMSO
and methanol solutions at low temperature, Fink has claimed
to have detected and isolated an acyl-chymotrypsin intermediate
(Fink, 1973a, b). The presumed Na-Ac-L-tryptophanyl- a-chymo-
trypsin was isolated by Sephadex LH-20 chromatography in the
cryosolvent at low temperature. Using similar procedures,
Fink et al. (1979) have claimed the isolation of Na-furylacryloyl-
L-tryptophanyl- a-chymotrypsin. Acyl enzymes from a, 8, y,
chymryps ins are all reported to be detected in high yields in both
DMSO and methanol cryosolvents at low temperatures (Fink and
Ahmed, 1976). The authors also used crystalline enzymes in
cryosolvent and at low temperature and have claimed to have
isolated high yields of crystalline acyl enzymes with negligible
38
turnover rates. Acylation for crystalline Y-chymotrypsin was
found to be fifteen times slower than for the dissolved enzyme with
no deacylation observable over two to four day periods at temper-
atures below _400 C. These experiments show the versatility
of the cryoenzymological technique and support the conclusion that
the catalytic pathway of chymotrypsin remains unchanged in cryo-
solvent.
Trypsin was found to be stable at low temperature in 65%
DMSO and an acyl enzyme is reported to be accumulated with
negligible turnover below -450
C (Fink, 1974b). Little spectro-
scopic evidence or information is presented for the acyl enzyme.
A later study indicated that 44% of the enzyme is acylated at -330
C
(Fink and Ahmed, 1976). Supposedly a higher proportion of enzyme
is acylated in studies with crystalline trypsin and the same substrate.
In the same report, rates of acylation and deacylation for elastase
dissolved in cryosolvent and in the crystalline state are also
presented. High concentrations of a proposed acyl enzyme are
reported for the elastase-catalysed hydrolysis of Na-CBZ-L-Ala-
p-nitrophenyl ester and Na-Ac-Ala 3 methyl ester in 70% methanol
cryosolvents. At temperatures below -450C, deacylation is not
observed. The rate of acylation in the crystalline enzyme is 20
times slower than in solution and deacylation may be slowed to
an even greater extent. Crystallographic studies of the acyl-
elastase intermediate have reported (Alber et al., 1976).
N a-CD Z- L-alanine p-nitrophenyl ester substrate is
dissolved in the methanol cryosolvent and diffused into the crystal
of elastase mounted in a flow-cell designed for use in a single
crystal diffractometer. Acylation was complete in one day and 0
collection of a complete set of three-dimensional data to 3. 5 A
of the crystalline acyl enzyme was completed in two days. An
electron density map is interpreted to show the close proximity
of the acyl group to the active-site Ser-195. No density due to
the p-nitrophenyl portion of the substrate is evident. (Alber et al., 1976).
39
Although a detailed structural interpretation is not presented,
this demonstrates the potential. for the application of the cryo-
enzyrnological techniques to high resolution structural deter-
minations.
C ryoenzymological investigations of the a- chymotryps in
catalysed hydrolysis of Na-Ac-L-Phe methyl ester (Fink and
Wildi, 1974), and the trypsin catalysed hydrolysis of Nc-Ac-
L-lysine methyl ester (Fink, 1974b) provided evidence for a
conformational change in addition to formation of the acyl enzyme
intermediate in the catalytic pathway. The a-chymotrypsin
catalysed reaction was studied more extensively. The reaction
was initiated at -900 C in 65% DMSO apparently without viscosity
problems. Raising the temperature allowed observation of three
distinct reactions attributed to substrate binding, acylation, and
deacylation. The product of the acylation reaction is reported
to undergo a significant decrease in the fluorescence emission
along with a blue shift in A max which is suggested to be due
to a perturbation of a tryptophan residue at the active-site. A
less detailed study with trypsin showed UV absorbance changes
suggesting a similar perturbation.
The detection of a possible tetrahedral intermediate is an
especially useful application of cryoenzymological techniques.
Considering the results of Fastrez and Fersht (1973) who con-
cluded that a THI exists only at low concentrations at room
temperature, cryoenzymology may be particularly suitable
since as previously mentioned, intermediates which may be
at low concentration at room temperature, may be accumulated
at higher concentrations at reduced temperatures.
Evidence supporting the presence of stabilized THIts
in the elastase catalysed hydrolyses of Ac-L-Ala-L-Pro-L-
Ala-p-nitroanilide, Ac - L- Pro - L-Ala- p-nitroanilide, and
succinyl-L-A1a 3 -P-nitroanilide at low temperature in aqueous
methanol cryosolvents has been presented (Fink and Meehan, 1979).
1979).

40
The absorption spectrum of the intermediate: is similar to the
product p-nitroaniline ( A =381 nm) but blue-shifted approx-
imately 20 nm to 359±2 nm. Both are significantly different from
the starting p-nitroanilide substrates which have absorption
maxima around 320 nm. The rate of formationof the reported
THI followed first-order kinetics and exhibited a sigmoidal *
pH dependence with pK =7.0 at -39 0 C. The amount of THI trapped a * *
is reported to increase with pH to a maximum value around pH
9. 4 and increase with decreasing temperature. Several arguments
were presented in favour of identifying this intermediate as a THI:
(i) The reaction of the p-nitroanilide substrates is much slower
than with the corresponding p-nitrophenyl esters. Since deacylation
is rate limiting for the esters, the rate limiting step for the anilides
must be prior to deacylation. (ii) An increase in enzyme concen-
tration increased the rate of reaction attributed to turnover and
the magnitude of the absorbance change associated with formation
of a THI. (iii) Increasing the substrate concentration increased the
rate of formation of the intermediate but not the turnover reaction.
The authors also report the detection of an additional intermediate
with a UV spectrum resembling the substrate but formed after
the Michaelis-complex. It was suggested that this intermediate
arises from a conformational change involving movement of the
active-site imidazole. Balny and Bieth (1977) also reported
evidence of a transient intermediate preceeding turnover in
the elastas e c3talys ed reaction of succinyl- L-A1a 3 -p-nitroanilide
at subzero temperatures in aqueous ethylene glycol. The cryo-
enzymological results compare favourably with the stopped-flow
results of Hurikapillar et al. (1976) at room temperature (see THI
section).
Similar results are obtained with trypsin and Na-CBZ-
L-lysine-p-nitroanilide (Compton and Fink, 1980). The authors
report that burst kinetics are observed in the formation of a T}-II
with a A of 355+2 nm. Formation of this intermediate is max -

41 *
negligible at pH values <6 and at temperatures higher than
-40 ° C. Kinetic parameters at room temperature in aqueous
solution are reported and Km = 1. 5mM. Burst kinetics correspontling
to 80%dthe active enzyme are observed under conditions of
-45 0 C, 65% DMSO, and with[S = 280 I.LM which would correspond
to a situation where <K. No kinetic parameters at low
temperature or in aqueous cryosolvent are presented. Although
these reports present some of the first direct evidence for
detection of a THI, the results are not as yet unambiguous. This
is especially true when the results of Markley et al. (1981) are
taken into account.
Markley et al. (1981), as discussed previous.y, reported
that burst kinetics observed by Fink and Meehan (1979) for proline
containing substrates may be due to cis, trans heterogeneity
about the alanyl-prolyl peptide bond. The authors argue that
elastase hydrolyses the cis-isomermore rapidly than the trans-
isomer which leads to observation of a burst due to different
rates of hydrolysis of different substrates and not a TI-il. This
however does not explain the results obtained with succinyl-L-
Ala 3 -p-nitroanilide substrate. Markley et al. (1981) point out
the difficulty in interpreting the data of Fink and co-workers
as essential kinetic parameters such as values of.K and magni-
tudes of bursts have not been reported. Inclusion of this data
would form a more complete and convincing argument in support
of the results. Markley et al. (1981) emphasize the need for
careful experimental technique since confusing spectral changes
may be due to incomplete mixing, (especially possible in viscous
solutions at low temperature) thermal gradients, and substrate
heterogeneity. The results indicate the applications and problems
of cryoenzymology as applied to the serine protease-catalysed
reactions.
After extensive CD, UV, fluorescence and kinetic studies,
Fink and Angelides (1976) concluded that papain is not adversely
affected by low temperature or aqueous-DMSO or aqueous-ethanol

42
cryosolvents. Methanol in solutions at concentrations greater
than 10 M and DMF containing cryosolvents were found to be
unsuitable. The acyl enzyme formed from the reaction of Na-
CBZ-L-lysine p-nitrophenyl ester and papain is reported to be
accumulated and trapped at temperatures below - 50 0 C in 60%
DMSO cryosolvents. Some of the data presented is inconsistent
with such a conclusion. Fink and Angelides (1976) have reported
experimental details for a typical acylation experiment with
14 liM and[S0 1 mM. The amount of p-nitrophenol released
in the acylation reaction is reported to be approximately stoichi-
ometric with enzyme and no subsequent release of p-nitrophenol
is detected. The K in 60% DMSO at 0 °C is observed to be 10 mM m
and is stated to be invariant between 0 and -20 °C. Although data
is not provided for Km at lower temperatures, a significant drop
must occur between -20 and -70 °C for the enzyme to be saturated
and a stoichiometric burst to occur. Such a significant effect is
not mentioned. The values of k cat
used in an Arrhenius plot are
obtained in 60% DMSO also withLS0 1mM (i.e. Km>::;ISc). Further-
more, a similar 1:1 stoichiometry of p-nitrophenol released to
enzyme concentration is observed in 12 M aqueous ethanol at _700 C
which is below the freezing point of such a solution ( CRC Handbook
of Chemistry and Physics).
Cryoenzymological studies of the papain-catalysed hydrolysis
of Na-CBZ-L-lysine methyl ester detected maximal changes at 276 nm
in the UV (Fink and Angelides, 1978). At low temperature, where
turnover is reported to be negligible, the reaction exhibits three
phases. The first two of these three phases could also be detected
in the fluorescence emission of the enzyme. The Trp-177 residue
at the active-site, which is responsible for a large part of the
fluorescence emission of the enzyme, is greatly influenced by the
interaction of the adjacent imidazole ring of His-159. Based on
the results of this investigation and those of earlier workers, a
detailed mechanism for the action of papain is proposed by
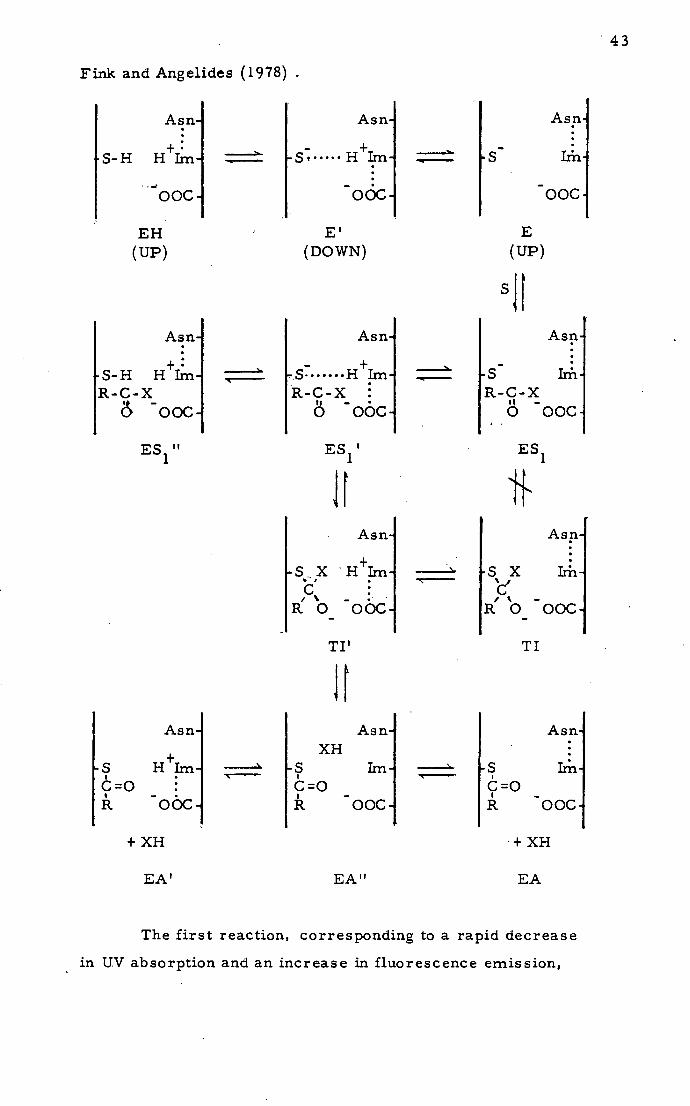
Fink and Angelides (1978)
Asn Asn Asn
S-H H+Im S ••••••H +Im S Ixri
ooc oác ooc
EH E E
(UP) (DOWN) (UP)
sfl Asn Asn Asn
S-H H+Im ' S ....... Hrn+I____ S Ith R-C--X R-C-X : R-C-X
_OOc o ooc ooc
ES 1 t' ES 1 ' ES 1
U . . Asn Asn
S.X H+Im '- S X Irh S.
R000C R000C
TI'
'It TI
Asn Asn Asn XH +
S HIm ' S Im S Ir I . C=O
I
C=O I
C=O I - . R OOC
I - R OOC
I - R OOC
+XH +XH
EA' EA" EA
The first reaction, corresponding to a rapid decrease
in UV absorption and an increase in fluorescence emission,
43

44
involves substrate binding to E to form ES 1 . The substrate
preferentially binds to the so-called UP form E rather than E'.
According to space-filling models, access to the active-site in
the latter form would be sterically hindered. The pKs of the
thiol group and the histidine imidazole are dependent upon the
enzyme conformation. The fluorescence increase in the first
reaction may be due to changes in the Trp-177 environment
on going from E' in the DOWN conformation with imidazolium
to ES 1 in the UP conformation with imidazole free base. Imida-
zolium ion is known to be an effective quenching agent in trypto-
phan emission (Shinitzky and Goldman, 1967). Reaction 2 is
assigned to the transformation of ES 1 to TI' via ES 1 ' at neutral
pH. At low pH, ES 1 is converted to ES 1 " via ES 1 1 . Both cases
are suggested to involve the rate limiting ES 1 to ES 1 ' transformation.
The quenching of the Trp-177 fluorescence emission is consistent
with the proposed step. Reaction 3, the slowest of those observed,
in the intermediate pH range is concluded to be the conversion
of species TI' to acyl enzyme EA' through EA". At high pH,
species TI should be formed in reaction 2 and accumulate since
the general-acid catalysis by the imidazole, which is required
to form the acyl enzyme, is not possible. Although much of the
mechanism proposed is purely hypothetical, it does appear to
explain many of the apparent differences in PKa values observed
in papain-catalysed reactions.
In an investigation similar to those previously reported
with the serine proteases, Angelides and Fink (1979a,b) studied
the papain-catalysed hydrolysis of Na-CBZ-L-lysine-p-nitro-
anilide. They reported the detection of four different reactions
spectrophotometrically prior to the turnover reaction. Each of
these reactions are separately characterized with respect to pH,
temperature and enzyme and substrate concentration. The
slowest reaction in the sequence was suggested to be acylation.
The first of the four reactions is considered to be formation of
45
the Michaelis-complex, coupled with a slower reaction attributed
to a conformational change between two forms of the enzyme
prior to binding. These results are consistent with the mechanism
proposed earlier. The third reaction is reported as a conforma-
tional change in the ES complex similar to the change observed
with the methyl ester, i.e. ES 1 to ES 1 t. The fourth reaction,
the product of which has a similar spectrum to the final product
p-nitroaniline, is suggested to be formation of a tetrahedral inter-
mediate. The absorption spectrum of this intermediate displayed
a A. max max of 365 nm in contrast to a A. of 320 nm for the substrate
and 380 nm for the product in 60% DMSO. The rate of formation of
the product of reaction 4 shows bell-shaped pH dependence with *
pK 's of 4. 3 and 8. 6. At low pH , formation of the intermediate
a * is rate determining, whereas at high pH breakdown is rate
determining. The concentration of the accumulated intermediate *
was shown to be pH dependent with a concentration of intermediate *
ranging from 3% of the enzyme concentration at a pH of 3 to a *
value of 98% of enzyme-bound intermediate at pH 9. 3. The
catalytic mechanism at low temperature in cryosolvent was
reported to be consistent with that found in aqueous solution at
21. 5 0 C by the reported observation of this same intermediate
by stopped-flow experiments. These results are claimed as
the first direct observation of a THI in the papain-catalysed
reactions. The greatest limitation of this investigation is the
small amount of structural information available from the UV
spectrum. The actual identity of the intermediates must be
inferred from the spectral changes.
The preceeding review demonstrates one of the most
valuable attributes of cryoenzymology, namely its applicability
to many types of enzymes and its adaptability to a wide range
of chemical and physical analytical techniques. Less ambiguous
results are still required and these may be obtainable by using
high resolution techniques such a x-ray diffraction and nuclear
46
magnetic resonance (NMR). NMR techniques have the advantage
in that they can be applied to enzymes in solution without giving
rise to many of the artefacts which may easily occur using spectro-
photometric techniques.
13C-NMR Spectroscopy
The preceeding sections have outlined the possible inter-
mediates involved in certain enzyme- catalys ed reactions and the
physical techniques commonly applied to the analysis of enzyme
interactions with various substrates and inhibitors. The most
commonly used physical technique applied in enzymology is
UV-visible spectrophotometry. Due to the large number of atoms
involved in a typical enzyme-substrate interaction, there are an
eno$rmous number of electronic states present which produce
broad absorption peaks in the UV-visible region. These broad
peaks contain only a limited amount of diagnostic information.
NMR spectroscopy on the other hand, is one of the most important
physical techniques available to the organic chemist for molecular
analysis. NMR has the potential to not only characterize the
functional. groups of the molecules of interest, but may also
provide structural, stereochemical, and conformational information.
This is invaluable if it can be successfully applied to the detection
and characterization of intermediates in enzyme- catalys ed reactions.
A brief introduction to the theory of NMR will illustrate the wealth
of information available by utilizing this technique. The special
applications of 13C-NMR methods to enzyme chemistry will then
be considered. The basic theory of NMR has been presented in
several books and the following section on theory is a short
summary of the relevant theory more extensively presented in
these texts (Jackman and Sternhell, 1969; Shaw, 1976; Stothers,
1972; Wehrli and Wirthlin, 1976).
47
Nuclei of certain isotopes possess an intrinsic spin due
to the number of nucleonic particles (1. e. protons, neutrons)
which are present. The nuclear spin quantum number, I, is a
characteristic constant for any given nucleus. Spinning of a
positively charged nucleus produces a magnetic field with magnetic
moment, ii, directed along the axis of spin. Organic chemists
are primarily interested in carbon and hydrogen isotopes which
possess such a spin and therefore the spectral characteristics
of the Hand C nuclides with 1=1/2 have been extensively studied
in a large number of systems.
When placed in a static, uniform magnetic field of strength
B, the proton or 13C nucleus is restricted to two possible orienta-
tions which are characterized by energies dependent on the magni-
tudes of p. an B. The nuclei are either aligned with (low energy),
or against (high energy) the magnetic field. The energy difference
between the two states is comparatively small ( zEii P B, where
3', the gyromagnetic ratio, is a characteristic constant of a
particular nuclide) as are the population differences which are
described by a Boltzmann distribution. Fortunately, there exists
• slight excess of nuclei in the low energy state. Application of
• particular frequency of electromagnetic radiation in the radio-
frequency range results in a net absorption of energy. Restoration
of the populations to thermal equilibrium is achieved by a number
of relaxation processes which will be discussed in more detail.
Unfortunately, NMR is a relatively insensitive technique
as compared to the optical techniques commonly used. This is
due to a combination of the low number of nuclei in excess in the
lower energy level and the small energy differences between these
levels. The long lifetime in the excited states (iO to 10 3.
sec.)
as compared to electronic transitions (108 to 10 sec. , Jaffe, Orchin,
1962) contributes to the insensitivity. The low gyromagnetic ratio 13 1
of C, approximately one-fourth that of H, and the fact that 13 13
the natural abundance of the C isotope is 1. 1%, makes C-NMR

48
approximately 1/5800 as sensitive as 1 H-NMR. Development of
various techniques, in particular pulse and Fourier transform
methods, have overcome these difficulties and have made 13C-NMR
a powerful analytical tool.
After perturbation of the spin-state equilibrium by the
application of a radiofrequency pulse, the process of returning
a nucleus fromahigh to low energy state takes place by relaxation
processes. Two processes are most important, the spin-lattice,
and the spin-spin relaxation.
a) Spin-lattice relaxation. This process is due to the
interaction of the nuclei with rapidly fluctuating local magnetic
fields in its surroundings, or lattice. The fluctuations have a
component at the resonance frequency which enables a nucleus
in the upper spin state to relax to the lower state. The energy
lost is transferred to the lattice as extra rotational or transla-
tional energy. The time constant for this exponential process
is designated T 1 . The magnitude of T 1 depends upon the nature
and rapidity of the local magnetic fluctuations which are predomi-
nately dependent on the molecular motions. This relaxation
process is responsible for the excess of nuclei in the low energy
orientation at equilibrium. A large value of T 1 indicates an
inefficient relaxation process.
The 13C spin-lattice relaxation process is itself composed
of various relaxation mechanisms (Wehrli and Wirthlin, 1976).
Two of these mechanisms are especially important when considering
the 13C-NMR of proteins (Allerhand, 1979). Dipole-dipole
relaxation results from rotational motions of C-H vectors. This
is the predominant relaxation mechanism for protonated carbons
and contributes to the total spin-lattice relaxation in non-proton-
ated carbons at low magnetic field strength (Norton et al., 1977).
An important contributor to the spin-lattice relaxation in non-
protonated carbons is chemical-shift anisotropy (CSA). If a
49
G-X bond is placed with its axis perpendicular to the external
magnetic field the carbon shielding by the electrons will be
different from that found if the axis is parallel to the field.
Rotational motion then produces a fluctuating magnetic field and
relaxation may occur by this mechanism. GSA is found to be
the predominant relaxation mechanism for non-protonated sp 2
carbons at high magnetic field (>40 kG) (Levy and Edlund, 1975;
Norton et al., 1977; Allerhand, 1979).
b) Spin-spin relaxation. This process is operative when
two nuclei in close proximity are able to interact. The magnetic
field generated by a spinning nucleus has a component perpendicular
(transverse) to the main field which is ideal for inducing transitions
in an adjacent spinning nucleus. This process results in spin-spin
or transverse relaxation which is also an exponential process with
time constant designated T 2. The magnetic field produced by one
nucleus will also cause a variation in the field experienced by
another nucleus in close proximity. This will cause a spreading
of the resonance frequency leading to broadening of the resonance
lines in the spectrum.
Also dependent on the relaxation processes is the nuclear
Overhauser effect (NOE). A 13C-NMR spectrum obtained with
simultaneous proton irradiation often yields an improvement
in the signal-to-noise ratio (S/N) of the carbon resonance in
addition to that expected from removal of 13C- 1 H scalar coupling.
The NOE phenomenon is due to a favourable redistribution of the
energy level populations caused by irradiation of nearby
protons (Lyerla and Grant, 1972) and therefore depends upon
the influence of these protons on the relaxation mechanism.
All of these processes affect the resolution and the intensity
of the 13G-NMR resonances.
As mentioned previously, the advent of pulse and Fourier
transform methods enabled 13C-NMR spectroscopy to become
routinely used. Briefly, a strong pulse of radio-frequency energy

r. 1.
pulse
y t xl k\4 B
0
x ,
RC
50
when applied to a sample is capable of exciting all resonances
at once. Since there was an excess of nuclei in a low energy
state originally there is a net magnetization parallel to the applied
magnetic field along the z-axis:
Application of a pulse causes rotation of the net magnetization
away from the z-axis toward the x'-y' plane. After termination of
the r. f. pulse, the nuclei relax to obtain thermal equilibrium with
an exponential time constant related to the relaxation mechanisms
involved. If a receiver coil (RC in the figure) has an axis perpen-
dicular to the field, the nuclei will induce an A. C. signal in the
coil which decays exponentially. This signal, known as the free-
induction decay (FID), represents the time development of the
magnetization (M(t)). This is mathematically related to a conventional
spectrum, where the magnetization is a function of frequency,
(M( )), by a Fourier transformation. A sequence of pulses may
thenbe applied to a sample and the responses to each pulse
accumulated as an FID and stored. Application of a single pulse
will usually not yield the desired S/N and a summation of the
responses to a number of pulses will directly increase the intensity
of a signal while the signal due to random noise will increase
at the square-route of the number of pulses accumulated. This
summation process leads to a dramatic increase in the sensitivity
of pulse-Fourier transform NMR spectroscopy.
The signal induced in a receiver coil after a single pulse is
51
greatest for a pulse which rotates the magnetization 900 from
the z-axis. Often it is more practical to use a pulse (or flip-
angle) much less than 900. The relaxation times (i. e. T 1 1 T 2 )
will affect the optimal pulse angle and the pulse repetition time
(or relaxation delay) needed for the best results. Usually, the
relaxation times are not known, so a compromise between the
flip-angle, relaxation delay, and number of pulses must be sought
in order to obtain the most information in the shortest possible
time.
The most useful parameter obtainable from an NMR
spectrum is the chemical shift. The chemical shift is the
difference in frequencies between a particular signal and a
standard (usually the resonance of tetramethylsilane, TMS).
This frequency value is directly proportional to the applied magnetic
field B. Spectra from different spectrometers may be compared
by using the chemical shift parameter 8, which is obtained from
the following equation:
v sample TMS )inHz
8in parts per million) = -
(29) i spectrometer frequency n MHz
This chemical shift value is influenced by the distribution
of electrons about the nucleus which reflects the nature and
conformation of the surrounding groups. The magnetic field
experienced by a nucleus is not equal to the applied field B
because the nucleus is shielded to some extent by its own electrons
and electrons of neighbouring nuclei. A secondary magnetic field
is generated by the circulating electrons which opposes the applied
field. The greater the electron density, the greater the affect, and
the further upfield (lower frequency, lower ppm) the resonance
occurs. The nature and orientation of neighbouring groups can
affect the shielding and therefore the chemical shift. Several
important contributions to shielding in C-NMR are outlined
below (Wehrli and Wirthlin, 1976).
52
The hybridization of the nucleus is an important factor
in determining the chemical shift.
Inductive effects such as electronegativity effects
which removes electron density from the nucleus.
Steric effects which cause distortion of the electronic
distribution.
Electric field effects may be generatedfor example,
by an ionized group resulting from protonation.
Mesomeric effects are due to delocalization of charge
across a n system. This is particularly relevant to the carbonyl
carbon. The carbonyl carbon bears a partial positive
charge which accounts for its low field chemical shift.
Heavy atoms such as F, Cl, Br, I, contain a large
number of electrons which may influence electronic shielding in
the observed nucleus.
Slight differences in the electronic shielding due to one or
several of the above effects allows observation of single distinct
resonances assignable to carbons in different functional groups
and/or conformations. Of particular significance are the changes
in chemical shift due to medium effects. A change of temperature,
ionic strength, and solvent modify the above effects to a greater
or lesser extent. For example, the chemical shift of the carbonyl
resonance in benzoic acid changes from 172.6 ppm in CDC1 3
(Johnson and Jan.kowski, 1972), to 168.5 ppm in acetone-d 6 .
In most organic compounds, the carbon nucleus under
observation is in close proximity to other nuclei possessing a spin.
This is usually a 1 H as 1. 1% natural abundance
13C makes the
coupling insignificant. These spins may be coupled
so that combinations of the spin-states differ in energy causing
splitting of the resonance signal. Most 13C spectra are obtained
with simultaneous irradiation of the proton resonances in order
to saturate these resonances and eliminate the coupling. This
leads to a large increase in the signal of protonated carbons due

53
to NOE, and an increase in non-protonated carbon resonances
depending upon the contribution of the dipolar relaxation mechanism
to these carbons. The signals of non-protonated quaternary
carbons may be selectively observed while the resonances of
protonated carbons may be reduced or eliminated by using an
NMR technique called low-power noise decoupling (Sadler, 1973).
In this method, broad band decoupling at a very low power level
(0. 05 to 0. 25 W) is applied at the proton resonances. This results
in inefficient, decoupling of the proton-bearing carbons which
spreads the resonance frequencies for these carbons and results
in broad, low intensity signals. The quaternary carbons on the
other hand, are completely decoupled since the long-range coupling
effects on quaternary carbons are much smaller. This means that
the NOE contribution to the intensity of the quaternary carbons is
retained and splitting due to long range coupling is eliminated.
Application of 13C-NMR to the study of proteins is a fairly
recent development. Allerhand (1979) presented an extensive
review of the techniques used for the observation of individual
resonances in the 13C-NMR spectra of proteins. The 13C-NMR
spectrum can be divided into regions depending upon the types
of carbon nuclei present. The aliphatic region extends from
approximately 0 to 100 ppm, the aromatic region (also containing
the of arginine and tyrosine) from 100' to 160 ppm, and the
carbonyl region from 160 to 210 ppm (Allerhand, 1979).
The resolution of carbon resonances is greatly affected
by the freedom of rotation of the carbons under observation.
Allerhand et al. (1971) have shown that sharp resonance lines
(long T 1 and T 2) originate from carbons with a large degree of
motion. The backbone carbons of proteins tend to exhibit broad
resonances, whereas relatively free side-chain carbons yield
sharp lines. This is consistent with the much sharper lines
observed for denatured proteins where the backbone carbons have

54
a much greater degree of motion (Allerhand et al., 1973;
Glushko et al., 1972; Nigen et al., 1973a). The increased
resolution obtained with the denatured protein is also due to the
elimination of chemical shift non-equivalence caused by folding
of the polypeptide chain. Sharp resonance lines in protein spectra
also arise from non-protonated carbon resonances as compared
to protonated carbons because of the inherently longer T 1 values
(Oldfield et al. , 1975a). A decrease in resolution is also observed
with an increase in molecular weight of the protein which causes
a slower tumbling of the protein molecule resulting in a longer
rotational correlation time which is the time taken for a
molecule to reorient itself with respect to the magnetic field. The
decrease in resolution is also caused by an increase in the number
of non-equivalent resonances in a larger molecule ( Oldfield et al.,
l975a).
Specific assignments of individual resonances in high
resolution spectra of proteins has also been accomplished
(Oldfield et al. , 1975b; Allerhand et al., 1977; Glushko et al. , 1972).
Of particular interest are the well-separated resonances at 155
and 160 ppm assignable to the of tyrosine and arginine
residues.
In these studies, high resolution spectra were obtained
using a relatively low field (14 kG) instrument. A comparison
of the spectra obtained at both low and high field (63 kG) of
hen egg-white lysozyme indicates that the resolution of the
protonated aliphatic and methine carbons are much more greatly
enhanced than the carbonyl and non-protonated aromatic resonances
by an increase in field strength (Norton et al. , 1977). This may
be explained by the contbution of GSA to the relaxation mechanism
for non-protonated unsaturated carbons at magnetic field strengths
above 40 kG. The contribution from 3C-1H dipolar relaxation
at 63 kG is low for non-protonated carbons. The T 1 value for a
carbonyl carbon was experimentally determined as 1.6 seconds at
55
this field strength. A calculated value of 7. 9 second is obtained
for a dipolar relaxation mechanism and 1.9 seconds when GSA
effects are also taken account (Norton et al., 1977).
Allerhand et al. (1977) demonstrated the effect of the change
in pH on the chemical shifts of carbons associated with an ionizing
group. The behavior of a 13C resonance of such a carbon is
affected by the rate of exchange between the protonated and depro-
tonated states. If the rate of exchange is fast compared to the
difference in chemical shifts of the two states (in Hz), a single,
ehange averaged resonance is observed. The chemical shift of
the single resonance is a weighted average of the values for the
protonated and deprotonated forms. As the pH is changed, the
chemical shift of the resonance will also change. If however,
the exchange between the two states is slow, two distinct resonances
due to both the protonated and non-protonated species may be
observed. Intermediate exchange rates may exhibit two broad
peaks or one broad resonance (Allerhand, 1979). In this way
the predominant tautomeric state of specific histidine residues
in hen egg-white lysozyme (Allerhand et al., 1977), ribonuclease
A (Walters and'Allerhand, 1980) and myoglobin (Wilbur and
Allerhand, 1977a) have been determined. Similarly the PKaS
of tyrosine (Wilbur and Allerhand, 1976) and the terminal
glycine (Wilbur and Allerhand, 1977b) of myoglobin were obtained.
Shindo and Cohen (1976) determined the of a number of
carboxyl groups of hen egg-white lysozyme by 13C-NMR.
In order to increase the sensitivity and observe specific
resonances, many enzymes have been covalently modified with
enriched 13C containing residues. Often this will provide valuable
information concerning the environment of the particular residue
and has also been used to verify the existence of molecular inter-
actions in solution proposed from a study of the crystal structure.
Multiple 13C labelling of amino groups of proteins by reductive
methylation has allowed extensive study of the environment of the
56
labelled residues (Jentoft and Dearborn, 1979; Jentoft et al.,
1979, 1980, 1981; Gerken et al., 1982). Ionization of a nearby
carboxyl group causes a perturbation of the pK for the
methylated amino group and comparison with x-ray structures
allows specific assignments to be made.
Enzymes carboxymethylated with enriched bromoacetate
have provided a great deal of information concerning the behaviour of
covalently. bound species. Multiple carboxymethylation of myo-
globin and mono-carboxymethylation of ribonuclease A is observed
when these enzymes are reacted with [2- 13C]-bromoacetate (\Tigen
et al., 1972, 1973b). By comparison with model compounds, the
multiple resonances observed with the myoglobins can be assigned
to carboxymethylation of histidine, lysine, and terminal -NH 2
groups. Cytochrome c has also been carboxymethylated at several
residues with [2- 13C]-bromoacetate and studied by 13C-NMR
(Eakin et al.,, 1975). Khalifah and co-workers utilized [1- 3C]-
bromoacetate as an active-site probe of carbonic anhydrase
(Strader and Khalifah, 1976; Khalifah, 1977; Khalifah et al., 1977).
Bron-ioacetate mono-carboxylates the His-ZOO residue found in
close proximity to the essential zinc metal in the active site. The
PKa of the ca rboxymethylated- his tidin e is greatly affected by the
binding of inhibitr6 to the metal.
The binding of 13
C enriched carbon monoxide to various
haemoglobins and myoglobins has been widely studied (Moon
and Richards, 1972, 1974; Moon et al., 1977; Vergamini et al.,
1973; Matwiyoff et al., 1973; Antonini et al., 1973; Morgan
et al., 1976; Giacometti et al., 1976; Banerjee et al., 1976;
Banerjee and Lhoste, 1976; Choc and Caughey, 1981). Differences
in the environment experienced by the 13
CO in the a and 13 chains
are easily discernible as distinct resonances. Information on the
i 13
nteraction of CO 2 and haemoglobin has also been obtained
(Morrow et al., 1973, 1974, 1976). Resonances due to formation
of carbamino residues on the, protein chain are clearly observable
57
along with resonances attributed to bicarbonate, carbonate,
and dissolved 13CO2 . Carbonic anhydrase interaction with 13CO 2
(Stein et al., 1977; Koenig et al., 1973) and 13CN (Feeny et al.,
1973) has.. also been studied by 13
C-NMR. Cyanide labelled with
has been utilized in the modification of a specific cysteine
residue in glutamate aspartate transaminase (Boettcher and
Martinez-Carrion, 1975). Observation of the binding of
labelled bicarbonate to essential metal atoms in enzymes by
NMR has been useful in obtaining structural and mechanistic
information for the enzymes carbonic anhydrase (Yeagle et al.,
1975), and ribulose 1, 5-diphosphate carboxylase (Miziorko and
Mildvan, 1974).
The complex between chymotrypsin and the virtual substrate
N-Ac-L-tryptophan labelled at the acetyl 13CO3 was studied by
3C-NMR (Rodgers and Roberts, 1973) A decrease in the coupling
constant between 13C and the a-proton upon binding was interpreted
as evidence for a conformational change undergone by the substrate.
Conversely, Robillard et al. (1974) found no evidence for strain
in the Michaelis-complex formed between chymotrypsin and N-Ac-
L-tyrosine-semicarbazide labelled at the tyrosine carboxyl.
The inhibition of trypsin with soybean trypsin inhibitor has
been the subject of both x-ray and 13C-NMR investigations. It was
first proposed from x-ray evidence that a fully tetrahedral covalent
bond is formed between the Arg-63 carboxyl of STI and the serine
active-site residue of trypsin (Sweet et al. , 1974). Later x-ray
evidence was interpreted to show a distorted carbonyl with some
pyrimidal character (Huber and Bode, 1978). Baillargeon et al.
(1980) and Hunkapiller et al. (1979) enriched the carboxyl carbon
of Arg-63 of STI and studied its interaction with trypsin by 13C-NMR.
Enriched STI by itself has a resonance typical of the amide region
of the 3C-NMR spectrum at 173. 3 ppm. Upon reaction with trypsin,
the resonance moves slightly downfield to 174. 7 ppm. The slight
downfield shift would not be expected if formation of a covalent
58
tetrahedral adduct occurred. Baillargeon et al. (1980) predicts
an upfield shift of approximately 55 ppm upon formation of a tetra-
hedral carbon from a carbonyl carbon based on values obtained
with model compounds. For example, the carbonyl resonance of
DMF shifts from 16 2. 4 ppm to 110.6 ppm on formation of the
diethyl acetal. The slight downfield shift observed in the inhibitor
studies may be due to the different environment of the active-site
without formation of a covalent bond, or to formation of an acyl
enzyme as proposed by Hunkapiller et al. (1979). The distortion
of the trigonal carbon towards a tetrahedrally oriented form as
proposed by Huber and Bode (1978) cannot be ruled out from the
data obtained. Richarz et al. (1980) in a similar experiment, with
an enriched modified basic pancreatic trypsin inhibitor, also found
no evidence of a covalent tetrahedral carbon formed on interaction
with trypsin.
A resonance attributed to an adduct formed between pepsin
and a pepstatin analogue has been presented in the 3C-NMR work
of Rich et al. (1982). A ketone analogue of pepstatin enriched at
the carbonyl carbon displays a single resonance at 204. 2 ppm
typical of a ketone carbonyl in CDC1 3 /CD 3 OD. When one equivalent
of the inhibitor is added to porcine pepsin in 1D 20, a new signal
at 99 ppm appears which is consistent with formation of a tetra-
hedral adduct. Malthouse et al., (1983) have, shown that a tetrahedral
adduct is formed between the Ser-195 of trypsin and the inhibitor
Ncz-CBZ-L-lysine-chloromethylketone. Both the neutral and anionic
forms of this adduct were shown to be stabilized by the enzyme by
pH titration (pK8).
Niu et al., (1977) detected a resonance attributed to a
transient acetyl-chymotrypsin intermediate by 13C-NMR. In this
study, chymotrypsin was reacted with the non-specific substrate
p-nitrophenyl [1- 13C] acetate. Signals due to the substrate at
170.4 ppm and the product acetic acid at 175. 1 ppm are detected
along with a resonance at 174. 0 ppm assigned to an acetyl-chymo-
trypsin. The intensity of this signal decreased as the acetic acid
59
signal increased and enzyme activity returned. The resonance at
174. 0 ppm had a sufficiently long lifetime to allow determination
of T 1 . A value of T 1 for this resonance of 2. 6 seconds is reported
as compared to a value of 2. 9 seconds for backbone carbonyls.
This suggests that the carbonyl of the acetyl group is similarly
restricted in motion. The results demonstrate the potential of
13 C-NMR for detection of transient enzyme-bound species.
Ghisla et al. (1978) present results of a particularly interesting
experiment. These investigators provide evidence for detection
of an intermediate in the bacterial luciferase catalysed oxidation
of flavin mononucleotide (FMN) by 13C-NMR at low temperature.
Evidence obtained by absorption spectrophotometry for the enzyme
intermediate has proven unreliable and lacks diagnostic information.
The authors used 13C-NMR spectroscopy combined with low temper-
ature enzymology in an attempt to provide more useful information
on the transient intermediate. FMN was specifically enriched in
the C-4a carbon as this has been proposed as the site of oxidation
by the enzyme. A narrow resonance at 137 ppm assigned to the
free oxidized FMN substrate in solution was observed superimposed
upon a broad signal attributed to the same species bound to the
enzyme. Upon reduction, the signal splits into two resonances at
103 and 104 ppm. Addition of ethylene glycol cosolvent and reduction
of the temperature further broadened the, signal due to the bound-
reduced FMN to a linewidth of 50 Hz. Broadening of the signal was
probably due to the increased viscosity resulting in decreased
molecular motions. Upon addition of oxygen at -150C, the resonances
at 103 and 104 ppm disappeared and reoxidized FMN appeared at
137 ppm and a new broad (50 Hz) resonance at 74 ppm appears.
The resonance at 74 ppm disappeared on warming and resulted in
observation of oxidized FMN at 137 ppm. The results can be inter-
preted as evidence for specific oxygenation of the C-4a carbon in
FMN catalysed by bacterial lucif erase. With the signal-to-noise
ratio obtained in this study, the interpretation of the resonances
is not entirely convincing. However, these results illustrate the
type of information which may be obtained utilizing 13C-NMR in
the analysis of low temperature enzyme- catalys ed reactions.
The versatility of 13C-NMR is well illustrated since it
can be used with a wide variety of enzymes for various experiments
ranging from the determination of a microscopic pK at to the
detection of specific enzyme-bound intermediates.
When combined with low temperature enzymological tech- 13
niques, C-NMR has the unique potential of supplying a vast amount
of structural, conformational, and kinetic information on transient
enzyme intermediates and inhibitor complexes. The application of
these techniques to the study of intermediates along the pathway
for papain-catalysis is especially interesting. Papain is a well
studied enzyme with a large amount of kinetic and structu:al information
available from previous investigations using other more conventional
techniques. This is important since we need to develop this new
combination of 13C-NMR and cryoenzymology methods on such a
familiar system rather than starting with a relatively unstudied
enzyme. Of course the complete mechanistic pathway of papain-
catalysed reactions is still in question and some of the possible
intermediates outlined previously should provide distinct changes in
the 13
C-NMR spectra of enriched substrates. A thioester intermediate
should be well separated downfield from the enzyme background
resonances and a proposed tetrahedral intermediate should show
a dramatic upfield change in chemical shift in transforming from
an sp to and sp 3 hybridized carbon. Papain has also been previously
studied by cryoenzymological techniques which is a great advantage
to this work since a new system may not be amenable to either
cryoenzymology oi 13C-NMR. Yet some inconsistencies in the
cryoenzymological results for papain require further investigation.
The first stage in the development of this method is to find
the capabilities and requirements of the system. This is done by
varying the concentrations of reactants, the solvent mixtures, and
61
finding optimal acquisition parameters on the NMR. In this way,
the feasibility of cryoenzymology combined with 13C-NMR
spectroscopy for the detection of enzyme intermediates and
structural elucidation of enzyme-inhibitor complexes can be
evaluated.
MATERIALS
AND
62
METHODS
Instrumentation
U V-Visible Spectrophotometry
Low temperature absorption spectrophotometry was performed
on a Varian Cary 210 UV-Visible spectrophotometer modified for
low temperature work using a design similar to that described by
Maurel et al. (1974). Dry, gaseous nitrogen is passed through a
copper heat exchanging coil immersed in liquid nitrogen. The
cooled gas is delivered to the sample compartment through glass
vacuum tubing and the temperature of the gas is regulated by passage
over electrical resistance heating coils controlled by an Oxford
Intruments DTC 2 digital temperature controller. The cooled N 2
is then circulated through two brass sample cell holders ( for
the sample and reference cells ) designed to accommodate 1 cm
quartz cells. The nitrogen outlet is directed onto the cell walls
to prevent condensation and ice formation. The exiting cooling gas
provides a positive pressure of nitrogen in the sample compartment
to prevent condensation on the optical lenses of the spectrophometer.
Gas and sample temperatures were measured using a Comark 5000
digital thermometer fitted with Cu/Cu-Ni thermocouples. The
sample temperature was measured directly using a plastic coated
thermocouple in the solution. Temperatures down to -900C can be
routinely maintained using this apparatus.
Absorption spectrophotometry at 250C was performed on
a Variari DMS-90 UV-visible spectrophotometer with a Varian Model
9176 recorder. Constant temperature was maintained with a
thermostatted circulating water bath ( Grant Instruments (Cambridge)
Ltd., Model SE 10).
63
64
2Measurement
pH measurements were determined with a Beckman Model
3500 digital pH meter or Radiometer pHM 82 standard pH meter
with Beckman combination electrode 39505 or Radiometer electrode
GK2401c. The pH meters were standardized using Radiometer
buffer solutions S1306 pH 1.68, S1316 pH4.01, Beckman buffer
solutions S3581 pH 7.00, 3506 pH 4.00, 3009 pH 9. 18, 3505 pH 10.01
at 25°C.
Titr imey
Titrimetric assays were performed using a Radiometer pH
meter 25 with Titrator Model 11, Titrigraph Model SBR2c, and
syringe burrette Type SBU1a.
The reaction mixture was maintained at 250C using a water-
jacketed reaction vessel connected to a Shandon thermostatted
circulating water bath.
Conductance Measurements
Buffer gradient for ion-exchange chromatography was
determined using a Portland Electronic Conductivity Meter Model
P310 fitted with a Pye-Unicam Conductivity Cell. Samples were
diluted 1 in 10 in water.
Ion- exchange Chromatography
Fractions were collected during ion-exchange chromatography
on an LKB 2070 tfltrorac II and a constant flow rate was provided
by an I.KB 2132 Microperplex peristaltic pump.

65
Spectrometry
13C-NMR spectra were obtained on a Bruker WM-300
wide-bore NMR spectrometer at 75.47 MHz for 13C-nuclei.
Samples from 0. 5 to 15 mis were used in 5, 10, or 20 mm
sample tubes. Temperatures were maintained with a Bruker
VT-100.0 variable temperature control unit using cooled gaseous
nitrogen for low temperature work. Probe and sample temperatures
were measured with a Comark digital thermometer with Cu/Cu-Ni
thermocouples.
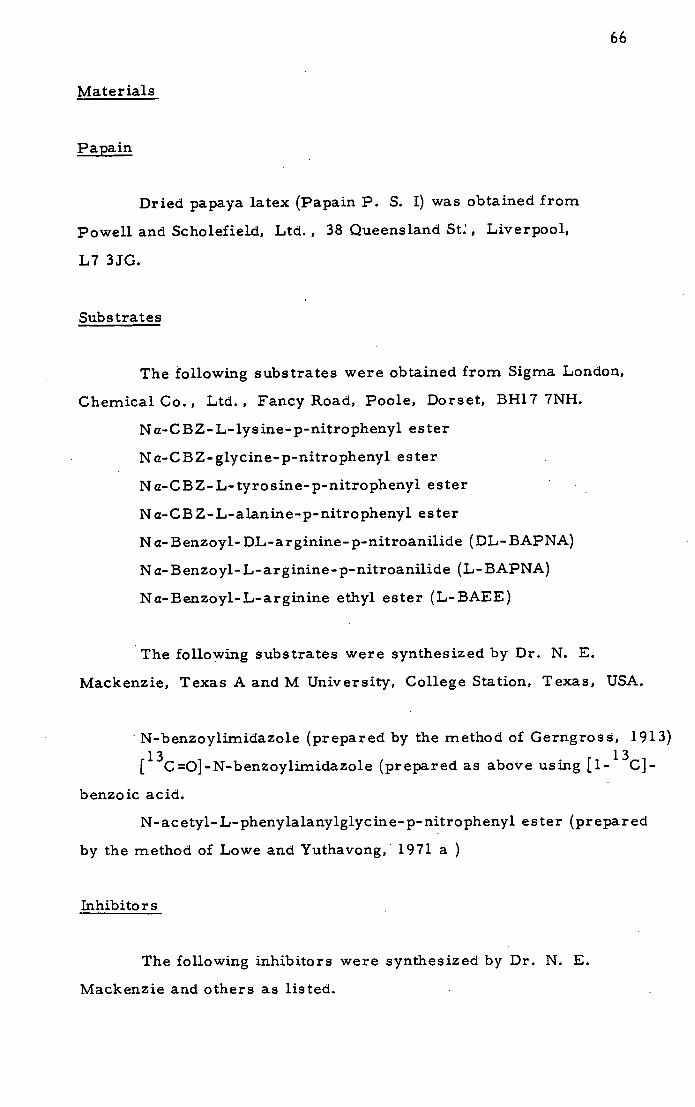
Materials
Papa in
Dried papaya latex (Papain P. S. I) was obtained from
Powell and Scholefield, Ltd., 38 Queensland St, Liverpool,
L7 3JG.
Substrates
The following substrates were obtained from Sigma London,
Chemical Co., Ltd., Fancy Road, Poole, Dorset, BH17 7NH.
Na-CBZ-L-lysine-p-nitrophenyl ester
N a-CBZ- glycine-p-nitrophenyl ester
N a-C B Z- L- tyro sine- p-nitrophenyl ester
Na-CBZ-L-alanine-p-nitrophenyl ester
N a- Benzoyl- DL-arginine- p-nitroanilide (DL- BAPNA)
N a- Benzoyl- L-arginine- p-nitroanilide (L- BAPNA)
Na-Benzoyl-L-arginine ethyl ester (L-BAEE)
The following substrates were synthesized by Dr. N. E.
Mackenzie, Texas A and M University, College Station, Texas, USA.
N-benzoylimidazole (prepared by the method of Gerngross, 1913)
[ 13C=O]-N-benzoylimidazole (prepared as above using {1 3C}-
benzoic acid.
N-acetyl- L- phenylalanylglyc in e- p-nitrophenyl ester (prepared
by the method of Lowe and Yuthavong, 1971 a )
Inhibitors
The following inhibitors were synthesized by Dr. N. E.
Mackenzie and others as listed.

67
N-ac etyl- L- phenylalanyiglycinal dimethyl ac etal ( with
Dr. R. A. Russell by the method of Mattis et al., 1977)
N-ac etyl- L-phenylalanyl-[ 1- 13C]-glycil dimethyl acetal
(with W. U. Primrose by the procedure outlined below).
[1- 13C]-glycine was fused with phthalic anhydride at
145-1500C. The [1) 3C]-N-phthalyl-glycine is reacted with
thionyl chloride in benzene with heating for 2 hours. The acid
chloride is converted to the aldehyde by hydrogenation with 5%
Pd on BaSQ4 in toluene at 1000C with a.trac-e of quinoline present.
The aldehyde was converted to the dimethyl acetal by treatment
with trimethyl orthoforinate, with toluene sulphonic acid in benzene
with heating for 30 minutes. The N-phthalyl group was removed by
treatment with 64% hydrazine hydrate-in pure ethanol with heating
over 2 hours. The [1- 13
C]-glycinal dimethyl acetal was coupled
to N-ac etyl- L- phenylalanine using dicyclohexylca rbo diimide in
dichloromethane at room temperature over 2 days.
Na-CBZ-L-lysine-chloromethyl ketone (1-chloro- 3-(carbo-
benzyloxyamino)- 7-aminoheptan- 2-one) was synthesized by the
method of Coggins et al. (1974) and Bezas and Zervas (1961).
[2- 13C]-Na-CBZ-L-lysine chloromethyl ketone was synthesized
by the same methods using [1 3C]-L-lysine.
Other 13C-labelled Compounds
[1- 13
C}-benzoic acid was obtained from Stohler Isotope
Chemicals, Waltham, Massachusetts, USA (90% 13C-enriched)
[l) 3C}-D, L-lysine, 90 atom % 13C, was obtained from
Merck, Sharp, and Dohme, Canada, Ltd.
[1 3C}-L-lysine (90% 13C enriched) was obtained from
Stohler Isotope Chemicals.
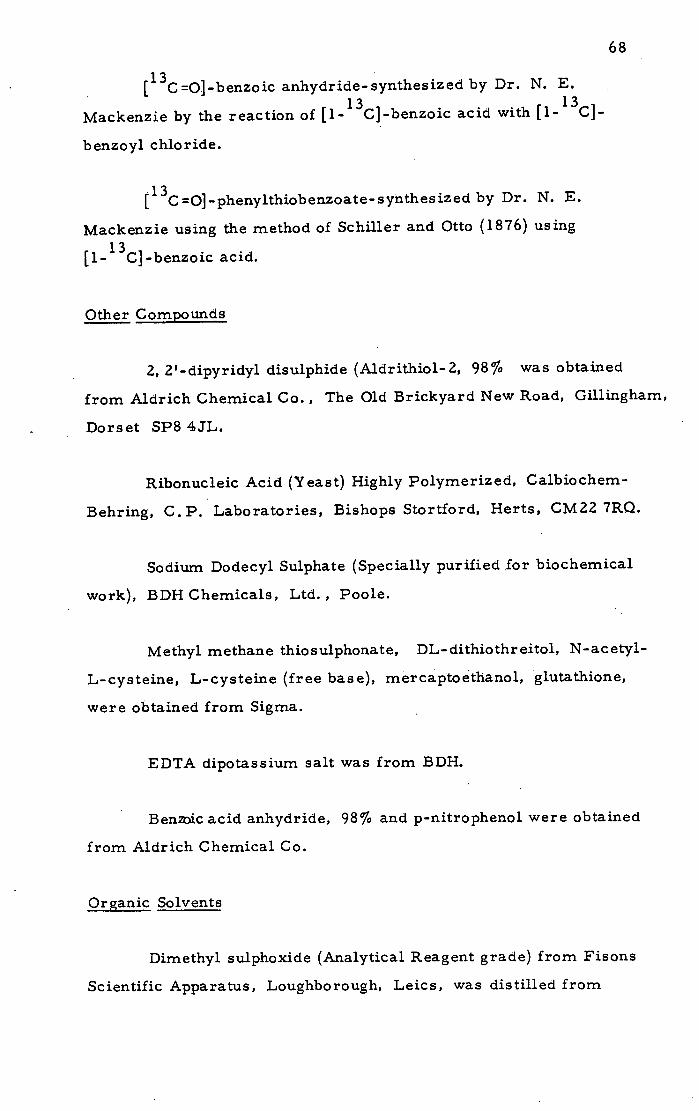
[13C=O]-benzoic anhydride- synthesized by Dr. N. E.
Mackenzie by the reaction of [1) 3C]-benzoic acid with [1- 13C]-
benzoyl chloride.
11 3c =O]-phenylthiobenzoate- synthesized by Dr. N. E.
Mackenzie using the method of Schiller and Otto (1876) using
[1- 13
C]-benzoic acid.
Other Compounds
2, 2 1 -dipyridyl disulphide (Aldrithiol-2, 98% was obtained
from Aldrich Chemical Co., The Old Brickyard New Road, Gillingham,
Dorset SP84JL.
Ribonucleic Acid (Yeast) Highly Polymeriz ed, Calbiochem-
Behring, C.P. Laboratories, Bishops Stortford, Herts, CM22 7RQ.
Sodium Dodecyl Sulphate (Specially purified for biochemical
work), BDH Chemicals, Ltd., Poole.
Methyl methane thiosuiphonate, DL- dithiothr eitol, N-ac etyl-
L-cysteine, L-cysteine (free base), mercaptoethanol, glutathione,
were obtained from Sigma.
EDTA dipotassium salt was from BDH.
Benic acid anhydride, 98% and p-nitrophenol were obtained
from Aldrich Chemical Co.
Organic Solvents
Dimethyl sulphoxide (Analytical Reagent grade) from Fisons
Scientific Apparatus, Loughborough, Leics, was distilled from

M.
calcium hydride under reduced pressure at 350C. The purified
DMSO was separated into 25 ml fractions and stored in a dessicator
at 4 0C. When required, the solid DMSO was melted at room
temperature and stored in a dessicator.
Methanol, acetonitrile, 1, 4-dioxane (all 'Spectrograde')
were obtained from Fisons Scientific Apparatus and used without
further purification.
Acetone (analytical reagent ) from Fisons was distilled
before use.
Deuterated Solvents
Deuterium Oxide, 99. 8% D, was obtained from Goss
Scientific Instruments, Ltd.
Dimethyl Sulphoxide-d 6 , 99.9 atom % D, Gold Label, was
from Aldrich Chemical Co.
Chromatographic Materials
Sephadex G-25 (Medium), Sepharose 2-B, SP-Sephadex
C-50 cation exchange resin were obtained from Pharmacia Fine
Chemicals, AB, IJppsala, Sweden.
Thin-layer chromatography was carried out on Polygram
Silica Gel Sil G/iJV 254 , 0. 25 mm pre-coated plastic sheets, from
Macherey-Nagel, 516 Duren, Werkstrasse, 6-8, Postfach 307,
West Germany.
Sepharos e-(glutathione- 2-pyridyl disulphide) gel was
prepared by the method of Brocklehurst et al. (1973).

NaOH and HC1
NaOH and HC1 solutions used were volumetric solutions
(4M and 5M respectively) obtained from BDH Chemicals, Ltd.
Glass distilled, deionised water was used throughout.
All other solvents, salts, and buffers were of the highest
purity available.
70
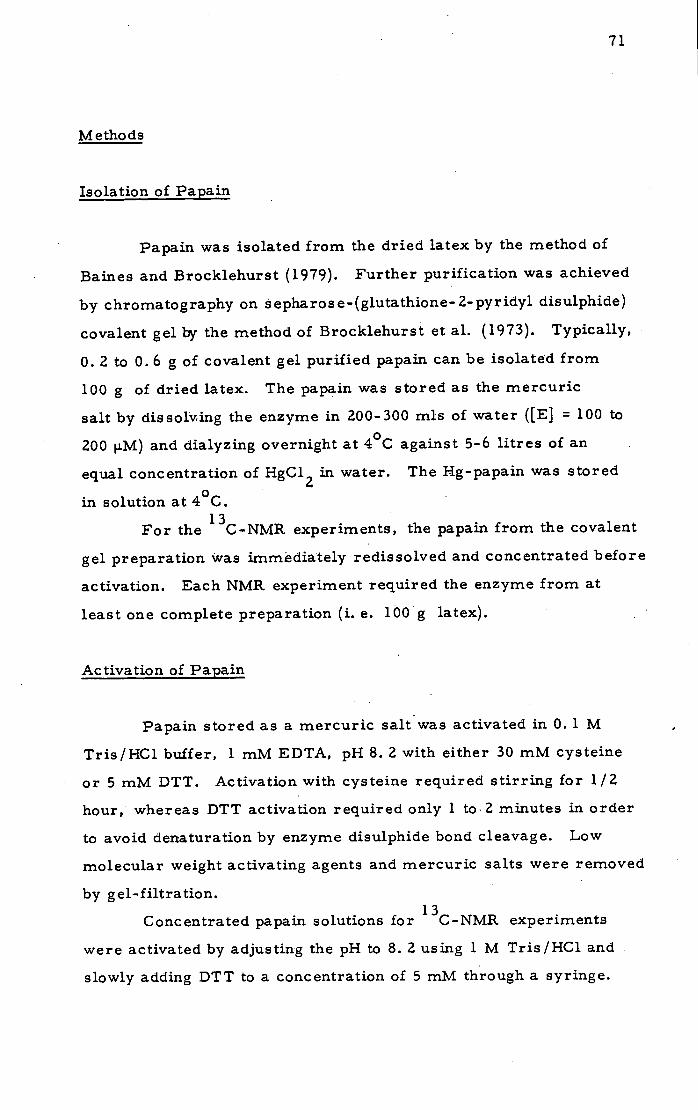
Methods
Isolation of Papain
Papain was isolated from the dried latex by the method of
Baines and Brocklehurst (1979). Further purification was achieved
by chromatography on s epharos e-(glutathione- 2- pyridyl disulphide)
covalent gel by the method of Brocklehurst et al. (1973). Typically,
0. 2 to 0. 6 g of covalent gel purified papain can be isolated from
100 g of dried latex. The papain was stored as the mercuric
salt by dissolving the enzyme in 200- 300 mIs of water ([E] = 100 to
200 i.M) and dialyzing overnight at 4 0C against 5-6 litres of an
equal concentration of HgC1 2 in water. The Hg-papain was stored
in solution at 40
C.
For the 13C-NMR experiments, the papain from the covalent
gel preparation was immediately redissolved and concentrated before
activation. Each NMR experiment required the enzyme from at
least one complete preparation (i. e. 100 g latex).
Activation of Papain
Papain stored as a mercuric salt was activated in 0. 1 M
Tris/HC1 buffer, 1 mM EDTA, pH 8. 2 with either 30 mM cysteine
or 5 mM DTT. Activation with cysteine required stirring for 1/2
hour, whereas DTT activation required only 1 to2 minutes in order
to avoid denaturation by enzyme disulphide bond cleavage. Low
molecular weight activating agents and mercuric salts were removed
by gel-filtration.
Concentrated papain solutions for 13C-NMR experiments
were activated by adjusting the pH to 8. 2 using 1 M Tris/HC1 and
slowly adding DTT to a concentration of 5 mM through.a syringe.
71

72
Rapid addition of DTT caused precipitation of the enzyme. In a
typical experiment, 5 ml of 50 mM DTT was added to a rapidly
stirred solution of 50 ml of 300 i.M papain, pH 8. 2 over a period
of 2 minutes. After the addition was complete, the activated
enzyme was gel-filtered.
Gel-Filtration
Low molecular weight compounds were separated from
protein solutions by gel-filtration on Sephadex G-25. Small
samples were applied to a 3 x 20 cm column and eluted with 10 mM
KC1. Larger samples (for example, when preparing enzyme for
a 13C-NMR experiment) were divided and applied to two 5 x 20 cm
columns and eluted with 10 mM KC1. Fractions were collected
and the protein was detected by its absorbance at 280 nm ( c 280 =
56000 M ' cm 1 , Baines and Brocklehurst, 1979).
Preparation of 2-PDS Solutions
Saturated solutions of 2-PDS (.'..1. 5 mM) in water were
prepared by stirring solid 2-PDS ('.20-30 mg) in 25 ml of water
for 30-60 minutes at room temperature. Excess solid was removed
by filtration. The concentration of 2-PDS was determined by UV -
spectrophotometry 281 = 10200 Mcm 1 , Shipton and Brocklehurst,
1978).
Thiol Determinations
The reactive thiol content of papain solutions was determined
by the spectrophotometric method of Baines and Brocklehurst (1978,
1979). The samples were prepared as follows:
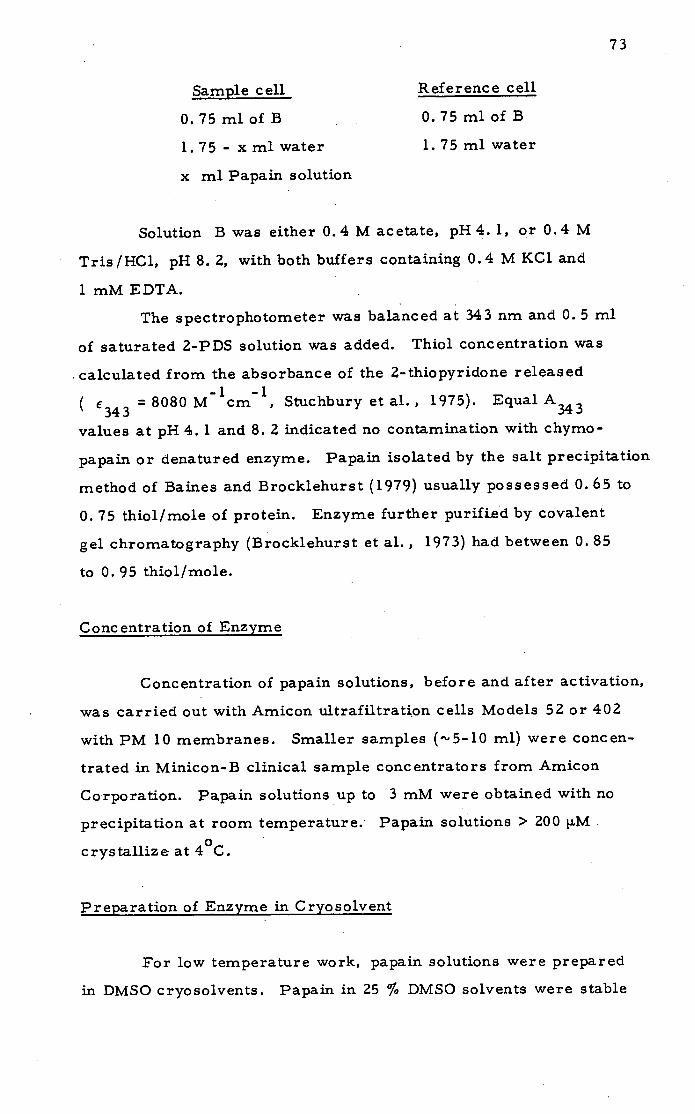
73
Sample cell
Reference cell
0.75 ml of B
0. 75 ml of B
1.75 - xml water 1.75 ml water
x ml Papain solution
Solution B was either 0.4 M acetate, pH 4. 1, or 0.4 M
Tris/HC1, pH 8. 2, with both buffers containing 0.4 M KC1 and
1 mM EDTA.
The spectrophotometer was balanced at 343 nm and 0. 5 ml
of saturated 2-PDS solution was added. Thiol concentration was
calculated from the absorbance of the 2-thiopyridone released
( E 34 = 8080 Mcm 1 , Stuchbury et al., 1975). Equal A 3
values at pH 4. 1 and 8. 2 indicated no contamination with chymo-
papain or denatured enzyme. Papain isolated by the salt precipitation
method of Baines and Brocklehurst (1979) usually possessed 0. 65 to
0. 75 thiol/mole of protein. Enzyme further purified by covalent
gel chromatography (Brocklehurst et al., 1973) had between 0. 85
to 0. 95 thiol/mole.
Concentration of Enzyme
Concentration of papain solutions, before and after activation,
was carried out with Amicon ultrafiltration cells Models 52 or 402
with PM 10 membranes. Smaller samples (5-10 ml) were concen-
trated in Minicon-B clinical sample concentrators from Amicon
Corporation. Papain solutions up to 3 mM were obtained with no
precipitation at room temperature. Papain solutions > 200 jiM,
crystallize at 40
C.
Preparation of Enzyme in Cryosolvent
For low temperature work, papain solutions were prepared
in DMSO cryo solvents. Papain in 25 % IDMSO solvents were stable
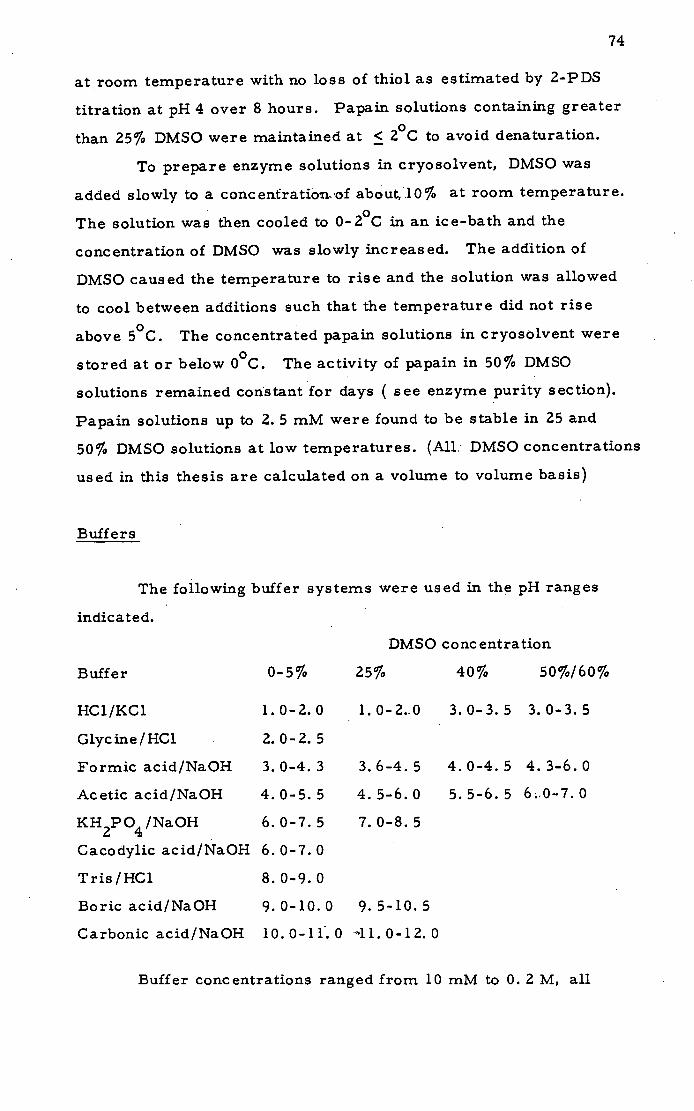
74
at room temperature with no loss of thiol as estimated by 2-PDS
titration at pH 4 over 8 hours. Papain solutions containing greater
than 25% DMSO were maintained at < 20C to avoid denaturation.
To prepare enzyme solutions in cryosolvent, DMSO was
added slowly to a conceufratio'nof about,10% at room temperature.
The solution was then cooled to 0-20C in an ice-bath and the
concentration of DMSO was slowly increased. The addition of
DMSO caused the temperature to rise and the solution was allowed
to cool between additions such that the temperature did not rise
above 50C. The concentrated papain solutions in cryosolvent were
stored at or below 00C. The activity of papain in 50% DMSO
solutions remained constant for days ( see enzyme purity section).
Papain solutions up to 2. 5 mM were found to be stable in 25 and
50% DMSO solutions at low temperatures. (All. DMSO concentrations
used in this thesis are calculated on a volume to volume basis)
Buffers
The following buffer systems were used in the pH ranges
indicated.
DMSO concentration
Buffer 0-5% 25% 40% 50%/ 6 0%
HC1/KC1 1.0-2.0 1. 0-2..0 3.0-3. 5 3.0-3. 5
Glycine/HC1 2.0-2.5
Formic acid/NaOH 3. 0-4. 3 3. 6-4. 5 4. 0-4. 5 4. 3-6. 0
Acetic acid/NaOH 4.0-5.5 4.5-6.0 5. 5-6. 5 60-7. 0
KH2PO4 /NaOH 6. 0-7. 5 7. 0-8. 5
Cacodylic acid/NaOH 6. 0-7. 0
Tris/HC1 8. 0-9.0
Boric acid/NaOH 9. 0-10.0 9. 5-10. 5
Carbonic acid/NaOH 10.0-110 11.0-12.0
Buffer concentrations ranged from 10 mM to 0. 2 M, all
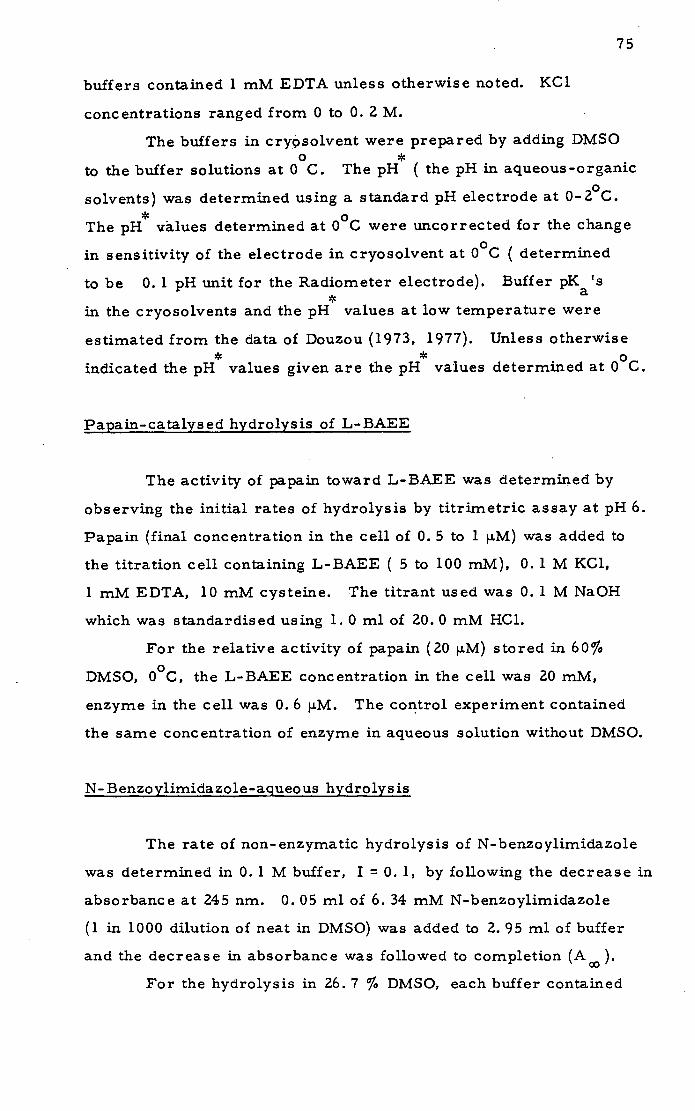
75
buffers contained 1 mM EDTA unless otherwise noted. KC1
concentrations ranged from 0 to 0. 2 M.
The buffers in cry9solvent were prepared by adding DMSO 0 *
to the buffer solutions at 0 C. The pH ( the pH in aqueous-organic
solvents) was determined using a standard pH electrode at 0-2 °C.
The pH * values determined at 0 0C were uncorrected for the change
in sensitivity of the electrode in cryosolvent at 00C ( determined
to be 0. 1 pH unit for the Radiometer electrode). Buffer pK 'S * a
in the cryosolvents and the pH values at low temperature were
estimated from the data of Douzou (1973, 1977). Unless otherwise * *
indicated the pH values given are the pH values determined at 0 0
C.
Papain- catalys ed hydrolysis of L- BAEE
The activity of papain toward L-BAEE was determined by
observing the initial rates of hydrolysis by titrimetric assay at pH 6.
Papain (final concentration in the cell of 0. 5 to 1 ii.M) was added to
the titration cell containing L-BAEE ( 5 to 100 mM), 0. 1 M KC1,
1 mM EDTA, 10 mM cysteine. The titrant used was 0. 1 M NaOH
which was standardised using 1. 0 ml of 20.0 mM HC1.
For the relative activity of papain (20 M) stored in 60%
DMSO, 00C, the L-BAEE concentration in the cell was 20 mM,
enzyme in the cell was 0. 6 p.M. The control experiment contained
the same concentration of enzyme in aqueous solution without DMSO.
N- Benzoylimidazole-agueous hydrolysis
The rate of non-enzymatic hydrolysis of N-benzoylimidazole
was determined in 0. 1 M buffer, I = 0. 1, by following the decrease in
absorbance at 245 nm. 0. 05 ml of 6. 34 mM N-benzoylimidazole
(1 in 1000 dilution of neat in DMSO) was added to 2. 95 ml of buffer
and the decrease in absorbance was followed to completion (A).
For the hydrolysis in 26. 7 % DMSO, each buffer contained
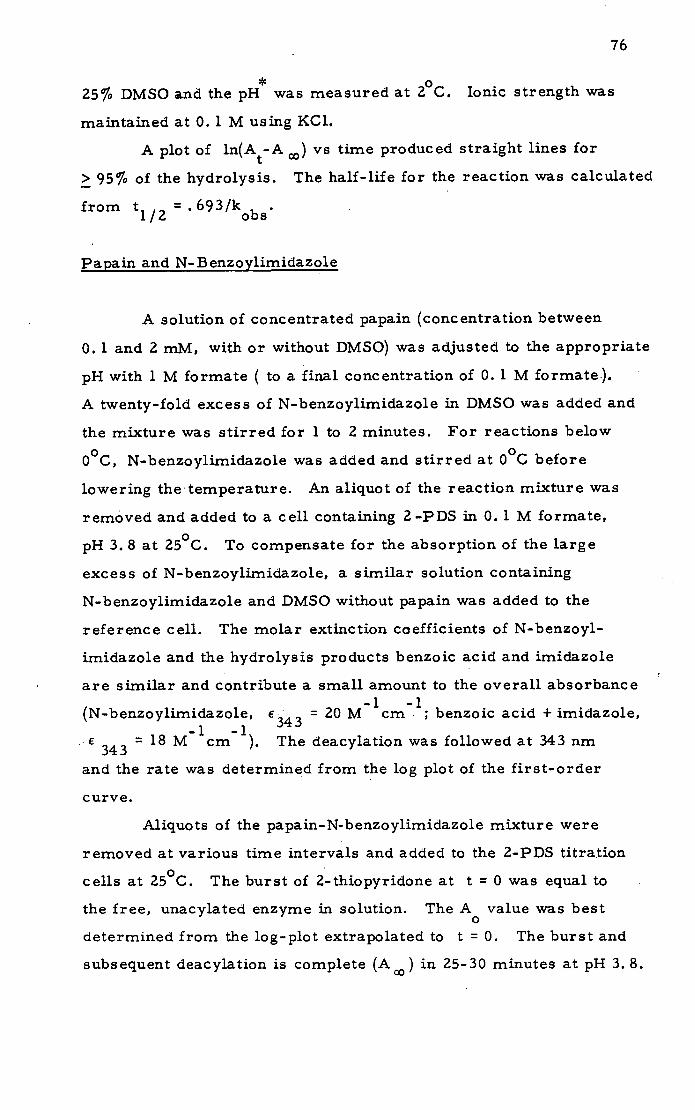
76
25% DMSO and the pH was measured at 20C. Ionic strength was
maintained at 0. 1 M using KC1.
A plot of ln(A_A ) vs time produced straight lines for
2 95% of the hydrolysis. The half-life for the reaction was calculated
from t 1 ,2 =.693/k obs
Papain and N-Benzoylimidazole
A solution of concentrated papain (concentration between
0. 1 and 2 mM, with or without DMSO) was adjusted to the appropriate
pH with 1 M formate ( to a final concentration of 0. 1 M formate.).
A twenty-fold excess of N-benzoylimidazole in DMSO was added and
the mixture was stirred for 1 to 2 minutes. For reactions below
00C, N-benzoylimidazole was added and stirred at 0
0C before
lowering the temperature. An aliquot of the reaction mixture was
removed and added to a cell containing 2-PDS in 0. 1 M formate,
pH 3. 8 at 250C. To compensate for the absorption of the large
excess of N-benzoylimidazole, a similar solution containing
N-benzoylimidazole and DMSO without papain was added to the
reference cell. The molar extinction coefficients of N-benzoyl-
imidazole and the hydrolysis products benzoic acid and imidazole
are similar and contribute a small amount to the overall absorbance
(N-benzoylimidazole, E 343 = 20 M ' cm.; benzoic acid + imidazole,
• €343 = 18 Mcm). The deacylation was followed at 343 nm
and the rate was determined from the log plot of the first-order
curve.
Aliquots of the papain-N-benzoylimidazole mixture were
removed at various time intervals and added to the 2-PDS titration
cells at 250C. The burst of 2-thiopyridone at t = 0 was equal to
the free, unacylated enzyme in solution. The A value was best
determined from the log-plot extrapolated to t = 0. The burst and
subsequent deacylation is complete (A) in 25-30 minutes at pH 3.8.

77
The fraction of enzyme unacylated is equal to A/A m . A plot
of in (acylated) = ln ( 1-(A/A)) versus time produced a straight
line with a slope equal to the deacylation rate.
In each titration, the 2-PDS concentration was in at least
a ten-fold excess over enzyme concentration. N-benzoylimidazole
itself had no.ctivity toward 2-PDS.
Slight errors are introduced when pipetting cold. DMSO- water
solutions when adding aliquots to the titration cell, but over an
800 range (+20 to -60 0C), this error is less than 5 % (for 50%
DMSO solutions, Douzou and Balny, 1978). The pH of the solution
at -10°C can be estimated to be approximately 0. 1 pH unit higher
than at 00C (Maurel et al., 1975; Douzou, 1973).
In the 13C-NMR experiments, the [ 13C0]-N-benzoyi-
imidazole was added and the solution stirred at 00C for 2 minutes
before the temperature of the sample was rapidly lowered to -7 0C
in an alcohol bath..for 2 minutes before placing the sample in the
spectrometer. A 0. 5 ml sample was removed and stored at -7 0C
for assay by 2-PDS during the NMR time-course experiments.
pain and Na-CBZ-L-lysine-p-nitrophenyl ester
The solutions of N a-CBZ- L-lysine-p-nitrophenyl ester were
prepared by dissolving a known weight of solid substrate in DMSO.
The concentration was determined by adding 0. 05 ml of the substrate
in DMSO to 2.95 ml of 1M NaOH and determining the absorbance of -1 -1 the p- nitro phenolate at 400 nm (e 400(pNP) = 18900 M cm , Goren
and Fridkin, 1974). This value was usually within 10% of the value
determined from the weight of the solid compound dissolved in the
DMSO.
The bulfers used in these experiments varied in concentration
from 0. 01 to 0. 2 M with KC1 concentrations from 0 to 0. 2 M. All
buffers contained 1 mM EDTA except in the RNA experiments where
25 i.M EDTA was used.
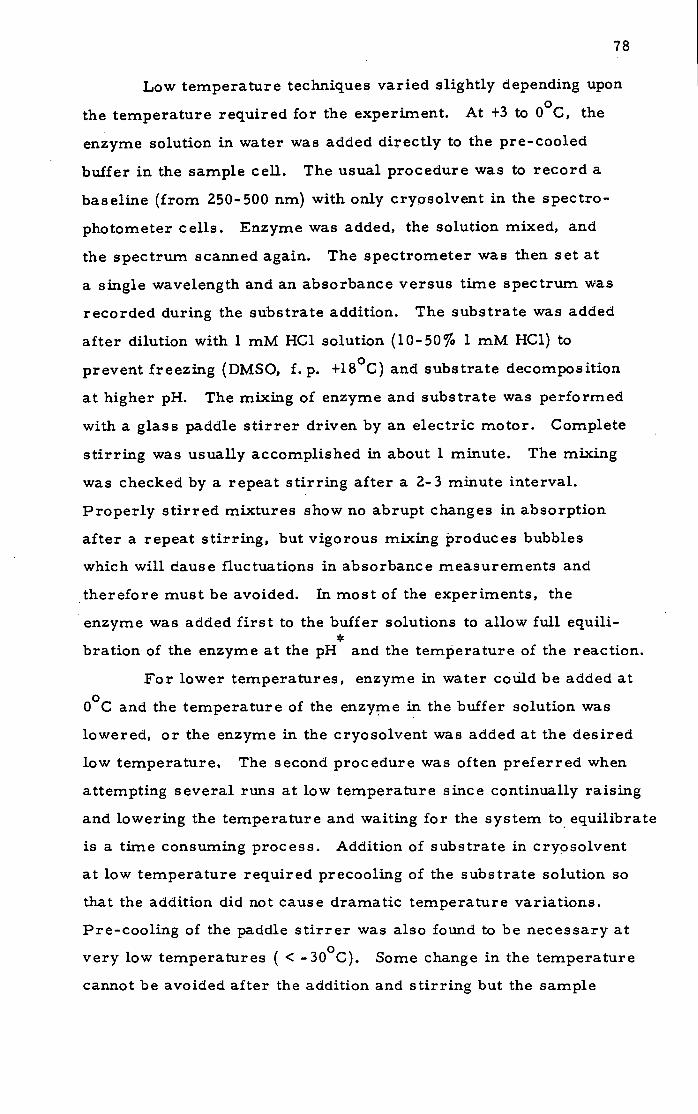
78
Low temperature techniques varied slightly depending upon
the temperature required for the experiment. At +3 to 00C, the
enzyme solution in water was added directly to the pre-cooled
buffer in the sample cell. The usual procedure was to record a
baseline (from 250-500 nm) with only cryosolvent in the spectro-
photometer cells. Enzyme was added, the solution mixed, and
the spectrum scanned again. The spectrometer was then set at
a single wavelength and an absorbance versus time spectrum was
recorded during the substrate addition. The substrate was added
after dilution with 1 mM HC1 solution (10-50% 1 mM HC1) to
prevent freezing (DMSO, f. p. +180C) and substrate decomposition
at higher pH. The mixing of enzyme and substrate was performed
with a glass paddle stirrer driven by an electric motor. Complete
stirring was usually accomplished in about 1 minute. The mixing
was checked by a repeat stirring after a 2-3 minute interval.
Properly stirred mixtures show no abrupt changes in absorption
after a repeat stirring, but vigorous mixing produces bubbles
which will dause fluctuations in absorbance measurements and
therefore must be avoided. In most of the experiments, the
enzyme was added first to the buffer solutions to allow full equili- *
bration of the enzyme at the pH and the temperature of the reaction.
For lower temperatures, enzyme in water could be added at
0 0 C and the temperature of the enzyme in the buffer solution was
lowered, or the enzyme in the cryosolvent was added at the desired
low temperature. The second procedure was often preferred when
attempting several runs at low temperature since continually raising
and lowering the temperature and waiting for the system to equilibrate
is a time consuming process. Addition of substrate in cryosolvent
at low temperature required precooling of the substrate solution so
that the addition did not cause dramatic temperature variations.
Pre-cooling of the paddle stirrer was also found to be necessary at
very low temperatures ( < -30 0C). Some change in the temperature
cannot be avoided after the addition and stirring but the sample
generally returns to a constant temperature after 2 to 3 minutes.
During this time interval, the temperature is frequently recorded.
The temperature of the sample is usually stable to -I- 0. 2 0C with
the apparatus used.
In 50 and 60% DMSO solution at temperatures below -500
C,
the solutions became extremely viscous. Mixing problems which
produce air bubbles or temperature inhomogeneity were clearly
evident in the experiments as fluctuations in the absorbance versus
time curves. The presence of air bubbles or a precipitate in the
cell could be detected by scanning the spectrum at long wavelengths
(500-600 nm) where no species present absorbs light but air bubbles
and precipitates cause perturbations.
The extinction of p-nitrophenol in these solutions was checked
upon completion of the hydrolysis by adding a small amount of a
standard solution of p-nitrophenol to the cell. After completion of the
low temperature experiments, the cell contents were warmed to 0 *
0 C and the pH of the solution was checked. Cells containing high
concentrations of the substrate required 0. 2 M buffer solutions.
An initial rate method was also used to determine the effects
of temperature on k cat
/K m
. For example, in 60% DMSO solutions,
substrate was added to the enzyme solution at -450C to a concentration
of 200-300 i.M. The initial rate of hydrolysis of the first 5% of the
substrate was observed and the temperature raised five or ten degrees
to get another determination from the same sample. The substrate
concentration at the higher temperature can be obtained from the
difference extinctions and k cat m
/K can be calculated. Three or
four determinations can be obtained over a twenty degree temperature
range. Over a greater range, the reaction may become too fast at
higher temperatures since the enzyme concentration is constant.
The effect of DMSO on the kinetic parameters was determined
in 1. 7 to 50% DMSO solutions. In this case, 0. 1 M acetate buffer
M.
with 1 mM EDTA was used in each determination without correcting
for the variation in ionic strength. Using formate buffer with a
different pK in 50% DMSO had no effect on the parameters obtained.
The effect of RNA on the kinetic parameters was determined
by preparing 10 mM acetate buffer with 10 mM KC1, 25 ii.M EDTA,
pH 5. 9, 50% DMSO with varying amounts of RNA (0 to 4 mg) in
3 ml. A stock solütin of concentrated RNA was added to each cell.
The molecular weight of RNA was estimated as 50000 g/móle
(Douzou and Balny, 1977).
Other p-nitrophenyl ester substrates
C ryo enzymological investigations with GB Z - glycine- p-
nitrophenyl ester and N-ac etyl- L- phenylalanyl- p- nitro phenyl ester
were performed using identical techniques to those described in
the papain-CB Z - L-lys ine- p-nitrophenyl ester section.
Interpretation of Kinetic Data
Values of [SI and v were obtained from complete curves
by the method of Waley (1981). The data was fitted to the Michaelis-
Menten equation by the method of Wilkinson (1961). Each determination
from a single complete progress curve listed in the results section
has a standard error computed by this method.
The activation energies were obtained by non-weighted linear
regression of ln(kb) vs (lIT) data.
Papain and Na-CBZ-glycine-p-nitrophenyl ester at 250
C
This substrate was used to determine the relative activity
of papain solutions. The acitvity was determined in 0. 1 M acetate,
pH 5. 0. The concentration of substrate in the cell was approximately
81
100 1.M and the enzyme concentration varied from 0. 1 to 0. 5 iM.
The hydrolysis was monitored by the increase in absorption at
340 nm (4c 340 = 6230 M 1 cm 1 ).
Papain inhibition with N-ac etyl- L- phenylalanylglyc inal
N-acetyl- L- phenylalanylglycinal dimethyl ac etal was
hydrolysed in either 0. 05 of 0. 2 M HC1 ( 10 mg of dimethyl acetal
in 5 ml of acid) under argon or nitrogen with rapid stirring.
The hydrolysis was monitored by thin layer chromatography
(CHC1 3 :MeOH, 9:1; Acetal R f = 0.63, Aldehyde Rf = 0. 38). In
0. 05 M HC1, the hydrolysis was complete in 18 hours, and in
0. 2 M HC1 in 5 hours. The concentration of aldehyde in solution
was estimated from the phenylalanine absorbance (. c 258 (Phe) =
200 M'crn ; Greenstein and Winitz, 1961).
The inhibition constant K. for this competitive inhibitor was
determined using CBZ-glycine-p-nitrophenyl ester as a substrate
and the method of Henderson (1972). At pH 7, a constant amount
of enzyme was mixed with varying amounts of inhibitor ([I] = 0. 1 to
16 iJ.M ). The substrate was. added and the initial rate was observed
at 340 nm. The substrate concentration was held constant for each
[I]. The substrate concentration is then changed and the process
repeated ([S] = 10 to 60 i.i.M). The rate of the uninhibited reaction
(v) was compared to the rate of hydrolysis with inhibitor present
(v). For each substrate concentration, a linear plot of (v/v.) vs
If(l-(v./v)) was obtained. A . plot of the slopes of these lines against
substrate concentration yields a line with a y-intercept of K.. The
K. determination was performed in duplicate.
The stoichiometry of inhibition was determined by the method
of Morrison (1969) using L-BAPNA as substrate. This substrate
allowed the enzyme concentration to be varied over a wide range
without the reactions becoming too rapid for observation. At
constant [S] (1 mM), [E] was varied from 0. 05 to 1.6 for different 0
values of, [I]. Inhibitor concentrations varied between 0. 03 and 0. 3
M. A plot of [E] vs rate produced a series of curves for each
inhibitor concentration. The asymptote of the curves intersected the
x-axis at [E] = [I], showing 1 : 1 stoichiometry.
In the 13C-NMR experiment, acetal hydrolysis was followed
in D 2 0 solution containing 5% 4M HC1 by both 13C-NMR and thin-layer
chromatography. After addition of the aldehyde to the enzyme and
accumulation of the spectra, solid 2-PDS was added to the inhibition
mixture and stirred for 1. 5 hours. The mixture was centrifuged
at room temperature to remove the excess 2-PDS. The 2-PDS
concentration in the sample was estimated by scanning the spectrum
of the sample at pH 8. 2 and obtaining the A 343 . 30 mM cysteine
was added and the spectrum rescanned. The amount of 2-thiopyridone
released upon addition of cysteine was calculated from A 343 and
is double the amount of 2-PDS originally in the sample.
BAPNA Hydrolysis
For rate assays using BAPNA, a standard 1 mM solution was
prepared by dissolving 43.5 mg BAPNA-HC1 (MW=434. 9 g/mol) in
1 ml of DM50 with slight warming. This was diluted to 100. 0 ml
in 0.1 M phosphate, pH 7.0 containing 10 mM cysteine at 250
C.
0. 1 ml of enzyme solution was added to 2.9 ml of the BAPNA
solution ([E] = 1 p.M) and the initial rate of hydrolysis was obtained
at 410 nm '410 = 8800 M 'cm 1;
Mole and Horton, 1973). L-BAPNA
without cysteine was used in the aldehyde inhibition studies and
D, L-BAPNA elsewhere.
Papain inhibition with N a-CBZ- L-lysine-CMK
CBZ-L-lysine-CMK hydrochloride was dissolved in 1 mM HC1
83
and stored at 40C. The concentration of material was calculated
from the weight dissolved. CMK solution was added to papain in
phosphate buffer pH 7.0 and stirred for 15 minutes. Aliquots of
this mixture were removed and the activity to CBZ-glycine-pNP,
BAPNA, or 2-PDS was determined. After reaction with CMK,
low molecular weight material was removed by gel-filtration.
Denaturation of Papain
Papain blocked with CBZ-L-lysine-CMK was denatured by
adding 0. 2 ml of 33% sodium dodecyl sulphate (by weight) to 10 ml
of rapidly stirring papain solution from the 13C-NMR experiment,
at pH 7. 1. The enzyme immediately began to precipitate out of
solution and 0. 025 ml of 10 M HC1 was added to bring the pH to 2.
The precipitate immediately redissolved and was used in the 13C-
NMR experiment.
Preparation of Papain-S-S-CH 3
Papain blocked as a disulphide with an(-S-CH 3 ) group
was prepared by the method of Smith et al. (1975). A two-fold
excess of methyl methanethiolsuiphonate was added to a stirred
solution of papain pH 7. 8. After treatment, activity to BAPNA
was negligible. The blocked papain was eluted down a G-25 column
to remove the excess methyl methanethiolsulphonate and CH 3 SO2H.
The enzyme nay be unblocked with cysteine or 2-mercaptoethanol
by stirring at pH 8 with the recovery of full activity.
13C-NMR spectral parameters
In general, 13C-NMR spectra were recorded over a spectral
width of "230 ppm (17000 Hz) with an acquisition time of around
0. 24 seconds which gave 8 K time domain datapoints. The spectral
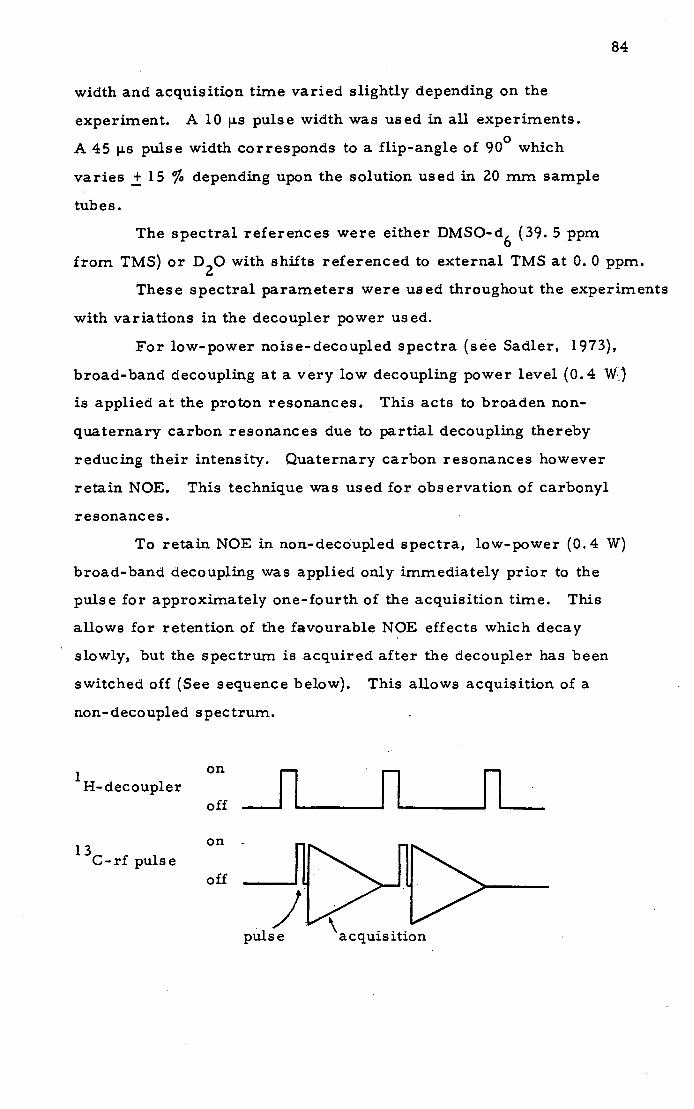
84
width and acquisition time varied slightly depending on the
experiment. A 10 u.s pulse width was used in all experiments.
A 45 i.i.s pulse width corresponds to a flip-angle of 900 which
varies ± 15 % depending upon the solution used in 20 mm sample
tubes.
The spectral references were either DMSO-d 6 (39. 5 ppm
from TMS) or D 2 0 with shifts referenced to external TMS at 0. 0 ppm.
These spectral parameters were used throughout the experiments
with variations in the decoupler power used.
For low-power noise-decoupled spectra (see Sadler, 1973),
broad-band decoupling at a very low decoupling power level (0.4 V/)
is applied at the proton resonances. This acts to broaden non-
quaternary carbon resonances due to partial decoupling thereby
reducing their intensity. Quaternary carbon resonances however
retain NOE. This technique was used for observation of carbonyl
resonances.
To retain NOE in non-decoupled spectra, low-power (0.4 W)
broad-band decoupling was applied only immediately prior to the
pulse for approximately one-fourth of the acquisition time. This
allows for retention of the favourable NOE effects which decay
slowly, but the spectrum is acquired after the decoupler has been
switched off (See sequence below). This allows acquisition of a
non-decoupled spectrum.
1H-decoupler on
[1 H rL off
on
off 13C-rf pulse
pulse acquisition
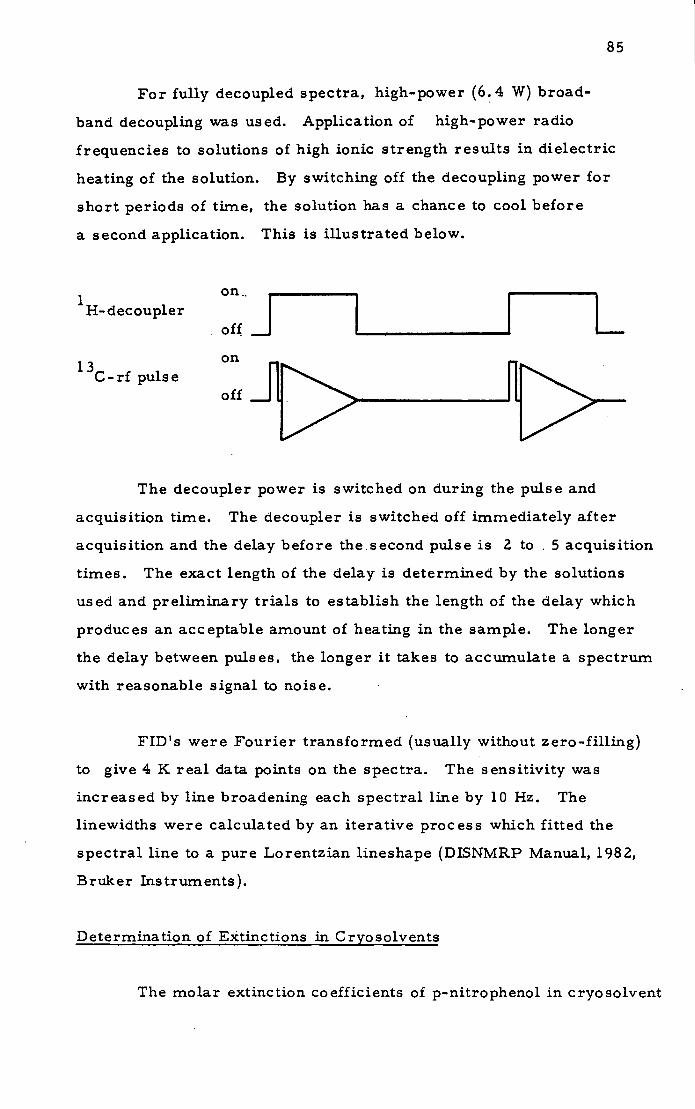
85
For fully decoupled spectra, high-power (64 W) broad-
band decoupling was used. Application of high-power radio
frequencies to solutions of high ionic strength results in dielectric
heating of the solution. By switching off the decoupling power for
short periods of time, the solution has a chance to cool before
a second application. This is illustrated below.
1H-decoupler ::;ii ri
3C-rfpulse on
off
The decoupler power is switched on during the pulse and
acquisition time. The decoupler is switched off immediately after
acquisition and the delay before the.second pulse is 2 to 5 acquisition
times. The exact length of the delay is determined by the solutions
used and preliminary trials to establish the length of the delay which
produces an acceptable amount of heating in the sample. The longer
the delay between pulses, the longer it takes to accumulate a spectrum
with reasonable signal to noise.
FIDt s were Fourier transformed (usually without zero-filling)
to give 4 K real data points on the spectra. The sensitivity was
increased by line broadening each spectral line by 10 Hz. The
linewidths were calculated by an iterative process which fitted the
spectral line to a pure Lorentzian lineshape (DISNMRP Manual, 1982,
Bruker Instruments).
Determination of Extinctions in Cryosolvents
The molar extinction coefficients of p-nitrophenol in cryosolvent
M.
at various temperatures were determined by repetitively scanning
the spectrum. The baseline was recorded with.cells containing the
cryosolvent at room temperature. A standard solution of p-nitro-
phenol (3.93 or 30.45 mM, standardized in fully aqueous solution
by the A400 in 1 M NaOH) was added to the cells and the spectrum
rescanned. The temperature was lowered 100 and the spectrum
was scanned again. This process was repeated down to -50 to
-600 C allowing time for the cell temperature to equilibrate before
coiceif recording each spectrum. The extinction 4was calculated by dividing
the absorbance by the concentration of pNP in the cell.
The extinctions of the substrates were determined in a
similar way except that the substrate was added to cold cryosolvent
( 0°C) to slow the aqueous hydrolysis.
The difference extinction (i € ) was obtained by (.€ - product ) and used in kinetic analyses.
substrate
Preliminary investigation of alternative cryosolvents
To screen possible cryosolvents for a cryoenzymological
investigation, a simple cooled sample holder was constructed. A
1.5 x 12 cm test-tube was wrapped in Tygon tubing (OD 3/32 11 , ID
1/32") through which gaseous nitrogen, cooled in liquid nitrogen,
was passed. The temperature of the sample in :the test-tube was
measured with a plastic coated thermocouple and the temperature
could be rapidly raised and lowered by adjusting the flow rate of
the gaseous nitrogen. Temperatures down to -100 0C can easily
be obtained ising this apparatus. For preliminary tests, the
cryosolvent was placed in the sample tube with a glass paddle
stirrer and the temperature was lowered at a constant rate. The
viscosity of the sample was judged by manually stirring the solutions
and observing the speed at which air bubbles introduced into the sample
are dispersed. As mixtures freeze, the decrease in temperature
of the system stops. Many supercooled mixtures become viscous
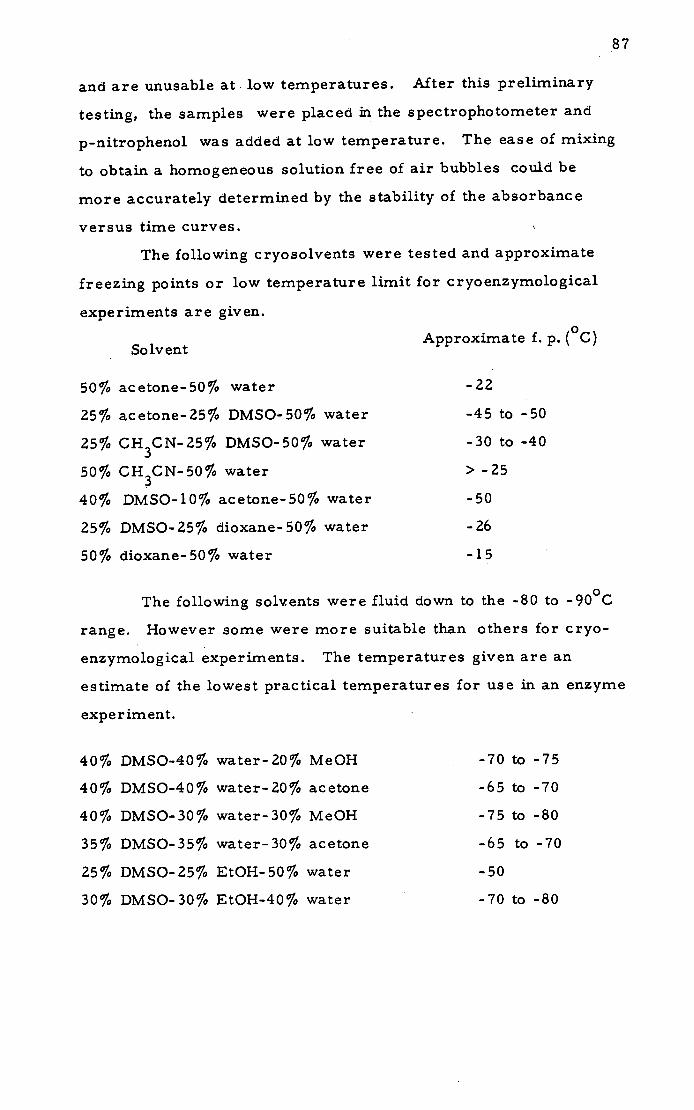
87
and are unusable at. low temperatures. After this preliminary
testing, the samples were placed in the spectrophotometer and
p-nitrophenol was added at low temperature. The ease of mixing
to obtain a homogeneous solution free of air bubbles could be
more accurately determined by the stability of the absorbance
versus time curves.
The following cryosolvents were tested and approximate
freezing points or low temperature limit for cryoenzymological
experiments are given.
Solvent
50% acetone-50% water
25% acetone-25% DMSO-50% water
25% CH 3CN-25% DMSO-50% water
50% CH 3CN-50% water
40% DMSO-10% acetone-50% water
25% DMSO-25% dioxane-50% water
50% dioxane-50% water
Approximate f. p. ( ° C)
-22
-45 to -50
-30 to -40
> -25
-50
-26
-15
The following solvents were fluid down to the -80 to -90 0 C
range. However some were more suitable than others for cryo-
enzymological experiments. The temperatures given are an
estimate of the lowest practical temperatures for use in an enzyme
experiment.
40% DMSO-40% water- 20% MeOH -70 to -75
40% DMSO-40% water-20% acetone -65 to -70
40% DMSO-30% water-30% MeOH -75 to -80
35% DMSO-35% water-30% acetone -65 to -70
25% DMSO-25% EtOH-50% water -50
30% DMSO-30% EtOH-40% water -70 to -80
Ion- exchange chromatography
The homogeneity of papain purified by covalent gel chroma-
tography was determined using ion-exchange chromatography by
the method of Baines and Brocklehurst (1979). A 1. 5 x 20 cm
column of SP-Sephadex C-50 in 0. 1 M acetate, 1 mM EDTA, pH
5. 0 was used. Approximately 90 mg of papain was applied to the
column ( 8 ml of 0.46 mM) and washed with 25 ml of 0. 1 M buffer.
A linear gradient from 0. 1 acetate to 1. 0 M acetate was applied
at a flow-rate'of 15 ml/hour and was complete after 30 hours.
10 ml fractions were collected. The absorbance at 280 nm was
measured, and the relative activity to BAPNA. A single protein
was isolated with maximum activity corresponding to the highest
concentration of protein.
Stopped-flow experiments
A sample of the enzyme used in the N-acetylphenylalanyl-
glycinal 13C-NMR experiments was analysed by stopped-flow
spectrophotometry by Mr. E. Salih and Dr. K. Brocklehurst
of the Department of Chemistry and Biochemistry at St. Bartholomews
Medical College, University of London.
Amino acid analysis
The amino acid analysis of salt-precipitated papain and
covalent gel purified papain were carried out by Dr. R. R. Ambler
of the Department of Molecular Biology, Edinburgh University.
RESULTS
AND
DISC USSION

Purification of Papain
Since contamination by other erzymes or proteins could
give rise to anomalous or misleading results it was essential for
this work that the purity of the papain used for kinetic and 3C-NMR
studies be rigourously ascertained. Papain purified by the method
of Baines and Brocklehurst (1979) showed no sign of chymopapain
contamination by the spectrophotometric method of Baines and
Brocklehurst (1978). The papain purified by this method usually
contained between 0. 65 and 0. 75 thiol/mol of protein with equal
amounts of 2-thiopyridone released at pH 4. 1 and 8. 2. However,
an amino acid analysis of the preparation (Table 1 ) showed
contamination by another protein. Several residues are in excess
of that expected from the amino acid composition determined by
Glazer and Smith (1971). Most noticeable is the appearance of
methionine which is absent in papain. Also listed in Table 1 are
the amino acid compositions of papaya lysozyme ( Howard and
Glazer, 1967; Smith et al., 1955 b ), and chymopapain B (Kunimitsu
and Yasunobu, 1970 ). The results suggest that this preparation
may be contaminated by papaya lysozyme as a small amount of
this enzyme would result in a methionine content of 0. 9 residues.
A Lcomparatively large contathinàtiQn by chymopapain B would be
required to produce this amount of methionine and would be detected
by the 2-PDS titration method of Baines and Brocklehurst (1978).
The number of glutamic acid and aspartic acid residues listed in
Table 1 results from both the acids (Glu, Asp) and the amides
(Gln, Asn). Covalent gel purification by the method of Brocklehurst
t al. (1973) was used to remove contaminating lysozyme, and the
amino acid analysis confirms the high purity of this preparation
(2-PDS titration of covalent gel purified papain usually showed
between 0. 85 to 0. 95 thiol/mole).

Table 1 . Amino acid compositions
Papain Covalent-gel Salt-precipitate Papaya Chymo- (Glazer and Smith) purified (Baines and Brocklehurst, 1979) lysozyme papain B
Lysine 10 10.4 12.5 10 27
Histidine 2 1.9 2.6 3 5
Arginine 12 121 9J4 13 10
Aspartic acid 6 1 i 18.6 16.6 22 29
Asparagine 13
Threonine 8 8.8 9.5 13 17
Serine 13 12.7 12.7 16 24
Glutamic acid 8 1 J- 19.5 15.7 .11 30
Glutamine 12
Proline 10 9.5 13.8 18 14
Glycine 28 27.7 23.8 26 41
Alanine 14 13.3 13.3 21 20
Valine 18 16.1 12.4 8 27
Methionine 0 0.09 0.9 4 1
Isoleucine 12 10.2 8.1 11 13
Leucine 11 11.2 10.6 12 16
Tyrosine 19 17.9 13.6 13 20
Phenylalanine 4 4.2 6.1 12 7
0

92
Covalent gel purified papain was used in the hydrolysis
of several synthetic substrates and in all cases, the kinetic
parameters compare well with previous investigations ( for
CBZ-glycine-pNP and CBZ-lysine-pNP, see appropriate
sections ). The hydrolysis of L-BAEE has been well studied and
the values obtained from two initial rate investigations compare
favourably with other values ( see Table 2 ).
Table 2 . Hydrolysis of L-BAEE by papain, pH 6
K (mM) k (_1)
m cat
* Triall 19.4±1.1 26.5±0.5
* Trial 2 22.2 ± 1. 1 29.0 ± 0. 6
Brocklehurst et al. (1973) 18.2 ± 0. 1 16.4 ± 0.5
Baines and Brocklehurst(1979) 13 ± 2 20 ± 2
Blumberg etal. (1970) 18 28.5
Sluyterman and Wijdenes (1970) 18 26
* (± Standard Error)
All of the results in Table 2 were obtained using fully
active papain preparations. Brocklehurst and Baines (1979)
reported that papain contaminated with other enzymes from
papaya latex had a higher K ( 20 mM ) and lower k (V /SH = -1 m cat m
2.2 s ) than the purified enzyme.
The homogeneity of papain prepared by covalent chromatography
was confirmed by ion-exchange chromatography on SP-Sephadex
C-50 by the method of Baines and Brocklehurst (1979). The relative
activity to the hydrolysis of BAPNA coincided with the protein
fractions determined by the A 280 .
A sample of the papain used in the N-acetyl-L-phenylalanyl-
glycinal 13C-NMR experiments was used in a stopped-flow analysis
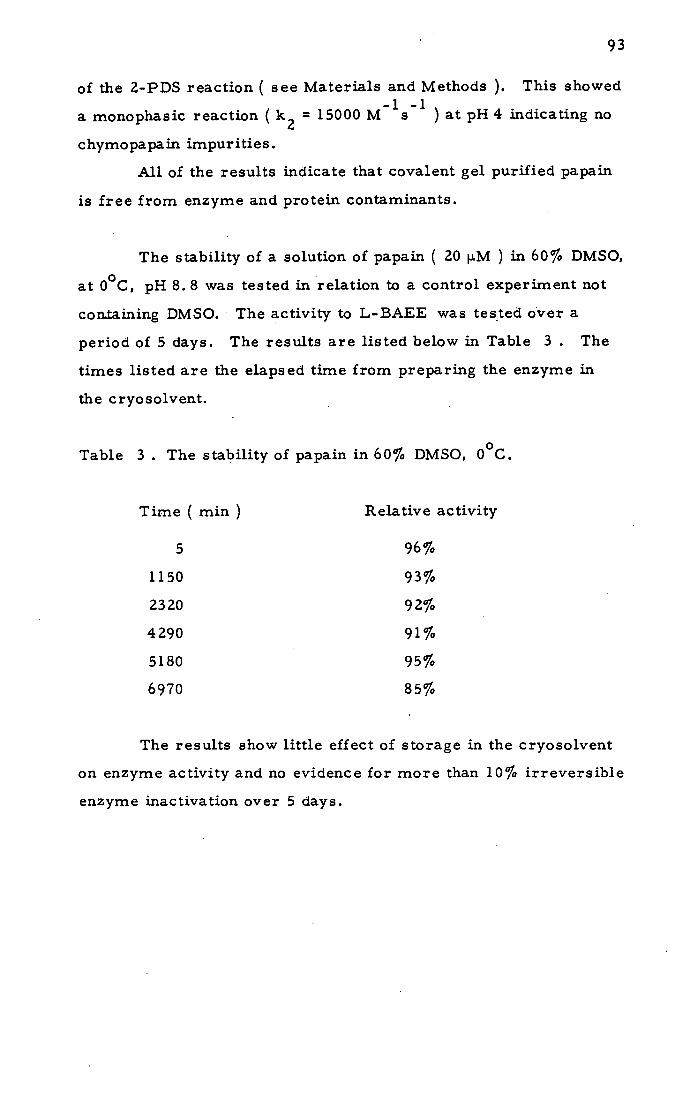
93
of the 2-PDS reaction ( see Materials and Methods ). This showed
a monophasic reaction (k 2 = 15000 M-1
s - l) at pH 4 mdicating no
chymopapain impurities.
All of the results indicate that covalent gel purified papain
is free from enzyme and protein contaminants.
The stability of a solution of papain ( 20 i.M ) in 60% DMSO,
at 00C, pH 8. 8 was tested in relation to a control experiment not
containing DMSO. The activity to L-BAEE was tested over a
period of 5 days. The results are listed below in Table 3 . The
times listed are the elapsed time from preparing the enzyme in
the cryosolvent.
Table 3. The stability of papain in 60% DMSO, 00
C.
Time ( mm ) Relative activity
5 96%
1150 93%
2320 92%
4290 91%
5180 95%
6970 85%
The results show little effect of storage in the cryosolvent
on enzyme activity and no evidence for more than 10% irreversible
enzyme inactivation over 5 days.

94
Papain and N-benzoylimidazole
The presence of an acyl intermediate in the papain-catalysed
hydrolysis of ester and amide substrates has long been inferred from
indirect evidence but relatively little direct evidence is presented in
the literature (see introduction). The resonance Raman observations
of Storer et al. (1979), and Ozaki et al. (1982), provide direct evidence
for dithioacylpapains but the direct evidence for the catalytically
relevant thioacyl intermediate is less conclusive. Bender and Brubacher
(1964), Brubacher and Bender (1966), and Hinkle and Kirsch (1970),
have presented results for direct observation of thioacyl papains
by UV-spectrophotometry. In each case studied, the absorption
spectrum of the acyl papain is red-shifted from the S-acylcysteine
model compounds. Only upon denaturation are the absorption
maxima in reasonable agreement with those of the model compounds.
This implies that the denatured enzyme exists as a thioacyl derivative
but some doubt must remain about the structure in the intact enzyme.
13C-NMR has the potential to observe individual nuclei and
provide structural information which is crucial to the direct
detection and unambiguous classification of an enzyme-bouhd
intermediate. In order to detect an acyl intermediate by 3C-NMR,
the concentration of the intermediate must be high (-1 mM), and
the lifetime relatively long (t1 / 2
1 hour), for detection. To
decrease the rate of deacylation, it is necessary to lower the
temperature of the system. However, papain solutions at concen-
trations > 200 M rapidly crystallize at -140C so it was necessary
to add a cosolvent to the papain solutions to ensure high enzyme
solubility below 250C. DMSO was found to be an excellent cosolvent
for papain and Fink and Angelides (1976) have determined that
solutions of DMSO up to 60% (v/v) have no adverse effect on the
structural or catalytic properties of papain. Addition of DMSO to
25% (v/v) ensures high solubiity (2 to 3 mM) of papain down to the
freezing-point (-15 0C) of the cryosolvent. The DMSO therefore
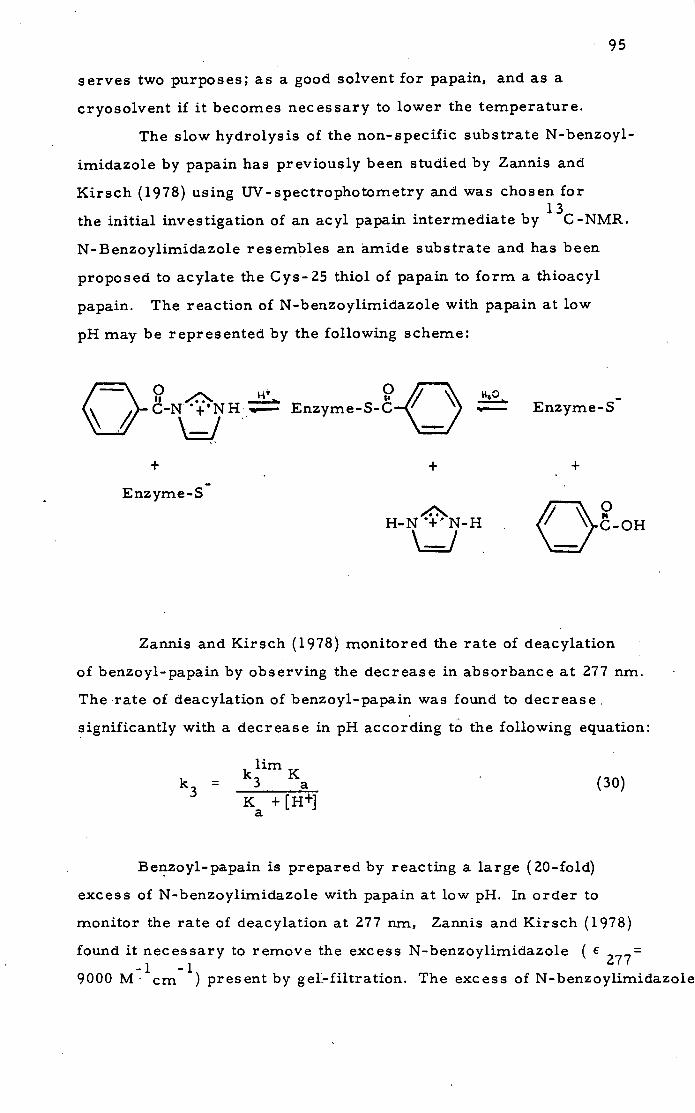
95
serves two purposes; as a good solvent for papain, and as a
cryosolvent if it becomes necessary to lower the temperature.
The slow hydrolysis of the non-specific substrate N-benzoyl-
imidazole by papain has previously been studied by Zannis and
Kirsch (1978) using tJV-spectrophotometry and was chosen for
the initial investigation of an acyl papain intermediate by 13C-NMR.
N-Benzoylimidazole resembles an amide substrate and has been
proposed to acylate the Cys-25 thiol of papain to form a thioacyl
papain. The reaction of N-benzoylimidazole with papain at low
pH may be represented by the following scheme:
H — Enzyme - S- Enzyme - S
+ + + Enzyme-S
110.0
H-N +. N-H (JCOH
Zannis and Kirsch (1978) monitored the rate of deacylation
of benzoyl-papain by observing the decrease in absorbance at 277 nm.
The rate of deacylation of benzoyl-papain was found to decrease
significantly with a decrease in pH according to the following equation:
k khmK
3 a (30) = K +[H+]
a
Benzoyl-papain is prepared by reacting a large (20-fold)
excess of N-benzoylimidazole with papain at low p1-i. In order to
monitor the rate of deacylation at 277 nm, Zannis and Kirsch (1978)
found it necessary to remove the excess N-benzoylimidazole € 277
9000 M'cm l) present by gel-filtration. The excess of N-benzoylimidazole

is required to ensure a high level of acylation of papain by the
non-specific substrate which rapidly hydrolyses at low pH.
Smith (1976) and Choi and Thornton (1974) determined the
rate of non-enzymatic hydrolysis of N-benzoylimidazole in aqueous
solution over a pH range from 1 to 10. The resulting experimentally
observed rate constants lie on a curve described by equation (31)
using the parameters listed below in Table 4
k obs [H+] +K ( K
=
a\ 'a
kQH K (31)
[H+]
The constants and kOH are the rate constants for the
acid and base catalysed reactions respectively and kHO is the rate
constant for water hydrolysis. Ka is the acid dissociation constant
for the N-benzoylimidazolium ion. The rate constants in Table 4
from Smith (1976) are the values obtained when etr lated to
zero buffer concentration.
The high concentrations of papain ( 1 mM), and N-benzoyl-
imidazole ("20 mM), needed for the 13C-NMR experiments require
the presence of a high concentration of buffer (0. 1 M), and for
lower temperatures, 25% DMSO. The effect of these additional
components on the non-enzymatic hydrolysis were investigated.
The rate of hydrolysis of N-benzo.ylimidazole was determined by
monitoring the decrease in absorption at 245 nm in 0. 1 M buffer,
1= 0.1. The ) of N-benzoylimidazole is 241. 5 nm ( = 11400
' 1 1 max M cm ) in 1.7% DMSO pH 6. 1 and 250C. The A max of the
1 products of the hydrolysis occurs at 234 nm (€ = 10900 M cm )
(see Figure 1). The decrease in absorption is pseudo-first-order
in substrate concentration and linear plots of ln(_(AA)) vs. t
were obtained and used to determine the first-order rate constant
k . The results listed in Tabi e 4 are obtained from log k
obs 10 obs vs. pH profiles shown in Figure 2. The experimental points, in

300 280 260 240 220
1.0
0.8
a) U
Cd .0
0
•0 0.4
0. 2
Wavelength (nm)
Figure 1 . Absorption spectrum of:
1.06 x M N-benzoylimidazole in 0. 1 M
phosphate, 1. 7% DMSO, pH 6. 1, 250
C.
Same as in (A), after complete hydrolysis at
25 0C ( 60 minutes later).
97
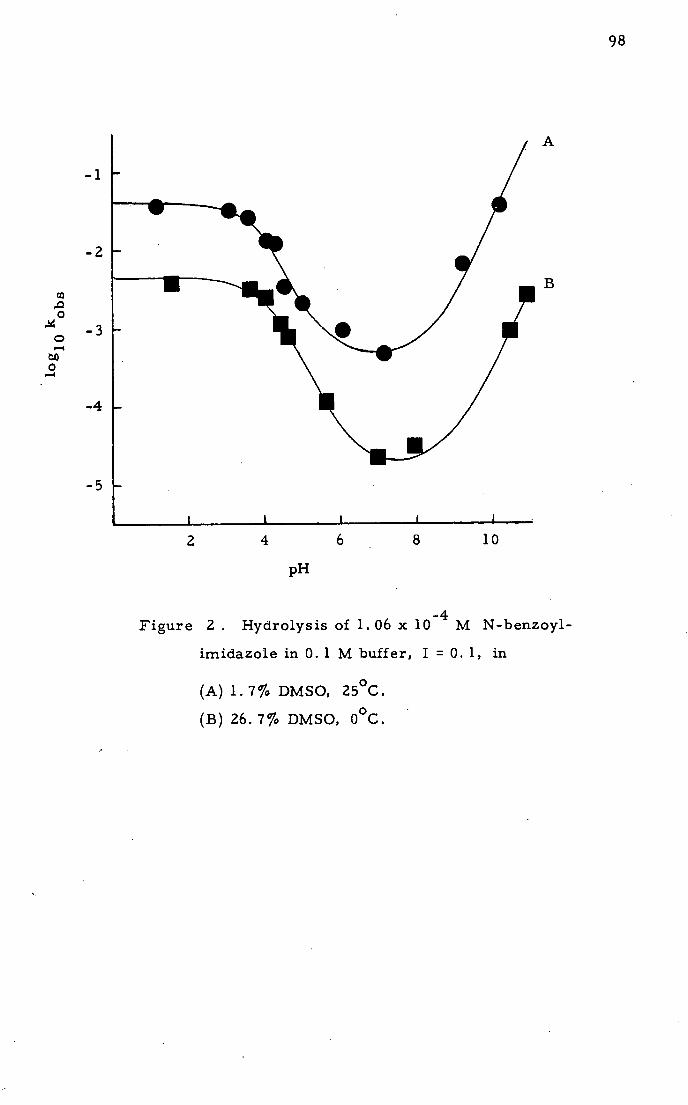
2 4 6 8 10
-1
-2
-4
-5
0
0 -4
0 -I
pH
Figure 2 . Hydrolysis of 1.06 x 10 M N-benzoyl-
imidazole in 0. 1 M buffer, I = 0. 1, in
1.7% DMSO, 250C.
26. 7% DMSO, 0°C.
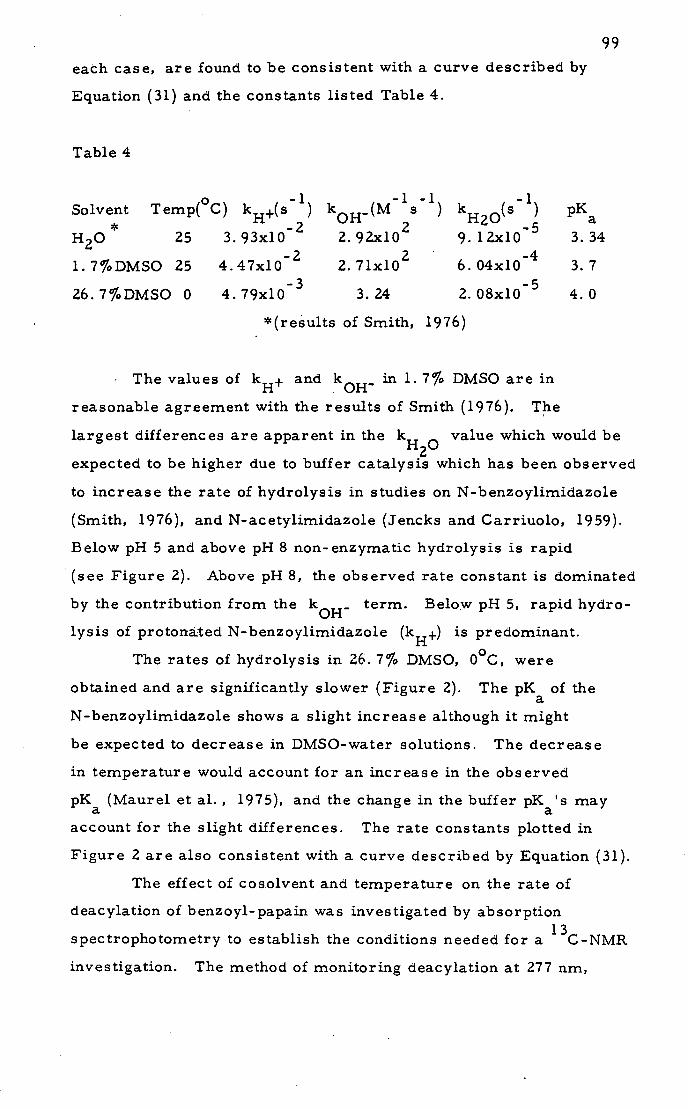
each case, are found to be consistent with a curve described by
Equation (31) and the constants listed Table 4.
Table 4
Solvent Temp(°C) kH+(s) koH(Ms) kHo(s') pK
H20 25 3.93x10 2.92x10 9.12x10 3.34
1.7%DMSO 25 4.47x10 2 2.71x10 2 6.04x10 4 3.7
26. 7 %DMSO 0 4.79x10 3 3.24 2.08x10 5 4.0
*(results of Smith, 1976)
The values of and kQH.. in 1. 7% DMSO are in
reasonable agreement with the results of Smith (1976). The
largest differences are apparent in the k value which would be Li z
expected to be higher due to buffer catalysis which has been observed
to increase the rate of hydrolysis in studies on N-benzoylimidazole
(Smith, 1976), and N-acetylimidazole (Jencks and Carriuolo, 1959).
Below pH 5 and above pH 8 non-enzymatic hydrolysis is rapid
(see Figure 2). Above pH 8, the observed rate constant is dominated
by the contribution from the kQH.. term. Below pH 5, rapid hydro-
lysis of protonated N-benzoylimidazole (kH+) is predominant.
The rates of hydrolysis in 26. 7% DMSO, 00C, were
obtained and are significantly slower (Figure 2). The PKa of the
N-benzoylimidazole shows a slight increase although it might
be expected to decrease in DMSO-water solutions. The decrease
in temperature would account for an increase in the observed
PK (Maurel et al., 1975), and the change in the buffer PKa'S may
account for the slight differences. The rate constants plotted in
Figure 2 are also consistent with a curve described by Equation (31).
The effect of cosolvent and temperature on the rate of
deacylation of benzoyl-papain was investigated by absorption
spectrophotometry to establish the conditions needed for a 13C-NMR
investigation. The method of monitoring deacylation at 277 nm,
100
used by Zannis and Kirsch (1978), was unsuitable since the gel-
filtration step needed to remove the excess N-benzoylimidazole
and its hydrolysis products, dramatically reduces the concentration
of the enzyme. For our purposes, it was necessary that the concen-
tration remain as high as possible. Reconcentration of the acyl
papain solution after gel-filtration is possible but would require
additional time during which the concentration of the intermediate
further decreases since the enzyme deacylates during the whole
process. While removal of excess reactants or products would
not be required for a 13C-NMR experiment, it was important to
monitor the reaction by UV-spectrophotornetry under identical
conditions. A new technique was developed to monitor the extent
of acylation and rate of deacylation of high concentrations of
benzoyl-papain in the presence of an excess of N-benzoylimidazole
and the products of the hydrolysis.
This technique utilizes the high reactivity of the titrant
2, 2 1 -dipyridyl disulphide (2-PDS) with the thiolate ion of papairi
at low pH. 2-PDS reacts rapidly (k1 5000 M 1 s 1 ) with the thiolate
ion of papain at pH 3. 8 (Brocklehurst and Little, 1972). In a
titration mixture containing 0. 25 mM 2-PDS (thiolate concentration
< 0. 025 mM), the reaction with papain has a half-life of 0. 27
seconds. Zannis and Kirsch (1978) report a limiting value of 150
seconds for the half-life of deacylation of benzoyl-papain, therefore
deacylation is the rate limiting step. Addition of benzoyl-papain
to a solution containing 2-PDS should produce a biphasic curve
when the absorbance at 343 nm is measured as a function time.
The initial phase (t 112 = 0.27 s. ), represents rapid titration of
non-benzoylated papain with 2- PIDS releasing 2- thiopyridone. This
is followed by a slower phase which reflects the rate limiting deacyl-
ation since as the enzyme slowly turns over, more thiolate is then
available for titration by 2-PDS. In practice, an initial burst of
2-thiopyridone is observed which is proportional to the concentration
of nori-benzoylated papain and is followed by a slower first-order
101
increase in absorbance. The final absorbance value (A ) of 00
the 2-thiopyridone in solution after the enzyme completely deacylates,
is equal to the concentration of active enzyme present before
acylation. A plot of ln(AOO _A) vs. t produces a line with slope
kb equal to the deacylation rate, and y-intercept equal to the
initial burst of 2-thiopyridone (or free enzyme). Using this method,
the deacylation rate in water at pH 3. 8 and room temperature was
obtained.
In a modification of this procedure, aliquots of the benzoyl-
imidazole-papain solution were removed at various time intervals
and added to the 2-PDS titration solutions. In this way, the amount
of non-acylated papain present was obtained as a function of time by
measuring the initial burst ( = free thiol) of 2-thiopyridone for
each addition. A plot of ln(fraction acylated) vs time produces a
straight line with a slope equal to the deacylation rate. The
advantage of this method is that papain-benzoylimidazole reaction
mixtures under various conditions of cosolvent concentration and
temperature can all be titrated by the same method at room temper-
ature. At 250C, pH 3. 8, the deacylation rate is sufficiently slow
(t1/2 = • mm.), to allow accurate determination of the initial
burst yet fast enough for complete deacylation to occur in a
reasonably short time. The benzoyl-papain may therefore be
successively titrated and the final A OD value for each titration
should be consistent. If the final A value varies from one CO
titration to the next, the results for that titration were discarded.
Low A CO values may be caused by denaturation of the enzyme; this
can. be checked by titrating the denatured enzyme at pH 8 where it
is most reactive (Brocklehurst and Little, 1973). The concentration
of 2-PDS in the titration cell was varied between 0. 1 to 0. 75 mM
and had no effect on kb. Protein concentrations in the papain-
N-benzoylimidazole mixtures varied between 0. 1 to 1. 7 mM and
in the titration cell from 4 to 40 iM also without any effect on the
observed rate. This indicates that deacylation is indeed the rate

102
limiting step in the titrations.
The two methods of determining the deacylation rate were
directly compared. The half-life for deacylation, determined by
measuring the bursts for a series of titrations, is 13. 0 minutes.
Following complete deacylation by removing a single aliquot of
the papain-benzoylimidazole mixture and monitoring complete
deacylation in a titration cell under similar conditions, has a
= 14.4 minutes. The results are in reasonable agreement
and support the validity of this procedure for determining the
rate of deacylation of benzoyl-papain.
Table 5 lists the results obtained for the deacylation of
benzoyl-papain under different conditions of cosolvent and temper-
ature. At 250C, pH 3. 2, the half-life for deacylation was 13. 9
minutes. Raising the pH to 3. 8 increases the deacylation rate
3. 2 fold, which illustrates the importance of maintaining a constant,
low pH. Also included in the table are the results of Zannis and
Kirsch (1978) at the same pH values calculated from Equation (30)
with kulm = 0. 271 mm 1 and pK = 4. 3. Their results are 2:5 3 a
times lower. The ratio of the rates at pH. 3. 2 and 3. 8 however
are similar. The differences in the results cannot be due to
differences in buffer or ionic strength as both are similar in the
two experiments. Included in the table are the half-lives for
non-enzymatic hydrolysis under the same conditions. It is immedi-
ately apparent that the rate of non-enzymatic hydrolysis is much
faster than the deacylation rate at acid pH.
The rate of deacylation of papain at low pH and 250C was
however too fast for a 13C-NMR experiment so it was necessary
to reduce the rate of deacylation by lowering the temperature. At
00C in 25% DMSO, the half-life for deacylation proved to be approx-
imately one hour which in the range required for the 13C-NMR
experiment. The freezing-pointof a 25% DMSO cryosolvent is
-150C so that the lowest practical temperatures which could be
used were in the -5 to -10 0C range.
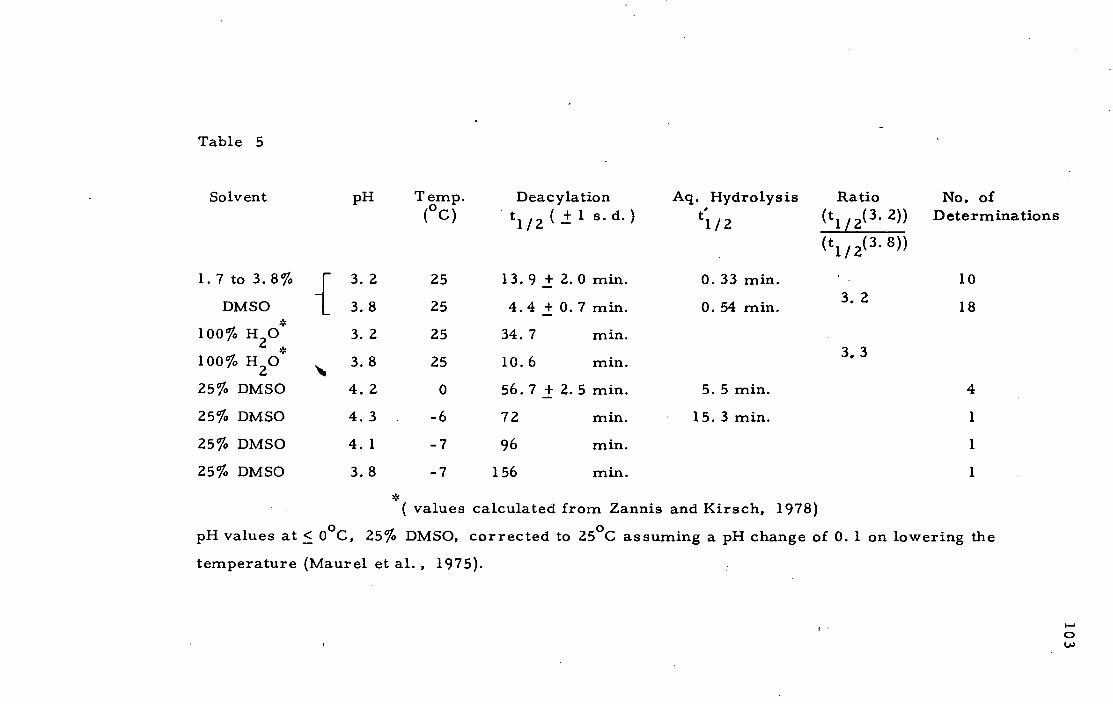
Table 5
Solvent pH Temp. Deacylation Aq. Hydrolysis Ratio No. of (° C) t 1 ( + 1 s.d.) t'l , z (t 112(3. 2)) Determinations
(t 112(3. 8))
1.7 to 3.8% 3. 2 25 13.9 ± 2.0 mm. 0.33 mm. 10
DMSO 1 3.8 25 4.4 ± 0.7 mm. 0. 54 mm. . 2
18
100% H 20 3. 2 25 34. 7 mm.
100% H 2 0 3.8 25 10.6 mm.
3.3
25% DMSO 4.2 0 56. 7 ± 2. 5 mm. 5. 5 mm. 4
25% DMSO 4.3 -6 72 min. 15.3 mm. 1
25% DMSO 4.1 -7 96 mm. 1
25% DMSO 3.8 -7 156 mm. 1
* ( values calculated from Zannis and Kirsch, 1978)
pH values at < 00 C, 25% DMSO, corrected to 25 0C assuming a pH change of 0. 1 on lowering the
temperature (Maurel et al., 1975).
0 J.)
104
A large excess of N-benzoylimidazole was used to ensure
a high concentration of non-hydrolysed N-benzoylimidazole during
acylation. For twenty determinations ranging from 1. 7 to 25%
DMSO, over a pH range 3. 2 to 4. 3, the average extent of acylation
is 84 ± 12 % (± 1 s. d.) of the available active enzyme.
In the experiments listed in Table 5 , 0. 1M formate buffer
was used to maintain a low pH. The increase in DMSO concentration
causes an increase in the PK of the buffer (Douzou, 1973). Formate
is the only suitable buffer available (at 0. 1M concentration) with a
PKa low enough for these experiments. At higher pH. deacylation
becomes rapid and lower temperatures would be required.
In the experiments at subzero temperatures, a lag phase
was observed during which time little or no deacylation was observed.
This is shown graphically in the results of a typical experiment
(Figure 3). The figure shows a plot of ln(fraction acylated) vs.
time for benzoyl-papain at -70C. The benzoyl-papain concentration
remained constant for the first two titrations over a 30 minute
interval. The third titration at 60 minutes shows the first decrease
in benzoyl-papain concentration and subsequent titrations indicate
a first-order breakdown of acyl enzyme. The rate constant for
deacylation is obtained from the slope of the linear portion. The
lag phase may be due to the presence of unhydrolysed N-benzoyl-
imidazole still in solution. At this low temperature, the N-benzoyl-
imidazole hydrolyses slowly which may allow for reacylation of the
enzyme. The rate constant for non-enzymatic hydrolysis of N -
benzoylimidazole under similar conditions is 0.046 mm ' . At this
rate, after 40 minutes (S323. 8 mM, [E1. 7 mM), 3.8 mM
N-benzoylimidazole is still available for acylation. After 60 minutes,
only 1. 5 mM benzoylimidazole remains which is less than the enzyme
concentration. At higher temperatures, where N-benzoylimidazole
hydrolyses rapidly, and the enzyme has a higher rate of deacylation,
a lag phase was not observed.
The purpose of the UV investigation was not to provide an
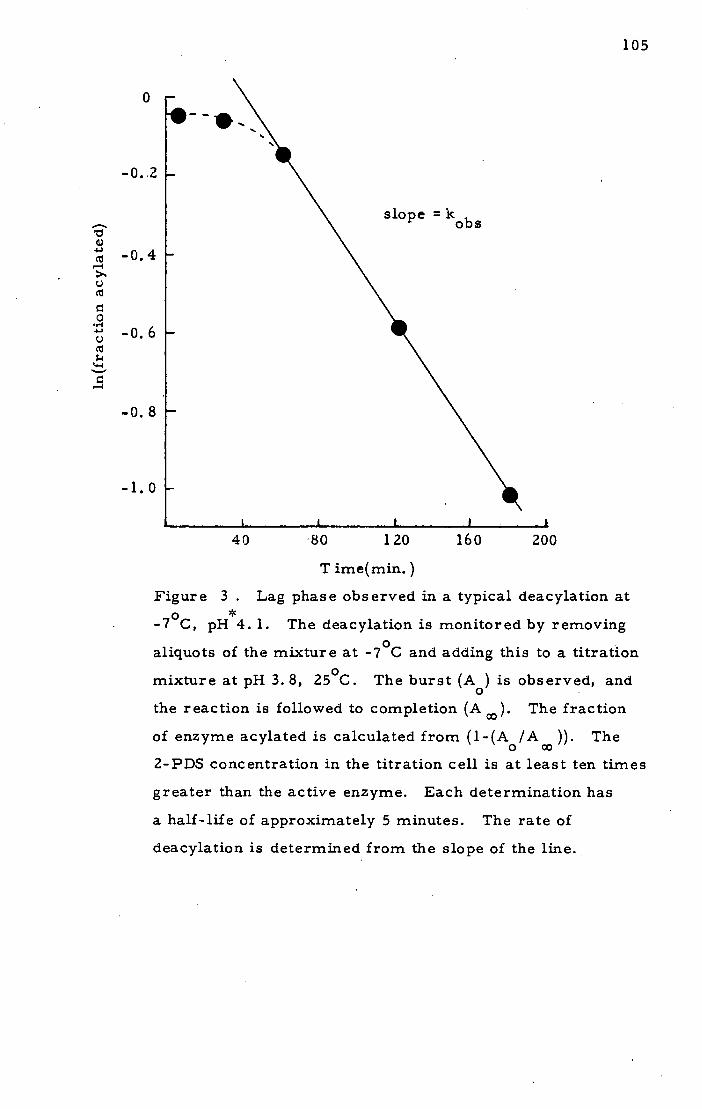
105
40 80 120 160 200
01
cd -. -I
U Cd
0
-' U -6 Cd
1-4
IM
T ime(min.)
Figure 3 . Lag phase observed in a typical deacylation at *
-7 0 C, pH 4. 1. The deacylation is monitored by removing
aliquots of the mixture at -70C and adding this to a titration
mixture at pH 3.8, 250C. The burst (A) is observed, and
the reaction is followed to completion (A ). The fraction
of enzyme acylated is calculated from (1-(A/A )).
The00
2-PDS concentration in the titration cell is at least ten times
greater than the active enzyme. Each determination has
a half-life of approximately 5 minutes. The rate of
deacylation is determined from the slope of the line.
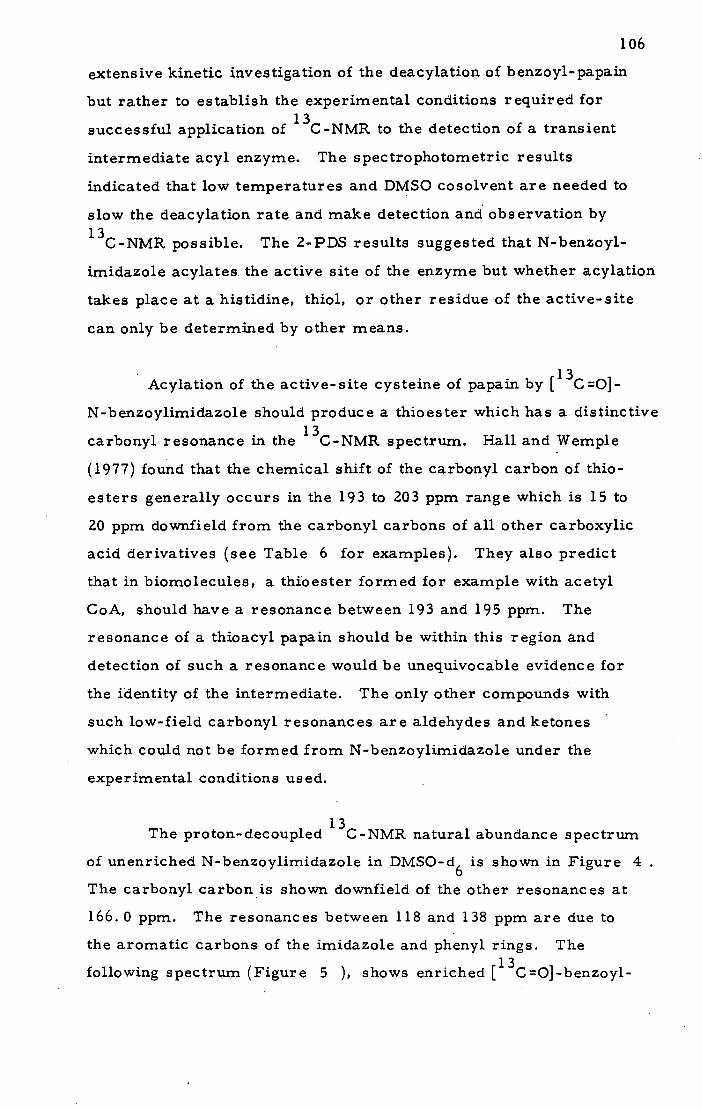
106
extensive kinetic investigation of the deacylation of benzoyl-papain
but rather to establish the experimental conditions required for
successful application of 13C-NMR to the detection of a transient
intermediate acyl enzyme. The spectrophotometric results
indicated that low temperatures and DMSO cosolvent are needed to
slow the deacylation rate and make detection and observation by
13C-NMR possible. The 2-PDS results suggested that N-benzoyl-
imidazole acylates. the active site of the enzyme but whether acylation
takes place at a histidine, thiol, or other residue of the active-site
can only be determined by other means.
Acylation of the active-site cysteine of papain by [ 13C=O]-
N-benzoylimidazole should produce a thioester which has a distinctive
carbonyl resonance in the 13C-NMR spectrum. Hall and Wemple
(1977) found that the chemical shift of the carbonyl carbon of thio-
esters generally occurs in the 193 to 203 ppm range which is 15 to
20 ppm downfield from the carbonyl carbons of all other carboxylic
acid derivatives (see Table 6 for examples). They also predict
that in biomolecules, a thioester formed for example with acetyl
CoA, should have a resonance between 193 and 195 ppm. The
resonance of a thioacyl papain should be within this region and
detection of such a resonance would be unequivocable evidence for
the identity of the intermediate. The only other compounds with
such low-field carbonyl resonances are aldehydes and ketones
which could not be formed from N-benzoylirnidazole under the
experimental conditions used.
The proton-decoupled 13C-NMR natural abundance spectrum
of unenriched N-benzoylimidazole in DMSO-d 6 is shown in Figure 4
The carbonyl carbon is shown downfield of the other resonances at
166. 0 ppm. The resonances between 118 and 138 ppm are due to
the aromatic carbons of the imidazole and phenyl rings. The
following spectrum (Figure 5 ), shows enriched [13C0]-benzoyl-
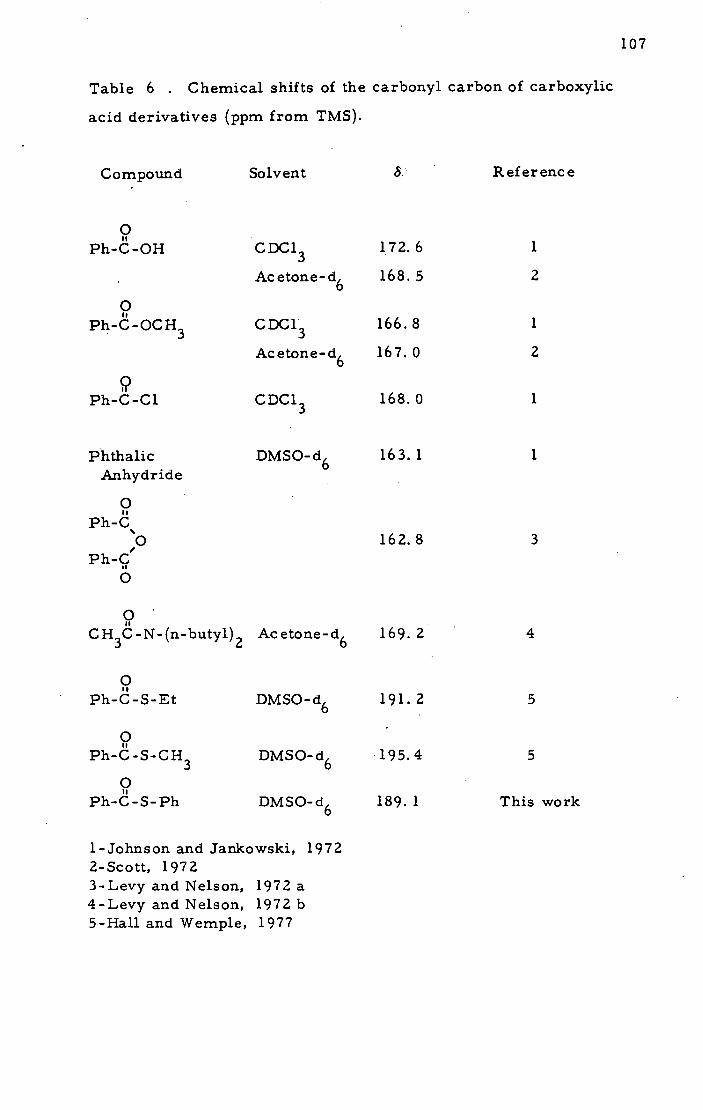
Table 6 . Chemical shifts of the carbonyl carbon of carboxylic
acid derivatives (ppm from TMS).
Compound Solvent 8 Reference
p Ph-C-OH CDC1 3 172.6 1
Acetone-d6 168. 5 2
p Ph-C-OCH3 CDC1 3 166.8 1
Acetone-d 6 167.0 2
Ph-C-Cl CDC1 3 168.0 1
Phthalic DMSO-d6
163.1 1 Anhydride
0 of
Ph-C '0 162.8 3
Ph-C II
0
0' CH3C-N-(n-butyl) 2 Acetone-d6 169. 2 4
9 Ph-C-S-Et DMSO-d6
191.2 5
0 it
Ph-C-S-CH 3 DMSO-d6 195.4 5
11
Ph-C-S-Ph DMSO-d6
189.1 This work
1-Johnson and Jarikowski, 1972 2-Scott, 1972 3-Levy and Nelson, 1972 a 4-Levy and Nelson, 1972 b 5-Hall and Wemple, 1977
107

170 160 150 140 130 120
8(ppm) 0 00
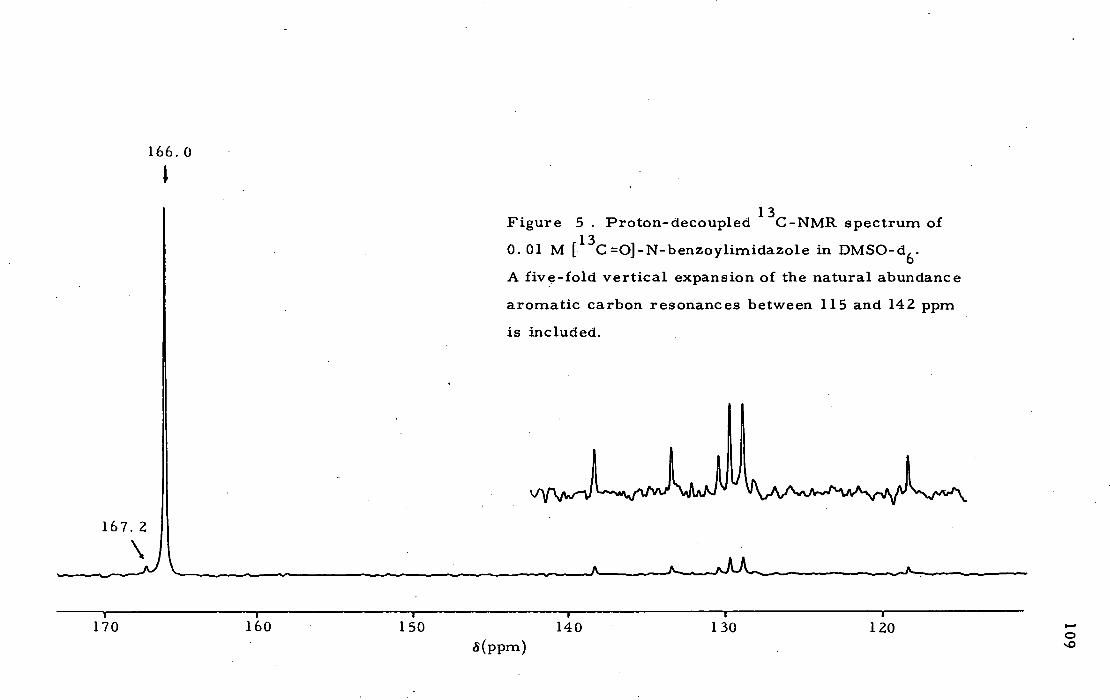
166. 0
I,
Figure 5 . Proton-decoupled 13C-NMR spectrum of
0.01 M [ '3C0]-N-benzoylimidazole in DMSO-d 6 .
A five-fold vertical expansion of the natural abundance
aromatic carbon resonances between 115 and 142 ppm
is included.
167. 2
\
8(ppm)
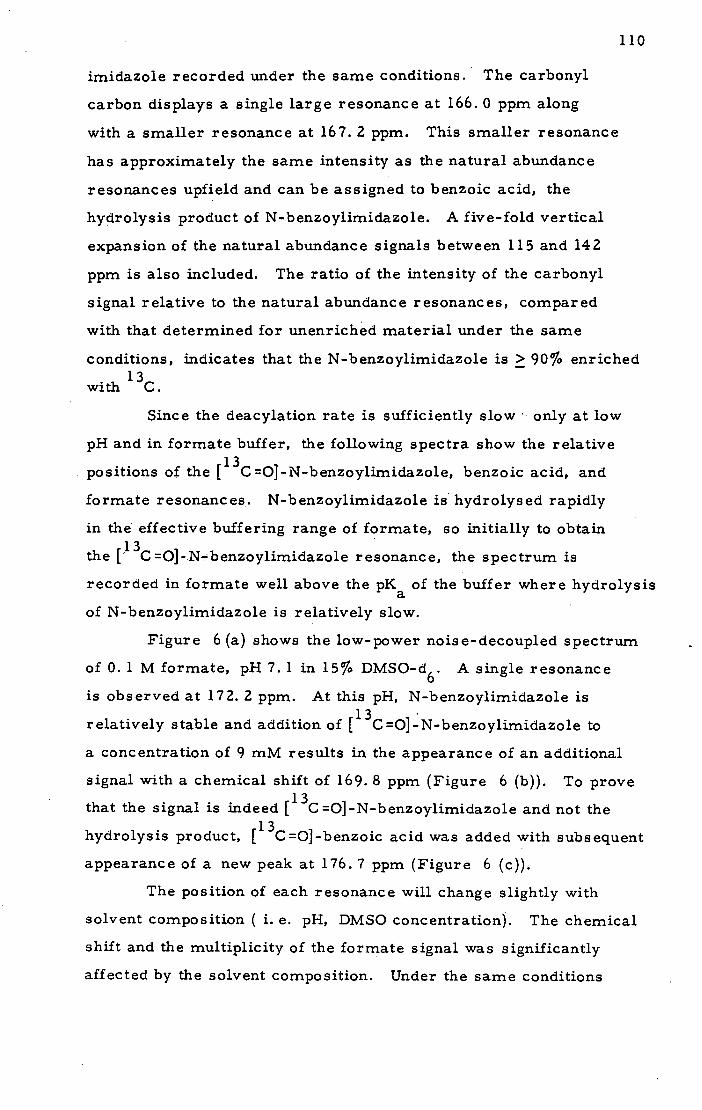
110
imidazole recorded under the same conditions. The carbonyl
carbon displays a single large resonance at 166. 0 ppm along
with a smaller resonance at 167. 2 ppm. This smaller resonance
has approximately the same intensity as the natural abundance
resonances upheld and can be assigned to benzoic acid, the
hydrolysis product of N-benzoylimidazole. A five-fold vertical
expansion of the natural abundance signals between 115 and 142
ppm is also included. The ratio of the intensity of the carbonyl
signal relative to the natural abundance resonances, compared
with that determined for unenriched material under the same
conditions, indicates that the N-benzoylimidazole is > 90% enriched
with 13
C.
Since the deacylation rate is sufficiently slow only at low
pH and in formate buffer, the following spectra show the relative
positions of the [ 13C0}-N-benzoylimidazole, benzoic acid, and
formate resonances. N-benzoylimidazole is hydrolysed rapidly
in the effective buffering range of formate, so initially to obtain
the [.1 3c 0]-.N-benzoylimidazole resonance, the spectrum is
recorded in formate well above the pK of the buffer where hydrolysis
of N-benzoylimidazole is relatively slow.
Figure 6 (a) shows the low-power noise-decoupled spectrum
of 0. 1 M formate, pH 7.1 in 15% DMSO-d 6 . A single resonance
is observed at 172. 2 ppm. At this pH, N-benzoylimidazole is
relatively stable and addition of [13C0J-N-.benzoylimidazole to
a concentration of 9 mM results in the appearance of an additional
signal with a chemical shift of 169. 8 ppm (Figure 6 (b)). To prove
that the signal is indeed 1 13C01-N-benzoylimidazole and not the
hydrolysis product, [ 13C0}-benzoic acid was added with subsequent
appearance of a new peak at 176. 7 ppm (Figure 6 (c)).
The position of each resonance will change slightly with
solvent composition ( i. e. pH, DMSO concentration). The chemical
shift and the multiplicity of the formate signal was significantly
affected by the solvent composition. Under the same conditions
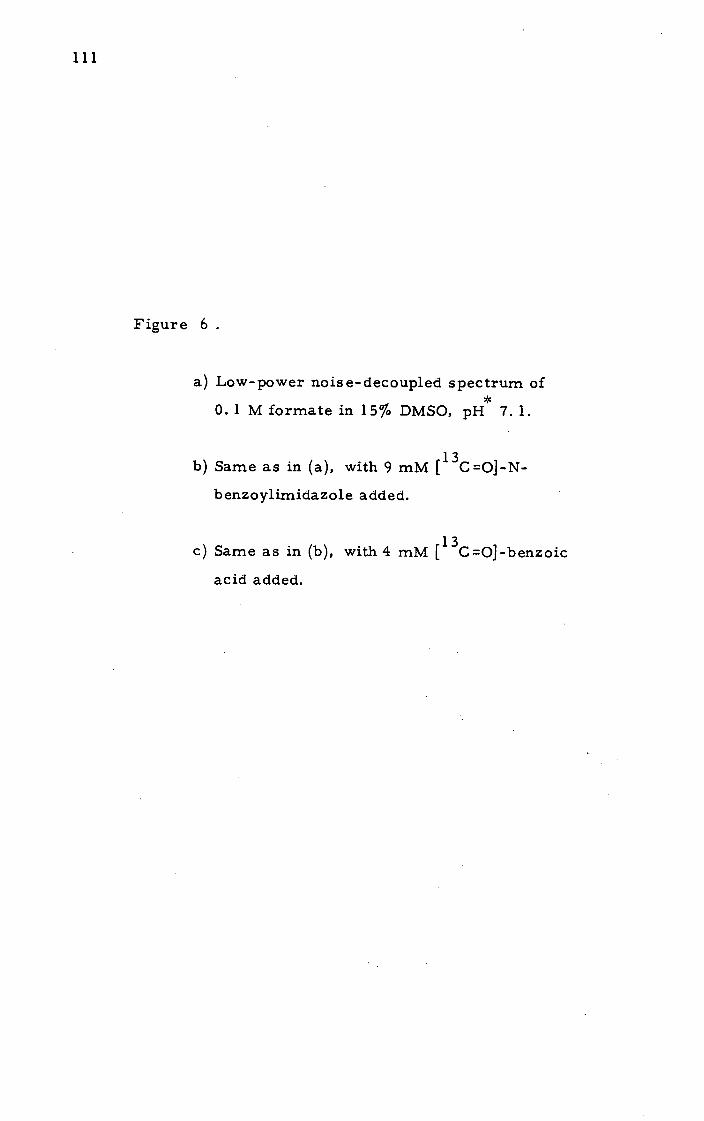
Figure 6
Low-power noise-decoupled spectrum of
0.1 M formate in 15% DMSO, pH *
7. 1.
Same as in (a), with 9 mM [ 13C 0] - N-
benzoylimidazole added.
Same as in (b), with 4 mM [ 13C0]-benzoic
acid added.
111
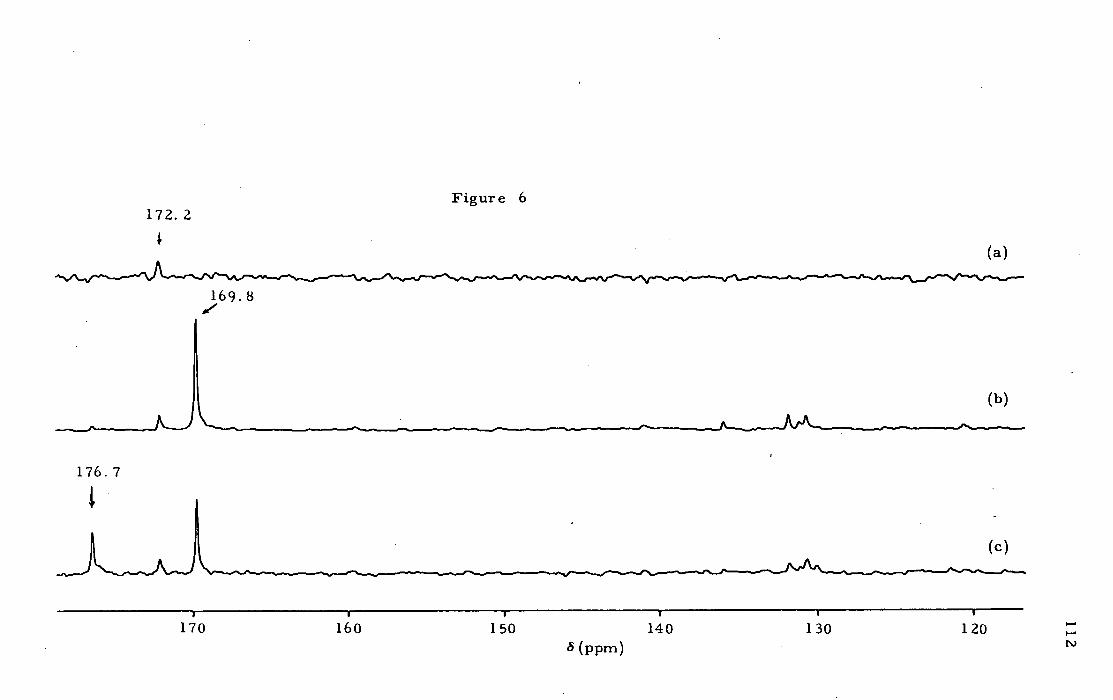
Figure 6 172. 2
169.8
176.7
I- I
170 160 150 140 130 120 8(ppm)
(c)
113
of low-power noise-decoupling, the formate signal appears as a
doublet at low pH and a triplet at higher pH. The chemical shifts
of the multiplets also changes with pH. Figure 7 shows a plot
of chemical shift of the formate signals versus pH in 25% DMSO,
00C. The pH of the solution can therefore be determined from
the chemical shift of the forrnate resonances. The PK determined
from Figure 7 is approximately 4. 0 which is a reasonable estimate
for formic acid in 25% DMSO 01°C. The pK a in water is 3. 7 and
increases with increasing ]DMSO concentration and a decrease in
temperature (Douzou, 1973). The change in multiplicity is caused
by the relative efficiency of the decoupling power which is affected
by changes in the solvent. Changes in pH and/or changes in DMSO
affect the ionic strength and dielectric constant of the NMR solutions.
The change in the solvent properties and therefore decoupler
efficiency, means that at low pH the formate signal is fully coupled
to the attached proton and hence a doublet is observed At higher
pH, the signal is partially decoupled and an apparent triplet,
(singlet + doublet) is observed. Figure 8 illustrates the effect of
varying decoupler power onthe formate signal. Figure 8 (a)
shows a fully coupled formate signal. Figure 8 (b) shows the same
solution now accumulated under conditions of full decoupling ( i. e.
high-power decoupled). The bottom spectrum (Figure 8 (c)), shows
a low-power partially decoupled spectrum of forrnate. This spectrum
is a combination of the above spectra. The problem of varying
multiplicity does not affect any. other signals of interest since
formate is the only carbonyl compound under study which has a
directly attached proton.
The non-enzymatic hydrolysis of N-benzoylimidazole in
0. 1 M formate was monitored by a time-course 13C-NMR experiment
as a control for the enzyme experiment. Figure 9 shows the time-
course for the hydrolysis of {13C0]-N-benzoylimidazole with the
first spectrum of the sequence on the bottom. The spectra on the
left side of the page show the carbonyl region of interest between

174
172 r
114
I 170
CIO
168
.166
2 4 6 8 10
pH
Figure 7 The dependence of the chemical shift 8 (ppm)
and the multiplicity of the formate resonances
on pH under conditions of low-power noise-
decoupling. 25% DMSO-d 69
00C, 0. 2 M formate.
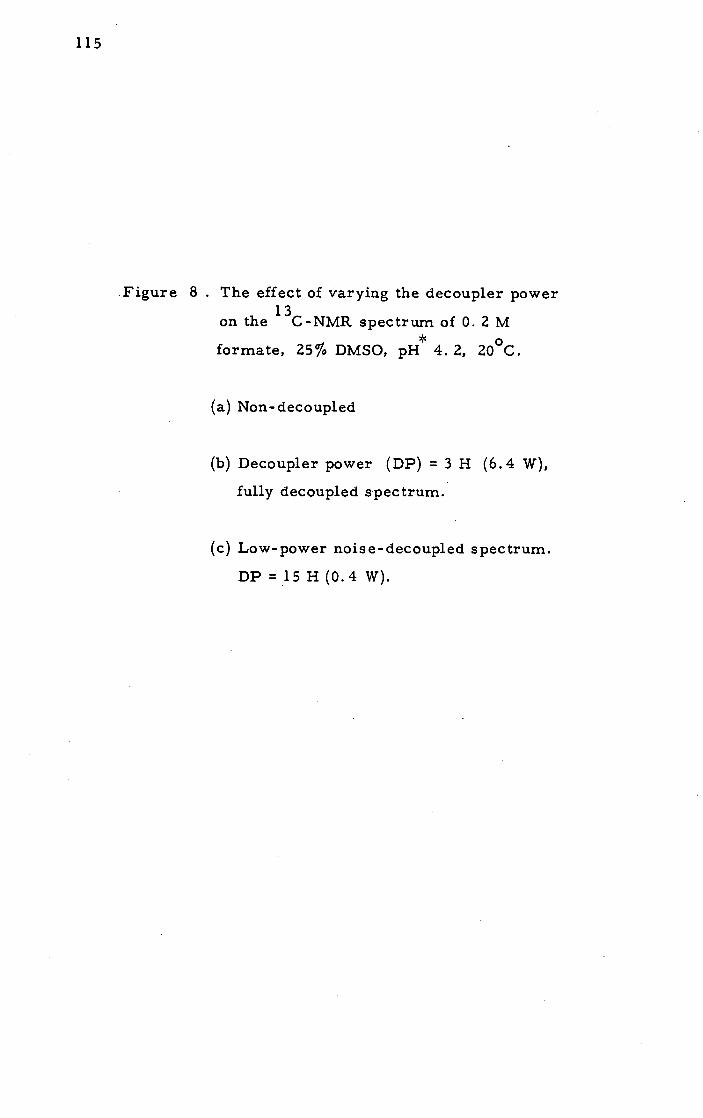
Figure 8 . The effect of varying the decoupler power
on the 13C-NMR spectrum of 0. 2 M
formate, 25% DMSO, pH 4. 2, 200
C.
Non-decoupled
Decoupler power (DP) = 3 H (6.4 W),
fully decoupled spectrum.
Low-power noise- decoupled spectrum.
DP = 15 H (0.4 w).
115
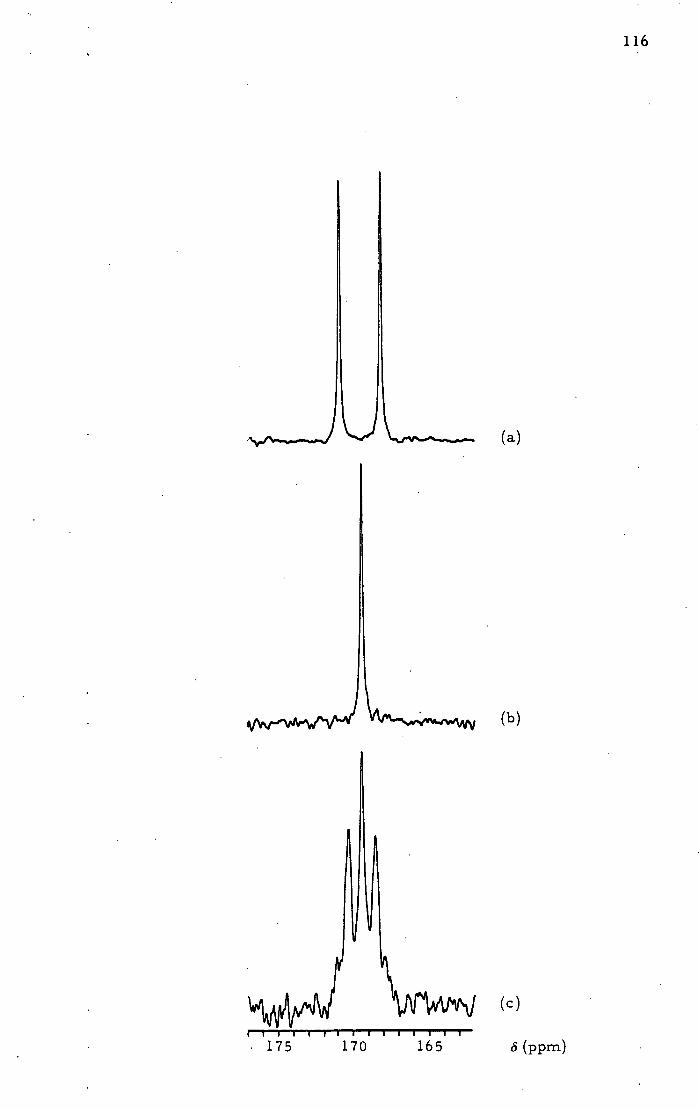
175 170 165 S (ppm)
116

117
164 and 176 ppm. In order to observe the weaker resonances, the
spectra on the right side of the page show a 12-fold vertical expansion
of the same time course spectra from 164 to 172 ppm. The spectra
shown if Figure 9 were recorded sequentially 4 minutes after
mixing [ 13C=O]-N-benzoylimidazole in the formate buffer. After
45 minutes, accumulation of the first spectrum (Figure 9 (a)) is
complete and it shows that most of the N-benzoylimidazole at 169. 1
ppm has been hydrolysed to benzoic acid resulting in a signal at
173. 7 ppm. The relative peak heights provide a measure of relative
concentration, and it can be estimated that approximately 12%
(2. 3 mM) [ 13C=O]-N-benzoylimidazole remains after 49 minutes.
Figures 9 (b) to (e) show the rapid decrease in the N-benzoylimidazole
signal at 169. 1 ppm slightly upfield from theformate triplet centered
at 170. 7 ppm. Also appearing in the spectra is one additional peak
at 165. 5 ppm. This peak also eventually disappears and since no
additional resonances appear in the spectra, it must be assumed
that the hydrolysis product(s) of this peak is also benzoic acid.
This resonance must therefore represent some acid labile derivative
of benzoic acid. Possible derivatives could be a benzoic acid
ester, amide, or anhydride which all have carbonyl resonances 13
in that region of the C-NMR spectrum (see Table 6 ). Since
no additional carbonyl resonances appeared in the spectrum of
[13C=O]-N-benzoylimidazole in 100% DMSO (Figure 5 ), the
additional resonance must have been produced during hydrolysis.
A similar resonance is present in the hydrolysis of N-benzoylimidazole
at acid pH in the absence of formate buffer. A possibility is
benzoic anhydride formed during the reaction by nucleophilic
attack of the product benzoate on benzoylimidazole:
O - Ph Ph-C=O / Ph-C-O C=O_____ + H-N.+,. N-H
I Ph-C=O
<ND'

Figure 9 . Hydrolysis of 19. 2 mM {3CO]-N-benzoyl-
imidazole in 0. 1 M formate, 1 mM EDTA,
25% DMSO, -6 0C, pH 4.4. Low-power
noise-decoupled spectra. 12-fold vertical
expansion of the region from 164-172 ppm
shown on the right.
(a) Spectrum accumulated 4 minutes after
mixing 11
3c 0]-N-benzoylimidazole
in buffer. Each spectrum required
45 minutes accumulation time (i. e.
NS = 10000
(b)-(e) Recorded sequentially after (a)
during the times indicated on the
spectra.
118
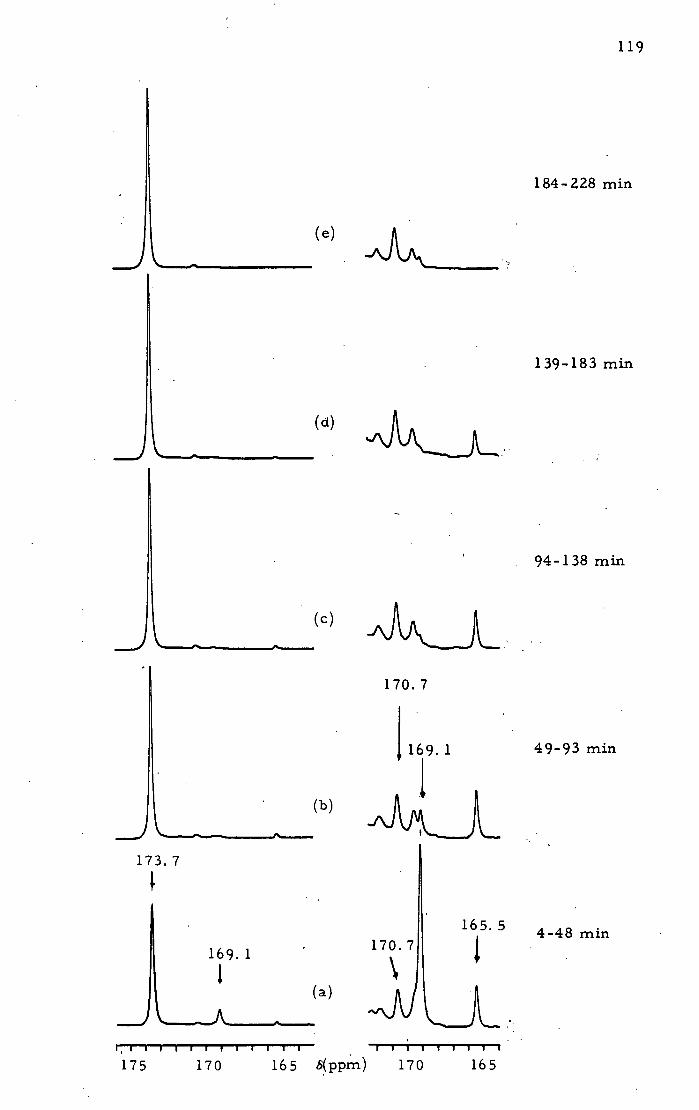
175 170 165 s(ppm) 170 165
D 4-48 mm
119
184-228 mm
139-183 mm
(d) JA,
94-138 mm
(C) Ak,_L .. . 170.7
1 1 ,69.1 49-93 mm
J\AJ LJ
a)
173.7

120
The spectrum of non-enriched benzoic anhydride in DMSO
is shown in Figure 10 (a). The resonance at 163. 2 is the carbonyl
signal of benzoic anhydride and the resonance at 167.3 ppm is
benzoic acid which was confirmed by adding additional benzóic acid
to the solution (Figure 10 (b)). *
The spectrum of formate, pH 3. 8, in 25% DMSO, is shown
in Figure 11 (a), below which is the spectrum after addition of
[13C=0]-benzoic anhydride (Figure 11(b)). The peak at 172. 5 ppm
is benzoic acid and the anhydride resonance in 25% DMSO, formate
buffer, has a chemical shift of 165. 4 ppm. After complete hydrolysis.
of the anhydride, the spectrum in Figure 11 (c) was recorded showing
only the formate and benzoic acid resonances. The additional peak
at 165. 5 ppm present in the control hydrolysis in Figure 9 is there-
fore assigned to benzoic acid anhydride.
In the enzyme experiments, the expected chemical shift of a
thioester intermediate between 190 and 200 ppm should be well down-
field of all the resonances observed in the control experiments. The
natural abundance spectrum of papain is shown inFigure 12 (h) and
shows the broad resonances due to protein carbonyls between 165 and
180 ppm. The quaternary carbons of arginine C-6 and tyrosine C-7
are also evident at 158 and 156 ppm respectively. Figure 12 (g)
shows the same sample after addition of formate. The triplet due
to partially decoupled formate is clearly'seen. The 1 13C =O] - N -
benzoylimidazole was added and the spectrum in Figure 12 (a) was
recorded starting at 6 minutes from the addition. Each spectrum
requires 45 minutes accumulation time for adequate S/N so the
spectra were recorded sequentially starting at 6, 51, 96, 141, 186,
and 231 minutes after addition of the N-benzoylimidazole. A sample
of the solution from the 13C-NMR experiment was removed two
minutes after the addition and kept at -' °C. Titration of aliquots
of this solution showed that 5 minutes after the addition of N-benzoyl-
imidazole, the enzyme was 96% acylated. Subsequent titrations

Figure 10 . a) Low-power noise decoupled spectrum
of 0. 2 M benzoic anhydride in DMSO-d 6 .
b) Same as in (a) plus 0. 09 M benzóic acid.
(b)
163.2
167. 3
(a)
I- I I
170 160 150 140 130 120
8(ppm)

Figure 11 . Low-power noise-decoupled spectra of
benzoic anhydride hydrolysis.
0. 1 M formate, 25% DMSO-d 6 , pB3. 8
-6°c.
Added [ 13C0]-benzoic anhydride to (a)
to a concentration of 0. 5 mM.
After complete hydrolysis of [ 3CO]- 13
benzoic anhydride to [ C0]-benzoic
acid.
122

168. 8
123
(a)
(b)
72.
(c)
I I I I U I U I I I I U U I I I U I I I j U
170 160
8 (ppm)
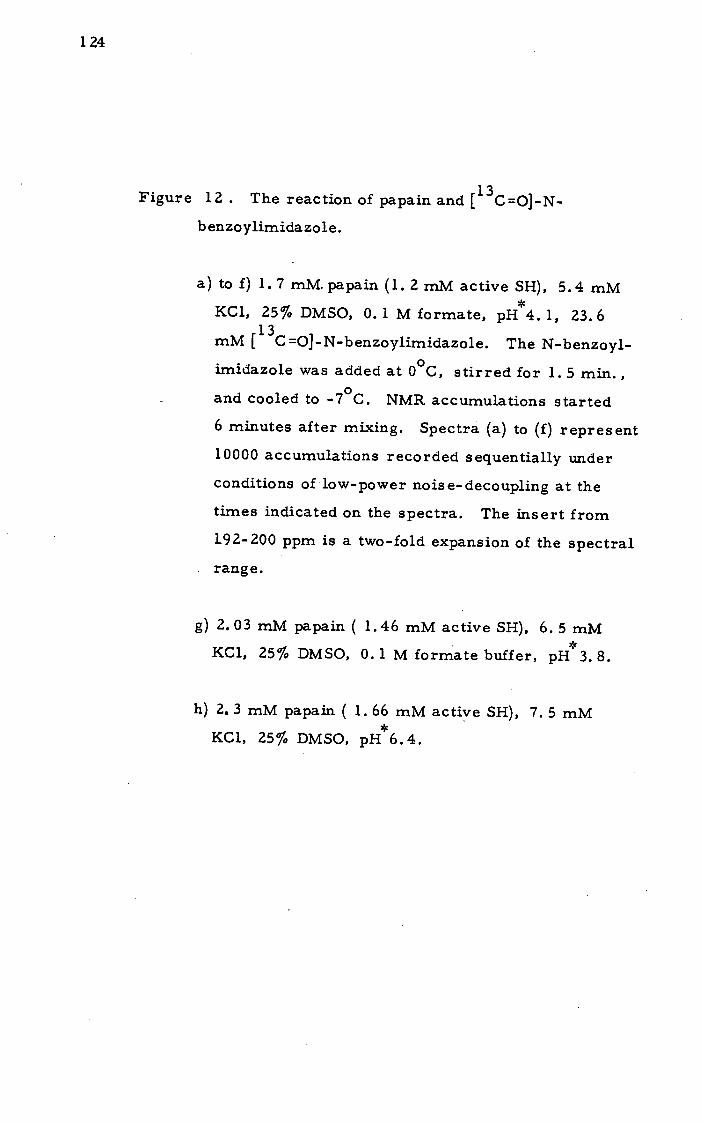
Figure 12 . The reaction of papain and 1 13C=OJ-N-
b enzoylimidazol e.
a) to f) 1.7 mM. papain (1.2 mM active SH), 5.4 mM
KC1, 25% DMSO, 0. 1 M formate, pH4. 1, 23.6
mM 11 3
C 0J - N-benzoylimidazole. The N-benzoyl-
imidazole was added at 0 C, stirred for 1. 5 mm.,
and cooled to -7 0C. NMR accumulations started
6 minutes after mixing. Spectra (a) to (f) represent
10000 accumulations recorded sequentially under
conditions of low-power noise-decoupling at the
times indicated on the spectra. The insert from
192-200 ppm is a two-fold expansion of the spectral
range.
2.03 mM papain ( 1.46 mM active SH), 6.5mM
KC1, 25% DMSO, 0. 1 M formnate buffer, pH*3. 8.
2. 3 mM papain (1. 66 mM active SH), 7. 5 mM
KC1, 25% DMSO, pH 6.4.
124

158 125
'-169. 3 (h)
(g)
(f) 231 - 275 minutes
(e) 186 - 230 minutes
(d) 141 - 185 minutes
(c) 96 - 140 minutes
(b) 51-95 minutes
(a) 6 - 50 minutes
210 190 170 150
8 (ppm)

126
indicated that the half-life for deacylation is 96 minutes. The
spectra in Figure 12 can be directly compared to the control
experiment in Figure 9. The position of the formate triplet shifts *
slightly with a change in pH from 169. 3 (pH 3.8) in Figure 12 (g) *
to 170. 1 ppm (pH 4. 1) in Figures 12 (a) to (f). The resonance
due to benzoic anhydride is also present at 165. 2 ppm in Figures
12 (a,b), but then disappears. The rate of hydrolysis of the anhydiide
appears to be much faster in the enzyme experiments (compare
FIgure 9 to Figure 12) which may be due to groups on the protein
aiding in hydrolysis. The resonance due to 1 13C=OJ - N-benzoyl -
imidazole is present in Figures 12 (a,b) at 168. 7 ppm but rapidly
hydrolyses. The most significant resonance observable in these
spectra and not found in any of the control experiments is the rather
broad resonance at 196. 0 ppm. A two-fold vertical expansion of
this signal is shown above each spectrum. The time-course shows
the disappearance, of this broad (25 + 5 Hz) resonance.
The resonance at 196. 0 ppm is characteristic of thioesters
(see Table 6 ) and is assigned to the formation of benzoylpapain
by the following scheme:
O _ Papain-S + Ph- N'Y'NH H
.\=J - 168. 7 ppm
• - 13C-label
O HO Papain-S-C-Ph 2
• Papain-S
l96.OppM + 0
PhC-OH
173. lppm
This provides the first unequivocable evidence that a transient
thioacyl papain is formed as an intermediate.
The signal-to-noise ratioôf the thiobenzoyl signal at 196.0,
ppm is not large enough to accurately determine its half-life. The
signal-to-noise ratio in Figure 12 (a) is approximately 4 : 1. At
this ratio, the signal should not be visible after two half-lives, i. e.

127
after 192 minutes (from the thiolate assays determined by UV,
/2 = 96 minutes). This is in good agreement with the time-
course spectra shown in Figure 12 where there is little or no
signal observable after 186 minutes. These results show the
correspondence between the signal due to benzoyl-papain in the
13C-NMR experiment and the amount of acylated enzyme calculated
from the thiolate titration of the same mixture.
The broad (25 ± 5 Hz) thioester resonance can be compared
to the resonance of benzoic acid in the same spectrum which has
a linewidth of 5 Hz. Oldfield et al. ( 1975á) calculated the linewidths
(Lw) for the non-protonated carbons of horse heart cytochrome c
(MW12300, LW0.49 Hz), hen egg-white lysozyme (MW14300,
LWO. 55 Hz), and human adult haemoglobin (Mw=64 500, LW1. 1 Hz),
from the relaxation times for these resonances. These determinations
were made at a field strength of 15. 2 MHZ in water at 360C. The
relaxation times and linewidths are related to the size of the protein
molecule because of the increased rotational correlation times
(TR) of larger molecules. Non-protonated carbons in papain
(MW23406) therefore should have a linewidth between 0. 5 and 1 Hz
if measured under these same conditions.
Many factors can influence the width of spectral lines.
Instrumental broadening places a lower limit on the linewidth
obtainable for a certain spectrometer. As a comparison to the
results above, at 250C in 100% water, the linewidth of the benzoic
acid carbonyl resonance was measured as 1. 1 Hz in a spinning
sample and 2. 5 Hz in a non-spinning sample at 75.47 MHz. Spinning
the sample reduces instrumental broadening due to magnetic-field
inhomogeneity. Placing the sample in aqueous-DMSO solvent and
lowering the temperature increased the benzoic acid linewidth from
2. 5 to 5 Hz in non-spinning samples. Low molecular weight com-
pounds such as benzoic acid would be expected to have a much
narrower linewidth than the enzyme-bound benzoyl group. The
linewidth of the thioester should then be > 5 Hz.

128
According to the theoretical calculations of Norton et al.
(1977), the linewidth of non-protonated carbons in a high magnetic
field should be dominated by the contribution from CSA. This
contribution is again dependent on the rotational correlation time
which for papain should be between 19 and 49 nsec. (Oldfild, 1975a;
see also discussion in Ac-Phe-Glycinal section). For a rotational
correlation time in this range, the linewidth should be around 10 Hz
at a field strength of 75.47 MHz. Add to this, the effect of lowering
the temperature in aqueous-DMSO solutions and not spinning the
samples, and a 25 Hz linewidth does not seem unusually broad. Line-
broadening to this extent can be expected for non-protonated carbons
of bound substrates and inhibitors at low temperature.
After the time-course experiment was completed (18 h at
40C), the sample was diluted four times, the low molecular weight
material was removedby gel-filtration at room temperature, and
the papain solution was reconcentrated. Thiol titration showed no
loss of the original reactive thiolate (72%). DMSO was added to the
sample and the 3C-NMR spectrum was accumulated for a long
period of 200000 scans (Figure 13 (a)). This improves the sensi-
tivity of this spectrum approximately five-fold over the time-course
spectra shown in Figure 12. Formate was not added to this sample
in order to get an unobscured view of the carbonyl region. Two
additional resonances at 168. 7 and 169. 1 ppm are immediately
apparent. The spectrum of papain itself (Figure 13 (b)) was sub-
tracted to give the difference spectrum shown in Figure 13 (c). The
difference spectrum clearly shows the two resonances which appear
in the region characteristic of amide and ester carbonyl signals. By
analogy with the acylation of trypsin with N-acetylimidazole (Houston
and Walsh, 1970), these resonances may be assigned to non-specific
benzoylation of the O-' of tyrosine and N€ of lysine residues.
The papain used in this experiment was determined to have
0. 72 thiol/mole of protein. The preparation used was subjected to
covalent gel chromatography (Brocklehurst et al. , 1973) but difficulties
Figure 13 . a) 0.852 mM papain (0. 614 mM SH), 25% DMSO-d6 , 7. 5 mM KC1, pH5. 9
at 200C. Low power noise decoupled spectrum. NS = 200000.
2. 3 mM papain (1. 66 mM SH), 25 % DMSO-d6 , 7.5 mM KC1, pH6. 6
at 00C. Low power noise decoupled spectrum. NS = 180000.
Difference spectrum (a)-(b).
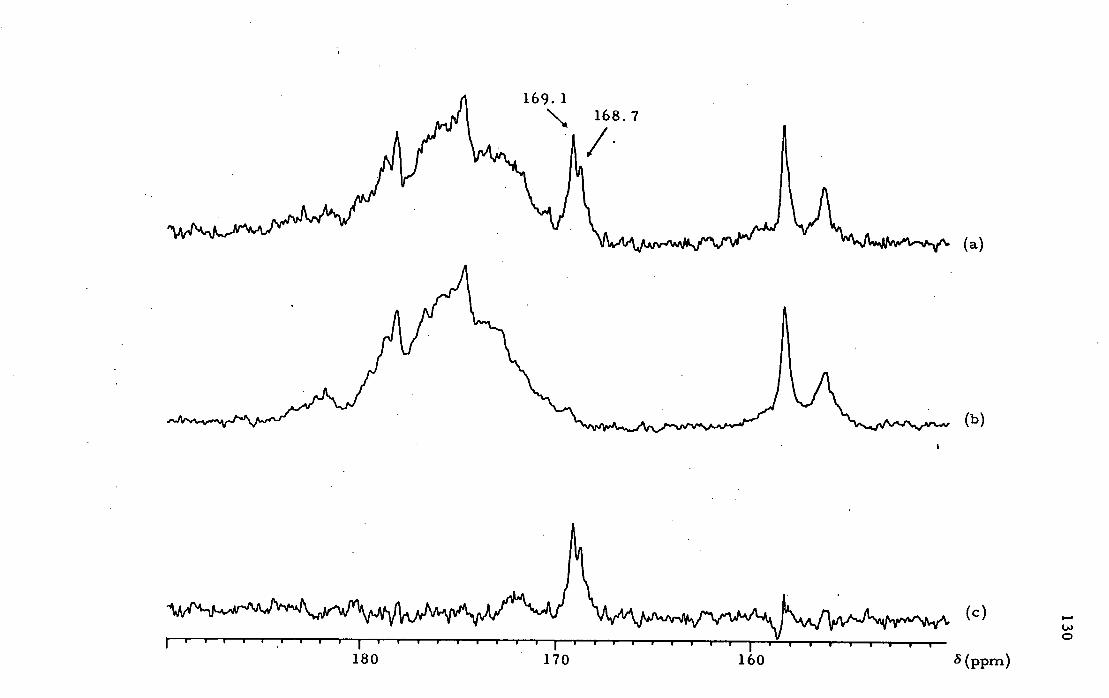
169. 1 168.7
*1
-
0
180 170 160 8(ppm)

131
with the procedure did not increase the purity of the enzyme over
that obtained from the salt- pr ec ipitation procedure (Baines and
Brocklehurst, 1979). No contaminating thiol containing proteins
were present since the 2-PDS titration at pH 4 and 8 both showed
0. 72 thiol/mole.
These results provide unambiguous evidence for detection
of a thioacyl intermediate in the reaction of papain with N-benzoyl-
imidazole. Normally, this transient intermediate would be undetect-
able by 13C-NMR at room temperature and appropriate techniques
had to be developed in order to successfully observe this resonance. 13
C-NMR was also shown to be particularly well suited to observing
non-specific acylation. This series of experiments demonstrated
the feasibility of using low-temperature techniques combined with
13C-NMR to provide important structural information on enzyme-
bound intermediates.

132
apain and Nacetyl-L-pheny1a1anylglyCiflal
There is considerable indirect evidence for formation of a
tetrahedral intermediate in the reactions catalysed by the proteolytic
enzymes (see introduction). Direct evidence for such an intermediate
is not abundant and the interpretation of the cryoenzymological
results of Fink and co-workers with the serine proteases (Fink, and
Meehan, 1979; Compton and Fink;1980) and possibly with papain
(Angelides and Fink, 1979 a, b) must be viewed with some caution
in light of the results of Markley et al. (1981). Asb6th and Polg.r
(1983) suggested that stabilization of an oxyanion THI is important
with the serine proteases but is absent or is not significant with
the thiol proteases. Whether a distinct THI exists at high concentration
or is present only at very low steady-state concentrations also has
not been established.
By synthesizing substrate analogues which form transition-
state-like structures with enzymes, Wolf enden and coworkers
have obtained valuable information on the possible structures of
enzyme-bound intermediates (Wolfenden, 1972). Wolf enden
proposes that if papain catalysis proceeds through the stabilization
of tetrahedral intermediates, then the stability of analogues
resembling these intermediates should be enhance.d (Westerik and
Wolfenden, 1972). The reversible inhibition of papain by aldehydes
is thought to occur through stabilization of a hemithioacetal formed
between the thiol and the aldehydic carbonyl (Westerik and Wolfenden,
1972; Lewis and Wolfenden, 1977 b; Mattis et al., 1977; Bendall et al.
1977; Frankfater and Kuppy,
O - o_ E-S
R-C-H ____ R-C-H
it HO E-S
OH 2 R-C-H
OH
Hydrate -
1981).
OH - R-C-H
E-
Hemithioac etal
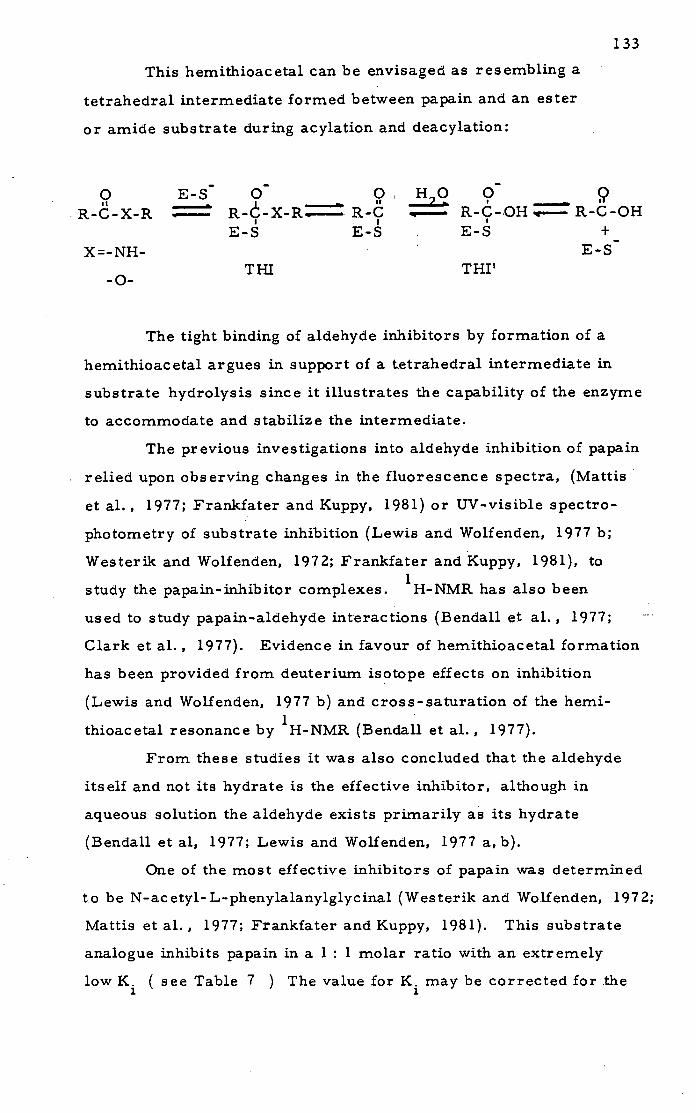
133
This hemithioacetal can be envisaged as resembling a
tetrahedral intermediate formed between papain and an ester
or amide substrate during acylation and deacylation:
0 E-S 0 0., HO 0 0 It ______ - U - SI
R-C-X-R - R--X-R- R-c -. R-ç-.oH R-C-OH
E-S E-S E-S + X=-NH- E-S
Tm THI' -0-
The tight binding of aldehyde inhibitors by formation of a
hernithioacetal argues in support of a tetrahedral intermediate in
substrate hydrolysis since it illustrates the capability of the enzyme
to accommodate and stabilize the intermediate.
The previous investigations into aldehyde inhibition of papain
relied upon observing changes in the fluorescence spectra, (Mattis
et al., 1977; Frankfater and Kuppy, 1981) or tJV-visible spectro-
photometry of substrate inhibition (Lewis and Wolfenden, 1977 b;
Westerik and Wolfenden, 1972; Frankfater and Kuppy, 1981), to
study the papain-inhibitor complexes. ' H-NMR has also been
used to study papain-aldehyde interactions (Bendall et al., 1977;
Clark et al., 1977). Evidence in favour of hemithioacetal formation
has been provided from deuterium isotope effects on inhibition
(Lewis and Wolfenden, 1977 b) and cross-saturation of the hemi-
thioacetal resonance by 1 H-NMR (Bendall et al., 1977).
From these studies it was also concluded that the aldehyde
itself and not its hydrate is the effective inhibitor, although in
aqueous solution the aldehyde exists primarily as its hydrate
(Bendall et al, 1977; Lewis and Wolfenden, 1977 a,b).
One of the most effective inhibitors of papain was determined
t.o be N-acetyl-L-phenylalanylglycinal (Westerik and Wolfenden, 1972;
Mattis et al., 1977; Frankfater and Kuppy, 1981). This substrate
analogue inhibits papain in a 1: 1 molar ratio with an extremely
low K. ( see Table 7 ) The value for K. may be corrected for the
134
fraction of aldehyde (and not hydrate) in solution. Because of the
low inhibition constant for N-ac etyl- L-phenylalanylglycinal, the
methods of Henderson (1972) and Morrison (1969) must be used to
estimate K. and the stoichiometry of inhibition. These methods are
used with tightly bound inhibitors where Michaelis-Menten kinetics
may not be valid.
The stoichiometry and inhibition constant were obtained
and compared to the results of previous investigations (Table 7 ).
These results agree well with earlier findings and the 1:1 stoichi-
ometry of the inhibition was also confirmed.
Table 7
Reference
Westerik and Wolfenden (1972)
Lewis and Wolfenden (1977 b)
Mattis et al. (1977)
K. (M) pH
4.6x10 8 Totalaldehyde 5.5
5. 2 x 10 Corrected for hydrate 5. 5
1.0 x 10 8 Total aldehyde 6. 5
Frankfater and Kuppy 8. 3 x Corrected for hydrate 6. 5 (1981)
This work 1.0 x 10⁸ Total aldehyde 7.0
13C-NMR spectroscopy should enable direct observation
of the inhibitor-enzyme complex and provide information on the
mechanism of inhibition. Formation of a tetrahedrally substituted
carbon should be readily observed by 13C-NMR. The results of
Rich et al. (1982), and Maithouse et al. (1983) illustrate the potential
of 13C-NMR when studying the inhibition of serine proteases with
ketone inhibitors. Covalent attachment of the sulphur of Cys-25
to the 13
C-enriched aldehyde carbonyl to form a hemithioacetal
should directly confirm the nature of the inhibition. If the aldehyde
or hydrate inhibits papain by non-covalent binding in the active-site,

135
only a small shift in the resonances would be expected since bonds
directly attached to the enriched carbon remain intact.
The reaction of N- acetyl-L-cysteine with N-Acetyl-L-
phenylalanyl-[1-13 C]-glycinal was first studied as a model system by
13C-NMR spectroscopy. From the equilibrium constants of thiol-
aldehyde reactions studied by UV (K=4-40 M 1 ), an excess of
aldehyde or thiol is needed for significant amounts of hemithioacetal
to be formed (Lienhard and Jencks, 1966; Kanchuger and Byers,
1979).
The 13C-labelled aldehyde was provided as its more stable
dimethyl acetal since free aldehydes are susceptible to polymerization
and/or condensation when at high concentration. The dimethyl
acetal itself is acid labile and was hydrolysed to the aldehyde in
0. 2 M HCl and the reaction was followed by 13C-NMR. Figure 14 (a)
shows the resonances of the dimethyl acetal at 102. 4 ppm and the
aldehyde hydrate at 88. 2 ppm. After hydrolysis is complete ("-5 h),
a single large resonance due to the hydrate was detected (Figure 14(c)).
Below each spectrum are the proton coupled spectrum of the acetal
(Figure 14 (b)), and the hydrate (Figure 14(d)). The 13CH
coupling constant for the acetal is 167 Hz, and for the hydrate,
164 Hz.
C- H The natural-abundance proton-decoupled spectrum of
N-acetyl-L-cysteine is shown in Figure 15(f). Figure 15(a)
shows the hydrate resonance at pH 2 as in Figure 14 (c). Five
resonances are clearly visible and assignable to each carbon atom
on the basis of analysis of the proton-coupled spectrum (not shown).
Adding approximately equimolar N-acetyl-L-cysteine to the aldehyde
solution at low pH did not change the position of the hydrate resonance
nor was any new signal detectable (Figure 15(b)). Adjusting the pH
to 7 did not change the spectrum (Figure 15(c)). Addition of a
large excess of N-acetyl-L-cysteine resulted in the appearance of a
broad resonance at 75. 7 ppm along with the natural-abundance
resonances of N-acetyl-L-cysteine at 56. 6, 26. 3, and 21. 9 ppm
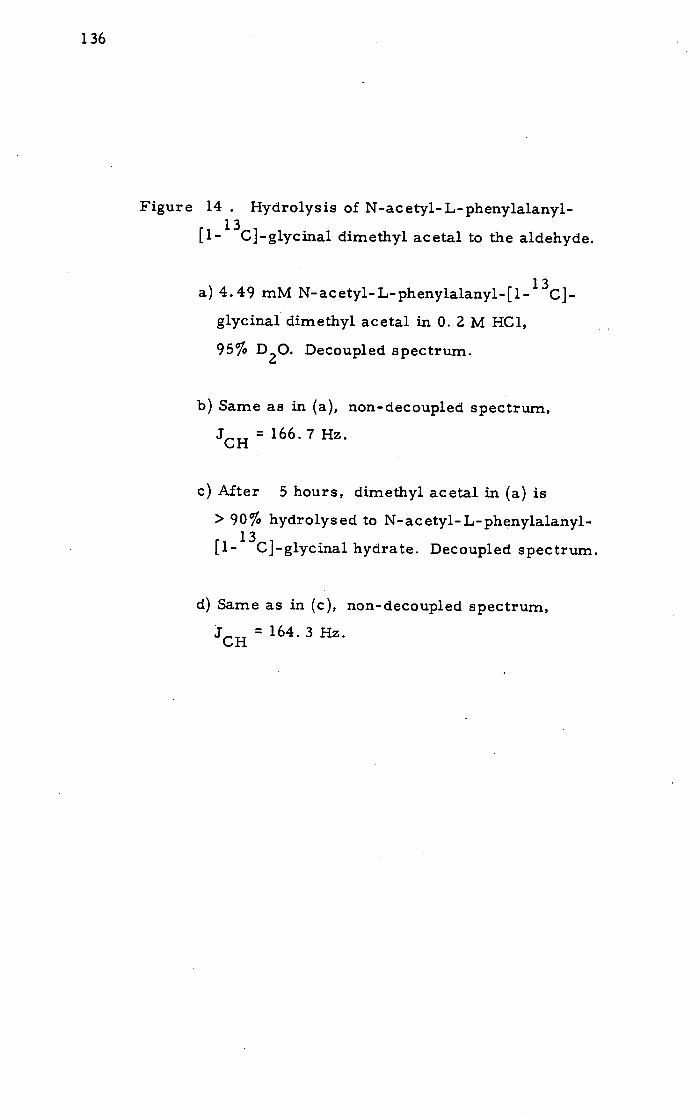
Figure 14 . Hydrolysis of N-acetyl-L-phenylalanyl-
[1 3C]-glycina1 dimethyl acetal to the aldehyde.
4.49 mM Nacety1L_phenylalanyl[1) 3CJ_
glycinal dimethyl acetal in 0. 2 M HC1,
95% D 20. Decoupled spectrum.
Same as in (a), non-decoupled spectrum,
CH = 166. 7 Hz.
Alter 5 hours, dimethyl acetal in (a) is
> 90% hydrolys ed to N-ac etyl- L- phenylalanyl-
[1- 13C]-glycinal hydrate. Decoupled spectrum.
Same as in (c), non-decoupled spectrum,
CH = 164. 3 Hz.
136
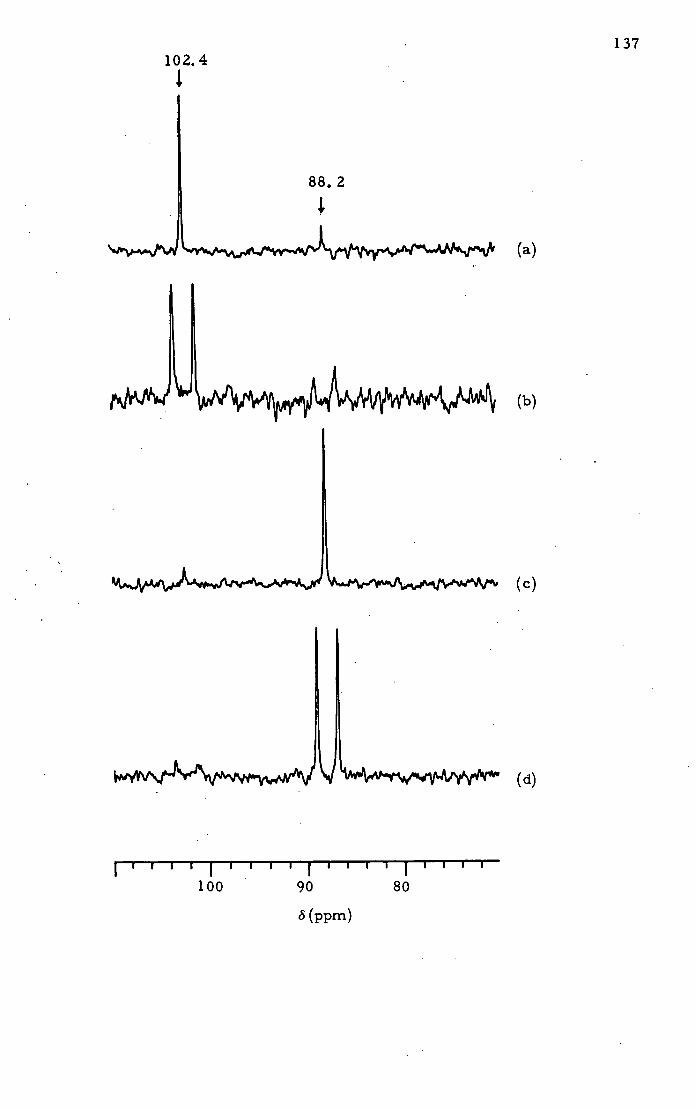
102.4
1
137
(d)
I I I I I I I I I I I I I I I•I 100 90 80
8(ppm)

138
(Figure 15(d)). The pH was then lowered and two sharp resonances
at 75.8 and 76. 9 ppm were observed (Figure lS(e)). These are in
the region predicted for a hemithioacetal carbon. The hemithioacetal
resonances should be upfield from the hydrate resonance in view of
the smaller a-effect of sulphur as compared to oxygen. Since sulphur
is less electronegative than oxygen, there is less deshielding of the
attached carbon and therefore the resonance of a sulphur substituted
tetrahedral carbon is at higher field than a similar oxygen containing
compound (Stothers, 1972; Breitmaier. and Voelter, 1978)
The fact that two hemithioacetal resonances are observed in
this experiment is predictable because of the two configurations
which are possible when an aldehyde, with two pro-chiral faces,
undergoes nucleophilic addition:
OH 0 OH
C - C tflQfl)}j.
R/
I re_face)si_face
R
R-hemithioacetal I S-hemithioacetal
The sulphur atom of the thiol is able to add either to the "re"
or "si" face (Hanson, 1966) of the aldehyde producing either and R-
or S-hemithioacetal respectively. When the thiol is an achiral molecule,
two enantiomers are formed The enantiomers are indistinguishable
by 13C-NMR (in achiral solvents) since the tetrahedral carbon is in
the same environment in both (Raban and Mislow, 1967). This is
illustrated by the single chemical chift observed for the hemithioacetal
formed between N-acetyl-L-phenylalanyl-[1-13 C]- glycinal and the
achiral thiol 2-mercaptoethanol ( 6 73. 3 ppm; Primrose et al.,
With a chiral group such as N-acetyl-L-(S)-cysteine, 2 diastereoisorners

Figure 15 . Model experiment; reaction of N-acetyl-
L-cysteine with N-acetyl-L-phenylalanyl- 13
[1- C]-glycinal. Decoupled spectra.
Same as in Figure 14 (c).
3.74 mM
glycinal as in (a) with 3. 0 mM N-acetyl-L-
cysteine, pH 2, 80% D 20.
3. 21 mM 13
C-labelled aldehyde with 2.6 mM
N-acetyl-L-cysteine, 7 mM phosphate, pH 7. 1,
70% D 20.
2.81 mM 13C-labelled aldehyde with 27 mM
N-ac etyl-L-cysteine, 6 mM phosphate, pH 7. 3,
60% D 20.
Same as in (d), adjusted to pH 3. 7.
32 mM N-acetyl-L-cysteine, 90% .D 20, 7 mM
phosphate, pH 3. 7.
139

IYAOIA
56.6 26.3 21.9
140
76.9 75.8 N I..
(e)
(1)
150 100 50
cS(ppm)
141
are formed; R-hemithioac etal- S-cysteine, and S-hemithioac etal-
S-cysteine. In this case, the carbons are non-equivalent and two
resonances are observable. This approach has been used to detect
mixtures of enantiomers by NMR (Raban and Mislow, 1967).
The effect of pH on the intensity of the hemithioacetal signals
(Figure 15(d) and (e)), can be explained by the effect of pH on the
formation and breakdown of hemithioacetals. Jencks and co-workers
have shown that the equilibrium constants (K he mi ) for formation of
a hemithioacetal are pH independent (Lienhard and Jencks, 1966;
Gilbert and Jencks, 1977).
K hemi
[Hemithioac etal]
[Thio] [TJnhydrated aldehyde]
(32)
For thiols such as N-ac etyl-L-cysteine (PK a = 9. 52, Friedman
et al., 1965), the addition of thiolate to aldehyde may be represented
by the following equilibria (Gilbert and Jencks, 1977).
R' k 1 [RS] - R-s-ç-o
H H k 1
kh[H20]
k h[OH]
R-s-ç-o-H H
For the wide range of thiols studied by Jencks and co-workers,
the pH independent rate constants k 1 and kh are large and are not
the rate limiting steps in formation and breakdown of the hemithio-
acetals at the pH values used. The rate constants k 1 and k_h are
also pH independent but both steps rely upon reactants with pH
dependent concentrations. These steps are the rate determining
steps in formation and breakdown of the hemithioacetal. Since data
is not available for the hemithioacetal formed between N-acetyl-L-
cysteine and N-acetyl-L-phenylalanylglycinal, a reasonable estimate
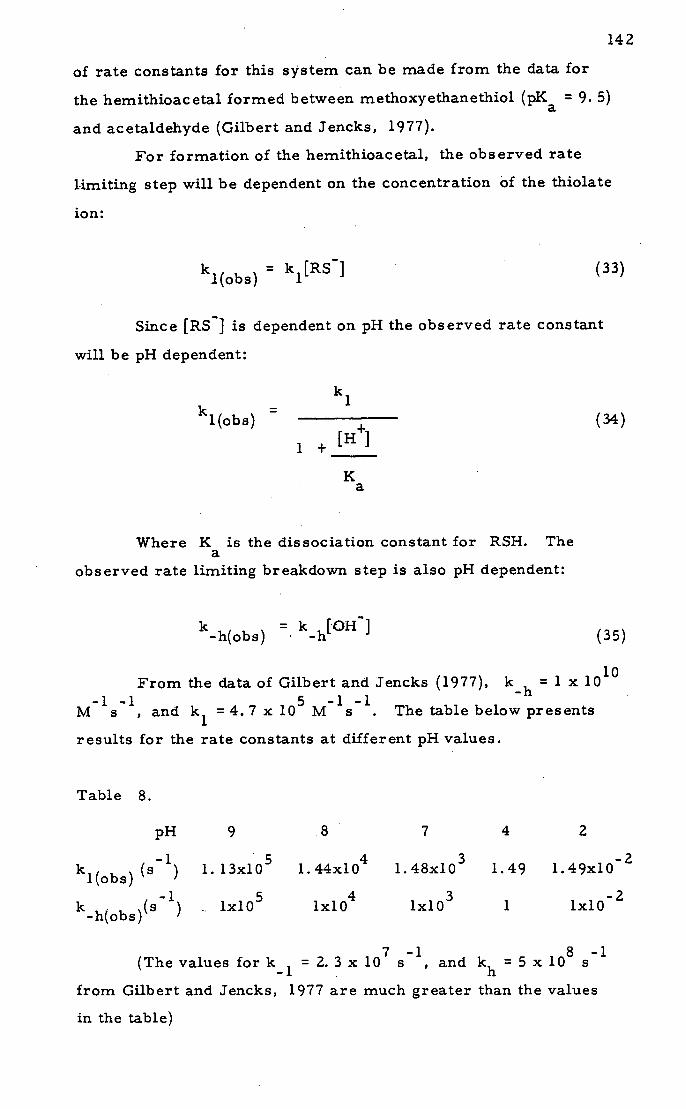
142
of rate constants for this system can be made from the data for
the hemithioacetal formed between methoxyethanethiol (pK =9.5)
and acetaldehyde (Gilbert and Jencks, 1977).
For formation of the hemithioacetal, the observed rate
1-imiting step will be dependent on the concentration of the thiolate
ion:
kl(b) = k 1 [RS]
(33)
Since [RS] is dependent on pH the observed rate constant
will be pH dependent:
k 1
= _______ (34)
K a
Where K is the dissociation constant for RSH. The a
observed rate limiting breakdown step is also pH dependent:
kh(b) =, k[OH] (35)
From the data of Gilbert and Jencks (1977), k_h = 1 x 10 10
M 1 s 1 , and k 1 = 4.7 x 10 M 1 s 1 . The table below presents
results for the rate constants at different pH values.
Table 8.
pH 9 8 7 4 2
kl(b) (1)
1. 13x10 5 1.44x10⁴ 1.48x10 3 1.49 1.49x10 2
1x10 5 1x10⁴ 1x10 3 1 lxlO 2
(The values for k 1 = 2.3 x 10 7 s 1 , and kh = 5 x 10 8 s '
from Gilbert and Jencks, 1977 are much greater than the values
in the table)
143
In order to distinguish two distinct resonances in an NMR
spectrum the difference in chemical shift (in Hz) between the two
species must be much greater than the rate constant for exchange
between the two (Breitmaier. and Voelter, 1978)
1'aldehyde - " hem >> k
ithioacetal exchange (36)
For the aldehyde (o = 200.9 ppm = 15150 Hz), and the
hemithioacetals ( 6 "74 ppm = 5580 Hz) and the difference is
9500 Hz. Between pH 7 and 8 the observed rate constants for
formation and breakdown are of the order 1000 to 14000 s.
In
this pH region, the rates of exchange are too fast for detection of
sharp resonances and instead a broadening of the resonances results
(Figure 15(d)). On lowering the pH to less than 4, the rate constants
are well below the limit for 13
C-NMR observation of sharp resonances
(Figure 15(e)). It must be emphasized that the equilibrium constant
(K .) remains the same at pH 7 and 4, but the rate of exchange hemi - 13
is beyond the detectable rangefor C-.NMR at the higher pH. The
rate constants here are also estimates and may be slightly different
for N-ac etyl- L-cysteine and N-ac etyl- L-phenylalanylglycinal.
The proton-decoupled spectrum of papainis shown in Figure
16 (b) below the decoupled spectrum of N-acetyl-L-phenylalanyl-
[1- 13C}-glycinal (Figure 16 (a)). A small amount of the aldehyde
was added to the papain solution to give a 3-fold excess of protein.
The 3C-NMR spectrum (Figure 16 (c)) shows a weak, broad
resonance near 74 ppm and the notable absence of the aldehyde
hydrate resonance at 88. 2 ppm. Additionof more N-acetyl-L-
phenylalanyl-[1-13 glycinal to bring its conc entration approximately
equimolar with papain resulted in the appearance of a strong, broad
resonance at 74. 7 ppm (Figure 16 (d)). Also observable is a small
peak at 102.4 ppm corresponding to the quaternary carbon of the
unhydrolysed dimethyl acetal. A third addition of labelled inhibitor

Figure 16 . Inhibition of Papain with N-Acetyl-L-Phenylalanyl-[1- 13C]-glycinal
Decoupled spectra.
3.41 mM N-ac etyl- L-phenylalanyl-[l - 13c]- glycinal in 10 mM phosphate
80% D20, NS = 1000, pH 7. 1.
0.936 mM Papain (1.04 mM protein), 10 mM phosphate, 10% D 2 0
pH 7. 1, NS = 5000 (Spectra (c) to (e) have the same NS )
c)First addition of aldehyde. 0. 851 mM papain ( 0. 945 mM protein), 0. 280 mM
N-acetyl-L-phenylalanyl-[1- 13C]-glycinal, 10 mM phosphate;16% D 20, pH 7. 1
Second addition of aldehyde. 0. 720 mM papain (0. 800 mM protein), 0. 710 mM
13C-labelled aldehyde, 10 mM phosphate, 26% D 20, pH 7. 1
Third addition of aldehyde. 0. 624 mM papain, 1. 76 mM 13C-labelled aldehyde,
10 mM phosphate, 33% D 2 0, pH 7. 1.
I-
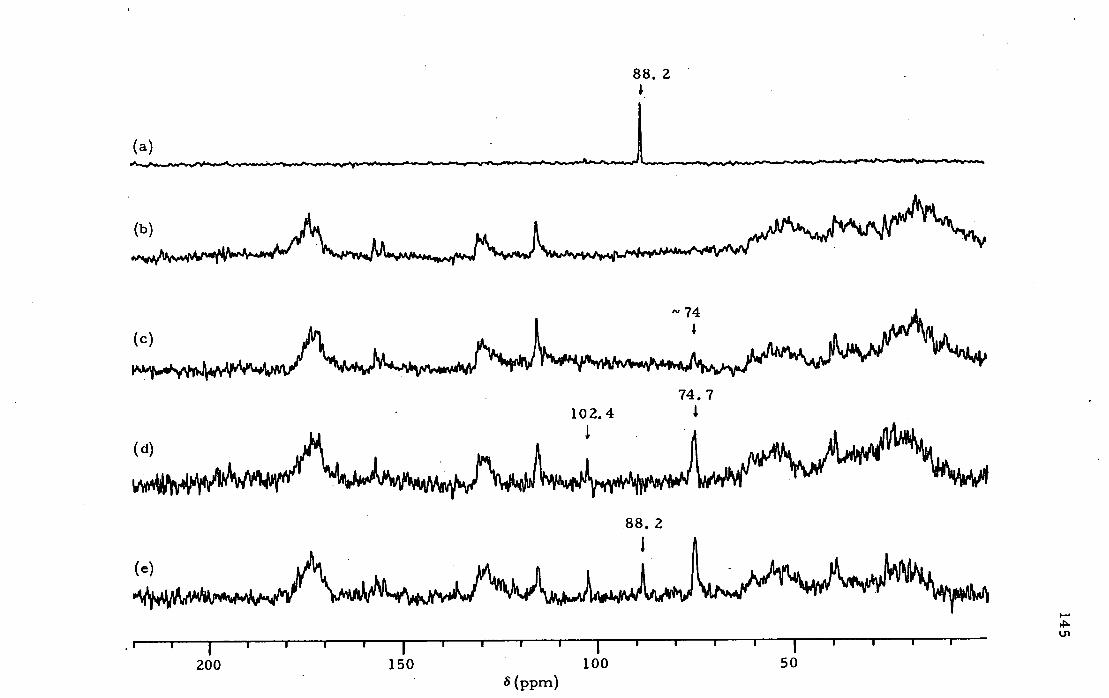
88. 2 4
1' 74 4
74.7 102.4 4
200 150 100 50 8(ppm)
Ui
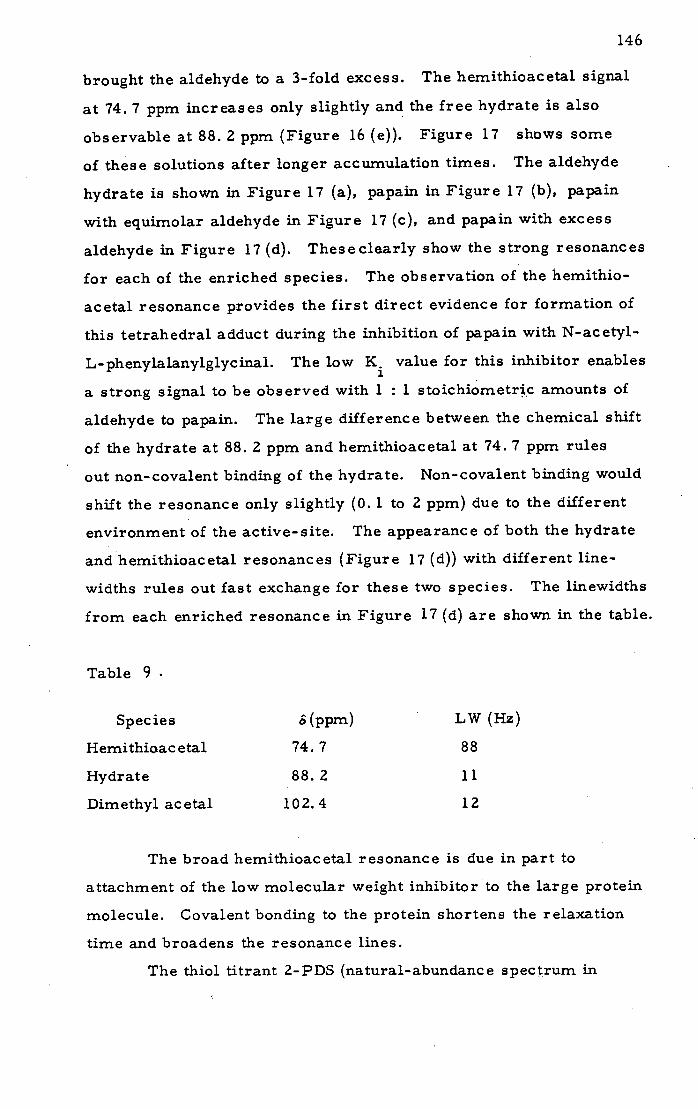
146
brought the aldehyde to a 3-fold excess. The hemithioacetal signal
at 74. 7 ppm increases only slightly and the free hydrate is also
observable at 88. 2 ppm (Figure 16 (e)). Figure 17 shows some
of these solutions after longer accumulation times. The aldehyde
hydrate is shown in Figure 17 (a), papain in Figure 17 (b), papain
with equimolar aldehyde in Figure 17 (c), and papain with excess
aldehyde in Figure 17(d). These clearly show the strong resonances
for each of the enriched species. The observation of the hemithio-
acetal resonance provides the first direct evidence for formation of
this tetrahedral adduct during the inhibition of papain with N-ac etyl-
L-phenylalanylglycinal. The low K. value for this inhibitor enables
a strong signal to be observed with 1 : 1 stoichiometrc amounts of
aldehyde to papain. The large difference between the chemical shift
of the hydrate at 88. 2 ppm and hemithioacetal at 74. 7 ppm rules
out non-covalent binding of the hydrate. Non-covalent binding would
shift the resonance only slightly (0. 1 to 2 ppm) due to the different
environment of the active-site. The appearance of both the hydrate
and hemithioacetal resonances (Figure 17 (d)) with different line-
widths rules out fast exchange for these two species. The linewidths
from each enriched resonance in Figure 17 (d) are shown in the table.
Table 9
Species 6(ppm) LW(Hz)
Hemithioacetal 74.7 88
Hydrate 88.2 11
Dimethyl acetal 102.4 12
The broad hemithioacetal resonance is due in part to
attachment of the low molecular weight inhibitor to the large protein
molecule. Covalent bonding to the protein shortens the relaxation
time and broadens the resonance lines.
The thiol titrant 2-PDS (natural-abundance spectrum in
I-
-J
Figure 17 . Enzyme aldehyde experiment, longer accumulations, improved signal-to-noise
in each spectrum.
Same as in Figure 16 (a)
Same sample as in Figure 16 (b), NS = 29000
Same sample as in Figure 16 (c), NS = 29000
Same sample as in Figure 16 (d), NS = 32000
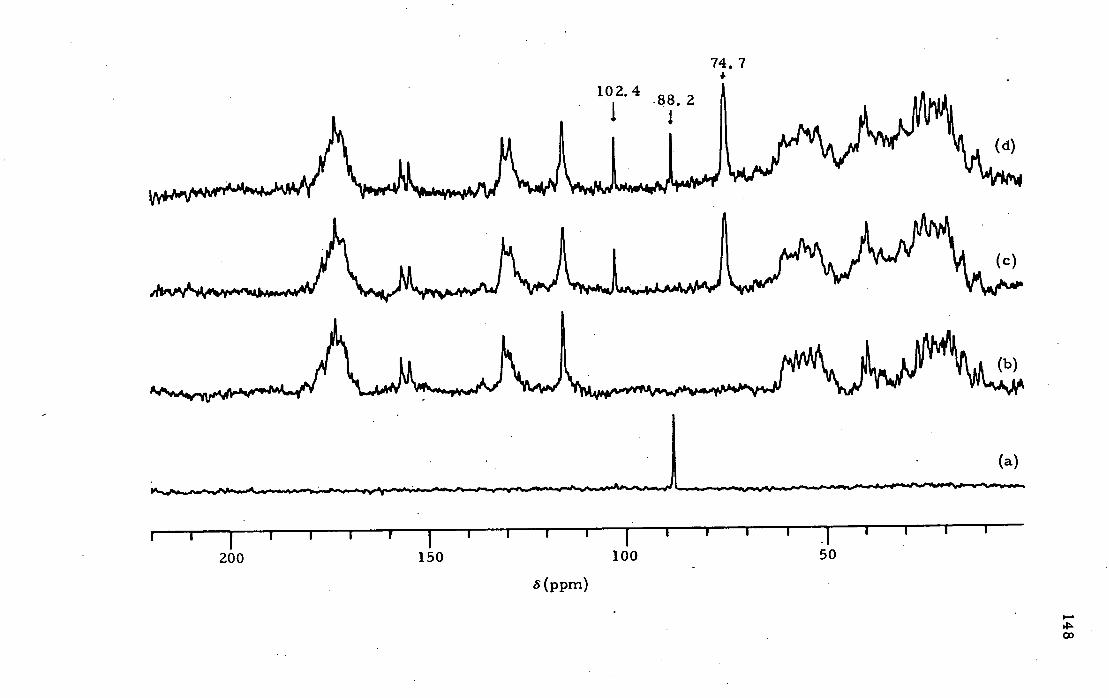
74. 7
102.4 .88.
(d)
(c)
(b)
(a)
I I I I I I I I I I I I I
200 150 100 50
o(ppm)
00

149
Figure 18(b)) was then added to the papain-inhibitor mixture
(shown again in Figure 18 (a)). This titTant rapidly reacts with
free thiol and prevents formation of the hemithioacetal by the
reversible aldehyde inhibitor. The addition at pH 7 results in
a dramatic increase in the free hydrate resonance at 88. 2 ppm.
There is also asignificant amount of the hemithioacetal present but
the linewidth of the resonance decreased to 52 Hz. (Figure 18 (c)).
By comparison, the linewidths of the hydrate and dimethyl acetal
resonances in Figure 18 (a) and (c) remain approximately the
same. After 48 hours., the spectrum remains the same and only
upon changing to pH 4 is most of the hemithioacetal signal eliminated
(Figure 18(d)). The intensity of the free hydrate signal in Figure
18 (d) shows the effect of line broadening on the resonances. Also
apparent in the spectrum is the free unhydrated aldehyde at 200. 9
ppm. This resonance is not observed in the spectra with the hemi-
thioacetal present which is consistent with this species being the
effective inhibitor and/or K hemi hemi
being very large ( K hyd
>> K ).
The ratio of the hydrate to aldehyde (Khyd) is approximately
10 : 1 (estimated from the peak intensities), which agrees with values
obtained earlier for hydration of aldehydes (Lewis and Wolfenden,
1977 a; Bendall et al., 1977). Each species has now been detected
in the experiments and assignments can be made as follows:
OMe dilHCl B-C-H
OMe
102. 4ppm
9 E-S R-C-H
200. 9ppm
1J OH
R-C-H
OH
OH
R ? H
E-S
74. 7 ppm
88. 2ppm

Figure 18 . Addition of 2-PDS to papain-aldehyde mixture
Same as in Figure 17 (d)
Natural abundance spectrum, 1. 37 mM 2, 2'-dipyridyl
disuiphide, 33% D 20, pH 7. 2, NS 44000.
Addition of 2-PDS. As in (a) plus 10 mg 2-PDS,
stirred 1. 5 hours, NS = 42000.
150
d) After 24 hours, adjusted (c) to pH 4. 1, NS = 42000.
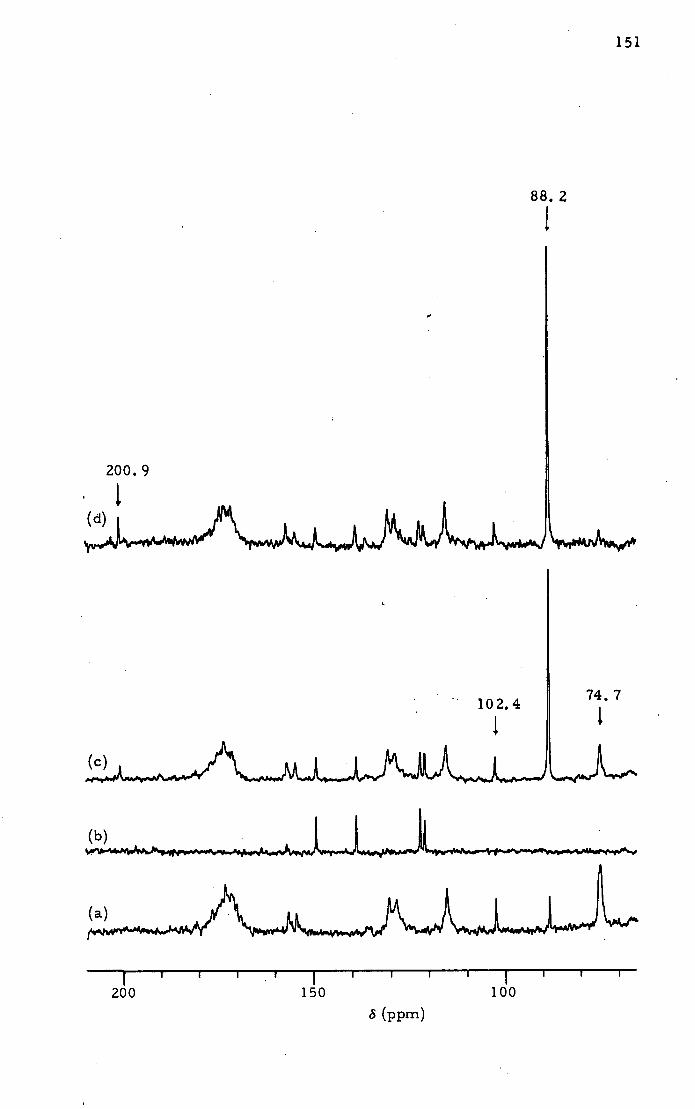
88. 2
(b)
(a)
I I I I I I I I I 200 150 100
S (ppm)
151

152
On closer inspection, the broad hemithioacetal resonance
(LW = 88 Hz) is seen to be split into two resonances at 75. 1 and
74. 7 ppm, separated by 28 Hz (Figure 19 (a)). The proton-coupled
spectra also show similar splitting of the two resonances (Figure
19 (b)). After addition of 2-PDS at pH 7, the upfield resonance
remains at 74. 7 ppm while the resonance at 75. 1 ppm disappears
(Figure 19 (c)). The remaining resonance at 74. 7 ppm has a line-
width of 52 Hz. This resonance is shown in the proton-coupled
spectrum (Figure 19 (d)), and the coupling constant obtained is
160 Hz. This is equivalent to the coupling constant obtained in
Figure 19 (b) for the upfield resonance at 74. 7 ppm. The down-
field resonance at 75. 1 ppm in Figure 19 (a) shows a slightly
different coupling constant of 155 Hz in Figure 19 (b). These
results offer convincing evidence that two hemithioacetal resonances
are present. The broad resonance of 88 Hz is composed of two
resonances of -50 Hz each. Since both resonances are of equal
intensity, and the aldehyde inhibition has been shown to be reversible,
then the equilibrium constants for the two forms of the hemithioacetal
must be similar.
From the model studies, the two forms may result from
the two modes of addition of the papain thiol to the aldehyde. The
sulphur atom is able to add either to the "re " of "Si" face of the
inhibitor showing no preference for either conformation. This
suggests that binding of the inhibitor aldehyde group is not stereo-
specific and that a proposed oxygen binding site for a substrate
carbonyl oxygen (Drenth et al., 1976) does not influence binding
of the inhibitor carbonyl. These results are consistent with the
conclusion of Asb6th and Polgár (1983) in that a specific oxygen•
binding sit.e does not play an important part in papa in- catalys ed
hydrolyse. Different stereochemical considerations may apply
to the binding of specific amide and ester substrates since it has
been determined that the S subsite is specific for non-polar
leaving groups of the substrates (Alecio et al., 1974). The less
Figure 19 . Proton coupled and decoupled spectra of the
hemithioac etal resonances.
Same spectrum as in Figure 17 (d) showing only
the region from 70 to 80 ppm.
Same sample as in (a), non-decoupled, NS = 128000
After addition of 2-PDS at pH 7, as in Figure 18 (c)
Non-decoupled spectrum of the same sample as in (c).
NS = 168000.
153
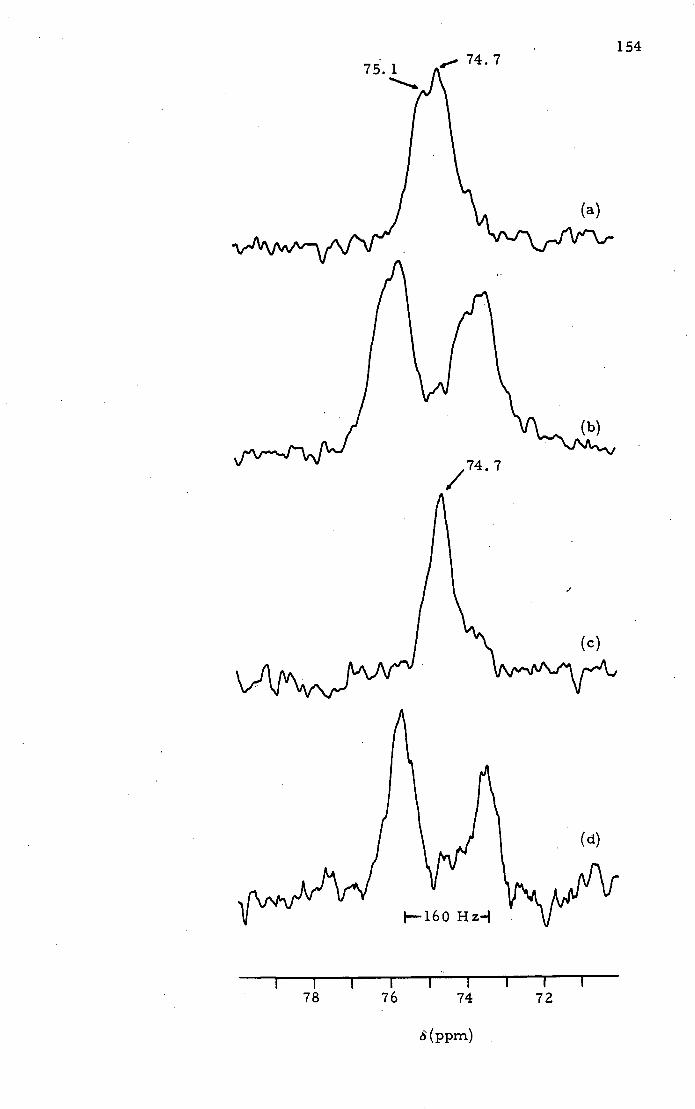
154 A
/ 74.
I I I I I ' I I I
78 76 74 72
8(ppm)
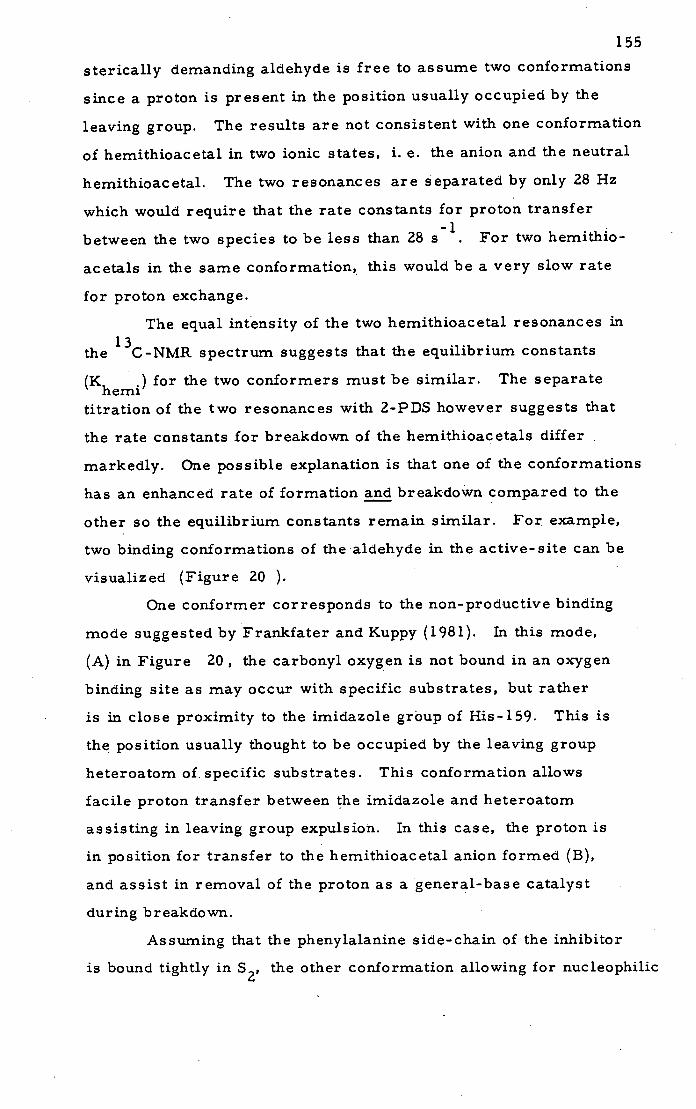
155
sterically demanding aldehyde is free to assume two conformations
since a proton is present in the position usually occupied by the
leaving group. The results are not consistent with one conformation
of hemithioacetal in two ionic states, i. e. the anion and the neutral
hemithioacetal. The two resonances are separated by only 28 Hz
which would require that the rate constants for proton transfer
between the two species to be less than 28 s_ i . For two hemithio-
acetals in the same conformation, this would be a very slow rate
for proton exchange.
The equal intensity of the two hemithioacetal resonances in
the 13C-NMR spectrum suggests that the equilibrium constants
(K hemi ) for the two conformers must be similar. The separate
titration of the two resonances with 2-PDS however suggests that
the rate constants for breakdown of the hemithioacetals differ
markedly. One possible explanation is that one of the conformations
has an enhanced rate of formation and breakdown compared to the
other so the equilibrium constants remain similar. For example,
two binding conformations of the aldehyde in the active-site can be
visualized (Figure 20 ).
One conformer corresponds to the non-productive binding
mode suggested by Frankfater and Kuppy (1981). In this mode,
(A) in Figure 20, the carbonyl oxygen is not bound in an oxygen
binding site as may occur with specific substrates, but rather
is in close proximity to the imidazole group of His-159. This is
the position usually thought to be occupied by the leaving group
heteroatom of. specific substrates. This conformation allows
facile proton transfer between the imidazole and heteroatom
assisting in leaving group expulsion. In this case, the proton is
in position for transfer to the hemithioacetal anion formed (B),
and assist in removal of the proton as a general-base catalyst
during breakdown.
Assuming that the phenylalanine side-chain of the inhibitor
is bound tightly in S 2, the other conformation allowing for nucleophilic
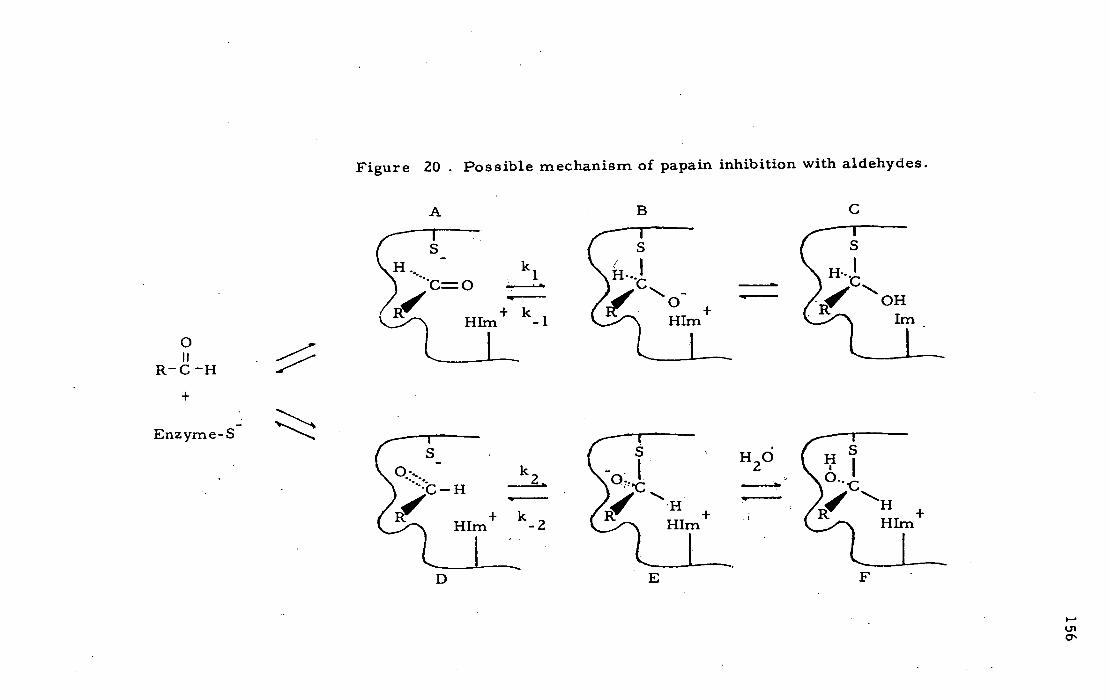
Figure 20 . Possible mechanism of papain inhibition with aldehydes.
HIm
A B
S ( S H.. - k 1
R- C -H
+
Enzyme-S S
O. .. - k 2
RV +k HIm-2
C
(S
),C C>' OH Im
H 2 0
C Im+
IC
E
F
I-.
U' 0'

157
attack on the opposite face of the aldehyde would place the aldehydic
proton near the imidazole (D), and require protonation of the hemi-
thioacetal from the water solvent, (E) to (F) in Figure 20 . This
conformer may have a rate constant for formation much lower than
with (C) but breakdown would also be slower. The two species may
therefore be present in solution in equal amounts (K hemi herni
(C) = K (F))
but the rate constants are unequal (k 1 >> k2, k 1 >> k 2). The
2-PDS may rapidly titrate the conformer with a fast exchange rate
and slowly titrate the other conformer. At low pH (i. e. <4), the
inhibition constants for papain and N-ac etyl- L - phenylalanylglyc inal
increases (Frankfater and Kuppy, 1981) and both conformers
dissociate rapidly.
The results are also consistent with another less likely
mechanism. If both conformations are equally stable and in equi-
librium, the imidazole may be able to adopt two conformations
to stabilize both modes of inhibiton. This would resemble the
UP-DOWN transitions suggested by Angelides and Fthk (1978)
for substrate binding. The 2-PDS results could then be ration-
alized by binding of 2-PDS at the active-site which enhances the
stability of one conformer.
The two hemithioacetal signals do not result from the
presence of denatured enzyme in the solution. At the completion
of the 13C-NMR experiments, the 2-PDS blocked papain-aldehyde
solution was subjected to gel-filtration to remove the aldehyde
and excess 2-PDS present. The protein concentration was
determined at pH 8. 2 and excess cysteine was added to reactivate
the enzyme. The reactivation unblocks the enzyme and liberates
2-thiopyridone. From this experiment it was determined that
> 90% of the active enzyme was blocked with 2-PDS. The reactivated
enzyme showed no loss of activity to Na-CBZ-glycine-p-nitrophenyl
ester at pH 5.
The 13C-NMR results may be compared to the 1 H-NMR
results of Bendall et al. (1977). In particular, the coupling constants,
158
1 obtained by these authors between the aldehydic proton C-H 13
and a C-enriched aldehyde should be directly comparable.
The aldehyde signal in Figure 17 (d) has a coupling constant of
183 Hz as compared to the aldehyde coupling determined by Bendall
et al. (1977) where it was measured as 182 Hz. The aldehyde hydrate
signal is split by 164 Hz compared to the hydrate in the previous
study ol 165 Hz. Bendall et al. (1977) reported the splitting of the
hemithioacetal signal as 173 Hz. The substitution of a sulphur
for an oxygen atom should however decrease the splitting because
of the lower electronegativity of the sulphur (Stothers, 1972;
Breitmaier. and Voelter, 1978). The.hemithioaceta.1 signal should therefore
have a smaller splitting than that of the hydrate which is consistent
with the result obtained, J 13 1 (hemithioacetals) = 160, 155 Hz.
The results of Bendall et al. C H (1977) may be rationalized by the
fact that they did not directly observe the hemithioacetal splitting,
but estimated it from cross-saturation experiment. By applying
a second radio-frequency in the region expected for a hemithioacetal
proton (which they could not observe), they cross-saturated the
resonance of the unbound aldehyde which they could observe. In
this way they obtained a reasonable, but not accurate, estimate of
the hemithioacetal coupling. More accurate results are obtained
in directly measuring this splitting by 13C-NMR. The ' H-NMR
technique also suffers from resolution problems. The 28 Hz (0.4 ppm)
difference between , the hemithioacetal signals observed in the
NMR spectrum would be more difficult to resolve in the 1 H-NMR
spectrum where this same difference corresponds to a separation of
0. 1 ppm. This resolution problem would also contribute to errors
in the estimate of the hemithioacetal coupling since two peaks would
appear as one. The 13C-NMR spectrum of the hemithioacetal offers
a far more accurate picture of hemithioacetal formation and provides
much more information about the conformation and moleculat
events occurring during inhibition.
The broad hemithioacetal resonances at 74. 7 and 75. 1 ppm

159
have been shown to have a linewidth of 50 Hz. This can be
compared to the hemiketal formed with trypsin and a chioro-
methyl ketone which has a linewidth of ..9 Hz (Maithouse et al.
1983). Protonated carbons are expected to have broader resonance
lines due to the decrease in the relaxation time caused by the attached
proton. The 13C- 1 H dipole-dipole relaxation mechanism is dominant
for the protonated carbon and the linewidth is related to the contribution
from this interaction. For a carbon with a single proton attached,
an estimate of the contributions of dipolar interactions to the line-
width is shown by the following equation (assuming no internal
rotations) (OldIield et al. 1975a ).
1 2 2 2 -6 LW=
C 3'H rCHH 20 7t:
13 Where V and P are the gyromagnetic ratios for C and
1 0 H respectively, rCH is the interatornic distance (1. 09 A), and
H is a function of the rotational correlation time (TB.) and Larmor
frequencies of the carbon ac) and proton ( c) nuclei in the
magnetic field used.
TB. 3T +
6TR + =
22 2 2 22 1+(w-w) ,.
R 1+o T H 1
H C R C +(W+uC) TR
4TR + 22
1
The correlation time for overall rotation of the papain-
inhibitor complex may be calculated for a 50 Hz linewidth as
TR = 36 nsec. This is a reasonable estimate for a carbon covà.lently
attached to a large protein rracromolecule. This value compares
160
well with the results for protonated carbons of proteins calculated
by Oldfield et al. (1975a). They found that for myoglobin (MW
17000), TR = 19 nsec, and for haemoglobin (MW = 65000), TR = 47 nsec.
Since the rotational correlation time is inversely related to the size
of the molecule, papain (MW = 23406 ) would be expected to have a
value in between these two. The linewidth of a non-protonated
carbon with the same correlation time would be expected to have a
linewidth near 10 Hz (Oldfield et al. 1975a). These results further
confirm that the hemithioacetal is covalently bound to the enzyme.
The hemithioacetal must also be rigidly held since free rotation
would result in narrower linewidths.
The results of this experiment confirm the fact that a
hemithioacetal is formed during the inhibition of papain with
N-ac etyl- L-phenylalanylglycinal. For the first time, evidence
is pres ented for non- ster eospecific hemithioac etal formation.
This application of •13CNMR to the study of the stereospecificty
of enzyme reactions may have further implications for the
results of previous investigations. The single hemiketal resonances
observed by Rich et al. (1982), and Malthouse et al. (1983), means
that either for these complexes binding is essentially stereospeci.fic,
or that two resonances are not resolved.

161
Papain and Na-CBZ-L-lysine-chloromethyl ketone
The inhibition of serine proteases with chloromethyl ketone
(CMK) substrate analogues occurs by alkylation of the active-site
his tidine and formation of a tetrahedral hemiketal by nucleophilic
attack of the active-site serine hydroxyl on the ketone carbonyl
(Poulos et al., 1976; Malthouse et al., 1983). With papain, alkylation
occurs at the thiol of Cys-25 (Bender and Brubacher, 1966; Husain
and Lowe, 1965; Whitaker and Perez-Villasenor, 1968), without
reaction at the ketone carbonyl. Drenth et al. (1976) studied the
interaction of a number of peptide-CMK inhibitors with papain and
presented a detailed study of papain inhibition by x-ray crystallography.
Since CMK inhibitors covalently bond irreversibly at the active-site
of papain, a 13C-NMR study was initiated to obseive the effects of the
protein environment on the carbonyl resonance of a 13C-enriched
CMK.
Na-CBZ-L-lysine-CMK has been shown to irreversibly inhibit
trypsin (Coggins et al., 1974) and was chosen for the papain study
on the basis of preliminary inhibition experiments. The rate of
hydrolysis of Na-CBZ-glycine-p-nitrophenyl ester was determined
for papain solutions preincubated with various concentrations of CMK.
An equirnolar amount of CMK to papain thiol inhibited> 90% of the
activity (see Table 10 ) but an excess of CMK was required for full
inhibition.
Table 10 . The inhibition of the papain-catalysed hydrolysis of
Na-CBZ-glycine-pNP with Na-CBZ-L-lysine-CMK.
Papain-SH : CMK k(S') Relative activity
1 : 0 5.1 100%
1 : 1 0.56 11%
1 : 1. 5 0.10 2%
1',: 2 0.012 0.23% **
1 : 2 0.014 0. 27%
** (After gel-filtration)
162
2-PDS titration of the protein solution after gel-filtration
to remove unreacted CMK showed no reactive thiol which indicated
that the active-site cysteine residue is irreversibly blocked.
As a model system for the enzyme reaction, [2- 13C]-Na-
CBZ-L-lysine-CMK was reacted with N-acetyl-L-cysteine. The
spectrum of [2-13C]-Na-CBZ-L-lysine-CMK in DMSO-d 6 is shown
in Figure 21 (a). A single resonance is observable at 200. 6 ppm.
This resonance is at the high-field end of the ketorie carbonyl
region of the 13C-NMR spectrum (''..200-220 ppm), due to the
deshielding effect by the chlorine atom on the adjacent carbon
( see entries 1-3 in Table 11). In 1 mM HC1, the 13C-NMR
spectrum shows two enriched resonances at 204. 7 and 95. 4 ppm
which can be assigned to the ketone and its hydrate respectively
(Malthouse et al., 1983) (Figure 21(b)). The linewidth of the
ketone resonance is 4. 0 Hz. The spectrum of the ketone and hydrate
was unchanged between pH 3 and 7. The intensity of the hydrate
signal decreased between pH 7 and 9 as expected for a hydrated
carbonyl group where hydration is acid catalysed (He1lstr'm and.
Almqvist, 1970). Above pH 9 the signals at 204. 7 and 95.4 are
not detected due to breakdown of the CMK (Malthouse et al., 1983).
Addition of CMK to a solution of N-acetyl-L-cysteine at pH 7
resulted in the appearance of a new resonance at 207. 8 ppm with
the disappearance of the signals at 95. 4 and 204. 7 ppm (Figure
21(c)). The resonance was unchanged between pH 7 and 10. This
downfield shift is consistent with substitution of the chlorine atom
and is characteristic of aliphatic ketones ( see Table 11). The
resonances can be assigned to the species in the following reaction
scheme:
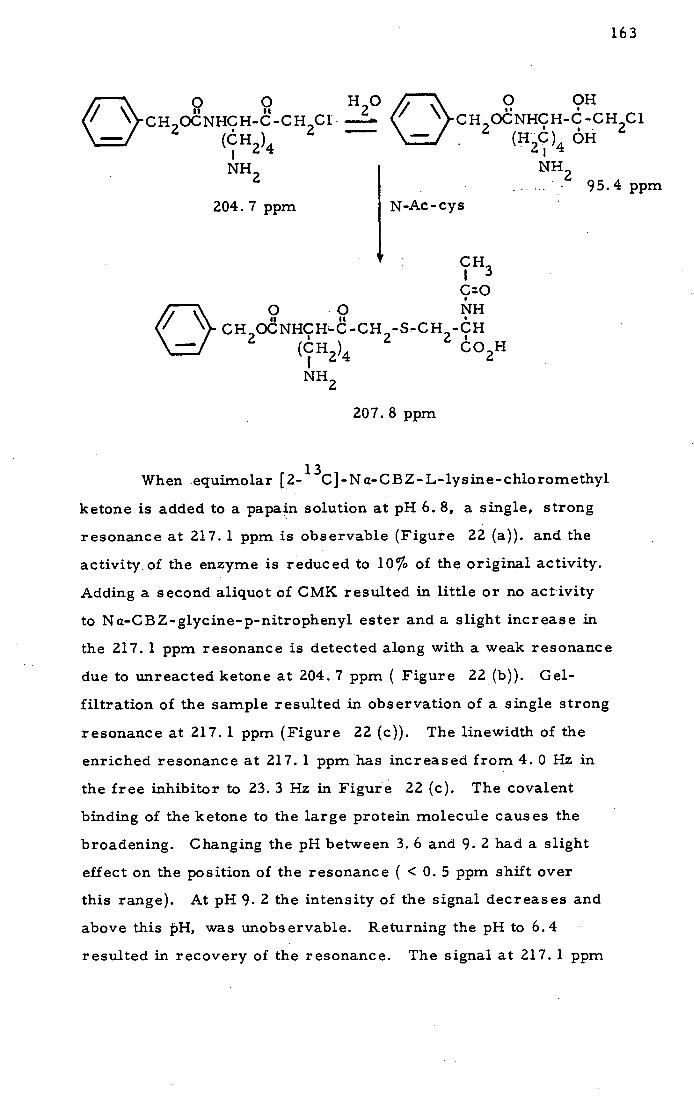
163
o oH Is a
CH OCNHCH-C-CH2C1 H200 2 (H)&
NH 2
204. 7 ppm N-Ac-cys
CH
C:O
/\N 0
- 0 H
Is II a
CH OCNHCHC-CH 2-S-CH2-CH 2
(H2 )4 CO 2H
NH2
207. 8 ppm
When equimolar [2- 13C]-N tz-CBZ- L-lysine-chloromethyl
ketone is added to a papain solution at pH 6. 8, a single, strong
resonance at 217. 1 ppm is observable (Figure 22 (a)). and the
activity, of the enzyme is reduced to io% of the original activity.
Adding a second aliquot of CMK resulted in little or no activity
to Na-CBZ-glycine-p-nitrophenyl ester and a slight increase in
the 217. 1 ppm resonance is detected along with a weak resonance
due to unreacted ketone at 204. 7 ppm ( Figure 22 (b)). Gel-
filtration of the sample resulted in observation of a single strong
resonance at 217. 1 ppm (Figure 22 (c)). The linewidth of the
enriched resonance at 217. 1 ppm has increased from 4. 0 Hz in
the free inhibitor to 23. 3 Hz in Figure 22 (c). The covalent
binding of the ketone to the large protein molecule causes the
broadening. Changing the pH between 3. 6 and 9. 2 had a slight
effect on the position of the resonance ( < 0. 5 ppm shift over
this range). At pH 9. 2 the intensity of the signal decreases and
above this PH, was unobservable. Returning the pH to 6.4
resulted in recovery of the resonance. The signal at 217. 1 ppm
Ooo
I, II
CH OCNHCH-C-CH Cl )4
- 2 (áH2
2
NH2

Figure 21. The reaction of Na-CBZ-L-lysine-CMK with
N-ac etyl- L-cysteine.
11.42 mM [2 3C]-Na-CBZ-L-lysine-CMK in
DMSO-d6 , NS = 6000. ( 5 mm sample tube).
47.6 mM [2)3C]-Na-CBZ-L-lysjne-CMK in
1 mM HC1, 12% D 20, NS = 1500, ( 5 mm tube).
13C-labelled CMK added to solution of N-acetyl-L-
cysteine. Resulting solution: 5 mM N-Ac-L-cysteine
2.5 mM . '3C-labelled CMK, 10 mM phosphate, 12. 5%
D20, pH 6. 6, NS = 5000 . Spectrum was unchanged.
over 3 hours. Adjusting the pH between 4 and 10
also did not change the spectrum (10 mm sample
tube).
164

200. 6
t
165
(a)
204.7 a,
95.4
,207. 8
(b)
(c)
I I I I I I I I I I I I
200 150 100
o(ppm)
Figure 21
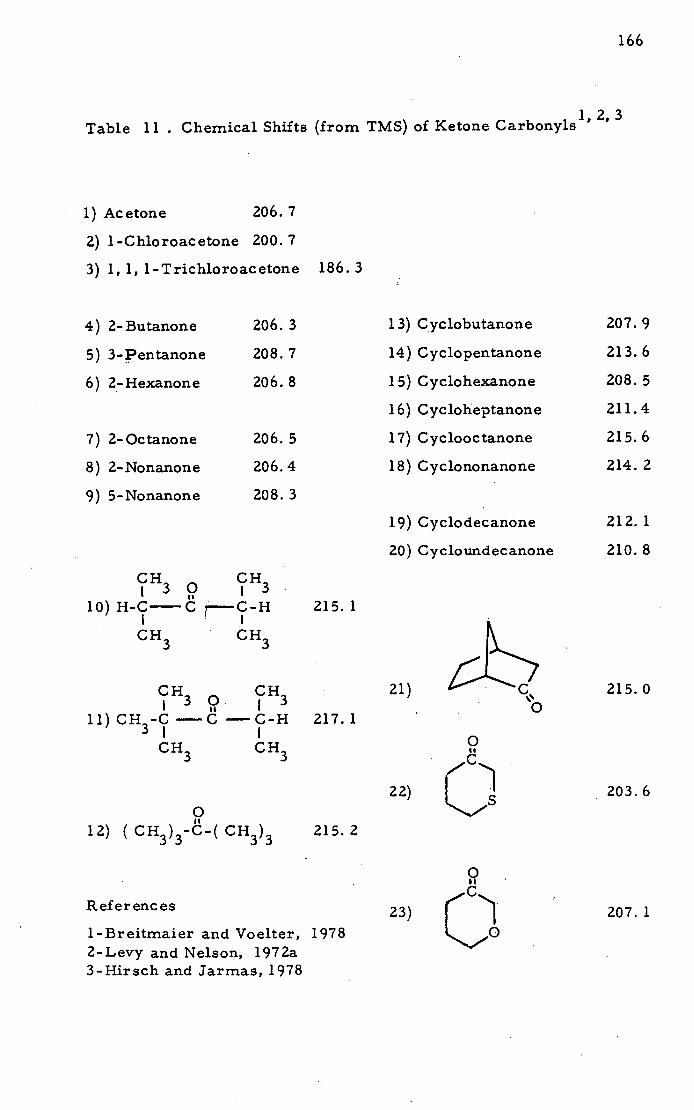
166
Table 11 . Chemical Shifts (from TMS) of Ketone Carbonyls1' 2,3
Acetone 206.7
1-Chloroacetone 200. 7
1, 1, 1-Trichloroacetone 186. 3
4) 2-Butanone 206. 3 13) Cyclobutanone 207.9
5) 3-Pentanone 208.7 14) Cyclopentanone 213.6
6) 2-Hexanone 206.8 Cyclohexanone 208. 5
Cycloheptanone 211.4
7) 2-Octanone 206. 5 17) Cyclooctanone 215.6
8) 2-Nonanone 206.4 18)Cyclononanone 214.2
9) 5-Nonanone 208. 3
19) Cyclodecanone 212.1
20) Cycloundecanone 210.8
CH t 3 9
CH
lo)H-C Cr— C-H 215.1
CH 3 CH
CH 3
CH 0
21) C 215.0
11) CH -C -d —CH 217.1 0
CH 3
CH 3 c
to
22) L....,.._i 203.6
11
12) (
CH3 ) 3 -C-( CH3 ) 3 215. 2
0
References 23) 207.1
1-Breitmaier and Voelter, 1978 2-Levy and Nelson, 1972a 3-Hirsch and Jarmas, 1978
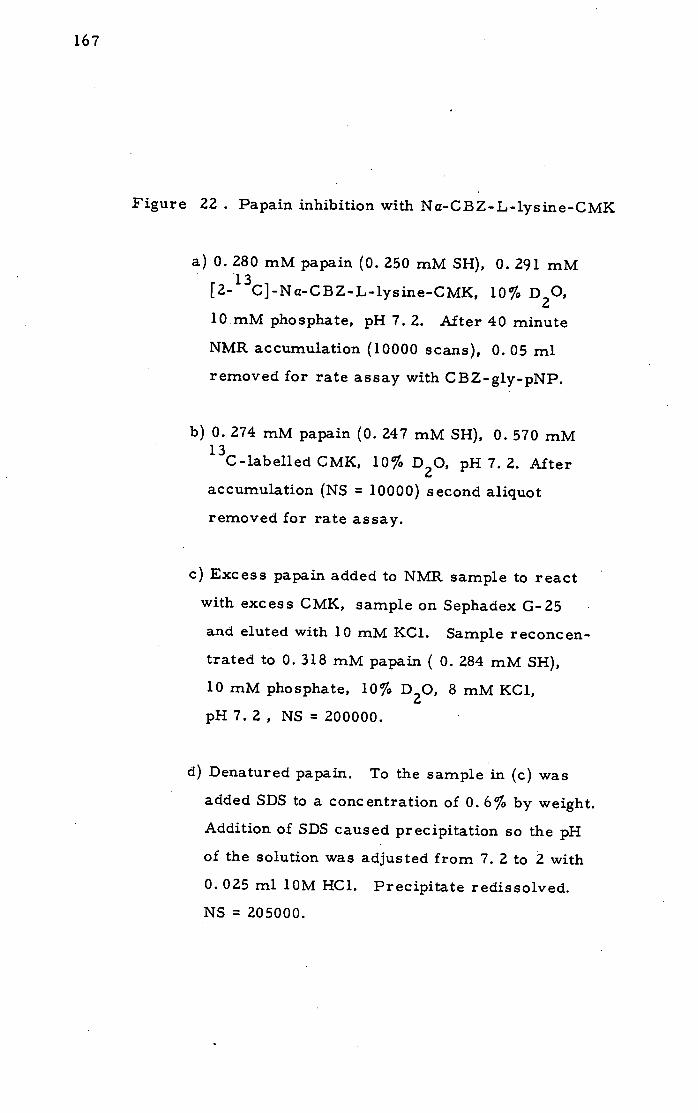
Figure 22 . Papain inhibition with Na-C B Z- L- lys ine-CMK
0. 280 mM papain (0. 250 mM SH), 0. 291 mM
[2- 13C]-Na-CBZ-L-lysine-CMK, 10% D 20,
10 mM phosphate, pH 7. 2. After 40 minute
NMR accumulation (10000 scans), 0. 05 ml
removed for rate assay with CBZ-gly-pNP.
0. 274 mM papain (0. 247 mM SH), 0. 570 mM
13 -labelled CMK, 10% D 20, pH 7. 2. Alter
accumulation (NS = 10000) second aliquot
removed for rate assay.
Excess papain added to NMR sample to react
with excess CMK, sample on Sephadex G-25
and eluted with 10 mM KC1. Sample reconcen-
trated to 0. 318 mM papain ( 0. 284 mM SH),
10 mM phosphate, 10% D 20, 8 mM KC1,
pH 7. 2 , NS = 200000.
Denatured papain. To the sample in (c) was
added SDS to a concentration of 0. 6% by weight.
Addition of SDS caused precipitation so the pH
of the solution was adjusted from 7. 2 to 2 with
0. 025 ml 10M HC1. Precipitate redissolved.
NS = 205000.
167
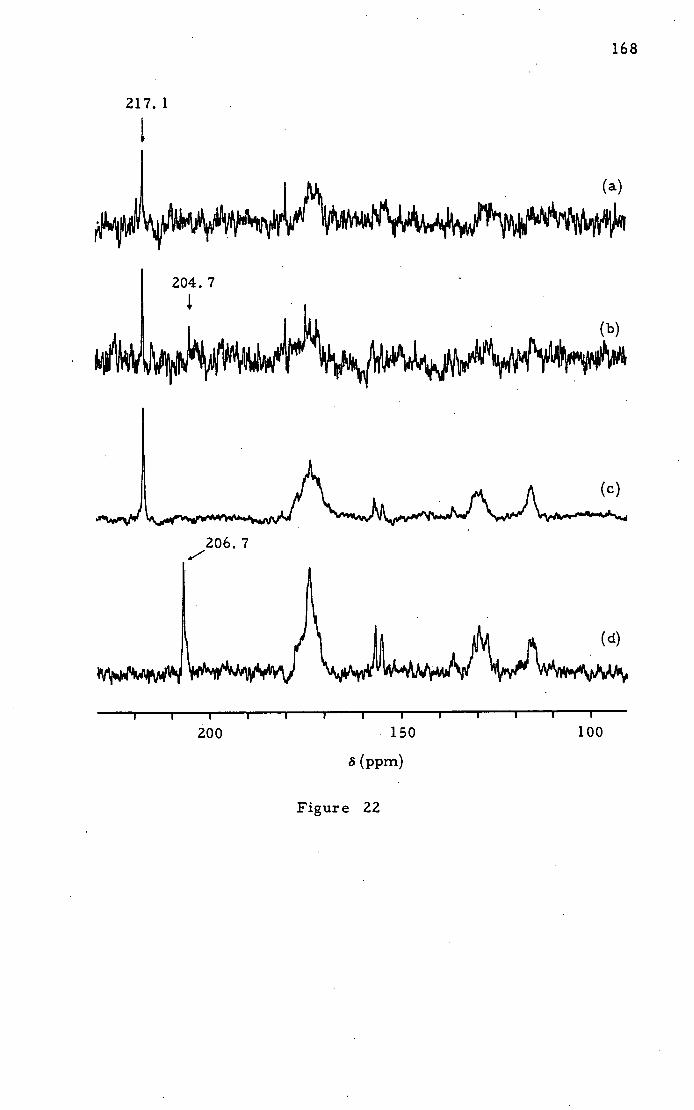
217. 1
168
204. 7
206. 7
200 150 100
o (ppm)
Figure 22

169
is significantly different from that of the model compound N-acetyl-
L-cysteine-CMK. Resonances in this region are characteristic
of highly branched ketones (see entries 10-12 in Table 11 ),
or cyclic ketones (entries 13-21 in Table 11 ). Since substitution
at the adjacent carbons is the same as in the model compound, the
shift in resonance due to polysubstitution at the C-1 carbon is
unlikely.
To confirm that the CMK does indeed react at the active-
site sulphur, papain blocked with an (-S-CH 3 ) group on the Cys-25
sulphur was prepared by the method of Smith et al. (1975). This
blocked papain (papain-S-S-CH 3 ), was unreactive toward Na-CBZ-
glycine-pNP and 2-PDS. Addition of 13C-CMK to papain-S-S-CH 3 ,
pH 7. 2, showed no change in the CMK resonances at 204. 5 and
95. 3 ppm (Figure 23 (a)). The linewidth of the ketone resonance at
204. 5 ppm shows only a slight increase to 6.4 Hz indicating that
covalent binding of inhibitor to protein has not occurred. ( Linewidths
are accurate to ± 4 Hz depending on sample homogeneity, i. e. a
change of 2 Hz is not significant) Even with a four-fold excess of
CMK after 18 hours, the resonance positions were unchanged. The
additional sharpresonance at 174. 1 ppm superimposed on the protein
carbonyl resonances, can be assigned to one of the products of the
breakdown of CMK in aqueous solution. The resonance may be due
to an enriched carboxylic acid formed by a Favorskii-type rearrange-
ment (Kende, 1960):
0 0 R--CH2-C1 - R-CH 2-C-OH
The lysine carbonyl of Na-CBZ-L-lysine has a chemical
shift of 174. 5 ppm under similar conditions.
Alter gel-filtration the 13C-NMR spectrum of the enzyme
showed no evidence of enriched resonances (Figure 23 (b)). Re:-
activation of the enzyme with cysteine resulted in recovery of full

170
204. 5 1
95.4
4
I I I I I I I I I I I I 1 I
200 150 100
&(ppm)
Figure 23 . Papain-S-S-CH 3 and Na-CBZ-L-lysine-CMK.
0. 261 mM papain-S-S-CH 3 (0. 96 thiol/mol), 10 mM
phosphate, 10 % D 20, 0.510 mM [2) 3C]-Na-CBZ-
L-lysine-CMK, pH 7. 2, NS 10000 (part of 25 ml
sample)
Sample from (a) after gel-filtration, reconcentration
0.800 mM papain-S-S-CH 3, 10 mM phosphate, 10 %
DO, pH 7. 2, NS = 40000.
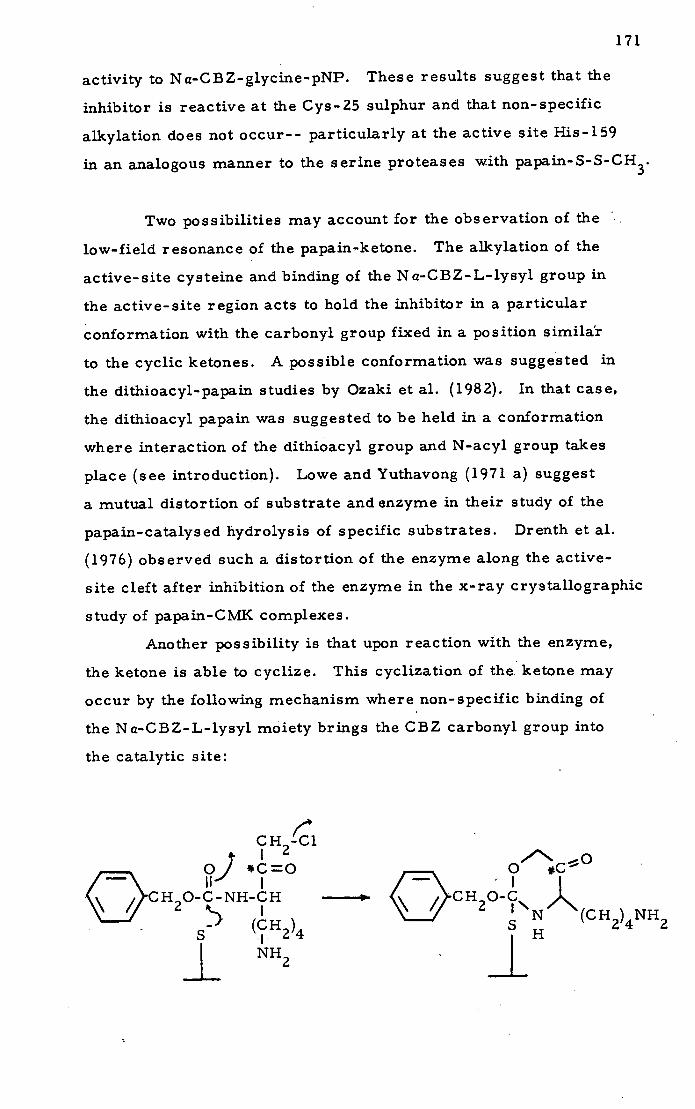
171
activity to Na-CBZ-glycine-pNP. These results suggest that the
inhibitor is reactive at the Cys-25 sulphur and that non-specific
alkylation does not occur-- particularly at the active site His-159
in an analogous manner to the serine proteases with papain-S-S-CH 3
Two possibilities may account for the observation of the
low-field resonance of the papain-ketone. The alkylation of the
active-site cysteine and binding of the Na-CBZ-L-lysyl group in
the active-site region acts to hold the inhibitor in a particular
conformation with the carbonyl group fixed in a position simila
to the cyclic ketones. A possible conformation was suggested in
the dithioacyl- papa in studies by Ozaki et al. (1982). In that case,
the dithioacyl papain was suggested to be held in a conformation
where interaction of the dithioacyl group and N-acyl group takes
place (see introductipn). Lowe and Yuthavong (1971 a) suggest
a mutual distortion of substrate and enzyme in their study of the
papain-catalysed hydrolysis of specific substrates. Drenth et al.
(1976) observed such a distortion of the enzyme along the active-
site cleft after inhibition of the enzyme in the x-ray crystallographic
study of papain-CMK complexes.
Another possibility is that upon reaction with the enzyme,
the ketone is able to cyclize. This cyclization of the. ketone may
occur by the following mechanism where non-specific binding of
the Na-CBZ-L-lysyl moiety brings the CBZ carbonyl group into
the catalytic site:
CH -Cl
1*- Iv I
C H 20-C- NH-C H C\
-, (CH)24
___ NH
o ' c 0
w (CH2)4 NH2
H

172
Since only one resonance is observed, this would require
complete binding of the inhibitor in this non-specific mode. The
13C-NMR results cannot distinguish between these two possibilities.
Addition of trypsin to digest the papain did not produce a change in
the 217. 1 ppm resonance after 18 hours. SDS was added to a papain-
CMK mixture to denature the enzyme and the pH lowered to 2
(concentrated, denatured papain was soluble at pH 2). The 13C-
NMR spectrum shows a resonance at 206. 7 ppm (Figure 22 (d)).
This resonance is very similar to the model compound. Unfortunately,
lowering the pH to solubilize the denatured papain means that the
results cannot definitely distinguish between the two possibilities.
The experiment suggests that denaturation of the enzythe resulted
in relief of the conlormational restraints on the inhibitor complex
and therefore the chemical shift is similar to the model compound.
An alternative explanation is that the cyclic ketone is acid labile
and hydrolyses to the 1-hydroxy-2-ketone which has a similar
chemical shift. From entries 22 and 23 in Table 11 , an oxygen
attached to the C-1 should have a resonance slightly downfield
of the sulphur ketone. The differences are too small to distinguish
between these two possibilities. Further 13C-NMR investigation
would be required using similar CMK inhibitors which could not
form cyclic species or which were doubly labelled at both carbonyl
positions. The results do show that a unique carbonyl resonance
is produced upon inhibition of papain with a CMK inhibitor. The
resonance may be due to a unique binding mode with cyclization,
or to the formation of a conlormationally distorted enzyme-
inhibitor complex.
173
Absorption Spectra in Cryosolvent at Low Temperature
The analysis of spectrophotometric data from cryoenzymological
experiments is complicated by the fact that the UV-visible spectrum
of a chromophore will change as the solvent composition and
temperature changes. The next section describes the kinetic
analysis of papain-catalysed hyrolyses of specific p-nitrophenyl
esters substrates. In each case, the reaction was monitored by the
spectrophotometric observation of the p-nitrophenol chromophore
produced during the acylation reaction. Prior to these experiments,
the effect of co-solvent and temperature on the substrate and product
UV-visible spectra was studied. The data from this study provides
the difference extinctions (ItE) needed to analyse the progress curves
and initial rate data. -
Hargreaves et al. (1965) have determined that the PKa of
p-nitrophenol increases from 7. 28 in water to 7. 67 in 44% acetone
in water, to 8.13 in 51% dioxane -water, and 8.04 in 49% DMF-water
(all at 200C). The PKa of p-nitrophenol in 40% DMSO has been deter-
mined to be 7.65 (Maithouse, 1983; unpublished result). p-nitro-
phenol is commonly used as a spectrophotometric acid-base indicator
with the appearance of the p-nitrophenol chromophore as a single
peak at 317. 5 nm at low pH, which decreases in intensity as the pH
is raised with concomitant increase in the p-nitrophenolate absorption
which has a A max = 402 nm in highly basic solutions (Doub and
Vandenbilt, 1947). Figure 24 illustrates the effect of added DMSO
on the absorption spectrum of p-nitrophenol. Curve A shows the
absorption spectrum in water at pH 6. 1. A large absorption at
318 nm due to p-nitrophenol is present with a small amount of
p-nitrophenolate seen as a shoulder on the main peak. Curve B
shows the spectrum of the same concentration of p-nitrophenol in
60% DMSO, pH6. 1. The shoulder due to p-nitrophenolate is
much smaller since the pK increases in DMSO and less p-nitro-
phenolate is present at the same pH. The position of the A max
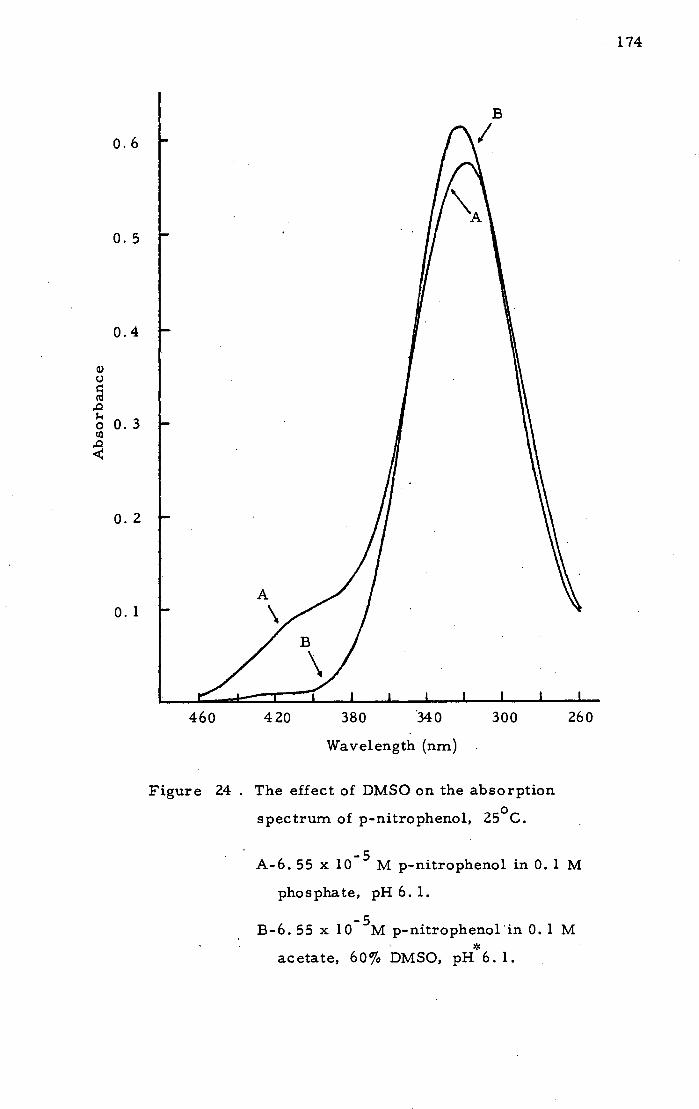
S.
0. 5
0.4
4) U
Cd 0 14 o 0. 3
0. 2
0. 1
174
460 420 380 '340 300 260
Wavelength (nm)
Figure 24 . The effect of DMSO on the absorption
spectrum of p-nitrophenol, 250
C.
A-6. 55 x 10 M p-nitrophenol in 0. 1 M
phosphate, pH 6. 1.
B-6. 55 x 10 5M p-nitrophenolin 0. 1 M
acetate, 60% DMSO, pH6. 1.
'75
shifts slightly to 320 nm with a molar extinction coefficient of
—9400 M ' cm ' . A slight change in the pH can cause a change
in the value of E at each wavelength.
Keilen and Hartree (1949) have examined the effects of
low temperatures on the absorption spectrum and noted a sharpening
of peaks. This same effect was observed with p-nitrophenol as
shown in Figure 25 . As the temperature of the solution of p-nitro-
phenol in DMSO-water is lowered, the absorption spectrum sharpens
with the € value increasing from 10400 at 180C to 12300 M ' cm '
max at -6 5° C. The sharpening of the absorption spectrum causes
increases in the molar extinction coefficient near A and max
decreases at wavelengths further from A. max . Similar behaviour
occurred in 40 and 50% DMSO solutions. Figures 26 to 28 show
the variation in p-nitrophenol molar extinction coefficients with *
temperature at pH 6. 1. The figures show the increase in e at
wavelengths near 340 nm with a decrease in temperature, and the
decrease in with temperature at longer wavelengths. The
extinction values obtained from Figures 26 to 28 were used to
calculate the difference extinction by subtraction of the contribution.
of the substrate molar extinction coefficient under the same conditons.
The absorption spectra of the p-nitrophenyl ester substrates
used were all very similar and the effect of temperature on the
spectrum of one of these, CBZ-glycine p-nitrophenyl ester, is
shown in Figure 30 . With decreasing temperature, the substrate
spectrum also sharpens and the C. increases. The spectrum max
at 340 nm and above is not greatly affected by temperature and
the molar extinction coefficients. obtained are about 10% of the
p-nitrophenol value under the same conditions. The, substrate
spectra did not change significantly in 40 or 50% DMSO and the
values used for all of the substrates described were obtained
from Figure 29 . The E values in Figure 29 show little change
with temperature.
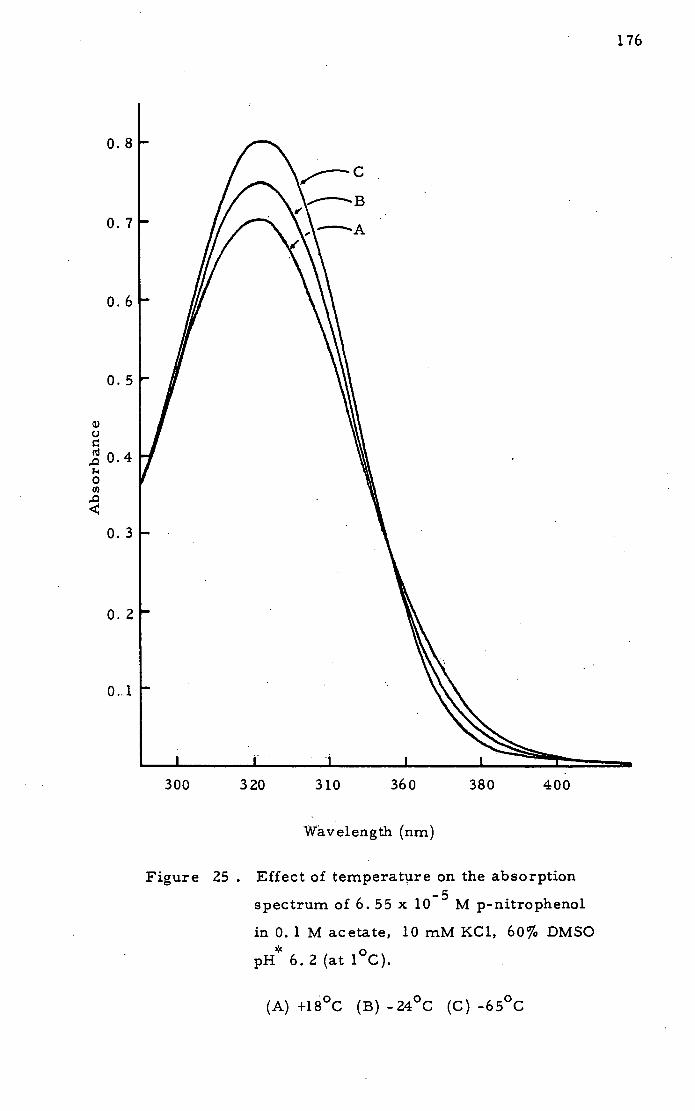
300 320 310 360 380 400
ODE
0. 7
I.
0. 5
0. 2
0.1
U
0.4 .0 Ii 0
.0 p.
0. 3
176
Wavelength (nm)
Figure 25 . Effect of temperature on the absorption
spectrum of 6. 55 x 10 M p-nitrophenol
in 0. 1 M acetate, 10 mM KC1, 60% DMSO *
pH 6.2(at1 0
C).
(A) +18°C (B) -24 °C (C) -65 ° C
Figure. 26 . Molar extinction coefficients for p-nitro-
phenol in 0. 1 M acetate, 1 mM EDTA, 60% DMSO, *
pH 6. 1. The values of E are calculated from x
the concentration of p-nitrophenol used and the
absorbance at wavelength N.
Figure 27 . Molar extinction coefficients for p-nitro-
phenol in 0. 1 M acetate, 1 mM EDTA, 50% DMSO *
pH 6.1.
177

178
9000
340 nm
7000
350 nm
5000
360nm i 3000
C-,
370nrn
1000 -
L 380 nm 800
600
400 390 nm
200 400 nm 410 nm 420 nm
-50 -30 -10 +10
Temperature ( ° C)
60% DMSO
Figure 26

179
• 340 nm
7000
- - 350nm
5000
360 nm
-; 3000
U
370 nm
1000
600 1-
380 nm
400 390 nm
4ZOnm
400 nm 200 410 nm
-50 -30 -10 +10
Temperature ( ° C)
50% ]DMSO
Figure 27
Figure 28 . Molar extinction coefficients for p-nitro-
phenol in 0. 1 M acetate, 1 mM EDTA, 40% DMSO, *
pH 6. 1
Figure 29 . Molar extinction coefficients calculated
from the spectrum of Na-CBZ-glycine p-nitro-
phenyl ester in 60% DMSO and used for all
p-nitrophenyl ester substrates since the spectra
were virtually identical. DMSO concentration
down to 40% had no significant effect on the
molar extinction coefficients at the wavelengths
swn.
180

Figure 28 350 nm
5000
4000 -
36Onm
3000 -
2000 - 370 nr
380 nm 1000 -
390 nm
[ :' ' S
• 340 nm
:is
hoo 350 nm
400 360 nm
200 370 nm
• 380nm 390 nm
-50 -30 -10
+10 Temperature ( ° C)
Figure 29
181
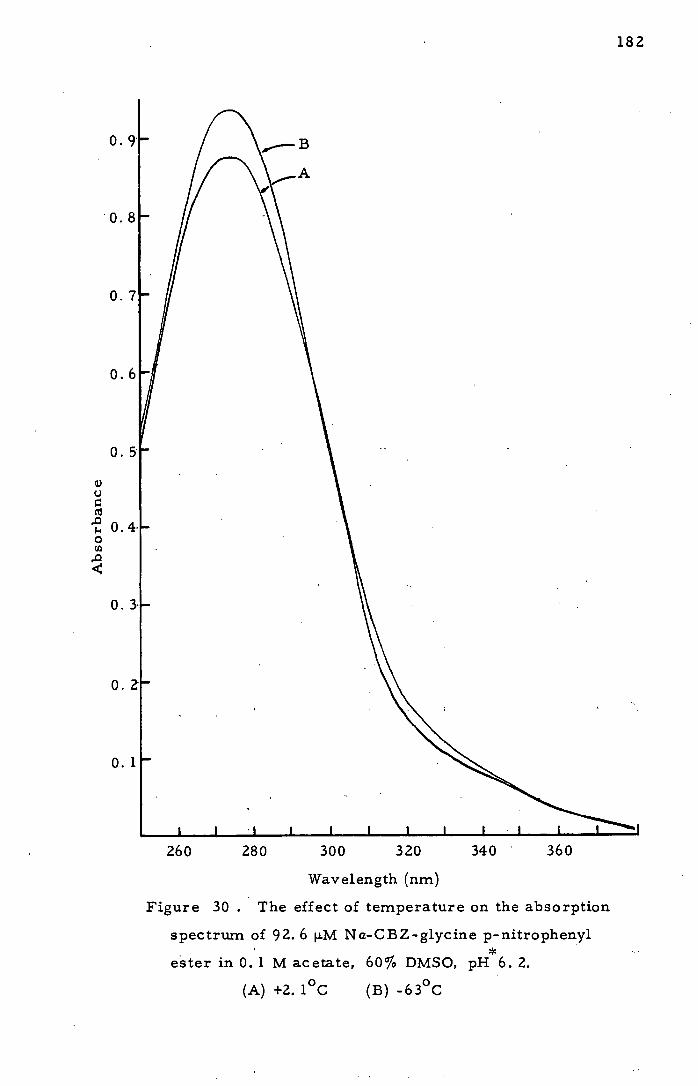
260 280 300 320 340 360
RE
RE
LII
LII
[II
[!1
U
0. 0
p.
182
Wavelength (nm)
Figure 30 . The effect of temperature on the absorption
spectrum of 92.6 p.M Ncz-CBZ-glycine p-nitrophenyl
ester in 0. 1 M acetate, 60% DMSO, pH6. 2.
(A) +2. 10 C (B) -630 C
183
The a C. values, which can be calculated from the temperature
dependence of the product p-nitrophenol and substrate molar extinction
coefficients, were used in the analysis of the spectrophotometric
data obtained during the enzyme catalysed reaction. The contribution
of the papain absorption spectrum at> 340 nm is very small at the
concentrations used and can be ignored. The values of ac were
also calculated in each experiment where A and A were obtained
and these values provided a cross-check on the concentratioh of
substrate used. After the completion of the hydrolysis, a small
amount of p-nitrophenol was often added to the cell to check the
p-nitrophenol extinction at the pH of the experiment.
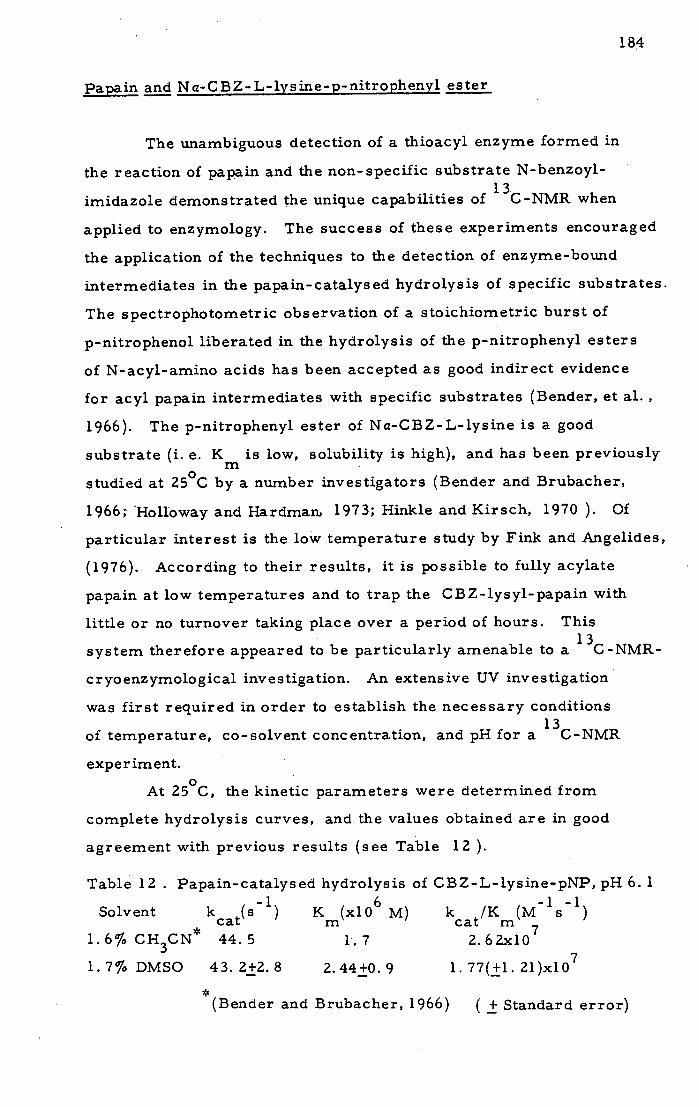
184
Papain and Na-CBZ-L-lysine-p-nitrophenyl ester
The unambiguous detection of a thioacyl enzyme formed in
the reaction of papain and the non-specific substrate N-benzoyl-
imidazole demonstrated the unique capabilities of 13C-NMR when
applied to enzymology. The success of these experiments encouraged
the application of the techniques to the detection of enzyme-bound
intermediates in the papain-catalysed hydrolysis of specific substrates.
The spectrophotometric observation of a stoichiometric burst of
p-nitrophenol liberated in the hydrolysis of the p-nitrophenyl esters
of N-acyl-amino acids has been accepted as good indirect evidence
for acyl papain intermediates with specific substrates (Bender, et al.
1966). The p-nitrophenyl ester of Ncz-CBZ-L-lysine is a good
substrate (i. e. Km is low, solubility is high), and has been previously
studied at 250C by a number investigators (Bender and Brubacher,
1966; Holloway and Hardmath 1973; Hinkle and Kirsch, 1970 ). Of
particular interest is the low temperature study by Fink and Angelides,
(1976). According to their results, it is possible to fully acylate
papain at low temperatures and to trap the CBZ-lysyl-papain with
little or no turnover taking place over a period of hours. This
system therefore appeared to be particularly amenable to a 13C-NMR-
cryoenzymological investigation. An extensive UV investigation
was first required in order to establish the necessary conditions
of temperature, co-solvent concentration, and pH for a 13C-NMR
experiment.
At 250C, the kinetic parameters were determined from
complete hydrolysis curves, and the values obtained are in good
agreement with previous results (see Table 12 ).
Table 12 . Papain-catalysed hydrolysis of CBZ-L-lysine-pNP, pH 6. 1
Solvent k cat
(el m
) K (xlO 6 M)
k cat m /K (Ms)
1.6% CH3CN* 44.5 1.7 2.62xl0
1.7% DMSO 43.2±2.8 2.44±0.9 1.77(±1.21)xlO7
*(Bender and Brubacher, 1966) ( ± Standard error)
185
Buffers containing 60% (v/v) DMSO were used by Fink and
Angelides (1976) to study the low temperature hydrolysis of Na-
CBZ-L-lysine-p-nitrophenyl ester by papain. They found that
papain is stable and active in this cryosolvent below +100C. Above
this temperature, papain in 60% DMSO was reversibly denatured.
High concentrations of DMSO also improves the solubility of papain
at low temperatures which is essential for the detection of an acyl
intermediate by 13
C-NMR. The effect of DMSO on the kinetic
parameters was investigated and the results are listed in Table 13
The reaction was studied at +30C in order to avoid freezing problems
with solutions at low DMSO concentrations, and to prevent denatura-
tion of papain in solutions of higher co-solvent concentration at
warmer temperatures. Also listed in Table 13 are the results of
Fink and Angelides (1976) for a similar investigation at 00
C.
The results in Table 13 clearly show that k- increases cat
with increasing DMSO concentration in marked contrast to the trend
reported by Fink and Angelides (1976). Other investigators have
observed similar increases in the rates of papain-catalysed
reactions in the presence of organic solvents. Hinkle and Kirsch
(1970) observed large increases in the deacylation rate of furyl-
acryloyl-papain upon addition of organic co-solvents including
DMSO. In the same study, kcat for the papain-catalysed hydrolysis
of Na-CBZ-glycine-p-nitrophenyl ester and Na-CBZ-L-lysine-p-
nitrophenyl ester was increased 3. 3 and 1. 6-fold respectively in
27. 6% dioxane as compared to water. The increase in rates is
attributed to a mechanism involving co-solvent molecules binding
at the active-site. This binding improves the orientation of the
acyl-group with respect to the catalytic groups on the enzyme
thereby increasing the rate of acyl-transfer to water. Henry and
Kirsch (1967) also observed a rate increase with an increase in
acetonitrile concentration in the papain-catalysed hydrolysis of
p-nitrophenyl hippurate. The rate of the papain-catalysed hydrolysis
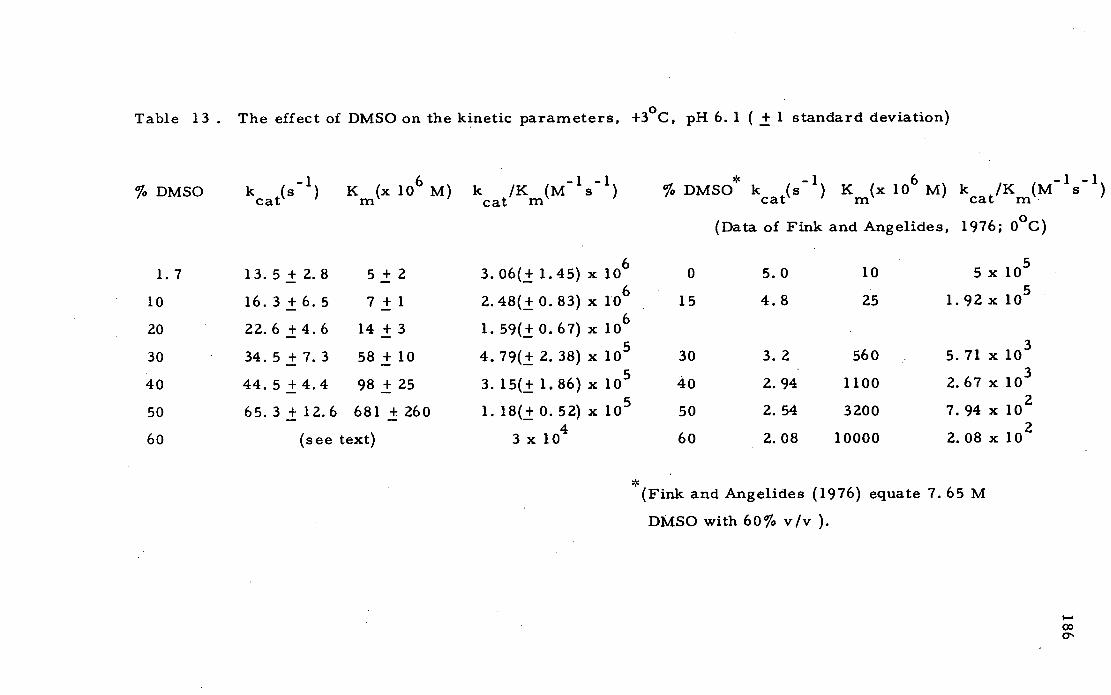
Table 13 . The effect of DMSO on the kinetic parameters, +30C, pH 6. 1 ( ± 1 standard deviation)
% DMSO k (s) K (x 10 6 M) k /K (Ms ' ) % DMSO k (s) K (x 106 M) k /K (Ms ' )
cat m cat m cat m cat M .
(Data of Fink and Angelides, 1976; 0°C)
1.7 13.5 + 2.8 5 ± 2 3. 06(± 1.45) x 106 0 5.0 10 5 x 10
10 16.3+6.5 7±1 2.48(+0.83)x 106 15 4.8 25 1.92x 10
20 22.6 + 4.6 14 ± 3 1. 59(± 0.67) x 106
30 34. 5 ± 7. 3 58 ± 10 9(± 2. 38) x 10 30 3.2 560 71 x 10
40 44.5 ± 4.4 98 ± 25 3. 15(± 1.86) x 10 40 2.94 1100 2.67 x 1O 3
50 65.3 + 12.6 681 + 260 1. 18(± 0.52) x 10 50 2.54 3200 7.94 x 10²
60 (see text) 3 x 10⁴ 60 2.08 10000 2.08 x 10 2
* (Fink and Angelides (1976) equate 7. 65 M
DMSO with 60% v/v).
00

187
of ethyl hippurate increased in solutions containing 20% DMSO
(Sluyterman, 1967). Fink and co-workers however have reported
the same uniform decrease in kt with trypsin (Fink, 1974 b),
chymotrypsin (Fink, 1973 a, b; Fink and Wildi, 1974), and papain
(Fink andAngelides, 1976; Angelides and Fink, 1978), with a
wide variety of N-acyl amino ' acid esters. In each case, the
decrease in kcat is claimed to be proportional to the decrease in
the water concentration. Maurel (1978) studied the effects of various
co-solvents, including DMSO, on several enzymes and found that
the effect of cosolvent varies with the enzyme. For example, in
the chymotrypsin-catalysed hydrolysis of N-ac etyl-L-tryptophan
ethyl ester, kcat decreases with increasing DMSO, whereas
kcat for the trypsin-catalysed hydrolysis of L-BAEE is not affected
by an increase in the co-solvent concentration.
The kcat value in 50% DMSO is approximately 25-times
greater than found by Fink and Angelides (1976). Since the kcat
values are larger in the present study, this could suggest that
this preparation contained an activator. This explanation is
unlikely as the kinetic parameters ( k, K m
) for the hydrolysis
of Na-CBZ-L-lysine-p-nitrophenyl ester, Na-CBZ-glycine-p-
nitrophenyl ester (see Table 20 in next section), and L-BAEE
(Table 2 in enzyme purity section) at 250C in water agree well
with those reported by other workers. It is more likely that the
enzyme preparations of Fink and Angelides (1976) contains an
inhibitor, denatured or not fully active papain, chymopapain
contaminants, or that they over-estimated the enzyme concentration.
The purity of the enzyme preparation used in their study was not
as extensively investigated as in this study (see enzyme purity
section). Enzyme activity was determined by a kinetic and burst
assays (Fink and Angelides, 1976) with p-nitrophenyl ester substrates
which would not easily detect contaminating enzymes and would give
a less accurate estimate of active enzyme.
The kcat values in Table 13 are plotted versus % DMSO in

188
Figure 31 . Up to 50% DMSO, kcat increases exponentially.
A plot of ln(k) vs % DMSO (Figure 32) produces a straight
line. Determination of the kinetic parameters in 60% DMSO
at +30C was impossible since the products of the hydrolysis are
insoluble at this temperature and a precipitate forms as the reaction
proceeds ( lowering the temperature improves the solubility and
the precipitate redissolves). Kinetic determinations in 60% DMSO
at +30C were limited to trials with low substrate concentrations
where only an estimate of k cat m
/K could be obtained. This value
is included in Table 13 . k cat
values in Table 13 were obtained
from complete hydrolysis curves, and in solutions containing <40%
DMSO, k values were also obtained from initial rate studies. cat
The data for k cat in cat m
/K vs % DMSO and ln( k 1K ) vs
% DMSO are presented in Figures 33 and 34 . The values of
k cat m m 0
/K were determined from first-order curves (ES] << K ),
and from the individual kinetic parameters k cat m
and K determined
from complete progress curves (rS] > K).
The values of K m cat
(and k in 50 and 60% DMSO solutions)
listed in Table 13 and in the low temperature experiments, were
calculated from the complete progress curves and are the average
of at least five determinations. The determination of K values m
from complete curves is prone to errors due to the possible effects
of substrate or product inhibition, or denaturation-inactivation of the
enzyme during hydrolysis (Atkins and Nimmo, 1980). The values of
k /K determined with[S]> K are in agreement with the same values cat m o in
determined from first-order curves (S<< K) ( see examples in
Tables 15 and 17 ). In all of the determinations with [s)<< K 0 in
the log.plots of the first-order curves were linear over > 90 % of
the reaction indicating no significant denaturation of the enzyme
occurred during the hydrolysis. The correspondence between ks/K
values at from first-order curves and complete progress curves
was found over a wide temperature range. This is illustrated in
Tables 15 and 17 and Figure 38 . The similar values for 'k /K cat n-i

Figure 31 . The dependence of kcat on DMSO
concentration for the papain-catalysed
hydrolysis of Na-CBZ-L-lysine-p-nitro-
phenyl ester. The values are from
Table 13 . The error bars represent
+ one standard deviation and each point
is the average of at least five-determinations.
For solutions containing <40% DMSO,
cat values were obtained from both
initial rates and complete progress curves.
Figure 32 . The linear relationship of In ( k cat ) to
DMSO concentration for the data in Table
13 and plotted in Figure 31.
189

MMI
,y 0
20
190
20 40
% DMSO
Figure 31
20 40 % DMSO
Figure 32
4.0
3.6
.
cd C)
2.8
2.4

Figure 33 The dependence of k cat in 1K on DMSO
concentration for the papain-catalys ed
hydrolysis of N a-CBZ- L-lysine-p-nitro-
phenyl ester from the data listed in
Table 13 . The points represent the
average of at least five determinations
obtained from complete progress curves
and first-order curves. The error bars
are ± one standard deviation.
Figure .34 . The dependence of In (k cat in
/K ) on DMSO
concentration for the data in Table 13
191
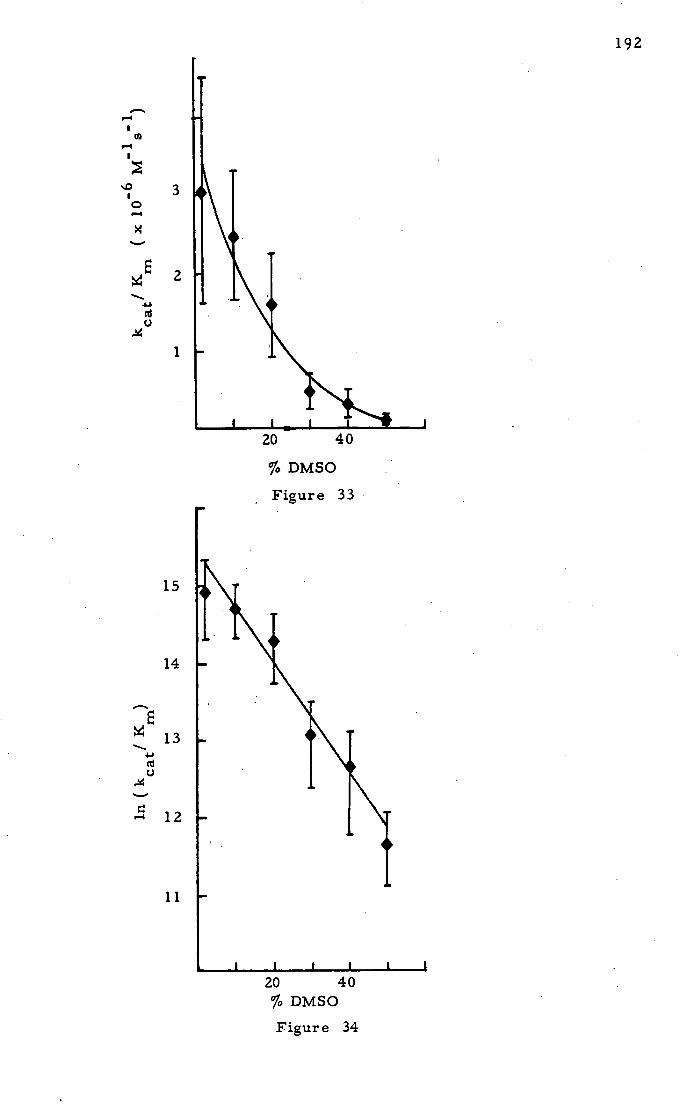
-4
3 0 -4
E 2
(*j C)
1
192
20 40
% DMSO
Figure 33
15
14
13
Cd
- 12
11
20 40 % DMSO
Figure 34
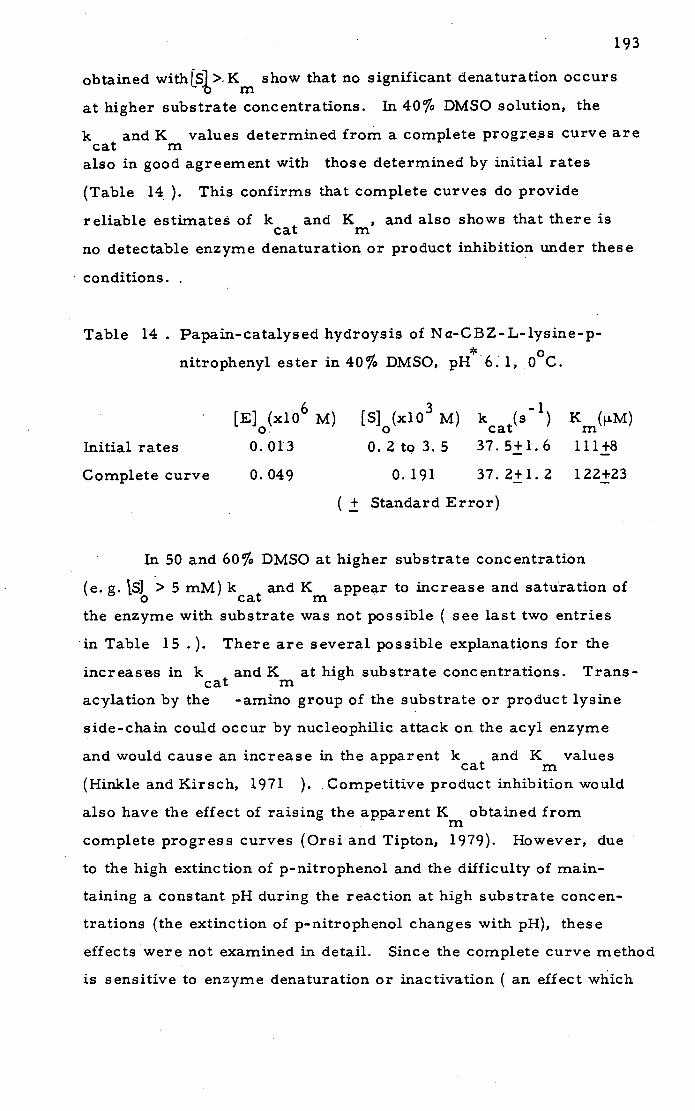
193
obtained withLSl >K show that no significant denaturation occurs b m
at higher substrate concentrations. In 40% DMSO solution, the
k cat in
and K values determined from a complete progress curve are
also in good agreement with those determined by initial rates
(Table 14 ). This confirms that complete curves do provide
reliable estimates of kcat m
and K , and also shows that there is
no detectable enzyme denaturation • or product inhibition wider these
conditions.
Table 14 . Papain-catalysed hydroysis of Na-CBZ-L-lysine-p-
nitrophenyl ester in 40% DMSO, pH*6. 1, .00
C.
[E](x10 6 M) [S](x10 3 M) k(s..:l) K(IJ.M)
Initial rates 0.013 0.2 to 3. 5 37. 5± 1 . 6 111 ±8
Complete curve 0.049 0.191 37 . 2± 1 . 2 122±23
(± Standard Error)
In 50 and 60% DMSO at higher substrate concentration
(e. g. IS) > 5 mM) k and K appear to increase and saturation of o cat in
the enzyme with substrate was not possible ( see last two entries
in Table 15 .). There are several possible explanations for the
increases in k cat m
and K at high substrate concentrations. Trans-
acylation by the -amino group of the substrate or product lysine
side-chain could occur by nucleophilic attack on the acyl enzyme
and would cause an increase in the apparent k cat in
and K values
(Hinkle and Kirsch, 1971 ).
. Competitive product inhibition would
also have the effect of raising the apparent Km obtained from
complete progress curves (Orsi and Tipton, 1979). However, due
to the high extinction of p-nitrophenol and the difficulty of main-
taining a constant pH during the reaction at high substrate concen-
trations (the extinction of p-nitrophenol changes with pH), these
effects were not examined in detail. Since the complete curve method
is sensitive to enzyme denaturation or inactivation ( an effect which

194
would be most pronounced over the long periods required for.
complete substrate hydrolysis when[S] is large ), this method
was not suitable for investigating these effects further. Due to
the experimental difficulties, an initial rate study at low temperature
was not undertaken, and at higher temperatures, the decreased
product solubility ruled out initial rate studies with high substrate
concentrations.
The data in Table 13 for K vs % DMSO is shown in
Figure 35 and in (K) vs % DMSO1n Figure 36
In 60% DMSO, with [S] < 5 mM, reproducible results for
k and K were obtainedbut for determinations wher4Sj< K: ., cat m o m
the values obtained must be regarded as minimum estimates for K * m
Table 15 lists the results for 60% DMSO, pH 6. 1 where values
of k and K can be estimated from the complete progress curves. cat rn
Table 15 . Papain-catalysed hydrolysis of Na-CBZ-L-lysine-p-
nitrophenyl ester in 60% DMSO pH* 6. 1.
Temp.(°C) [E](ii.M) [S](mM) k(s ' ) Km(mM) k/K(M ' s '
-3 0. 28 0.06 (First-order curve) 12500
-3 1.12 2.8 62.0±20.1 5.6±2.9 11100
-11 1.09 2.0 26.3-1-9.9 3.44±1.3 7650
-41 22.6 1.14 0.56+0.24 6.76±2.8 82.8
-41 11.3 .7.46 0.42+0. 16 53. 1±13.4 7.91 **
-40 10.1 39.0 467±171 139+45 3360
** (0. 2 M Buffer) (± Standard Error)
The results for K are fairly consistent when [SI o < 5 mM. m
The temperature dependence observations were therefore limited
to determinations of k cat m
/K with low substrate concentrations
(S3 << 2 mM) from first-order curves and initial rates. A plot of

Figure 35 . The dependence of K on DMSO m
concentration for the papain- catalys ed
hydrolysis of N a-CBZ- L-lysine-p-nitro- 0
phenyl ester at + 3 C. (From the data
in Table 13
Figure 36 . The dependence of In ( K m)
on
DMSO concentration.
195

:1,
I'S
i
400
200
-7
Im
-11
-12
20 40
% DMSO Figure 3
20 40
% DMSO
Figure 36
196
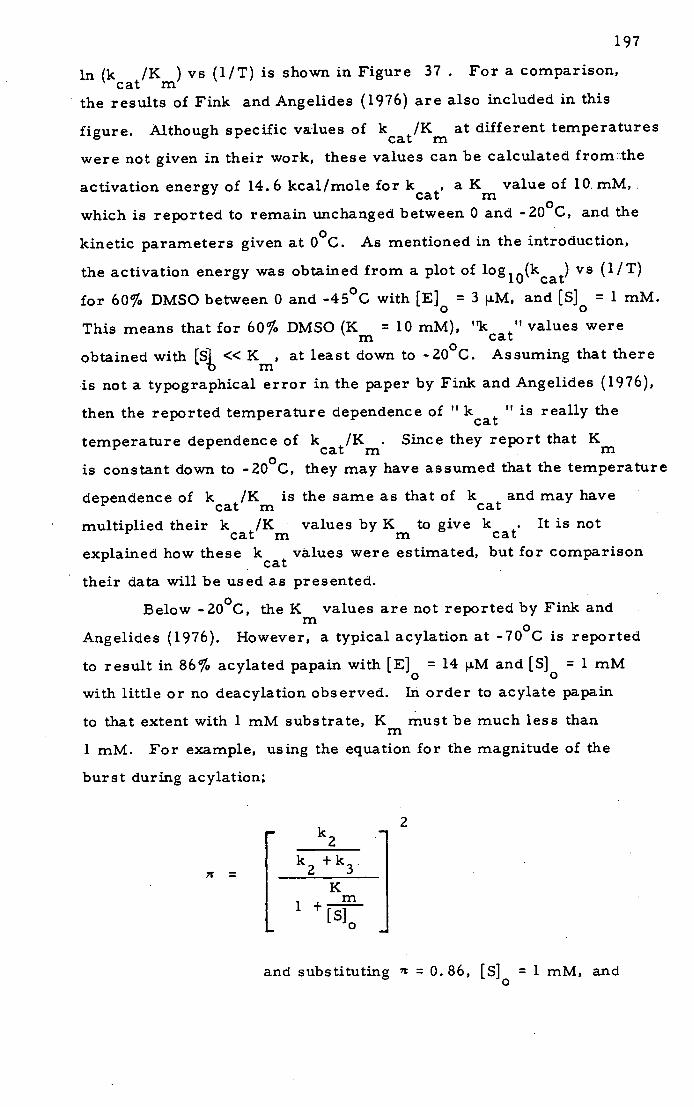
197
in (k cat m
/K ) vs (lIT) is shown in Figure 37 . For a comparison,
the results of Fink and Angelides (1976) are also included in this
figure. Although specific values of kr/K m at different temperatures
were not given in their work, these values can be calculated from ::the
activation energy of 14. 6 kcalfmole for k cat , a K m
value of 10. mM,
which is reported to remain unchanged between 0 and -200C, and the
kinetic parameters given at 00C. As mentioned in the introduction,
the activation energy was obtained from a plot of 1og10(kcat)vs (l/T)
for 60% DMSO between 0 and -450C with [E] = 3 .i.M, and [s] = 1 mM.
This means that for 60% DMSO (K m cat
= 10 mM), "k "values were
obtained with [St <<K, at least down to -20 0C. Assuming that there
is not a typographical error in the paper by Fink and Angelides (1976),
then the reported temperature dependence of " kcat " is really the
temperature dependence of k /K . Since they report that K cat m m
is constant down to -200C, they may have assumed that the temperature
dependence of k cat m cat
/K is the same as that of k and may have
multiplied their k cat m m cat
/K values by K to give k . It is not
explained how these kcat values were estimated, but for comparison
their data will be used as presented.
Below -200C, the Km values are not reported by Fink and
Angelides (1976). However, a typical acylation at -7 0 °C is reported
to result in 86% acylated papain with [E] = 14 iiM and [S] = 1 mM
with little or no deacylation observed. hi order to acylate papain
to that extent with 1 mM substrate, K must be much less than m
1 mM. For example, using the equation for the magnitude of the
burst during acylation;
= k 2 +k 3 .
[
K m
1 [s] 0
and substituting 7T = 0. 86, [S]0 = 1 mM, and

3.7 3.9 4.1 4.3
1 K')
10
1.1
- 6 4., cd U
2
Figure 37 . The temperature dependence of in ( k r /K)
for the papain-catalysed hydrolysis of Na-CBZ-L-
iysine-p-nitrophenyl ester, 60% DMSO, pH 6. 1.
A- Initial rates, [s] <<K 0 m
•- Complete first-order curves
• - Data of Fink and Angeiides (1976) calculated
from an activation energy of 14. 6 kcai/moi, K m = 10 mM.
From the slope of the line, Ea = 64. 6 ± 2. 7 kJ/mol
15.4 ± 0. 6 kcal/moi
198
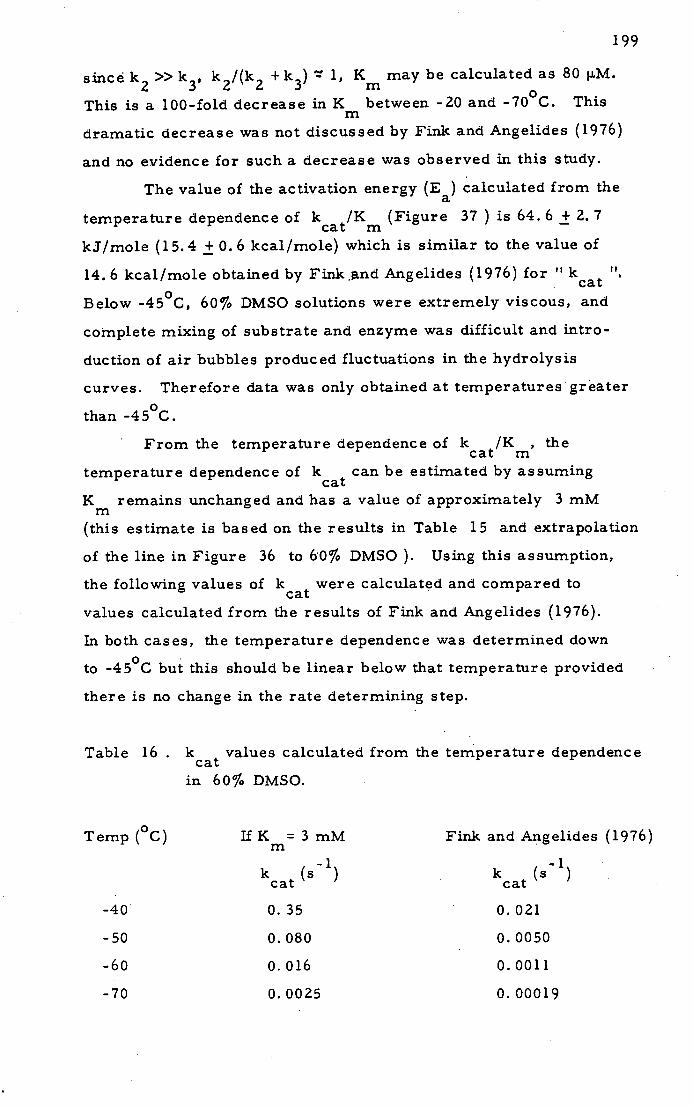
199
since k 2 >> k 3 , k 2/(k 2 + k 3 ) T 1, Km may be calculated as 80 i.M.
This is a 100-fold decrease in K between -20 and -700C. This
dramatic decrease was not discussed by Fink and Angelides (1976)
and no evidence for such a decrease was observed in this study.
The value of the activation energy (Ea) calculated from the
temperature dependence of kr/K (Figure 37 ) is 64. 6 ± 2. 7
kJ/mole (15.4 ± 0.6 kcal/mole) which is similar to the value of
14.6 kcal/mole obtained by Fink,and Angelides (1976) for htk cat
Below -450C, 60% DMSO solutions were extremely viscous, and
complete mixing of substrate and enzyme was difficult and intro-
duction of air bubbles produced fluctuations in the hydrolysis
curves. Therefore data was only obtained at temperatures greater
than -450
C.
From the temperature dependence of k cat m
/K , the
temperature dependence of kcat can be estimated by assuming
Km remains unchanged and has a value of approximately 3 mM
(this estimate is based on the results in Table 15 and extrapolation
of the line in Figure 36 to 60% DMSO ). Using this assumption,
the following values of kcat were calculated and compared to
values calculated from the results of Fink and Angelides (1976).
In both cases, the temperature dependence was determined down
to -4 5°C but this should be linear below that temperature provided
there is no change in the rate determining step.
Table 16 . kcat values calculated from the temperature dependence
in 60% DMSO.
Temp (°C) If K = 3 mM Fink and Angelides (1976) m
k (s ' ) k (_l)
cat cat
-40 0. 35 0.021
-50 0.080 0.0050
-60 0.016 0.0011
-70 0.0025 0.00019

200
The kcat values listed in Table 16 are approximately
1 5-times greater than the values calculated from Fink and Angelides
(1976). For an acyl- enzyme to be observed by 3C-NMR, the
enzyme must be saturated with substrate over long periods of time
(> 1 hour ); this requires [s]>> Km• The 13C-NMR experiments
require high concentrations of enzyme (-.. 1 mM ) in order to detect
an enzyme intermediate in a reasonably short period of time (-1 hr).
At -500C, 1 mM enzyme would hydrolyse 0.08 mM
s of substrate
under saturating conditions. In one hour, the enzyme would hydrolyse
288 mM substrate. At -600C, 58 mM substrate would be hydrolysed
over the same time period. Although this is much less than at -500
C,
a large amount of substrate is still required. At -70 0C, the enzyme
hydrolyses a relatively small amount of substrate ( 9 mM in 1 hr).
A 13C-NMR experiment would then require a temperature of -700
C
or below. A UV investigation at this temperature was not possible
due to the extremely viscous solutions obtained under these conditions.
In order to alleviate some of the viscosity probl.ms, 50%
DMSO solutions were used. These solutions have the advantage that
they are slightly less viscous, the Km is lower, and the results at
+30C suggest that kcat may be lower ( assuming that the plot of
in (k ) vs % DMSO, Figure 32 , is linear to 60% DMSO ). In a cat
similar study to the one in 60% DMSO solution, the papain-cataiysed
hydrolysis was studied over a temperature range from -42 to +30
C.
The results are shown in Table 17
The data in Table• 17 shows no significant change in K
over a 450
temperature range and the similarity between the
k cat m
/K values obtained from first-order curves and complete
progress curves is illustrated. In 50% DMSO, k cat m
and K values
can be obtained over a wide temperature range. The temperature
dependence of k /K and k are shown in Figures 38 and 39 cat m cat
respectively. Included in Figure 38 are values of k cat m
/K from
complete progress curves, first-order curves, and initial rates.

Table 17 . Papain-catalysed hydrolysis of Na-CBZ-L-lysine-p-nitrophenyl ester in 50% DMSO, pH6. 1.
Temp (°C) [E] (riM) [s] (mM) V kcat ') Km (mM) kt/K (Ms') m
+3 0.1 0.905 76.4 ± 4. 2 0. 500 ± 0. 048 153000
+3 0.1 0.044 **
149000
0 0.03 0.423 94.9±23.3 1.16±0.39 81800
-15 0.23 2.77 21.3 ± 1.3 0.974 + 0.119 21900
-21 0.21 1.00 14.8 ± 1.2 0.968 + 0.112 13200
-21 0.20 0.07 **
15000
-31 1.02 1.33 8.78±1.15 1.07±0.20 8210
-42 1.16 1.41 1. 21 ± 0. 12 0. 520 ± 0.092 2330
-42 2.33 0.028 **
1990
** (First-order curves) ( ± Standard Error)
in 50% DMSO, Buffer concentrations from 0. 01 to 0. 2 had no effect on the kinetic parameters
I', 0 I-.
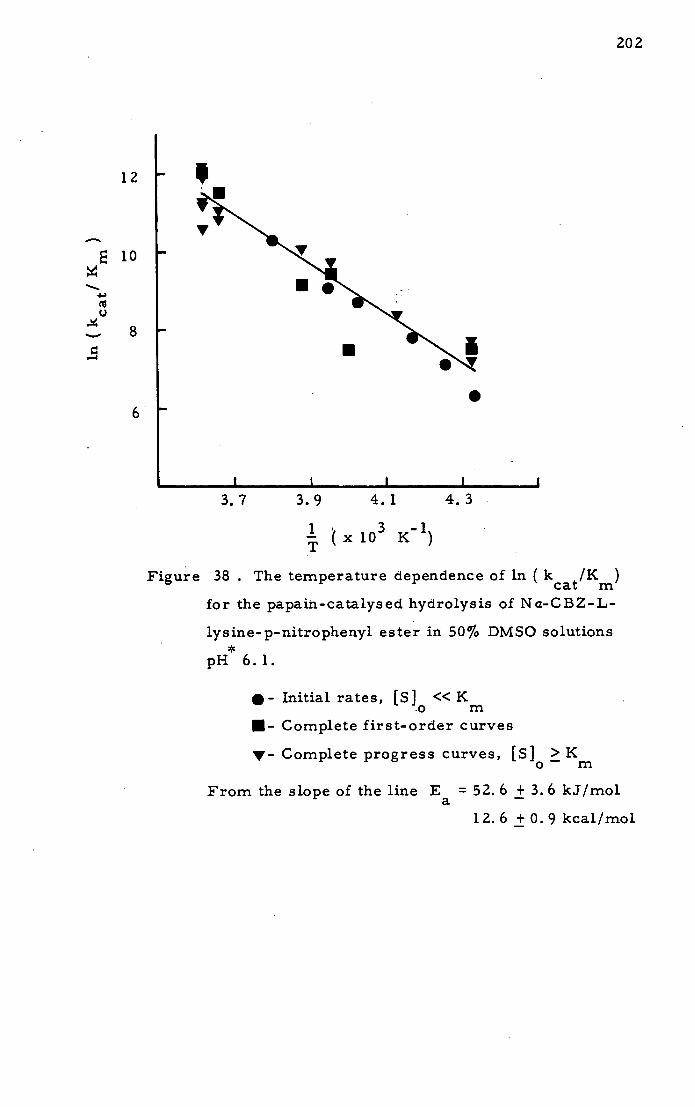
izE
202
E 10
Cd C)
-4
3.7 3.9 4.1 4.3
4 xiø3 K')
Figure 38 . The temperature dependence of in ( k s /K)
for the papain-catalysed hydrolysis of Na-CBZ-L-
iysine-p-nitrophenyl ester in 50% DMSO solutions *
pH 6.1.
•- Initial rates, [SI <<K m
R- Complete first-order curves
y- Complete progress curves, [5] > K o m
From the slope of the line Ea = 52. 6 ± 3. 6 kJ/mol
12.6 ±0.9 kcai/mol
M.
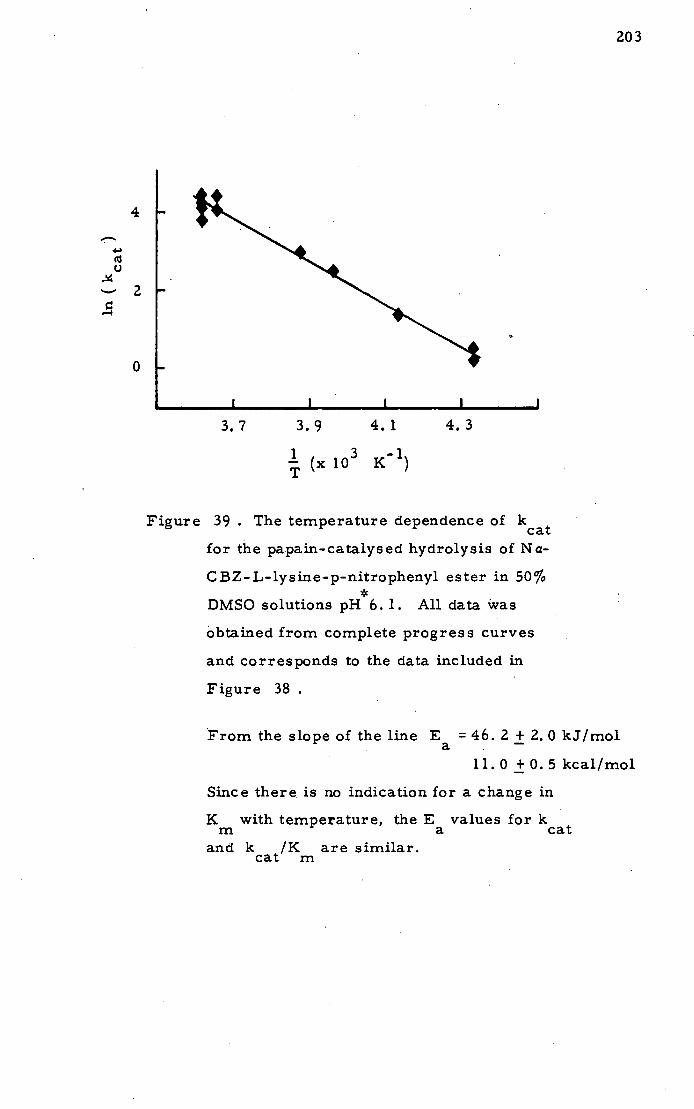
U
—2
3.7 3.9. 4.1 4.3
(x 1O 3 K)
Figure 39 . The temperature dependence of kcat
for the papain-catalysed hydrolysis of Na-
CBZ-L-lysine-p-nitrophenyl ester in 50% *
DMSO solutions pH 6. 1. All data was
obtained from complete progress curves
and corresponds to the data included in
Figure 38
From the slope of the line E = 46. 2 + 2. 0 kJ/mol a -
11.0 ± 0.5 kcal/mol
Since there is no indication for a change in
K with temperature, the E values for k m a cat
and k cat m
/K are similar.
203
204
k values were obtained from complete curves with K '! S <4K cat m o. m
and must be regarded as minimum values. Below -50 °C, mixing
problems produced unreliable data. Markely et al (1981) observed
mixing artefacts in their attempts to reproduce the earlier cryo-
enzymological results of Fink and co-workers.
The lower activation energy in 50% DMSO solutions ( 52. 6
kJ/mol calculated from the slope of Figure 38 ) indicates that at
low temperature the k values in 50% DMSO solutions would be cat
greater than those predicted for 60% DMSO solutions. The lower
activation energy in 50% DMSO solutions is consistent with the
results of Maurel et al. (1975) who observed an increase in the
activation energy with an increase in co-solvent concentration for the
trypsin-catalysed hydrolysis of BAEE. The slowest reactions are
therefore observed in 60% DMSO, and from the previous discussion,
this would require a temperature of < -70 0C for detection of an
acyl- enzyme by 13C-NMR.
The effects of temperature on a carbonyl resonance in the
13C-NMR spectrum was studied in 50% DMSO solution. The N-benzoyl-
imidazole results are useful for providing an estimate of the intensity
and resolution that can be expected for an enriched acyl- enzyme.
In that experiment, the low molecular weight benzoic acid carbonyl
signal was much narrower ( 5 Hz) than the enzyme-bound benzoyl
resonance ( 25 Hz). The linewidth of the benzoic acid signal doubled
in changing from 100% water at 25 0C to 25% DMSO at -70C. Similarly,
the linewidth of [1- 13C]-DL-lysine changed from 2.95 Hz in water at
250C to 5.7 Hz in 50% DMSO at -5
0C. The following table lists the
linewidth of [13C]-DL-lysine in 50% DMSO containing 0.8 mM
enzyme to produce a system similar to that required for detection
of an acyl enzyme. The NMR acquisition parameters are exactly
the same as described for the N-benzoylimidazole experiments; i. e.
low-power noise-decoupling, 10000 scans over a 45 minute period.
205
Table 18 . The variation in the linewidth of [1 3C]-DL-lysine
with temperature in 50% DMSO, pH4.
Temp (°C) Linewidth (Hz)
-5 5.7
-27 6.9
-50 19.8
The linewidth increases over 3-fold down at -500C; the same
temperature at which the tJV experiments indicated that the solutions
became extremely viscous. This 3-fold indrease in the linewidth
would also be expected for other resonances in the sample. That
means that an acyl-enzyme resonance similar to the benzoyl-papain
resonance would decrease in intensity 3-fold due to line broadening.
The signal-to-noise ratio of the transient thioester resonance in
the N-benzoylimidazole experiments was approximately 4 : 1. From
the results of the [1- 3C]-DL-lysine experiments, -50 0C would be
the lowest temperature possible for detecting a thioester resonance
in 50% DMSO. The natural-abundance protein spectrum in the same
sample was undetectable below -50C after 10000 scans. Remembering
that a thioacyl resonance will most likely be of a similar intensity
as the natural-abundance protein spectrum ( see Figure 12 in the
N-benzoylimidazole section), the lower lImit of -50 0C in 50% DMSO
may be optimistic for observation of an acyl-enzyme by 1 3C-NMR.
The results show that the reaction in 60% DMSO, pH6. 1 is
too fast at -500C and that temperatures below this are unsuitable
for NMR detection.
The reaction in 50% DMSO was studied at low pH in an attempt *
to reduce the turnover rate. At pH 3. 3, substrate concentrations in
the range 1 to 2 mM produced first-order curves showing K>> 2 mM.
The Km in water at 250C has been previously shown to increase seven-
fold on lowering the pH from 6. 2 to 3. 2 (Bender and Brubacher, 1966),

206
therefore any favourable decrease in kcat is offset by the increase
inK. rn
The temperature dependence of the reaction in 40% DMSO
is shown in Figures 40 and 41 . The activation energy is further
reduced and the reaction is limited to temperatures above -410
C,
the freezing point of these solutions.
Several alternative ternary cryosolvents were tested to
reduce viscosity and the effects on K. The most promising cryo-
solvent was 40% DMSO, 20% methanol, 40% water which was found
to be fluid down to the -70 to -800C range. Preliminary trials at
-600C showed a high K
m cat ('5-10 mM) and k values higher than
predicted for the 50 and 60% DMSO cryosolvents at -600C. DMSO:
acetone:water (4:2:4) cryosolvent had a similar viscosity to the
methanol ternary solvent but was not a good solvent for the substrate.
Douzou and Balny (1977) found that addition of water soluble
polyelectrolytes to cryosolvents reduced the co-solvent effects on the
kinetic parameters. They observed a ten-fold decrease in Km for
the trypsin-catalysed hydrolysis of BAEE in 50%. DMSO cryosolvent
by the addition of highly polymerized RNA. It was proposed that the
polyelectrolyte creates a microenvironment around the enzyme which
excludes the co-solvent. This preferential solvation fo the enzyme
acts to protect it from co-solvent effects and reduces the perturbation
of the kinetic parameters. A mole ratio of 1 : 1 polyelectrolyte to
enzyme was found to be suitable in reducing co-solvent effects in
50% DMSO.
The effect of RNA on the k cat m
and K of the papain-catalysed
hydrolysis was studied in 50% DMSO solution. The results of a pre.-
liminary investigation are shown in Table 19

Figure 40 . The temperature dependence of in (kcat/Km)
for the papain-catalysed hydrolysis of Na-
CBZ-L-lysine-p-nitrophenyl ester in 40% *
DMSO, pH 6. 1. The data was obtained
from complete hydrolysis curves.
From the slope of the line, E a = 46. 2 + 2. 0 kJ/moi - 11.0 ± 0.5 kcal/mol
Figure 41 The temperature dependence of kcat
in 40% DMSO, pH 6. 1. The data
was obtained from complete progress
curves.
E a = 35. 0 + 3. 5 kJ/mol - 9. 36 ± 0. 84 kcal/mol
207
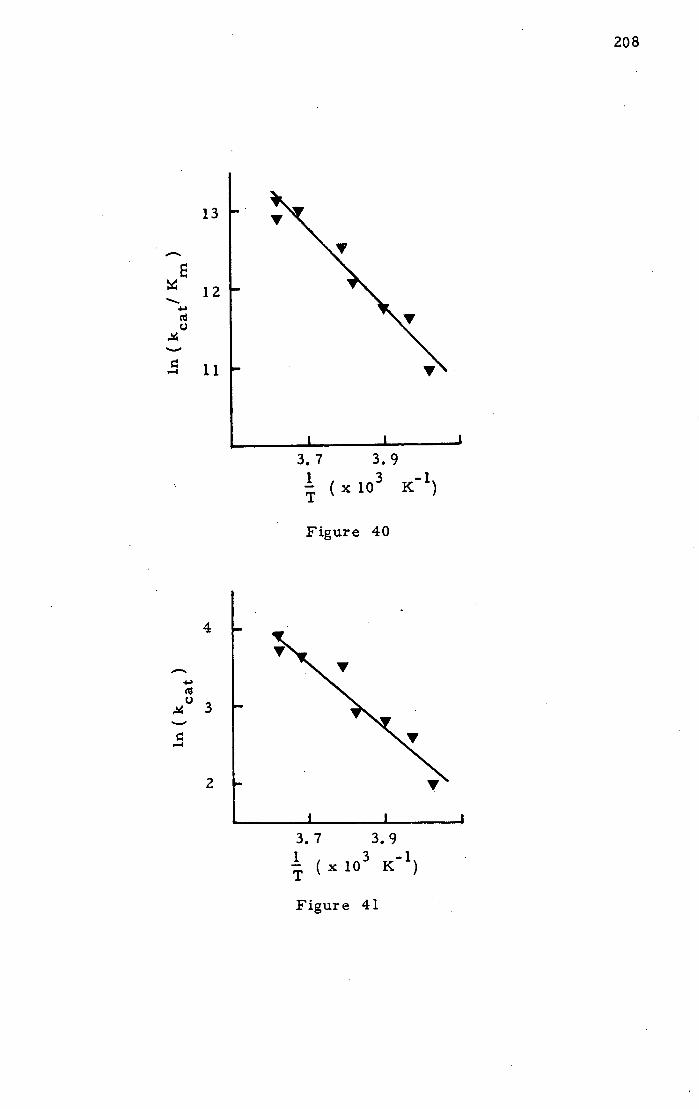
13
12
208
3.7 3.9
(x10 3 K)
Figure 40
4
U 3
'-4
2 y
x 10 3 L( 1 )
Figure 41
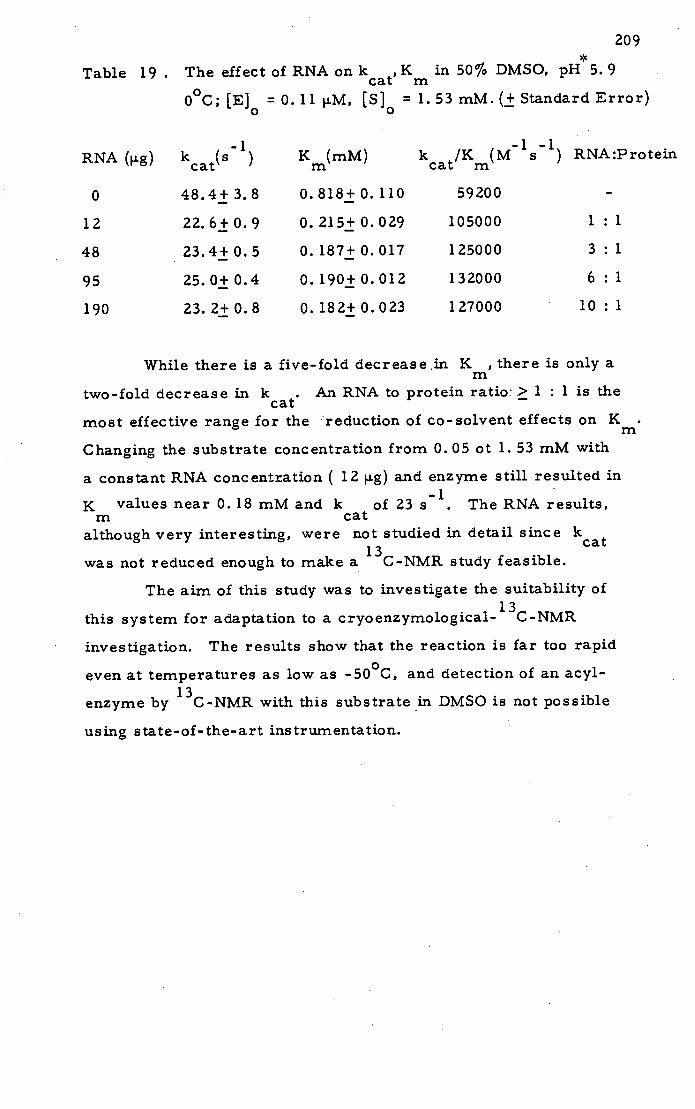
209
Table 19 . The effect of RNA on k cat' in 50% DMSO, pH5. 9
00C; [E] = 0.11 M, [S] =1.53 mM. (± Standard Error)
RNA (.g) k(s 1 )
K m
(mM)
k cat m
/K (Ms) RNA:Protein
0 48 . 4± 3 . 8
0.818±0.110
59200 -
12 22.6±0.9
0.215±0.029
105000 1 : 1
48 . 23.4±0.5
0. 187± 0.017
125000 3 : 1
95 25.0±0.4
0.190±0.012
132000 6 : 1
190 23.2±0.8
0. 182± 0.023
127000 10 : 1
While there is a five-fold decrease in K , there is only a m
two-fold decrease in k cat . An RNA to protein ratio:> 1 : 1 is the
most effective range for the reduction of co-solvent effects on K m
Changing the substrate concentration from 0. 05 ot 1. 53 mM with
a constant RNA concentration ( 12 g) and enzyme still resulted in
K m cat
values near 0. 18 mM and k of 23 The RNA results,
although very interesting, were not studied in detail since kcat
was not reduced enough to make a 13C-NMR study feasible.
The aim of this study was to investigate the suitability of
this system for adaptation to a cryoenzymological- 13C-NMR
investigation. The results show that the reaction is far too rapid
even at temperatures as low as -500C, and detection of an acyl-
enzyme by 13C-NMR with this substrate in DMSO is not possible
using state-of-the-art instrumentation.
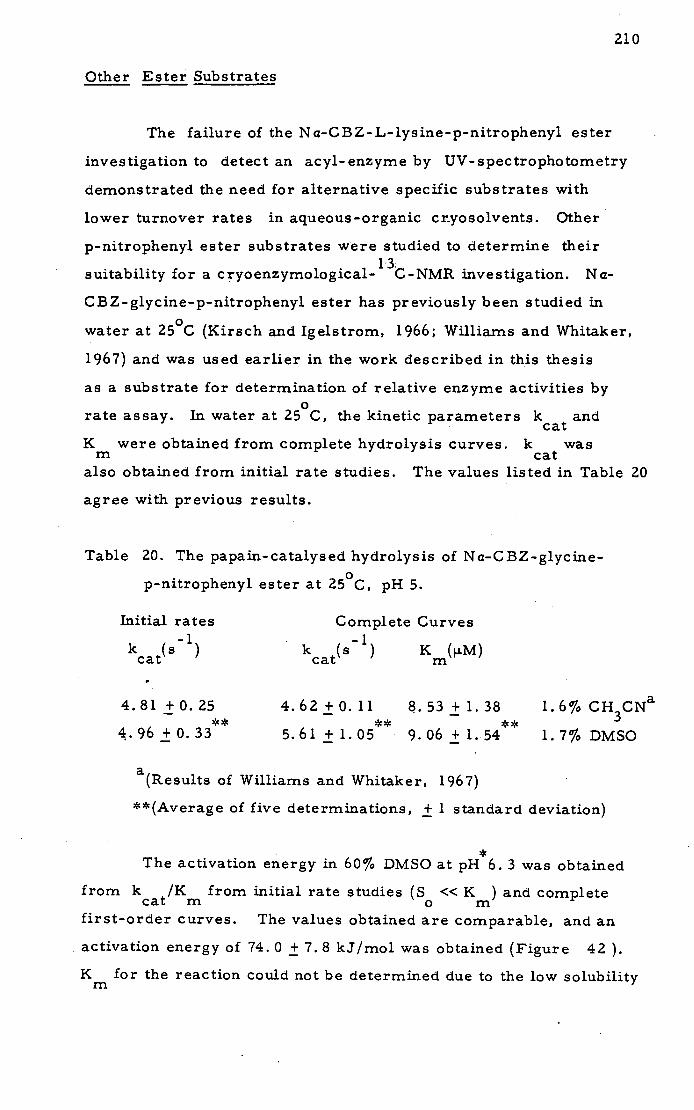
210
Other Ester Substrates
The failure of the Na-CBZ-L-lysine-p-riitrophenyl ester
investigation to detect an acyl-enzyme by UV-spectrophotometry
demonstrated the need for alternative specific substrates with
lower turnover rates in aqueous-organic ctyosolvents. Other
p-nitrophenyl ester substrates were studied to determine their
suitability for a c ryoenzymo1ogica1 c -NMR investigation. Na-
CBZ-glycine-p-nitrophenyl ester has previously been studied in
water at 250C (Kirsch and Igeistrom, 1966; Williams and Whitaker,
1967) and was used earlier in the work described in this thesis
as a substrate for determination of relative enzyme activities by
rate assay. In water at 250C, the kinetic parameters kcat and
K m cat
were obtained from complete hydrolysis curves. k was
also obtained from initial rate studies. The values listed in Table 20
agree with previous results.
Table 20. The papain-catalysed hydrolysis of Na-C BZ-glycine-
p-nitrophenyl ester at 250C, pH 5.
Initial rates Complete Curves
k cat (el
cat
) k (si
m ) K (i.M)
4.81 ± 0.25 4.62 ± 0.11 8.53 ± 1.38 1.6% CH CNa ** ** **
4.96±0.33 5 . 61 ± 1 . 05 9.06±1.54 1.7%DMSO
a(Results of Williams and Whitaker, 1967)
**(Average of five determinations, ± 1 standard deviation)
* The activation energy in 60% DMSO at pH 6. 3 was obtained
from k cat m o m
/K from initial rate studies (S <<K ) and complete
first-order curves. The values obtained are comparable, and an
activation energy of 74. 0 ± 7. 8 kJ/mol was obtained (Figure 42 ).
K m
for the reaction could not be determined due to the low solubility
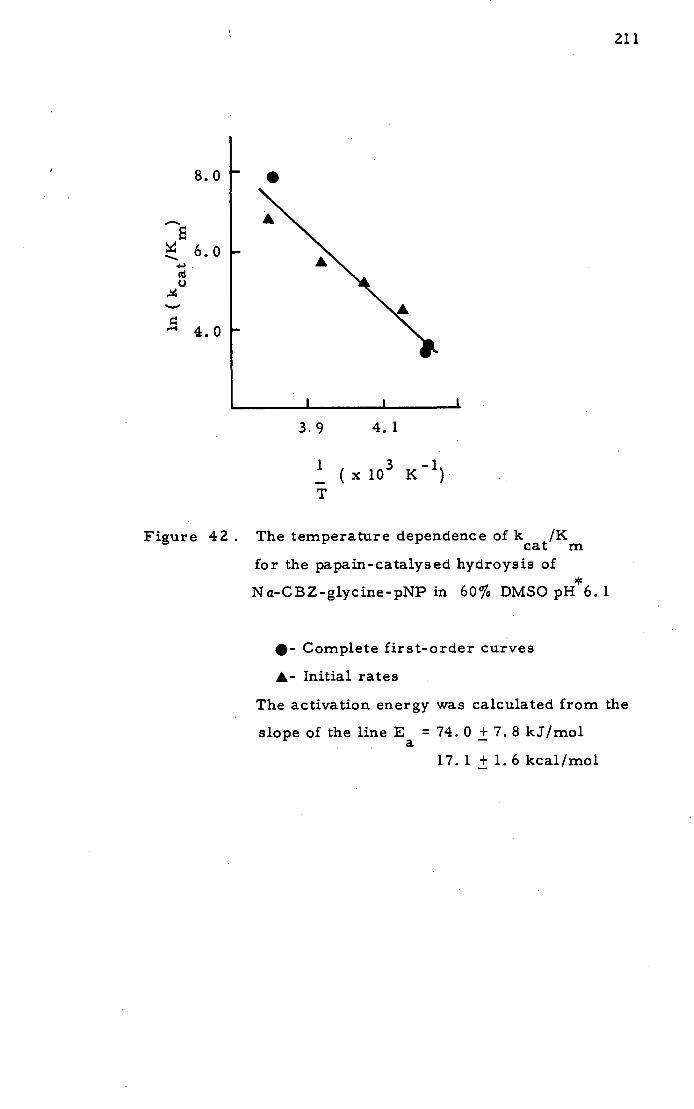
6.0
'•4 4.0
8.0
3.9 4.1
.::. ( x 10 K 1 )
T
Figure 42 . The temperature dependence of k /K cat m
for the papain-catalysed hydroysis of
Na-CBZ-glycine-pNP in 60% DMSO pH*6. 1
•- Complete first-order curves
A- Initial rates
The activation energy was calculated from the
slope of the line E a = 74. 0 + 7. 8 kJ/mol -
17. 1 ± 1. 6 kcal/mol
211
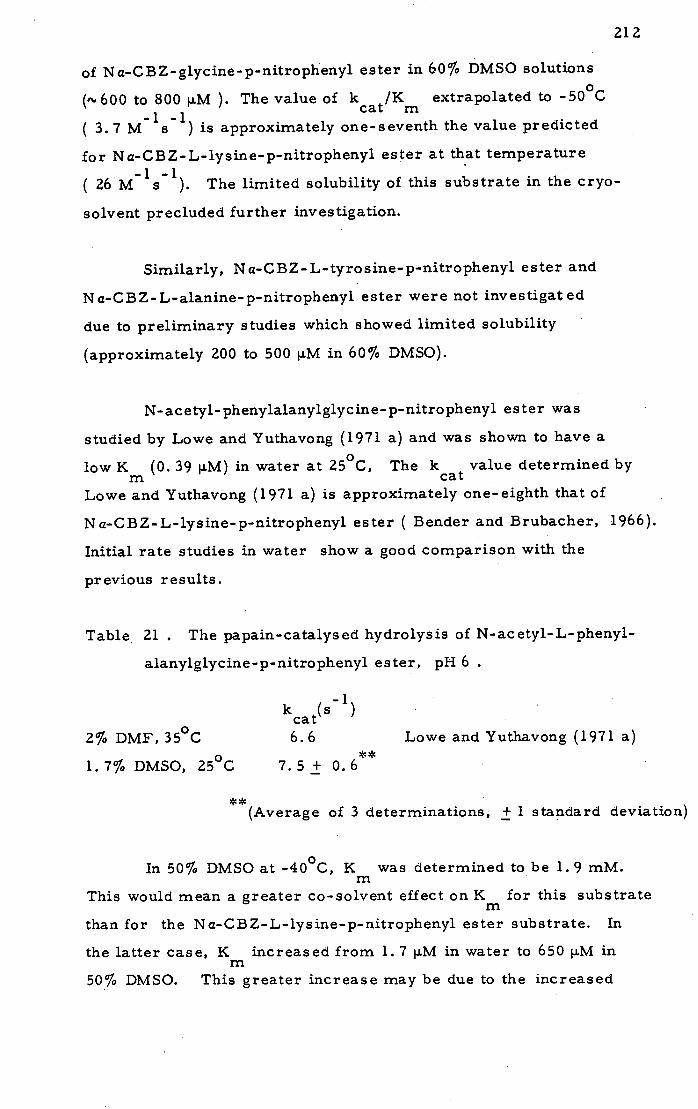
212
of Na-CBZ-glyciflepflitrOPheflYl ester in 60% DMSO solutions
('..600 to 800 i.i.M ). The value of k cat m /K extrapolated to -50
0C
( 3. 7 M s ) is approximately one-seventh the value predicted
for N a-CBZ- L-lysine-p-nitrophenyl es ter at that temperature
( 26M1s 1)• The limited solubility of this substrate in the cryo-
solvent precluded further investigation.
Similarly, N a-CBZ- L-tyrosine-p-nitrophenyl ester and
N a-CBZ- L-alanine-p-nitrophenyl ester were not investigated
due to preliminary studies which showed limited solubility
(approximately 200 to 500 p.M in 60% DMSO).
N-acetyl- phenylalanylglycine- p- nitro phenyl ester was
studied by Lowe and Yuthavong (1971 a) and was shown to have a
low K m
(0. 39 p. cat
M) in water at 25 °C, The k value determined by
Lowe and Yuthavong (1971 a) is approximately one-eighth that of
Na-CBZ-L-lysine-p-nitrophenyl ester ( Bender and Brubacher, 1966).
Initial rate studies in water show a good comparison with the
previous results.
Table 21 . The papain-catalysed hydrolysis of N-acetyl-L-phenyl-
alanylglycine-p-nitrophenyl ester, pH 6
k (s i ) cat
2% DMF, 35°C 6.6 Lowe and Yuthavong (1971 a) **
1.7% DMSO, 250
C 7.5+ 0.6
** (Average of 3 determinations, ± 1 standard deviation)
In 50% DMSO at -400C, Km was determined to be 1.9 mM.
This would mean a greater co-solvent effect on K m
for this substrate
than for the Na-CBZ-L-lysine-p-nitrophenyl ester substrate. In
the latter case, K increased from 1.7 p.M in water to 650 p.M in
50% DMSO. This greater increase may be due to the increased
213
contribution of hydrophobic interactions to the binding of the
dipeptide substrate. The effect of temperature on k 1K cat m
is shown in Figure 43 . An activation energy of 64. 0 ± 2. 1
kJ/mol was calàulated from the data in Figure 43 and the value
of k 1K predicted at -50 °C (63 M1s .1)
is approximately cat m
one-sixth the value of k 1K predicted from the temperature cat m
dependenc e of kcat/K for Na-C BZ- L-lysine-p-nitrophenyl
ester under these same conditions. Assuming a K of 1. 9 mM
at -500C, the kcat value at this temperature would be only a third
of that for the lysine substrate. The decrease in the turnover rate
was not great enough to merit further investigation and this substrate
was concluded to be unsuitable for a cryoenzymological- 13C-NMR
investigation.
None of the ester substrates investigated was found to
be adaptable to a 13
-NMR- cryo enzymological mv estigation
designed to detect an acyl- enzyme. The results illustrate the
specific requirements needed in a substrate, namely, high
solubility, low kcat and Km and a high activation energy.
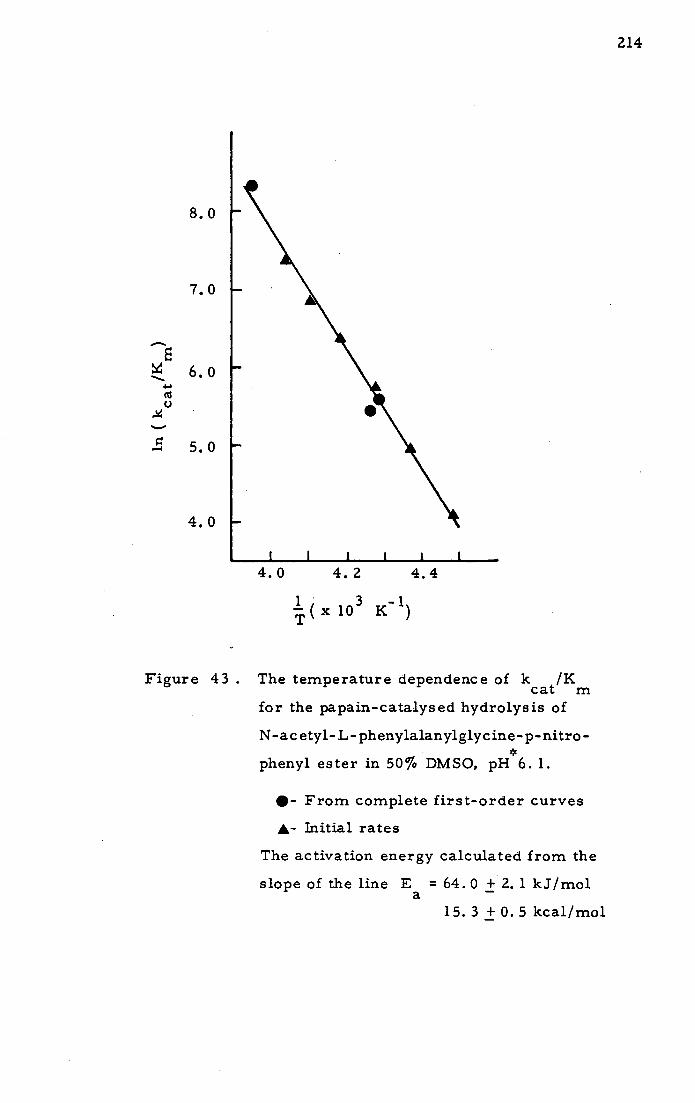
4.0 4.2 4.4
(x1O 3 K')
8. 0
7. 0
6.0
5.0
4.0
Figure 43 . The temperature dependence of k /K cat m
for the papain-catalysed hydrolysis of
N-ac etyl- L- phenylalanylglycine- p- nitro -
phenyl ester in 50% DMSO, pH6. 1.
•- From complete first-order curves
A- Initial rates
The activation energy calculated from the
slope of the line Ea = 64. 0 ± 2. 1 kJ/mol
15.3 + 0.5 kcal/mol
214

REFERENCES
215

216
Alber, T., Petsko, G. A. and Tsernglou, D. (1976) Nature
(London), 263, 297-300.
Alecio, M. R., Dann, M. L. and Lowe, G. (1974) Biochem. J.,
141, 495-501.
Allen, K. G. D., Stewart, J. A., Johnson, P. E. and Wettlaufer,
D. G. (1978) Eur. J. Biochem., 87, 575-582.
Allerhand, A., (1979) Methods in Enzymól. , 61, (Enzyme Structure,
Part H) Academic Press, New York., pp. 458-549.
Allerhand, A. , Childers, R. F., and Old.field, E. (1973)
Biochemistry, 12, 1335-1341.
Allerhand, A., Doddrell, D., Glushko, V., Cochran, D. W.,
Wenkert, E.,, Lawson, P. J. and Gurd, F. R. N. (1971)
J. Am. Chem. Soc., 93, 544-546.
Allerhand, A., Norton, R. S. and Childers, R. F. (1977)
J. Biol. Chem., 252, 1786-1794.
Angelides, K. J. and Fink, A. L. (1978) Biochemistry, 13,
2659- 2668.
Angelides, K. J. and Fink, A. L. (1979 a) Biochemistry, 18,
2355- 236 3.
Angelides, K. J. and Fink, A. L. (1979 b) Biochemistry, 18,
2363-2369.
Antonini, E., Brunori, M., Conti, F. and Geraci, G. (1973)
FEBS Lett., 34, 69-70.
Arnon, R. (1970) Methods in Enzymol., 19, Academic Press,
NewYork., pp. 226-244.
Asb6th, B. and Po1gr, L. (1983) Biochemistry, 22, 117-122.
Atkins,: C. L. and Nimmo, I. A. (1980) Anal. Biochem.,
104, 1-9.
Baillargeon, M. W.,, Laskowski, M., Neves, D. E., Porubcan,
M. A. , Santini, R. E. and Markley, J. L. (1980)
Biochemistry, 19, 5703-5710.
217
Baines, B. S. and Brocklehurst, K. (1978) Biochem. J.,
173, 345-347.
Baines, B. S. and Brocklehurst, K. (1979) Biochem. J.,
177, 541-548.
Balls, A. K. and Lineweaver, H. (1939) J. Biol. Chem.,
130, 669-686.
Bal1s, A. K., Lineweaver, H. and Thompson, R. R. (1937)
Science, 86, 379.
Balny, C. and Bieth, J. G. (1977) FEBS Lett., 80, 182-186.
Banerjee, R. and Lhoste, J. -M. (1976) Eur. J. Biochem.,
67, 349-356.
Banerjee, R., Stetzkowski, F. and Lhoste, J. -M. (1976)
FEES Lett., 70, 171-174.
Bendall, M. R., Cartwright, I. L., Clark, P. I., Lowe, G.
and Nurse, D. (1977) Eur. J. Biochem., 79, 20 1-209.
Bendall, M. R. and Lowe, G. (1976) Eur. J. Biochem., 65,
481-49 1.
Bender, M. L. (1960) Chem. Rev., 60, 53-113.
Bender, M. L., Begu-Canton, M. L., Blakely, R. L.,
Brubacher, L. J., Feder, J., Gunter, C. R., Kezdy,
F. J., Killheffer, Jr., J. V., Marshall, T. H., Miller,
C. G., Roeske, R. W. and Stoops, J. K. (1966) J. Am.
Chem. Soc., 88, 5890-5913.
Bender, M. L. and Brubacher, L. J. (1964) J. Am. Chem. Soc.,
86, 5333-5334.
Bender, M. L. and Brubacher, L. J. (1966) J. Am. Chem. Soc.,
88, 5880-5889.
Bender, M. L. and Ginger, R. D. (1955) J. Am. Chern. Soc.,
77, 348-351.
Bender, M. L. and Thomas, R. J. (1961) J. Am. Chem. Soc.,
83, 4183-4189.
Berger, A. and Schechter, I. (1970) Phil. Trans. Roy. Soc.
London, B, 257, 249-264.

218
Bergmann, M., Zervas, L. and Fruton, J. S. (1935) J. Biol.
Chem., 111, 225-244.
Bergmann, M., Zervas, L. and Fruton, J. S. (1936) J. Biol.
Chem., 115, 593-611.
Bezas, B. and Zervas, L. (1961) J. Am. Chem. Soc., 83,
719-723.
Bielski, B. H. and Freed, S. (1964) Biochim. Biophys. Acta,
, 314-323.
Blumberg, S., Schechter, I. and Berger, A. (1970) Eur. J.
Biochem., 15, 97-102.
Boettcher, B. and Martinez-Carrion, M. (1975) Biochem.
Biophys. Res. Commun., 64, 28-33.
Breitmaier, E. and Voelter, W. (1978) 13C-NMR Spectroscopy,
Monographs in Modern Chemistry, v. 5, Verlag Chemie,
Weinham, New York.
Brocklehurst, K., Cans son, J., Kierstan, M. P.. J. and Crook,
E. M. (1973) Biochem. J. 133, 573-584.
Brocklehurst, K., Canisson, J., Kierstan, M. P. J. and Crook,
E. M. (1974) Methods in Enzymol., 34B, Academic Press,
NewYork., pp. 531-534.
Brocklehurst, K., Crook, E. M. and Wharton, C. W. (1968)
FEBS Lett., 2, 69-73.
Brocklehurst, K. and Little, G. (1970) FEES Lett. , 9, 113-116.
Brocklehurst, K. and Little, G. (1972) Biochern. J., 128, 471-474.
Brocklehurst, K. and Little, G. (1973) Biochem. J., 133, 67-80.
Brubacher, L. J. and Bender, M. L. (1966) J. Am. Chem. Soc.,
88, 5871-5880.
Bruice, T. C. (1961) Organic Sulfur Compounds, v. 1, (N. Khar.asch,
ed.)Pergamon Press, Oxford., ch. 35.
Bruice, T. C. and Benkovic, S. J. (1966) Bioorganic Mechanisms,
v. 1, W. A. Benjamin, Inc., New York. pp. 259-297.
Bunton, C. A. and Spatcher, D. N. (1956) J. Chem. Soc., 1079-1080.

219
Burke, D. E., Lewis, S. D. and Shafer, J. A. (1974) Arch.
Biochem. Biophys., 164, 30-36.
Caplow, M. (1969) J. Am. Chem. Soc., 91, 36 39-3645.
Carey, P. R., Carriere, R. G., Lynn, K. R. and Schneider, H.
(1976) Biochemistry, 15, 2387-2393.
Carey, P. R., Carriere, R. G., Phelps, D. J. and Schneider, H.
(1978) Biochemistry, 1081-1087.
Choc, M. G. and Caughey, W. S. (1981) J. Biol. Chem., 256,
1831- 1838.
Choi, M. and Thornton, E. R. (1974) J. Am. Chem. Soc., 96,
1428-1436.
Clark, P. I., Lowe, G. and Nurse, D. (1977) J. Chem. Soc.,
Chem. Commun., 451-453.
Coggins, J. R., Kray, W. and Shaw, E. (1974) Biochem. J.,
137, 579-585.
Compton, P. and Fink, A. L. (1980) Biochem. Biophys. Res.
Commun., 93, 427-431.
Creighton, D. J., Gessouroun, M. S. and Heapes,. J. M. (1980)
FEES Lett., 110, 319-322.
Doub, L. and Vandenbelt, J. M. (1947) J. Am. Chem. Soc.,
69, 2714-2723.
Douzou, P. (1973) Mol. Cell. Biochem., 1, 15-27.
Douzou, P. (1974) Methods Biochem. Anal., 22, 401-512.
Douzou, P. (1977) Adv. Enzymology, 45, 157-272.
Douzou, P. (1979) Qu. Rev. Biophysics, 12, 521-569.
Douzou, P. and Balny, C. (1977) Proc. Nati. Acad. Sci., USA,
74, 2297-2300.
Douzou,P. and Balny, C. (1978) Adv. Protein Chem., 32, 77-189.
Douzou, p., Hui Bon Hoa, G., Maurel, P. and Travers, F. (1976)
Handbook of Biochemistry and Molecular Biology, v. 1,
(Fasman, G. D., ed., 3rd Edition) Chemical Rubber Co.,
Cleveland, Ohio., pp. 520-539.
Drenth, J., Jansonius, J. N., Koekoek, R., Sluyterman, L. A. AE.
and Woithers, B. G. (1970) Phil. Trans. Roy. Soc. London, B,
220
257, 231-236.
Drenth, J., Jansonius, J. N., Koekoek, R., Swen,, H. M. and
Woithers, B. G. (1968) Nature (London), 218, 929-932.
Drenth, J., Jansonius, J. N., Koekoek, R. and Woithers, B. G.
Adv. Protein Chem., 25, 79-115.
Drenth, J., Jansonius, J. N. and Woithers, B. G. (1967)
J. Mol. Biol., 24, 449-457.
Drenth, J., Kalk, K. H. and Swen, H. M. (1976) Biochemistry,
15, 3731-3738.
Eakin, R. T., Morgan, L. 0. and Matwiyoff, N. A. (1975)
Biochemistry, 14, 4538-4543.
Fastrez, J. and Fersht, A. R.. (1973) Biochemistry, 12, 1067-1074.
Feeny, J., Burgen, A. S. V. and Grell, E. (1973) Eur. J. Biochem.,
34, 107-111.
Fersht, A. R. (1972) J. Am. Chem. Soc., 94, 293-295.
Fersht, A. R. (1977) Enzyme Structure and Mechanism, W. H.
Freeman and Company, Ltd., Reading.
Fersht, A. R. and Requena, Y. (1971) J. Am. Chem. Soc.,
93, 7079-7087.
Fink, A. L. (1973 a) Arch. Biochem. Biophys., 155, 473-474.
Fink, A. L. (1973 b) Biochemistry, 12, 1736-1742.
Fink, A. L. (1974 a) Biochemistry, 13, 277-280.
Fink, A. L. (1974 b) J. Biol. Chem., 249, 5027-5032.
Fink, A. L. (1976 a) Biochemistry, 15, 1580-1586.
Fink, A. L. (1976 b) J. Theor. Biol., 61, 4 19-445.
Fink, A. L. (1977) Acc. Chem. Res., 10, 233-239.
Fink, A. L. and Ahmed, A. I. (1976) Nature (London), 263,
294-297.
Fink, A. L. and Angelides, K. J. (1976) Biochemistry, 15,
5287-5293.
Fink, A. L. and Cartwright, S. J. (1981) CRC Grit. Rev.
Biochem., 11, 145-207.
221
Fink, A. L., Feldman, R. and Zehnder, J. (1979) Biochem. J.,
181, 733-736.
Fink, A. L. and Geeves, M. A. (1979) Methods in Enzymol.,
63, Part A, Academic Press, New York., pp. 336-370.
Fink, A. L. and Meehan, P. (1979) Proc. Natl. Acad. Sci., USA,
76, 1566-1569.
Fink, A. L. and Petsko, G. A. (1981) Adv. Enzymol. Relat. Areas
Mol. Biol., 52, 177-246.
Fink, A.: L. and Wildi, E. (1974) J. Biol. Chem., 249, 6087-6089.
Frankfater, A. and Kuppy, T. (1981) Biochemistry, 20, 5517-5524.
Gerken, T. A., Jentoft, J. E., Jentoft, N. and Dearborn, D. G.
(1982) J. Biol. Chem., 257, 2894-2900.
Gerngross, 0. (1913) Chem. Ber., 46, 1908-1913.
Ghisla, S., Hastings, J. W., Favaudon, V. and Lhoste, J. -M.
(1978) Proc. Natl. Acad. Sci., USA, 75, 5860-5863.
Giacometti, C. M., Giardina, B., Brunori, M., Giacometti, G.
and Rigatti, G. (1976) FEBS Lett., 62, 157-160.
Gilbert, H. F. and Jencks, W. P. (1977) J. Am. Chem. Soc.,
99, 7931-7947.
Glazer, A. N. (1966) J. Biol. Chem., 241, 3811-3817.
Glazer, A. N. and Smith, E. L. (1971) The Enzymes, 3, (Boyer,
P. D., ed.,) 3rd Edition, Academic Press, New York.,
pp. 501-546.
Glushko, V., Lawson, P. J. and Gurd, F. R. N. (1972) J. Biol.
Chem., 247, 3176-3185.
Goren, H. J. and Fridkin, M. (1974) Eur. J. Biochem., 41,
263-272.
Greenstein, J. P. and Winitz, M. (1961) Chemistry of the Amino
Acids, v. 2, John Wiley and Sons, New York., p. 1688.
Hall, C. M. and Wemple, J. (1977) J. Org . Chem., 42, 2118-2123.
Hanson, K. R. (1966) J. Am. Chem. Soc., 88, 2731-2742.
1-Iargreaves, M. K., Stevinson, E. A. and Evans, J. (1965) J. Chem.
Soc., 458 2-4583.
222
Hellstr6m, N. and Almqvist, S. -0. (1970) J. Chem. Soc., (B),
1396-1400.
Henderson, P. J. F. (1972) Biochem. J., 127, 321-333.
Henes, J. B., Mattis, J. A. and Fruton, J. S. (1979) Proc. Nati.
Acad, Sci., USA, 76, 1131-1134.
Henry, A. C. and Kirsch, J. F. (1967) Biochemistry, 6, 3536-3544.
Hine, J. and Weimer, Jr., R. D. (1965) J. Am. Chem. Soc., 87,
3387-3396.
Hinkle, '. M. and Kirsch, J. F. (1970) Biochemistry, 9, 4633-4643.
Hinkle, P. M. and Kirsch, J. F. (1971) Biochemistry, 10, 2717-2726.
Hirsch, J. A. and Jarmas, A. A. (1978) J. Org . Chem., 43,
4 106-4110.
Hollaway, M. R. and Hardman, M. J. (1973) Eur. J. Biochem.,
32, 537-546.
Houston, L. L. and Walsh, K. A. (1970) Biochemistry, 9, 156-166.
Howard, J. B. and Glazer, A. N. (1967) J. Biol. Chem., 242,
5715- 57 23.
Huber, R. and Bode, W. (1978) Acc. Chem. Res., 11, 114-122.
Huber, R., Kukia, D., Bode, W., Schwager, P., Bartels, K.,
Deisenhofer, J. and Steigemann, W. (1974) J. Mol. Biol.,
89, 73-101.
Hui Bon Hoa, C. and Douzou, P. (1973) J. Biol. Chem., 248,
4649-46 54.
Hunkapiller, M. W., Forgac, M. D. and Richards, J. H. (1976)
Biochemistry, 15, 5581-5588.
Hunkapiller, M. W., Forgac, M. D., Yu, E. H. and Richards,
J. H. (1979) Biochem. Biophys. Res. Commun., 87, 25-31.
Hupe, D. J. and Jencks, W. P. (1977) J. Am. Chem. Soc., 99,
451-464.
Husain, S. S. and Lowe, G. (1965) J. Chem. Soc., Chem. Commun.,
34 5-346.
Husain, S. S. and Lowe, G. (1968) J. Chem. Soc., Chern. Commun.,
310- 311.
223
Husain, S. S. and Lowe, G. (1969) Biochem. J., 114, 279-287.
Husain, S. S. and Lowe, G. (1970) Biochem. J., 116, 689-69 2.
Inagami, T. and Sturtevant, J. M. (1964) Biochem. Biophys.
Res. Commun.,14, 69-74.
Jackman, L. M. and Sternhell, S. (1969) Applications of Nuclear
Magnetic Resonance in Organic Chemistry, 2nd Edition,
Pergamon Press, Oxford.
Jaffe, H. H. and Orchin, M. (1962) Theory and Applications of
Ultraviolet Spectroscopy, John Wiley and Sons, Inc.,
NewYork., p. 533.
Jencks, W. P. and Carriuolo, J. (1959) J. Biol. Chem., 234, 1272-1279.
Jentoft, J. E., Dearborn, D. G., Gerken, T. A. and Jentoft, N.,
(1980) Biophys. J., 32, 97-99.
Jentoft, J. E., Gerken, T. A., Jentoft, N. and Dearborn, D. G.
(1981) J. Biol. Chem., 256, 231-236.
Jentoft, J. E., Jentoft, N., Gerken, T. A. and Dearborn, D. G.
'(1979) J. Biol. Chem., 254, 4366-4370.
Jentoft, N. and Dearborn, D. G. (1979) J. Biol. Chem., 254, 4359-4365.
Johnson, L. F. and Jarikowski, W. C. (1972) Carbon-13 NMR
Spectra, John Wiley and Sons, New York.
Keilen, D. and Hartree, E. F. (1949) Nature (London), 164,
254-259.
Kende, A. S. (1960) Org. Reactions, 11, 261-316.
Khalifah, R. G. (1977) Biochemistry, 16, 2236-2240.
Khalifah, R. G., Strader, D. J., Bryant, S. H. and Gibson, S. M.
(1977) Biochemistry, 16, 2241-2247.
Kimmel, J. R. and Smith, E. L. (1954) J. Biol. Chem., 207,
515-531.
Kimmel, J. R. and Smith, E. L. (1957) Adv. Enzymol., 19, 267-334.
Kirsch, J. F. and Igelstr6m, M. (1966) Biochemistry, 5, 783-791.
Kirsch, J. F. and Katchaiski, E. (1965) Biochemistry, 4, 884-890.
Koenig, S. H., Brown, R. D.,, Needham, T. E. and Matwiyoff, N. A.
(1973) Biochern. Biophys. Res. Commun., 53, 624-630.

224
Kraicsovits, F. and Douzou, P. (1973) Biochimie, 55, 1007-1010.
Kunimitsu, D. K. and Yasunobu, K. T. (1970) Methods in Enzymol.,
19, Academic Press, New York., pp. 244-252.
Larroque, C., Maurel, P., Balny, C. and Douzou, P. (1976)
Anal. Biochem., 73, 9-19.
Levy, G. C. and Edlund, U. (1975) J. Am. Chem. Soc., 97,
5031-5032.
Levy, G. C. and Nelson, G. L. (1972 a) Carbon-13 Nuclear
Magnetic Resonance for Organic Chemists, John Wiley
and Sons, New York.
Levy, G. C. and Nelson, G. L. (1972 b) J. Am. Chem. Soc., 94,
4897-4901.
Lewis, Jr., C. A. and Wolfenden, R. (1977 a) Biochemistry, 16
4886-4890.
Lewis, Jr., C. A. and Wolfenden, R. (1977 b) Biochemistry, 16,
4 890-4895.
Lewis, S. D., Johnson, F. A., Ohno, A. K. and Shafer, J. A.
(1978) J. Biol. Chem., 253, 5080-5086.
Lewis, S. D., Johnson, F. A. and Shafer, J. A. (1976) Biochemistry,
15, 5009-5017.
Lienhard, G. E. and Jencks, W. P. (1966) J. Am. Chem. Soc.,
88, 3982-3995.
Lowbridge, J. and Fruton, J. S. (1974) J. Biol. Chem., 249,
6 54-6761.
Lowe, G. (1979) Phil. Trans. Roy. Soc. London, B, 257, 237-248.
Lowe, G. and Whitworth, A. S. (1974) Biochem. S., 141, 503-515.
Lowe, G. and Williams, A. (1964) Proc. Chem. Soc., 140-141.
Lowe, G. and Williams, A. (1965 a) Biochem. J., 96, 189-193.
Lowe, G. and Williams, A. (1965 b) Biochem. J., 96, 199-204.
Lowe, G. and Yuthavong, Y. (1971 a) Biochem. J., 124, 107-115.
Lowe, G. and Yuthavong, Y. (1971 b) Biochem. J., 124, 117-122.
Lucas, E. C. and Caplow, M. (1972) J. Am.. Chem. Soc. 94,
960- 96 3.

225
Lucas, E. C., Caplow, M. and Bush, K. J. (1973) J. Am. Chem.
Soc., 95, 2670-2673.
Lucas, E. C. and Williams, A. (1969) Biochemistry, 8, 5125-5135.
Lyerla, J. .R. and Grant, D. M. (1972) MTP International Rev. Sci.,
(Phys. Chem. Series 1) v. 4, (McDowell, C. A., ed.,)
Butterworths., ch. 5.
Makinen, M. W. and Fink. A. L. (1977) Ann. Rev. Biophys.
Bioeng. 6, 301-343.
Maithouse, J. P. G., Mackenzie, N. E., Boyd, A. S. F. and
Scott, A. I. (1983) J. Am. Chem. Soc., 105, 1685-1686.
Maithouse, J. P. G. (1983) unpublished results.
Markicy, J. F., Travers, F. and Balny, C. (1981) Eur. J.
Biochem., 120, 477-485.
Mattis, J. A. and Fruton, J. S. (1976) Biochemistry, 15, 2191-2194.
Mattis, J. A., Henes, J. B. .an.d Fruton, J. S. (1977) J. Biol. Chem.,
252, 6776-6782.
Matwiyoff, N. A., Vergamini, P. J., Needham, T. E., Gregg, C. T.,
Volpe, J. A. and Caughey, W. S. (1973) J. Am. Chem. Soc.,
95, 4429-4431.
Maurel, P. (1978) J. Biol. Chem., 253, 1677-1683.
Maurel, P., I-Iui Bon Hoa, G. and Douzou, P. (1975) J. Biol. Chem.,
250, 1376-1382.
Maurel, P., Travers, F. and Douzou, P. (1974) Anal. Biochem.,
57, 555-563.
Mitchel, R. E. J., Chaiken, I. M. and Smith, E. L. (1970) J.
Biol. Chem., 245, 3485-3492.
Miziorko, H. M. and Mildvan, A. S. (1974) J. Biol. Chem.,
249, 2743-2750.
Mole, J. E. and Horton, H. R. (1973) Biochemistry, 12, 816-822.
Moon, R. B., Dill, K. and Richards, J. H. (1977) Biochemistry,
16 221-228.
Moon, R. B. and Richards, J. H. (1972) J. Am. Chem. Soc.,
94, 5093-5095.
226
Moon, R. B. and Richards, J. H. (1974) Biochemistry, 13,
3437-3443.
Morgan, L. 0., Eakin, R. T., Vergamini, P. J. and Matwiyoff,
N. A. (1976) Biochemistry, 15, 2203-2207.
Morrison, J. F. (1969) Biochim. Biophys. Acta, 185, 269-286.
Morrow, J. S., Keim, P. and Gurd, F. R. N. (1974) J. Biol.
Chem., 249, 7484-7494.
Morrow, J. S., Keim, P., Visscher, R. B., Marshall, R. C.
and Gurd, F. R. N. (1973) Proc. Nati. .Acad, Sci., USA,
70, 1414-1418.
Morrow, J. S., Matthew, J. B., Wittebort, R. J. and Gurd,
F. R. N. (1976) J. Biol. Chem., 251, 477-484.
Nigen, A. M., Keim, P., Marshall, R. C., Glushko, V., Lawson,
P. J. and Gurd, F. R. N. (1973) J. Biol. Chem., 248,
3716- 37 23.
Nigen, A. M., Keim, P., Marshall, R. C., Morrow, J. 3. and
Gurd, F. R. N. (1972) J. Biol. Chern., 247, 4100-4102.
Nigen, A. M., Keim, P., Marshall, R. C., Morrow, J. S., Vigna,
R. A. and Gurd, F. R. N. (1973) J. Biol. C hem., 248,
3724- 3732.
Niu, C. -H., Shindo, H., Cohen, J. S. and Gross, M. (1977)
J. Am. Chem. Soc., 99, 3161-3162.
Norton, R. S., Clouse, A. 0., Addleman, R. and Allerhand, A.
(1977) J. Am. Chem. Soc., 99, 79-83.
Oldlield, E., Norton, R. S. and Allerhand, A. (1975 a) J. Biol.
Chem., 250, 6368-6380.
Qldfield, E., Norton, R. S. and Allerhand, A. (1975 b) J. Biol.
Chem., 250, 6381-6402.
O'Leary, M. H. and Kluetz, M. D. (1971) J. Am. Chem. Soc.,
665-666.
O'Leary, M. H. and Kluetz, M. D. (1972) J. Am. Chem. Soc.,
3585-3589.
O'Leary, M. H., Urberg, M. and Young, A. P. (1974) Biochemistry,
13, 2077-2081.

227
Orsi, B. A. and Tipton, K. F. (1979) Methods in Enzymol., 63,
Academic Press, NewYork., pp. 159-183.
Ozaki, Y., Pliura, D. H., Carey, P. R. and Storer, A. C. (1982)
Biochemistry, 21, 3102-3108.
Petkov, D. D. (1978) Biochim. Biophys. Acta, 523, 538-541.
Poulos, T. L., Alden, R. A., Freer, S. T., Birktoft, J. J. and
Kraut, J. (1976) J. Biol. Chen-i., 251, 1097-1103.
Primrose, W. U., Mackenzie, N. E. and Scott, A. I. (1983)
unpublished results.
Raban, M. and Mislow, K. (1967) Topics in Stereochemistry,
2, 199-230.
Rich, D. H., Bernatowicz, M. S. and Schmidt, P. G. (1982)
J. Am. Chem. Soc., 104, 3535-3536.
Richarz, R., Tschesche, H. and Wuthrich, K. (1980) Biochemistry,
19, 5711-5715.
Robertus, J. D., Kraut, J., Alden, R. A. and Birktoft, J. J. (1972)
Biochemistry, 11, 4293-4303.
Robillard, G., Shaw, E. and Shulman, R. G. (1974) Proc. Natl.
Acad. Sci., USA, 71, 26 23-2626.
Robinson, D. R. (1970) J. An-i. Chem. Soc., 92, 3138-3146.
Robinson, G. W. (1975) Biochemistry, 14, 3695-3700.
Rodgers, P. and Roberts, G. C. K. (1973) FEBS Lett., 36, 330-333.
Ruhlmann, A., Kukla, D., Schwager, P., Bartels, K. and Huber, R.
(1973) J. Mol. Biol., 77, 4 17-436.
Sadler, I. H. (1973) J. Chem. Soc., Chem. Commun., 809-810.
Schechter, I. and Berger, A. (1967) Biochem. Biophys. Res.
Commun., 27, 157-162.
Schechter, I. and Berger, A. (1968) Biochem. Biophys. Res.
Commun., 32, 898-902.
Schiller, R. and Otto, R. (1876) Chem. Ber., 9, 1634-1636.
Scott, K. N. (1972) J. Am. Chem. Soc., 94, 8564-8568.
Shaw, D. (1976) Fourier Transform NMR Spectroscopy, Elsevier
Scientific Publishing Company, Amsterdam.
228
Shindo, H. and Cohen, J. S. (1976) Proc. Natl. Acad. Sci., USA,
73, 1979-1983.
Shinitzky, M. and Goldman, R. (1967) Eur. J. Biochem., 3, 139-144.
Shipton, M. andBrocklehurst, K. (1978) Biochem. J., 171, 385-401.
Shipton, M., Kierstan, M. P. J., Maithouse, J. P. G., Stuchbury,
T. and Brocklehurst, K. (1975) FEBS Lett., 50, 365-368.
Sluyterman, L. A. AE. (1967) Biochim. Biophys. Acta, 139,
418-429..
Sluyterman, L. A. AE. (1968) Biochirn. Biophys. Acta, 151,
178- 187.
Sluyterman, L. A. AE. and De Graaf, M J. M. (1969) Biochim.
Biophys. Acta, 171, 277-287.
Sluyterman, L. A. AE.and Widjenes, J. (1970) Biochem. Biophys.
Acta, 200, 593-595.
Smith, D. J., Maggio, E. T. and Kenyon, G. L. (1975) Biochemitry,
• 14, 766-771. • -
Smith, E. L. (1958).J. Biol. Chem., 233, 1392-1397.
Smith, E. L., Fin.kle, B. J. and Stockell, A. (1955 a) Diss. Faraday
Soc., 20, 96-104.
Smith, E. L., Kimrnel, J. .R., Brown, D. M. and Thompson, E. 0. P.
• (1955 b) J. Biol. Chem., 215, 67-89.
Smith, E. L. and Parker, M. J. (1958) J. Biol. Chem., 233, 1387-1391.
Smith, J. H. (1976) J. Am. Chem. Soc., 98, 3598-3601.
Stein, P. J., Merrill, S. P. and Henkens, R. W. (1977) J. Am. Chem.
Soc., 99, 3194-3196.
Steiner, R. F. (1971) Biochemistry, 10, 771-778.
Stockell, A. and Smith, E. L. (1957) J. Biol. Chem., 227, 1-26.
Storer, A. C., Murphy, W. F. and Carey, P. R. (1979) J. Biol.
Chem., 254, 3163-3165.
Stothers, J. B. (1972) Carbon-13 NMR Spectroscopy, Academic
Press, New York.
Strader, D. J. and Khalifah, R. G. (1976) J. Am. Chem. Soc.,
98, 5043-5044.

229
Stuchbury, T., Shipton, M., Norris, R., Maithouse, J. P. G.,
Brocklehurst, K., Herbert, J. A. L. and Suschitzky, H.
(1975) Biochem. J., 151, 417-432.
Sweet, R. M., Wright, H. T., Janin, J., Clothia, C. H. and
Blow, D. M. (1974) Biochemistry, 13, 4212-4228.
Timasheff, S. N. (1970) The Enzymes, 2, (Boyer, P. D., ed.,)
Academic Press, New York, pp. 371-443.
Travers, F. and Douzou, P. (1974) Biochimie, 56, 509-514.
Travers, F., Douzou, P., Pederson, T. and Gunsalus, I. C.
(1975) Biochimie, 57, 43-48.
Tschesche, R. R. H. and Wüthrich, K. (1980) Biochemistry,
19, 5711-5715.
Vergamini, P. J., Matwiyoff, N. A., Wohi, R. C. and Bradley, T.
(1973) Biochem. Biophys. Res. Commun., 55, 453-461.
Waley, S. G. (1981).Biochem. J., 193, 1009-1012.
Walters, D. E. and Allerhand, A. (1980) J. Biol. Chem., 255,
6200-6204.
Wehrli, F. W. and Wirthlin, T. (1976) Interpretation of Carbon-13
NMR Spectra, Heyden and Son, Ltd., London.
Weiss, J. (1937) Chem. md. (london), 15, 685-686.
Westerik, J. 0G. and Wolfenden, R. (1972) J. Biol. Chem., 247,
8 195-8 197.
Whitaker, J. R. (1969) Biochemistry, 8, 4591-4597.
Whitaker, J. R. and Bender, M. L. (1965) J. Am. Chem. Soc.,
87, 2728-2737.
Whitaker, J. R. and P erez- Villas enor, J. (1968) Arch. Bioch.
Biophys., 124, 70-78.
Wilbur, D. J. and Allerhand, A. (1976)J. Biol. Chem., 251,
5187-5194.
Wilbur, D. J. and Allerhand, A. (1977 a) J. Biol. Chem., 252,
4968-49 75.
Wilbur, D. J. and Allerhand, A. (1977 b) FEES Lett., 79, 144-146.
Wilkinson, G. N. (1961) Biochem. J., 80, 324-332
230
Williams, A., Lucas, E. C. and Rimmer, A. R. (1972 a) J. Chem.
Soc., Perkin II, 621-627.
Williams, A., Lucas, E. C., Rimmer, A. R. and Hawkins, H. C.
(1972 b) J. Chern. Soc., Perkin II, 627-633.
Williams, D. C. and Whitaker, J. R. (1967) Biochemistry, 6,
3711-3717.
Wolfenden, R. (1972) Acc. Chem. Res., 5, 10-18.
Yeagle, P. L., Lochmiiller, C. H. and Henkens, R. W. (1975)
Proc. Natl. Acad. Sci., USA, 72, 454-458.
Yuthavong, Y. and Suttimool, W. (1979) Biochim. Biophys. Acta,
523, 198-206.
Zannis, V. I. and Kirsch, J. F. (1978) Biochemistry, 17, 2669-2674.
Zerner, B. and Bender, M. L. (1964) J. Am. Chem. Soc., 86,
3669-3674.
P tJBLICATION
231

Reprinted from the Journal of the American Chemical Society, 1982, 104, 6811. Copyright © 1982 by the American Chemical Society and reprinted by permission of the copyright owner
Cryoenzymology of Proteases: NMR Detection of a Productive Thioacyl Derivative of Papain at Subzero Temperaturet
J. Pil-G. Malthöuse,' Michael P. Gamcsik,' ilan S. F. Boyd,' Neil E. Mackenzie, 2 and A. Ian Scott 1,2
Department of Chemistry, University of Edinburgh Edinburgh EH9 3JJ, Scotland
Center for Biological NMR, Department of Chemistry Texas' A & M University, College Station, Texas 77843
Received August 11, 1982
It is generally accepted 3 that the hydrolysis of peptides and mides catalyzed by the thiol protease papain can be represented y a minimal three-step pathwa as in Scheme I. The reactions re controlled by a thiolate ion (cys-25) at the active site of papain n a sequence involving binding, acylation, and deacylation. ;tractural evidence for the thioacyl intermediate 1 is limited to lectronic absorption data in which acylation of papain by N-innamoylimidazole gave rise to a UV spectrum red shifted by 0 nm relative to the model, (S)-trans-cinnamoylcysteine. 5 More lirect evidence bearing on this point comes from the observation 6 if a species assigned to a dithioester structure with X m 313 nm cf. dithioacetate, X 305 nm) in the papain-catalyzed hydrolysis if methyl thionohippurate. As a result of the development in our aboratory of reliable protocols for the observation of covalently ound intermediates of enzymes and their substrates by 13C NMR pectroscopy at subzero temperatures, we can now report on the lirect observation of a productive thioacyl intermediate prepared rom papain and [ 13C=O]-N-benzoylimidazole by adapting the echniques of cryoenzymology' to a 13C NMR experiment. To nonitor the extent of benzoylation of papain and the rate of leacylation, we used the high reactivity of 2,2'-dipyridyl disulfide 8 oward the thiolate ion of cys-25 in papain at pH 3.8 to titrate
free thiolate in aliquots of incubation mixtures corresponding to the time course NMR experiment, using 1-2 mM solutions of papain and a large excess (—'20 mM) of substrate in formate buffer. After many trials the following conditions gave completely reproducible results in which a suitable concentration (—p1 mM) and t 1 ,, 2 (>30 mm) of the intermediate were achieved. Papain (1.7 mM) in formate buffer (0.1 M, pH 4.1) was mixed with 90% enriched [ 13C=O]-N-benzoylimidazole 9" 0 (23.6 mM) in 25% Me2SO-d6 at 0 °C then rapidly cooled to —6 °C. An aliquot of this solution was kept at —6 °C and active site thiol concentration measured throughout the NMR time course.
At 0 °C papain was 96% acylated (thiolate assay) while at —6 °C the half-life of deacylation is 96 mm. The time course of the CMR experiment is shown in Figure 1 a—f. The broad (25 ± 5 Hz) resonance at 196.0 ppm is assigned to the thiobenzoate (2, Scheme II) of papain labeled at 13C==O (cf. phenylthiobenzoate, ô 189.1;" n-butyl thioacetate, 194.1 12). The rate of disappearance of the signal at 196.0 ppm (allowing for experimental error due
Dedicated to the memory of the late Professor F. gorm. a To whom correspondence should be addressed at the Center for Biological
NMR, Texas A&M University. University of Edinburgh. Texas A&M University. Lowe, G. Tetrahedron 1976, 32, 291. Presumed tetrahedral intermediates have not been included in the
scheme. Brubacher, L. J.; Bender, M. L. I. Am. Chem. Soc. 1966, 88, 5871. Lowe, G.; Williams, A. Biochem. J. 1965, 96, 189. Douzou, P. Cryobiochemistry"; Academic Press: London/New York,
1977. Brocklehurst, K.; Little, G. Biochem. J. 1972, 128, 471. Gerngross. 0. Chem. Be,. 1913, 46, 1908.
Caplow, M.; Jencks, W. P. Biochemistry 1962, 1, 883. Schiller, R.; Otto, R. Chem. Be,. 1876,9, 1635. 13C NMR spectrum
recorded in Me2SO.d6 (present work). Johnson, L. F.; Jankowski, W. C. Carbon-I3 NMR Spectra"; Wiley:
New York, 1972.
0002-7863/82/1504-681 l$0l.25/0 © 1982 American Chemical Society

681 2 J. Am. chem. Soc., Vol. 104, No. 24, 1982
Sct emel
0 0 ,Dindinq
_________ * ac Ioton R— C—x + E—SH R—C---x:E—SH 2
papain
HX + Rf—S—E I4 O deacylatioi E—SH +
11 thioacyl
intermediate 1
Communications to the Editor
Scheme 11
168.7 ppm o 196 ppm
R—SH + Ph— II,
-C--N I R—S—C—Ph +
papain II 2 0
BI
HN I - RSH + HO2 13CPh
173.1 ppm
to line broadening) corresponds well with t112, measured inde-pendently by titration with 2,24pyridyl disulfide. Moreover, the thiobenzoate signal at 196.0 ppm was not observed in the control hydrolysis experiment in the absence of papain at pH 4.1. Apart from the resonances due to papain at natural abundance, in which Arg C-6 (158 ppm) and Tyr C-7 (156 ppm)' 3 are clearly discerned, together with broad carbonyl resonances between 170 and 180 ppm, a signal at 165.2 ppm (A in Figure la,b) was also detected in the absence of both formate and papain and is ascribed to the carbonyl resonance of benzoic anhydride, which has been shown to hydrolyze to benzoic acid at pH 4.1. It should be noted that theremaining triplet centered at 170.1 ppm (pH 4.1) (Figure la-f) is chic to partially.decoupled formateand is shifted to 169.3 ppm at jH 3.8 (Figure ig).
After 17 h at -6 °C, the reaction mixture used in the above expriments was diluted (X4), low molecular weight material was
rfhr
ed by gel filtration, and the sample was concentrated by utration, whereupon titration with 2,2'-dipyridyl disulfide s no loss of fast-reacting thiol at pH 3.8. The 13C NMR sm of this sample exhibited a broad resonance at 168-170 phich resolved clearly into two peaks at 168.7 and 169.1 p subtraction of the ' 3C NMR spectrum of papain. By a with model compounds and studies on trypsin,' 4 the main S this nonspecific benzoylation are assigned to the amino anolic side chains of the 10 lysine and 19 tyrosine residues oin.
rom the above data we conclude that (a) papain reacts with bei oylimidazole to form a thioacyl intermediate unambiguously det cted by 13C NMR spectroscopy at -6 °C, (b) the rate of decay of i tis intermediate is equal to the rate of regeneration of the active cen er thiolate ion of papain as measured by titration with 2,2 ..dipyridyl disulfide, and (c) nonspecific benzoylation of lysine an tyrosine residues of papain can be observed by virtue of the ap mrance of resonances at 168-170 ppm.
hese results show that it is possible to characterize a labile co lent enzyme-substrate intermediate under well-defined cry enzymological conditions by 13C NMR spectroscopy and to obs rye its transformation to product. Previous studies 15 have pr ided 13C NMR evidence for acetyl chymotrypsin stabilized at pH 5.1 at room temperature. The experiments described herein sh w that it is now possible to observe at subzero temperatures en rne-substrate intermediates that would escape detection above
0 0
C or at higher ratios of substrate to enzyme. Further re-fin ment of the technique to evolve parameters for the observation
Allerhand, A. Methods Enzymol. 1979, 61, 458. Houston, L. L.; Walsh, K. A. Biochemistry 1910, 9, 156.
, (lS) Niu,:C;.H.; Shindo. H.; Cohen, J. S. J. Am. Chem. Soc. 1917. 99,
L
a)
200 180 160 ,ppm Figure 1. (a-f) 1.7 mM papain (72% active enzyme), 5.4mM potassium chloride, 25% v/v Me2SO, 0.1 M sodium formate buffer (pH 4.1), 23.6 mM benzoylmiidazole. [ 13C"O]Benzoylimidazole was added at 0 °C after 1.5 mm, the reaction mixture cooled to –6 °C, and the NMR data acquisition commenced 6 min after the reaction was initiated. Spectra a–f represent 10000 accumulations recorded sequentially starting at 6, 51, 96, 141, 186, and 231 min after adding bcnzoylimidazole. The insert at 200-192 ppm is a 3-fold vertical expansion of this spectral range. (g) 2.03 mM papain (72% active enzyme), 6.5 mM potassium chloride, 25% v/v Me2SO, 0.1 mM sodium formate buffer (pH 3.8). (h) 2.3 mM papain (72% active enzyme), 7.5 mM potassium chloride, 25% v/v Me2SO (pH = 6.4). Papain was purified by salt precipitation and co-valent chromatography' 8 ' 9 to 95% activity. Concentration and treat-ment with aqueous Me2SO reduced activity to 72%.
of acyl and tetrahedral intermediates ' 6 ' 7 of thiol and serine proteases is in progress.
0 6) Fink, A. L. Acc. Chem. Res. 1977, 10, 233.
Acknowledgment. We thank the Science and Engineering Research Council (U.K.) for generous support of this work and for the provision of a Bruker WB 300-MHz spectrometer.
Registry No. Papain, 9001-73-4; N-benzoylimidazole, 10364-94-0.
Marklcy, J. L; Neves, D. E.; Wt1er, W. M.; Ibanez, I. B.; Porbucan, M. A.; Baillargeon, M. W. Dev. Biochem. 1980, 10, 31.
Brocklehursi, K.; Carlsson, 1.; Kierstan, M. P. 3.; Crook, E. M. Biochem. J. 1973, 133, 573.
Stuchbury. 1.; Shipton, M.; Norris, R.. Malthouse, J. P. 0.; Brock-lehurst, K. Blochem. J. 1975, Iii, 417.
6813
I have attended the following lectures and seminars:
Biosynthesis - Dr. T. J. Simpson ( 5 lectures)
Natural Products - Professor A. I. Scott ( 5 lectures)
-Lactam Antibiotics - Glaxo Research ( 5 lectures )
Pulse sequences in NMR - Dr. C. A. Morris
( 5 lectures )
Bio-organic chemistry - series of 5 lectures
Current topics in organic chemistry. - organic staff
(10 lectures )
Professor Scott's research group seminars over
a period of one year.
Various departmental colloquia and seminars and
Monday evening organic seminars over three years.
235


![13C NMR AND DENSITY FUNCTIONAL THEORY STUDY OF …lfd/Lfz/474/21/Ljp47421.pdf · tion of 13C NMR critical o w [12] is the only appli-cation of 13C NMR to study critical phenomena](https://img.dokumen.tips/doc/110x75/5fa0728b929a19569c69b999/13c-nmr-and-density-functional-theory-study-of-lfdlfz47421-tion-of-13c-nmr.jpg)