Embed Size (px)
Citation preview

BUPA CHILE S.A. AND AFFILIATES (FORMERLY,
CRUZ BLANCA SALUD S.A. AND AFFILIATES)
Consolidated Financial Statements
at December 31, 2014 and 2013
and for the years then ended
(With the report of independent accountants)
BUPA CHILE S.A. AND AFFILIATES
(FORMERLY, CRUZ BLANCA SALUD S.A. AND AFFILIATES)
CONTENTS
Report Of The Independent Accountants
Consolidated Classified Statement Of Financial Position
Consolidated Statement Of Income, By Function
Consolidated Statement Of Comprehensive Income
Consolidated Statement Of Changes To Net Equity
Consolidated Statement Of Cash Flows
Notes To The Consolidated Financial Statements
Th$ - Thousands of Chilean pesos
UF Unidad de fomento, a constant purchase power
restatement unit adjusted daily based on the prior
month’s change in the Consumer Price Index.
US$ - US dollars

KPMG Auditores Consultores Ltda. Teléfono +56 (2) 2798 1000 Av. isidora Goyenechea 3520, Piso 2 Fax +56 (2) 2798 1001 Las Condes, Santiago, Chile www.kpmg.cl
Report of the Independent Auditors
Mssrs. the Shareholders and Directors
Bupa Chile S.A. (Formerly, Cruz Blanca Salud S.A.)
Report on consolidated financial statements
We have reviewed the consolidated statement of financial position herein of Bupa Chile S.A. and affiliates
(formerly Cruz Blanca Salud S.A.) at December 31, 2014 and the consolidated statement of comprehensive
income for the six-month period ended on December 31, 2014 and the corresponding statement of
changes to net equity and cash flows for the years ended on that date.
Responsibility of the Administration regarding the consolidated financial statements
Management is responsible for the preparation and reasonable presentation of these financial statements
in accordance with instructions and standards of preparation and presentation of financial information
issued by the Superintendence of Securities and Insurance, as described in Note 2 to these consolidated
financial statements. This responsibility includes the design, implementation and maintenance of the
relevant internal controls for the preparation and reasonable disclosures of financial information, in
accordance with the applicable framework of preparation and presentation of financial information.
Responsibility of the auditor
Our responsibility is to issue an opinion on these consolidated financial statements on the basis of our
audit. We carry our review in accordance with generally accepted audit standards in Chile. Such standards
require that we plan and carry our work with the purpose of achieving a reasonable level of certainty that
the consolidated financial statements are free of significant misrepresentations
An audit consists of applying procedures to gather audit evidence related to amounts and disclosures in
the consolidated financial statements. The procedures selected depend on the auditor’s judgment,
including the assessment of risks of significant misrepresentation of the consolidated financial
statements, either due to fraud or error. While assessing the risks, the auditor considers the relevant
internal controls for the preparation and reasonable presentation of the consolidated financial statements
of the entity with the purpose to design audit procedures that are appropriate to the circumstances, but
without the purpose to express an opinion on the effectiveness of the entity’s internal control. Therefore,
we do not express such opinion. An audit also includes the assessment of the appropriateness of the
accounting policies used and the reasonableness of management estimates, as well as a general
presentation of the consolidated financial statements.
We consider the audit evidence we have gathered to be sufficient and appropriate to provide us the basis
for our audit opinion.

KPMG Auditores Consultores Ltda. Teléfono +56 (2) 2798 1000 Av. isidora Goyenechea 3520, Piso 2 Fax +56 (2) 2798 1001 Las Condes, Santiago, Chile www.kpmg.cl
Opinion on the regulations on the accounting basis
In our opinion, the consolidated financial statements present reasonably in all its significant aspects the
financial situation of Bupa Chila and affiliates (formerly Cruz Blanca Salud S.A. and affiliates) at December
31, 2014 and the results of its operations and cash flows for the year ended on that date, in accordance to the
preparation and presentation instructions and standards issued by the Superintendence of Securities and
Insurance, as described in Note 2 to the consolidated financial statements.
Accounting basis
As described in Note 19 to the consolidated financial statements, in exercise of its attributions the
Superintendence of Securities and Insurance issued on October 17, 2014 the Circular Communication 856
that instructed the entities subject to its over watch to record against equity in the corresponding period the
differences in assets and liabilities related to deferred taxes that will result from the increase in the
corporate income tax rate introduced by Law 20,780, changing the preparation and presentation framework
of the financial information adopted to that date, as the previous network (IFRS) requires that it is adopted
entirely, explicitly and without reservations. At December 31, 2014, and the year ended on that date, the
amount resulting of the change in the accounting framework is also described in Note 19 to these
consolidated financial statements. Our opinion is not modified by this matter.
Other matters
The financial statements of Bupa Chile S.A. and affiliates (formerly Cruz Blanca Salud S.A. and affiliates) at
December 31, 2013 and the year ended on that date were audited by other auditors who issued an
unqualified opinion on those consolidated financial statements in their report dated March 7, 2014.
Luis Inostroza C. KPMG Ltda.
Santiago, March 18, 2014.

BUPA CHILE S.A. AND AFFILIATES (FORMERLY BUPA CHILE S.A. AND AFFILIATES) CONSOLIDATED FINANCIAL STATEMENTS For the periods ended December 31, 2014 and 2013 (A free translation from the original in Spanish) CONTENTS CONSOLIDATED CLASSIFIED STATEMENT OF FINANCIAL POSITION CONSOLIDATED STATEMENT OF INCOME, BY FUNCTION CONSOLIDATED STATEMENT OF COMPREHENSIVE INCOME CONSOLIDATED STATEMENT OF CHANGES TO NET EQUITY CONSOLIDATED STATEMENT OF CASH FLOWS - DIRECT METHOD NOTES TO THE CONSOLIDATED FINANCIAL STATEMENTS
IFRS - International Financial Reporting Standards IAS - International Accounting Standards GAAP - Generally Accepted Accounting Principles $ - Chilean pesos Th$ - Thousands of Chilean pesos
UF - Unidad de fomento, a constant purchase power restatement unit adjusted daily based on the prior month’s change in the Consumer Price Index.
US$ - US dollars S/. - New Peruvian Sol

Bupa Chile S.A. and Affiliates CONTENTS Page I CONSOLIDATED FINANCIAL STATEMENTS
CONSOLIDATED CLASSIFIED STATEMENT OF FINANCIAL POSITION 1 Assets 1 Liabilities and Net Equity 2
CONSOLIDATED STATEMENT OF INCOME BY FUNCTION 3 CONSOLIDATED STATEMENT OF COMPREHENSIVE INCOME 4 CONSOLIDATED STATEMENT OF CHANGES IN NET EQUITY 5 CONSOLIDATED STATEMENT OF CASH FLOWS - DIRECT METHOD 6
II NOTES TO THE CONSOLIDATED FINANCIAL STATEMENTS 1. GENERAL INFORMATION 7 2. SUMMARY OF MAIN ACCOUNTING POLICIES 8
2.1. Accounting period 8 2.2. Basis for preparation 8 2.3. Standards, interpretations and amendments adopted by Bupa Chile S.A. and Affiliates 9 2.4. Consolidation basis 11 2.5. Segment reporting 13 2.6. Conversion of balances, transactions and financial statements nominated in foreign currency 13 2.7. Property, plant and equipment 14 2.8. Investment property 15 2.9. Intangible assets 15 2.10. Interest cost 16 2.11. Impairment of non-financial assets 16 2.12. Financial assets 16 2.13. Derivative financial instruments and hedging activity 17 2.14. Inventory 18 2.15. Trade debtors and other receivables 18 2.16. Cash and cash equivalent 18 2.17. Shareholder’s capital 18 2.18. Dividends distribution 18 2.19. Trade creditors and other payables 18 2.20. Interest-bearing loans 19 2.21. Corporate income tax and deferred taxes 19 2.22. Employee benefits 20 2.23. Provisions 20 2.24. Classification of balances as current and non-current 22 2.25. Revenue recognition 22 2.26. Leases 23 2.27. Business combinations 23 2.28. Impairment 23 2.29. Environment 24 2.30. Changes in accounting standards 24
3. RISK MANAGEMENT 25
3.1. Regulatory framework 25 3.2. Correlation with economic cycles 25 3.3. Competition 25 3.4. Currency risk 25 3.5. Foreign exchange rate risk 25 3.6. Interest rate risk 26 3.7. Insurance risk 26 3.8. Calculation of fair value of financial instruments 26 3.9. Financial risk management 26

Page
4. MANAGEMENT ESTIMATES AND JUDGMENT 31 4.1. Estimation on goodwill impairment 31 4.2. Fair value of derivatives and other financial instruments 31 4.3. Impairment of goodwill of investments and intangibles with indefinite useful life 32 4.4. Fair value of assets and liabilities 32 4.5. Useful lives and residual value 32 4.6. Fair value of the provision on health related expenses and labor disability 32 4.7. Fair value of non-declared and non-paid social payments (NDNP) 32 4.8. Legal proceedings and other contingencies 32
5. CASH AND CASH EQUIVALENT 33 6. CURRENT AND NON-CURRENT FINANCIAL ASSETS AND LIABILITIES 33
6.1. Other financial assets 33 6.2. Other financial liabilities 34 6.3. Derivative instruments 49
7. OTHER CURRENT AND NON-CURRENT NON-FINANCIAL ASSETS AND LIABILITIES 49
7.1. Other non-financial assets 49 7.2. Other non-financial liabilities 49
8. TRADE DEBTORS AND OTHER ACCOUNTS RECEIVABLE 50 8.1. Trade debtors and other accounts receivable, Gross and Net 50 8.2. Maturities of overdue and not impaired accounts 51 8.3. Maturities of current accounts 51 8.4 Impairment of trade debtors and other receivables 51 8.5 Breakdown of other accounts receivable 51 9. BALANCES AND TRANSACTIONS WITH RELATED ENTITIES 52 9.1. Balances with related entities, not consolidated on a line-by-line basis 52 9.2. Transactions with related entities 52 9.3 Key personnel compensations 53 10. INVENTORY 54 11. INTANGIBLE ASSETS 54
11.1. Breakdown of this accounting area 54 11.2. Details of useful lives applied to this accounting area 55 11.3. Intangibles roll-forward 55 11.4. Intangible amortization charges to income 55
12. INVESTMENTS IN AFFILIATES 56 12.1. Investments in affiliates 56 12.2. Summarized information 56 12.3 Joint arrangements 57 13. BUSINESS COMBINATIONS 57 14. GOODWILL 59
14.1. Breakdown of this accounting area 59 14.2. Changes in goodwill 59 14.3 Impairment test 60
Page
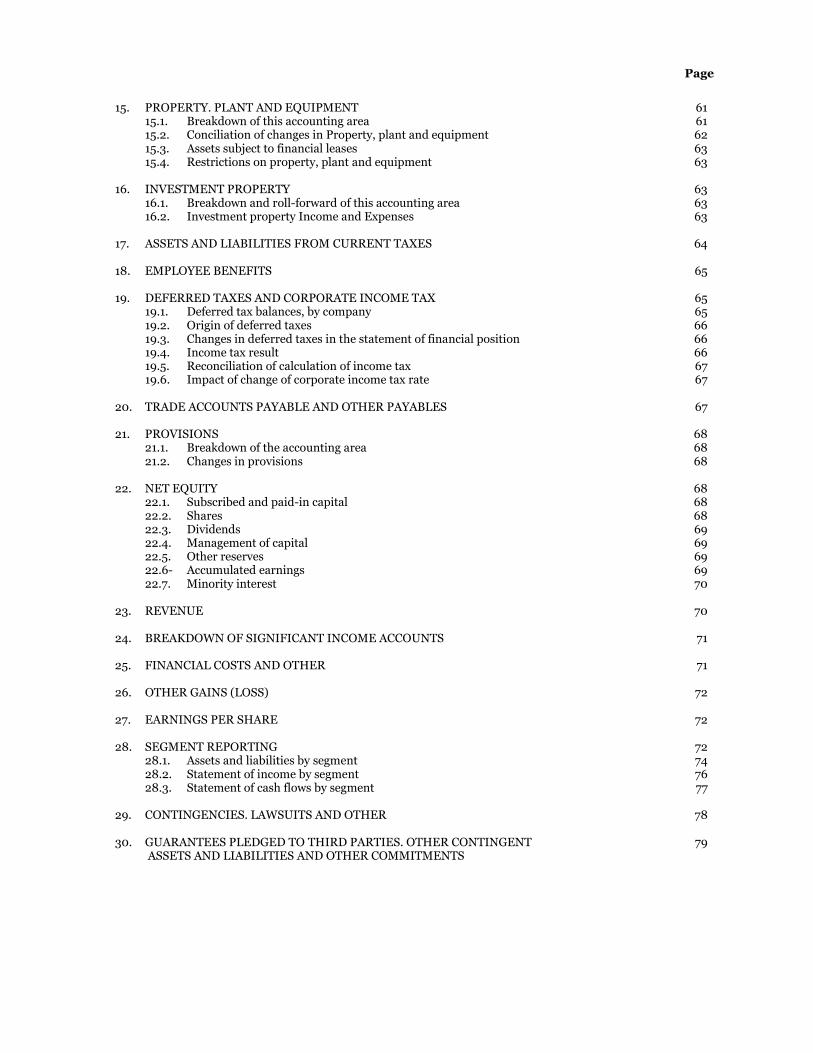
15. PROPERTY. PLANT AND EQUIPMENT 61
15.1. Breakdown of this accounting area 61 15.2. Conciliation of changes in Property, plant and equipment 62 15.3. Assets subject to financial leases 63 15.4. Restrictions on property, plant and equipment 63
16. INVESTMENT PROPERTY 63
16.1. Breakdown and roll-forward of this accounting area 63 16.2. Investment property Income and Expenses 63
17. ASSETS AND LIABILITIES FROM CURRENT TAXES 64 18. EMPLOYEE BENEFITS 65 19. DEFERRED TAXES AND CORPORATE INCOME TAX 65
19.1. Deferred tax balances, by company 65 19.2. Origin of deferred taxes 66 19.3. Changes in deferred taxes in the statement of financial position 66 19.4. Income tax result 66 19.5. Reconciliation of calculation of income tax 67 19.6. Impact of change of corporate income tax rate 67
20. TRADE ACCOUNTS PAYABLE AND OTHER PAYABLES 67 21. PROVISIONS 68
21.1. Breakdown of the accounting area 68 21.2. Changes in provisions 68
22. NET EQUITY 68
22.1. Subscribed and paid-in capital 68 22.2. Shares 68 22.3. Dividends 69 22.4. Management of capital 69 22.5. Other reserves 69 22.6- Accumulated earnings 69 22.7. Minority interest 70
23. REVENUE 70 24. BREAKDOWN OF SIGNIFICANT INCOME ACCOUNTS 71 25. FINANCIAL COSTS AND OTHER 71 26. OTHER GAINS (LOSS) 72 27. EARNINGS PER SHARE 72 28. SEGMENT REPORTING 72
28.1. Assets and liabilities by segment 74 28.2. Statement of income by segment 76 28.3. Statement of cash flows by segment 77
29. CONTINGENCIES. LAWSUITS AND OTHER 78 30. GUARANTEES PLEDGED TO THIRD PARTIES. OTHER CONTINGENT 79 ASSETS AND LIABILITIES AND OTHER COMMITMENTS

Page
31. PERSONNEL DISTRIBUTION 84 32. ENVIRONMENT 85 33 LOCAL AND FOREIGN CURRENCY 86 34. SIGNIFICANT EVENTS 90 35. SUBSEQUENT EVENTS 92

1
BUPA CHILE S.A. AND AFFILIATES CONSOLIDATED CLASSIFIED STATEMENT OF FINANCIAL POSITION At December 31, 2014 and December 31, 2013 Presented in thousands of Chilean pesos
12/31/2014 12/31/2013
Th$ Th$
CURRENT ASSETS
Cash and cash equivalents 5 23,452,576 19,480,538
Other f inancial assets, current 6.1 1,177,747 26,074,375
Other non-financial assets, current 7.1 10,089,466 7,685,085
Trade debtors and other accounts receivable, current 8.1 55,571,019 46,770,122
Accounts receivable from related entities, current 9.1 374,287 485,993
Inventory 10 2,599,415 2,407,095
Tax assets, current 17 6,560,438 7,936,290
Total Assets, Current 99,824,948 110,839,498
NON-CURRENT ASSETS
Other f inancial assets, non-current 6.1 37,578,806 23,961,092
Other non-financial assets, non-current 7.1 42,684,326 36,816,414
Intangible assets other than goodw ill 11.1 105,758,070 103,287,509
Goodw ill 14.1 83,530,937 83,533,337
Property, plant and equipment 15.1 132,586,625 116,913,293
Investment property 16.1 1,728,278 1,768,412
Deferred tax assets 19.1 11,907,031 4,825,743
Total assets, non-current 415,774,073 371,105,800
TOTAL ASSETS 515,599,021 481,945,298
ASSETS NOTE
2
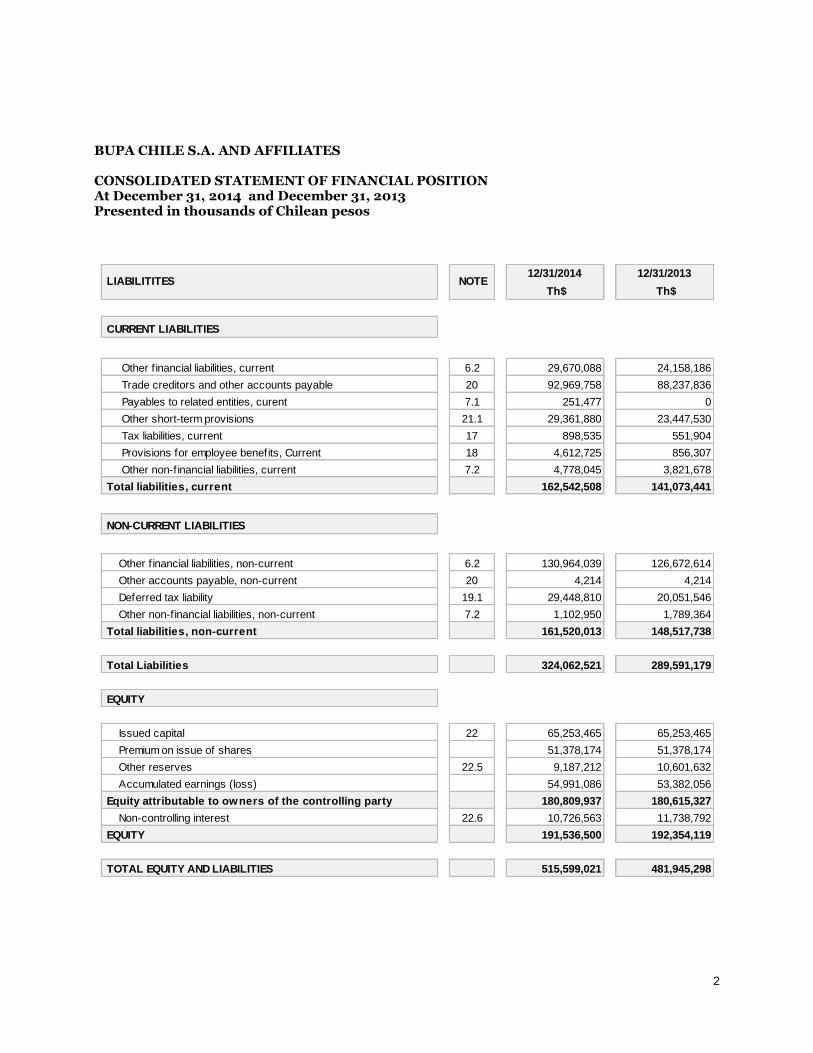
BUPA CHILE S.A. AND AFFILIATES CONSOLIDATED STATEMENT OF FINANCIAL POSITION At December 31, 2014 and December 31, 2013 Presented in thousands of Chilean pesos
12/31/2014 12/31/2013
Th$ Th$
CURRENT LIABILITIES
Other f inancial liabilities, current 6.2 29,670,088 24,158,186
Trade creditors and other accounts payable 20 92,969,758 88,237,836
Payables to related entities, curent 7.1 251,477 0
Other short-term provisions 21.1 29,361,880 23,447,530
Tax liabilities, current 17 898,535 551,904
Provisions for employee benefits, Current 18 4,612,725 856,307
Other non-financial liabilities, current 7.2 4,778,045 3,821,678
Total liabilities, current 162,542,508 141,073,441
NON-CURRENT LIABILITIES
Other f inancial liabilities, non-current 6.2 130,964,039 126,672,614
Other accounts payable, non-current 20 4,214 4,214
Deferred tax liability 19.1 29,448,810 20,051,546
Other non-financial liabilities, non-current 7.2 1,102,950 1,789,364
Total liabilities, non-current 161,520,013 148,517,738
Total Liabilities 324,062,521 289,591,179
EQUITY
Issued capital 22 65,253,465 65,253,465
Premium on issue of shares 51,378,174 51,378,174
Other reserves 22.5 9,187,212 10,601,632
Accumulated earnings (loss) 54,991,086 53,382,056
Equity attributable to owners of the controlling party 180,809,937 180,615,327
Non-controlling interest 22.6 10,726,563 11,738,792
EQUITY 191,536,500 192,354,119
TOTAL EQUITY AND LIABILITIES 515,599,021 481,945,298
LIABILITITES NOTE
3
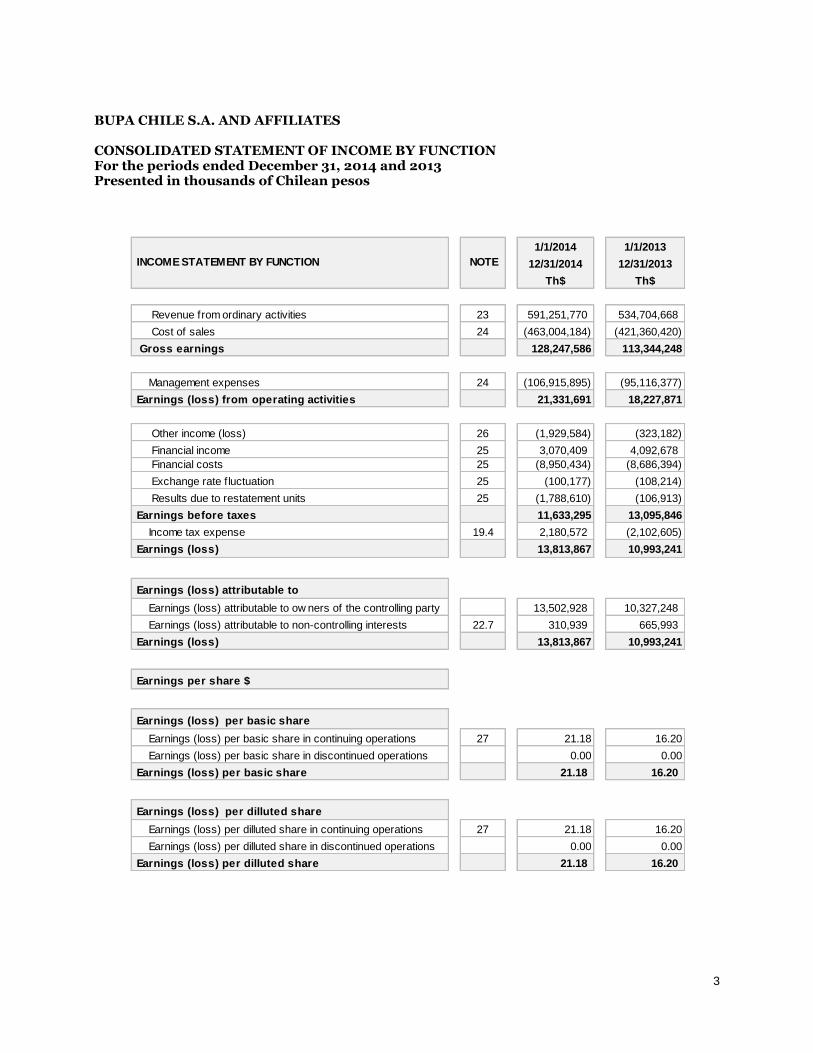
BUPA CHILE S.A. AND AFFILIATES CONSOLIDATED STATEMENT OF INCOME BY FUNCTION For the periods ended December 31, 2014 and 2013 Presented in thousands of Chilean pesos
1/1/2014 1/1/2013
12/31/2014 12/31/2013
Th$ Th$
Revenue from ordinary activities 23 591,251,770 534,704,668
Cost of sales 24 (463,004,184) (421,360,420)
Gross earnings 128,247,586 113,344,248
Management expenses 24 (106,915,895) (95,116,377)
Earnings (loss) from operating activities 21,331,691 18,227,871
Other income (loss) 26 (1,929,584) (323,182)
Financial income 25 3,070,409 4,092,678
Financial costs 25 (8,950,434) (8,686,394)
Exchange rate f luctuation 25 (100,177) (108,214)
Results due to restatement units 25 (1,788,610) (106,913)
Earnings before taxes 11,633,295 13,095,846
Income tax expense 19.4 2,180,572 (2,102,605)
Earnings (loss) 13,813,867 10,993,241
Earnings (loss) attributable to
Earnings (loss) attributable to ow ners of the controlling party 13,502,928 10,327,248
Earnings (loss) attributable to non-controlling interests 22.7 310,939 665,993
Earnings (loss) 13,813,867 10,993,241
Earnings per share $
Earnings (loss) per basic share
Earnings (loss) per basic share in continuing operations 27 21.18 16.20
Earnings (loss) per basic share in discontinued operations 0.00 0.00
Earnings (loss) per basic share 21.18 16.20
Earnings (loss) per dilluted share
Earnings (loss) per dilluted share in continuing operations 27 21.18 16.20
Earnings (loss) per dilluted share in discontinued operations 0.00 0.00
Earnings (loss) per dilluted share 21.18 16.20
INCOME STATEMENT BY FUNCTION NOTE

4
BUPA CHILE S.A. AND AFFILIATES CONSOLIDATED STATEMENT OF COMPREHENSIVE INCOME For the periods ended December 31, 2014 and 2013 Presented in thousands of Chilean pesos
1/1/2014 1/1/2013
12/31/2014 12/31/2013
Th$ Th$
Earnings (loss) 13,813,867 10,993,241
Components of Other Comprehensive Income, Before Taxes
Earnings (loss) from cash flow hedging, before taxes (3,393,137) (921,654)
Earnings (loss) from conversion exchange rate differences, before taxes 1,066,821 5,702
Income Taxes related to components of comprehensive income
Income tax related to cash flow hedging 0 (92,688)
Addition of income taxes related to components of comprehensive income (2,326,316) (1,008,640)
Total comprehensive income 11,487,551 9,984,601
Comprehensive income attributable to
Comprehensive income attributable to Controlling Interests 11,176,612 9,318,608
Comprehensive income attributable to Non-Controlling Interests 22.7 310,939 665,993
Total Comprehensive Income 11,487,551 9,984,601
STATEMENT OF COMPREHENSIVE INCOME NOTE

5
BUPA CHILE S.A. AND AFFILIATES CONSOLIDATED STATEMENT OF CHANGES IN NET EQUITY At December 31, 2014 and 2013 In thousands of Chilean pesos
Th$ Th$ Th$ Th$ Th$ Th$ Th$ Th$ Th$ Th$
Opening balance at 01/01/2014 65,253,465 51,378,174 (82,337) (4,917,556) 15,601,525 10,601,632 53,382,056 180,615,327 11,738,792 192,354,119
Restated Equity 65,253,465 51,378,174 (82,337) (4,917,556) 15,601,525 10,601,632 53,382,056 180,615,327 11,738,792 192,354,119
Changes in Equity
Comprehensive income
Earnings (loss) 0 0 0 0 0 0 13,502,928 13,502,928 310,939 13,813,867
Other comprehensive income 0 0 1,066,821 (3,393,137) 0 (2,326,316) 0 (2,326,316) 0 (2,326,316)
Total comprehensive income 0 0 1,066,821 (3,393,137) 0 (2,326,316) 13,502,928 11,176,612 310,939 11,487,551
Dividends 0 0 0 0 0 0 (5,097,427) (5,097,427) (178,119) (5,275,546)
Increase (decrease) due to changes in ow nership interest in
aff iliates, that do not involve a change in control 0 0 0 0 0 0 0 0(139,479)
(139,479)
Other increase (decrease) in net equity 0 0 0 0 911,896 911,896 (6,796,471) (5,884,575) (1,005,570) (6,890,145)
Total changes in equity 0 0 1,066,821 (3,393,137) 911,896 (1,414,420) 1,609,030 194,610 (1,012,229) (817,619)
Closing balance at 12/31/2014 65,253,465 51,378,174 984,484 (8,310,693) 16,513,421 9,187,212 54,991,086 180,809,937 10,726,563 191,536,500
Th$ Th$ Th$ Th$ Th$ Th$ Th$ Th$ Th$ Th$
Opening balance at 01/01/2013 65,253,465 51,378,174 (88,039) (3,903,214) 15,525,137 11,533,884 47,867,574 176,033,097 14,181,488 190,214,585
Restated Equty 65,253,465 51,378,174 (88,039) (3,903,214) 15,525,137 11,533,884 47,867,574 176,033,097 14,181,488 190,214,585
Changes in equity
Comprehensive income
Earnings (loss) 0 0 0 0 0 0 10,327,248 10,327,248 665,993 10,993,241
Other comprehensive income 0 0 5,702 (1,014,342) 0 (1,008,640) 0 (1,008,640) 0 (1,008,640)
Total comprehensive income 0 0 5,702 (1,014,342) 0 (1,008,640) 10,327,248 9,318,608 665,993 9,984,601
Dividends 0 0 0 0 0 0 (4,812,766) (4,812,766) 0 (4,812,766)
Other increase (decrease) in net equity 0 0 0 0 76,388 76,388 0 76,388 (3,108,689) (3,032,301)
Total changes in equity 0 0 5,702 (1,014,342) 76,388 (932,252) 5,514,482 4,582,230 (2,442,696) 2,139,534
Closing balance at 12/31/2013 65,253,465 51,378,174 (82,337) (4,917,556) 15,601,525 10,601,632 53,382,056 180,615,327 11,738,792 192,354,119
Statement of changes to net equity
Other reserves
Issued
Capital
Premium on
issue of
shares Other
reserves
Total Other
Reserves
Conversion
foreign exchange
rate differences
reserve
Cash flow
hedging
reserves
Conversion
foreign exchange
rate differences
reserve
Cash flow
hedging
reserves
Accumulated
earnings (loss)
Equity
attributable to
the owners of
the controlling
party
Non-
controlling
interest
Net equity,
total
Statement of changes to net equity
Issued
Capital
Premium on
issue of
shares
Net equity,
total
Accumulated
earnings (loss)
Equity
attributable to
the owners of
the controlling
party
Non-
controlling
interest
Other
reserves
Total Other
Reserves
Other reserves

6
BUPA CHILE S.A. AND AFFILIATES CONSOLIDATED STATEMENT OF CASH FLOWS, DIRECT METHOD For the periods ended December 31, 2014 and 2013 Presented in thousands of Chilean pesos
1/1/2014 1/1/2013
12/31/2014 12/31/2013
Th$ Th$
Cash flows proceeds from (used in) operating activities
Classes of collections from operating activities
Collection of sales of goods and rendering of services 678,871,580 615,534,798
Collections from premiums and benefits, annuities and other subscribed policy benefits 3,155,089 455,037
Other collections from operating activities 46,591,261 35,093,538
Classes of payments
Payments to suppliers for the procurement of goods and services (545,272,714) (514,104,073)
Payments to and on behalf of employees (85,554,855) (73,338,473)
Payments for premiums and benefits, annuities and other obligations derived from subscribed policies (1,572,550) (46,480)
Other payments from operating activities (70,648,524) (51,706,554)
Other operating collections and payments
Dividends paid (4,113,395) (7,014,192)
Interest paid (58,762) (17,527)
Interest collected 1,002,162 1,910,963
Income tax return (payment) (1,915,637) 50,769
Other inflow s (outf low s) of cash 89,238 81,458
Net Cash flows from (used in) operating activities 20,572,893 6,899,264
Cash flows from (used in) investment activities
Cash flow s used to acquire controlling interests in aff iliates or other businesses 0 (5,946,844)
Cash f low s used to acquire non-controlling interests (93,744) 0
Other proceeds from the sale of interests in joint agreements 8,054 0
Other payments to acquire interests in joint agreements (172) 0
Loans to related entities (11,850) 0
Proceeds from the sale of property, plant and equipment 28,117 980,536
Acquisition of property, plant and equipment (22,060,382) (13,909,367)
Acquisition of intangibles (567,940) (878,421)
Proceeds from other long-term assets 76,575,019 8,619,297
Acquisition of other long-term assets (63,099,964) (16,314,235)
SISP guarantee (204,353) 0
Interests received 1,168,717 1,346,182
Income tax reimbursement (paid) 553 0
Other cash inflow s (outf low s) (824) 12,781
Net cash flows from (used in) investment activities (8,258,769) (26,090,071)
Cash flows from (used in) financing activities
Inflow s from long-term loans 12,014,383 15,104,337
Inflow s from short-term loans 10,310,249 7,240,247
Total inflows from loans 22,324,632 22,344,584
Payment of loans (15,476,241) (10,569,759)
Payment of liabilities from financial leases (7,468,908) (6,418,049)
Dividends paid (341,463) (22,169)
Interests paid (8,083,520) (7,155,990)
Other cash inflow s (outf low s) (304,770) 489,934
Net cash flows from (used in) financing activities (9,350,270) (1,331,449)
Net increase (decrease) of cash and cash equivalents, before the effect of changes in exchange rate 2,963,854 (20,522,256)
Effect of changes in the exchange rate on cash and cash equivalents 1,008,184 475,399
Net Increase (decrease) of Cash and Cash Equivalents 3,972,038 (20,046,857)
Cash and cash equivalents at beginning of period 19,480,538 39,527,407
Cash and cash equivalents at closing of period 5 23,452,576 19,480,550
STATEMENT OF CASH FLOWS, DIRECT METHOD NOTE

7
Bupa Chile S.A. And Affiliates Notes To The consolidated financial statements For the period ended December 31, 2014 __________________________________________________________________ NOTE 1. - GENERAL INFORMATION Bupa Chile S.A. (from hereon the “Company” or the “Group”) is a public Corporation, entered into the Securities Registry of the Superintendence of Securities and Insurance under number 1,075. The Company’s address is Cerro Colorado N° 5240, Torre Del Parque II, office 11 B, Las Condes, in the city of Santiago, Republic of Chile. The Company was established as Cruz Blanca S.A. on December 11, 2007 and its purpose is to perform investments in financial assets, tangible and intangible, shares, bonds, medium term financing instruments, and other financial instruments, rights in companies and specifically in those companies whose business is the rendering of services in the Health Care or financing of health procedures or benefits, or developing activities that are related or complementary to the Health Care industry, both in Chile and abroad; manage, transfer, exploit and obtain gains from said services and; to perform all sorts of acts and to enter into any contracts necessary for the fulfillment of the Company’s purpose or in the development of its business. The company formerly known as Cruz Blanca Salud S.A. communicated in November 2014 its change of name to Bupa Chile S.A., part of the international BUPA (British United Provident Association) with an ultimate head company in the United Kingdom. Bupa Chile S.A.’s controlling party is Grupo Bupa Sanitas, through the company GBS Chile Uno SpA, which owns 56.38% of the Company’s shares. GBS Chile Uno SpA is a company established under the laws of the Republic of Chile, whose only contributor is Grupo Bupa Sanitas Chile S.L., a company established and existing in accordance to the laws of the Kingdom of Spain (from hereon "Bupa Sanitas"). Bupa Chile S.A. and its affiliate companies are companies of the health care industry. Its main business areas are: Insurance area
Isapre Cruz Blanca S.A.
Cruz Blanca Compañía de Seguros de Vida S.A. Hospital Health Care area
Promotora de Salud S.A.
Desarrollo e Inversiones Médicas S.A.
Inversiones Clínicas Pukará S.A.
Corporación Médica de Arica S.A.
Inversiones Clínicas CBS S.A.
Servicios Clínicos Domiciliarios S.A. Outpatients Health Care area
Integramédica S.A.
Sonorad S.A. International area (providers of outpatients healthcare services)
Cruz Blanca Salud Internacional S.A.
Cruz Blanca Salud Perú S.A.C. (Prestadora de Salud Ambulatoria) Other
Bupa Chile Servicios Corporativos SpA.
Inversiones CBS SpA.
8
These consolidated Financial Statements correspond to the period ended December 31, 2014, which were approved by the Board in the meeting held on March 18, 2015. The corresponding meetings of the board of directors approved the financial statements of the affiliates. The Company’s financial statements, corresponding to the period ended on December 31, 2013, were approved by the Board in the meeting held on March 7, 2014. NOTE 2. - SUMMARY OF THE MAIN ACCOUNTING POLICIES Following is a description of the main accounting policies adopted in the preparation of these consolidated financial statements. These policies were applied consistently on the financial statements herein presented. These consolidated financial statements are presented in thousands of Chilean pesos.
These consolidated financial statements have been prepared according to International Financial Reporting Standards issued by the International Accounting Standards Board (“IASB”), except for what has been ruled by the Superintendence of Securities and Insurance that established an exception in the accounting of the effects of the changes of the income tax rate arising from the application of Law 20,780 and Circular Communication 856 dated October 17, 2014, that must be recorded as deferred tax assets and liabilities in the financial statements of entities subject to the overwatch of the Superintendence. The exception to accounting means that the effect of changes to the tax rates must be recorded through shareholders' equity and not through income as it is set in International Accounting Standards 12. The accounting policies adopted in the preparation of these consolidated financial statements have been designed following the IFRS current at December 31, 2014 and applied consistently to all the periods presented in these consolidated financial statements, and by the standards issued by the Superintendence of Securities and Insurance (from hereon "SVS"). In case of any differences the later will take precedence over the former. The Superintendence of Securities of Insurance issued instructions that established an exception to the accounting of the changes of income tax rate arising from the application of Law 20,780 with regards to the recognition of the deferred income tax assets and liabilities of the entities subject to the Superintendence supervision. The instructions indicate that said changes must be recorded with impact through Equity and not with impact through Income as is set forth in International Accounting Standards 12 - Income Taxes. 2.1. Accounting period The consolidated Financial Statements (from hereon, “financial statements”) cover the following periods:
Statement of Financial Position, for the periods ended December 31, 2014 and December 31, 2013.
Statement of Changes in Net Equity and Statement of Cash Flows, Direct Method, for the periods ended December 31, 2014 and 2013.
Statement of Income by Function and Statement of Comprehensive Income for the periods ended on December 31, 2014 and 2013, for comparison purposes.
2.2. Basis for preparation The consolidated financial statements have been prepared on the historic cost basis, except for those items recorded at fair value such as is the case of the derivative instruments. The book value of liabilities that qualify for hedge accounting is adjusted to reflect the fair value with regards to the hedged risks.
9
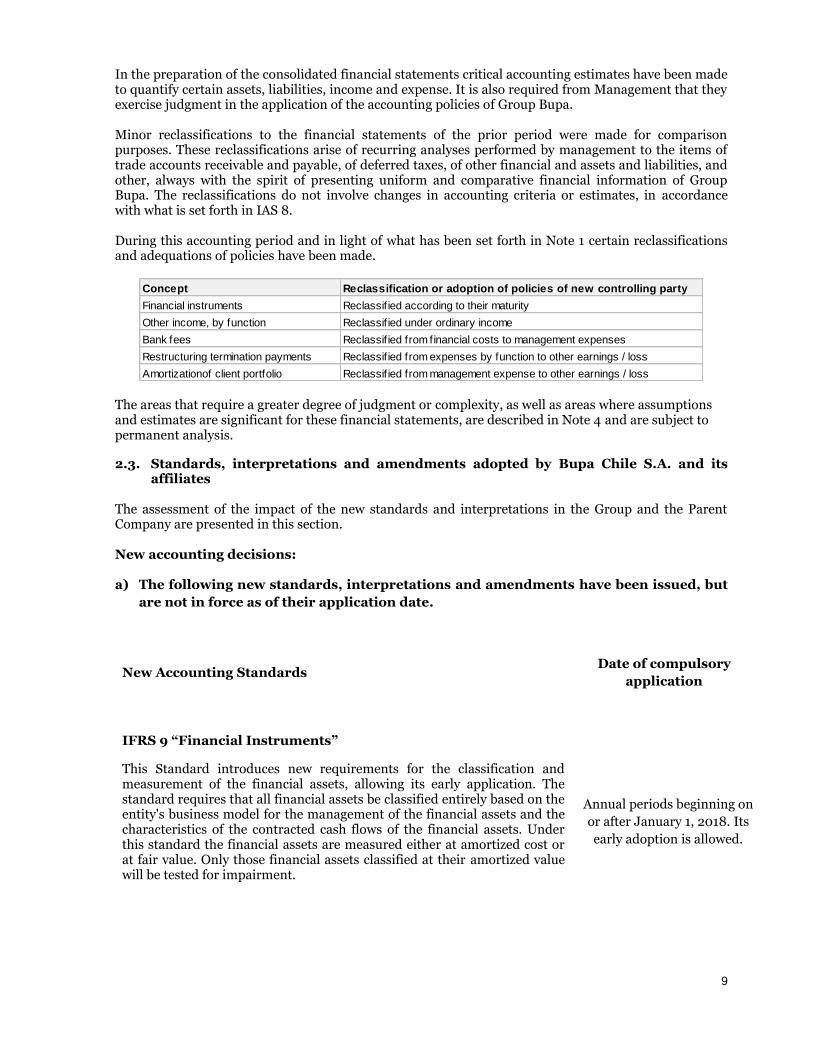
In the preparation of the consolidated financial statements critical accounting estimates have been made to quantify certain assets, liabilities, income and expense. It is also required from Management that they exercise judgment in the application of the accounting policies of Group Bupa. Minor reclassifications to the financial statements of the prior period were made for comparison purposes. These reclassifications arise of recurring analyses performed by management to the items of trade accounts receivable and payable, of deferred taxes, of other financial and assets and liabilities, and other, always with the spirit of presenting uniform and comparative financial information of Group Bupa. The reclassifications do not involve changes in accounting criteria or estimates, in accordance with what is set forth in IAS 8. During this accounting period and in light of what has been set forth in Note 1 certain reclassifications and adequations of policies have been made.
The areas that require a greater degree of judgment or complexity, as well as areas where assumptions and estimates are significant for these financial statements, are described in Note 4 and are subject to permanent analysis.
2.3. Standards, interpretations and amendments adopted by Bupa Chile S.A. and its affiliates
The assessment of the impact of the new standards and interpretations in the Group and the Parent Company are presented in this section. New accounting decisions: a) The following new standards, interpretations and amendments have been issued, but
are not in force as of their application date.
New Accounting Standards Date of compulsory
application
IFRS 9 “Financial Instruments”
This Standard introduces new requirements for the classification and measurement of the financial assets, allowing its early application. The standard requires that all financial assets be classified entirely based on the entity's business model for the management of the financial assets and the characteristics of the contracted cash flows of the financial assets. Under this standard the financial assets are measured either at amortized cost or at fair value. Only those financial assets classified at their amortized value will be tested for impairment.
Annual periods beginning on
or after January 1, 2018. Its
early adoption is allowed.
Concept Reclassification or adoption of policies of new controlling party
Financial instruments Reclassif ied according to their maturity
Other income, by function Reclassif ied under ordinary income
Bank fees Reclassif ied from financial costs to management expenses
Restructuring termination payments Reclassif ied from expenses by function to other earnings / loss
Amortizationof client portfolio Reclassif ied from management expense to other earnings / loss

10
IFRS 15 "Revenue from contracts with clients"
This Standard provides a unique five-step model based on principles which will be applied to all client contracts. These are the steps:
Identify the client contract
identify the performance obligations of the contract
Establish the transaction price
Allocate the transaction price to the performance obligations of the contracts
Recognize income when the entity satisfies a performance obligation.
The standard offers guidance about topics such as the point for revenue recognition and divers related matters. New revenue disclosures are introduced.
The Company’s Management is assessing the impact on the consolidated financial statements of the abovementioned standards at the time of their first adoption.
Annual periods beginning on or after January 1, 2017. Early adoption is allowed.
Improvements and amendments to accounting statements
New IFRS and improvements
Date of compulsory
application
IAS 19 Employee benefits - contributions from employees Annual periods beginning on
or after July 1, 2014
(January 1, 2015). Early
adoption is allowed
IFRS 11 "Joint Arrangements" Annual periods beginning on
or after January 1, 2016.
Early adoption is allowed
IAS 16 "Property, plant and equipment," IAS 38 "Intangible assets": Clarification of acceptable depreciation and amortization methods.
Annual periods beginning on
or after January 1, 2016.
Early adoption is allowed
IAS 27 "Separate Financial Statements," IFRS 10 "Consolidated Financial statements”
Annual periods beginning on
or after January 1, 2014.
The Company’s management is currently assessing the impact in the consolidated financial statements when the abovementioned standards at their first application.
The following standards and interpretations have been adopted in the financial statements.
11
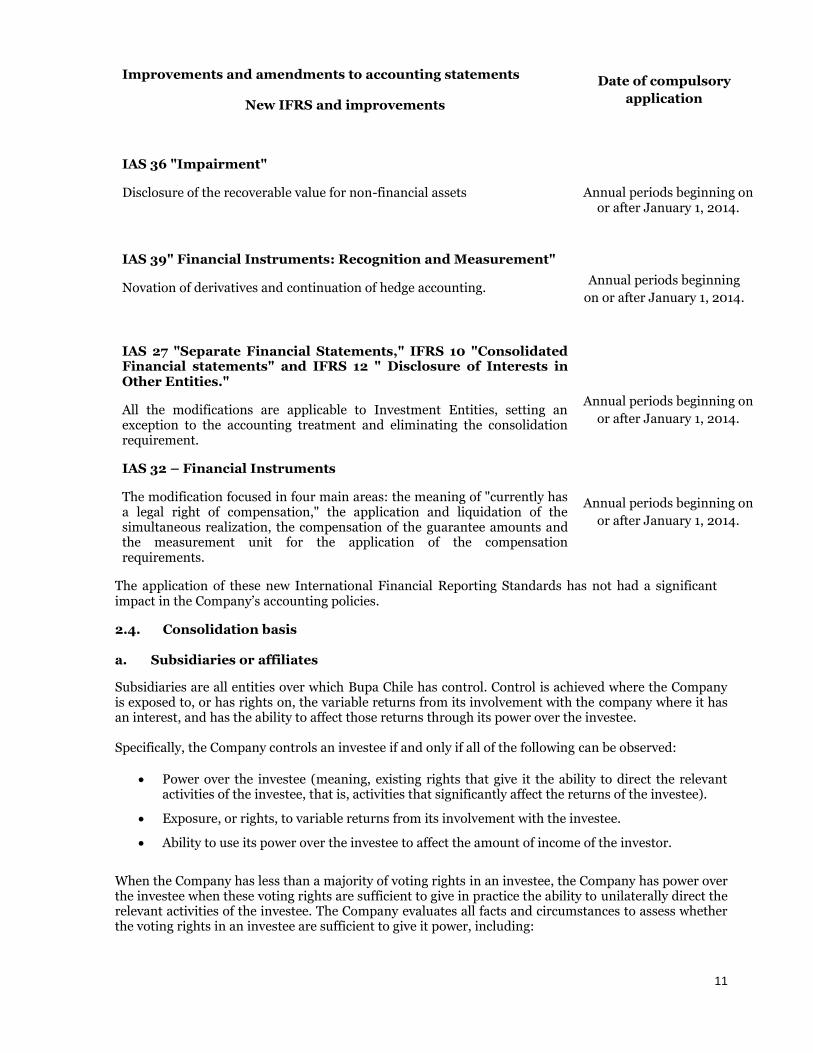
Improvements and amendments to accounting statements
New IFRS and improvements
Date of compulsory
application
IAS 36 "Impairment"
Disclosure of the recoverable value for non-financial assets
Annual periods beginning on or after January 1, 2014.
IAS 39" Financial Instruments: Recognition and Measurement"
Novation of derivatives and continuation of hedge accounting.
Annual periods beginning
on or after January 1, 2014.
IAS 27 "Separate Financial Statements," IFRS 10 "Consolidated Financial statements" and IFRS 12 " Disclosure of Interests in Other Entities."
All the modifications are applicable to Investment Entities, setting an exception to the accounting treatment and eliminating the consolidation requirement.
Annual periods beginning on
or after January 1, 2014.
IAS 32 – Financial Instruments
The modification focused in four main areas: the meaning of "currently has a legal right of compensation," the application and liquidation of the simultaneous realization, the compensation of the guarantee amounts and the measurement unit for the application of the compensation requirements.
Annual periods beginning on
or after January 1, 2014.
The application of these new International Financial Reporting Standards has not had a significant impact in the Company’s accounting policies.
2.4. Consolidation basis
a. Subsidiaries or affiliates
Subsidiaries are all entities over which Bupa Chile has control. Control is achieved where the Company is exposed to, or has rights on, the variable returns from its involvement with the company where it has an interest, and has the ability to affect those returns through its power over the investee. Specifically, the Company controls an investee if and only if all of the following can be observed:
Power over the investee (meaning, existing rights that give it the ability to direct the relevant activities of the investee, that is, activities that significantly affect the returns of the investee).
Exposure, or rights, to variable returns from its involvement with the investee.
Ability to use its power over the investee to affect the amount of income of the investor.
When the Company has less than a majority of voting rights in an investee, the Company has power over the investee when these voting rights are sufficient to give in practice the ability to unilaterally direct the relevant activities of the investee. The Company evaluates all facts and circumstances to assess whether the voting rights in an investee are sufficient to give it power, including:
12
the number of voting rights that the investor holds in relation to the number and spread that other vote holders hold;
potential voting rights held by the investor, other vote holders or other parties;
rights arising from other contractual arrangements;
any additional facts and circumstances indicate that the investor has or does not have, as well as the current ability to direct the relevant activities at the time these decisions need to be taken, including the voting behavior patterns observed in previous shareholder meetings.
The Company reassesses whether it has control on an affiliate if facts and circumstances indicate that there have been changes in one or more of the three control elements mentioned above. The consolidation of an affiliate will start from the date when the investor gains control of the investee and ceasing when it loses control over it. To account for the acquisition of a subsidiary, Bupa Chile uses the acquisition method. The acquisition cost is the fair value of the assets transferred, equity instruments issued and liabilities incurred or assumed at the transaction date. Identifiable assets acquired and liabilities and contingent liabilities assumed in a business combination is initially measured at fair value at the acquisition date. The excess of cost of acquisition over the fair value of the share of Bupa Chile in the identifiable net assets acquired is recognized as goodwill. If the cost of acquisition is less than the fair value of the net assets of the subsidiary acquired, the identification and measurement of assets, liabilities and contingent liabilities of the purchaser, and the measurement of the cost of the acquisition will be reconsidered, the difference, which continues to exist, is recognized directly in the income statement. Subsidiary companies are consolidated using the line by line combination of all assets, liabilities, income, expenses and cash flows. Non-controlling interests in subsidiaries are included in the assets of the parent company. Intercompany transactions, balances and unrealized gains on transactions between Group companies are eliminated. Unrealized losses are also eliminated unless the transaction provides evidence of an impairment of the asset transferred. When necessary, to ensure consistency with the policies adopted by Bupa Chile, accounting policies of subsidiaries are changed. b. Transactions and non-controlling interests In the case of an acquisition of non-controlling interest, the difference between any paid retribution and the corresponding interest in the book value of the acquired net assets of the subsidiary is recognized through Equity. Gains and losses from interest sales, as long as control is retained, are also recorded through Equity. c. Interest in investments accounted for using the equity method The Group's interest in investments acounted for using the equity method include interests in associate companies and in one joint arrangement Associate companies are all those entities over which the Group has a significant influence but does not hold control. A joint arrangement is an agreement in which the Group has the joint control, through which the Group has rights to the net assets of the agreement and does not have rights on its assets nor obligations for its liabilities. The interest in associates and in the joint arrangement are accounted for using the equity method. Initially the interest is recorded at cost including the transaction costs. After initial recognition the consolidated financial statements include the Group's interest in income and comprehensive income of the investments made under the equity method, until that time when the significant influence or joint control ceases.

13
d. Joint arrangements Joint arrangements are included in the financial statements using the equity method. e. Affiliate entities e.1. The companies included in consolidation are the following:
(1) As of December 31, 2014 these companies are now direct investments of Inversiones Clínicas CBS S.A. as part of the Group’s reorganization of the
companies, retaining control in Bupa Chile S.A.
On June 5, 2014 Inversiones Clínicas made a capital increase of $1,700,000,000 by issuing 1,700,000 shares which were entirely subscribed and paid for by Bupa Chile S.A. This explains the change in distribution of direct and indirect ownership percentage. On December 31, 2014 Cruz Blanca Salud Internacional S.A. made a capital increase of $3,084,311,659 by issuing 3,916,500 shares that were entirely subscribed and paid by Bupa Chile S.A.. This explains the change in direct and indirect percentage distribution in these financial statements. During 2014, Group Bupa Chile has enacted a reorganization of the companies, seeking to optimize its management processes given the requirements of the new controlling party. In this regard a number of mergers have occurred in the Outpatients segment and in the companies of corporate services of the group, which simplify the Groups organization and, in addition, generate efficiencies in the financial management of the business. Finally and as a result of the reorganization, there was a positive effect in the tax result of approximately MM$ 5,700,000 which is mainly the result of a tax goodwill generated in the reorganization of the outpatients segment. 2.5. Segment reporting IFRS 8 requires that the entities adopt the “management approach” to disclose information on the results of its operating segments. Segment reporting is disclosed in a way consistent with the internal reports issued to those responsible of taking the relevant operating decisions. Said executives are those responsible of allocating the resources and assessing the performance of the operational segments, which have been identified as: Health Insurance, Hospital Health Provider, Outpatients Health Providers and Other, for which the strategic decisions are made. This information is disclosed in Note 28. 2.6. Conversion of balances, transactions and financial statements nominated in foreign currency a.- Presentation currency and functional currency
The items included in the financial statements of each of the Group’s entities are valued using the currency of the main economic environment where the entity operates (“functional currency”). The consolidated financial statements are presented in Chilean pesos, which is the functional and presentation currency of the Parent company and of its affiliates. In the case of the Peruvian subsidiary, its functional currency is the Peruvian New Sol.
Direct Indirect Total Direct Indirect Total
96.501.450-0 Isapre Cruz Blanca S.A. 95.16576% 3.84448% 99.01024% 95.16576% 3.84448% 99.01024%
76.098.454-K Integramédica S.A. 99.99860% 0.00000% 99.99860% 99.99860% 0.00000% 99.99860%
96.562.210-1 Promotora de Salud S.A. (1) 0.00000% 53.15315% 53.15315% 53.15315% 0.00000% 53.15315%
96.562.220-9 Desarrollo e Inversiones Médicas S.A. (1) 0.00000% 83.03676% 83.03676% 71.50957% 11.52719% 83.03676%
96.529.970-K Inversiones Clínicas Pukará S.A. (1) 0.00000% 85.43280% 85.43280% 85.43280% 0.00000% 85.43280%
96.613.220-5 Corporación Médica de Arica S.A. (1) 0.00000% 68.97233% 68.97233% 68.97233% 0.00000% 68.97233%
76.785.130-8 Servicios de Gestión Ltda. 0.00000% 0.00000% 0.00000% 99.00000% 1.00000% 100.00000%
96.845.430-7 Bupa Chile Servicios Corporativos Spa 99.08954% 0.91046% 100.00000% 0.00000% 0.00000% 0.00000%
76.117.164-K Inversiones CBS SPA 100.00000% 0.00000% 100.00000% 100.00000% 0.00000% 100.00000%
76.188.053-5 Cruz Blanca Salud Internacional S.A 99.99822% 0.00178% 100.00000% 99.99822% 0.00178% 100.00000%
76.238.779-4 Inversiones Clínicas CBS S.A. 99.99734% 0.00266% 100.00000% 99.99330% 0.00670% 100.00000%
76.282.191-5 Cruz Blanca Compañía de Seguros de Vida S. A. 100.00000% 0.00000% 100.00000% 100.00000% 0.00000% 100.00000%
Tax Id
Number Company Name
Ownership percentage
12/31/2014 12/31/2013

14
b.- Transactions and balances
Transactions in foreign currency are converted to the functional currency using the exchange rates current at the date of the transaction. Gains and losses in foreign currency that result from the settlement of these transactions and the conversion at the closing exchange rates of the monetary assets and liabilities nominated in foreign currency are carried through income, except when they should be deferred through net equity, as is the case of results from strategies of cash flows hedging.
c.- Exchange rates
Assets and liabilities in foreign currency and those set in UF are presented at the following exchange rates and closing values:
2.7. Property, plant and equipment Property, plant and equipment corresponds mainly to land, constructions, infrastructure works, vehicles, machinery and equipment, medical equipment, and are recorded at cost minus accumulated depreciation and impairment losses, except in the case of the land, which are disclosed net of impairment losses, if any.
Expansion or upgrade costs that represent an increase in the capabilities or useful life of the goods will be capitalized as a greater cost.
Periodic maintenance, conservation and repair expenses are carried through income in the period they are incurred.
Works in progress during the construction period include financial expenses that can be directly attributed to the acquisition or construction and the personnel expenses related directly and other of operating nature attributable to the construction. Works in progress are transferred to operating assets once the period of trials is completed and they are available for use, moment when the depreciation begins. Depreciation is calculated on a straight-line basis over the estimated years of technical and / or economic useful life of the assets, unless in special cases where to better represent the economic reality it is required to use consumption units. Residual values of the assets, useful lives and depreciation methods are reviewed and adjusted if required, at each year’s closing. Estimated useful lives for property, plant and equipment are contained in the following ranges, considering the characteristics of the assets in each class:
Gains and losses in the sale of Property, plant and equipment, are calculated comparing the proceeds obtained with the corresponding book value and are carried through income. When selling assets appraised according to IAS 16, the values recorded as revaluation reserves are transferred to accumulated results.
Date $ / US$ $ / S/. $ / UF
12/31/2014 606.75 202.93 24,627.10
12/31/2013 524.61 187.49 23,309.56
Estimated useful lives or depreciation rates used Minimum years Maximum years
Buildings 60 60
Plant and equipment 3 10
IT equipment 3 10
Fixed installations and accessories 3 10
Motor vehicles 3 10
Leasehold improvement
Other property, plant and equipment 3 10
Amortized at low er of 50 years and contract term

15
2.8. Investment property
This item includes mainly land, buildings and constructions held with the purpose to obtain income in future sales, appreciation or exploitation under a lease regime, and are not used by the Group’s companies. Said assets are valued initially at their acquisition cost, plus all other expenses incurred that can be directly allocated. Subsequently, they are valued periodically at their appraisal value, bet of depreciation and impairment of value. Management has defined periodicity to be a frequency of two years. Depreciation is calculated on a straight-line basis in function of the useful life of the corresponding goods.
2.9. Intangible assets
a.- Goodwill
Goodwill represents the excess of the acquisition cost over the fair value of the Group’s interest in the identifiable net assets of the affiliate or associate acquired on the transaction date. Goodwill related to the acquisition of affiliates is recorded under Goodwill.
Goodwill related to acquisition of associates is included under Investment in Associates and is submit to fair value impairment tests with the total balance of the associate. Goodwill recognized separately is submitted to value impairment tests annually, and is valued at its cost less accumulated impairment losses. Gains and losses from the sale of an entity include the book values of the goodwill related to the sold entity.
Goodwill is allocated to the cash generating units in order to perform impairment tests. The allocation is performed among those cash generating units or groups of cash generating units that are expected to obtain benefits from the business combination that generated the goodwill. A bargain purchase, or the higher cost acquired arising from the acquisition of an investment or a business combination, is debited directly through the Income Statement, under Other Gains (Losses).
b.- Software
Purchased software licenses are capitalized on the basis of costs incurred to acquire and prepare them to use the specific program. These costs are amortized linearly over their estimated useful lives.
Expenses related with development or maintenance of software are recognized as an expense when incurred. Costs directly related with the production of unique and identifiable software controlled by the Company, and that it is probable that may generate economic benefits greater than the costs over more than one year, are recognized as Intangible Assets. Direct costs include personnel expenses that develop the software and a reasonable percentage of overheads.
The development costs of software recognized as assets are amortized over their estimated useful lives. c.- Trademarks
The Group’s trademarks correspond to Intangible Assets of indefinite useful life that are disclosed at historic cost less any impairment losses. The Group believes that through investment in marketing, the trademarks keep their value and therefore are considered to have an indefinite useful life and are not subject to amortization. These assets are submitted to annual impairment tests or when there are indicators that show a potential impairment. d.- Client portfolio Client portfolio is the intangible value allocated in the business combination of former Isapre ING Salud S.A., which corresponds to the portfolio of affiliates and beneficiaries of that business. This intangible asset has been deemed to have an indefinite useful life and is therefore amortized on the basis of the expected benefits to be generated by the portfolio.
16
2.10. Interest cost
Interest costs incurred in the construction of any qualified asset are capitalized over the time that is required to complete and prepare the asset for its intended use. Other interest costs are recorded through income (financial costs). 2.11. Impairment losses of non-financial assets
Assets with an indefinite useful life are not subject to amortization and are annually submitted to impairment test as described in Note 2.28 a). Assets subject to depreciation and amortization are subject to impairment tests if some event or change in circumstances indicates that the book value may not be recovered. An impairment loss is recorded for the excess in book value of the asset over its recoverable value.
The recoverable value is the fair value of an asset less the costs to sell or value-in-use, the greater of the two. In order to assess the impairment losses the assets are grouped at the lower level where there are separately identifiable cash flows (cash generating units). Non-financial assets other than goodwill that may have experienced an impairment loss are submitted to reviews at each balance sheet date to determine whether the loss may be reversed. 2.12. Financial assets
The Group classifies its financial assets in the following categories: at fair value with changes through income, loans and accounts receivable, financial assets held to maturity and available for sale. The classification depends on the purpose the financial assets were acquired for. Management establishes the classification of the financial assets at the time of initial recognition. a.- Financial assets at fair value with changes through income Financial assets at fair value with changes through income are financial assets held for trading. A financial asset is classified under this category if it is acquired mainly with the purpose of being sold in the short-term. Derivatives are also classified as acquired for trading unless they are designated as hedges. Assets in this category are classified as current assets. Investments in financial instruments are initially recorded at cost and subsequently its value is updated based on its market value (fair value). Investments in shares are accounted for at their fair value, and the results are recorded under other income. b.- Loans granted and accounts receivable. Loans and accounts receivable are non-derivative financial assets with fixed or determinable payments that are not quoted in an active market. In this category are include the trade debtors and other receivables of the current assets, except for those maturities exceeding in 12 months since the balance date, that are classified as non-current assets. c.- Recognition and measurement of financial assets Acquisitions and divestments of investments are recognized as of the negotiation date, meaning, on the date that the Group commits to acquire or sell an asset. Investments are initially recognized at the fair value plus transaction costs for all the financial assets not carried at fair value with changes through income. Financial assets at fair value with changes through income are initially recorded at their fair value and the transaction costs are carried to income. Investments are written off in the books when the rights to receive cash flows from the investments are exhausted or have been transferred and the Group has substantially transferred all the risks and advantages derived from its ownership.
17
Financial assets held for sale and financial assets at fair value with changes through income are subsequently valued at their fair value with counterparts in equity and income, respectively. Loans, accounts receivable and financial assets held to maturity are recorded at their amortized cost according to the effective rate method, recognizing the resulting interest in income. Dividends income derived from financial assets at fair value with changes through income are recognized in the statement of income under Other Income, when the right of the Group to obtain the payment has been established. The fair values of the investments with quotes available are based in the current purchase prices. If the market for a financial asset is not active (for those securities that do not quote) the Group sets the fair value using valuation techniques that include the use of recent available transactions between willing and duly informed parties, related to other substantially equal instruments, the analysis of discounted cash flows, and options pricing models using a maximum use of market inputs and placing the least trust possible in specific inputs from the entity. In case that none of the abovementioned techniques can be used to set a fair value, investments are recorded at their acquisition cost net of impairment losses, if any. The Group assesses at each closing date whether there is objective evidence that a financial asset or group of financial assets may have experienced impairment losses. In the case of equity securities classified as held for sale, to establish whether said titles have experienced impairment losses, whether the fair value of the titles has decreased significantly or for an extended period of time below its cost will be considered. If there is any evidence of this type for the financial assets held for sale, the accumulated loss established from the difference between acquisition cost and the current fair value, less any impairment loss in that financial asset previously recorded as a gain or loss is eliminated from the net equity and is recorded as a loss in the income statement. Impairment losses recognized in the income statement for equity instruments are not reversed through the income statement. 2.13. Derivative financial instruments and hedging activity Derivative instruments are initially recognized at their fair value in the date when the derivatives contract has been signed and subsequently are valued at their fair value. The method to record a resulting gain or loss depends on whether the derivative has been designated as a hedging instrument and, if that is the case, on the nature of the accounting item it is hedging. The Group designates certain derivatives as:
Hedging of a specific risk related to a recognized liability or a highly probable foreseen transaction (hedging of cash flows).
Hedging of the fair value of recognized liabilities (fair value hedges).
The Group documents at the beginning of the transaction the existing relationship between the hedging instruments and the hedged parties, as well as their objectives for the risk management and the strategy to manage several hedging transactions. The Group also documents its assessment, both at the beginning and on an ongoing basis, whether the derivatives used in the hedging transactions are highly effective to compensate the changes in fair value or in the cash flows of the hedged parties.
The derivatives total fair value is classified as a non-current asset or liability if the outstanding maturity of the hedged party is over 12 months and as a current asset or liability if the outstanding maturity of the hedged party is lower than 12 months. The offsetting entry of this recognition is made in comprehensive income.
When a hedging instrument reaches maturity or is sold, or when it ceases to comply with the requirements to be recorded with the accounting treatment of hedging, any accumulated gain or loss in equity as of that date remains in equity and is recognized when the projected transaction impacts the income statement. When it is expected that the projected transaction will not occur, the accumulated gain or loss in equity is transferred immediately to the income statement.

18
2.14. Inventory
Inventory is valued at the lower of its cost or net realizable value. The cost is calculated using the weighted average method. The net realizable value is the estimated sale price in the normal course of business, less the applicable variable costs of goods sold.
Additionally, if needed, an impairment loss of inventory will be recorded when the cost of inventory cannot be recovered, whether the inventory are damaged, have become partially or completely obsolete, or if the sale price has declined.
At each period’s closing an assessment of the net realizable value of inventory is made, performing the required adjustments in case of being overvalued.
2.15. Trade debtors and other accounts receivable
These are recognized initially at their fair value (nominal value that includes an implicit interest) and subsequently at their amortized cost according to the method of the effective interest rate, less any value impairment loss provision. A trade accounts receivable impairment loss provision is set when there is objective evidence that the Group will not be able to collect all the amounts owed according to the original accounts receivable terms.
The existence of significant financial difficulties on behalf of the debtor, the probability that the debtor becomes bankrupt or requires financial restructuring, and the existence of late or overdue payments are considered indicators that the account receivable is impaired.
The implicit interest is broken down and recorded as a financial income as the interests are accrued. The amount of the provision is the difference between the book value of the asset and the current value of the projected cash flows, discounted at the effective interest rate. The book value of the asset is reduced through the provision account and the amount of the loss is recorded in the income statement. When an account receivable is considered uncollectable, it is written off against the corresponding impairment provision. The subsequent recovery of amounts previously written-off is recorded as a debit in the income statement. 2.16. Cash and cash equivalent Cash and cash equivalent include cash in banks, term deposits in financial institutions, other highly liquid short-term investments with maturities of three months or less and bank overdrafts. In the statement of financial position overdrafts - if any - are classified under current liabilities. 2.17. Shareholder’s capital Shareholder’s capital is represented by ordinary shares of one class and one vote per share. Incremental costs directly attributable to the issue of new shares are presented in net equity as a deduction, net of taxes, of the proceeds. 2.18. Dividends distribution As per what is explained in Note 22.3 dividends distribution corresponds to the policy set by Management, this is 30% of the proceeds, subject to the agreements reached in the Shareholders Meetings. 2.19. Trade creditors and other payables Trade creditors and other payables are recognized at their nominal value, as their average payment term is short and there is no material difference with its fair value.

19
2.20. Interest-bearing loans Loans are recorded initially at their fair value net of the costs incurred in the transaction. Subsequently, loans are valued at their amortized cost; any difference between the proceeds (net of costs necessary to obtain the loan) and the reimbursement value, is recognized in the income statement over the life of the debt according to the method of the effective interest rate. The effective interest method consists of applying the market rate of reference for debts of similar characteristics to the amount of the debt (net of all costs required to obtain the loan). Loans are classified as current liabilities unless the Group has an unconditional right to defer its liquidations for at least twelve months beyond the balance sheet’s closing date. 2.21. Corporate income tax and deferred taxes The income tax expense includes taxes of Bupa Chile S.A. and its affiliates, based on the taxable income for the period, along with the fiscal adjustments of prior periods and the change in deferred tax balances. Tax is recognized in the income statement, except when it is related to parties that are directly recognized in equity. In that case, the tax is also recognized in equity (through the consolidated classified statement of Comprehensive Income). Income tax is recorded on the basis of the liquid taxable income calculated for tax purposes. Deferred taxes are calculated according to the liability method, over the temporary differences arising from the tax base of assets and liabilities, and their book value. However, if the deferred taxes arise from an initial recognition of an asset or a liability in a transaction different of a business combination that at the time of the transaction does not impact income nor the tax gain or loss, it is not accounted for. The deferred tax is calculated using approved or about to be approved and highly probable of being passed tax rates, on the date of the financial statement and that are expected to be applicable when the corresponding deferred tax asset becomes realized or deferred tax liability becomes liquidated.
Deferred tax assets are recorded when it is considered probable that the entities of the Group will have, in the future, enough tax profits against which the assets may be made effective.
Deferred taxes have not been recorded for the temporary differences between the tax and accounting values that investments in related parties may generate, as per what is set forth in IAS 12. On September 29, 2014, the Tax Reform Law was enacted. This Law defines the deafault tax regime that applies to the company and the default corporate income tax rate that will be gradually applied to companies between 2014 and 2018, and enables companies to opt into one of two tax regimes. These tax regimes are defined as the Attributed system or the Partially Integrated System. Both systems are subject to different income tax rates as of year 2017. The Attributed regime applies to individual entrepreneurs, single-owner limited liability companies, comunnities and person-owned companies when these are made exclusively by natural persons with residence and address in Chile. The Partially Integrated regime applies to the remainder of contributors, such as publicly traded and closely-held companies, share-based or rights-based partnerships whose partners are not exclusively people living or residents of Chile, unless these manifest their will to reside in teh attributed tax regime. This decision must be declared in a shareholders' meeting with the unanimous approval of all partners or shareholders. The tax regime option must be informed to the SII on the last quarter of 2016 or at the time of beginning operations and the decision shall be valid for five years. Since as of December 31, 2014 there has been no shareholders' meeting of the Group, the company has calculated its deferred taxes arising from the change in tax rates using the Partially Integrated Income criterion. Furthermore, the Company may opt to a regime change different to the default regime within the last six months of the prior commercial year (2016) with the approval of an extraordinary shareholders' meeting

20
with a quorum of at least two thirds of the shares with voting rights and will be made effective presenting the declaration subscribed by the company, jointly with the act reduced to public deed duly signed by the company. The company must remain in the tax regime that corresponds for at least five consecutive commercial years. After said period the company may change regimes and maintaining the new regime for at least five consecutive years. The deferred tax is measured using the tax rates that are expected to be applied to the temporary differences at the time they are reversed using the default tax rate at the balance date, as indicated in the following chart:
2.22. Employee benefits
a.- Severance indemnity
The companies of the Group have not agreed this benefit with the employees.
b.- Personnel annual leave
The Group records an annual leave expense for the employees during the accrual period. This benefit corresponds to all the employees and is equivalent to a fixed amount according to the individual labor contracts with each partner.
This benefit is recorded at its nominal value. c.- Employee bonuses The payments related to the real performance bonuses accrued can differ of the amounts previously recognized as liabilities, whose base of estimation were subject to the income of the period and to the performance recorded in appraisals made by Management and objective appraisals (teamwork, efficiency, empathy) and goals (income of the period, agreements, collectability indices and other). 2.23. Provisions
Provisions for onerous contracts, legal proceedings and other contingencies, are set when:
The Group has a present liability, be legal or implicit, as a result of past events;
It is probable that a resource outflow will be required to settle the liability;
The amount has been estimated in a reliable manner.
Existing obligations at the balance date, arising as a result of past events whose settlement amount and time are indeterminate, are recorded in the statement of financial position as a provision for the total of the most probable amount that the Company estimates that it will have to disburse to settle the liability.
The provisions are quantified considering the best possible information on the date of their recognition.
In the Insurer area there are Provisions directly related to the Isapre business and correspond to provisions of benefits accrued and not liquidated and for lawsuits related to health expenses and labor disability subsidies (LDS, or SIL by its acronym in Spanish).
a.- Health expenses
Year Attributed
income
Partially
Integrated
2014 21.0% 21.0%
2015 22.5% 22.5%
2016 24.0% 24.0%
2017 25.0% 25.5%
2018 25.0% 27.0%

21
The Health Insurance affiliate (Isapre) recognizes as expenses those benefits that, having materialized at the closing date of the Financial Statements, have not been accounted for yet. To come up with the provision the following were considered: benefits provided and not reported to the Isapre, benefits provided and reported but not yet valued, and the benefits provided, reported and valued but where the corresponding bonds have not been issued yet. As an information starting-point were considered the Hospital Bonds, Medical Programs, Hospital Reimbursements and Outpatients Reimbursements, and considering factors such as: behavior of accident rates, historic trend, seasonal variables, processing time, prices, Specific Health Guarantees (GES) and solution of medical programs and amount of benefits provided at the closing of each quarter and liquidated on the following quarter. b.- Labor Disability Subsidy (LDS) LDS considers all medical leave that have been claimed but have not been valued, and those that, while corresponding to the current closing period, have not been filed to the Isapre Cruz Blanca S.A. To estimate the provision the following factors were considered: behavior of accident rates, historic trend, seasonal variables, and amount of the benefits provided at the closing of each quarter and liquidated on the following quarter. In the calculation of the provision, the bonds and reimbursements for hospital and outpatients’ services and LDS, the following was considered:
The cost of the benefits accrued at each monthly closing and that were accounted for in subsequent dates.
The amount of the provision was set as the moving average of the last twelve moths of the subsidies accrued at closing and accounted for after that date.
c.- Ongoing risk reserve For the purposes of the Life Insurance Company, and according to what is set forth in General Standard NCG 306 (letter b, point 1, Title III), this note presents the rationale for the application of the exception indicated in said standard, according to which this affiliate records its liabilities with the Health insurance beneficiaries, whose intermediary is the Isapre, by establishing an ongoing risk reserve equivalent to one month of average premium, prior to discounting the acquisition costs, in accordance to the requirements of the Superintendence of Securities and Insurance. d.- Claims reserve In the Life Insurance Company liabilities are recorded (Claims payable, outstanding claims, in settlement process, and incurred but not reported). This Incurred But Not Reported reserve (from hereon IBNR reserve) has the purpose to set a reserve to compensate the future cost of claims occurred in the current period, but will not be informed until a time in the future that may be more or less close to the present. In accordance with what is set forth in NCG 306 of the SVS and Circular 507, the IBNR liabilities are estimated by applying the transitory method defined by the Superintendence of Securities and Insurance. The outstanding and settled claims correspond to the amount of claims of this type that as of the closing of the financial statements were settled but as of the closing date have not been paid to the beneficiary. Here are included the claims that are being assessed by the insurance Company to determine whether a payment is due.

22
2.24. Classification of balances as current and non-current In the statement of financial position, balances are classified according to their maturity, as current if the maturity is equal or lower to twelve months counted from the cut-off date of the financial statements, and as non-current those that exceed that time frame. 2.25. Revenue recognition a.- Ordinary revenue In the health service rendering business, ordinary revenue derived from the rendering of services are recognized in accordance with IAS 18 and IAS 11, when they can be reliably measured and in function of the progress level of the rendering or realization of the transaction at the closing date. Ordinary revenue is presented net of value added tax, returns, rebates and discounts and after eliminating intercompany sales within the group where they consolidate. Revenues derived from the rendering of medical services (hospital and outpatients), are recognized generally in the period in which the services are provided and accrued on the basis of estimated revenues as at the closing date of the financial statements. For the Insurer business, according to what is set in IAS 18 it is necessary to recognize revenue on an accrual basis. This implies the recognition of non-declared and non-paid (NDNP) contributions arising from the obligation of the beneficiaries to pay the contribution (signed contracts between beneficiaries and Isapre). The NDNP and DNP must be recorded net of impairment, avoiding in this manner the recognition of assets that will not finally be recognized as an equity increase. In this segment, the Life Insurance Company recognizes its revenue on an accrual basis on the accepted and ceded premium, in accordance with what is set forth in Circular 1499 and it its subsequent modifications, which are in line with IFRS. With regards to commissions and direct costs of the sales area, and considering that there are studies that demonstrate that the contract length of the beneficiary portfolio is approximately of six years, and in order to correlate revenues (contributions) with expenses, it is allowed to recognize as an asset said amount and to defer it over the average period of contract length of the beneficiaries, and with regards to additional products such as unemployment insurance and death insurance, it is necessary to recognize a provision to cover the net cost of benefits, for all beneficiaries that have their insurance current at the closing date of the financial statements. Ordinary income of the Insurance Company correspond to those net premiums originated by the sale of Insurance Policies in the period between the date of authorization to operate granted by the Superintendence of Securities and Insurance and the closing date of the financial statements. b.- Interest income
Interest income is recognized using the effective interest method. When an account receivable is deemed impaired, the Group reduces the book value to its recoverable value, discounting the future cash flows at the original effective rate of the instrument, and the discount is recognized as a smaller interest income. The interest income from loans that have suffered value impairment losses are recognized using the effective rate method. At the closing date, these amounts are not relevant.
c.- Dividends income
Dividends income is recognized when the right to perceive the payment is established, in the case of the investments that are not accounted for using the equity method.

23
2.26. Leases
a.- When an entity of the Group is the lessee - Financial lease
The property, plant and equipment leases are recorded as financial leases when the Group holds substantially all the risks and advantages derived from ownership. Financial leases are capitalized at eh beginning of the lease at the lower of the fair value of the leased property or at the present value of the minimum lease payments.
Each lease payment is distributed among the liability and the financial burdens to achieve a constant interest rate on the outstanding balance of the debt. The corresponding lease liabilities, net of financial burden, are included in other non-current accounts payable. The interest element of the financial cost is charged to income over the life of the lease. The asset acquired under a financial lease scheme is depreciated over the shorter of its useful life or the life of the contract.
b.- When an entity of the Group is the lessee – Operating lease
Leases where the lessor retains a significant part of the risks and advantages derived from the ownership are classified as an operating lease. Payments for operating lease (nets of any incentive received by the lessor) are charged to income on a linear basis over the life of the lease, unless it is more appropriate to use another, mire systematic, basis that better represents the benefits generation pattern for the user, independent of the actual fashion in that installments are made. c.- When an entity of the Group is the lessor
Assets leased to a third party under operating lease contracts are included within property, plant or equipment.
Revenue derived from the lease is recognized linearly over the term of the lease. 2.27 Business combinations Business combinations are accounted for using the acquisition method. This involves the recognition at fair value of identifiable assets (including previously non recognized intangible assets) and liabilities (including contingent liabilities and future restructuring) of the acquired business. Goodwill acquired in a business combination is initially valued at cost, and is defined as the excess of the cost of the business combination over the company’s interest in the fair value of the assets, liabilities and contingent liabilities identifiable in the acquisition. After the initial recognition, goodwill is measured at cost less any accumulated impairment loss. For the purposes of impairment tests, goodwill acquired in a business combination is allocated as of the acquisition date to each cash generating unit or groups of cash generating units that are expected to get benefits from the combination synergies, notwithstanding whether other assets or liabilities of the Group are allocated to these units or groups of units. If the acquisition cost is lower than the fair value of the net assets of the acquired subsidiary, the difference is carried directly to income. Transaction costs are treated as expenses at the time they are incurred. For business combinations performed in stages the fair value of the acquired company is measured at each opportunity, recognizing the effects of changes in the interest in the results in the period in which they occur. The accounting policies of the subsidiaries shall be modified if necessary, to guarantee the uniformity with the policies adopted by the Bupa Chile Group. Minority interest is presented as a separate component of net equity (non-controlling interest). 2.28 Impairment tests Impairment tests are assessments performed to specific assets in order to test whether they can be recovered or realized at a value equal or higher than its current book value.

24
a) Non-financial assets As set forth in IAS 36, balances of Property, Plant and Equipment are subject to impairment tests every time that an event or change in circumstances of the business indicates that the book value of the assets may not be recoverable, whereas goodwill and other Non-financial assets with indefinite useful life are tested annually. The recoverable value of an asset is estimated as the greater of the net sales price and the value-in-use. An impairment loss is recognized when the balance exceeds the recoverable amount. A previously recognized impairment loss can be reversed if a change has occurred in the estimates performed to calculate the recoverable amount. However, the reversal may not be for an amount higher than the amount calculated and accounted for in prior years. In the case of goodwill, a previously recognized impairment loss is not reversible. In order to assess the impairment losses, assets are grouped at the lower level for which there are separately identifiable cash flows (cash generating units). Non-financial assets other than goodwill that may have experienced an impairment loss are subject to reviews at each closing date to check for reversals of the loss. Cash generating units are the smallest identifiable groups of assets whose continuous use generates cash inflows that are mainly independent of those generated by the use of other assets or groups of assets. b) Financial assets In accordance with IAS 39, at the end of each period an assessment is carried to check if there is objective evidence that assets or groups of financial assets are impaired. The effects of impairment will be accounted for only if there is objective evidence of one or more events that occur after the initial recognition of the financial asset, and when this impairment has future effects on the related cash flows. Trade debtors are periodically assessed with regards to their agreed terms and those that are overdue are reviewed and monitored for the purposes of getting evidence of their recoverability. In case of obtaining objective evidence that the cash flows may not be recovered then the Company has a basis on which to make a Trade debtors impairment estimate. Trade debtors for which an impairment provision has been recorded are periodically reviewed to obtain evidence of probable subsequent billing or collection in order to recognize, if needed, the impairment or write-off of said receivable. Therefore, the impairment or doubtful accounts provision related to Trade Debtors is calculated when there is evidence that Bupa Chile S.A. or one of its affiliates will not receive payments in accordance to the original sale terms. Furthermore, provisions are recorded when the customer enters into a legal process of bankrupcy, or when Bupa Chile S.A. or some of its subsidiaries have exhausted all collection methods over a reasonable time frame, either in a normal or legal stage. Complementary information can be found in Note 3.9 b). 2.29. Environment Disbursements related to environment that do not correspond to property, plant and equipment additions, are recorded as an expense in income of the period, or in the period where they are incurred. 2.30 Changes in accounting criteria The Group has not made changes in accounting estimates or policies that imply a restatement in accordance to what is set forth in IAS 8, compared to prior periods. It is habitual during the monitoring processes to perform checks on the estimates when there is new information or data that allow to make a more precise and reliable said estimates.

25
NOTE 3.- FINANCIAL RISK MANAGEMENT The Company is exposed to the risks of the industry where it develops its activity, such as changes in the Regulatory framework, correlation with economic cycles and competition. The Company is also exposed to risks related to the financial structure of the Company and its affiliates, as well as insurance risk in the Isapre and Life Insurance industries. The main risk situations that the Group faces are: 3.1. Regulatory framework With regards to the Health Care and Insurance businesses the Superintendence of Health is permanently supervising its operations and checking the compliance with the current regulations. This forces the subsidiary Isapre Cruz Blanca to comply with the regulations of the industry. Bupa Chile S.A. and Cruz Blanca Compañía de Seguros de Vida S.A. are entities subject to regulation by the Superintendence of Securities and Insurance (SVS). Bupa Chile S.A. and affiliates have the technical, management and financial capabilities to comply with the required regulations and to adequate its operations to the legal requirements. Additionally, the Company is permanently improving its Quality Policies applicable to each of its subsidiaries, like for example the current process of certification of its hospitals and outpatient care centers. 3.2. Correlation with economic cycles This industry has a relative positive correlation to the economic cycle where there are a series of elective, non-urgent, services that people may postpone. However, Bupa Chile S.A. and affiliates have as a business strategy the rendering of Health Care services of quality at an accessible price and develops its commercial strategies according to this to minimize the effect of said cycles. 3.3. Competition In the Insurance business, competition among its agents generates the need to permanently offer improvements in the benefits offered to its beneficiaries, with a potential impact no margins. In the health care business, competition results in efforts to improve technology and service levels. Both in the insurance health care businesses the Company and its affiliates hold trademarks of recognized prestige and with a relevant market position at national level, considering in the case of the hospitals the areas of influence in the regions where they are located. Additionally, the have a financial structure that allows them to perform the required investments to keep a relevant position in their respective markets. 3.4. Currency risk Financial liabilities of the companies are mainly nominated in UF and Chilean pesos, US dollar and in New Peruvian sol. Investments are mainly made in UF and in Chilean pesos. There are also specific investments in medical equipment that are set in foreign currency for which the Parent company and its affiliates, through its Finances area, attempt to hold an adequate financial structure to control and mitigate the risk of fluctuations in the value of these currencies, generating financing instruments or financial investments in foreign currencies that reduce the impact from currency fluctuations from the moment that the investment decision is made up to the moment that the asset is installed and must be paid. 3.5. Foreign exchange rate risk The head company holds investments in Peru which results in an exposure to the fluctuation of the exchange rate the Peruvian new sol and US dollar. The investment is controlled from Chile in Chilean pesos. Despite the above, at the closing of this period the Head Company and its Affiliates do not hold significant balances in currencies other than the functional currencies, and therefore there is no significant exposure to the foreign exchange rate risk in these companies.

26
3.6. Interest rate risk The Company, through its Finances area, aims for a financing structure that allows to control the volatility of the cost of debt and to minimize the Interest rate risk and its impact on the Company’s income. A portion of the debt is agreed with a fixed interest rate (mainly the portion related to the Bonds) and a portion with a variable rate - mainly the portion related to the Syndicated Loan - which has been transformed to fixed rate through the use of derivative instruments. 3.7. Insurance risk With regards to the Insurance business of the Company, management on Insurance risk is based on the correct pricing of the insurance plans that the Company trades. To perform the pricing the following aspects must be considered, among others: a) Income estimates: socio economic segment, number of beneficiaries, permanence rate, and overdue
rate. b) Cost estimates (claims rate): age, gender, socioeconomic segment, geographic zone, preferred health
care provider, and frequency, price of benefits. The pricing method considers, for a given costs level (given the frequency of according to the portfolio’s configuration) and a target claims rate (defined for the segment), the estimation of required income to reach that level of claims rate. After obtaining the income the price is estimated considering the risk factors that the portfolio configuration generates for these expenses. The composition of the beneficiaries in Isapre Cruz Blanca S.A., by region, is the following:
In the Life Insurance Company, internal policies have been set based on regulation requirements to manage insurance own risks, among which are: Reinsurance Management Risks, Product Development and Pricing Risks, Subscription Risks, Claims Risks and Reserve Management Risks. 3.8. Calculation of fair value of financial instruments As part of the risk analysis, a market value analysis has been performed over the bank liabilities of the Company At December 31, 2014. This analysis consists in obtaining the present value of the future cash flows of the current financial debt using rates representative of the market conditions according to the Company’s risk and the outstanding term of the debt. This analysis concluded that there are no significant effects with respect to the values of the financial debt calculated by the amortized cost method. 3.9. Financial risk management Bupa Chile S.A. has a formal policy, approved by the Board and reviewed at least annually, which sets forth the general indications regarding the management of the Financial Risk of the Company. In this sense, the Company understands as “Risk Management” the process that involves how the entity identifies, assesses, responds, monitors and reports those risks relevant to the size, volume and complexity of its operations.
12/31/2014 12/31/2013 12/31/2014 12/31/2013
Region 147,953 139,396 39% 39%
Santiago 229,054 219,558 61% 61%
Total 377,007 358,954 100% 100%
DescriptionNumber of affiliates (Policies) Market share %

27
Bupa Chile S.A. understands the different types of risks that the Company faces according to the industry where each affiliate operates and how these companies interact with economic and financial environment that, under certain circumstances, could impact the business expectations and the financial sustainability in the medium and long term. On the other hand, according to the scenario that the industry may be facing, the Company must assess the impact on business development for circumstances arising from fluctuations in the economic cycle (for example, inflationary scenarios) and exceptional unemployment levels. These factors make Bupa Chile S.A. continuously search method that result in improvements of its benefits in the lines of services, faced to a high competition scenario. In the performance of its daily operations, Bupa Chile S.A. faces different factors that could impact the achievement of the profitability targets. These factors could impact the organization by different transmission mechanisms, generating scenarios of financial uncertainty that could result in defaults with counterparts in financial operations, liquidity contractions, significant fluctuations in the values of assets and liabilities held in portfolio, among other matters. Given this, the Corporate Finance Management is responsible to perform the actions related with the financial risk management. According to the financial risk management policies, the Company uses derivative instruments only with the purpose of hedging exposure to currency and interest rate risks derived from the Company’s operations and its sources of financing. The company does not acquire derivatives for trading. The Company classifies its risks according to the underlying uncertainty source and their transmission method. Therefore the Company understands that the risks it faces are: a.- Liquidity risk Bupa Chile S.A. uses the concept of liquidity risk when speaking of that financial uncertainty at different time frames, related with the Company’s capability to respond to the net cash requirements that support its operations, both in normal and exceptional conditions. As a liquidity risk management policy, the Company holds an adequate level of liquidity through long-term credit facilities for amounts that are sufficient to support the requirements of each of its business lines, projected over a period that is in function of the situation and expectations of the equity and debt markets. The analysis of financial liability maturities of Bupa Chile S.A. is presented following:
Maturity analysis
2015 2016 2017 2018 2019 and beyond
Th$ Th$ Th$ Th$ Th$
Crédito Sindicado $ 7,319,198 7,052,930 14,898,545 14,217,896 0 43,488,569
Bono UF 2,395,578 1,585,967 1,583,786 1,583,786 53,211,467 60,360,584
Otros Créditos $ 13,817,611 3,848,118 3,596,152 4,808,206 0 26,070,087
Otros Créditos S/. 91,801 83,944 7,062 0 0 182,807
Otros Créditos UF 5,642,611 3,348,382 4,975,614 5,121,458 34,476,008 53,564,073
Leasing $ 5,353,157 4,178,916 1,721,714 168,208 0 11,421,995
Leasing S/. 20,735 19,691 19,691 19,691 0 79,808
Leasing UF 1,356,236 1,040,044 792,151 770,472 1,517,499 5,476,402
Otros Créditos USD (37,578) 29,002 27,549 23,460 0 42,433
Leasing USD 124,292 121,642 113,083 0 0 359,017
36,083,641 21,308,636 27,735,347 26,713,177 89,204,974 201,045,775
Class Currency Total
Total
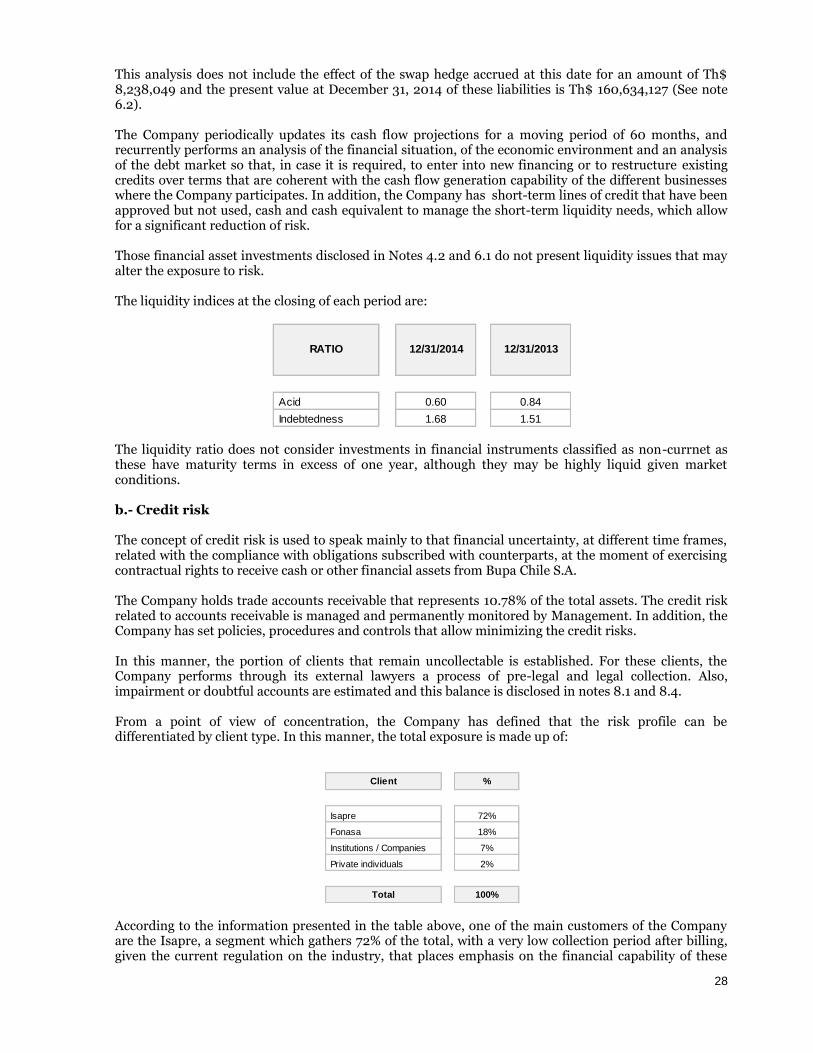
28
This analysis does not include the effect of the swap hedge accrued at this date for an amount of Th$ 8,238,049 and the present value at December 31, 2014 of these liabilities is Th$ 160,634,127 (See note 6.2). The Company periodically updates its cash flow projections for a moving period of 60 months, and recurrently performs an analysis of the financial situation, of the economic environment and an analysis of the debt market so that, in case it is required, to enter into new financing or to restructure existing credits over terms that are coherent with the cash flow generation capability of the different businesses where the Company participates. In addition, the Company has short-term lines of credit that have been approved but not used, cash and cash equivalent to manage the short-term liquidity needs, which allow for a significant reduction of risk. Those financial asset investments disclosed in Notes 4.2 and 6.1 do not present liquidity issues that may alter the exposure to risk. The liquidity indices at the closing of each period are:
The liquidity ratio does not consider investments in financial instruments classified as non-currnet as these have maturity terms in excess of one year, although they may be highly liquid given market conditions. b.- Credit risk The concept of credit risk is used to speak mainly to that financial uncertainty, at different time frames, related with the compliance with obligations subscribed with counterparts, at the moment of exercising contractual rights to receive cash or other financial assets from Bupa Chile S.A. The Company holds trade accounts receivable that represents 10.78% of the total assets. The credit risk related to accounts receivable is managed and permanently monitored by Management. In addition, the Company has set policies, procedures and controls that allow minimizing the credit risks. In this manner, the portion of clients that remain uncollectable is established. For these clients, the Company performs through its external lawyers a process of pre-legal and legal collection. Also, impairment or doubtful accounts are estimated and this balance is disclosed in notes 8.1 and 8.4. From a point of view of concentration, the Company has defined that the risk profile can be differentiated by client type. In this manner, the total exposure is made up of:
According to the information presented in the table above, one of the main customers of the Company are the Isapre, a segment which gathers 72% of the total, with a very low collection period after billing, given the current regulation on the industry, that places emphasis on the financial capability of these
Acid 0.60 0.84
Indebtedness 1.68 1.51
RATIO 12/31/2014 12/31/2013
Client %
Isapre 72%
Fonasa 18%
Institutions / Companies 7%
Private individuals 2%
Total 100%

29
institutions. There are no foreseeable contingencies for this concept with regards to this client segment. The same is true for account receivables from Fonasa (18%), which can be considered very close to “risk free” given its condition of social security provider institution that is financed by direct contributions by the State of Chile. The third group, with a 7% share, corresponds to companies with agreements, for which the Group has hired an external collections service that presents weekly to the Finance Department the results of its work, as these companies present the higher relative risk level within the segments with greater share. Although from a point of view of attributes the “individuals” segment is the most risky, the impact of the occurrence of events of credit would not result material given the low share over the total exposure. The collection of payment from a patient in hospital is supported by promissory notes which are released to the patients once that the corresponding bill has been paid either in cash or through financial instruments. For this reason the guarantees are not material against the total of accounts receivable as its risk exposure is not significant. Affiliates of the outpatients segment, given the business practice of collecting the payment prior to initiating the medical appointment or procedure have a lower risk credit in accounts receivable. The affiliates of the insurer segment perform a risk credit assessment based on current policies and its actual collection probability of the amounts accrued monthly that are related to the coverage granted. c.- Market risk The market risk concept is used to address that financial uncertainty at different time frames related to the future developments of the market variables relevant to the financial performance. Specifically, the relevant financial variables to the business of the Company are: - Exchange rate Chilean peso to UF - Reference interest rate (TAB - Interbank active rate, as per its acronym in Spanish) The abovementioned activities establish the magnitude of the interest payment of some of the most important liabilities of the Head Company and some affiliate companies. Market variables sensitivity analysis When faced to uncertainty scenarios created from these factors, the net exposition amount of these assets and liabilities has been submitted to sensitivity tests according to the expected volatility in the interest rate (TAB 180) and the behavior of the UF in the calculation of the maximum exposure amounts in face of eventual changes in the conditions of the economic environment. With regards to the liabilities, the impact in results from changes in the variables identified as risky is analyzed according to both positive and negative changes expected, and keeping in mind the volatility of the variable rate of debt TAB 180, the hedging effect can be seen in the following table:
Th$ + - + -
Crédito Sindicado (1)
No Sw apeado $ 3,256,000 TAB +-1,65% (2) 1.650% 53,724 53,724 0 0
Sw apeado UF 31,282,498 UF 3,09% (3) 3.090% 0 0 966,629 966,629
Bono UF 38,569,087 UF 3,09% (3) 3.090% 0 1,191,785 0 0
Otros Créditos $ 26,953,072 Fija - - 0 0 0 0
Otros Créditos US$ 96,259 Fija - - 0 0 0 0
Otros Créditos UF 36,346,444 UF 3,09% (3) 3.090% 0 1,123,105 0 0
Otros Créditos S/. 168,657 S/. - - 0 0 0 0
Leasing $ 10,584,407 Fija - - 0 0 0 0
Leasing US$ 334,008 Fija - - 0 0 0 0
Leasing UF 4,736,026 UF 3,09% (3) 3.090% 0 146,343 0 0
Leasing S/. 69,617 S/. - - 0 0 0 0
53,724 2,514,957 966,629 966,629 Totales
Equity / (hedge) (4)
Th$ Th$ Type Currency Balance Market
Variable
Variable
Volatility
Variable
Changes
Profit

30
(1) Corresponds to a syndicated loan partially hedged with a CLP/UF swap and fixed rate on 91.88% of the
liability. (2) TAB 180 volatility between 2008 and 2012 according to statistics of the Central Bank of Chile (3) UF volatility between 2008 and 2012 according to the Central Bank of Chile; equivalent to the average annual
change in the UF value over the period. (4) Corresponds to the impact in equity as an effect of the hedging activities.
At December 31, 2014 the Group does not have significant balances in readjustable monetary assets in currencies other than the functional currency (Chilean peso) and its exposition to the market risk is focused on the balances of the outstanding debts. The sensitivity analysis of said balances, considering the portion nominated on a different base than the functional currency (equivalent to UF 4,504,552), shows a potential loss in income equivalent to (Th$ 2,461,233) considering the volatility of the UF in the last 5 years. However, it should be noted that a significant portion of the Company’s cash flows come from the Insurance business that are restated monthly following the change in the UF, which mitigates the abovementioned exposure. Additionally, the Company presents an exposure to the changes to the TAB rate for 180 days for a portion of the syndicated loan whose impact on income, after applying the volatility of the last 5 years of the TAB 180 rate, would be a loss of income of Th$ 53,724 and a gain or loss in net assets of Th$966,629 a portion that has 100% hedge effectiveness. An internal structure has been set to carry the actions to manage the exposure to financial risk, where the Group’s Finance Management is in charge of assessing the requirement of performing hedging operations, mainly, of liabilities nominated under a variable interest rate or in currencies different to the functional currency. Currently the Company uses derivative instruments to mitigate the exposure to the Interest rate risk that generate those liabilities nominated with a variable interest rate, specifically the syndicated loan indexed to a TAB rate on Chilean pesos. Specifically, among the actions to mitigate financial risk is the hedge for an approximate amount of Th$ 52,560,000 through Cross-Currency Swaps where the active component replicates the conditions set for the debt. The current balance of the hedged debt is Th$ 31,282,498 and the total amount of the syndicated loan is Th$ 34,538,498. This hedging effect is what is reflected in the sensitivity table, showing that the effect of change in the interest rate and the value of the UF impact in the opposite way the effect on the liability. Part of the risk management is to identify and minimize the effect of the risk situations that affect the Company’s risk profile. Specifically, a series of assets has been defined, that can be chosen to form part of the Company’s investment portfolio. A structure of investment limits has been defined, according to an external classification setup, which differentiates on the basis of the class of instrument, issuer type and credit rating of short and long-term. In this manner, the institutions that are eligible as counterparts of the Company, are:
With these ratings Bupa Chile S.A. seeks to hedge the eventual risks that may arise as a consequence of its business and performance.
d.- Insurance risk With regards to the Insurance business of the Company, management on Insurance risk is based on the correct pricing of the insurance plans that the Company trades. To perform the pricing the following aspects must be considered, among others:
Type of issuerShort-term
instruments
Long-term
instruments
Banks Level 1 AA
State and Private Companies - AA
Pension Funds Managers Aafm / M1 -

31
Income estimates: socio economic segment, number of beneficiaries, permanence rate, and overdue rate. Cost estimates (claims rate): age, gender, socioeconomic segment, geographic zone, preferred health care provider, and frequency, price of benefits. The pricing method considers, for a given costs level (given the frequency of according to the portfolio’s configuration) and a target claims rate (defined for the segment), the estimation of required income to reach that level of claims rate. After obtaining the income the price is estimated considering the risk factors that the portfolio configuration generates for these expenses. NOTE 4.- MANAGEMENT ESTIMATES AND JUDGMENT Estimates and criteria used are continuously assessed and are based on historic experience and other factors, including the expectation of occurrence of future events that are deemed reasonable according to circumstance. The Group makes estimates and assumptions with regards to the future. Accounting estimates are, by definition, seldom equal to actual results. Estimates and assumptions that have a significant risk of causing a material adjustment to the asset and liability balances of next year are disclosed following: 4.1. Estimation on goodwill impairment The Group assesses annually if goodwill has suffered any impairment, according to the accounting policy described in Note 2.9 a). Recoverable amounts of the cash generating units have been established on the base of the calculation of their value in use and are disclosed in Note 14. 4.2. Fair value of derivatives and other financial instruments The fair value of financial instruments that are not traded in an active market (shares without quote or insufficient market presence, off-market derivatives, etc.) is calculated using valuation techniques. The Financial Instruments have been accounted at their fair value in the statement of financial position At December 31, 2014, based on the methods set forth in IAS 39. Said methods applied to each class of financial instruments are classified according to its hierarchy in the following manner: - Level I: value or price quote in identical asset or liability markets. - Level II: inputs from sources different than the quote values in Level I but that may be observed in
the market of assets of liabilities either directly (price) or indirectly (obtained from prices). - Level III: inputs for assets and liabilities that are not based on observed market data. The following chart presents the financial assets and liabilities measured at fair value according to their valuation hierarchy:
Current Non-current Current Non-current
Th$ Th$ Th$ Th$
Financial Assets
Superintendence Guarantee 0 16,022,014 0 14,295,813 Level II
Mutual Funds 10,445,184 65,007 9,013,646 245,656 Level I
Term Deposits 9,964,540 1,185,779 27,998,290 2,299,440 Level II
Bonds and mortgages 1,162,786 20,306,006 2,811,486 7,120,184 Level II
Shares 735 0 911 0 Level I
Total assets 21,573,245 37,578,806 39,824,333 23,961,093
Financial liabilities
Interest-bearing loans 18,161,806 76,272,648 14,599,776 72,678,872 Level II
Financial lease liabilities 6,075,851 9,648,207 6,174,366 13,667,515 Level II
Bonds 782,004 37,787,083 770,426 35,712,927 Level II
Sw ap contracts 981,948 7,256,101 1,064,375 4,613,300 Level II
Other bank loans 3,668,479 0 1,549,243 0 Level II
Total liabilities 29,670,088 130,964,039 24,158,186 126,672,614
Financial Net Assets at fair value (8,096,843) (93,385,233) 15,666,147 (102,711,521)
Classes of financial instruments at fair value
12/31/2014 12/31/2013
Hierarchy

32
4.3. Impairment of intangibles with indefinite useful life The Group holds intangibles with indefinite useful life that are presented at historic cost less any impairment loss. These assets are subject annually to impairment tests, or when there are factors that indicate a potential impairment. 4.4. Fair value of assets and liabilities The fair value is the amount at which an asset can be bought or sold or the amount at which a liability can be incurred or liquidated in a current transaction between duly informed parties at arm’s length conditions. The Group estimates that said values based on the best estimate available make use of models or other valuation techniques. 4.5. Useful lives and residual value The valuation of investments in property, plant and equipment consider the performing of assessments to calculate both the residual values and the useful lives to use in the calculation of the depreciation of each asset. These estimates consider variables as operations, technology and alternative use of the assets. In the case of the depreciation of medical equipment, the depreciation has been estimated based on the useful life that Management has estimated for each of these assets through estimations of constructive aspects (materiality of the components that make up the equipment), intensity in the use of the goods (time or frequency of use of the equipment) and costs related to repairs. 4.6. Fair value of the provision on health related expenses and labor disability These provisions are recorded as a provision whose amount is equivalent to the most probable amount that the Group estimates it will have to disburse to settle the liability with impact on results. See note 2.23 for additional information. 4.7. Fair value of non-declared and non-paid social payments (NDNP) This value represents those non-declared and not paid contributions at the closing of the period and that have been recognize as revenue according to IAS 18. Amounts calculated are based on the real behaviors of collection considering a 48 month history as this is the period where recovery rates are relevant for the Company. The recovery rates defined for each flow are built in accordance to the average of the last four years. 4.8. Legal proceedings and other contingencies The Group assesses periodically through its management and/or legal counsel the impact of litigation in the financial statements, as set forth in IAS 37.
Current Non-current Current Non-current
Th$ Th$ Th$ Th$
Financial Assets
Cash on hand 705,738 0 401,579 0 Level I
Bank balances 2,351,340 0 5,329,001 0 Level I
Total assets 3,057,078 0 5,730,580 0
Final net position of financial assets and liabilities (5,039,765) (93,385,233) 21,396,727 (102,711,521)
Cash equivalents (Note 5) 23,452,576 0 19,480,538 0
Other f inancial assets (Note 6.1) 1,177,747 37,578,806 26,074,375 23,961,092
Other f inancial liabilities (Note 6.2) (29,670,088) (130,964,039) (24,158,186) (126,672,614)
Total (5,039,765) (93,385,233) 21,396,727 (102,711,522)
Classes of financial instruments at book value
Non-current asset Non-current liabilities
Hierarchy

33
NOTE 5.- CASH AND CASH EQUIVALENTS Cash and cash equivalents included in the consolidated Statements of Financial Position At December 31, 2014 and December 31, 2013, is the following:
The breakdown by currency type is the following:
Cash and cash equivalents included in the consolidated Statements of Financial Position At December 31, 2014 and December 31, 2013, does not differ from those presented in the consolidated Statements of Cash Flows, as explained in the following chart:
NOTE 6.- OTHER CURRENT AND NON-CURRENT FINANCIAL ASSETS
NOTE 6.1. OTHER FINANCIAL ASSETS
The breakdown of this accounting area at December 31, 2014 and December 31, 2013 is the following:
These assets are presented at fair value, recognizing the changes in value through income under Financial Income.
12/31/2014 12/31/2013
Th$ Th$
Cash 705,738 401,579
Bank account balances 2,351,340 5,329,001
Short-term deposits up to 90 days 9,030,845 5,059,418
Marketable securities of quick liquidation (overnight deposits, mutual funds) 10,445,184 8,238,086
Bonds and mortgage letters 919,469 452,454
Total cash and cash equivalents 23,452,576 19,480,538
Cash and Cash Equivalents
Balances at
12/31/2014 12/31/2013
Th$ Th$
US dollar 483,305 8,572
Peruvian New Sol 370,649 1,891,233
UF 3,073,601 3,027,667
Non restatable Chilean pesos 19,525,021 14,553,066
23,452,576 19,480,538
Currency
Balances at
12/31/2014 12/31/2013
Th$ Th$
Cash and Cash Equivalents 23,452,576 19,480,538
Cash and Cash Equivalents (statement of cash flows) 23,452,576 19,480,538
Balances at Reconciliation of Cash and Cash Equivalents
presented in the statement of financial position with
that in the statement of cash and cash equivalents
Current
Non-
Current Current
Non-
Current
Mutual funds (variable income) Non restatable pesos 0 65,007 775,560 854,410
Term deposit Non restatable pesos 933,695 364,611 7,900,787 1,762,684
Superintendence guarantee Non restatable pesos 0 1,946,953 0 1,391,986
Shares Non restatable pesos 735 0 911 0
Bonds and mortgage letters of credit Non restatable pesos 0 1,708,159 0 0
Term deposit New Peruvian Sol 0 0 14,716 0
Term deposit UF 0 821,168 15,023,369 536,756
Superintendence guarantee UF 0 14,075,061 0 12,903,827
Bonds and mortgage letters of credit UF 243,317 18,597,847 2,359,032 6,511,429
Total 1,177,747 37,578,806 26,074,375 23,961,092
Other financial assets
Th$ Th$
12/31/2014 12/31/2013
Currency

34
The investments performed by Isapre Cruz Blanca S.A. in order to comply with the obligations set forth in the Law, with regards to the guarantee that the Health Institutions must deposit and maintain, as well as the investments held by the Life Insurance Company to keep the minimum risk equity, are assets recorded at fair value, recognizing the changes in value in income under Financial Income. NOTE 6.2. OTHER FINANCIAL LIABILITIES
The breakdown of this accounting area at December 31, 2014 and December 31, 2013 is the following:
Current Non-
Current Current
Non-
Current
Th$ Th$ Th$ Th$
US dollars 24,586 71,673 21,231 83,164
Non-restatable pesos 14,582,306 43,853,315 13,468,748 52,481,139
Peruvian New Sol 80,876 87,781 63,474 155,825
UF 3,474,038 32,259,879 1,046,323 19,958,744
Total bank loans 18,161,806 76,272,648 14,599,776 72,678,872
US dollars 111,076 222,932 140,302 289,201
Non-restatable pesos 4,818,559 5,765,848 4,529,803 8,901,361
Peruvian New Sol 16,692 52,925 10,414 65,408
UF 1,129,524 3,606,502 1,493,847 4,411,545
Total financial leasing liabilities 6,075,851 9,648,207 6,174,366 13,667,515
Swap contracts Non-restatable pesos 981,948 7,256,101 1,064,375 4,613,300
Bond debt UF 782,004 37,787,083 770,426 35,712,927
UF 612,530 0 18,770 0
Non-restatable pesos 3,055,949 0 1,530,473 0
Total Other financial loans 3,668,479 0 1,549,243 0
Total 29,670,088 130,964,039 24,158,186 126,672,614
Bank loans
Financial leasing liabilities
12/31/2014 12/31/2013
Areas Currency
Other financial loans

35
6.2.1. The breakdown of currencies and maturities of interest-bearing loans is the following: At December 31, 2014 - Current
1 to 3 months 3 to 12
months
Th$ Th$
76.005.001-6 Bupa Chile S.A. Chile 97.023.000-9 Banco Corpbanca (*) Annual Non-restatable pesos 5.46% 5.53% 6/30/2018 (17,518) 4,946,571 4,929,053
0-E MediPerú S.A.C. Perú 0-E Banco de Crédito del Perú Monthly New Peruvian Sol 8.00% 7.99% 1/24/2017 18,155 62,721 80,876
0-E MediPerú S.A.C. Perú 0-E Banco de Crédito del Perú Monthly US Dollar 8.50% 8.63% 11/5/2018 6,156 18,430 24,586
95.432.000-6 Centro Médico Antofagasta S.A Chile 97.053.000-2 Banco Security At maturity UF 4.70% 4.76% 10/10/2032 17,973 42,706 60,679
95.432.000-6 Centro Médico Antofagasta S.A Chile 97.053.000-2 Banco Security At maturity UF 4.87% 4.93% 2/9/2020 24,897 62,332 87,229
76.012.645-4 Inmobiliaria Centro Médico Antofagasta S.A. Chile 97.053.000-2 Banco Security At maturity UF 4.67% 4.73% 9/10/2031 60,120 150,364 210,484
95.431.000-0 Servicios y Abastecimientos a Clínicas S.A. Chile 97.053.000-2 Banco Security At maturity UF 4.43% 4.48% 9/10/2031 22,930 57,321 80,251
95.431.000-0 Servicios y Abastecimientos a Clínicas S.A. Chile 97.053.000-2 Banco Security At maturity UF 4.37% 4.42% 9/10/2031 5,162 12,903 18,065
95.431.000-0 Servicios y Abastecimientos a Clínicas S.A. Chile 97.053.000-2 Banco Security At maturity UF 4.70% 4.76% 10/10/2032 8,833 20,893 29,726
95.431.000-0 Servicios y Abastecimientos a Clínicas S.A. Chile 97.053.000-2 Banco Security At maturity UF 4.43% 4.48% 9/10/2031 2,061 5,152 7,213
76.012.653-5 Inmobiliaria Somequi S.A. Chile 97.053.000-2 Banco Security At maturity UF 4.47% 4.52% 9/10/2031 5,096 12,781 17,877
96.359.000-8 Sociedad Médica Quirúrgica de Antofagasta S.A. Chile 97.053.000-2 Banco Security At maturity UF 5.46% 5.53% 4/30/2019 8,963 26,597 35,560
96.359.000-8 Sociedad Médica Quirúrgica de Antofagasta S.A. Chile 97.053.000-2 Banco Security At maturity UF 4.70% 4.76% 10/10/2032 1,579 3,751 5,330
95.432.000-6 Inmobiliaria Centro Médico Antofagasta S.A. Chile 97.080.000-K Banco Bice At maturity Non-restatable pesos 5.60% 5.68% 1/4/2015 1,266,873 0 1,266,873
96.562.220-9 Desarrollo e Inversiones Medicas S.A. Chile 97.053.000-2 Banco Security Monthly UF 4.98% 5.04% 4/10/2032 39,833 96,916 136,749
96.562.220-9 Desarrollo e Inversiones Medicas S.A. Chile 97.053.000-2 Banco Security Monthly UF 5.62% 5.70% 7/3/2033 15,937 36,436 52,373
96.562.220-9 Desarrollo e Inversiones Medicas S.A. Chile 97.053.000-2 Banco Security Monthly UF 5.79% 5.87% 10/4/2025 22,917 57,451 80,368
96.562.220-9 Desarrollo e Inversiones Medicas S.A. Chile 97.053.000-2 Banco Security Monthly UF 5.50% 5.58% 1/3/2026 34,134 86,078 120,212
96.562.220-9 Desarrollo e Inversiones Medicas S.A. Chile 97.053.000-2 Banco Security Monthly UF 4.29% 4.34% 4/5/2020 25,414 63,169 88,583
96.562.220-9 Desarrollo e Inversiones Medicas S.A. Chile 97.053.000-2 Banco Security Quarterly Non-restatable pesos 5.91% 6.00% 5/1/2015 8,976 1,100,000 1,108,976
96.562.220-9 Desarrollo e Inversiones Medicas S.A. Chile 97.080.000-K Banco Bice Quarterly Non-restatable pesos 6.08% 6.17% 8/1/2014 352,838 0 352,838
79.576.810-6 Clínica Reñaca S.A. Chile 97.053.000-2 Banco Security Quarterly Non-restatable pesos 6.68% 6.79% 2/1/2015 454,617 0 454,617
79.576.810-6 Clínica Reñaca S.A. Chile 97.032.000-8 Banco BBVA Semi-annual Non-restatable pesos 6.48% 6.58% 1/1/2015 456,966 0 456,966
79.576.810-6 Clínica Reñaca S.A. Chile 97.004.000-5 Banco Chile Semi-annual Non-restatable pesos 5.04% 5.10% 5/25/2015 1,225 250,000 251,225
76.098.454-K Integramédica S.A. Chile 97.023.000-9 Banco Corpbanca Anual Non-restatable pesos 4.78% 4.84% 6/30/2018 574 605,747 606,321
76.098.454-K Integramédica S.A. Chile 97.023.000-9 Banco Corpbanca Anual Non-restatable pesos 7.80% 7.95% 11/29/2018 90,675 3,000,000 3,090,675
76.098.454-K Integramédica S.A. Chile 76.645.030-k Banco Itaú Monthly Non-restatable pesos 7.80% 7.95% 9/25/2017 9,910 30,574 40,484
96.613.220-5 Corporación Médica de Arica S.A. Chile 97.053.000-2 Banco Security Monthly UF 5.25% 5.32% 5/28/2019 18,190 53,638 71,828
96.613.220-5 Corporación Médica de Arica S.A. Chile 97.080.000-K Banco Bice At maturity Non-restatable pesos 5.71% 5.79% 1/13/2015 101,191 0 101,191
96.613.220-5 Corporación Médica de Arica S.A. Chile 97.080.000-K Banco Bice At maturity Non-restatable pesos 5.71% 5.79% 1/13/2015 101,191 0 101,191
96.613.220-5 Corporación Médica de Arica S.A. Chile 97.080.000-K Banco Bice At maturity Non-restatable pesos 5.71% 5.79% 1/13/2015 101,191 0 101,191
96.613.220-5 Corporación Médica de Arica S.A. Chile 97.080.000-K Banco Bice At maturity Non-restatable pesos 5.71% 5.79% 1/13/2015 101,191 0 101,191
96.613.220-5 Corporación Médica de Arica S.A. Chile 97.053.000-2 Banco Security At maturity Non-restatable pesos 6.42% 6.52% 5/1/2015 2,652 300,000 302,652
96.613.220-5 Corporación Médica de Arica S.A. Chile 97.053.000-2 Banco Security At maturity Non-restatable pesos 6.42% 6.52% 5/1/2015 4,862 550,000 554,862
96.613.220-5 Corporación Médica de Arica S.A. Chile 97.053.000-2 Banco Security At maturity Non-restatable pesos 6.42% 6.52% 5/1/2015 1,414 160,000 161,414
96.613.220-5 Corporación Médica de Arica S.A. Chile 97.053.000-2 Banco Security At maturity Non-restatable pesos 5.66% 5.74% 1/23/2015 200,215 0 200,215
96.613.220-5 Corporación Médica de Arica S.A. Chile 97.032.000-8 Banco BBVA At maturity Non-restatable pesos 5.04% 5.10% 1/23/2015 300,294 0 300,294
96.613.220-5 Corporación Médica de Arica S.A. Chile 97.053.000-2 Banco Security At maturity Non-restatable pesos 5.52% 5.60% 1/25/2015 100,077 0 100,077
76.242.774-5 Inmobiliaria y Constructora CBS S.A. Chile 97.032.000-8 Banco Bilbao Vizcaya Argentaria Semi-annual UF 0.97% 0.97% 1/17/2034 1,070,472 0 1,070,472
76.242.774-5 Inmobiliaria y Constructora CBS S.A. Chile 97.032.000-8 Banco Bilbao Vizcaya Argentaria Semi-annual UF 2.57% 2.59% 1/17/2034 27,592 0 27,592
76.242.774-5 Inmobiliaria y Constructora CBS S.A. Chile 97.032.000-8 Banco Bilbao Vizcaya Argentaria Semi-annual UF 4.02% 4.06% 1/17/2034 5,560 0 5,560
76.242.774-5 Inmobiliaria y Constructora CBS S.A. Chile 97.032.000-8 Banco Bilbao Vizcaya Argentaria Semi-annual UF 4.87% 4.93% 1/17/2034 82,131 0 82,131
76.242.774-5 Inmobiliaria y Constructora CBS S.A. Chile 76.645.030-K Banco Itaú Semi-annual UF 0.97% 0.97% 1/17/2034 1,070,472 0 1,070,472
76.242.774-5 Inmobiliaria y Constructora CBS S.A. Chile 76.645.030-K Banco Itaú Semi-annual UF 2.57% 2.59% 1/17/2034 27,592 0 27,592
76.242.774-5 Inmobiliaria y Constructora CBS S.A. Chile 76.645.030-K Banco Itaú Semi-annual UF 4.02% 4.06% 1/17/2034 5,560 0 5,560
76.242.774-5 Inmobiliaria y Constructora CBS S.A. Chile 76.645.030-K Banco Itaú Semi-annual UF 4.87% 4.93% 1/17/2034 82,132 0 82,132
TOTALS 6,349,275 11,812,531 18,161,806
Maturity
Current
Balance at
12/31/2014
Creditor Name Amortization
Type Currency
Tax Id Number of
Debtor Entity Name of Debtor Entity Country
Tax Id Number of
Creditor
Company
Nominal
Interest rate
(%)
Effective
interest rate
(%)
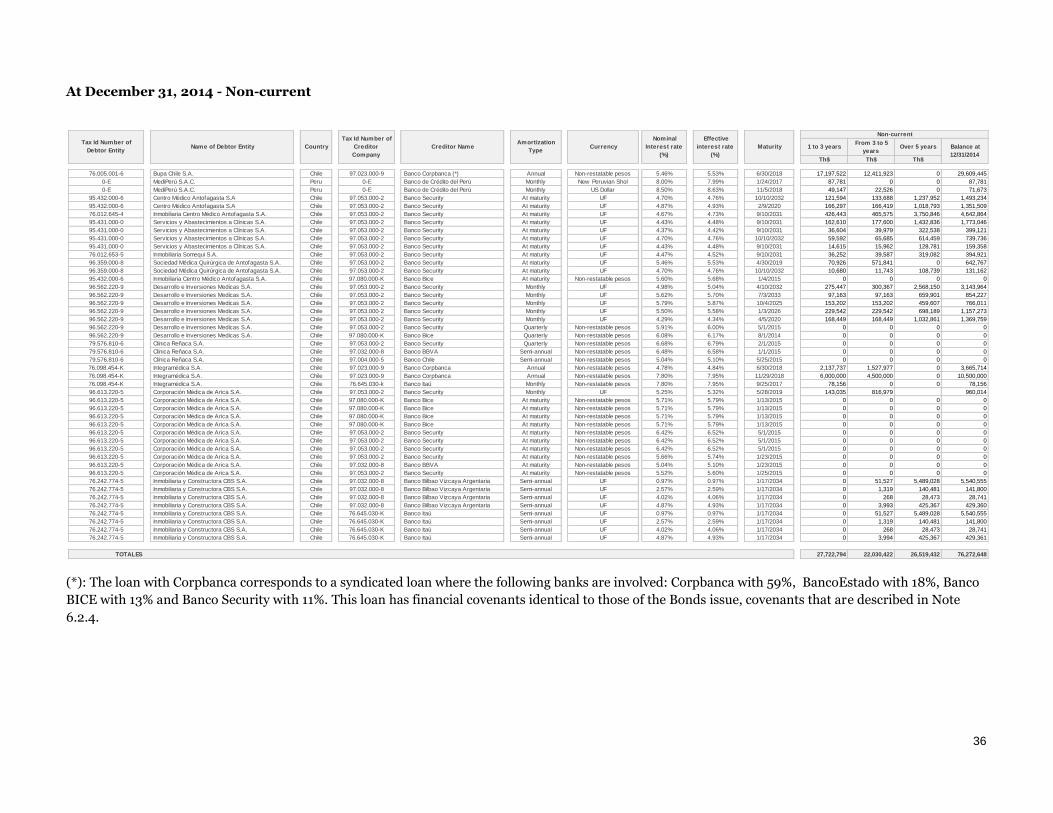
36
At December 31, 2014 - Non-current
(*): The loan with Corpbanca corresponds to a syndicated loan where the following banks are involved: Corpbanca with 59%, BancoEstado with 18%, Banco
BICE with 13% and Banco Security with 11%. This loan has financial covenants identical to those of the Bonds issue, covenants that are described in Note
6.2.4.
1 to 3 years From 3 to 5
years Over 5 years
Th$ Th$ Th$
76.005.001-6 Bupa Chile S.A. Chile 97.023.000-9 Banco Corpbanca (*) Annual Non-restatable pesos 5.46% 5.53% 6/30/2018 17,197,522 12,411,923 0 29,609,445
0-E MediPerú S.A.C. Peru 0-E Banco de Crédito del Perú Monthly New Peruvian Shol 8.00% 7.99% 1/24/2017 87,781 0 0 87,781
0-E MediPerú S.A.C. Peru 0-E Banco de Crédito del Perú Monthly US Dollar 8.50% 8.63% 11/5/2018 49,147 22,526 0 71,673
95.432.000-6 Centro Médico Antofagasta S.A Chile 97.053.000-2 Banco Security At maturity UF 4.70% 4.76% 10/10/2032 121,594 133,688 1,237,952 1,493,234
95.432.000-6 Centro Médico Antofagasta S.A Chile 97.053.000-2 Banco Security At maturity UF 4.87% 4.93% 2/9/2020 166,297 166,419 1,018,793 1,351,509
76.012.645-4 Inmobiliaria Centro Médico Antofagasta S.A. Chile 97.053.000-2 Banco Security At maturity UF 4.67% 4.73% 9/10/2031 426,443 465,575 3,750,846 4,642,864
95.431.000-0 Servicios y Abastecimientos a Clínicas S.A. Chile 97.053.000-2 Banco Security At maturity UF 4.43% 4.48% 9/10/2031 162,610 177,600 1,432,836 1,773,046
95.431.000-0 Servicios y Abastecimientos a Clínicas S.A. Chile 97.053.000-2 Banco Security At maturity UF 4.37% 4.42% 9/10/2031 36,604 39,979 322,538 399,121
95.431.000-0 Servicios y Abastecimientos a Clínicas S.A. Chile 97.053.000-2 Banco Security At maturity UF 4.70% 4.76% 10/10/2032 59,592 65,685 614,459 739,736
95.431.000-0 Servicios y Abastecimientos a Clínicas S.A. Chile 97.053.000-2 Banco Security At maturity UF 4.43% 4.48% 9/10/2031 14,615 15,962 128,781 159,358
76.012.653-5 Inmobiliaria Somequi S.A. Chile 97.053.000-2 Banco Security At maturity UF 4.47% 4.52% 9/10/2031 36,252 39,587 319,082 394,921
96.359.000-8 Sociedad Médica Quirúrgica de Antofagasta S.A. Chile 97.053.000-2 Banco Security At maturity UF 5.46% 5.53% 4/30/2019 70,926 571,841 0 642,767
96.359.000-8 Sociedad Médica Quirúrgica de Antofagasta S.A. Chile 97.053.000-2 Banco Security At maturity UF 4.70% 4.76% 10/10/2032 10,680 11,743 108,739 131,162
95.432.000-6 Inmobiliaria Centro Médico Antofagasta S.A. Chile 97.080.000-K Banco Bice At maturity Non-restatable pesos 5.60% 5.68% 1/4/2015 0 0 0 0
96.562.220-9 Desarrollo e Inversiones Medicas S.A. Chile 97.053.000-2 Banco Security Monthly UF 4.98% 5.04% 4/10/2032 275,447 300,367 2,568,150 3,143,964
96.562.220-9 Desarrollo e Inversiones Medicas S.A. Chile 97.053.000-2 Banco Security Monthly UF 5.62% 5.70% 7/3/2033 97,163 97,163 659,901 854,227
96.562.220-9 Desarrollo e Inversiones Medicas S.A. Chile 97.053.000-2 Banco Security Monthly UF 5.79% 5.87% 10/4/2025 153,202 153,202 459,607 766,011
96.562.220-9 Desarrollo e Inversiones Medicas S.A. Chile 97.053.000-2 Banco Security Monthly UF 5.50% 5.58% 1/3/2026 229,542 229,542 698,189 1,157,273
96.562.220-9 Desarrollo e Inversiones Medicas S.A. Chile 97.053.000-2 Banco Security Monthly UF 4.29% 4.34% 4/5/2020 168,449 168,449 1,032,861 1,369,759
96.562.220-9 Desarrollo e Inversiones Medicas S.A. Chile 97.053.000-2 Banco Security Quarterly Non-restatable pesos 5.91% 6.00% 5/1/2015 0 0 0 0
96.562.220-9 Desarrollo e Inversiones Medicas S.A. Chile 97.080.000-K Banco Bice Quarterly Non-restatable pesos 6.08% 6.17% 8/1/2014 0 0 0 0
79.576.810-6 Clínica Reñaca S.A. Chile 97.053.000-2 Banco Security Quarterly Non-restatable pesos 6.68% 6.79% 2/1/2015 0 0 0 0
79.576.810-6 Clínica Reñaca S.A. Chile 97.032.000-8 Banco BBVA Semi-annual Non-restatable pesos 6.48% 6.58% 1/1/2015 0 0 0 0
79.576.810-6 Clínica Reñaca S.A. Chile 97.004.000-5 Banco Chile Semi-annual Non-restatable pesos 5.04% 5.10% 5/25/2015 0 0 0 0
76.098.454-K Integramédica S.A. Chile 97.023.000-9 Banco Corpbanca Annual Non-restatable pesos 4.78% 4.84% 6/30/2018 2,137,737 1,527,977 0 3,665,714
76.098.454-K Integramédica S.A. Chile 97.023.000-9 Banco Corpbanca Annual Non-restatable pesos 7.80% 7.95% 11/29/2018 6,000,000 4,500,000 0 10,500,000
76.098.454-K Integramédica S.A. Chile 76.645.030-k Banco Itaú Monthly Non-restatable pesos 7.80% 7.95% 9/25/2017 78,156 0 0 78,156
96.613.220-5 Corporación Médica de Arica S.A. Chile 97.053.000-2 Banco Security Monthly UF 5.25% 5.32% 5/28/2019 143,035 816,979 960,014
96.613.220-5 Corporación Médica de Arica S.A. Chile 97.080.000-K Banco Bice At maturity Non-restatable pesos 5.71% 5.79% 1/13/2015 0 0 0 0
96.613.220-5 Corporación Médica de Arica S.A. Chile 97.080.000-K Banco Bice At maturity Non-restatable pesos 5.71% 5.79% 1/13/2015 0 0 0 0
96.613.220-5 Corporación Médica de Arica S.A. Chile 97.080.000-K Banco Bice At maturity Non-restatable pesos 5.71% 5.79% 1/13/2015 0 0 0 0
96.613.220-5 Corporación Médica de Arica S.A. Chile 97.080.000-K Banco Bice At maturity Non-restatable pesos 5.71% 5.79% 1/13/2015 0 0 0 0
96.613.220-5 Corporación Médica de Arica S.A. Chile 97.053.000-2 Banco Security At maturity Non-restatable pesos 6.42% 6.52% 5/1/2015 0 0 0 0
96.613.220-5 Corporación Médica de Arica S.A. Chile 97.053.000-2 Banco Security At maturity Non-restatable pesos 6.42% 6.52% 5/1/2015 0 0 0 0
96.613.220-5 Corporación Médica de Arica S.A. Chile 97.053.000-2 Banco Security At maturity Non-restatable pesos 6.42% 6.52% 5/1/2015 0 0 0 0
96.613.220-5 Corporación Médica de Arica S.A. Chile 97.053.000-2 Banco Security At maturity Non-restatable pesos 5.66% 5.74% 1/23/2015 0 0 0 0
96.613.220-5 Corporación Médica de Arica S.A. Chile 97.032.000-8 Banco BBVA At maturity Non-restatable pesos 5.04% 5.10% 1/23/2015 0 0 0 0
96.613.220-5 Corporación Médica de Arica S.A. Chile 97.053.000-2 Banco Security At maturity Non-restatable pesos 5.52% 5.60% 1/25/2015 0 0 0 0
76.242.774-5 Inmobiliaria y Constructora CBS S.A. Chile 97.032.000-8 Banco Bilbao Vizcaya Argentaria Semi-annual UF 0.97% 0.97% 1/17/2034 0 51,527 5,489,028 5,540,555
76.242.774-5 Inmobiliaria y Constructora CBS S.A. Chile 97.032.000-8 Banco Bilbao Vizcaya Argentaria Semi-annual UF 2.57% 2.59% 1/17/2034 0 1,319 140,481 141,800
76.242.774-5 Inmobiliaria y Constructora CBS S.A. Chile 97.032.000-8 Banco Bilbao Vizcaya Argentaria Semi-annual UF 4.02% 4.06% 1/17/2034 0 268 28,473 28,741
76.242.774-5 Inmobiliaria y Constructora CBS S.A. Chile 97.032.000-8 Banco Bilbao Vizcaya Argentaria Semi-annual UF 4.87% 4.93% 1/17/2034 0 3,993 425,367 429,360
76.242.774-5 Inmobiliaria y Constructora CBS S.A. Chile 76.645.030-K Banco Itaú Semi-annual UF 0.97% 0.97% 1/17/2034 0 51,527 5,489,028 5,540,555
76.242.774-5 Inmobiliaria y Constructora CBS S.A. Chile 76.645.030-K Banco Itaú Semi-annual UF 2.57% 2.59% 1/17/2034 0 1,319 140,481 141,800
76.242.774-5 Inmobiliaria y Constructora CBS S.A. Chile 76.645.030-K Banco Itaú Semi-annual UF 4.02% 4.06% 1/17/2034 0 268 28,473 28,741
76.242.774-5 Inmobiliaria y Constructora CBS S.A. Chile 76.645.030-K Banco Itaú Semi-annual UF 4.87% 4.93% 1/17/2034 0 3,994 425,367 429,361
TOTALES 27,722,794 22,030,422 26,519,432 76,272,648
Non-current
Balance at
12/31/2014
Currency
Nominal
Interest rate
(%)
Effective
interest rate
(%)
Maturity Amortization
Type
Tax Id Number of
Debtor Entity Creditor Name Name of Debtor Entity Country
Tax Id Number of
Creditor
Company

37
At December 31, 2013 - Current
1 to 3 months 3 to 12
months
Th$ Th$
76.005.001-6 Cruz Blanca Salud S.A. Chile 97.023.000-9 Banco Corpbanca (*) Annual Non-restatable pesos 6.59% 6.70% 6/30/2018 0 4,929,057 4,929,057
0-E Resonancia Magnética S.A. Perú 0-E Banco de Crédito del Perú Monthly New Peruvian Sol 8.00% 8.00% 1/24/2017 15,439 48,035 63,474
0-E Resonancia Magnética S.A. Perú 0-E Banco de Crédito del Perú Monthly US Dollar 8.50% 8.50% 11/5/2018 5,308 15,923 21,231
95.432.000-6 Centro Médico Antofagasta S.A Chile 97.053.000-2 Banco Security At maturity UF 4.70% 4.76% 10/10/2032 16,894 39,607 56,501
95.432.000-6 Centro Médico Antofagasta S.A Chile 97.053.000-2 Banco Security At maturity UF 4.86% 4.92% 2/9/2020 24,004 59,789 83,793
76.012.645-4 Inmobiliaria Centro Médico Antofagasta S.A. Chile 97.053.000-2 Banco Security At maturity UF 4.67% 4.73% 8/10/2031 58,065 144,430 202,495
95.431.000-0 Servicios y Abastecimientos a Clínicas S.A. Chile 97.053.000-2 Banco Security At maturity UF 4.43% 4.48% 9/10/2031 22,204 55,230 77,434
95.431.000-0 Servicios y Abastecimientos a Clínicas S.A. Chile 97.053.000-2 Banco Security At maturity UF 4.37% 4.42% 9/10/2031 4,998 12,433 17,431
95.431.000-0 Servicios y Abastecimientos a Clínicas S.A. Chile 97.053.000-2 Banco Security At maturity UF 4.70% 4.76% 10/10/2032 8,447 19,803 28,250
95.431.000-0 Servicios y Abastecimientos a Clínicas S.A. Chile 97.053.000-2 Banco Security At maturity UF 4.43% 4.48% 9/10/2031 1,996 4,964 6,960
76.012.653-5 Inmobiliaria Somequi S.A. Chile 97.053.000-2 Banco Security At maturity UF 4.47% 4.52% 8/10/2031 4,942 12,292 17,234
96.359.000-8 Sociedad Médica Quirúrgica de Antofagasta S.A. Chile 97.053.000-2 Banco Security At maturity UF 5.45% 5.53% 4/30/2019 8,489 25,174 33,663
96.359.000-8 Sociedad Médica Quirúrgica de Antofagasta S.A. Chile 97.053.000-2 Banco Security At maturity UF 4.70% 4.76% 10/10/2032 1,484 3,479 4,963
95.432.000-6 Centro Médico Antofagasta S.A Chile 97.004.000-5 Banco Chile At maturity Non-restatable pesos 6.71% 6.83% 1/1/2014 629,368 0 629,368
95.432.000-6 Centro Médico Antofagasta S.A Chile 97.004.000-5 Banco Bice At maturity Non-restatable pesos 7.31% 7.45% 2/4/2014 1,262,248 0 1,262,248
96.562.220-9 Desarrollo e Inversiones Médica S.A. Chile 97.053.000-2 Banco Security Monthly UF 4.98% 5.04% 1/3/2026 32,773 81,473 114,246
96.562.220-9 Desarrollo e Inversiones Médica S.A. Chile 97.053.000-2 Banco Security Monthly UF 5.62% 5.70% 12/2/2025 22,016 54,377 76,393
96.562.220-9 Desarrollo e Inversiones Médica S.A. Chile 97.053.000-2 Banco Security Monthly UF 5.79% 5.87% 4/5/2020 24,293 59,789 84,082
96.562.220-9 Desarrollo e Inversiones Médica S.A. Chile 97.053.000-2 Banco Security Monthly UF 5.50% 5.58% 7/3/2033 15,278 34,487 49,765
96.562.220-9 Desarrollo e Inversiones Médica S.A. Chile 97.053.000-2 Banco Security Monthly UF 4.29% 4.34% 4/10/2032 36,846 88,415 125,261
96.562.220-9 Desarrollo e Inversiones Medicas S.A. Chile 97.053.000-2 Banco Security Monthly Non-restatable pesos 7.63% 7.78% 5/13/2014 10,599 1,100,000 1,110,599
96.562.220-9 Desarrollo e Inversiones Medicas S.A. Chile 97.080.000-K Banco Bice Monthly Non-restatable pesos 6.04% 6.13% 2/14/2014 351,033 0 351,033
79.576.810-6 Clínica Reñaca S.A. Chile 97.053.000-2 Banco Security Monthly Non-restatable pesos 7.63% 7.78% 5/1/2014 5,166 450,000 455,166
79.576.810-6 Clínica Reñaca S.A. Chile 97.032.000-8 Banco BBVA Monthly Non-restatable pesos 6.95% 7.07% 1/6/2014 457,969 0 457,969
76.098.454-K Integramédica S.A. Chile 97.023.000-9 Banco Corpbanca Annual Non-restatable pesos 6.59% 6.70% 6/30/2018 0 618,000 618,000
76.098.454-K Integramédica S.A. Chile 97.023.000-9 Banco Corpbanca Annual Non-restatable pesos 7.80% 7.95% 11/29/2018 702,000 1,500,064 2,202,064
76.098.454-K Integramédica Centros Médicos S.A. Chile 76.645.030-k Banco Itaú Monthly Non-restatable pesos 7.19% 7.43% 9/25/2017 9,256 28,508 37,764
96.613.220-5 Corporación Médica de Arica S.A. Chile 97.053.000-2 Banco Security Monthly UF 5.25% 5.32% 5/28/2019 17,085 50,767 67,852
96.613.220-5 Corporación Médica de Arica S.A. Chile 97.080.000-K Banco Bice At maturity Non-restatable pesos 7.70% 7.85% 2/25/2014 100,393 0 100,393
96.613.220-5 Corporación Médica de Arica S.A. Chile 97.080.000-K Banco Bice At maturity Non-restatable pesos 7.70% 7.85% 2/25/2014 100,393 0 100,393
96.613.220-5 Corporación Médica de Arica S.A. Chile 97.080.000-K Banco Bice At maturity Non-restatable pesos 7.70% 7.98% 2/25/2014 100,393 0 100,393
96.613.220-5 Corporación Médica de Arica S.A. Chile 97.080.000-K Banco Bice At maturity Non-restatable pesos 7.70% 7.98% 2/25/2014 100,393 0 100,393
96.613.220-5 Corporación Médica de Arica S.A. Chile 97.080.000-K Banco Bice At maturity Non-restatable pesos 7.72% 7.87% 3/12/2014 301,120 0 301,120
96.613.220-5 Corporación Médica de Arica S.A. Chile 97.053.000-2 Banco Security At maturity Non-restatable pesos 7.70% 7.85% 3/12/2014 552,160 0 552,160
96.613.220-5 Corporación Médica de Arica S.A. Chile 97.053.000-2 Banco Security At maturity Non-restatable pesos 7.70% 7.85% 3/12/2014 160,628 0 160,628
TOTALES 5,163,680 9,436,096 14,599,776
Amortization
Type
Tax Id Number
of Debtor Entity Name of Debtor Entity Country
Tax Id Number of
Creditor
Company
Creditor Name
Effective
interest rate
(%)
Maturity
Current
Balance at
12/31/2013
Currency
Nominal
Interest rate
(%)

38
At December 31, 2013 - Non-current
(*): The loan with Corpbanca corresponds to a syndicated loan where the following banks are involved: Corpbanca with 59%, BancoEstado with 18%, Banco
BICE with 13% and Banco Security with 10%.
1 to 3 years From 3 to 5
years Over 5 years
Th$ Th$ Th$
76.005.001-6 Cruz Blanca Salud S.A. Chile 97.023.000-9 Banco Corpbanca (*) Annual Non-restatable pesos 6.59% 6.70% 6/30/2018 9,804,188 24,734,311 0 34,538,499
0-E Resonancia Magnética S.A. Perú 0-E Banco de Crédito del Perú Monthly New Peruvian Sol 8.00% 8.00% 1/24/2017 142,903 12,922 0 155,825
0-E Resonancia Magnética S.A. Perú 0-E Banco de Crédito del Perú Monthly US dollar 8.50% 8.50% 11/5/2018 42,465 40,699 0 83,164
95.432.000-6 Centro Médico Antofagasta S.A Chile 97.053.000-2 Banco Security At maturity UF 4.70% 4.76% 10/10/2032 112,538 123,361 1,247,943 1,483,842
95.432.000-6 Centro Médico Antofagasta S.A Chile 97.053.000-2 Banco Security At maturity UF 4.86% 4.92% 2/9/2020 159,437 159,437 1,044,035 1,362,909
76.012.645-4 Inmobiliaria Centro Médico Antofagasta S.A. Chile 97.053.000-2 Banco Security At maturity UF 4.67% 4.73% 8/10/2031 405,836 439,258 3,746,823 4,591,917
95.431.000-0 Servicios y Abastecimientos a Clínicas S.A. Chile 97.053.000-2 Banco Security At maturity UF 4.43% 4.48% 9/10/2031 155,192 167,973 1,432,790 1,755,955
95.431.000-0 Servicios y Abastecimientos a Clínicas S.A. Chile 97.053.000-2 Banco Security At maturity UF 4.37% 4.42% 9/10/2031 34,935 37,811 322,528 395,274
95.431.000-0 Servicios y Abastecimientos a Clínicas S.A. Chile 97.053.000-2 Banco Security At maturity UF 4.70% 4.76% 10/10/2032 56,269 61,680 623,971 741,920
95.431.000-0 Servicios y Abastecimientos a Clínicas S.A. Chile 97.053.000-2 Banco Security At maturity UF 4.43% 4.48% 9/10/2031 13,948 15,097 128,777 157,822
76.012.653-5 Inmobiliaria Somequi S.A. Chile 97.053.000-2 Banco Security At maturity UF 4.47% 4.52% 8/10/2031 34,538 37,383 318,869 390,790
96.359.000-8 Sociedad Médica Quirúrgica de Antofagasta S.A. Chile 97.053.000-2 Banco Security At maturity UF 5.45% 5.53% 4/30/2019 67,132 67,132 507,682 641,946
96.359.000-8 Sociedad Médica Quirúrgica de Antofagasta S.A. Chile 97.053.000-2 Banco Security At maturity UF 4.70% 4.76% 10/10/2032 9,885 10,836 109,619 130,340
96.562.220-9 Desarrollo e Inversiones Médica S.A. Chile 97.053.000-2 Banco Security Monthly UF 4.98% 5.04% 1/3/2026 217,261 217,261 769,467 1,203,989
96.562.220-9 Desarrollo e Inversiones Médica S.A. Chile 97.053.000-2 Banco Security Monthly UF 5.62% 5.70% 12/2/2025 145,006 145,006 507,521 797,533
96.562.220-9 Desarrollo e Inversiones Médica S.A. Chile 97.053.000-2 Banco Security Monthly UF 5.79% 5.87% 4/5/2020 159,437 159,437 1,057,322 1,376,196
96.562.220-9 Desarrollo e Inversiones Médica S.A. Chile 97.053.000-2 Banco Security Monthly UF 5.50% 5.58% 7/3/2033 91,965 91,965 670,579 854,509
96.562.220-9 Desarrollo e Inversiones Médica S.A. Chile 97.053.000-2 Banco Security Monthly UF 4.29% 4.34% 4/10/2032 248,917 272,873 2,575,668 3,097,458
76.098.454-K Integramédica S.A. Chile 97.023.000-9 Banco Corpbanca Annual Non-restatable pesos 6.59% 6.70% 6/30/2018 1,236,000 3,088,000 0 4,324,000
76.098.454-K Integramédica S.A. Chile 97.023.000-9 Banco Corpbanca Annual Non-restatable pesos 7.80% 7.95% 11/29/2018 6,000,000 7,500,000 0 13,500,000
76.098.454-K Integramédica Centros Médicos S.A. Chile 76.645.030-k Banco Itaú Monthly Non-restatable pesos 7.19% 7.43% 9/25/2017 83,971 34,669 0 118,640
96.613.220-5 Corporación Médica de Arica S.A. Chile 97.053.000-2 Banco Security Monthly UF 5.25% 5.32% 5/28/2019 135,382 135,382 705,580 976,344
TOTALES 19,357,205 37,552,493 15,769,174 72,678,872
Amortization
Type
Tax Id Number
of Debtor Entity Name of Debtor Entity Country
Tax Id Number of
Creditor
Company
Creditor Name
Effective
interest rate
(%)
Maturity
Non-current
Balance at
12/31/2013
Currency
Nominal
Interest rate
(%)

39
6.2.2.- The breakdown of financial leasing liabilities is the following: At December 31, 2014 - current
1 to 3 months 3 to 12 months
Th$ Th$
0-E Cruz Blanca Salud Internacional S.A. Perú Banco de Crédito del Perú Monthly US dollar 5.53% 5.67% 27,639 80,825 108,464
0-E Cruz Blanca Salud Internacional S.A. Perú Banco Continental Monthly US dollar 6.50% 6.70% 1,913 699 2,612
0-E Cruz Blanca Salud Internacional S.A. Perú Banco de Crédito del Perú Monthly New Peruvian Sol 5.53% 5.67% 5,161 11,531 16,692
95.431.000-0 Servicios y Abastecimientos a Clínicas S.A Chile Banco Santander At maturity UF 3.87% 3.94% 1,443 4,327 5,770
95.431.000-0 Servicios y Abastecimientos a Clínicas S.A Chile Banco Santander At maturity UF 4.31% 4.40% 3,250 9,901 13,151
95.431.000-0 Servicios y Abastecimientos a Clínicas S.A Chile Banco Santander At maturity UF 3.87% 3.94% 7,951 24,082 32,033
95.431.000-0 Servicios y Abastecimientos a Clínicas S.A Chile Banco Security At maturity UF 3.90% 3.97% 10,567 0 10,567
95.431.000-0 Servicios y Abastecimientos a Clínicas S.A Chile Banco Bice At maturity UF 2.63% 2.67% 24,377 8,163 32,540
95.431.000-0 Servicios y Abastecimientos a Clínicas S.A Chile Banco Bice At maturity UF 5.22% 5.35% 22,213 52,569 74,782
78.804.370-8 Soc. Instituto de Cardiología el Norte Ltda. Chile Banco Security At maturity UF 4.77% 4.87% 14,882 45,259 60,141
78.804.370-8 Soc. Instituto de Cardiología el Norte Ltda. Chile Banco Security At maturity New Peruvian Sol 7.38% 7.63% 24,402 74,768 99,170
95.432.000-6 Centro Médico Antofagasta S.A. Chile Banco Bice At maturity UF 4.44% 4.53% 22,109 66,549 88,658
95.432.000-6 Centro Médico Antofagasta S.A. Chile Banco Santander At maturity Non-restatable pesos 6.80% 7.02% 10,615 31,577 42,192
95.432.000-6 Centro Médico Antofagasta S.A. Chile Banco Santander At maturity Non-restatable pesos 6.80% 7.02% 476 1,373 1,849
95.432.000-6 Centro Médico Antofagasta S.A. Chile Banco BBVA Monthly Non-restatable pesos 5.00% 5.12% 19,099 57,705 76,804
79.576.810-6 Clínica Reñaca S.A. Chile Banco Security Monthly UF 5.84% 6.00% 5,079 15,055 20,134
79.576.810-6 Clínica Reñaca S.A. Chile Banco Security Monthly UF 4.74% 4.84% 16,198 45,653 61,851
79.576.810-6 Clínica Reñaca S.A. Chile Sinde Monthly UF 19.80% 21.70% 3,248 10,001 13,249
76.098.454-K Integramédica S.A. Chile Andueza & Principal Monthly UF 8.58% 8.92% 4,576 13,410 17,986
76.098.454-K Integramédica S.A. Chile ING Seguros de Vida Monthly UF 8.19% 8.50% 12,412 38,452 50,864
76.098.454-K Integramédica S.A. Chile Banco Bice Monthly Non-restatable pesos 7.23% 7.47% 1,523 4,696 6,219
76.098.454-K Integramédica S.A. Chile Banco Bice Monthly Non-restatable pesos 7.08% 7.31% 5,689 17,527 23,216
76.098.454-K Integramédica S.A. Chile Banco Corpbanca Monthly Non-restatable pesos 7.85% 8.14% 37,373 115,629 153,002
76.098.454-K Integramédica S.A. Chile Banco BBVA Monthly Non-restatable pesos 7.44% 7.70% 17,203 53,187 70,390
76.098.454-K Integramédica S.A. Chile Banco BBVA Monthly Non-restatable pesos 6.90% 7.12% 50,455 155,466 205,921
76.098.454-K Integramédica S.A. Chile Banco BBVA Monthly Non-restatable pesos 6.77% 6.98% 42,401 130,478 172,879
76.098.454-K Integramédica S.A. Chile Banco BBVA Monthly Non-restatable pesos 6.71% 6.92% 34,383 106,034 140,417
76.098.454-K Integramédica S.A. Chile Banco BBVA Monthly Non-restatable pesos 7.18% 7.42% 34,680 106,649 141,329
76.098.454-K Integramédica S.A. Chile Banco BBVA Monthly Non-restatable pesos 6.33% 6.52% 22,021 67,420 89,441
76.098.454-K Integramédica S.A. Chile Banco BBVA Monthly Non-restatable pesos 6.36% 6.55% 26,082 79,830 105,912
76.098.454-K Integramédica S.A. Chile Banco BBVA Monthly Non-restatable pesos 6.22% 6.40% 52,949 161,931 214,880
76.098.454-K Integramédica S.A. Chile Banco BBVA Monthly Non-restatable pesos 6.36% 6.55% 11,549 35,277 46,826
76.098.454-K Integramédica S.A. Chile Banco BBVA Monthly Non-restatable pesos 6.13% 6.31% 19,250 58,741 77,991
76.098.454-K Integramédica S.A. Chile Banco BBVA Monthly Non-restatable pesos 4.44% 4.53% 32,955 99,921 132,876
76.098.454-K Integramédica S.A. Chile Banco Bice Monthly Non-restatable pesos 7.09% 7.32% 15,211 46,943 62,154
76.098.454-K Integramédica S.A. Chile Banco Bice Monthly Non-restatable pesos 6.90% 7.12% 36,148 0 36,148
76.098.454-K Integramédica S.A. Chile Banco Bice Monthly Non-restatable pesos 6.66% 6.87% 11,115 30,435 41,550
76.098.454-K Integramédica S.A. Chile Banco Bice Monthly Non-restatable pesos 7.57% 7.83% 26,408 81,237 107,645
76.098.454-K Integramédica S.A. Chile Banco Bice Monthly Non-restatable pesos 6.70% 6.91% 27,855 66,589 94,444
76.098.454-K Integramédica S.A. Chile Banco Bice Monthly Non-restatable pesos 7.44% 7.70% 37,794 64,359 102,153
76.098.454-K Integramédica S.A. Chile Banco Bice Monthly Non-restatable pesos 7.38% 7.63% 12,256 37,816 50,072
76.098.454-K Integramédica S.A. Chile Banco Bice Monthly Non-restatable pesos 7.34% 7.59% 38,358 118,129 156,487
76.098.454-K Integramédica S.A. Chile Banco Bice Monthly Non-restatable pesos 7.04% 7.27% 23,113 71,315 94,428
76.098.454-K Integramédica S.A. Chile Banco Bice Monthly Non-restatable pesos 7.29% 7.53% 21,425 51,219 72,644
76.098.454-K Integramédica S.A. Chile Banco Bice Monthly Non-restatable pesos 7.27% 7.51% 42,188 129,979 172,167
76.098.454-K Integramédica S.A. Chile Banco Bice Monthly Non-restatable pesos 11.15% 11.73% 3,654 11,217 14,871
76.098.454-K Integramédica S.A. Chile Banco Bice Monthly Non-restatable pesos 6.86% 7.08% 15,568 47,763 63,331
76.098.454-K Integramédica S.A. Chile Banco Bice Monthly Non-restatable pesos 6.68% 6.89% 22,579 69,274 91,853
76.098.454-K Integramédica S.A. Chile Banco Bice Monthly Non-restatable pesos 4.44% 4.53% 4,396 13,329 17,725
Current
Balance at
12/31/2014
Nominal
Interest rate
(%)
Tax Id
Number of
Debtor Entity
Name of Debtor Entity Amortization
Type Creditor Name Country Currency
Effective
interest rate
(%)

40
At December 31, 2014 - current (continued)
1 to 3
months
3 to 12
months
Th$ Th$
76.098.454-K Integramédica S.A. Chile Banco Itaú Mensual Pesos no reajustables 6.76% 6.97% 68,395 210,204 278,599
76.098.454-K Integramédica S.A. Chile Banco Itaú Mensual Pesos no reajustables 7.28% 7.53% 26,843 54,972 81,815
76.098.454-K Integramédica S.A. Chile Banco Itaú Mensual Pesos no reajustables 7.10% 7.34% 11,696 23,939 35,635
76.098.454-K Integramédica S.A. Chile Banco Itaú Mensual Pesos no reajustables 6.76% 6.97% 30,709 94,379 125,088
76.098.454-K Integramédica S.A. Chile Banco Itaú Mensual Pesos no reajustables 6.79% 7.00% 17,168 52,680 69,848
76.098.454-K Integramédica S.A. Chile Banco Itaú Mensual Pesos no reajustables 6.86% 7.08% 52,655 161,750 214,405
76.098.454-K Integramédica S.A. Chile Banco Itaú Mensual Pesos no reajustables 6.58% 6.78% 37,529 115,316 152,845
76.098.454-K Integramédica S.A. Chile Banco Itaú Mensual Pesos no reajustables 7.16% 7.40% 47,633 64,672 112,305
76.098.454-K Integramédica S.A. Chile Banco Itaú Mensual Pesos no reajustables 7.16% 7.40% 49,957 33,738 83,695
76.098.454-K Integramédica S.A. Chile Banco Itaú Mensual Pesos no reajustables 6.61% 6.82% 48,954 149,887 198,841
76.098.454-K Integramédica S.A. Chile Banco Itaú Mensual Pesos no reajustables 6.67% 6.88% 9,572 29,301 38,873
76.098.454-K Integramédica S.A. Chile Banco Itaú Mensual Pesos no reajustables 6.45% 6.64% 21,671 66,291 87,962
76.098.454-K Integramédica S.A. Chile Banco Itaú Mensual Pesos no reajustables 6.76% 6.97% 10,997 33,640 44,637
76.098.454-K Integramédica S.A. Chile Banco Itaú Mensual Pesos no reajustables 6.24% 6.43% 1,960 5,991 7,951
76.098.454-K Integramédica S.A. Chile Banco Chile Mensual Pesos no reajustables 6.74% 6.95% 34,053 104,211 138,264
76.098.454-K Integramédica S.A. Chile Banco Chile Mensual Pesos no reajustables 6.13% 6.31% 16,324 49,853 66,177
76.098.454-K Integramédica S.A. Chile Banco Bice Mensual Pesos no reajustables 6.80% 7.01% 4,007 12,376 16,383
76.098.454-K Integramédica S.A. Chile Banco Bice Mensual Pesos no reajustables 7.08% 7.31% 6,144 18,945 25,089
76.098.454-K Integramédica S.A. Chile Banco Bice Mensual Pesos no reajustables 6.70% 6.91% 9,947 23,780 33,727
79.716.500-K Sonorad I S.A. Chile Banco Security Mensual UF 5.57% 5.71% 18,940 57,737 76,677
79.716.500-K Sonorad I S.A. Chile Banco Internacional Mensual UF 6.55% 6.75% 5,627 9,542 15,169
79.716.500-K Sonorad I S.A. Chile Banco Internacional Mensual UF 6.55% 6.75% 5,495 16,900 22,395
79.716.500-K Sonorad I S.A. Chile Banco Internacional Mensual UF 6.55% 6.75% 5,683 5,756 11,439
96.879.440-K Sonorad II S.A. Chile Banco Itaú Mensual UF 4.95% 5.06% 1,958 0 1,958
96.879.440-K Sonorad II S.A. Chile Banco Itaú Mensual UF 5.94% 6.11% 23,087 0 23,087
96.986.050-3 Exámenes de Laboratorio S.A. Chile Banco Itaú Mensual Pesos no reajustables 7.07% 7.31% 2,326 7,143 9,469
96.986.050-3 Exámenes de Laboratorio S.A. Chile Banco Itaú Mensual Pesos no reajustables 6.67% 6.88% 4,420 13,545 17,965
96.845.430-7 Bupa Chile Servicios Corporativos SpA Chile Cruz del Sur Seguros de Vida Mensual UF 2.60% 2.60% 18,008 55,657 73,665
96.845.430-7 Bupa Chile Servicios Corporativos SpA Chile ING Seguros de Vida Mensual UF 2.60% 2.60% 103,848 319,560 423,408
1,659,797 4,416,054 6,075,851 TOTAL
Balance at
12/31/2014
Nominal
Interest rate
(%)
Effective
interest rate
(%)
Current Tax Id
Number of
Debtor Entity
Name of Debtor Entity Country Creditor Name Amortization
Type Currency

41
At December 31, 2014 - Non - current
1 to 3
years
From 3 to 5
years
Over 5
years
Th$ Th$ Th$
0-E Cruz Blanca Salud Internacional S.A. Perú Banco de Crédito del Perú Monthly US dollars 5.53% 5.67% 222,932 0 0 222,932
0-E Cruz Blanca Salud Internacional S.A. Perú Banco de Crédito del Perú Monthly New Peruvian Sol 5.53% 5.67% 33,989 18,936 0 52,925
95.431.000-0 Servicios y Abastecimientos a Clínicas S.A Chile Banco Santander At maturity UF 3.87% 3.94% 3,957 0 0 3,957
95.431.000-0 Servicios y Abastecimientos a Clínicas S.A Chile Banco Santander At maturity UF 3.87% 3.94% 24,786 0 0 24,786
78.804.370-8 Soc. Instituto de Cardiología el Norte Ltda. Chile Banco Security At maturity UF 4.77% 4.87% 62,794 0 0 62,794
78.804.370-8 Soc. Instituto de Cardiología el Norte Ltda. Chile Banco Security At maturity Non-restatable pesos 7.38% 7.63% 115,549 0 0 115,549
95.432.000-6 Centro Médico Antofagasta S.A. Chile Banco Bice At maturity UF 4.44% 4.53% 76,583 0 0 76,583
95.432.000-6 Centro Médico Antofagasta S.A. Chile Banco Santander At maturity Non-restatable pesos 6.80% 7.02% 92,499 16,674 0 109,173
95.432.000-6 Centro Médico Antofagasta S.A. Chile Banco Santander At maturity Non-restatable pesos 6.80% 7.02% 4,023 1,094 0 5,117
95.432.000-6 Centro Médico Antofagasta S.A. Chile Banco BBVA Monthly Non-restatable pesos 5.00% 5.12% 150,276 0 0 150,276
79.576.810-6 Clínica Reñaca S.A. Chile Banco Security Monthly UF 5.84% 6.00% 30,297 0 0 30,297
79.576.810-6 Clínica Reñaca S.A. Chile Banco Security Monthly UF 4.74% 4.84% 129,966 142,864 70,135 342,965
79.576.810-6 Clínica Reñaca S.A. Chile Sinde Monthly UF 19.80% 21.70% 35,129 23,468 0 58,597
76.098.454-K Integramédica S.A. Chile Andueza & Principal Monthly UF 8.58% 8.92% 31,297 0 0 31,297
76.098.454-K Integramédica S.A. Chile ING Seguros de Vida Monthly UF 8.19% 8.50% 31,577 0 0 31,577
76.098.454-K Integramédica S.A. Chile Banco Bice Monthly Non-restatable pesos 7.23% 7.47% 5,523 0 0 5,523
76.098.454-K Integramédica S.A. Chile Banco Bice Monthly Non-restatable pesos 7.08% 7.31% 20,594 0 0 20,594
76.098.454-K Integramédica S.A. Chile Banco Corpbanca Monthly Non-restatable pesos 7.85% 8.14% 94,744 0 0 94,744
76.098.454-K Integramédica S.A. Chile Banco BBVA Monthly Non-restatable pesos 7.44% 7.70% 30,853 0 0 30,853
76.098.454-K Integramédica S.A. Chile Banco BBVA Monthly Non-restatable pesos 6.90% 7.12% 145,088 0 0 145,088
76.098.454-K Integramédica S.A. Chile Banco BBVA Monthly Non-restatable pesos 6.77% 6.98% 152,934 0 0 152,934
76.098.454-K Integramédica S.A. Chile Banco BBVA Monthly Non-restatable pesos 6.71% 6.92% 48,862 0 0 48,862
76.098.454-K Integramédica S.A. Chile Banco BBVA Monthly Non-restatable pesos 7.18% 7.42% 190,985 0 0 190,985
76.098.454-K Integramédica S.A. Chile Banco BBVA Monthly Non-restatable pesos 6.33% 6.52% 153,266 0 0 153,266
76.098.454-K Integramédica S.A. Chile Banco BBVA Monthly Non-restatable pesos 6.36% 6.55% 191,607 0 0 191,607
76.098.454-K Integramédica S.A. Chile Banco BBVA Monthly Non-restatable pesos 6.22% 6.40% 408,469 0 0 408,469
76.098.454-K Integramédica S.A. Chile Banco BBVA Monthly Non-restatable pesos 6.36% 6.55% 102,706 4,569 0 107,275
76.098.454-K Integramédica S.A. Chile Banco BBVA Monthly Non-restatable pesos 6.13% 6.31% 170,485 15,171 0 185,656
76.098.454-K Integramédica S.A. Chile Banco BBVA Monthly Non-restatable pesos 4.44% 4.53% 283,273 112,868 0 396,141
76.098.454-K Integramédica S.A. Chile Banco Bice Monthly Non-restatable pesos 7.09% 7.32% 32,706 0 0 32,706
76.098.454-K Integramédica S.A. Chile Banco Bice Monthly Non-restatable pesos 7.57% 7.83% 166,571 0 0 166,571
76.098.454-K Integramédica S.A. Chile Banco Bice Monthly Non-restatable pesos 7.38% 7.63% 39,961 0 0 39,961
76.098.454-K Integramédica S.A. Chile Banco Bice Monthly Non-restatable pesos 7.34% 7.59% 182,494 0 0 182,494
76.098.454-K Integramédica S.A. Chile Banco Bice Monthly Non-restatable pesos 7.04% 7.27% 49,673 0 0 49,673
76.098.454-K Integramédica S.A. Chile Banco Bice Monthly Non-restatable pesos 7.27% 7.51% 168,680 0 0 168,680
Non-current
Balance at
12/31/2014
Currency
Nominal
Interest rate
(%)
Tax Id
Number of
Debtor Entity
Name of Debtor Entity Country Creditor Name Amortization
Type
Effective
interest rate
(%)
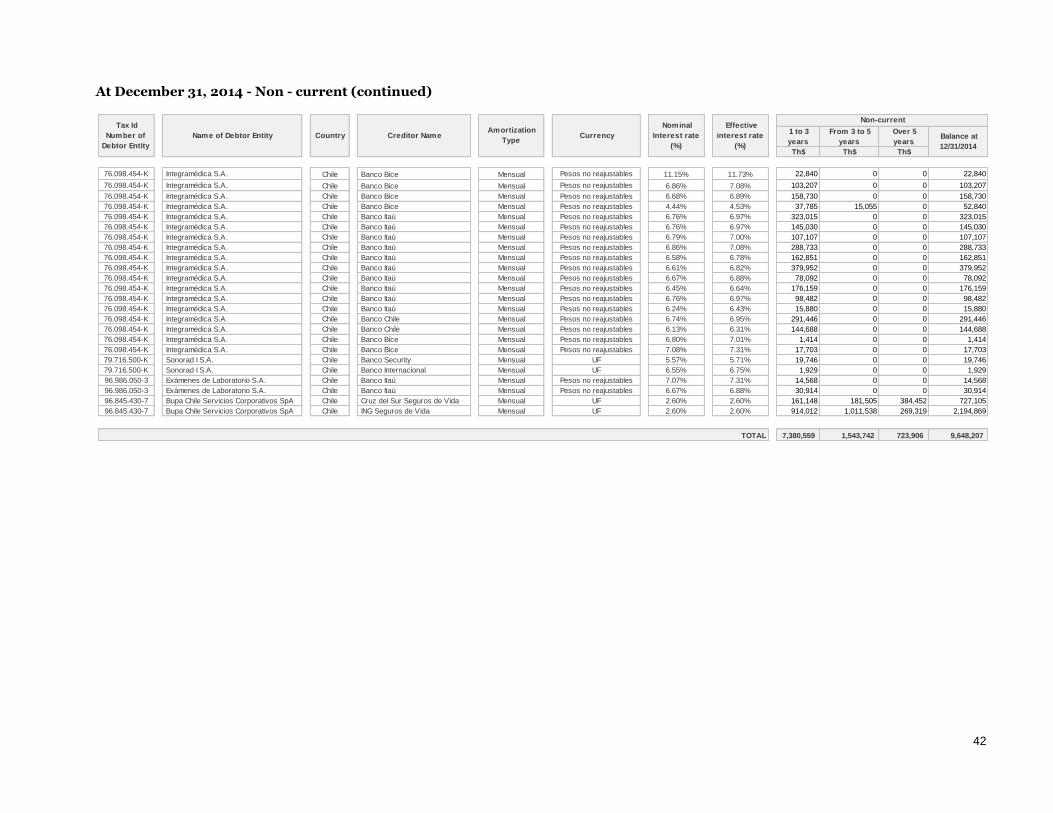
42
At December 31, 2014 - Non - current (continued)
1 to 3
years
From 3 to 5
years
Over 5
years
Th$ Th$ Th$
76.098.454-K Integramédica S.A. Chile Banco Bice Mensual Pesos no reajustables 11.15% 11.73% 22,840 0 0 22,840
76.098.454-K Integramédica S.A. Chile Banco Bice Mensual Pesos no reajustables 6.86% 7.08% 103,207 0 0 103,207
76.098.454-K Integramédica S.A. Chile Banco Bice Mensual Pesos no reajustables 6.68% 6.89% 158,730 0 0 158,730
76.098.454-K Integramédica S.A. Chile Banco Bice Mensual Pesos no reajustables 4.44% 4.53% 37,785 15,055 0 52,840
76.098.454-K Integramédica S.A. Chile Banco Itaú Mensual Pesos no reajustables 6.76% 6.97% 323,015 0 0 323,015
76.098.454-K Integramédica S.A. Chile Banco Itaú Mensual Pesos no reajustables 6.76% 6.97% 145,030 0 0 145,030
76.098.454-K Integramédica S.A. Chile Banco Itaú Mensual Pesos no reajustables 6.79% 7.00% 107,107 0 0 107,107
76.098.454-K Integramédica S.A. Chile Banco Itaú Mensual Pesos no reajustables 6.86% 7.08% 288,733 0 0 288,733
76.098.454-K Integramédica S.A. Chile Banco Itaú Mensual Pesos no reajustables 6.58% 6.78% 162,851 0 0 162,851
76.098.454-K Integramédica S.A. Chile Banco Itaú Mensual Pesos no reajustables 6.61% 6.82% 379,952 0 0 379,952
76.098.454-K Integramédica S.A. Chile Banco Itaú Mensual Pesos no reajustables 6.67% 6.88% 78,092 0 0 78,092
76.098.454-K Integramédica S.A. Chile Banco Itaú Mensual Pesos no reajustables 6.45% 6.64% 176,159 0 0 176,159
76.098.454-K Integramédica S.A. Chile Banco Itaú Mensual Pesos no reajustables 6.76% 6.97% 98,482 0 0 98,482
76.098.454-K Integramédica S.A. Chile Banco Itaú Mensual Pesos no reajustables 6.24% 6.43% 15,880 0 0 15,880
76.098.454-K Integramédica S.A. Chile Banco Chile Mensual Pesos no reajustables 6.74% 6.95% 291,446 0 0 291,446
76.098.454-K Integramédica S.A. Chile Banco Chile Mensual Pesos no reajustables 6.13% 6.31% 144,688 0 0 144,688
76.098.454-K Integramédica S.A. Chile Banco Bice Mensual Pesos no reajustables 6.80% 7.01% 1,414 0 0 1,414
76.098.454-K Integramédica S.A. Chile Banco Bice Mensual Pesos no reajustables 7.08% 7.31% 17,703 0 0 17,703
79.716.500-K Sonorad I S.A. Chile Banco Security Mensual UF 5.57% 5.71% 19,746 0 0 19,746
79.716.500-K Sonorad I S.A. Chile Banco Internacional Mensual UF 6.55% 6.75% 1,929 0 0 1,929
96.986.050-3 Exámenes de Laboratorio S.A. Chile Banco Itaú Mensual Pesos no reajustables 7.07% 7.31% 14,568 0 0 14,568
96.986.050-3 Exámenes de Laboratorio S.A. Chile Banco Itaú Mensual Pesos no reajustables 6.67% 6.88% 30,914 0 0 30,914
96.845.430-7 Bupa Chile Servicios Corporativos SpA Chile Cruz del Sur Seguros de Vida Mensual UF 2.60% 2.60% 161,148 181,505 384,452 727,105
96.845.430-7 Bupa Chile Servicios Corporativos SpA Chile ING Seguros de Vida Mensual UF 2.60% 2.60% 914,012 1,011,538 269,319 2,194,869
7,380,559 1,543,742 723,906 9,648,207
Nominal
Interest rate
(%)
Effective
interest rate
(%)
Non-current
Balance at
12/31/2014
TOTAL
Tax Id
Number of
Debtor Entity
Name of Debtor Entity Country Creditor Name Amortization
Type Currency

43
At December 31, 2013 - Current
1 to 3 months 3 to 12 months
Th$ Th$
0-E Resomasa S.A. Perú Banco de Crédito del Perú Mensual Dólares 9.50% 9.00% 29,346 13,182 42,528
0-E Resomasa S.A. Perú Banco de Crédito del Perú Mensual Dólares 5.00% 5.30% 21,750 66,498 88,248
0-E Anglolab S.A. Perú Banco Continental Mensual Dólares 6.00% 6.00% 1,729 1,473 3,202
0-E Anglolab S.A. Perú Banco Continental Mensual Dólares 6.50% 6.50% 1,586 4,738 6,324
0-E Resomasa S.A. Perú Banco de Crédito del Perú Mensual Soles 7.40% 7.40% 3,189 7,225 10,414
78.804.370-8 Soc. Instituto de Cardiología el Norte Ltda. Chile Banco Security Al vencimiento UF 4.77% 4.87% 13,570 40,939 54,509
95.431.000-0 Servicios y Abastecimientos a Clínicas S.A Chile Banco Santander Al vencimiento UF 3.87% 3.94% 1,329 3,941 5,270
95.431.000-0 Servicios y Abastecimientos a Clínicas S.A Chile Banco Santander Al vencimiento UF 4.31% 4.40% 2,967 8,973 11,940
95.431.000-0 Servicios y Abastecimientos a Clínicas S.A Chile Banco Santander Al vencimiento UF 3.87% 3.94% 7,282 21,930 29,212
95.431.000-0 Servicios y Abastecimientos a Clínicas S.A Chile Banco Security Al vencimiento UF 3.90% 3.97% 14,425 43,930 58,355
95.431.000-0 Servicios y Abastecimientos a Clínicas S.A Chile Banco Bice Al vencimiento UF 2.63% 2.67% 22,240 67,417 89,657
95.431.000-0 Servicios y Abastecimientos a Clínicas S.A Chile Banco Bice Al vencimiento UF 5.22% 5.35% 20,211 60,992 81,203
95.431.000-0 Servicios y Abastecimientos a Clínicas S.A Chile Banco BBVA Al vencimiento UF 3.90% 3.97% 1,120 0 1,120
95.432.000-6 Centro Médico Antofagasta S.A. Chile Banco Bice Al vencimiento UF 4.44% 4.53% 20,180 60,259 80,439
79.576.810-6 Clínica Reñaca S.A. Chile Banco Security Mensual UF 5.84% 6.00% 4,619 13,443 18,062
79.576.810-6 Clínica Reñaca S.A. Chile Banco Security Mensual UF 4.74% 4.84% 14,863 41,214 56,077
76.421.250-9 Sociedad Médica Imagenologica CR Ltda. Chile Banco BBVA Mensual UF 4.94% 5.05% 30,203 0 30,203
76.098.454-K Integramédica S.A. Chile Andueza & Principal Mensual UF 8.58% 8.92% 4,091 11,653 15,744
76.098.454-K Integramédica S.A. Chile ING Seguros de Vida Mensual UF 8.19% 8.50% 10,867 33,544 44,411
76.398.000-6 Integramédica de Centros Médicos S.A. Chile Banco Chile Mensual UF 14.05% 15.00% 2,833 0 2,833
76.398.000-6 Integramédica de Centros Médicos S.A. Chile Banco Bice Mensual Pesos no reajustables 7.23% 7.47% 1,422 4,369 5,791
76.398.000-6 Integramédica de Centros Médicos S.A. Chile Banco Bice Mensual Pesos no reajustables 7.08% 7.31% 5,317 16,332 21,649
76.398.000-6 Integramédica de Centros Médicos S.A. Chile Banco Chile Mensual UF 9.34% 9.75% 3,205 3,236 6,441
76.398.000-6 Integramédica de Centros Médicos S.A. Chile Banco Corpbanca Mensual Pesos no reajustables 7.85% 8.14% 34,680 106,927 141,607
76.398.000-6 Integramédica de Centros Médicos S.A. Chile Banco BBVA Mensual Pesos no reajustables 7.44% 7.70% 16,027 49,385 65,412
76.398.000-6 Integramédica de Centros Médicos S.A. Chile Banco BBVA Mensual Pesos no reajustables 6.90% 7.12% 47,240 145,132 192,372
76.398.000-6 Integramédica de Centros Médicos S.A. Chile Banco BBVA Mensual Pesos no reajustables 6.77% 6.98% 39,745 121,965 161,710
76.398.000-6 Integramédica de Centros Médicos S.A. Chile Banco BBVA Mensual Pesos no reajustables 6.71% 6.92% 32,255 99,172 131,427
76.398.000-6 Integramédica de Centros Médicos S.A. Chile Banco BBVA Mensual Pesos no reajustables 7.18% 7.42% 32,373 99,279 131,652
76.398.000-6 Integramédica de Centros Médicos S.A. Chile Banco BBVA Mensual UF 3.60% 3.66% 30,639 93,404 124,043
76.398.000-6 Integramédica de Centros Médicos S.A. Chile Banco BBVA Mensual UF 3.53% 3.59% 12,957 35,055 48,012
76.398.000-6 Integramédica de Centros Médicos S.A. Chile Banco BBVA Mensual Pesos no reajustables 6.33% 6.52% 20,718 63,294 84,012
76.398.000-6 Integramédica de Centros Médicos S.A. Chile Banco BBVA Mensual Pesos no reajustables 6.36% 6.55% 24,531 74,923 99,454
76.398.000-6 Integramédica de Centros Médicos S.A. Chile Banco BBVA Mensual Pesos no reajustables 6.22% 6.40% 49,866 152,191 202,057
76.398.000-6 Integramédica de Centros Médicos S.A. Chile Banco Bice Mensual Pesos no reajustables 7.09% 7.32% 14,217 43,739 57,956
76.398.000-6 Integramédica de Centros Médicos S.A. Chile Banco Bice Mensual Pesos no reajustables 6.90% 7.12% 50,933 157,459 208,392
76.398.000-6 Integramédica de Centros Médicos S.A. Chile Banco Bice Mensual Pesos no reajustables 6.66% 6.87% 10,434 32,129 42,563
76.398.000-6 Integramédica de Centros Médicos S.A. Chile Banco Bice Mensual Pesos no reajustables 7.06% 7.29% 24,337 74,591 98,928
76.398.000-6 Integramédica de Centros Médicos S.A. Chile Banco Bice Mensual Pesos no reajustables 6.70% 6.91% 26,140 80,531 106,671
76.398.000-6 Integramédica de Centros Médicos S.A. Chile Banco Bice Mensual Pesos no reajustables 7.44% 7.70% 35,225 108,913 144,138
76.398.000-6 Integramédica de Centros Médicos S.A. Chile Banco Bice Mensual Pesos no reajustables 7.38% 7.63% 11,422 35,134 46,556
76.398.000-6 Integramédica de Centros Médicos S.A. Chile Banco Bice Mensual Pesos no reajustables 7.34% 7.59% 35,756 109,794 145,550
76.398.000-6 Integramédica de Centros Médicos S.A. Chile Banco Bice Mensual Pesos no reajustables 7.04% 7.27% 21,612 66,479 88,091
76.398.000-6 Integramédica de Centros Médicos S.A. Chile Banco Bice Mensual Pesos no reajustables 9.35% 9.76% 20,106 61,943 82,049
76.398.000-6 Integramédica de Centros Médicos S.A. Chile Banco Bice Mensual Pesos no reajustables 7.21% 7.45% 40,009 122,901 162,910
76.398.000-6 Integramédica de Centros Médicos S.A. Chile Banco Bice Mensual Pesos no reajustables 11.15% 11.73% 3,419 10,469 13,888
76.398.000-6 Integramédica de Centros Médicos S.A. Chile Banco Bice Mensual Pesos no reajustables 6.86% 7.08% 14,574 44,604 59,178
76.398.000-6 Integramédica de Centros Médicos S.A. Chile Banco Bice Mensual Pesos no reajustables 7.01% 7.24% 18,552 56,778 75,330
Balance at
12/31/2013
Nominal
Interest rate
(%)
Effective
interest rate
(%)
Current Tax Id
Number of
Debtor Entity
Name of Debtor Entity
Countr
y
Creditor Name Amortization
Type Currency
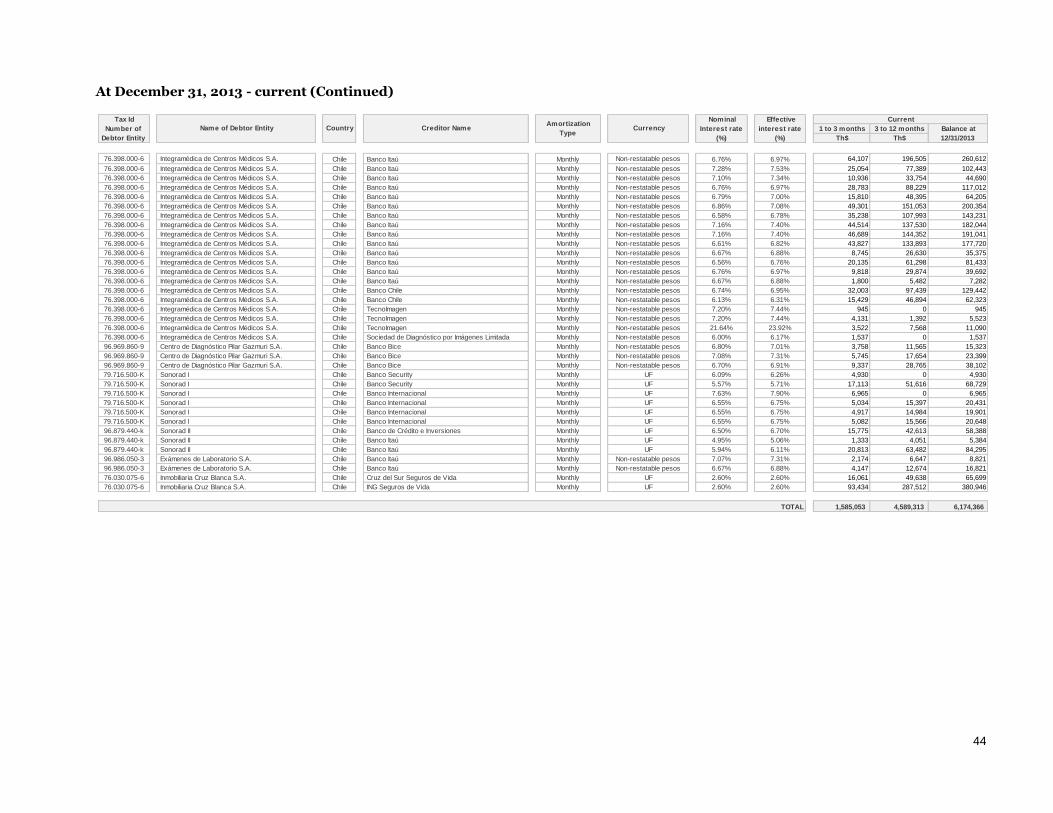
44
At December 31, 2013 - current (Continued)
1 to 3 months 3 to 12 months
Th$ Th$
76.398.000-6 Integramédica de Centros Médicos S.A. Chile Banco Itaú Monthly Non-restatable pesos 6.76% 6.97% 64,107 196,505 260,612
76.398.000-6 Integramédica de Centros Médicos S.A. Chile Banco Itaú Monthly Non-restatable pesos 7.28% 7.53% 25,054 77,389 102,443
76.398.000-6 Integramédica de Centros Médicos S.A. Chile Banco Itaú Monthly Non-restatable pesos 7.10% 7.34% 10,936 33,754 44,690
76.398.000-6 Integramédica de Centros Médicos S.A. Chile Banco Itaú Monthly Non-restatable pesos 6.76% 6.97% 28,783 88,229 117,012
76.398.000-6 Integramédica de Centros Médicos S.A. Chile Banco Itaú Monthly Non-restatable pesos 6.79% 7.00% 15,810 48,395 64,205
76.398.000-6 Integramédica de Centros Médicos S.A. Chile Banco Itaú Monthly Non-restatable pesos 6.86% 7.08% 49,301 151,053 200,354
76.398.000-6 Integramédica de Centros Médicos S.A. Chile Banco Itaú Monthly Non-restatable pesos 6.58% 6.78% 35,238 107,993 143,231
76.398.000-6 Integramédica de Centros Médicos S.A. Chile Banco Itaú Monthly Non-restatable pesos 7.16% 7.40% 44,514 137,530 182,044
76.398.000-6 Integramédica de Centros Médicos S.A. Chile Banco Itaú Monthly Non-restatable pesos 7.16% 7.40% 46,689 144,352 191,041
76.398.000-6 Integramédica de Centros Médicos S.A. Chile Banco Itaú Monthly Non-restatable pesos 6.61% 6.82% 43,827 133,893 177,720
76.398.000-6 Integramédica de Centros Médicos S.A. Chile Banco Itaú Monthly Non-restatable pesos 6.67% 6.88% 8,745 26,630 35,375
76.398.000-6 Integramédica de Centros Médicos S.A. Chile Banco Itaú Monthly Non-restatable pesos 6.56% 6.76% 20,135 61,298 81,433
76.398.000-6 Integramédica de Centros Médicos S.A. Chile Banco Itaú Monthly Non-restatable pesos 6.76% 6.97% 9,818 29,874 39,692
76.398.000-6 Integramédica de Centros Médicos S.A. Chile Banco Itaú Monthly Non-restatable pesos 6.67% 6.88% 1,800 5,482 7,282
76.398.000-6 Integramédica de Centros Médicos S.A. Chile Banco Chile Monthly Non-restatable pesos 6.74% 6.95% 32,003 97,439 129,442
76.398.000-6 Integramédica de Centros Médicos S.A. Chile Banco Chile Monthly Non-restatable pesos 6.13% 6.31% 15,429 46,894 62,323
76.398.000-6 Integramédica de Centros Médicos S.A. Chile TecnoImagen Monthly Non-restatable pesos 7.20% 7.44% 945 0 945
76.398.000-6 Integramédica de Centros Médicos S.A. Chile TecnoImagen Monthly Non-restatable pesos 7.20% 7.44% 4,131 1,392 5,523
76.398.000-6 Integramédica de Centros Médicos S.A. Chile TecnoImagen Monthly Non-restatable pesos 21.64% 23.92% 3,522 7,568 11,090
76.398.000-6 Integramédica de Centros Médicos S.A. Chile Sociedad de Diagnóstico por Imágenes Limitada Monthly Non-restatable pesos 6.00% 6.17% 1,537 0 1,537
96.969.860-9 Centro de Diagnóstico Pilar Gazmuri S.A. Chile Banco Bice Monthly Non-restatable pesos 6.80% 7.01% 3,758 11,565 15,323
96.969.860-9 Centro de Diagnóstico Pilar Gazmuri S.A. Chile Banco Bice Monthly Non-restatable pesos 7.08% 7.31% 5,745 17,654 23,399
96.969.860-9 Centro de Diagnóstico Pilar Gazmuri S.A. Chile Banco Bice Monthly Non-restatable pesos 6.70% 6.91% 9,337 28,765 38,102
79.716.500-K Sonorad I Chile Banco Security Monthly UF 6.09% 6.26% 4,930 0 4,930
79.716.500-K Sonorad I Chile Banco Security Monthly UF 5.57% 5.71% 17,113 51,616 68,729
79.716.500-K Sonorad I Chile Banco Internacional Monthly UF 7.63% 7.90% 6,965 0 6,965
79.716.500-K Sonorad I Chile Banco Internacional Monthly UF 6.55% 6.75% 5,034 15,397 20,431
79.716.500-K Sonorad I Chile Banco Internacional Monthly UF 6.55% 6.75% 4,917 14,984 19,901
79.716.500-K Sonorad I Chile Banco Internacional Monthly UF 6.55% 6.75% 5,082 15,566 20,648
96.879.440-k Sonorad II Chile Banco de Crédito e Inversiones Monthly UF 6.50% 6.70% 15,775 42,613 58,388
96.879.440-k Sonorad II Chile Banco Itaú Monthly UF 4.95% 5.06% 1,333 4,051 5,384
96.879.440-k Sonorad II Chile Banco Itaú Monthly UF 5.94% 6.11% 20,813 63,482 84,295
96.986.050-3 Exámenes de Laboratorio S.A. Chile Banco Itaú Monthly Non-restatable pesos 7.07% 7.31% 2,174 6,647 8,821
96.986.050-3 Exámenes de Laboratorio S.A. Chile Banco Itaú Monthly Non-restatable pesos 6.67% 6.88% 4,147 12,674 16,821
76.030.075-6 Inmobiliaria Cruz Blanca S.A. Chile Cruz del Sur Seguros de Vida Monthly UF 2.60% 2.60% 16,061 49,638 65,699
76.030.075-6 Inmobiliaria Cruz Blanca S.A. Chile ING Seguros de Vida Monthly UF 2.60% 2.60% 93,434 287,512 380,946
1,585,053 4,589,313 6,174,366
Nominal
Interest rate
(%)
Effective
interest rate
(%)
Current
Balance at
12/31/2013
TOTAL
Tax Id
Number of
Debtor Entity
Name of Debtor Entity Country Creditor Name Amortization
Type Currency

45
At December 31, 2013, non-current
1 to 3 years From 3 to 5
years Over 5 years
Th$ Th$ Th$
0-E Resomasa S.A. Perú Banco de Crédito del Perú Monthly US dollars 5.00% 5.30% 189,990 96,380 0 286,370
0-E Anglolab S.A. Perú Banco Continental Monthly US dollars 6.50% 6.50% 2,831 0 0 2,831
0-E Resomasa S.A. Perú Banco de Crédito del Perú Monthly New Peruvian Sol 7.40% 7.40% 29,210 36,198 0 65,408
78.804.370-8 Soc. Instituto de Cardiología el Norte Ltda. Chile Banco Security At maturity UF 4.77% 4.87% 116,230 0 0 116,230
95.431.000-0 Servicios y Abastecimientos a Clínicas S.A Chile Banco Santander At maturity UF 3.87% 3.94% 9,180 0 0 9,180
95.431.000-0 Servicios y Abastecimientos a Clínicas S.A Chile Banco Santander At maturity UF 4.31% 4.40% 12,427 0 0 12,427
95.431.000-0 Servicios y Abastecimientos a Clínicas S.A Chile Banco Santander At maturity UF 3.87% 3.94% 53,706 0 0 53,706
95.431.000-0 Servicios y Abastecimientos a Clínicas S.A Chile Banco Security At maturity UF 3.90% 3.97% 9,981 0 0 9,981
95.431.000-0 Servicios y Abastecimientos a Clínicas S.A Chile Banco Bice At maturity UF 2.63% 2.67% 30,726 0 0 30,726
95.431.000-0 Servicios y Abastecimientos a Clínicas S.A Chile Banco Bice At maturity UF 5.22% 5.35% 70,623 0 0 70,623
95.432.000-6 Centro Médico Antofagasta S.A. Chile Banco Bice At maturity UF 4.44% 4.53% 156,010 0 0 156,010
79.576.810-6 Clínica Reñaca S.A. Chile Banco Security Monthly UF 5.84% 6.00% 38,858 8,681 0 47,539
79.576.810-6 Clínica Reñaca S.A. Chile Banco Security Monthly UF 4.74% 4.84% 117,329 128,972 135,593 381,894
76.098.454-K Integramédica S.A. Chile Andueza & Principal Monthly UF 8.58% 8.92% 34,986 11,383 0 46,369
76.098.454-K Integramédica S.A. Chile ING Seguros de Vida Monthly UF 8.19% 8.50% 77,928 0 0 77,928
76.398.000-6 Integramédica de Centros Médicos S.A. Chile Banco Bice Monthly Non.restatable pesos 7.23% 7.47% 11,729 0 0 11,729
76.398.000-6 Integramédica de Centros Médicos S.A. Chile Banco Bice Monthly Non.restatable pesos 7.08% 7.31% 43,760 0 0 43,760
76.398.000-6 Integramédica de Centros Médicos S.A. Chile Banco Corpbanca Monthly Non.restatable pesos 7.85% 8.14% 247,433 0 0 247,433
76.398.000-6 Integramédica de Centros Médicos S.A. Chile Banco BBVA Monthly Non.restatable pesos 7.44% 7.70% 101,122 0 0 101,122
76.398.000-6 Integramédica de Centros Médicos S.A. Chile Banco BBVA Monthly Non.restatable pesos 6.90% 7.12% 350,619 0 0 350,619
76.398.000-6 Integramédica de Centros Médicos S.A. Chile Banco BBVA Monthly Non.restatable pesos 6.77% 6.98% 325,458 0 0 325,458
76.398.000-6 Integramédica de Centros Médicos S.A. Chile Banco BBVA Monthly Non.restatable pesos 6.71% 6.92% 189,075 0 0 189,075
76.398.000-6 Integramédica de Centros Médicos S.A. Chile Banco BBVA Monthly Non.restatable pesos 7.18% 7.42% 292,353 39,577 0 331,930
76.398.000-6 Integramédica de Centros Médicos S.A. Chile Banco BBVA Monthly Non.restatable pesos 6.33% 6.52% 184,202 58,257 0 242,459
76.398.000-6 Integramédica de Centros Médicos S.A. Chile Banco BBVA Monthly Non.restatable pesos 6.36% 6.55% 218,132 79,082 0 297,214
76.398.000-6 Integramédica de Centros Médicos S.A. Chile Banco BBVA Monthly Non.restatable pesos 6.22% 6.40% 442,224 180,501 0 622,725
76.398.000-6 Integramédica de Centros Médicos S.A. Chile Banco Bice Monthly Non.restatable pesos 7.09% 7.32% 94,752 0 0 94,752
76.398.000-6 Integramédica de Centros Médicos S.A. Chile Banco Bice Monthly Non.restatable pesos 6.90% 7.12% 36,108 0 0 36,108
76.398.000-6 Integramédica de Centros Médicos S.A. Chile Banco Bice Monthly Non.restatable pesos 6.66% 6.87% 41,505 0 0 41,505
76.398.000-6 Integramédica de Centros Médicos S.A. Chile Banco Bice Monthly Non.restatable pesos 7.06% 7.29% 219,890 49,956 0 269,846
76.398.000-6 Integramédica de Centros Médicos S.A. Chile Banco Bice Monthly Non.restatable pesos 6.70% 6.91% 94,342 0 0 94,342
76.398.000-6 Integramédica de Centros Médicos S.A. Chile Banco Bice Monthly Non.restatable pesos 7.44% 7.70% 102,031 0 0 102,031
76.398.000-6 Integramédica de Centros Médicos S.A. Chile Banco Bice Monthly Non.restatable pesos 7.38% 7.63% 89,926 0 0 89,926
76.398.000-6 Integramédica de Centros Médicos S.A. Chile Banco Bice Monthly Non.restatable pesos 7.34% 7.59% 324,023 14,557 0 338,580
76.398.000-6 Integramédica de Centros Médicos S.A. Chile Banco Bice Monthly Non.restatable pesos 7.04% 7.27% 143,937 0 0 143,937
76.398.000-6 Integramédica de Centros Médicos S.A. Chile Banco Bice Monthly Non.restatable pesos 9.35% 9.76% 89,318 0 0 89,318
76.398.000-6 Integramédica de Centros Médicos S.A. Chile Banco Bice Monthly Non.restatable pesos 7.21% 7.45% 345,905 0 0 345,905
76.398.000-6 Integramédica de Centros Médicos S.A. Chile Banco Bice Monthly Non.restatable pesos 11.15% 11.73% 30,717 6,951 0 37,668
76.398.000-6 Integramédica de Centros Médicos S.A. Chile Banco Bice Monthly Non.restatable pesos 6.86% 7.08% 130,768 35,586 0 166,354
76.398.000-6 Integramédica de Centros Médicos S.A. Chile Banco Bice Monthly Non.restatable pesos 7.01% 7.24% 166,793 53,203 0 219,996
Balance at
12/31/2013
Nominal
Interest rate
(%)
Effective
interest rate
(%)
Non-current Tax Id
Number of
Debtor Entity
Name of Debtor Entity Country Creditor Name Amortization
Type Currency
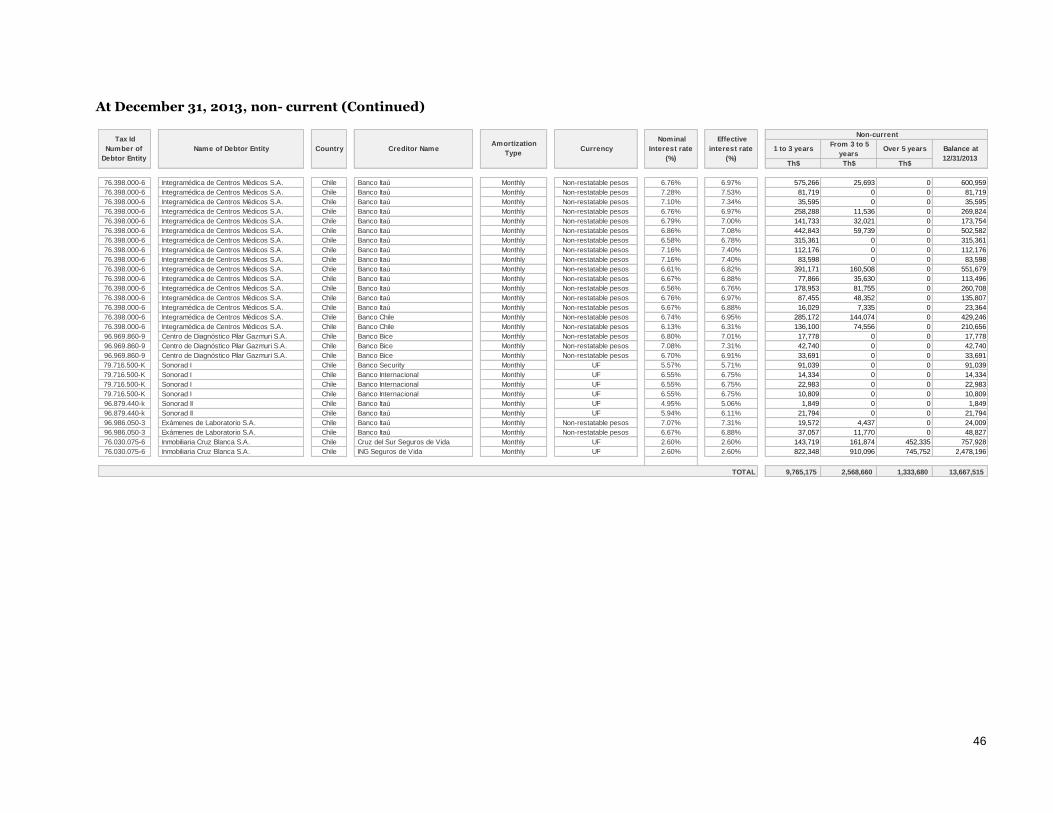
46
At December 31, 2013, non- current (Continued)
1 to 3 years From 3 to 5
years Over 5 years
Th$ Th$ Th$
76.398.000-6 Integramédica de Centros Médicos S.A. Chile Banco Itaú Monthly Non-restatable pesos 6.76% 6.97% 575,266 25,693 0 600,959
76.398.000-6 Integramédica de Centros Médicos S.A. Chile Banco Itaú Monthly Non-restatable pesos 7.28% 7.53% 81,719 0 0 81,719
76.398.000-6 Integramédica de Centros Médicos S.A. Chile Banco Itaú Monthly Non-restatable pesos 7.10% 7.34% 35,595 0 0 35,595
76.398.000-6 Integramédica de Centros Médicos S.A. Chile Banco Itaú Monthly Non-restatable pesos 6.76% 6.97% 258,288 11,536 0 269,824
76.398.000-6 Integramédica de Centros Médicos S.A. Chile Banco Itaú Monthly Non-restatable pesos 6.79% 7.00% 141,733 32,021 0 173,754
76.398.000-6 Integramédica de Centros Médicos S.A. Chile Banco Itaú Monthly Non-restatable pesos 6.86% 7.08% 442,843 59,739 0 502,582
76.398.000-6 Integramédica de Centros Médicos S.A. Chile Banco Itaú Monthly Non-restatable pesos 6.58% 6.78% 315,361 0 0 315,361
76.398.000-6 Integramédica de Centros Médicos S.A. Chile Banco Itaú Monthly Non-restatable pesos 7.16% 7.40% 112,176 0 0 112,176
76.398.000-6 Integramédica de Centros Médicos S.A. Chile Banco Itaú Monthly Non-restatable pesos 7.16% 7.40% 83,598 0 0 83,598
76.398.000-6 Integramédica de Centros Médicos S.A. Chile Banco Itaú Monthly Non-restatable pesos 6.61% 6.82% 391,171 160,508 0 551,679
76.398.000-6 Integramédica de Centros Médicos S.A. Chile Banco Itaú Monthly Non-restatable pesos 6.67% 6.88% 77,866 35,630 0 113,496
76.398.000-6 Integramédica de Centros Médicos S.A. Chile Banco Itaú Monthly Non-restatable pesos 6.56% 6.76% 178,953 81,755 0 260,708
76.398.000-6 Integramédica de Centros Médicos S.A. Chile Banco Itaú Monthly Non-restatable pesos 6.76% 6.97% 87,455 48,352 0 135,807
76.398.000-6 Integramédica de Centros Médicos S.A. Chile Banco Itaú Monthly Non-restatable pesos 6.67% 6.88% 16,029 7,335 0 23,364
76.398.000-6 Integramédica de Centros Médicos S.A. Chile Banco Chile Monthly Non-restatable pesos 6.74% 6.95% 285,172 144,074 0 429,246
76.398.000-6 Integramédica de Centros Médicos S.A. Chile Banco Chile Monthly Non-restatable pesos 6.13% 6.31% 136,100 74,556 0 210,656
96.969.860-9 Centro de Diagnóstico Pilar Gazmuri S.A. Chile Banco Bice Monthly Non-restatable pesos 6.80% 7.01% 17,778 0 0 17,778
96.969.860-9 Centro de Diagnóstico Pilar Gazmuri S.A. Chile Banco Bice Monthly Non-restatable pesos 7.08% 7.31% 42,740 0 0 42,740
96.969.860-9 Centro de Diagnóstico Pilar Gazmuri S.A. Chile Banco Bice Monthly Non-restatable pesos 6.70% 6.91% 33,691 0 0 33,691
79.716.500-K Sonorad I Chile Banco Security Monthly UF 5.57% 5.71% 91,039 0 0 91,039
79.716.500-K Sonorad I Chile Banco Internacional Monthly UF 6.55% 6.75% 14,334 0 0 14,334
79.716.500-K Sonorad I Chile Banco Internacional Monthly UF 6.55% 6.75% 22,983 0 0 22,983
79.716.500-K Sonorad I Chile Banco Internacional Monthly UF 6.55% 6.75% 10,809 0 0 10,809
96.879.440-k Sonorad II Chile Banco Itaú Monthly UF 4.95% 5.06% 1,849 0 0 1,849
96.879.440-k Sonorad II Chile Banco Itaú Monthly UF 5.94% 6.11% 21,794 0 0 21,794
96.986.050-3 Exámenes de Laboratorio S.A. Chile Banco Itaú Monthly Non-restatable pesos 7.07% 7.31% 19,572 4,437 0 24,009
96.986.050-3 Exámenes de Laboratorio S.A. Chile Banco Itaú Monthly Non-restatable pesos 6.67% 6.88% 37,057 11,770 0 48,827
76.030.075-6 Inmobiliaria Cruz Blanca S.A. Chile Cruz del Sur Seguros de Vida Monthly UF 2.60% 2.60% 143,719 161,874 452,335 757,928
76.030.075-6 Inmobiliaria Cruz Blanca S.A. Chile ING Seguros de Vida Monthly UF 2.60% 2.60% 822,348 910,096 745,752 2,478,196
9,765,175 2,568,660 1,333,680 13,667,515 TOTAL
Balance at
12/31/2013
Nominal
Interest rate
(%)
Effective
interest rate
(%)
Non-current Tax Id
Number of
Debtor Entity
Name of Debtor Entity Country Creditor Name Amortization
Type Currency

47
6.2.3.-Reconciliation of minimum payments of financial leases Financial lease obligations are effectively guaranteed as the property rights over the asset are reverted to the lessor in case of default. The breakdown by maturity of minimum lease payments and its present value is the following:
6.2.4.- Bonds On June 30, 2012, the Head Company issued bonds in the local market for a total of UF 1,550,000 with maturity on September 30, 2033, as stated in the complementary public deed dated June 19, 2012, which was filed to the SVS on June 21, 2012. On this occasion the company issued bond series A, consisting of 3,100 debt securities with a nominal value of UF 500 each. These bonds were placed directly in the local market at an effective issue rate of 4.34% per year.
There are certain ratios related to the issue of the bond, which are the following: a) Consolidated indebtedness ratio.
At the end of each calendar quarter the consolidated indebtedness level shall be no higher than 1.75 times, measured on the balances of the consolidated financial statements. For these effects, the Financial Indebtedness ratio is defined as a ratio between Financial Debt and Equity lower than 1.75 times of the Issuer Total.
b) Net Financial Expenses Coverage Ratio.
Beginning on 31 march 2012, at the end of each calendar quarter, the Net consolidated Financial Expenses Coverage ratio will not be lower than 2.5 times and as of December 31, 2014, it will not be lower than 3.0 times. Net Financial Expenses Coverage Ratio will be the ratio between the Issuer’s EBITDA of the last twelve months and the Issuer’s Net Financial Expenses of the last twelve months. However, the covenant in this section will be considered to be in default only when the abovementioned Net Financial Expenses Coverage ratio is lower to the level indicated above in two consecutive quarters.
Gross Value Interest Present
Value Gross Value Interest
Present
Value
Less than one year 6,854,419 778,568 6,075,851 8,247,879 2,073,513 6,174,366
Betw een one and five years 9,709,720 785,419 8,924,301 14,941,005 2,607,170 12,333,835
Over f ive years 773,085 49,179 723,906 1,471,498 137,818 1,333,680
Total 17,337,224 1,613,166 15,724,058 24,660,381 4,818,500 19,841,881
12/31/2014 12/31/2013 Reconciliation of minimum
payments of financial lease,
Lesee
Series A
UF Amount 1,550,000
Face Rate 4.23%
Amortizations Annual as of 06/30/2023
Payments of interest Annual as of 06/30/2013
Maturity 06/30/2033
Rating A
Description of the bond

48
The breakdown of the bonds at December 31, 2014 is the following
The breakdown of the bonds at December 31, 2013 is the following
Th$ Th$ Th$ Th$ Th$ Th$ Th$
76.005.006-6 Bupa Chile S.A. Chile Anual UF 4.23% 4.34% 6/30/2033 790,019 (8,015) 782,004 (21,318) (15,929) 37,824,330 37,787,083
TOTALS 790,019 (8,015) 782,004 (21,318) (15,929) 37,824,330 37,787,083
Face Rate
(%)
Tax Id Number
Debtor Entity Name Debtor Entity Country
Amortization
Type Currency Balance at
12/31/2014
Effective
Rate (%)
Maturity
Date
Current Non-current
1 to 3
months
3 to 12
months
Balance at
12/31/2014 1 to 3 years
Over 3 and
up to 5
Over 5
years
Th$ Th$ Th$ Th$ Th$ Th$ Th$
76.005.006-6 Cruz Blanca Salud S.A. Chile Anual UF 4.23% 4.34% 6/30/2033 770,426 0 770,426 0 0 35,712,927 35,712,927
TOTALS 770,426 0 770,426 0 0 35,712,927 35,712,927
Tax Id Number
Debtor Entity Name Debtor Entity Country
Amortization
Type Currency
Face Rate
(%)
Effective
Rate (%)
Maturity
Date
Current Non-current
1 to 3
months
3 to 12
months
Balance at
12/31/2013 1 to 3 years
Over 3 and
up to 5
Over 5
years
Balance at
12/31/2013

49
NOTE 6.3. DERIVATIVE FINANCIAL INSTRUMENTS The Group hires derivative financial instruments to cover its financial risks related to exchange rate and interest rates. The Group, on June 30, 2010 subscribed derivative currency and interest rate “swap” contracts with the banks Corpbanca and Security, which denominates a debt in pesos at variable rate into UF at a fixed annual rate of 4.83%, according to the following chart:
These contracts qualify as hedging contracts on recognized liabilities, recognizing the differences in fair value in equity, as Other Comprehensive Income under “Cash flow hedging reserve” as set forth in IAS 39 and IFRS 7. NOTE 7 OTHER CURRENT AND NON-CURRENT NON-FINANCIAL ASSETS AND
LIABILITIES NOTE 7.1 OTHER NON-FINANCIAL ASSETS The breakdown of this area is the following:
NOTE 7.2 OTHER NON-FINANCIAL LIABILITIES The breakdown of this area is the following:
The items included in the chart above have been considered "non-financial" as they are an accrued liability that does not have a definite payment date.
Fair value
valuation at
12/31/2014
Fair value
valuation at
12/31/2013
Net equity at
12/31/2014
Net Equity at
12/31/2013
Th$ Th$ Th$ Th$
Sw ap Banco Corpbanca 7/2/2018 Tab 180 + 1% 20,000,000 3,951,342 2,724,964 (3,951,342) (2,320,583)
Sw ap Banco Corpbanca 7/2/2018 Tab 180 + 1% 12,124,800 2,395,461 1,651,328 (2,394,513) (1,406,273)
Sw ap Banco Corpbanca 7/2/2018 Tab 180 + 1% 5,466,400 1,079,981 746,640 (1,082,668) (635,840)
Sw ap Banco Security 6/30/2018 Tab 180 + 1% 2,408,800 475,900 326,996 (474,161) (278,470)
Sw ap Banco Security 6/30/2018 Tab 180 + 1% 2,304,000 404,618 279,036 (404,618) (279,036)
Sw ap Banco Crédito del Perú 11/5/2018 11.00% 96,246 (16,464) (2,982) (3,373) (4,034)
Sw ap Banco Crédito del Perú 11/1/2017 8.00% 387,812 (52,789) (11,060) (2,453) 272
Sw ap Banco Crédito del Perú 4/1/2014 7.95% 478,947 0 (37,247) 0 3,973
43,267,005 8,238,049 5,677,675 (8,313,128) (4,919,991)
Hedge
Th$
Total
Instrument
type Bank Maturity Contract rate
Current Non-Current Current Non-Current
Th$ Th$ Th$ Th$
Prepayments of medical fees Non-restatable pesos 1,322,207 0 647,899 0
Cost of deferred commissions Non-restatable pesos 7,800,952 40,811,093 6,491,451 35,162,024
Prepaid expenses Non-restatable pesos 675,373 0 408,572 56,354
Guarantees given Non-restatable pesos 139,900 960,077 86,703 1,299,998
Insurance Company capital deposit Non-restatable pesos 241 0 374 0
Prepayments of medical fees Peruvian New Sol 4,667 0 0 0
Prepaid expenses Peruvian New Sol 32,549 0 0 0
Guarantees given Peruvian New Sol 89,709 0 0 0
Other non-financial assets Peruvian New Sol 121 0 22,516 0
Prepaid expenses Peruvian New Sol 5,310 598,203 0 0
Guarantees given UF 4,454 7,114 4,504 6,669
Prepaid expenses UF 13,983 0 23,066 0
Joint agreement Clinical Market S.A. UF 0 307,839 0 291,369
Total 10,089,466 42,684,326 7,685,085 36,816,414
12/31/2014 12/31/2013
Currency Other non-financial assets
Current Non- Current Non-
Th$ Th$ Th$ Th$
Deferred income Non-restatable pesos 13,081 0 12,371 0
Termination payments Non-restatable pesos 439,565 0 571,818 0
Sundry creditors Non-restatable pesos 4,229,354 0 3,230,682 0
Dividends payable Non-restatable pesos 0 459,000 0 609,000
Guarantees received UF 2,783 0 2,634 0
Guarantees received Peruvian New Sol 93,262 0 0 0
Dividends payable Peruvian New Sol 0 66,098 0 0
Sundry creditors Peruvian New Sol 0 577,852 4,173 1,180,364
4,778,045 1,102,950 3,821,678 1,789,364 Total
12/31/2014 12/31/2013 Area Currency

50
Following is the breakdown of deferred income:
NOTE 8. TRADE DEBTORS AND OTHER ACCOUNTS RECEIVABLE 8.1 Trade debtors and other accounts receivable, gross and net The breakdown of this area is as follows:
Current Non-
current Current
Non-
current
Th$ Th$ Th$ Th$
Dental services 10,290 0 9,031 0
Kynesiology services 2,791 0 3,340 0
Total 13,081 0 12,371 0
12/31/2014 12/31/2013
Area
Current Non-Current Current Non-
Current
Th$ Th$ Th$ Th$
Debtors from sales and services Non-restatable pesos 19,497,260 0 16,824,987 0
Accrued receivables Non-restatable pesos 18,420,355 0 15,509,061 0
Notes receivable Non-restatable pesos 6,571,691 0 7,098,767 0
Receivables from staff and other debtors Non-restatable pesos 4,306,005 0 3,427,521 0
Other accounts receivable (*) Non-restatable pesos 4,361,796 0 1,840,608 0
Debtors from sales and services Peruvian New Sol 1,282,578 0 1,542,600 0
Receivables from staff and other debtors Peruvian New Sol 27,794 0 42,005 0
Other receivables Peruvian New Sol 1,103,540 0 484,573 0
Trade debtors and other account receivables, 55,571,019 0 46,770,122 0
(*) See note 8.5
Current Non-Current Current Non-
Current
Th$ Th$ Th$ Th$
Debtors from sales and services Non-restatable pesos 25,309,227 0 22,202,431 0
Accrued receivables Non-restatable pesos 20,171,952 0 16,945,864 0
Notes receivable Non-restatable pesos 10,076,504 0 10,531,674 0
Receivables from staff and other debtors Non-restatable pesos 5,386,705 0 4,261,728 0
Other accounts receivable (*) Non-restatable pesos 4,361,796 0 1,840,608 0
Debtors from sales and services Peruvian New Sol 1,298,588 0 1,544,497 0
Receivables from staff and other debtors Peruvian New Sol 27,794 0 42,005 0
Other accounts receivable (*) Peruvian New Sol 1,103,540 0 484,573 0
Trade debtors and other account receivables,
Gross 67,736,106 0 57,853,380 0
(*) See note 8.5
Current Non-Current Current Non-
Current
Th$ Th$ Th$ Th$
Debtors from sales and services Non-restatable pesos 5,811,967 0 5,377,444 0
Accrued receivables Non-restatable pesos 1,751,597 0 1,436,803 0
Notes receivable Non-restatable pesos 3,504,813 0 3,432,907 0
Employee accounts and sundry debtors Non-restatable pesos 1,080,700 0 834,207 0
Debtors from sales and services Peruvian New Sol 16,010 0 1,897 0
Accumulated impairment allowance 12,165,087 0 11,083,258 0
Trade debtors and other account receivables,
Net Currency
Trade debtors and other account receivables,
Gross Currency
Impairment of trade debtors and other
accounts receivable Currency
12/31/2014 12/31/2013
12/31/2014 12/31/2013
12/31/2014 12/31/2013
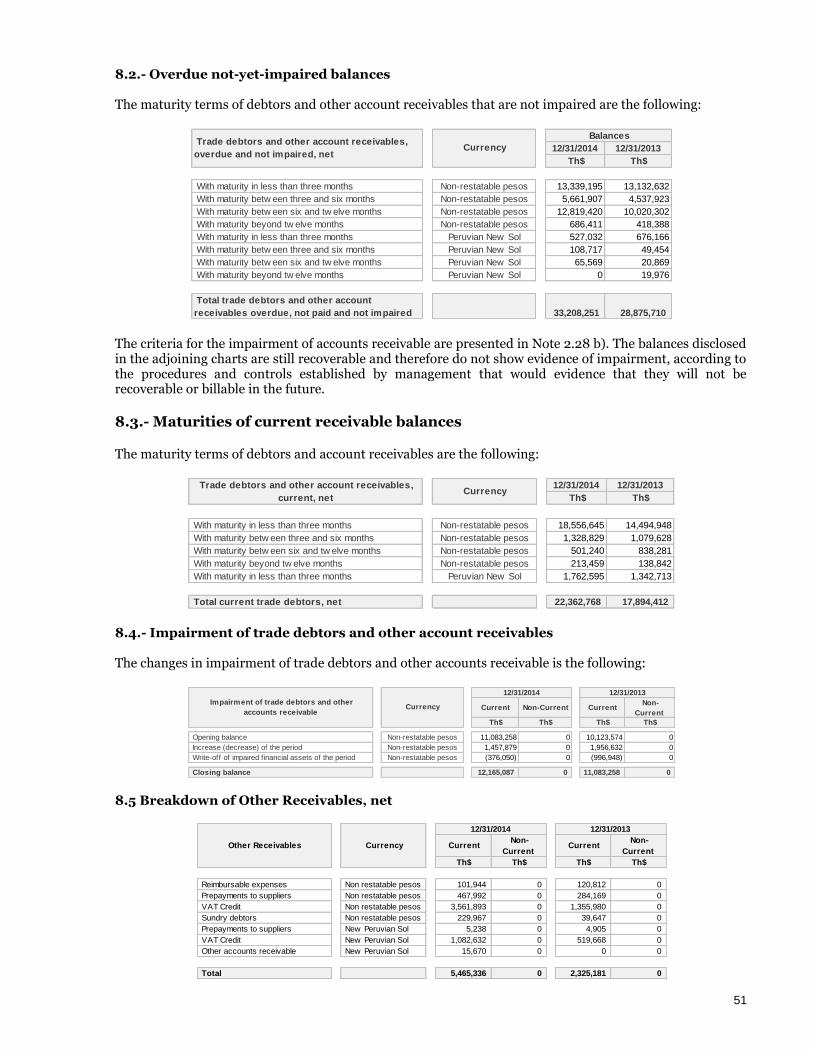
51
8.2.- Overdue not-yet-impaired balances The maturity terms of debtors and other account receivables that are not impaired are the following:
The criteria for the impairment of accounts receivable are presented in Note 2.28 b). The balances disclosed in the adjoining charts are still recoverable and therefore do not show evidence of impairment, according to the procedures and controls established by management that would evidence that they will not be recoverable or billable in the future.
8.3.- Maturities of current receivable balances The maturity terms of debtors and account receivables are the following:
8.4.- Impairment of trade debtors and other account receivables The changes in impairment of trade debtors and other accounts receivable is the following:
8.5 Breakdown of Other Receivables, net
12/31/2014 12/31/2013
Th$ Th$
With maturity in less than three months Non-restatable pesos 13,339,195 13,132,632
With maturity betw een three and six months Non-restatable pesos 5,661,907 4,537,923
With maturity betw een six and tw elve months Non-restatable pesos 12,819,420 10,020,302
With maturity beyond tw elve months Non-restatable pesos 686,411 418,388
With maturity in less than three months Peruvian New Sol 527,032 676,166
With maturity betw een three and six months Peruvian New Sol 108,717 49,454
With maturity betw een six and tw elve months Peruvian New Sol 65,569 20,869
With maturity beyond tw elve months Peruvian New Sol 0 19,976
Total trade debtors and other account
receivables overdue, not paid and not impaired 33,208,251 28,875,710
Trade debtors and other account receivables,
overdue and not impaired, net Currency
Balances
12/31/2014 12/31/2013
Th$ Th$
With maturity in less than three months Non-restatable pesos 18,556,645 14,494,948
With maturity betw een three and six months Non-restatable pesos 1,328,829 1,079,628
With maturity betw een six and tw elve months Non-restatable pesos 501,240 838,281
With maturity beyond tw elve months Non-restatable pesos 213,459 138,842
With maturity in less than three months Peruvian New Sol 1,762,595 1,342,713
Total current trade debtors, net 22,362,768 17,894,412
Currency Trade debtors and other account receivables,
current, net
Current Non-Current Current Non-
Current
Th$ Th$ Th$ Th$
Opening balance Non-restatable pesos 11,083,258 0 10,123,574 0
Increase (decrease) of the period Non-restatable pesos 1,457,879 0 1,956,632 0
Write-off of impaired financial assets of the period Non-restatable pesos (376,050) 0 (996,948) 0
Closing balance 12,165,087 0 11,083,258 0
Impairment of trade debtors and other
accounts receivable
12/31/2014 12/31/2013
Currency
Current Non-
Current Current
Non-
Current
Th$ Th$ Th$ Th$
Reimbursable expenses Non restatable pesos 101,944 0 120,812 0
Prepayments to suppliers Non restatable pesos 467,992 0 284,169 0
VAT Credit Non restatable pesos 3,561,893 0 1,355,980 0
Sundry debtors Non restatable pesos 229,967 0 39,647 0
Prepayments to suppliers New Peruvian Sol 5,238 0 4,905 0
VAT Credit New Peruvian Sol 1,082,632 0 519,668 0
Other accounts receivable New Peruvian Sol 15,670 0 0 0
Total 5,465,336 0 2,325,181 0
Other Receivables Currency
12/31/2014 12/31/2013
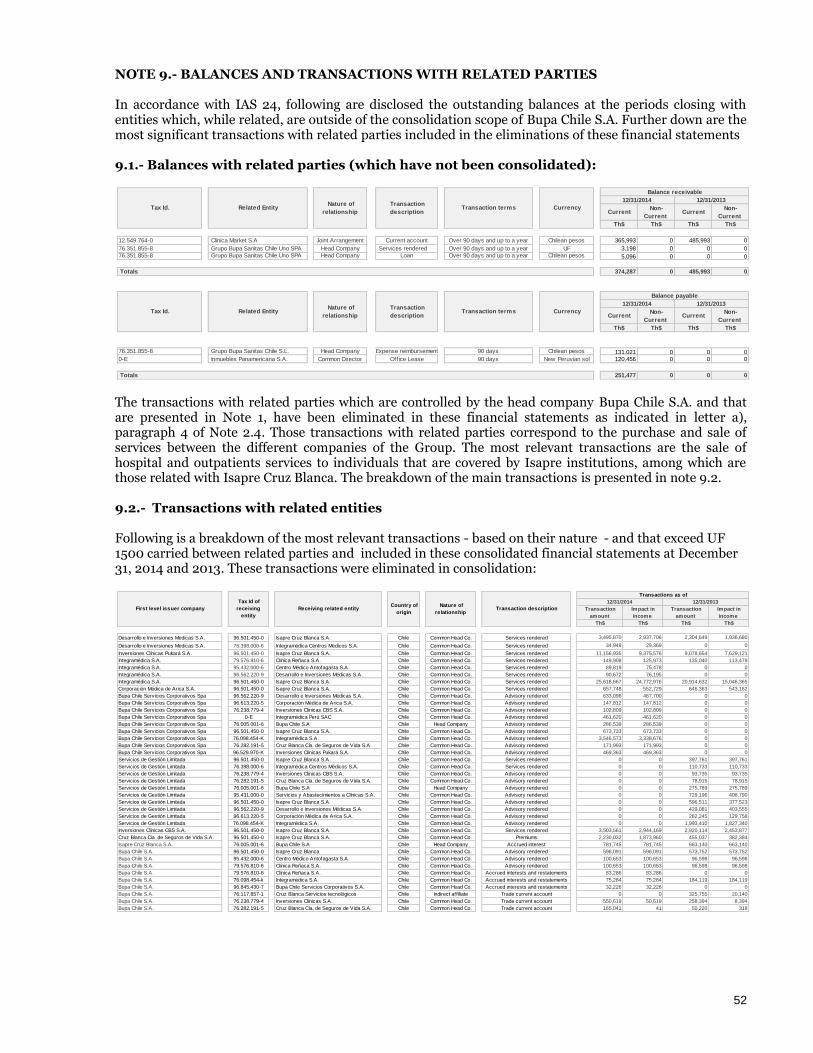
52
NOTE 9.- BALANCES AND TRANSACTIONS WITH RELATED PARTIES In accordance with IAS 24, following are disclosed the outstanding balances at the periods closing with entities which, while related, are outside of the consolidation scope of Bupa Chile S.A. Further down are the most significant transactions with related parties included in the eliminations of these financial statements 9.1.- Balances with related parties (which have not been consolidated):
The transactions with related parties which are controlled by the head company Bupa Chile S.A. and that are presented in Note 1, have been eliminated in these financial statements as indicated in letter a), paragraph 4 of Note 2.4. Those transactions with related parties correspond to the purchase and sale of services between the different companies of the Group. The most relevant transactions are the sale of hospital and outpatients services to individuals that are covered by Isapre institutions, among which are those related with Isapre Cruz Blanca. The breakdown of the main transactions is presented in note 9.2. 9.2.- Transactions with related entities Following is a breakdown of the most relevant transactions - based on their nature - and that exceed UF 1500 carried between related parties and included in these consolidated financial statements at December 31, 2014 and 2013. These transactions were eliminated in consolidation:
Current Non-
Current Current
Non-
Current
Th$ Th$ Th$ Th$
12.549.764-0 Clínica Market S.A Joint Arrangement Current account Over 90 days and up to a year Chilean pesos 365,993 0 485,993 0
76.351.855-8 Grupo Bupa Sanitas Chile Uno SPA Head Company Services rendered Over 90 days and up to a year UF 3,198 0 0 0
76.351.855-8 Grupo Bupa Sanitas Chile Uno SPA Head Company Loan Over 90 days and up to a year Chilean pesos 5,096 0 0 0
374,287 0 485,993 0
Current Non-
Current Current
Non-
Current
Th$ Th$ Th$ Th$
76.351.855-8 Grupo Bupa Sanitas Chile S.L. Head Company Expense reimbursement 90 days Chilean pesos 131,021 0 0 0
0-E Inmuebles Panamericana S.A. Common Director Office Lease 90 days New Peruvian sol 120,456 0 0 0
251,477 0 0 0
Balance payable
12/31/2014 12/31/2013
Totals
Nature of
relationship Currency Related Entity
Tax Id. Related Entity Nature of
relationship
Transaction
description Transaction terms Currency
Balance receivable
12/31/201312/31/2014
Totals
Tax Id. Transaction
description Transaction terms
Transaction
amount
Impact in
income
Transaction
amount
Impact in
income
Th$ Th$ Th$ Th$
Desarrollo e Inversiones Medicas S.A. 96.501.450-0 Isapre Cruz Blanca S.A. Chile Common Head Co. Services rendered 3,495,870 2,937,706 2,304,649 1,936,680
Desarrollo e Inversiones Medicas S.A. 76.398.000-6 Integramédica Centros Médicos S.A. Chile Common Head Co. Services rendered 34,949 29,369 0 0
Inversiones Clínicas Pukará S.A. 96.501.450-0 Isapre Cruz Blanca S.A. Chile Common Head Co. Services rendered 11,156,935 9,375,576 9,078,654 7,629,121
Integramédica S.A. 79.576.810-6 Clínica Reñaca S.A. Chile Common Head Co. Services rendered 149,908 125,973 135,040 113,479
Integramédica S.A. 95.432.000-6 Centro Médico Antofagasta S.A. Chile Common Head Co. Services rendered 89,819 75,478 0 0
Integramédica S.A. 96.562.220-9 Desarrollo e Inversiones Médicas S.A. Chile Common Head Co. Services rendered 90,672 76,195 0 0
Integramédica S.A. 96.501.450-0 Isapre Cruz Blanca S.A. Chile Common Head Co. Services rendered 25,618,667 24,772,976 20,914,632 15,046,365
Corporación Médica de Arica S.A. 96.501.450-0 Isapre Cruz Blanca S.A. Chile Common Head Co. Services rendered 657,748 552,729 646,363 543,162
Bupa Chile Servicios Corporativos Spa 96.562.220-9 Desarrollo e Inversiones Médicas S.A. Chile Common Head Co. Advisory rendered 633,096 467,700 0 0
Bupa Chile Servicios Corporativos Spa 96.613.220-5 Corporación Médica de Arica S.A. Chile Common Head Co. Advisory rendered 147,812 147,812 0 0
Bupa Chile Servicios Corporativos Spa 76.238.779-4 Inversiones Clínicas CBS S.A. Chile Common Head Co. Advisory rendered 102,809 102,809 0 0
Bupa Chile Servicios Corporativos Spa 0-E Integramédica Perú SAC Chile Common Head Co. Advisory rendered 461,620 461,620 0 0
Bupa Chile Servicios Corporativos Spa 76.005.001-6 Bupa Chile S.A Chile Head Company Advisory rendered 286,539 286,539 0 0
Bupa Chile Servicios Corporativos Spa 96.501.450-0 Isapre Cruz Blanca S.A. Chile Common Head Co. Advisory rendered 673,733 673,733 0 0
Bupa Chile Servicios Corporativos Spa 76.098.454-K Integramédica S.A. Chile Common Head Co. Advisory rendered 3,546,573 3,338,676 0 0
Bupa Chile Servicios Corporativos Spa 76.282.191-5 Cruz Blanca Cía. de Seguros de Vida S.A. Chile Common Head Co. Advisory rendered 171,993 171,993 0 0
Bupa Chile Servicios Corporativos Spa 96.529.970-K Inversiones Clínicas Pukará S.A. Chile Common Head Co. Advisory rendered 469,363 469,363 0 0
Servicios de Gestión Limitada 96.501.450-0 Isapre Cruz Blanca S.A. Chile Common Head Co. Services rendered 0 0 397,761 397,761
Servicios de Gestión Limitada 76.398.000-6 Integramédica Centros Médicos S.A. Chile Common Head Co. Services rendered 0 0 110,733 110,733
Servicios de Gestión Limitada 76.238.779-4 Inversiones Clínicas CBS S.A. Chile Common Head Co. Advisory rendered 0 0 93,735 93,735
Servicios de Gestión Limitada 76.282.191-5 Cruz Blanca Cía. de Seguros de Vida S.A. Chile Common Head Co. Advisory rendered 0 0 78,915 78,915
Servicios de Gestión Limitada 76.005.001-6 Bupa Chile S.A Chile Head Company Advisory rendered 0 0 275,789 275,789
Servicios de Gestión Limitada 95.431.000-0 Servicios y Abastecimientos a Clínicas S.A. Chile Common Head Co. Advisory rendered 0 0 729,196 408,790
Servicios de Gestión Limitada 96.501.450-0 Isapre Cruz Blanca S.A. Chile Common Head Co. Advisory rendered 0 0 596,511 377,523
Servicios de Gestión Limitada 96.562.220-9 Desarrollo e Inversiones Médicas S.A. Chile Common Head Co. Advisory rendered 0 0 429,081 403,555
Servicios de Gestión Limitada 96.613.220-5 Corporación Médica de Arica S.A. Chile Common Head Co. Advisory rendered 0 0 282,245 129,758
Servicios de Gestión Limitada 76.098.454-K Integramédica S.A. Chile Common Head Co. Advisory rendered 0 0 1,993,410 1,827,340
Inversiones Clínicas CBS S.A. 96.501.450-0 Isapre Cruz Blanca S.A. Chile Common Head Co. Services rendered 3,503,561 2,944,169 2,920,114 2,453,877
Cruz Blanca Cía. de Seguros de Vida S.A. 96.501.450-0 Isapre Cruz Blanca S.A. Chile Common Head Co. Premiums 2,230,032 1,873,960 455,037 382,384
Isapre Cruz Blanca S.A. 76.005.001-6 Bupa Chile S.A Chile Head Company Accrued interest 781,745 781,745 663,140 663,140
Bupa Chile S.A. 96.501.450-0 Isapre Cruz Blanca Chile Common Head Co. Advisory rendered 596,091 596,091 573,752 573,752
Bupa Chile S.A. 95.432.000-6 Centro Médico Antofagasta S.A. Chile Common Head Co. Advisory rendered 100,653 100,653 96,598 96,598
Bupa Chile S.A. 79.576.810-6 Clínica Reñaca S.A. Chile Common Head Co. Advisory rendered 100,653 100,653 96,598 96,598
Bupa Chile S.A. 79.576.810-6 Clínica Reñaca S.A. Chile Common Head Co. Accrued interests and restatements 83,286 83,286 0 0
Bupa Chile S.A. 76.098.454-k Integramédica S.A. Chile Common Head Co. Accrued interests and restatements 75,284 75,284 184,119 184,119
Bupa Chile S.A. 96.845.430-7 Bupa Chile Servicios Corporativos S.A. Chile Common Head Co. Accrued interests and restatements 32,226 32,226 0 0
Bupa Chile S.A. 76.117.857-1 Cruz Blanca Servicios tecnológicos Chile Indirect aff iliate Trade current account 0 0 325,755 20,140
Bupa Chile S.A. 76.238.779-4 Inversiones Clínicas S.A. Chile Common Head Co. Trade current account 550,619 50,619 258,394 8,394
Bupa Chile S.A. 76.282.191-5 Cruz Blanca Cía. de Seguros de Vida S.A. Chile Common Head Co. Trade current account 165,041 41 50,220 318
Transactions as of
12/31/2014 12/31/2013
First level issuer company
Tax Id of
receiving
entity
Receiving related entity Country of
origin
Nature of
relationship Transaction description

53
9.3.- Key management compensation The details of the amounts paid to the members of the Board and Key Management of the Parent Company is below:
The total compensation paid to managers and main executives of the Parent Company is made of the base salary plus the statutory reward on profits. Management is made of first-line Managers, Area Managers, Medical Directors and Area Sub-Managers, and therefore its change is made relevant through the increase in the amount of professionals hired as a result of new businesses. Performance bonuses are only granted after the appraisals that the Board carries annually. The amount of said bonuses paid at December 31, 2014 amounted to Th$ 62,498 (As of December 31, 2013 it amounted to Th$ 149,215). NOTE 10.- INVENTORY The breakdown of this accounting area is the following:
Following is a chart with additional information about inventory:
Concepts Currency 12/31/2014 12/31/2013
Board members compensation Th$ 149,703 200,326
Key management personnel Th$ 8,154,183 8,086,120
12/31/2014 12/31/2013
Th$ Th$
Drugs 1,072,436 973,016
Clinical supplies 827,469 693,403
Consumables 339,015 575,101
Other Inventory 360,495 165,575
Total 2,599,415 2,407,095
Classes of Inventory
12/31/2014 12/31/2013
Th$ Th$
Inventory costs recognized as expense during the period (16,339,243) (16,718,546)
Amount of inventory w rite-dow ns (23,857) (4,932)
Inventory additional information

54
NOTE 11.- INTANGIBLE ASSETS 11.1.- The breakdown of this accounting area is the following:
As the main intangible asset is "Patents, Trademarks and Other Rights," following is the breakdown of this line at net value, at the closing date of these financial statements:
Within Patents, Trademarks and Other rights, the most significant items are the brands with an indefinite useful life. These will continue to be used and will generate economic benefits for the head company and the whole of Group Bupa Chile. Of those intangibles with definite useful life, these are in the range disclosed in note 11.2 below, and those with an indefinite useful life have an impairment test applied as set in note 2.28 a).
12/31/2014 12/31/2013
Th$ Th$
Client Portfolio, Net 2,838,577 2,337,751
Identif iable intangible assets, net 245,355 344,013
Patents, Trademarks and Other Rights, Net 90,232,869 89,265,182
Softw are, Net 12,260,444 11,010,937
Other Identif iable Intangible Assets, Net 180,825 329,626
Total Intangible Assets, Net 105,758,070 103,287,509
12/31/2014 12/31/2013
Th$ Th$
Client Portfolio, Gross 7,061,080 6,246,472
Identif iable intangible assets, Gross 351,237 344,013
Patents, Trademarks and Other Rights, Gross 90,381,288 89,382,954
Softw are, Net 25,312,274 22,152,358
Other Identif iable Intangible Assets, Gross 222,986 361,257
Total Intangible Assets, Gross 123,328,865 118,487,054
12/31/2014 12/31/2013
Th$ Th$
Client Portfolio (4,222,503) (3,908,721)
Identif iable intangible assets (105,882) 0
Patents, Trademarks and Other Rights (148,419) (117,772)
Softw are (13,051,830) (11,141,421)
Other Identif iable Intangible Assets (42,161) (31,631)
Total accumulated amortization and impairment (17,570,795) (15,199,545)
Intangible Assets, Net
Intangible Assets, Gross
Accumulated Amortization and Impairment
Useful 12/31/2014 12/31/2013
Life Th$ Th$
Isapre Cruz Blanca Indefinite 37,387,671 37,387,670
Clínica Antofagasta Indefinite 5,899,437 5,899,437
Clínica Reñaca Indefinite 3,765,483 3,765,483
Clínica San José Arica Indefinite 1,337,360 1,337,360
Clinical Service Indefinite 568,280 568,280
Integramédica Indefinite 36,371,877 36,376,855
Sonorad Indefinite 1,554,728 1,295,607
Doctora Pilar Gazmuri Indefinite 367,616 367,616
MediPerú Indefinite 526,945 512,768
Anglolab Indefinite 2,453,472 1,754,106
Total accumulated amortization and impairment 90,232,869 89,265,182
Brands

55
11.2.- Details of useful lives applied to the intangibles is the following:
11.3.- Intangibles roll-forward is as follows:
11.4.- Intangible amortization charges to income are the following:
Estimated useful lives or amortization rates
used
Minimum Life Maximum Life
Trademarks 15 15
Client portfolio 12 58
Patents and other rights 1 48
Software 1 48
Licenses and programs 1 5
Client
Portfolio, Net
Identifiable
Intangible Assets,
Net
Patents,
trademarks
and other
rights
Software,
Net
Other
identifiable
intangible assets,
Net
Total
Intangible
Assets, Net
Th$ Th$ Th$ Th$ Th$ Th$
Opening Balance 2,337,751 344,013 89,265,182 11,010,937 329,626 103,287,509
External and internal reclassif ications 752,629 0 0 182,305 (182,305) 752,629
Additions 0 7,224 12,094,311 3,037,137 2,394 15,141,066
Divestments 0 0 0 (447) 0 (447)
Amortization (313,783) (105,882) (21,977) (1,964,586) (9,905) (2,416,133)
Increase (Decrease) due to change foreign exchange rate 61,980 0 (70,649) (4,902) 41,015 27,444
Other increase (decrease) 0 0 (11,033,998) 0 0 (11,033,998)
Balances at 12/31/2014 2,838,577 245,355 90,232,869 12,260,444 180,825 105,758,070
Client
Portfolio, Net
Identifiable
Intangible Assets,
Net
Patents,
trademarks
and other
rights
Software,
Net
Other
identifiable
intangible assets,
Net
Total
Intangible
Assets, Net
Th$ Th$ Th$ Th$ Th$ Th$
Opening Balance 2,657,633 221,329 85,740,085 7,497,630 0 96,116,677
External and internal reclassif ications 0 0 1,295,043 (181,742) 182,305 1,295,606
Additions 0 122,684 2,247,260 5,700,757 147,321 8,218,022
Divestments 0 0 0 (145,858) 0 (145,858)
Amortization (319,882) 0 (15,396) (1,904,750) 0 (2,240,028)
Increase (Decrease) due to change foreign exchange rate
changes 0 0 (1,810)
0 0 (1,810)
Other Increase (Decrease) 0 0 0 44,900 0 44,900
Balances at 12/31/2013 2,337,751 0 89,265,182 11,010,937 329,626 103,287,509
Current Period
Prior Period
1/1/2014 1/1/2013
12/31/2014 12/31/2013
Th$ Th$
Cost of sales 695,005 582,887
Management expense 1,407,345 1,337,261
Other earnings (loss) 313,783 319,880
TOTAL 2,416,133 2,240,028
Line item in income statement that includes the
amortization of identifiable intangible assets
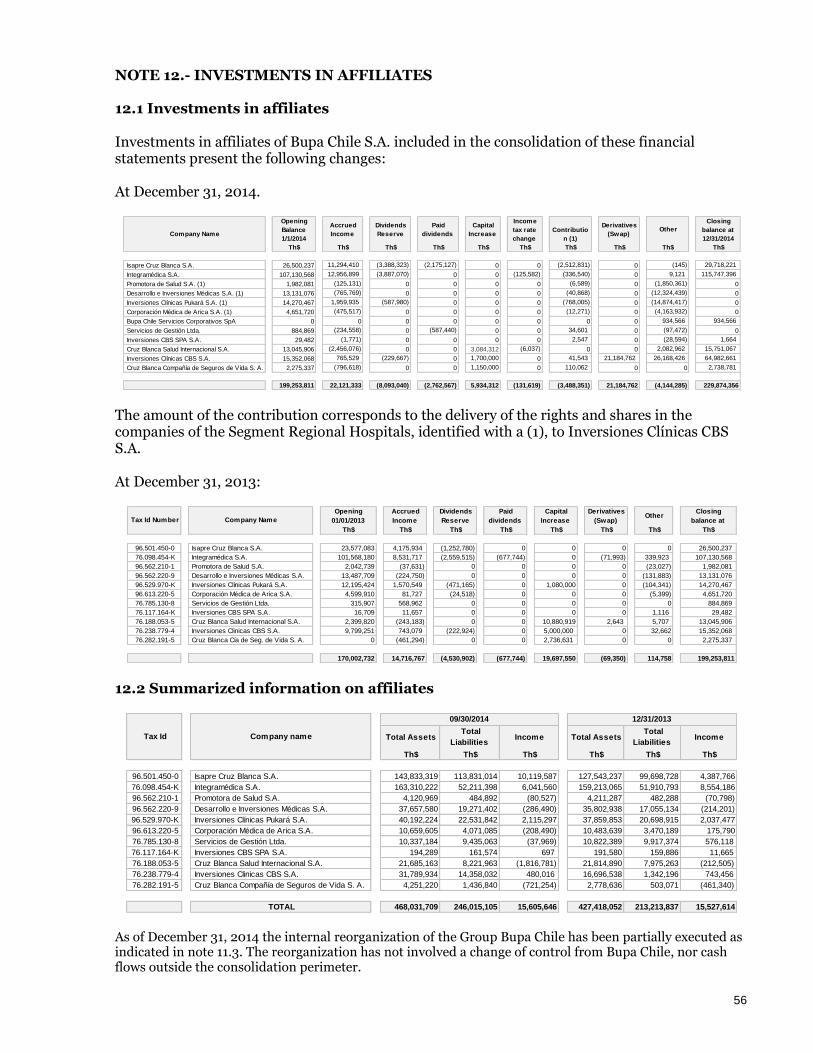
56
NOTE 12.- INVESTMENTS IN AFFILIATES 12.1 Investments in affiliates Investments in affiliates of Bupa Chile S.A. included in the consolidation of these financial statements present the following changes: At December 31, 2014.
The amount of the contribution corresponds to the delivery of the rights and shares in the companies of the Segment Regional Hospitals, identified with a (1), to Inversiones Clínicas CBS S.A. At December 31, 2013:
12.2 Summarized information on affiliates
As of December 31, 2014 the internal reorganization of the Group Bupa Chile has been partially executed as indicated in note 11.3. The reorganization has not involved a change of control from Bupa Chile, nor cash flows outside the consolidation perimeter.
Opening
Balance
1/1/2014
Th$ Th$ Th$ Th$ Th$ Th$ Th$ Th$ Th$ Th$
Isapre Cruz Blanca S.A. 26,500,237 11,294,410 (3,388,323) (2,175,127) 0 0 (2,512,831) 0 (145) 29,718,221
Integramédica S.A. 107,130,568 12,956,899 (3,887,070) 0 0 (125,582) (336,540) 0 9,121 115,747,396
Promotora de Salud S.A. (1) 1,982,081 (125,131) 0 0 0 0 (6,589) 0 (1,850,361) 0
Desarrollo e Inversiones Médicas S.A. (1) 13,131,076 (765,769) 0 0 0 0 (40,868) 0 (12,324,439) 0
Inversiones Clínicas Pukará S.A. (1) 14,270,467 1,959,935 (587,980) 0 0 0 (768,005) 0 (14,874,417) 0
Corporación Médica de Arica S.A. (1) 4,651,720 (475,517) 0 0 0 0 (12,271) 0 (4,163,932) 0
Bupa Chile Servicios Corporativos SpA 0 0 0 0 0 0 0 0 934,566 934,566
Servicios de Gestión Ltda. 884,869 (234,558) 0 (587,440) 0 0 34,601 0 (97,472) 0
Inversiones CBS SPA S.A. 29,482 (1,771) 0 0 0 0 2,547 0 (28,594) 1,664
Cruz Blanca Salud Internacional S.A. 13,045,906 (2,456,076) 0 0 3,084,312 (6,037) 0 0 2,082,962 15,751,067
Inversiones Clínicas CBS S.A. 15,352,068 765,529 (229,667) 0 1,700,000 0 41,543 21,184,762 26,168,426 64,982,661
Cruz Blanca Compañía de Seguros de Vida S. A. 2,275,337 (796,618) 0 0 1,150,000 0 110,062 0 0 2,738,781
199,253,811 22,121,333 (8,093,040) (2,762,567) 5,934,312 (131,619) (3,488,351) 21,184,762 (4,144,285) 229,874,356
Capital
Increase
Derivatives
(Swap) Other
Company Name
Accrued
Income
Dividends
Reserve
Paid
dividends
Income
tax rate
change
Contributio
n (1)
Closing
balance at
12/31/2014
Opening
01/01/2013
Th$ Th$ Th$ Th$ Th$ Th$ Th$ Th$
96.501.450-0 Isapre Cruz Blanca S.A. 23,577,083 4,175,934 (1,252,780) 0 0 0 0 26,500,237
76.098.454-K Integramédica S.A. 101,568,180 8,531,717 (2,559,515) (677,744) 0 (71,993) 339,923 107,130,568
96.562.210-1 Promotora de Salud S.A. 2,042,739 (37,631) 0 0 0 0 (23,027) 1,982,081
96.562.220-9 Desarrollo e Inversiones Médicas S.A. 13,487,709 (224,750) 0 0 0 0 (131,883) 13,131,076
96.529.970-K Inversiones Clínicas Pukará S.A. 12,195,424 1,570,549 (471,165) 0 1,080,000 0 (104,341) 14,270,467
96.613.220-5 Corporación Médica de Arica S.A. 4,599,910 81,727 (24,518) 0 0 0 (5,399) 4,651,720
76.785.130-8 Servicios de Gestión Ltda. 315,907 568,962 0 0 0 0 0 884,869
76.117.164-K Inversiones CBS SPA S.A. 16,709 11,657 0 0 0 0 1,116 29,482
76.188.053-5 Cruz Blanca Salud Internacional S.A. 2,399,820 (243,183) 0 0 10,880,919 2,643 5,707 13,045,906
76.238.779-4 Inversiones Clinicas CBS S.A. 9,799,251 743,079 (222,924) 0 5,000,000 0 32,662 15,352,068
76.282.191-5 Cruz Blanca Cía de Seg. de Vida S. A. 0 (461,294) 0 0 2,736,631 0 0 2,275,337
170,002,732 14,716,767 (4,530,902) (677,744) 19,697,550 (69,350) 114,758 199,253,811
Accrued
Income
Closing
balance at
Dividends
Reserve
Capital
Increase
Paid
dividends Tax Id Number Company Name
Derivatives
(Swap) Other
Th$ Th$ Th$ Th$ Th$ Th$
96.501.450-0 Isapre Cruz Blanca S.A. 143,833,319 113,831,014 10,119,587 127,543,237 99,698,728 4,387,766
76.098.454-K Integramédica S.A. 163,310,222 52,211,398 6,041,560 159,213,065 51,910,793 8,554,186
96.562.210-1 Promotora de Salud S.A. 4,120,969 484,892 (80,527) 4,211,287 482,288 (70,798)
96.562.220-9 Desarrollo e Inversiones Médicas S.A. 37,657,580 19,271,402 (286,490) 35,802,938 17,055,134 (214,201)
96.529.970-K Inversiones Clínicas Pukará S.A. 40,192,224 22,531,842 2,115,297 37,859,853 20,698,915 2,037,477
96.613.220-5 Corporación Médica de Arica S.A. 10,659,605 4,071,085 (208,490) 10,483,639 3,470,189 175,790
76.785.130-8 Servicios de Gestión Ltda. 10,337,184 9,435,063 (37,969) 10,822,389 9,917,374 576,118
76.117.164-K Inversiones CBS SPA S.A. 194,289 161,574 697 191,580 159,886 11,665
76.188.053-5 Cruz Blanca Salud Internacional S.A. 21,685,163 8,221,963 (1,816,781) 21,814,890 7,975,263 (212,505)
76.238.779-4 Inversiones Clinicas CBS S.A. 31,789,934 14,358,032 480,016 16,696,538 1,342,196 743,456
76.282.191-5 Cruz Blanca Compañía de Seguros de Vida S. A. 4,251,220 1,436,840 (721,254) 2,778,636 503,071 (461,340)
TOTAL 468,031,709 246,015,105 15,605,646 427,418,052 213,213,837 15,527,614
Tax Id Company name
09/30/2014 12/31/2013
Total Assets Total
Liabilities Income Total Assets
Total
Liabilities Income

57
On December 31, 2014, Cruz Blanca Salud Internacional S.A. made a capital increase of $3,084,311,659 issuing 3,916,500 shares which were entirely subscribed and paid for by Bupa Chile S.A. This explains the change in direct and indirect percentage share in these financial statements. On June 5, 2014, Bupa Chile S.A. paid Th$ 1,1700,000 in Inversiones Clínicas CBS S.A. as capital contribution. On March 12, 2014, Bupa Chile S.A. paid Th$ 1,150,000 as capital increase in Cruz Blanca Compañía de Seguros de Vida S.A. On December 31, 2013, Bupa Chile S.A. paid Th$ 1,080,000 as capital increase in Inversiones Clínicas Pukará S.A. On December 23, 2013, Bupa Chile S.A. made capital contributions amounting to Th$ 10,880,919 to CBS International for the execution of its expansion plan in Peru. During the first half of 2013 the Head Company Bupa Chile S.A. established the affiliate company Cruz Blanca Compañía de Seguros de Vida S.A., paying a capital contribution of $2,736,631. During the first-half of 2013 Bupa Chile S.A. has made capital contributions of Th$ 5,000,000 in Inversiones Clínicas CBS S.A.
12.3 Joint arrangements During June 2013 Servicios de Gestión Limitada entered into a joint agreement with Clinical Market S.A., with a contribution to the shared account of UF 12,500. This is presented as an accounts receivable under Other Non-Financial Assets.
NOTE 13.- BUSINESS COMBINATIONS During 2014 there have been no processes that qualify as a "business combination" in accordance to IFRS 3. Acquisitions during 2013 1) Acquisition of Mediperú S.A. Through the essential matter filed on September 10, 2013, Bupa Chile S.A. communicated that its subsidiary Cruz Blanca Salud Perú S.A.C. it had acquired 100% of the share ownership of the companies Mediperú S.A. and Panaholdings Investment Corp. Both companies carry - under the brand "MediPerú" - in the Republic of Peru the business of diagnosis through imaging, MRI, tomography, X-rays and laboratory sample taking in the city of Lima. The purchase price amounted to the US$ 5.8 million, amount which was financed in its entirety with funds of the acquiring company.

58
2) Acquisition of Anglolab S.A. On July 16, 2013 the Peruvian subsidiary Cruz Blanca Salud Perú S.A.C. entered in a share purchase agreement through which it acquired 70% of the share ownership - and therefore, control - of the company Anglolab S.A. a company established under the laws of the Republic of Peru, whose business is to render clinical laboratory, blood bank and pathologic anatomy services in different hospitals and health centers in Lima and other provinces of the Republic of Peru. The purchase price amounted to US$ 6 million, and is subject to financial and accounting adjustments. The price was paid with funds of the acquiring entity.
8/31/2013
Th$
Cash 3,021,787
Contingent payment 164,824
3,186,611
Cash and cash equivalents 10,124
Other assets 894,610
Goodwill 0
Net property, plant and equipment 3,790,433
Accounts payable (581,843)
Other liabilities (557,849)
3,555,475
3,555,475
Non-controlling interest 0
Bargain purchase (368,864)
3,186,611
Cruz Blanca Salud Perú S.A.C. (100%)
MediPerú, Panaholding
Total
Business combination cost
Total cost of business combination
Identifiable assets acquired and liabilities assumed
Net assets
7/16/2013
Th$
Cash 3,249,384
Contingent payment 600,145
3,849,529
Cash and cash equivalents 45,329
Other assets 3,634,925
Net property, plant and equipment 1,303,014
Accounts payable (922,876)
Other liabilities (861,994)
3,198,398
2,238,879
Non-controlling interest (959,520)
Goodwill 1,610,651
2,890,010Total
Anglolab
Business combination cost
Total cost of business combination
Identifiable assets acquired and liabilities assumed
Cruz Blanca Salud Perú S.A.C. (70%)
Net assets

59
NOTE 14.- GOODWILL 14.1.- The breakdown of this accounting area is the following:
14.2.- The roll-forward of Goodwill is the following:
(1) Additions at December 31, 2013 consist of:
Subsequent movements of goodwill are generated in the context of purchase accounting of IFRS 3. in the case of Clinical Service S.A. the compliance with the 12-month period at December 31, 2013. In the case of Sonorad S.A. this term ended on September 2013. In the case of the acquisitions of 2013 made through CBS Perú, as part of CBS Internacional S.A., the updating of the process concludes in July 2014 for Anglolab S.A. and in September 2014 for MediPeru S.A.
12/31/2014 12/31/2013
Th$ Th$
Goodw ill, Net 83,530,937 83,533,337
Total Goodwill Net 83,530,937 83,533,337
12/31/2014 12/31/2013
Th$ Th$
Goodw ill, Gross 83,530,937 83,533,337
Total Goodwill Gross 83,530,937 83,533,337
12/31/2014 12/31/2013
Th$ Th$
Purchased goodw ill 0 0
Total Accumulated amortization and impairment 0 0
Goodwill, Net
Goodwill, Gross
Accumulated amortization and impairment
Goodwill, Net
Th$
Opening balance at 01/01/2014 83,533,337
Increase (decrease) from changes in the foreign exchange rate (2,400)
Total at 12/31/2014 83,530,937
Goodwill, Net
Th$
Opening balance at 01/01/2013 85,123,348
Additions and reclassif ications (1) (1,590,012)
Total at 12/31/2013 83,533,336
Changes in Goodwill 2014
Changes in Goodwill 2012
1,531,722
(1,826,127)
(1,295,607)
(1,590,012) Total at 12/31/2013
Additions and reclassifications as of December 31, 2013 Th$
Direct Goodw ill in acquisitions made by CBS Internacional S.A.
Decrease in minority interest
Goodw ill in acquisition of Sonorad S.A. allocated as trademark

60
The abovementioned goodwill correspond to the amount determined at the date of change of control and therefore when the 12-month period for the "acquisition accounting" period starts, as per IFRS 3. 14.3 Impairment test on goodwill At each annual closing of Group CBS closing, a qualified third party is charged with the assessment and application of an impairment test on each goodwill that has been in the financial statements for over a year. Goodwill acquired during the period are valued and allocated as required by IFRS 3 and presented in Note 13. Goodwill current at the period's end and included in a Cash Generating Unit (CGU) are the following and are shown next to their impairment tests.
(1) Direct and indirect goodwill are made of the amount directly generated in the business combination
and the amounts that already existed in the accounting of the acquired companies. The impairment tests applied at the closing of the financial statements to the goodwill detailed above indicate that their value in use are greater than the book values of the CGU, and therefore there is no impairment of said investments. Variables used in the calculation of the value in use of the CGU are made from the characteristics of each business unit and on the basis of the requirements in paragraph 134 d) of IAS 36, as described below:
a) Key assumptions for the projected cash flows: In the Hospital and Outpatients segments the main variables are the occupancy rates of installations and medical equipment, as well as the ability to transfer prices, mainly, the fluctuations in the costs of personal and supplies; in the Insurer segment the variables are the average accident rates of contributors and beneficiaries, and the commercial ability to adjust the contributions.
b) Method used to estimate future values of key variables: this is based on the historic information
analysis, as well as assumptions and management's business plans, plus publicly available information on the industry and regulations.
c) Cash flows projection term: based on IAS 36, assessments are made each five years, with the sole
exception of the hospital segment which is made each 10 years, in order to link the cash flows to the target occupancy levels and therefore avoid inferences related to perpetuity growth rate higher than zero after the fifth year.
d) Perpetuity growth rates: the impairment analyses do not consider perpetuity growth rates other than zero.
e) Discount rates: the discount rates used in the different impairment tests are those derived from
the application of the Capital Pricing Method (CAPM) and therefore the rates correspond to the Weighted Average Cost of Capital (WACC).
(2) The CGUs listed in the chart correspond to recent acquisitions and there is no evidence of impairment
at the closing date of these financial statements.
Direct
goodwill
(1)
Indirect
goodwill
(1)
Brand
Net value of
assets at fair
value in
affiliate
C.G.U. Book
Value
Recoverabl
e value
(Value in
use)CGU Legal entity name Commercial name Th$ Th$ Th$ Th$ Th$ Th$
1 Isapre Cruz Blanca S.A. Isapre Cruz Blanca 8,779,115 0 37,387,671 29,706,630 75,873,416 130,102,233
2 Inversiones Clínicas Pukará S.A. Clínica Antofagasta 2,616,391 0 5,899,437 27,275,645 35,791,473 47,543,923
3 Desarrollo e Inversiones Médicas S.A. Clínica Reñaca 4,586,287 0 3,765,483 24,565,794 32,917,564 40,432,050
4 Corporación Médica de Arica S.A. Clínica San José Arica 288,828 0 1,337,360 7,608,073 9,234,261 11,470,470
5 Servicios Clínicos Domiciliarios S.A. Clinical Service 1,007,067 0 568,280 2,061,124 3,636,471 10,276,968
6 Sonorad S.A. Sonorad 1,749,083 3,044,690 1,554,728 6,178,201 12,526,702 24,503,342
7 Centro Diagnostico Doctora Pilar Gazmuri S.A. Doctora Pilar Gazmuri 420,310 0 367,616 879,006 1,666,932 2,043,969
8 Integramédica S.A. Integramédica 55,121,804 3,158,407 36,371,877 41,635,428 136,287,516 252,211,406
9 AngloLab S.A. AngloLab 985,356 526,945 37,428,506 38,942,543 114,601,823
10 Mediera S.A. Resomasa 1,773,598 2,453,472 6,658,530 10,240,672 125,868,386
77,327,839 6,203,097 90,232,869 Subtotales
Cash Generating Unit for Impairment Test at 12/31/2013

61
The parameters used in the WACC calculation are obtained from public sources and, therefore, verifiable by any interested third party.
Finally, as the projections are made in a constant value currency, the discount rates are real rates. NOTE 15.- PROPERTY, PLANT AND EQUIPMENT 15.1.- The breakdown of this accounting area is the following:
(1) Construction in progress includes the capitalized financial expense until the beginning of operations of the Clinica Santiago hospital, for an amount of Th$ 653,757.
12/31/2014 12/31/2013
Th$ Th$
Construction in Progress, Net 19,498,967 12,704,160
Land, Net 20,032,079 19,899,424
Buildings, Net 29,091,657 24,467,592
Plant and Equipment, Net 11,362,287 12,403,379
Information technology equipment, Net 3,168,726 2,769,705
Fixed Installations and Accessories, Net 16,538,436 11,797,751
Motor Vehicles, Net 128,192 161,003
Leasehold Improvements, Net 3,845,340 5,056,791
Leased assets, Net 26,252,032 26,362,333
Other Property, Net 2,668,909 1,291,155
Total Property, Plant, and Equipment, Net 132,586,625 116,913,293
12/31/2014 12/31/2013
Th$ Th$
Construction in Progress, Gross 19,498,967 12,704,160
Land, Gross 20,032,079 19,899,424
Buildings, Gross 35,099,452 29,388,132
Plant and Equipment, Gross 49,097,949 50,456,639
Information technology equipment, Gross 8,449,111 8,324,334
Fixed Installations and Accessories, Gross 24,563,267 17,735,889
Motor Vehicles, Gross 270,101 301,135
Leasehold Improvements, Gross 7,184,573 7,422,946
Leased assets, Gross 37,098,404 37,177,790
Other Property, Gross 4,059,996 1,940,463
Total Property, Plant, and Equipment, Gross 205,353,899 185,350,912
12/31/2014 12/31/2013
Th$ Th$
Accumulated Depreciation and Impairment, Buildings (6,007,795) (4,920,540)
Accumulated Depreciation and Impairment, Plant and Equipment (37,735,662) (38,053,260)
Accumulated Depreciation and Impairment, Information technology equipment (5,280,385) (5,554,629)
Accumulated Depreciation and Impairment, Fixed Installations and (8,024,831) (5,938,138)
Accumulated Depreciation and Impairment, Motor Vehicles (141,909) (140,132)
Accumulated Depreciation and Impairment, Leasehold Improvements (3,339,233) (2,366,155)
Accumulated Depreciation and Impairment, Leased assets (10,846,372) (10,815,457)
Accumulated Depreciation and Impairment, Other Property (1,391,087) (649,308)
Total Accumulated Depreciation and Impairment in Property, Plant
and Equipment (72,767,274) (68,437,619)
Classes of Property, Plant and Equipment, Net (Disclosure)
Classes of Property, Plant and Equipment, Gross (Disclosure)
Classes of Accumulated Depreciation and Impairment in Property,
Plant and Equipment (Disclosure)

62
15.2.- The following tables present the reconciliation of changes in property, plant and equipment, by class at December 31, 2014 and December 31, 2013:
Construction
in Progress Land
Buildings,
Net
Plant and
Equipment,
net
IT
Equipment,
net
Fixed
installations and
accessories, net
Motor
vehicles,
Net
Leasehold
Improvements,
Net
Leased
assets
Other Property,
Plant and
Equipment, Net
Property, Plant
and Equipment,
Net
Th$ Th$ Th$ Th$ Th$ Th$ Th$ Th$ Th$ Th$ Th$
Opening balance at 01/01/2014 12,704,160 19,899,424 24,467,592 12,403,379 2,769,705 11,797,751 161,003 5,056,791 26,362,333 1,291,155 116,913,293
External and Internal reclassif ications (7,534,871) 0 4,798,419 1,131,614 82,587 5,996,300 0 (250,579) 311,185 (4,534,655) 0
Additions 14,214,621 0 779,539 862,732 1,056,426 395,327 24,801 12,206 2,147,755 6,063,257 25,556,664
Retirement 0 0 0 (4,889) (9,897) 0 (3,912) 0 0 0 (18,698)
Write offs (47,756) 0 0 (289,421) (117,867) (53,085) (8,651) 0 (17,922) (21,204) (555,906)
Depreciation expense 0 0 (1,060,655) (2,482,279) (839,459) (1,749,265) (45,049) (973,078) (2,885,911) (266,863) (10,302,559)
Increase (Decrease) due to foreign exchange
fluctuations 162,813 132,655 106,762 111,336 (50,822) 69,431 0 0 104,495 137,219 773,889
Other increase (decrease) 0 0 0 (370,185) 278,053 81,977 0 0 230,097 0 219,942
Changes, Total 6,794,807 132,655 4,624,065 (1,041,092) 399,021 4,740,685 (32,811) (1,211,451) (110,301) 1,377,754 15,673,332
Closing balance at 12/31/2014 19,498,967 20,032,079 29,091,657 11,362,287 3,168,726 16,538,436 128,192 3,845,340 26,252,032 2,668,909 132,586,625
Construction
in Progress Land
Buildings,
Net
Plant and
Equipment,
net
IT
Equipment,
net
Fixed
installations and
accessories, net
Motor
vehicles,
Net
Leasehold
Improvements,
Net
Leased
assets
Other Property,
Plant and
Equipment, Net
Property, Plant
and Equipment,
Net
Th$ Th$ Th$ Th$ Th$ Th$ Th$ Th$ Th$ Th$ Th$
Opening balance at 01/01/2013 5,449,123 16,043,107 24,230,908 11,765,990 3,081,391 7,455,708 200,509 5,478,637 22,301,961 561,719 96,569,053
Internal reclassif ications (998,463) 0 375,234 (472,719) (177,684) 2,094,867 0 (138,997) (510,943) (3,647) 167,648
Additions 7,955,021 2,820,558 728 2,159,985 801,968 3,249,353 15,751 728,687 6,767,558 564,460 25,064,069
Acquisition from business combinations 5,754 1,820 159,728 1,283,778 56,291 617,979 0 0 132,026 375,260 2,632,636
Write offs (9,391) 0 0 (40,705) (429) (181,569) (9,725) 0 (164,035) (207) (406,061)
Depreciation expense 0 0 (808,462) (2,277,443) (847,118) (1,374,103) (46,532) (1,009,423) (2,603,213) (174,935) (9,141,229)
Increase (Decrease) from restatement recognized
in equity 0 1,082,255 926,877 0 0 0 0 0 232,986 0 2,242,118
Increase (Decrease) due to foreign exchange
fluctuations 896 (48,316) 19,673 (101,741) (84) (57,306) 0 (2,113) (2,653) (2,981) (194,625)
Other increase (decrease) 301,220 0 (437,094) 86,234 (144,630) (7,178) 1,000 0 208,646 (28,514) (20,316)
Changes, Total 7,255,037 3,856,317 236,684 637,389 (311,686) 4,342,043 (39,506) (421,846) 4,060,372 729,436 20,344,240
Closing balance at 12/31/2013 12,704,160 19,899,424 24,467,592 12,403,379 2,769,705 11,797,751 161,003 5,056,791 26,362,333 1,291,155 116,913,293
Prior period
Current Period

63
15.3.- The Assets subject to financial leases are the following:
15.4.- Restrictions on Property, plant and equipment Some affiliates of the Group hold real estate mortgages (See Note 30). NOTE 16.- INVESTMENT PROPERTY The composition and movement of this accounting area at December 31, 2014 and at December 31, 2013 is the following: 16.1.- Composition and changes of investment property.
Investment property of the Group corresponds to physical space destined to be exploited as leases, in which contracts it is established the responsibility of the lessor to maintain the assets. Depreciation is calculated using the straight-line method, and the useful life assigned to these goods is of 60 years. The book values do not differ significantly of the fair values. 16.2.- Investment property income and expense
12/31/2014 12/31/2013
Th$ Th$
Buildings in f inancial lease 6,243,419 6,140,972
Plant and equipment in f inancial lease 17,562,881 17,651,853
IT equipment in f inancial lease 2,371,780 2,315,718
Other property, plant and equipment in f inancial lease 73,952 253,790
Total 26,252,032 26,362,333
Property, Plant and Equipment in financial lease,
Net
12/31/2014 12/31/2013
Th$ Th$
Opening balance 1,768,412 1,803,014
Depreciation expense (40,134) (40,134)
Other increase (decrease), investment property 0 5,532
Changes in investment properties, fair value model, total (40,134) (34,602)
Total 1,728,278 1,768,412
Investment property, Fair Value Method
1/1/2014 1/1/2013
12/31/2014 12/31/2013
Th$ Th$
Income amount from lease of investment properties 93,570 78,081
Income and expense, investment property

64
NOTE 17.- CURRENT TAX ASSETS AND LIABILITIES a) Following is a breakdown of current tax assets and liabilities, by Company:
b) Following is a breakdown of current tax assets and liabilities by concept:
Asset Liability
Th$ Th$
Bupa Chile S.A. 2,292,366 0
Isapre Cruz Blanca S.A. 1,316,866 0
Integramédica S.A. 1,018,008 426,066
Inversiones CBS SPA. 0 581
Bupa Chile Servicios Corporativo Spa. 293,540 0
Cruz Blanca Salud Internacional S.A. 85,611 335,317
Inversiones Clínicas CBS S.A. 1,553,915 136,571
Cruz Blanca Compañía de Seguros de Vida S.A. 132 0
Totals 6,560,438 898,535
Net consolidated asset (liability) position 5,661,903
Asset Liability
Th$ Th$
Cruz Blanca Salud S.A. 840,694 0
Promotora de Salud S.A. 0 1,037
Desarrollo e Inversiones Médicas S.A. 410,637 26,512
Inversiones Clínica Pukará S.A. 282,634 225,156
Isapre Cruz Blanca S.A. 2,885,902 0
Integramédica S.A. 2,380,254 82,995
Corporación Medica de Arica S.A. 519,659 4,660
Inversiones CBS SPA. 42 0
Servicios de Gestión Limitada 25,168 103,155
Cruz Blanca Salud Internacional S.A. 526,972 108,389
Inversiones Clínicas CBS S.A. 60,007 0
Cruz Blanca Compañía de Seguros de Vida S.A. 4,321 0
Totals 7,936,290 551,904
Net consolidated asset (liability) position 7,384,386
Current tax assets and liabilities
Current tax assets and liabilities
12/31/2014
Balance
12/31/2013
Balance
12/31/2014 12/31/2013
Th$ Th$
Assets
Monthly tax prepayments 5,184,347 5,063,124
Absorbed profits prepayment 2,378,433 1,638,721
Training expense 367,958 275,008
Arica Law 323,463 336,352
Prior year income tax 2,616,246 1,564,806
Total assets 10,870,447 8,878,011
Liabilities
Income tax reserve 5,180,197 1,440,738
Other taxes payable 28,347 52,887
Total liabilities 5,208,544 1,493,625
Total net asset (liability) position 5,661,903 7,384,386
Current tax assets and liabilities

65
NOTE 18.- EMPLOYEE BENEFITS The breakdown of this accounting area is the following:
NOTE 19.- DEFERRED INCOME TAX 19.1.- Deferred tax balances, by company is the following:
Current Non-Current Current Non-Current
Th$ Th$ Th$ Th$
Performance Bonus Reserve 4,612,725 0 856,307 0
Total 4,612,725 0 856,307 0
12/31/2014 12/31/2013
Area
Asset Liability
Th$ Th$
Bupa Chile S.A. 0 10,204,264
Isapre Cruz Blanca S.A. 0 9,332,471
Integramédica S.A. 9,005,137 3,044,293
Bupa Chile Servicios Corporativo Spa. 188,687 0
Cruz Blanca Internacional S.A 1,358,246 1,377,290
Inversiones Clínicas CBS S.A 847,147 5,490,492
Cruz Blanca Compañía de Seguros de Vida S.A 507,814 0
TOTALS 11,907,031 29,448,810
Asset Liability
Th$ Th$
Cruz Blanca Salud S.A. 0 8,550,916
Desarrollo e Inversiones Médicas S.A. 260,726 532,000
Inversiones Clínicas Pukará S.A. 58,350 1,096,568
Isapre Cruz Blanca S.A. 0 7,333,167
Integramédica S.A. 3,009,033 892,152
Corporación Médica de Arica S.A 15,512 133,797
Inversiones CBS SPA 0 6,231
Servicios de Gestión Limitada 434,586 22,565
Cruz Blanca Internacional S.A 729,198 1,484,150
Inversiones Clínicas CBS S.A 191,620 0
Cruz Blanca Compañía de Seguros de Vida S.A 126,718 0
TOTALS 4,825,743 20,051,546
Deferred taxes
Deferred taxes
Balance
12/31/2014
12/31/2013
Balance
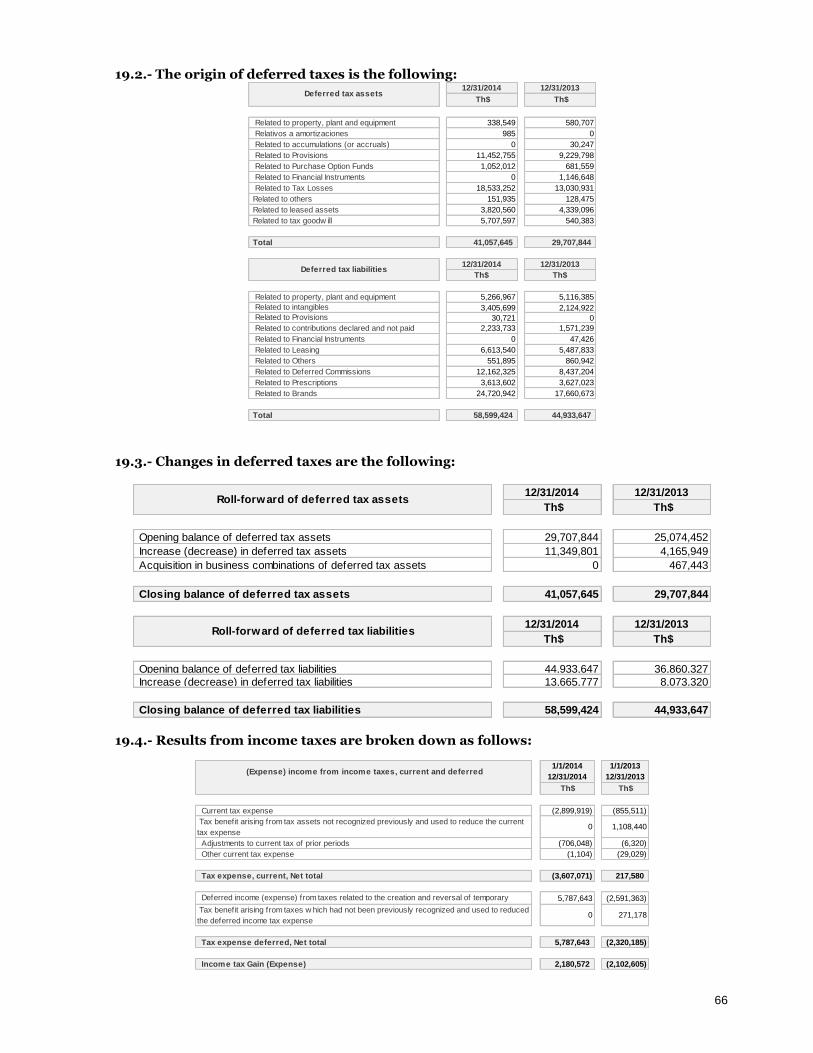
66
19.2.- The origin of deferred taxes is the following:
19.3.- Changes in deferred taxes are the following:
19.4.- Results from income taxes are broken down as follows:
12/31/2014 12/31/2013
Th$ Th$
Related to property, plant and equipment 338,549 580,707
Relativos a amortizaciones 985 0
Related to accumulations (or accruals) 0 30,247
Related to Provisions 11,452,755 9,229,798
Related to Purchase Option Funds 1,052,012 681,559
Related to Financial Instruments 0 1,146,648
Related to Tax Losses 18,533,252 13,030,931
Related to others 151,935 128,475
Related to leased assets 3,820,560 4,339,096
Related to tax goodw ill 5,707,597 540,383
Total 41,057,645 29,707,844
12/31/2014 12/31/2013
Th$ Th$
Related to property, plant and equipment 5,266,967 5,116,385
Related to intangibles 3,405,699 2,124,922
Related to Provisions 30,721 0
Related to contributions declared and not paid 2,233,733 1,571,239
Related to Financial Instruments 0 47,426
Related to Leasing 6,613,540 5,487,833
Related to Others 551,895 860,942
Related to Deferred Commissions 12,162,325 8,437,204
Related to Prescriptions 3,613,602 3,627,023
Related to Brands 24,720,942 17,660,673
Total 58,599,424 44,933,647
Deferred tax assets
Deferred tax liabilities
12/31/2014 12/31/2013
Th$ Th$
Opening balance of deferred tax assets 29,707,844 25,074,452
Increase (decrease) in deferred tax assets 11,349,801 4,165,949
Acquisition in business combinations of deferred tax assets 0 467,443
Closing balance of deferred tax assets 41,057,645 29,707,844
12/31/2014 12/31/2013
Th$ Th$
Opening balance of deferred tax liabilities 44,933,647 36,860,327
Increase (decrease) in deferred tax liabilities 13,665,777 8,073,320
Closing balance of deferred tax liabilities 58,599,424 44,933,647
Roll-forward of deferred tax assets
Roll-forward of deferred tax liabilities
1/1/2014 1/1/2013
12/31/2014 12/31/2013
Th$ Th$
Current tax expense (2,899,919) (855,511)
Tax benefit arising from tax assets not recognized previously and used to reduce the current
tax expense 0 1,108,440
Adjustments to current tax of prior periods (706,048) (6,320)
Other current tax expense (1,104) (29,029)
Tax expense, current, Net total (3,607,071) 217,580
Deferred income (expense) from taxes related to the creation and reversal of temporary
differences
5,787,643 (2,591,363)
Tax benefit arising from taxes w hich had not been previously recognized and used to reduced
the deferred income tax expense 0 271,178
Tax expense deferred, Net total 5,787,643 (2,320,185)
Income tax Gain (Expense) 2,180,572 (2,102,605)
(Expense) income from income taxes, current and deferred
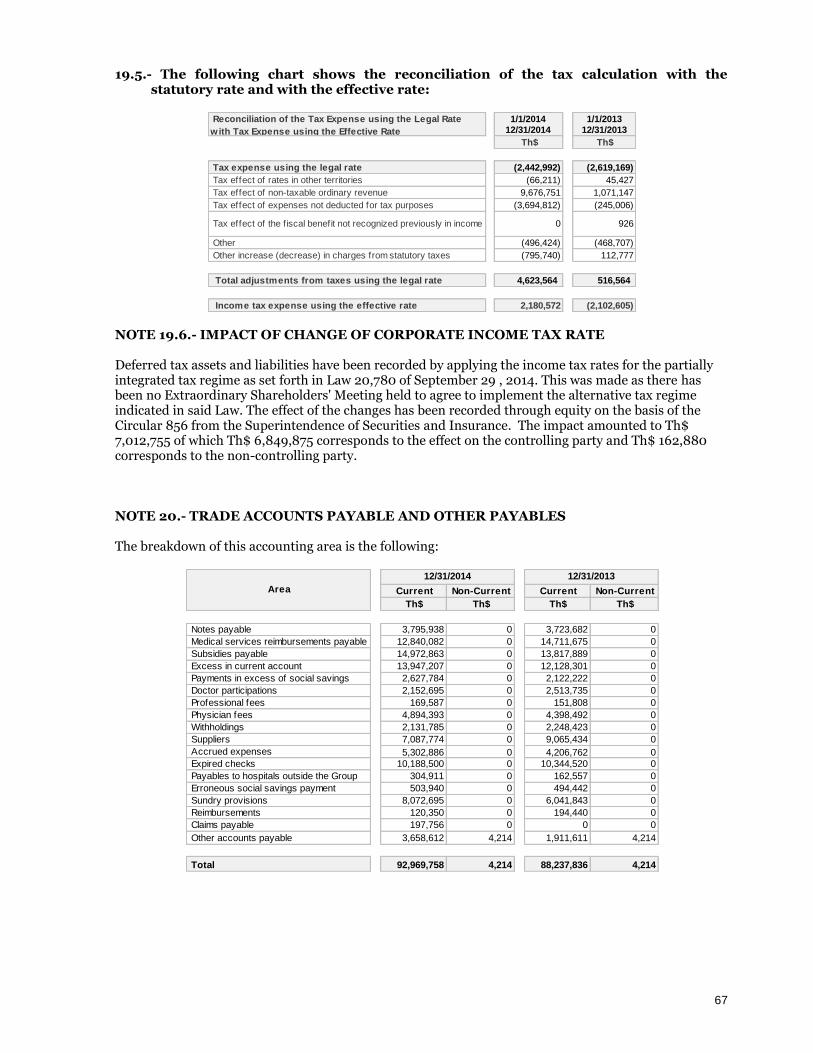
67
19.5.- The following chart shows the reconciliation of the tax calculation with the statutory rate and with the effective rate:
NOTE 19.6.- IMPACT OF CHANGE OF CORPORATE INCOME TAX RATE Deferred tax assets and liabilities have been recorded by applying the income tax rates for the partially integrated tax regime as set forth in Law 20,780 of September 29 , 2014. This was made as there has been no Extraordinary Shareholders' Meeting held to agree to implement the alternative tax regime indicated in said Law. The effect of the changes has been recorded through equity on the basis of the Circular 856 from the Superintendence of Securities and Insurance. The impact amounted to Th$ 7,012,755 of which Th$ 6,849,875 corresponds to the effect on the controlling party and Th$ 162,880 corresponds to the non-controlling party.
NOTE 20.- TRADE ACCOUNTS PAYABLE AND OTHER PAYABLES The breakdown of this accounting area is the following:
1/1/2014 1/1/2013
12/31/2014 12/31/2013
Th$ Th$
Tax expense using the legal rate (2,442,992) (2,619,169)
Tax effect of rates in other territories (66,211) 45,427
Tax effect of non-taxable ordinary revenue 9,676,751 1,071,147
Tax effect of expenses not deducted for tax purposes (3,694,812) (245,006)
Tax effect of the f iscal benefit not recognized previously in income 0 926
Other (496,424) (468,707)
Other increase (decrease) in charges from statutory taxes (795,740) 112,777
Total adjustments from taxes using the legal rate 4,623,564 516,564
Income tax expense using the effective rate 2,180,572 (2,102,605)
Reconciliation of the Tax Expense using the Legal Rate
w ith Tax Expense using the Effective Rate
Current Non-Current Current Non-Current
Th$ Th$ Th$ Th$
Notes payable 3,795,938 0 3,723,682 0
Medical services reimbursements payable 12,840,082 0 14,711,675 0
Subsidies payable 14,972,863 0 13,817,889 0
Excess in current account 13,947,207 0 12,128,301 0
Payments in excess of social savings 2,627,784 0 2,122,222 0
Doctor participations 2,152,695 0 2,513,735 0
Professional fees 169,587 0 151,808 0
Physician fees 4,894,393 0 4,398,492 0
Withholdings 2,131,785 0 2,248,423 0
Suppliers 7,087,774 0 9,065,434 0
Accrued expenses 5,302,886 0 4,206,762 0
Expired checks 10,188,500 0 10,344,520 0
Payables to hospitals outside the Group 304,911 0 162,557 0
Erroneous social savings payment 503,940 0 494,442 0
Sundry provisions 8,072,695 0 6,041,843 0
Reimbursements 120,350 0 194,440 0
Claims payable 197,756 0 0 0
Other accounts payable 3,658,612 4,214 1,911,611 4,214
Total 92,969,758 4,214 88,237,836 4,214
12/31/2014 12/31/2013
Area

68
NOTE 21.- PROVISIONS 21.1.- The breakdown of this accounting area is the following:
21.2.- Following is the roll-forward of provision balances:
NOTE 22.- NET EQUITY 22.1.- Subscribed and paid-in capital As of December 31, 2014 the authorized, subscribed and paid in capital of the Company amounts to Th$ 65,253,465, made of 637,650,000 shares. 22.2.- Shares As of December 31, 2014, 642,000,000 shares represent the Shareholders’ capital, of which 637,650,000 are subscribed and paid. 22.3.- Dividends At December 31, 2014, the dividends policy of the Company is to distribute at least a 30 per cent of the net profits that the balance sheet reflects, among the shareholders, as a dividend in cash in proportion of their share ownership percentage. However, in case of reaching an unanimous agreement (of all issued shares) in the corresponding meeting, a smaller percentage may be distributed or it could be agreed to not perform a dividends distribution. By agreement adopted by the absolute majority of the shares present at a shareholders’ meeting, it can be agreed that the portion of the profits that is not destined to dividends payable during the period, either as minimum or additional dividends, may be used in capital
Current Non-current Current Non-current
Th$ Th$ Th$ Th$
Health expenses provision 26,436,469 0 21,488,010 0
Subsidy expenses provision 1,944,417 0 1,750,180 0
Ongoing risk reserves provision 527,445 0 130,670 0
Claims reserves provision 419,975 0 39,201 0
Other provisions 33,574 0 39,469 0
Total 29,361,880 0 23,447,530 0
12/31/2014 12/31/2013
Classes of Provisions
Health care
expenses
provision
Health
subsidies
expense
provision
Ongoing
risk
reserves
provision
Claims
reserves
provision
Other
Provisions Total
Th$ Th$ Th$ Th$ Th$ Th$
Opening balance at 01/01/2014 21,488,010 1,750,180 130,670 39,201 39,469 23,447,530
Additional provisions 0 0 456,827 474,111 0 930,938
Increase (decrease) in existing provisions 144,612,486 32,115,053 (33,344) 0 179,779 176,873,974
Consumed provision (139,664,027) (31,920,816) (26,708) (93,337) (183,705) (171,888,593)
Other increase (decrease) 0 0 0 0 (1,969) (1,969)
Closing balance at 12/31/2014 26,436,469 1,944,417 527,445 419,975 33,574 29,361,880
Health care
expenses
provision
Health
subsidies
expense
provision
Ongoing
risk
reserves
provision
Claims
reserves
provision
Other
Provisions Total
Th$ Th$ Th$ Th$ Th$ Th$
Opening balance at 01/01/2013 23,210,575 1,791,322 0 0 31,968 25,033,865
Additional provisions 0 0 124,222 37,267 0 161,489
Increase (decrease) in existing provisions 118,971,786 28,289,452 6,448 1,934 55,157 147,324,777
Consumed provision (120,694,351) (28,330,594) 0 0 (43,675) (149,068,620)
Reversal of unused provision 0 0 0 0 (3,981) (3,981)
Closing balance at 12/31/2013 21,488,010 1,750,180 130,670 39,201 39,469 23,447,530
Classes of Provisions
Classes of Provisions
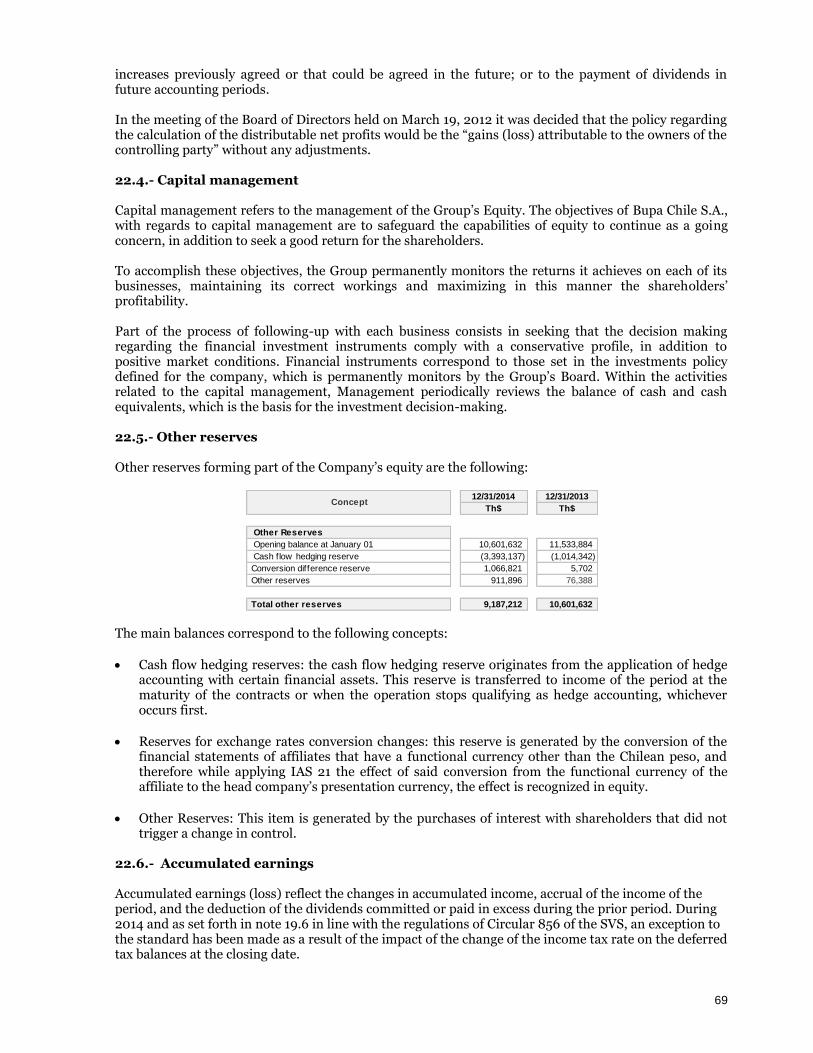
69
increases previously agreed or that could be agreed in the future; or to the payment of dividends in future accounting periods. In the meeting of the Board of Directors held on March 19, 2012 it was decided that the policy regarding the calculation of the distributable net profits would be the “gains (loss) attributable to the owners of the controlling party” without any adjustments. 22.4.- Capital management Capital management refers to the management of the Group’s Equity. The objectives of Bupa Chile S.A., with regards to capital management are to safeguard the capabilities of equity to continue as a going concern, in addition to seek a good return for the shareholders. To accomplish these objectives, the Group permanently monitors the returns it achieves on each of its businesses, maintaining its correct workings and maximizing in this manner the shareholders’ profitability. Part of the process of following-up with each business consists in seeking that the decision making regarding the financial investment instruments comply with a conservative profile, in addition to positive market conditions. Financial instruments correspond to those set in the investments policy defined for the company, which is permanently monitors by the Group’s Board. Within the activities related to the capital management, Management periodically reviews the balance of cash and cash equivalents, which is the basis for the investment decision-making. 22.5.- Other reserves Other reserves forming part of the Company’s equity are the following:
The main balances correspond to the following concepts:
Cash flow hedging reserves: the cash flow hedging reserve originates from the application of hedge accounting with certain financial assets. This reserve is transferred to income of the period at the maturity of the contracts or when the operation stops qualifying as hedge accounting, whichever occurs first.
Reserves for exchange rates conversion changes: this reserve is generated by the conversion of the financial statements of affiliates that have a functional currency other than the Chilean peso, and therefore while applying IAS 21 the effect of said conversion from the functional currency of the affiliate to the head company’s presentation currency, the effect is recognized in equity.
Other Reserves: This item is generated by the purchases of interest with shareholders that did not trigger a change in control.
22.6.- Accumulated earnings Accumulated earnings (loss) reflect the changes in accumulated income, accrual of the income of the period, and the deduction of the dividends committed or paid in excess during the prior period. During 2014 and as set forth in note 19.6 in line with the regulations of Circular 856 of the SVS, an exception to the standard has been made as a result of the impact of the change of the income tax rate on the deferred tax balances at the closing date.
12/31/2014 12/31/2013
Th$ Th$
Other Reserves
Opening balance at January 01 10,601,632 11,533,884
Cash flow hedging reserve (3,393,137) (1,014,342)
Conversion difference reserve 1,066,821 5,702
Other reserves 911,896 76,388
Total other reserves 9,187,212 10,601,632
Concept

70
22.7.- Minority interest Minority interest or non-controlling ownership in equity at the closing date of the financial statements is as follows:
Minority interest or non-controlling ownership in income at the closing date of the financial statements is as follows:
NOTE 23.- REVENUE The following is a breakdown of ordinary income:
(1) The breakdown by segments of this consolidation adjustment is presented in Note 28.2.
Minority
Interest %
12/31/2014
Th$
Minority
Interest %
12/31/2013
Th$
Minority Interest in Promotora Salud S.A. Affiliate 46.850% 1,630,826 46.850% 1,746,918
Minority Interest in Desarrollo e Inversiones Médicas S.A. Affiliate 16.963% 3,385,822 16.963% 3,500,121
Minority Interest in Clínica Pukará S.A. Affiliate 14.567% 3,019,289 14.567% 2,890,468
Minority Interest in Isapre Cruz Blanca S.A. Affiliate 0.990% 309,060 0.990% 275,594
Minority Interest in Corporación Médica de Arica S.A. Affiliate 31.030% 1,953,663 31.030% 2,361,572
Minority Interest in Integramédica S.A Affiliate 0.001% 98,625 0.001% 170,632
Minority Interest in CBS Internacional S.A. Affiliate 30.130% 329,278 30.355% 793,487
Totals 10,726,563 11,738,792
Name of affiliate Type
Equity Equity
Minority
Interest %
12/31/2014
Th$
Minority
Interest %
3/31/2012
Th$
Minority Interest Promotora Salud S.A. Affiliates 46.850% (120,010) 46.850% (33,167)
Minority Interest Desarrollo e Inversiones Médicas S.A. Affiliates 16.963% (87,222) 16.963% 46,777
Minority Interest Clínica Pukará S.A. Affiliates 14.567% 561,435 14.567% 461,829
Minority Interest Isapre Cruz Blanca S.A. Affiliates 0.990% 127,681 0.990% 43,428
Minority Interest Corporación Médica de Arica S.A. Affiliates 31.030% (265,103) 31.030% 94,061
Minority Interest Integramédica S.A Affiliates 0.001% 9,395 0.001% 22,383
Minority Interest CBS Internacional S.A. Affiliates 30.130% 84,763 30.100% 30,682
TOTALS 310,939 665,993
Name of the subsidiary Type
Income Income
12/31/2014 12/31/2013
1/1/2014 1/1/2013
12/31/2014 12/31/2013
Th$ Th$
Insurer segment revenue - Health contributions 427,523,989 383,526,812
Insurer segment revenue - Insurance Premiums 3,454,816 382,384
Revenue from Hospital Services Provided 61,366,835 57,614,083
Revenue from Outpatient Health Services Provided 132,640,833 120,589,253
Revenue from international segment (outpatients) 7,395,724 4,859,072
Revenues from the Other segment 8,154,234 8,615,169
Consolidation adjustments from intersegment sales (1) (49,284,661) (40,882,105)
Total 591,251,770 534,704,668
Ordinary Income
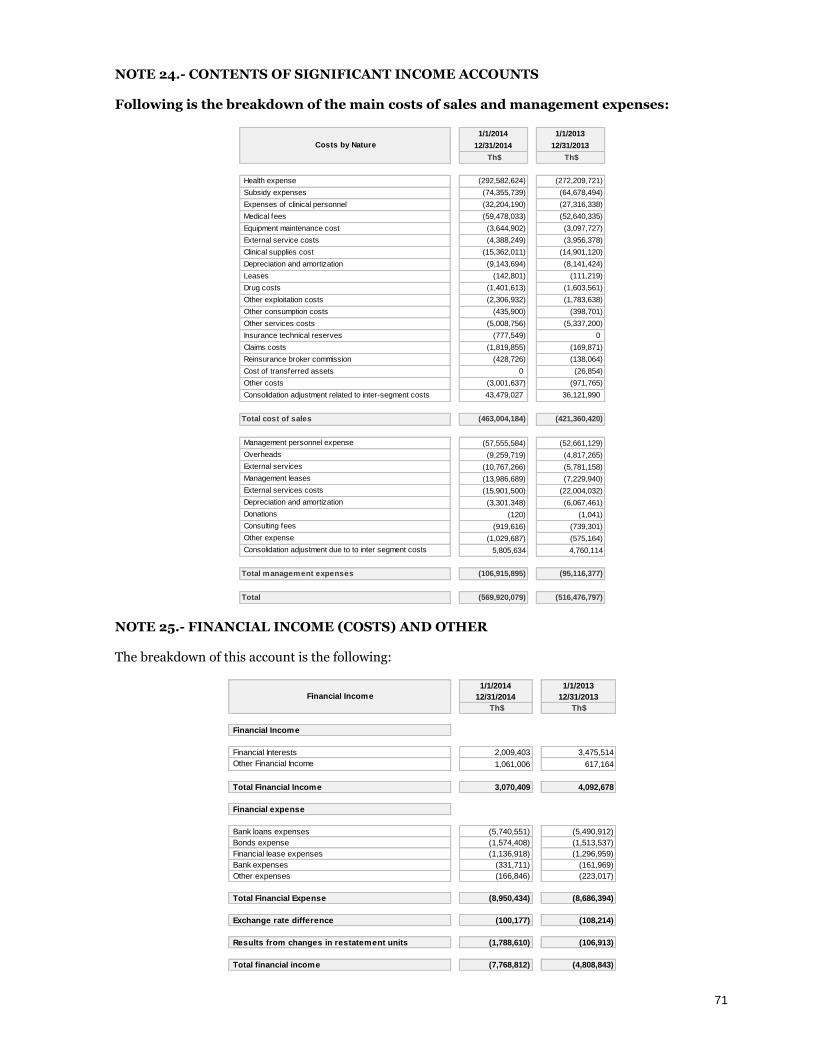
71
NOTE 24.- CONTENTS OF SIGNIFICANT INCOME ACCOUNTS Following is the breakdown of the main costs of sales and management expenses:
NOTE 25.- FINANCIAL INCOME (COSTS) AND OTHER The breakdown of this account is the following:
1/1/2014 1/1/2013
12/31/2014 12/31/2013
Th$ Th$
Health expense (292,582,624) (272,209,721)
Subsidy expenses (74,355,739) (64,678,494)
Expenses of clinical personnel (32,204,190) (27,316,338)
Medical fees (59,478,033) (52,640,335)
Equipment maintenance cost (3,644,902) (3,097,727)
External service costs (4,388,249) (3,956,378)
Clinical supplies cost (15,362,011) (14,901,120)
Depreciation and amortization (9,143,694) (8,141,424)
Leases (142,801) (111,219)
Drug costs (1,401,613) (1,603,561)
Other exploitation costs (2,306,932) (1,783,638)
Other consumption costs (435,900) (398,701)
Other services costs (5,008,756) (5,337,200)
Insurance technical reserves (777,549) 0
Claims costs (1,819,855) (169,871)
Reinsurance broker commission (428,726) (138,064)
Cost of transferred assets 0 (26,854)
Other costs (3,001,637) (971,765)
Consolidation adjustment related to inter-segment costs 43,479,027 36,121,990
Total cost of sales (463,004,184) (421,360,420)
Management personnel expense (57,555,584) (52,661,129)
Overheads (9,259,719) (4,817,265)
External services (10,767,266) (5,781,158)
Management leases (13,986,689) (7,229,940)
External services costs (15,901,500) (22,004,032)
Depreciation and amortization (3,301,348) (6,067,461)
Donations (120) (1,041)
Consulting fees (919,616) (739,301)
Other expense (1,029,687) (575,164)
Consolidation adjustment due to to inter segment costs 5,805,634 4,760,114
Total management expenses (106,915,895) (95,116,377)
Total (569,920,079) (516,476,797)
Costs by Nature
1/1/2014 1/1/2013
12/31/2014 12/31/2013
Th$ Th$
Financial Income
Financial Interests 2,009,403 3,475,514
Other Financial Income 1,061,006 617,164
Total Financial Income 3,070,409 4,092,678
Financial expense
Bank loans expenses (5,740,551) (5,490,912)
Bonds expense (1,574,408) (1,513,537)
Financial lease expenses (1,136,918) (1,296,959)
Bank expenses (331,711) (161,969)
Other expenses (166,846) (223,017)
Total Financial Expense (8,950,434) (8,686,394)
Exchange rate difference (100,177) (108,214)
Results from changes in restatement units (1,788,610) (106,913)
Total financial income (7,768,812) (4,808,843)
Financial Income
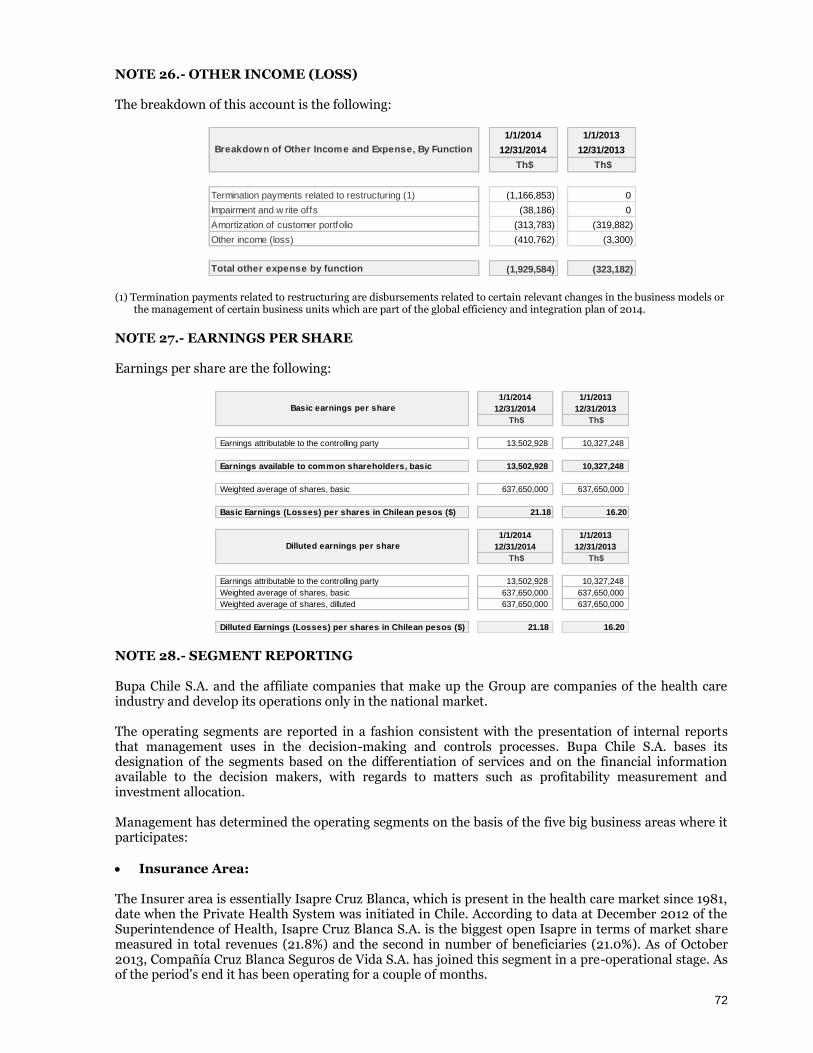
72
NOTE 26.- OTHER INCOME (LOSS) The breakdown of this account is the following:
(1) Termination payments related to restructuring are disbursements related to certain relevant changes in the business models or
the management of certain business units which are part of the global efficiency and integration plan of 2014.
NOTE 27.- EARNINGS PER SHARE Earnings per share are the following:
NOTE 28.- SEGMENT REPORTING Bupa Chile S.A. and the affiliate companies that make up the Group are companies of the health care industry and develop its operations only in the national market. The operating segments are reported in a fashion consistent with the presentation of internal reports that management uses in the decision-making and controls processes. Bupa Chile S.A. bases its designation of the segments based on the differentiation of services and on the financial information available to the decision makers, with regards to matters such as profitability measurement and investment allocation. Management has determined the operating segments on the basis of the five big business areas where it participates:
Insurance Area: The Insurer area is essentially Isapre Cruz Blanca, which is present in the health care market since 1981, date when the Private Health System was initiated in Chile. According to data at December 2012 of the Superintendence of Health, Isapre Cruz Blanca S.A. is the biggest open Isapre in terms of market share measured in total revenues (21.8%) and the second in number of beneficiaries (21.0%). As of October 2013, Compañía Cruz Blanca Seguros de Vida S.A. has joined this segment in a pre-operational stage. As of the period's end it has been operating for a couple of months.
1/1/2014 1/1/2013
12/31/2014 12/31/2013
Th$ Th$
Termination payments related to restructuring (1) (1,166,853) 0
Impairment and w rite offs (38,186) 0
Amortization of customer portfolio (313,783) (319,882)
Other income (loss) (410,762) (3,300)
Total other expense by function (1,929,584) (323,182)
Breakdown of Other Income and Expense, By Function
1/1/2014 1/1/2013
12/31/2014 12/31/2013
Th$ Th$
Earnings attributable to the controlling party 13,502,928 10,327,248
Earnings available to common shareholders, basic 13,502,928 10,327,248
Weighted average of shares, basic 637,650,000 637,650,000
Basic Earnings (Losses) per shares in Chilean pesos ($) 21.18 16.20
1/1/2014 1/1/2013
12/31/2014 12/31/2013
Th$ Th$
Earnings attributable to the controlling party 13,502,928 10,327,248
Weighted average of shares, basic 637,650,000 637,650,000
Weighted average of shares, dilluted 637,650,000 637,650,000
Dilluted Earnings (Losses) per shares in Chilean pesos ($) 21.18 16.20
Basic earnings per share
Dilluted earnings per share
73
Hospital health care Area: The hospital health care area is made of Clínica Reñaca, Clínica Antofagasta and Clínica San José. Clínica Reñaca: present in the region of Valparaíso since 1982, it has become in a highly complex Hospital after the investments made during the last 10 years, that include the incorporation of state-of-the-art technology and improvements in the intensive care and intensive treatment pavilions. Clínica San José: available to users of the region of Arica and Parinacota since 1991. It is a referent for medium and high complexity interventions in the region, thanks to a development plan on equipment and installations implemented since 2007. Clínica Antofagasta: Since 1980 it has been present in the region of Antofagasta. It is currently the main high complexity Hospital in the north of Chile, and is equipped with the best technology. The company Clinical Service of the Metropolitan Region of Santiago has been added as part of the Hospital healthcare segment.
Outpatients health care area: The outpatients health care area is made of the Integramédica Network, which includes a total of 29 consolidated centers of Integramédica (22), Sonorad (6) and Pilar Gazmuri (1). With this structure, the Integramedica Network is the main private outpatients health care provider in the Country. Among the services offered are all medical specialties, dentistry, imaging (sound imaging, scanner, MRI, among others), as well as support services such as digestive endoscopy, dermatologic, trauma and otolaryngology specialists.
International Area: The international area is made of the following companies: Resomasa, is a company established in 1992 and that focuses on rendering diagnosis services based in magnetic resonance imaging and scanner in Peru. Its commercial model is based on two pillars: the installation of resonators in the main hospitals of the Peruvian capital and sales through its sales team. Resomasa operates three resonators and a multi-slice CT-scanner, with high-resolution equipment compared to the Peruvian market’s standards. Integramédica Perú SAC, a company established on July 31, 2012, is currently in a pre-operational stage. It has the purpose of becoming the main outpatient health care provider in Peru. To this effect, it plans to open new diagnosis centers in the country. Each diagnosis center will have adequate capabilities to service the areas of physicians of each specialty, imaginery and procedures, laboratory sample taking and dental procedures. Anglolab is a Peruvian health company founded in 1994 with operations in Lima and other Peruvian provinces. This company focuses in rendering clinical laboratory analyses. Currently the company operates in thirteen locations which are able to carry a wide variety of tests. Its commercial model is based in the signing of agreements to operate laboratories in the premises of hospitals and private health institutions.
Other The results from other areas in addition to those mentioned above, related to Bupa Chile and other non-transferred to the operating segments, is presented under the Others concept, and do not represent significant amounts on an individual basis to be designated as an operating segment.

74
28.1.- ASSETS AND LIABILITIES BY SEGMENT
12/31/2014 12/31/2013 12/31/2014 12/31/2013 12/31/2014 12/31/2013 12/31/2014 12/31/2013 12/31/2014 12/31/2013 12/31/2014 12/31/2013 12/31/2014 12/31/2013
Th$ Th$ Th$ Th$ Th$ Th$ Th$ Th$ Th$ Th$ Th$ Th$ Th$ Th$
CURRENT ASSETS
Cash and cash equivalents 13,248,386 8,846,355 2,724,114 616,404 54,876 924,833 856,622 1,891,781 6,568,578 7,201,165 0 0 23,452,576 19,480,538
Other f inancial assets, current 634,160 234,018 0 0 0 1,018,581 0 14,716 543,587 24,807,060 0 0 1,177,747 26,074,375
Other non-financial assets, current 7,864,186 6,533,943 294,792 214,349 1,789,150 890,384 132,356 22,516 8,982 23,893 0 0 10,089,466 7,685,085
Trade debtors and other accounts receivable, current 12,854,144 12,358,387 31,337,427 24,910,408 8,840,591 7,336,320 2,463,912 2,109,213 74,945 55,794 0 0 55,571,019 46,770,122
Accounts receivable from related parties, current 33,092,060 29,615,639 1,459,545 1,785,891 148,033 1,675,745 1,098 0 12,105,426 7,453,028 (46,431,875) (40,044,310) 374,287 485,993
Inventory 0 0 1,659,869 1,655,134 707,856 622,612 231,690 129,349 0 0 0 0 2,599,415 2,407,095
Tax assets, current 1,316,998 2,890,223 1,553,915 1,272,937 1,018,008 2,380,254 85,611 526,972 2,585,906 865,904 0 0 6,560,438 7,936,290
Total Assets, Current 69,009,934 60,478,565 39,029,662 30,455,123 12,558,514 14,848,729 3,771,289 4,694,547 21,887,424 40,406,844 (46,431,875) (40,044,310) 99,824,948 110,839,498
NON-CURRENT ASSETS
Other f inancial assets, non-current 28,838,966 22,185,775 0 0 0 0 0 0 8,739,840 1,775,317 0 0 37,578,806 23,961,092
Other non-financial assets, non-current 40,893,251 35,240,845 21,535 88,350 858,007 1,195,850 598,203 0 313,330 291,369 0 0 42,684,326 36,816,414
Accounts receivable from related entities, non-current 1,521,611 1,531,461 0 0 0 0 0 0 376,843 1,004,198 (1,898,454) (2,535,659) 0 0
Investments accounted w ith the equity method 0 0 38,315,752 5,235,261 0 0 0 0 229,897,086 199,356,057 (268,212,838) (204,591,318) 0 0
Intangible assets other than goodw ill 1,931,662 2,620,572 17,263,666 6,604,684 44,807,381 42,864,624 4,011,928 2,452,809 36,536,204 47,537,591 1,207,229 1,207,229 105,758,070 103,287,509
Goodw ill 0 0 7,699,832 1,550,625 63,494,294 63,456,645 2,758,954 2,761,355 8,235,558 14,422,413 1,342,299 1,342,299 83,530,937 83,533,337
Property, plant and equipment 7,387,856 8,262,864 73,183,192 59,899,498 36,675,947 33,838,184 9,306,883 8,839,558 6,032,747 6,073,189 0 0 132,586,625 116,913,293
Investment property 0 0 432,897 439,910 0 0 0 0 1,295,381 1,328,502 0 0 1,728,278 1,768,412
Deferred tax assets 507,814 126,718 847,147 526,208 9,005,137 3,009,033 1,358,246 729,198 188,687 434,586 0 0 11,907,031 4,825,743
Total assets, non-current 81,081,160 69,968,235 137,764,021 74,344,536 154,840,766 144,364,336 18,034,214 14,782,920 291,615,676 272,223,222 (267,561,764) (204,577,449) 415,774,073 371,105,800
TOTAL ASSETS 150,091,094 130,446,800 176,793,683 104,799,659 167,399,280 159,213,065 21,805,503 19,477,467 313,503,100 312,630,066 (313,993,639) (244,621,759) 515,599,021 481,945,298
Consolidation Adjustments TOTALSInsurer Hospital Healthcare Outpatients Healthcare International Other

75
28.1.- ASSETS AND LIABILITIES BY SEGMENT (CONTINUED)
12/31/2014 12/31/2013 12/31/2014 12/31/2013 12/31/2014 12/31/2013 12/31/2014 12/31/2013 12/31/2014 12/31/2013 12/31/2014 12/31/2013 12/31/2014 12/31/2013
Th$ Th$ Th$ Th$ Th$ Th$ Th$ Th$ Th$ Th$ Th$ Th$ Th$ Th$
CURRENT LIABILITIES
Other f inancial liabilities, current 0 15 10,909,849 8,531,455 11,385,600 8,459,828 163,977 184,134 7,210,662 6,982,754 0 0 29,670,088 24,158,186
Trade creditors and other accounts payable 68,549,495 65,362,238 9,708,732 8,528,738 11,095,201 10,922,550 1,948,829 2,062,403 1,424,163 1,858,470 243,338 (496,561) 92,969,758 88,237,838
Accounts payable to related entities, current 5,522,881 3,441,167 6,985,568 2,785,420 4,387,113 3,643,982 665,714 0 27,485,223 29,311,894 (44,795,022) (39,182,463) 251,477 0
Other short-term provisions 29,361,880 23,445,561 0 0 0 0 0 0 0 1,969 0 0 29,361,880 23,447,530
Tax liabilities, current 0 0 136,570 257,365 426,067 82,995 335,317 108,389 581 103,155 0 0 898,535 551,904
Provisions for employee benefits, Current 2,905,570 164,235 359,581 274,923 671,178 156,809 61,289 20,629 615,107 239,711 0 0 4,612,725 856,307
Other non-financial liabilities, current 449,891 576,129 149,164 128,197 13,027 12,371 93,262 4,173 4,072,701 3,100,808 0 0 4,778,045 3,821,678
Total liabilities, current 106,789,717 92,989,345 28,249,464 20,506,098 27,978,186 23,278,535 3,268,388 2,379,728 40,808,437 41,598,761 (44,551,684) (39,679,024) 162,542,508 141,073,443
NON-CURRENT LIABILITIES
Other f inancial liabilities, non-current 0 0 33,239,969 20,847,060 20,070,105 27,131,106 435,312 593,598 77,218,653 78,100,850 0 0 130,964,039 126,672,614
Other accounts payable, non-current 4,214 4,214 0 0 0 0 0 0 0 0 0 0 4,214 4,214
Accounts payable to related entities, non-current 0 0 0 0 0 0 0 0 3,516,902 2,800,921 (3,516,902) (2,800,921) 0 0
Deferred tax liability 9,332,471 7,333,167 5,169,095 1,440,969 3,044,293 892,152 1,377,290 1,484,150 10,204,264 8,579,712 321,397 321,396 29,448,810 20,051,546
Other non-financial liabilities, non-current 0 0 0 0 459,000 609,000 643,950 1,180,364 0 0 0 0 1,102,950 1,789,364
Total liabilities, non-current 9,336,685 7,337,381 38,409,064 22,288,029 23,573,398 28,632,258 2,456,552 3,258,112 90,939,819 89,481,483 (3,195,505) (2,479,525) 161,520,013 148,517,738
Total Liabilities 116,126,402 100,326,726 66,658,528 42,794,127 51,551,584 51,910,793 5,724,940 5,637,840 131,748,256 131,080,244 (47,747,189) (42,158,549) 324,062,521 289,591,181
EQUITY
Issued capital 22,487,221 21,337,221 69,911,090 47,026,327 88,930,016 88,930,016 17,828,309 13,957,949 66,657,516 65,255,465 (200,560,687) (171,253,513) 65,253,465 65,253,465
Premium on issue of shares 0 0 0 0 0 0 0 0 51,378,174 51,378,174 0 0 51,378,174 51,378,174
Other reserves 0 0 26,085,227 (25,614) (55,146) 60,890 852,948 (384,537) 10,106,888 10,458,001 (27,802,705) 492,892 9,187,212 10,601,632
Accumulated earnings (loss) 11,477,471 8,782,853 13,093,552 13,892,242 26,874,201 18,140,734 (2,929,972) (527,274) 53,612,176 54,446,977 (47,136,342) (41,353,476) 54,991,086 53,382,056
Equity attributable to owners of the controlling party 33,964,692 30,120,074 109,089,869 60,892,955 115,749,071 107,131,640 15,751,285 13,046,138 181,754,754 181,538,617 (275,499,734) (212,114,097) 180,809,937 180,615,327
Non-controlling interest 0 0 1,045,286 1,112,577 98,625 170,632 329,278 793,489 90 11,207 9,253,284 9,650,887 10,726,563 11,738,792
EQUITY 33,964,692 30,120,074 110,135,155 62,005,532 115,847,696 107,302,272 16,080,563 13,839,627 181,754,844 181,549,824 (266,246,450) (202,463,210) 191,536,500 192,354,119
TOTAL EQUITY AND LIABILITIES 150,091,094 130,446,800 176,793,683 104,799,659 167,399,280 159,213,065 21,805,503 19,477,467 313,503,100 312,630,068 (313,993,639) (244,621,759) 515,599,021 481,945,300
TOTALSOther Consolidation AdjustmentsInsurer Hospital Healthcare Outpatients Healthcare International

76
28.2.- STATEMENT OF INCOME BY SEGMENT
(1): Since June 2013, the Insurer Area includes the balances of Cruz Blanca Compañía de Seguros de Vida S.A. (2): Since year 2014 the EBIT is measured as the equivalent of adding up Earnings (loss) from operating activities plus items that within the item Other Earnings (Loss), and EBITDA is measured as the addition of Earnings (Loss) of Operating Activities plus depreciation and amortization of the period. Revenues from ordinary activities between related entities that are eliminated in the consolidation adjustments column - which are later redistributed among the different cost and expense items - are the following:
1/1/2014 1/1/2013 1/1/2014 1/1/2013 1/1/2014 1/1/2013 1/1/2014 1/1/2013 1/1/2014 1/1/2013 1/1/2014 1/1/2013 1/1/2014 1/1/2013
12/31/2014 12/31/2013 12/31/2014 12/31/2013 12/31/2014 12/31/2013 12/31/2014 12/31/2013 12/31/2014 12/31/2013 12/31/2014 12/31/2013 12/31/2014 12/31/2013
Th$ Th$ Th$ Th$ Th$ Th$ Th$ Th$ Th$ Th$ Th$ Th$ Th$ Th$
Earnings (loss)
Revenues from ordinary activities 430,978,805 383,909,196 61,366,836 57,614,083 132,640,833 120,589,253 7,395,724 4,859,072 8,154,234 8,615,169 (49,284,662) (40,882,105) 591,251,770 534,704,668
Costs of sales (372,962,707) (338,188,596) (47,873,910) (43,961,612) (80,307,139) (72,514,235) (5,339,456) (2,817,968) 0 0 43,479,028 36,121,991 (463,004,184) (421,360,420)
Gross Earnings 58,016,098 45,720,600 13,492,926 13,652,471 52,333,694 48,075,018 2,056,268 2,041,104 8,154,234 8,615,169 (5,805,634) (4,760,114) 128,247,586 113,344,248
Management expenses (50,053,486) (43,924,008) (8,767,070) (8,775,654) (39,225,921) (36,069,601) (4,569,705) (2,282,479) (10,105,347) (8,824,749) 5,805,634 4,760,114 (106,915,895) (95,116,377)
Earnings (loss) from operating activities 7,962,612 1,796,592 4,725,856 4,876,817 13,107,773 12,005,417 (2,513,437) (241,375) (1,951,113) (209,580) 0 0 21,331,691 18,227,871
Other earnings (loss) (239,010) (240,821) (453,435) (7,089) (1,070,962) (11,010) (94,296) 0 (71,881) (64,262) 0 0 (1,929,584) (323,182)
Interest income 3,423,452 3,073,610 23,856 107,300 35,942 44,764 1,685 592 539,542 1,722,410 (954,068) (855,998) 3,070,409 4,092,678
Financial cost (278,177) (398,285) (1,680,344) (1,663,512) (2,446,984) (2,242,492) (53,954) (70,816) (5,445,043) (5,167,287) 954,068 855,998 (8,950,434) (8,686,394)
Interest in gain (loss) of aff iliates and joint
businesses accounted for using the equity method 0 0 301,796 129,290 0 0 0 0 22,124,878 14,732,322 (22,426,674) (14,861,612) 0 0
Foreign exchange difference 0 0 (6,818) (39,428) 0 0 (35,837) (10,815) (57,522) (57,971) 0 0 (100,177) (108,214)
Results from restatement units 2,354,375 1,069,767 (1,180,223) (379,429) (68,183) (45,313) 0 0 (2,894,579) (751,938) 0 0 (1,788,610) (106,913)
Earnings (loss), before taxes 13,223,252 5,300,863 1,730,688 3,023,949 9,557,586 9,751,366 (2,695,839) (322,414) 12,244,282 10,203,694 (22,426,674) (14,861,612) 11,633,295 13,095,846
Income tax expense (2,152,587) (1,374,436) (412,889) (352,227) 3,408,142 (1,197,180) 317,768 109,910 1,020,138 711,328 0 0 2,180,572 (2,102,605)
Earnings (loss) from continuing operations 11,070,665 3,926,427 1,317,799 2,671,722 12,965,728 8,554,186 (2,378,071) (212,504) 13,264,420 10,915,022 (22,426,674) (14,861,612) 13,813,867 10,993,241
Earnings (loss) 11,070,665 3,926,427 1,317,799 2,671,722 12,965,728 8,554,186 (2,378,071) (212,504) 13,264,420 10,915,022 (22,426,674) (14,861,612) 13,813,867 10,993,241
Depreciation and amortization 2,463,919 2,309,581 3,554,078 3,279,759 5,299,885 4,662,053 884,514 635,714 242,647 251,191 0 0 12,445,043 11,138,298
EBITDA 10,426,531 4,106,173 8,279,934 8,156,576 18,407,658 16,667,470 (1,628,923) 394,339 (1,708,466) 41,611 0 0 33,776,734 29,366,169
EBIT 7,962,612 1,796,592 4,375,869 4,877,113 12,186,288 12,005,417 (2,568,816) (241,375) (1,951,113) (209,580) 0 0 20,004,840 18,228,167
Consolidation
adjustments
AccumulatedOther
STATEMENT OF INCOME BY FUNCTION
Insurer (1) Hospital Healthcare Outpatients Healthcare International Area
1/1/2014 1/1/2013 1/1/2014 1/1/2013 1/1/2014 1/1/2013 1/1/2014 1/1/2013 1/1/2014 1/1/2013 1/1/2014 1/1/2013
12/31/2014 12/31/2013 12/31/2014 12/31/2013 12/31/2014 12/31/2013 12/31/2014 12/31/2013 12/31/2014 12/31/2013 12/31/2014 12/31/2013
Th$ Th$ Th$ Th$ Th$ Th$ Th$ Th$ Th$ Th$ Th$ Th$
Revenues from sales to related entities 2,023,636 382,383 17,205,774 14,893,945 24,330,004 20,845,663 5,725,248 4,760,114 0 0 49,284,662 40,882,105
AccumulatedConsolidation Adjustments
STATEMENT OF INCOME BY FUNCTION
Insurer area Hospital Healthcare Outpatients Healthcare Other

77
28.3.- CASH FLOWS BY SEGMENT
01/01/14 01/01/13 01/01/14 01/01/13 01/01/14 01/01/13 01/01/14 01/01/13 01/01/14 01/01/13 01/01/14 01/01/13 01/01/14 01/01/13
12/31/14 12/31/13 12/31/14 12/31/13 12/31/14 12/31/13 12/31/14 12/31/13 12/31/14 12/31/13 12/31/14 12/31/13 12/31/14 12/31/13
Th$ Th$ Th$ Th$ Th$ Th$ Th$ Th$ Th$ Th$ Th$ Th$ Th$ Th$
Cash flows proceeds from (used in) operating activities
Classes of collections from operating activities
Collection of sales of goods and rendering of services 455,102,488 407,252,180 70,682,017 65,351,173 135,286,985 132,387,321 8,469,215 1,997,138 9,330,875 8,546,986 0 0 678,871,580 615,534,798
Collections from premiums and benefits, annuities and other subscribed policy benefits 3,155,089 455,037 0 0 0 0 0 0 0 0 0 0 3,155,089 455,037
Other colllections from operating activities 46,394,927 35,094,081 0 0 0 0 196,334 0 0 (543) 0 0 46,591,261 35,093,538
Classes of payments
Payments to suppliers for the procurement of goods and services (398,618,719) (366,723,505) (39,605,980) (42,995,199) (90,627,581) (94,771,412) (7,604,025) (3,355,619) (8,880,863) (6,086,043) 64,454 (172,295) (545,272,714) (514,104,073)
Payments to and on behalf of employees (32,595,159) (30,869,732) (19,522,218) (17,960,991) (26,191,952) (21,503,757) (3,578,874) 0 (3,666,652) (3,003,993) 0 0 (85,554,855) (73,338,473)
Payments for premiums and benefits, annuities and other subscribed policy benefits (1,572,550) (46,480) 0 0 0 0 0 0 0 0 0 0 (1,572,550) (46,480)
Other payments from operating activities (59,618,250) (41,933,069) (5,894,363) (4,461,984) (4,118,014) (4,723,412) (504,937) (94,289) (512,960) (493,800) 0 0 (70,648,524) (51,706,554)
Other operating collections and payments
Dividends paid 0 0 0 0 (5,302) 0 0 0 (4,113,395) (7,014,192) 5,302 0 (4,113,395) (7,014,192)
Dividends received 0 0 0 79,481 0 0 0 0 6,483,133 15,809,831 (6,483,133) (15,889,312) 0 0
Interest paid (58,762) (17,527) 0 0 0 0 0 0 (773,436) 0 773,436 0 (58,762) (17,527)
Interest collected 0 0 1,052 0 0 0 0 0 1,001,110 1,910,963 0 0 1,002,162 1,910,963
Income tax returns (payments) (990,600) 92,869 (918,226) (525,395) (11,839) (113,669) (81,032) 0 86,060 596,964 0 0 (1,915,637) 50,769
Other inflow s (outf low s) of cash 0 0 68,990 (17,586) 0 0 0 0 20,248 99,044 0 0 89,238 81,458
Net cash flows from (used in) operating activities 11,198,464 3,303,854 4,811,272 (530,501) 14,332,297 11,275,071 (3,103,319) (1,452,770) (1,025,880) 10,365,217 (5,639,941) (16,061,607) 20,572,893 6,899,264
Cash flows from (used in) investment activities
Cash flow s received from the loss of control on subsidiaries or other businesses 0 0 0 11,167 0 0 0 0 (72,106) (1,851) 72,106 (9,316) 0 0
Cash flow s used to obtain control on subsidiaries or other businesses 0 0 0 0 0 (991,591) 0 (5,946,844) (2,209,587) (1,251,799) 2,209,587 2,243,390 0 (5,946,844)
Cash flow s used in the acquisition of non-controlling interest 0 0 (93,744) 0 0 0 0 0 0 (112) 0 112 (93,744) 0
Other income from the sale of joint businesses 0 0 0 0 0 0 0 0 8,054 0 0 0 8,054 0
Other payments from the acquisition of joint businesses 0 0 0 0 0 0 0 0 (172) 0 0 0 (172) 0
Loans granted to related entities (10,178,860) (34,207,186) 0 0 545,000 (3,764,882) 0 0 (9,756,800) (17,077,012) 19,378,810 55,049,080 (11,850) 0
Proceeds from the sale of Property, plant and equipment 0 0 0 980,536 0 0 28,117 0 0 0 0 0 28,117 980,536
Acquisition of property, plant and equipment (341,388) (883,340) (15,527,698) (6,620,009) (5,756,745) (4,515,163) (383,763) (1,640,770) (50,788) (250,085) 0 0 (22,060,382) (13,909,367)
Acquisition of intangibles (281,840) (468,994) 0 (306,687) 0 0 (285,592) (95,401) (508) (7,339) 0 0 (567,940) (878,421)
Proceeds from other long-term assets 0 8,624,825 0 0 1,045,341 (5,528) 0 0 75,529,678 0 0 0 76,575,019 8,619,297
Acquisition of other long-term assets (5,153,550) (2,902,525) 0 0 0 (390) 0 0 (57,946,414) (13,411,320) 0 0 (63,099,964) (16,314,235)
Funding and update of Superintendence Guarantee (less) (204,353) 0 0 0 0 0 0 0 0 0 0 0 (204,353) 0
Collection of amounts from related entities 10,231,471 21,763,762 0 0 63,158,724 59,760,467 0 0 4,512,301 9,387,815 (77,902,496) (90,912,044) 0 0
Dividends received 0 0 314,497 585,793 0 0 9,878 0 1,091 0 (325,466) (585,793) 0 0
Interests received 431,687 1,202,914 23,864 111,958 459 5,578 703 0 128,181 25,732 583,823 0 1,168,717 1,346,182
Income tax returns (payments) 0 0 0 0 553 0 0 0 0 0 0 0 553 0
Other cash inflow s (outf low s) 0 0 (824) (15,208) 0 0 0 0 0 27,977 0 0 (824) 12,769
Net cash flows from (used in) investment activities (5,496,833) (6,870,544) (15,283,905) (5,252,450) 58,993,332 50,488,491 (630,657) (7,683,015) 10,142,930 (22,557,994) (55,983,636) (34,214,571) (8,258,769) (26,090,083)
Cash flows from (used in) financing activities
Proceeds from the issue of shares 0 0 1,407,693 6,080,000 0 0 0 410,092 0 171,799 (1,407,693) (6,661,891) 0 0
Proceeds from the Issue of Other Equity Instruments (1) 1,150,000 2,736,905 0 0 0 0 985,355 0 0 0 (2,135,355) (2,736,905) 0 0
Inflow s from long-term loans 0 0 12,014,383 0 0 15,104,337 0 0 0 0 0 0 12,014,383 15,104,337
Inflow s from short-term loans 0 0 12,220,062 7,240,247 (1,909,813) 0 0 0 0 0 0 0 10,310,249 7,240,247
Total inflows from loans 0 0 24,234,445 7,240,247 (1,909,813) 15,104,337 0 0 0 0 0 0 22,324,632 22,344,584
Loans obtained from related entities 285,041 163,885 4,775,745 662,721 (4,260,372) 710,606 2,117,644 10,499,704 9,802,285 30,880,670 (12,720,343) (42,917,586) 0 0
Payment of loans 0 0 (11,142,969) (4,338,546) 758,000 (1,046,905) (91,272) (169,854) (5,000,000) (5,014,454) 0 0 (15,476,241) (10,569,759)
Payment of liabilities from financial leases 0 0 (765,958) (767,935) (6,102,070) (5,227,207) (164,077) 0 (436,803) (422,907) 0 0 (7,468,908) (6,418,049)
Payment of loans to related entities (170,000) (125,499) (3,116,693) (412,721) (58,163,351) (67,217,590) (1,059) (27,877) (9,589,147) (17,471,217) 71,040,250 85,254,904 0 0
Dividends paid (3,603,352) (11,453,409) (915,476) (2,406,416) (2,559,541) (3,500,000) (73,163) 0 0 0 6,810,070 17,337,656 (341,462) (22,169)
Interests paid 0 0 (1,591,462) (1,532,582) (1,958,439) (1,133,830) (43,667) (15,679) (4,526,600) (4,473,899) 36,648 0 (8,083,520) (7,155,990)
Other inflow s (outf low s) of cash 0 0 (304,770) (1,039) 0 496,412 0 0 0 (5,439) 0 0 (304,770) 489,934
Net cash flows from (used in) financing activities (2,338,311) (8,678,118) 12,580,555 4,523,729 (74,195,586) (61,814,177) 2,729,761 10,696,386 (9,750,265) 3,664,553 61,623,577 50,276,178 (9,350,269) (1,331,449)
Net increase (decrease) of cash and cash equivalents, before the effect of 3,363,320 (12,244,808) 2,107,922 (1,259,222) (869,957) (50,615) (1,004,215) 1,560,601 (633,215) (8,528,224) 0 0 2,963,855 (20,522,268)
Effect of changes in the exchange rate on cash and cash equivalents 1,038,711 474,843 (212) (126) 0 0 (30,944) (1,459) 628 2,141 0 0 1,008,183 475,399
Net Increase (decrease) of Cash and Cash Equivalents 4,402,031 (11,769,965) 2,107,710 (1,259,348) (869,957) (50,615) (1,035,159) 1,559,142 (632,587) (8,526,083) 0 0 3,972,038 (20,046,869)
Cash and cash equivalents at beginning of period 8,846,355 20,616,320 616,404 1,875,752 924,833 975,448 1,891,781 332,639 7,201,165 15,727,248 0 0 19,480,538 39,527,407
Cash and cash equivalents at closing of period 13,248,386 8,846,355 2,724,114 616,404 54,876 924,833 856,622 1,891,781 6,568,578 7,201,165 0 0 23,452,576 19,480,538
STATEMENT OF CASH FLOWS, DIRECT METHOD
Consolidation adjustments AccumulatedOtherInsurer (2) Hospital Healthcare Outpatients Healthcare International area

78
NOTE 29.- CONTINGENCIES, LITIGATION AND OTHER
The Parent Company does not have contingencies nor faces legal proceedings. Its affiliates face litigation or potential litigation, on court or off court proceedings within the normal course of its operations. According to the estimates of the legal advisors of the Company, Management does not believe that any of these proceedings may result in material gains or losses for any of the group's companies. Following is a summary of the lawsuits or other legal proceedings.
a) Isapre Cruz Blanca S.A. At December 31, 2014, the summary of the ongoing proceedings both Courts of Justice and in arbitration processes arising from claims against Isapre Cruz Blanca S.A. by its beneficiaries is the following:
1. Proceedings in courts of justice: a. Ordinary trials: there is knowledge of 12 ongoing ordinary lawsuits by the beneficiaries against
the Isapre.
b. Protection recourse: There is knowledge of 31,367 protection recourses based on the restatement of the base price as of December 31, 2014. In addition, as of that date there are 28 other recourses related to other topics, among which can be noted recourses for health plan coverages, CAEC coverage, change of CAEC service provider, house hospital care, undeclared preexistent illness, contract termination, medical leaves, and other matters.
2. Proceedings in arbitration: There is knowledge of 1,392 arbitration proceedings for claims against the Isapre by its beneficiaries, in process as of December 31, 2014 in the arbitration court of the Intendence of Health Funds and Insurances. As of December 31, 2014, the Company holds outstanding lawsuits against it for claims related to the normal course of business, which according to the legal advisors of the companies will not be succesful and therefore no provisions have been recorded. b) Integramédica S.A. and subsidiaries As of December 31, 2014, the Company holds outstanding lawsuits against it for claims related to the normal course of business, which according to the legal advisors of the companies, do not present risks of significant losses. c) Promotora de Salud S.A.
As of December 31, 2014, this company and its subsidiaries have outstanding lawsuits against it for claims related to the normal course of business, which according to the legal counsel, do not present risks of significant losses. d) Desarrollo e Inversiones Médicas S.A.
As of December 31, 2014, this company does not have outstanding lawsuits. Its subsidiary Clinica Reñaca S.A. has outstanding lawsuits against it for claims related to the normal course of business, which according to the legal counsel, do not present risks of significant losses. e) Inversiones Clínicas Pukará S.A. and affiliate As at December 31, 2014, there are outstanding lawsuits against the Company related to the normal course of its business, which according to the legal advisors of the companies do not represent a risk of significant losses.

79
f) Corporación Médica de Arica S.A. and affiliate As at December 31, 2014, there are outstanding lawsuits against the Company related to the normal course of its business, which according to the legal advisors of the companies do not represent a risk of significant losses.
NOTE 30.- GUARANTEES PLEDGED TO THIRD PARTIES, OTHER CONTINGENT ASSETS
AND LIABILITIES AND OTHER COMMITMENTS
a) Bupa Chile S.A. The Company has pledged the following guarantees with third parties: In relation to the contract of guarantee and co-debt dated November 17, 2010 which was sighted by the Public Notary of Santiago Mr. Eduardo Diez Morello the companies became a guarantor and co debtors in favor of Corpbanca, Banco Security, Banco Bice and Banco del Estado de Chile, in relationship to all the liabilities of Inversiones Médicas Cuatro S.A., Idelpa Salud Dos S.A. (both companies are nowadays part of Bupa Chile S.A.) and Integramédica under the contract “Debt recognition, and modification of credit contract” granted on that same date and sighted by the public notary Humberto Santelices Narducci. The Company has the following covenants related to the Bond Issuing Contract dated April 13, 2012: Prohibition to grant real guarantees. Bupa Chile S.A. will not grant nor will it allow that any of its Relevant Subsidiaries grant real guarantees, meaning liens or mortgages, that guarantee new Bond emissions or any other money financing operation, or other financing or existing obligations or that may arise in the future, as long that the total accumulated amount of all the liabilities guaranteed by Bupa Chile S.A. and/or its Relevant Subsidiaries, exceed 5% of the Total Assets of Bupa Chile S.A.. Notwithstanding the above, for this purpose the following real guarantees will not be considered: a/ those current at the date of the Bond Issue Contract; b/ those established to finance, refinance, pay or amortize the acquisition, construction, development or improvement price or cost of assets of Bupa Chile S.A. or of its subsidiaries, as long as the corresponding guarantee remains on the same acquired, built, developed or improved asset, is established at the same time with the acquisition, construction, development or improvement or within one year of the occurrence of any of these events, and as long as the guaranteed obligation does not exceed the acquisition, construction, development or improvement price or cost; c/ those that are granted by Bupa Chile S.A. in favor of its Subsidiaries or from the subsidiaries to Bupa Chile S.A., with the purpose of covering liabilities between them; d/ those granted by an entity that, subsequent to the date of grant of a guarantee, merges, is absorbed into, or becomes a subsidiary of, Bupa Chile S.A.; e/ those that set liens on assets acquired by Bupa Chile S.A. and that are established prior to its acquisition; f/ those established by legal requirements or by legal mandate; g/ those that establish, replace or take the place of any of the aforementioned guarantees; and h/ those established on the shares issued by the Relevant Subsidiaries. Bupa Chile S.A. or any of its Subsidiaries may grant real guarantees to other liabilities if, previously and simultaneously, they establish guarantees that are at least proportionally equivalent in favor of the Bondholders. In this case the proportion of guarantees will be assessed at each opportunity by the Bondholders’ Representative who, if it deems the guarantee sufficient, will grant the instruments to grant the guarantees in favor of the Bondholders. In case of doubt or of difficulties between the Representative and the Bupa Chile S.A. with regards to the proportionality of the guarantees, the matter will be subject to the knowledge and decision of the arbiter that may be designed in accordance to the Twenty-First clause of Bond Issue Contract, and who will resolve with the faculties established therein. Bupa Chile S.A. will only be able to set the guarantee if it obtains a favorable sentence to its pretensions and in no case will it be able to grant them during the trial proceedings. For the purposes of calculating whether the total amount of liabilities guaranteed with real guarantees exceed the amount corresponding to five percent of the Total Assets of Bupa Chile S.A., as required in this section, the calculation must be made at one time at the time of granting said real guarantees, based on the last consolidated quarterly financial statements of Bupa Chile S.A..

80
Following the contract related to the lines of credit between Inmobiliaria y Constructora CBS S.A. and Banco Itaú and BBVA, Chile, dated July 17, 2014, the Company has signed as codebtor of the liabilities of Inmobiliaria y Constructora CBS S.A. and has granted liens on the total amount of shares that it holds in Inversiones Clínicas CBS S.A. As a result of the merger of Servicios de Gestión Ltda, as set forth in public deed dated December 31, 2014 entered in the Public Notary of Santiago of Mr Hernán Cuadra Gazmuri the following guarantees: Servicios de Gestión Ltda. a related entity to Isapre Cruz Blanca S.A. is established as guarantor and codebtor of the liabilities arising of the lease contracts ceded to Inmobiliaria Cruz Blanca SpA (now called Bupa Servicios Corporativos SpA). The contract obligations are with the insurance companies ING Seguros de Vida S.A. y Compañía de Seguros de Vida Cruz del Sur S.A. On September 24, 2009, Isapre Cruz Blanca S.A. became guarantor and codebtor of the liabilities related to the lease contracts cessions that were acquired by Inmobiliaria Cruz Blanca SpA with Metlife Chile Seguros de Vida S.A. With regards to the financial lease contracts that Isapre Cruz Blanca S.A. held with ING Compañía de Seguros de Vida S.A. and Compañía de seguros de Vida Cruz del Sur S.A., and in accordance with decisions of the Board of Directors, during year 2008 was a renegotiation restructuring of real estate lease contracts that, in a first stage, considered the modification of the term conditions, rates and incomes related to said contracts and in a second stage, considered the transfer of rights and obligations that in those contracts corresponded to Isapre Cruz Blanca S.A. as lessee and owner of purchase options, to the affiliate called Inmobiliaria Cruz Blanca SpA, that belongs to the same corporate group. This compan subsequently gave in sub-lease the real estate to Isapre Cruz Blanca S.A. As a result of the transfer of contracts the terms and conditions of the lease contracts did not experience changes compared to the current terms and enables Isapre Cruz Blanca S.A. to use the real estate as result of the sublease agreements. As requisite for the transfer of lease contracts, the lessors ING Seguros de Vida S.A. and Compañía de Seguros de Vida Cruz del Sur S.A. requested that Isapre Cruz Blanca S.A. became guarantor and codebtor of the obligations that would arise for Inmobiliaria Cruz Blanca SpA from those contracts in favor the abovementioned insurance companies. This request was approved by the Twenty-fifth Extraordinary Shareholders' meeting held on November 20, 2008. During September 2009 a new financial lease contract was realized with MetLife Chile Seguros de Vida S.A. The contract included the transfer of rights and obligations in the same terms that corresponf to Isapre Cruz Blanca S.A. as lessee and owner of the purchase option, to Inmobiliaria Cruz Blanca SpA, a company that belongs to the same corporate group. In deeds dated May 11, 2011 Inmobiliaria Cruz Blanca SpA exercised the purchase option set forth in the lease contracts with Metlife Chile Seguros de Vida S.A. Subsequently, through deeds dated September 2011 Metlife Chile Seguros de Vida S.A. proceeded to lift and cancel for all legal purposes the liens and covenants, declaring that there is no outstanding debt related to the abovementioned contracts. b) Isapre Cruz Blanca S.A. On March 27, 2008 the Company established guarantees in favor of Banco de Chile which are comprised by trademarks entered in the Register of Trade Marks of the Department of Industrial Property of the Ministry of Economy, Promotion and Tourism. On November 20, 2008, the twenty-fifth Extraordinary Shareholders Meeting was held to discuss the authorization to pledge guarantees of third party obligations, according to what is set forth in number 5, article 57 of Law 18,046. Said meeting approved that Isapre Cruz Blanca S.A. become guarantor and co debtor of the liabilities that may arise in the lease cession contracts of the related company Inmobiliaria

81
Cruz Blanca S.A., with the insurance company ING Seguros de Vida S.A. and Compañía de Seguros de Vida Cruz del Sur S.A.; the value of the cessions amounts to UF 51,822 and UF 10,983 respectively. On September 24, 2009 was held the 26th Extraordinary Shareholder Meeting to discuss the authorization to pledge guarantees for third party liabilities, in accordance to number 5, article 57, Law 18,056. The Meeting approved that Isapre Cruz Blanca S.A. would become codebtor of the liabilities that Inmobiliaria Cruz Blanca S.A. would incur with Compañía Metlife Seguros de Vida S.A. with regards to leasing cession contracts. Said cession amounts to UF 3,892. In compliance with what is set forth in Circular 77 of the Superintendence of Health, the Company covers its obligations by means of investments for Th$ 19,876,244 (Th$ 14,295,813 at December 31, 2013), bank performance bonds for Th$ 52,000,000 (Th$ 49,000,000 At December 31, 2013) and receivables amounting to Th$ 2,000,000 (Th$ 2,500,000 at December 31, 2013). Guarantees Following is the composition of the guarantees pledged by the affiliate Isapre Cruz Blanca S.A. at December 31, 2014 and December 31, 2013:
c) Integramédica S.A.
With regards to the pledges that affect the assets of the Company, as of this date the following guarantees of the subsidiaries of Integramédica, are in force:
The company Integramédica S.A. became a joint debtor of the liabilities acquired by its affiliate companies Exámenes de Laboratorio S.A. as a result of the “Appendix to the End User of SAP support License” subscribed on September 6, 2011.
Exámenes de laboratorio S.A. According to the contract “Debt recognition, and modification of credit contract” dated November 17, 2010 and sighted by the Public Notary Mr. Humberto Santelices Narducci, both in the loan operation and in regards to the guarantees the following personal guarantees were established: Exámenes de Laboratorio S.A., Laboratorios Integrados S.A., and Florida Salud Integral S.A. became guarantors and co debtors in favor of Corpbanca, Banco Security, Banco Bice and Banco del Estado de Chile, in relationship to all the liabilities of Inversiones Médicas Cuatro S.A., Idelpa Salud Dos S.A. (both companies are nowadays part of Bupa Chile S.A.) and Integramédica under the
12/31/2014 12/31/2013
Th$ Th$
Bank performance bonds 56,626,208 49,000,000
Credits 2,000,000 2,500,000
Total 58,626,208 51,500,000
Bank performance bonds
12/31/2014 12/31/2013
Th$ Th$
Banco Crédito e Inversiones 9,000,000 9,000,000
Banco de Chile 7,000,000 7,000,000
Banco del Estado 13,000,000 10,000,000
Banco BBVA 8,000,000 8,000,000
Banco Corpbanca 8,000,000 8,000,000
Banco Bice 626,208 0
Banco Santander 7,000,000 7,000,000
Banco Security 4,000,000 0
Total bank performance bonds 56,626,208 49,000,000
Concept
Issuer

82
contract “Debt recognition, and modification of credit contract” granted on that same date and sighted by the public notary Humberto Santelices Narducci.
d) Inversiones Clínicas CBS S.A.
As of December 31, 2014, the company has the following guarantees pledged to third parties: The company is a joint and severally liable codebtor of the liabilities of Inmobiliaria y Constructora CBS S.A. related to the contract of lines of credit signed on July 17, 2014 with Banco Itaú and BBVA. In the same contract the company has granted a lien on the total amount of the shares it owns in Inmobiliaria y Constructora CBS S.A.
Inmobiliaria y Constructora CBS S.A. In regards to the contract for the opening of lines of credit signed on July 17, 2014 with Banco Itaú and Banco BBVA and has pledged the following guarantees in favor of the aforementioned banks: Lien on any subordinated debt. Mortgage on the following land owned by the company:
a) Property located in Avenida Departamental 01455-A, La Florida, Santiago.
b) Property located in Avenida Departamental 01455-B, La Florida, Santiago. Lien on the construction and operation contracts that may be signed regarding the hospital that will be built in the abovementioned locations. Irrevocable mandate to the creditors to collect, receive and allocate all and each of the VAT Reimbursement payments.
Desarrollo e Inversiones Médicas S.A.
The Company Desarrollo e Inversiones Médicas S.A. holds a first degree mortgage in favor of Banco Security, on the building located at Anabaena 336, Jardín del Mar, Reñaca, Commune of Viña del Mar, related to the mortgage interest bearing loan. The net fixed asset value amounts to Th$ 8,874,635 at December 31, 2012. The subsidiary Clinica Reñaca S.A. became a guarantor and codebtor of Desarrollo e Inversiones Médicas S.A. with regards of the mortgage debt of the latter with Banco Security.
Inversiones Clínicas Pukará S.A.
The Company has become codebtor of its affiliate Centro Médico Antofagasta S.A. with regards to the liabilities that this company has acquired towards Banco Bice, to maintain a working capital line of credit.
Inmobiliaria Somequi Ltda.
The real estate located at Washington N° 2,489 and Baquedano N° 298, have mortgages on them to guarantee the obligations with Banco Security since 2007. These assets have restrictions to be pledged and divested.
Servicios y Abastecimientos a Clínicas S.A.

83
At December 31, 2014, there are assets located at the Obelisco Building of Matta N° 1839, Antofagasta, whose divestment has been agreed and collected, but at the closing of 2011 were still recorded in the Real Estate Registry under the name of the Company. The mortgages have not been raised due to: - Pending inscription of parking ports number 218, 222, 223 of the second level, 308, 311 and 326
of the third level. - Pending to record in deed the parking port number 225 of the second level.
Centro Médico Antofagasta S.A.
To guarantee the obligations that this company acquired in 2007 with Banco Security, the Company has mortgaged the real estate located at Matta N° 1923, 1927, 1931, 1933, 1945 and 1959, Coquimbo N° 671 in the city of Antofagasta. These assets can not be pledged or divested.
Inmobiliaria Somequi S.A.
The real estate located at Washington N° 2,489 and Baquedano N° 298, have mortgages to guarantee the obligations the company acquired in 2006 with Banco Security. These assets cannot be pledged or divested.
Inmobiliaria Centro Médico Antofagasta S.A.
To guarantee the obligations acquired by Servicios and Abastecimientos a Clínicas S.A. with Banco Security during 2006 and 2007, mortgages have been established on the following assets:
1. First mortgage on:
- All the underground and the first, second and third levels and eleventh level of the Pukará
building located at Matta N° 1868.
- On the property located at 8367 Pedro Aguirre Cerda Avenue, lot 255, block 19, of the El Trocadero suburb.
2. Also, the lending company established a second mortgage on the same building to guarantee the
faithful and timely commitment of all and each of the obligations that the Affiliate Company currently owes.
3. For the assets singled out in point a)1. there is a restriction to pledge and divest, in favor of
Banco Security.
To guarantee the obligations acquired in 2006 with Banco Security, the Company has set mortgages on real estate located in Matta numbers 1923, 1927, 1931, 1933, 1945 and 1959, Coquimbo N° 671 of the city of Antofagasta. These assets have restrictions to pledge and divest.
Corporación Médica de Arica S.A. There are inscriptions regarding the following properties: 1. This company owns the following real estate located in Arica, and that are pledged in mortgage in
favor of Banco Security: Box numbers 112, 113, 213, 214, 219, 312, D-11, D-12, D-13, D-14, DX, 401, 402, 404, 405, 406, 410, 414, 417, 419, 420, 421, 423, 424, 425, 427, 428, 429, 430, 431, 432, 433, 435, 436 and Hospital, Building Edificio Clinica San José located in 1370 Juan Noé street, Arica, which is entered in page 2631 number 2080 and page 2630 number 2079, both in the Properties Register of the Real Estate Registry of Arica, of year 1991.
2. Transit, power and visitation easements recorded in page 4602 number 1958 in the Registry of Mortgage and Liens of the Curator of Real Estate of Arica.

84
e) Bupa Chile Servicios Corporativos SpA. As a result of the contract of guarantee and co-debt dated November 17, 2010, sighted by the Public Notary of Santiago Mr. Eduardo Diez Morello, Centro Medico Familiar S.A. (now Bupa Chile Servicios Corporativos SpA) became guarantors and co debtors in favor of Corpbanca, Banco Security, Banco Bice and Banco del Estado de Chile with regards to all liabilities of Inversiones Médicas Cuatro S.A., Idelpa Salud Dos S.A. (both companies currently Bupa Chile S.A.) and Integramédica under the contract named "Acknowledgement of Debt, Modification of Contract of Credit" granted on that same date, and sighted by the Public Notary Humberto Santelices Narducci. f) Inversiones CBS SpA As a result of the contract of guarantee and co-debt dated November 17, 2010, sighted by the Public Notary of Santiago Mr. Eduardo Diez Morello, this company became a guarantor and co debtor in favor of Corpbanca, Banco Security, Banco Bice and Banco del Estado de Chile with regards to all liabilities of Inversiones Médicas Cuatro S.A., Idelpa Salud Dos S.A. (both companies currently Bupa Chile S.A.) and Integramédica under the contract named "Acknowledgement of Debt, Modification of Contract of Credit" granted on that same date, and sighted by the Public Notary Humberto Santelices Narducci. As a result of the contract to obtain of lines of credit between Inmobiliaria y Constructora CBS S.A. and Banco Itaú and Banco BBVA Chile on July 17, 2014, Inversiones CBS SpA pledged all its shares in Inversiones Clínicas CBS S.A. and Inmobiliaria y Constructora CBS S.A. g) Cruz Blanca Salud Internacional S.A. As of December 31, 2014, the company does not have guarantees pledged to third parties, nor contingent assets or liabilities nor other commitments.
h) Cruz Blanca Compañía de Seguros de Vida S.A.
As of December 31, 2014, the company does not have guarantees pledged to third parties, nor contingent assets or liabilities nor other commitments.
NOTE 31.- PERSONNEL DISTRIBUTION The personnel distribution of the Group At December 31, 2014 and December 31, 2013 is the following:
Managers
and
Executives
Staff and front
desk Clinical Area Total
Insurer Area 28 2,040 0 2,068
Hospital Healthcare Area 55 672 1,263 1,990
Outpatients Healthcare Area 75 1,748 1,357 3,180
International Area 11 173 253 437
Other 16 145 0 161
Total 185 4,778 2,873 7,836
Segment
12/31/2014
Managers
and
Executives
Staff and front
desk Clinical Area Total
Insurer Area 28 1,926 0 1,954
Hospital Healthcare Area 39 755 1,163 1,957
Outpatients Healthcare Area 76 1,873 1,320 3,269
International Area 9 156 220 385
Other 18 126 0 144
Total 170 4,836 2,703 7,709
Segment
12/31/2013

85
NOTE 32.- ENVIRONMENT As Bupa Chile S.A. is an investment company, does not generate operations that could impact the environment, and for this reason it has not made disbursements related to this. The affiliates are concerned about the protection of the environment. As a result, all installations that operate continuously use as a main source of power electricity and gas, using only in cases of emergency oil for the power generator equipment. The handling of both solid and liquid waste is of paramount importance for Bupa Chile S.A. and its affiliates that are involved in the hospital and outpatients healthcare. Therefore, there is a strict control on the compliance of the handling of solid waste in accordance with the Ministry of Health (REAS, by its acronym in Spanish). The same is true regarding the liquid waste which is managed with a detailed discharge control plan through discharge chambers and an adequate use of sanitizers and cleaning chemicals while minimizing the impact to the environment and to peoples' health. The affiliates are participants in the health care provider market, whose nature involves the rendering of a service that does alter the environmental conditions. Both the parent company and its affiliates comply with the current standards and regulations. On September 20, 2014 the Regional Secretary of the Ministry of Transportation and Telecommunications of the Metropolitan Region, in Resolution Number 4140, approved the Study of Impact on the Urban Transportation System presented by Inmobiliaria y Constructora CBS S.A. for the project named "Clínica Bupa Santiago" which will be located in Avenida Departamental 1455, La Florida, Santiago.

86
NOTE 33.- LOCAL AND FOREIGN CURRENCY
12/31/2014 12/31/2013
Th$ Th$
Cash and cash equivalents 23,452,576 19,480,538
US dollar 483,305 8,572
Peruvian New Sol 370,649 1,891,233
UF 3,073,601 3,027,667
Non-restatable pesos 19,525,021 14,553,066
Other financial assets, current 1,177,747 26,074,375
Peruvian New Sol 0 14,716
UF 243,317 17,382,401
Non-restatable pesos 934,430 8,677,258
Other non-financial assets, current 10,089,466 7,685,085
Peruvian New Sol 132,356 22,516
UF 18,437 27,570
Non-restatable pesos 9,938,673 7,634,999
Cuentas por cobrar a entidades relacionadas corrientes 374,287 485,993
UF 3,198 0
Non-restatable pesos 371,089 485,993
Trade debtors and other accounts receivable, current 55,571,019 46,770,122
Peruvian New Sol 2,413,912 2,069,178
Non-restatable pesos 53,157,107 44,700,944
Inventory 2,599,415 2,407,095
Peruvian New Sol 231,690 129,349
Non-restatable pesos 2,367,725 2,277,746
Current tax assets 6,560,438 7,936,290
Peruvian New Sol 85,611 526,972
Non-restatable pesos 6,474,827 7,409,318
Total Current Assets 99,824,948 110,839,498
Assets

87
NOTE 33.- LOCAL AND FOREIGN CURRENCY (Continued)
Other financial assets, non-current 37,578,806 23,961,092
UF 33,494,076 19,952,012
Non-restatable pesos 4,084,730 4,009,080
Other non-financial assets, non-current 42,684,326 36,816,414
Peruvian New Sol 598,203 0
UF 314,953 298,038
Non-restatable pesos 41,771,170 36,518,376
Intangible assets other than goodwill 105,758,070 103,287,509
Peruvian New Sol 4,011,928 2,452,809
Non-restatable pesos 101,746,142 100,834,700
Goodwill 83,530,937 83,533,337
Peruvian New Sol 2,758,954 2,761,355
Non-restatable pesos 80,771,983 80,771,982
Property, plant, and equipment 132,586,625 116,913,293
Peruvian New Sol 9,306,883 8,839,558
Non-restatable pesos 123,279,742 108,073,735
Investment property 1,728,278 1,768,412
Non-restatable pesos 1,728,278 1,768,412
Deferred tax assets 11,907,031 4,825,743
Peruvian New Sol 1,358,246 729,198
Non-restatable pesos 10,548,785 4,096,545
Total Non-Current Assets 415,774,073 371,105,800
Total Assets 515,599,021 481,945,298
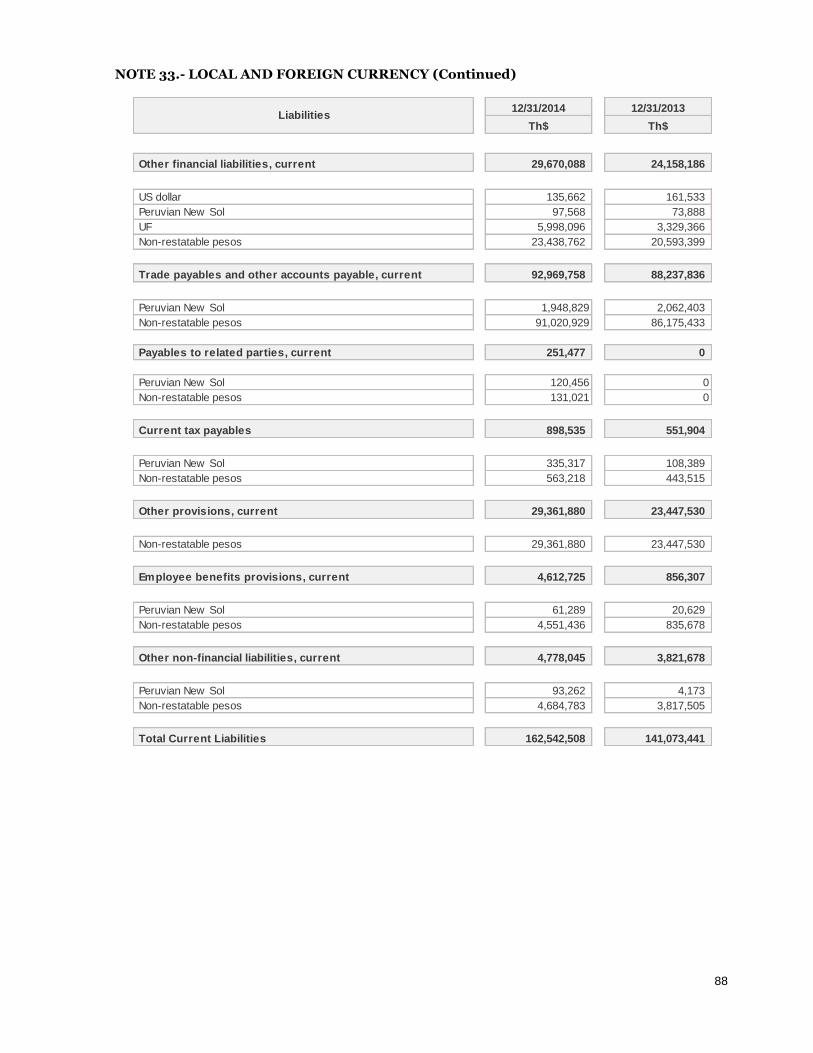
88
NOTE 33.- LOCAL AND FOREIGN CURRENCY (Continued)
12/31/2014 12/31/2013
Th$ Th$
Other financial liabilities, current 29,670,088 24,158,186
US dollar 135,662 161,533
Peruvian New Sol 97,568 73,888
UF 5,998,096 3,329,366
Non-restatable pesos 23,438,762 20,593,399
Trade payables and other accounts payable, current 92,969,758 88,237,836
Peruvian New Sol 1,948,829 2,062,403
Non-restatable pesos 91,020,929 86,175,433
Payables to related parties, current 251,477 0
Peruvian New Sol 120,456 0
Non-restatable pesos 131,021 0
Current tax payables 898,535 551,904
Peruvian New Sol 335,317 108,389
Non-restatable pesos 563,218 443,515
Other provisions, current 29,361,880 23,447,530
Non-restatable pesos 29,361,880 23,447,530
Employee benefits provisions, current 4,612,725 856,307
Peruvian New Sol 61,289 20,629
Non-restatable pesos 4,551,436 835,678
Other non-financial liabilities, current 4,778,045 3,821,678
Peruvian New Sol 93,262 4,173
Non-restatable pesos 4,684,783 3,817,505
Total Current Liabilities 162,542,508 141,073,441
Liabilities
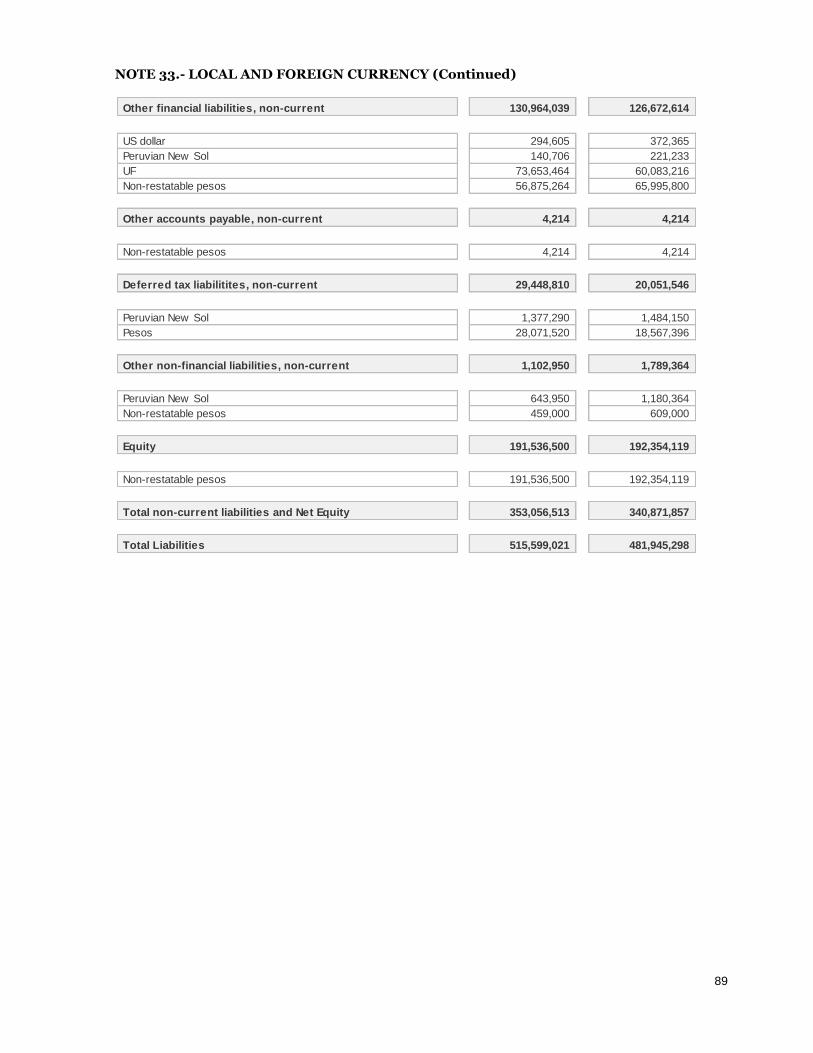
89
NOTE 33.- LOCAL AND FOREIGN CURRENCY (Continued)
Other financial liabilities, non-current 130,964,039 126,672,614
US dollar 294,605 372,365
Peruvian New Sol 140,706 221,233
UF 73,653,464 60,083,216
Non-restatable pesos 56,875,264 65,995,800
Other accounts payable, non-current 4,214 4,214
Non-restatable pesos 4,214 4,214
Deferred tax liabilitites, non-current 29,448,810 20,051,546
Peruvian New Sol 1,377,290 1,484,150
Pesos 28,071,520 18,567,396
Other non-financial liabilities, non-current 1,102,950 1,789,364
Peruvian New Sol 643,950 1,180,364
Non-restatable pesos 459,000 609,000
Equity 191,536,500 192,354,119
Non-restatable pesos 191,536,500 192,354,119
Total non-current liabilities and Net Equity 353,056,513 340,871,857
Total Liabilities 515,599,021 481,945,298

90
NOTE 34.- SIGNIFICANT EVENTS As of December 31, 2014, the Company has issued the following significant events: Agreements of Extraordinary Shareholders’ Meeting On November 24, 2014 the Company reported that on that day’s Extraordinary Shareholders’ Meeting an agreement was reached to modify the legal name of the Company, replacing Bupa Chile S.A. in place of Bupa Chile S.A. As a result of this agreement Article 1 of the Company’s by-laws was modified. The Company also reported that the change does not involve a change in the legal name of the Isapre Cruz Blanca S.A. nor of Cruz Blanca Compañía de Seguros de Vida S.A. which shall continue to operate using their current legal names. Impact of Law 20,780 On October 30, 2014 the Company reported to the Superintendence Of Securities and Insurance that as a consequence of what is set forth in Law 20,790 and applying in the interim the Partially Integrated System – pending the realization of an Extraordinary Shareholders’ Agreement to agree on another system in accordance to the Law and Circular 856 of the SVS dated October 17, 2014 – the impact of deferred taxes as a result of the increases in the corporate income tax rate as included in said Law would mean a charge against the Company’s equity for an approximate amount of $7,013 million pesos. In addition, the impact to income in 2014 is an estimated $147 millions, related to the increase from 20% to 21% corporate income tax rate. The impact for the changes introduced in Law 20,780 would am0unt to an estimated $7,160 millions. This information shall be included in the financial statements at December 21, 2014. Summon to Extraordinary Shareholders’ Meting On November 3 2014 the Company reported to the Superintendence of Securities and Insurance that during the meeting held on October 30 by the Board of Directors it was agreed to summon to an Extraordinary Shareholders’ Meeting to be held on November 24, 2014, in order to decide on the proposal to modify the legal name of the Company. The proposal was to replace Cruz Blanca Salud S.A. in place of Bupa Chile S.A. In case of approving the proposal Article 1 of the by-laws would be changed to reflect the aforementioned change. Signature of financing contract for the construction of a hospital in La Florida On July 18, 2014 the Company reported that on July 17, 2014 the company Inmobiliaria y Constructora CBS S.A. - an indirect subsidiary of Bupa Chile S.A. - signed a financing contract with Banco Bilbao Vizcaya Argentaria, Chile, and Banco Itau Chile for an amount of up to UF 3,224,940. The financing will be used in the construction and VAT, start-up costs and operations of the hospital that Group Bupa Chile will build in the commune of La Florida, in the Metropolitan Region. The financing term is of 20 years, including the construction period and has the usual guarantees given in this type of operations, such as a mortgage on the land where the hospital will be located and lien on the shares of the affiliates. Furthermore, Bupa Chile S.A. has entered as co-debtor to guarantee to the creditors the entire, effective and timely compliance with all the obligations related to the financing contract. General Shareholders' Meeting On April 25, 2014 the Company reported to the Superintendence of Securities and Insurance that on that date was held the Ordinary Shareholders’ Meeting of Bupa Chile S.A., which was held with a quorum of 92.009672% of the shares issued and paid. During this meeting the following matters were covered:
1. The Annual Report, General Balance and Financial Statements of the company, corresponding to the 2013 period, had been approved;

91
2. The Report of the Independent Auditor with respect for the period ended on December 31, 2013, was approved;
3. The compensation of the Board for the 2012 period and the expenses for said period was approved.
4. The activity report of the Directors Committee and their compensation was approved for the 2014 period.
5. The report on the information described in Title XVI (Disclosures on transactions with related entities) of Law 18046 on Corporations was approved.
6. KPMG Auditores Consultores Limitada was designated as the Independent Auditor for the 2014 period.
7. Humphreys Limitada and Fitch Chile Clasificadora de Riesgo Limitada were designated as risk ratings agencies.
8. The newspaper Diario Financiero was designated as the medium which will carry the official publications of the Company.
9. As definite minimum compulsory dividend, an additional profit distribution of $6.5 (six point five Chilean pesos) per share, payable from may 7, 2012 to the shareholders recorded in the corresponding Registry five days prior to that date. In this regard, Annex 1 to the Circular Number 660 of the Superintendence of Securities and Insurance is attached.
10. It was made present that a certified copy of the minutes of the Meeting would be sent to the Superintendence of Securities and Insurance within the time frame set for this in the current regulations and that at each opportunity the representatives of the Pension Funds Administration companies voiced their approval.
Summon to General Shareholders' Meeting On March 28, 2014 the Company reported to the Superintendence of Securities and Insurance that in meeting of the Board of Directors held on March 27, the Board agreed to: A. Summon the General Shareholders' Meeting to assemble on April 24, 2014 at 11.30am in Teatro Mori,
located at 5413 Avenida Presidente Kennedy, Las Condes, in order to:
1. Make a statement regarding the Annual Report, General Balance and Financial Statements of the Company, corresponding to 2013.
2. Make a statement regarding the report of the independent accountants. 3. Make a statement regarding the Board compensation for the period 2013 and to report on Board
expenses corresponding to 2013. 4. Report on activities and expenses of the Committee of Directors and to establish its
compensation for 2013. 5. Report on information set forth in Title XVI of Law 18,046. 6. Designate an independent accountant. 7. Designate risk rating agencies. 8. Designate the newspaper where the company's communications will be published. 9. Propose amounts for dividend payments. 10. Treat any other matter of interest for the shareholders and that may be the subject of this type of
Meeting. B. Regarding dividends payments, the Board agreed to propose to the Shareholders Meeting the
payment of $6.5 per share, corresponding to 40.13% of 2013's profits. Election of Committee of Directors and Chairman of the Board On March 12, 2014 Bupa Chile S.A. reported that in Board session held on March 11, 2014, the Board of Directors approved the following:
1. To appoint Mr. Salvador Said Somavía as Chairman of the Board of Bupa Chile S.A. 2. As independent member of the Board, Mr. Jorge Bande Bruck appointed Messrs.’ Carlos
Antonio Jaureguizar Ruiz-Jarabo and Rodrigo Muñoz Muñoz to form with him the Directors Committee of the Company, as set forth in article 50bis of Law 18.046.
3.
92
Agreements of the extraordinary Shareholders' Meeting On March 12, 2014, the Company reported to the Superintendence of Securities and Insurance that during the Extraordinary Shareholders' Meeting of Bupa Chile S.A. held on March 11, 2014, the following agreements were reached: 1. To increase the amount of Members of the Board from 7 to 9 members.
2. To modify article 7 of the Company's by-laws to reflect the increase in the number of members that compose the Board of Directors.
3. To revoke the current Board of Directors and to elect the following people as the Company's Directors, for the following three years:
Alvaro Erazo Latorre
Carlos Antonio Jaureguizar Ruiz-Jarabo
Gabriela Pueyo Roberts
Ignacio Ereño Iribarren
Jorge Bande Bruck (independent)
José Francisco Tomás Martínez
Monica Paramés García-Astigarraga
Rodrigo Muñoz Muñoz
Salvador Said Somavía
4. Prepare a revised consolidated text of the Company By-Laws.
Outcome of the Tender Offer On February 24 the Company reported to the Superintendence of Securities and Insurance of the successful outcome of the tender offer made by Grupo Bupa Sanitas Chile Uno SpA. Said company acquired control of Cruz Blanca Salud, nowadays, Bupa Chile on February 24, 2014, by acquiring 359,520,000 shares that represent a 56% of its share capital, and therefore has acquired the control of Cruz Blanca Salud S.A. This will be realized on March 11, 2014, in the Extraordinary Shareholders' Meeting. Summon To Extraordinary Shareholders' Meeting On January 31, 2014 the Company communicated to the Superintendence of Securities and Insurance of the summon to an Extraordinary Shareholders' Meeting of te Society to be held on March 11, 2013 in order to increase the number of Directors from 7 to 9, to modify the Company By-Laws in case of reaching said agreement, revoke the current Board and name the new Board members if the previous step is approved, and to agree on a new consolidated text for the By-Laws. Satisfactory Due Diligence On January 15, 2014, the Company reported to the Superintendence of Securities and Insurance that the due diligence process carried by Bupa Sanitas SL was satisfactorily concluded. This due diligence took place in the context of the tender offer that Fondo de Inversión Privado Costanera ("FIP Costanera") had communicated to the Company, related to the conditional promise to sell shares underwritten with Grupo Bupa Sanitas S.A., related to a tender offer for the acquisition of shares for at least 50% of the share capital of Bupa Chile (formerly Cruz Blanca Salud) plus one share (which could reach up to 56% of the share capital of Bupa Chile S.A.). NOTE 35.- SUBSEQUENT EVENTS At December 31, 2014, there are no subsequent events to report.