Embed Size (px)
Citation preview
A&ric Edrwnt Vol. 19, No. 12. pp. 2083-2097. 1985 C0C4-6981~5 $3.00 + 0.00
Printed in Great Britain. 0 1985 Pergamon Rosa Ltd.
CRUSTAL ENRICHMENTS IN THE ARCTIC AEROSOL
NIELS Z. HEIDAM
National Agency of Environmental Protection, Air Pollution Laboratory, Ri4 National Laboratory, DK-4000 Roskilde, Denmark
(First received 5 November 1984, injnalform 11 March 1985 and receivedfor publication 31 May 1985)
Abstract-Aerosol samples collected at various sites in Greenland for over a year have been analyzed by PIXE to determine the elemental composition. The data have been converted to crustal enrichment factors E using Ti as reference. After a short description of the results of a previous analysis of the total elemental concentrations, annual and monthly means of enrichment factors for the elements Al, Si, S, Cl, K, Ca, Cr, Mn, Fe, Ni, Cu, Zn, Br, Sr and Pb are presented. It is argued that the logarithm of the enrichment factor is a useful statistical measure of excess or non-crustal aerosol and these data are then studied by means of principal factor analyses. It is found that the non-crustal aerosol can be considered to be composed of 2-3 different source-related components that contribute equally to the total variance. One of these is a General Industry component of highly enriched elements that appears to originate in midlatitude regions. It has a pronounced winter maximum and is quite similar to a combustion component of the total aerosol. In the remaining components non-enriched elements are dominant. One of these components appears to be of distant marine origin, whereas the other derives from ferro-metal processes in industrial source areas and has a sharp peak in midwinter.
Key word index: Arctic aerosol, Greenland, enrichment factors, sources, transport, factor analysis.
1. INTRODU~ION
The origins of the Arctic aerosol are now known to extend from distant midlatitude sources to indi- geneous sources within mesoscale range. The sources are of both natural and anthropogenic character and their influences in the Arctic vary strongly with the season.
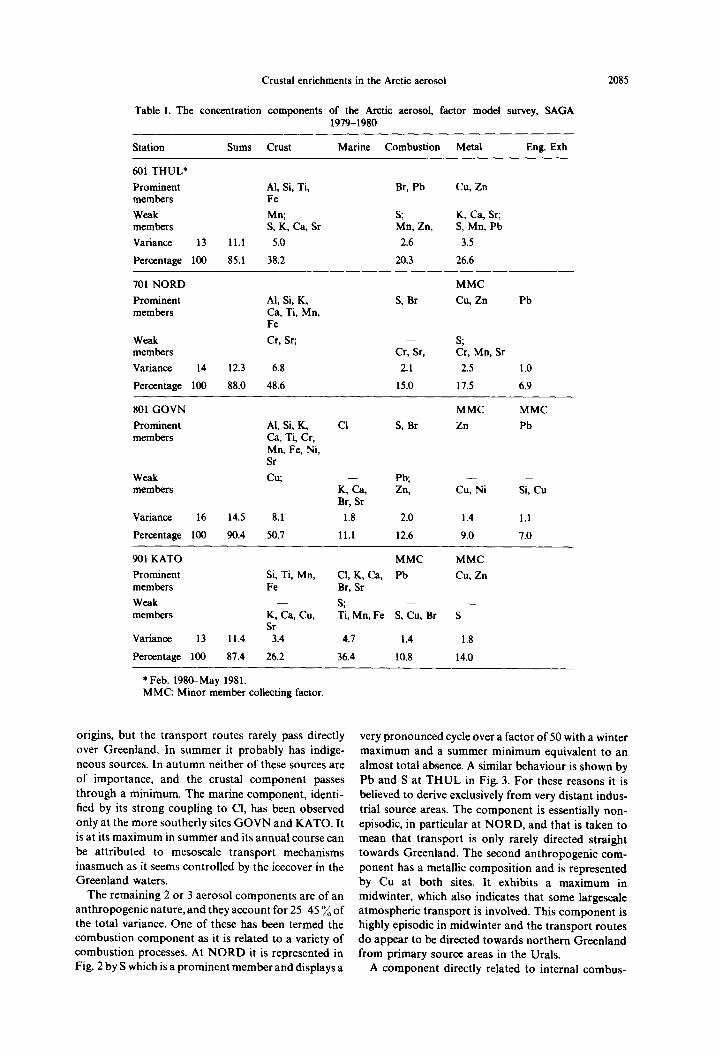
These conclusions have been reached in a number of studies (e.g. AGASP, 1984) and also in the Danish Study of the Arctic Greenland Aerosol (SAGA) (Heidam, 1983, 1984). In the SAGA project, atmos- pheric aerosol samples were collected twice a week at various sites in Greenland (see Fig. 1) for more than a year and analyzed by PIXE to determine the elemental concentrations in the aerosol.
The above study was concerned with these total concentrations, but it appears that additional informa- tion on the composition and origins of the Arctic aerosol can be extracted from the data through a study of the crustal enrichment factors of the elements.
To facilitate a comparison with the new results presented here, a brief summary of the earlier findings will be given. At the Thule site the time series has, however, been extended from 6 to 16 months.
2. CONCENTRATIONS
The samples under consideration were collected in the period August/September 1979-August/ September 1980 at the sites NORD, GOVN and KATO and at THUL from February 1980 to May
1981. About 15 different elements were detected regularly above the detection limits.
The elemental composition of the aerosol was studied by means of factor analysis of the logarithmic concentrations (Harman, 1976; Heidam, 1982). The result of the analysis was remarkable. It was found that the atmospheric aerosol in Greenland, sampled at these sites separated by up to 1600 km, can be de- scribed by the same 4-5 different source related and statistically independent components. This can be seen in the summary of the factor models shown in Table 1. For each station and each factor or aerosol component the more important elements loaded on that factor are listed. Elements with factor loadings a2 > 0.5 are labelled prominent and those with a2 > 0.1 are label- led weak members of the factors. For weakly coupled elements the dominant membership is listed sep- arately. The remaining elements with statistically sig- nificant loadings a2 < 0.1 are called minor members. They are not listed, but if they dominate the loadings of a factor, that factor is labelled minor member collector (MMC).
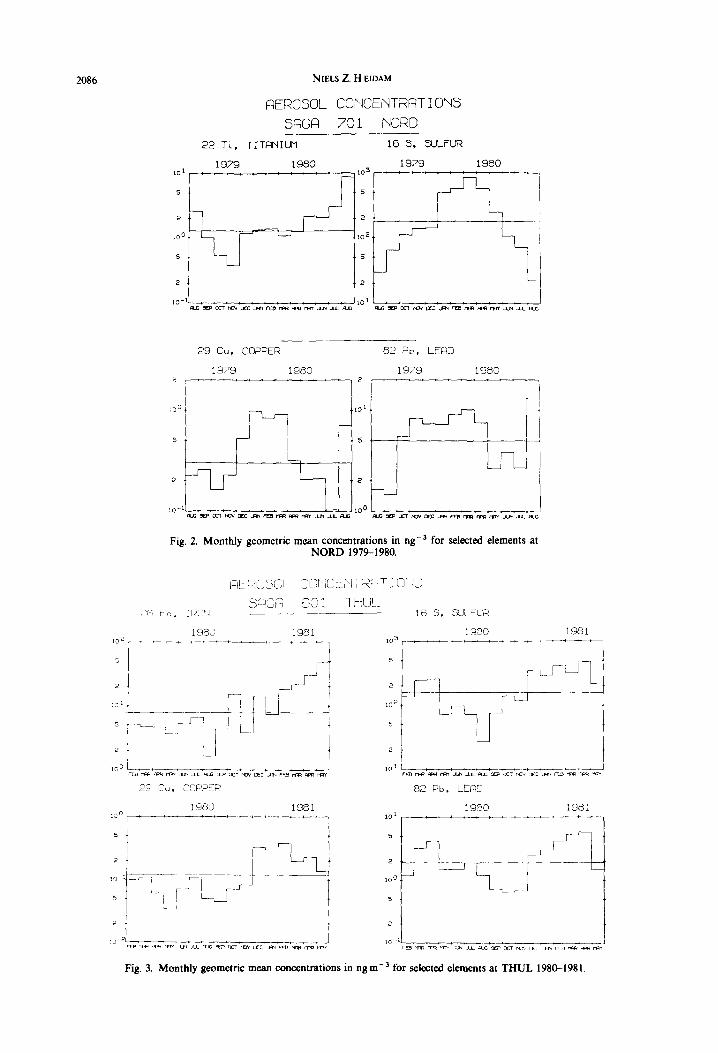
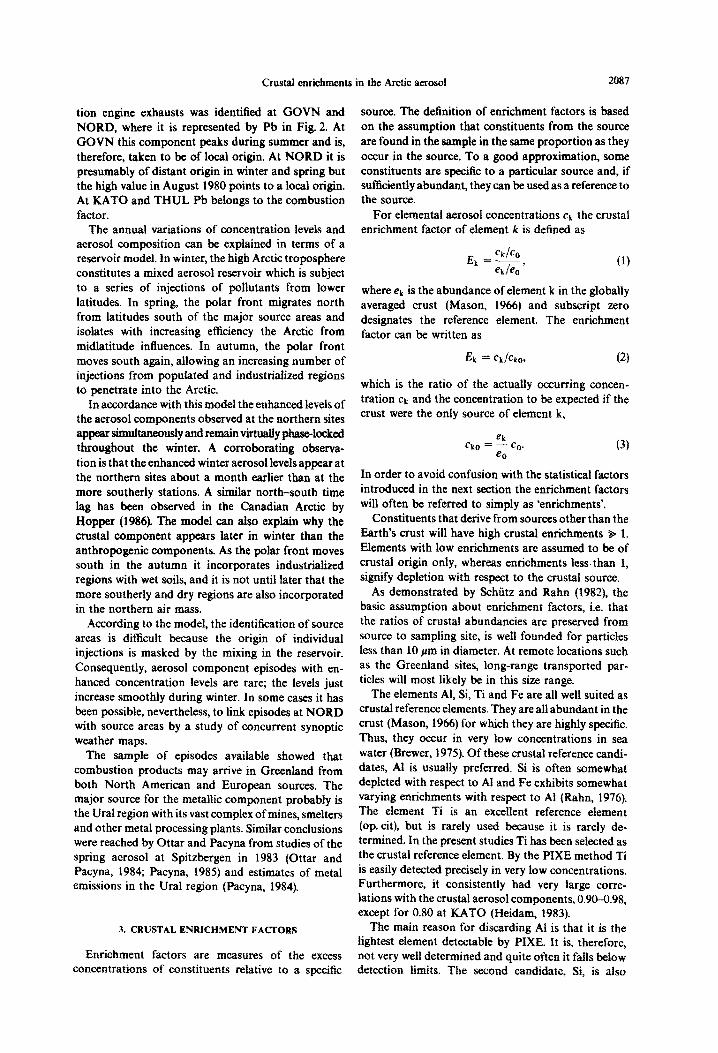
The temporal behaviour of the components at NORD and THUL is illustrated in Figs 2 and 3 by monthly geometric means of selected prominent member elements. Two of the aerosol components have a natural origin as they consist of a crustal component that derives from erosion processes and a marine component produced by sea spray. They account for 40-60 y0 of the total logarithmic variance. In winter and early spring the crustal component, represented by monthly geometric means of Ti at NORD and Fe at THUL, appears to have very distant
2083
2084 Nms Z. H EIDAM
II GR0NLAND
)I f 40
‘;THE SAGA STATIONS\
Fig. 1. Location af the SAGA stations in Greerhd.
Crustal enrichments in the Arctic aerosol
Table 1. T’he concentration components of the Arctic aerosol, factor model survey, SAGA 1979-1980
Station Sums Crust Marine Combustion Metal Eng. Exh
601 THUL*
Prominent Al, Si, Ti, Br, Pb Cu, Zn members Fe
Weak Mn; S; K, Ca, Sr; members S, K, Ca, Sr Mn, Zn, S, Mn, Pb
Variance 13 11.1 5.0 2.6 3.5
Percentage 100 85.1 38.2 20.3 26.6
701 NORD MMC
Prominent Al, Si, K, S, Br Cu, Zn Pb members Ca, Ti, Mn,
Fe
Weak Cr, Sr; S; members Cr. Sr, Cr, Mn, Sr
Variance 14 12.3 6.8 2.1 2.5 1.0
Percentage 100 88.0 48.6 15.0 17.5 6.9
801 GOVN MMC MMC
Prominent Al, Si, K, Cl S, Br Zn Pb members Ca, Ti, Cr,
Mn, Fe, Ni, Sr
Weak cu; Pb; - members K,< Zn, Cu, Ni s&u
Br, Sr
Variance 16 14.5 8.1 1.8 2.0 1.4 1.1
Percentage 100 90.4 50.7 11.1 12.6 9.0 7.0
901 KATO MMC MMC
Prominent Si, Ti, Mn, Cl, K, Ca, Pb Cu, Zn members Fe Br, Sr Weak S; -
members K, a, Cu, Ti, Mn, Fe S, Cu, Br S Sr
Variance 13 11.4 3.4 4.7 1.4 1.8
Percentage 100 87.4 26.2 36.4 10.8 14.0
*Feb. 198t&May 1981. MMC: Minor member collecting factor.
2085
origins, but the transport routes rarely pass directly over Greenland. In summer it probably has indige- neous sources. In autumn neither of these sources are
of importance, and the crustal component passes through a minimum. The marine component, identi- fied by its strong coupling to Cl, has been observed only at the more southerly sites GOVN and KATO. It is at its maximum in summer and its annual course can be attributed to mesoscale transport mechanisms inasmuch as it seems controlled by the icecover in the Greenland waters.
The remaining 2 or 3 aerosol components are of an anthropogenic nature, and they account for 2545 y/, of the total variance. One of these has been termed the combustion component as it is related to a variety of combustion processes. At NORD it is represented in Fig. 2 by S which is a prominent member and displays a
very pronounced cycle over a factor of 50 with a winter maximum and a summer minimum equivalent to an almost total absence. A similar behaviour is shown by Pb and S at THUL in Fig. 3. For these reasons it is believed to derive exclusively from very distant indus- trial source areas. The component is essentially non- episodic, in particular at NORD, and that is taken to mean that transport is only rarely directed straight towards Greenland. The second anthropogenic com- ponent has a metallic composition and is represented by Cu at both sites. It exhibits a maximum in midwinter, which also indicates that some largescale atmospheric transport is involved. This component is highly episodic in midwinter and the transport routes do appear to be directed towards northern Greenland from primary source areas in the Urals.
A component directly related to internal combus-
NIELS Z.H EIDAM
nEROSOL CONCENTRQTIONS
SPGFI 701 NORD
22 Ti. TITRNIUM 16 S. SULFUR
10’ 1979 1980 1979 1980
103
5
29 Cu, COPPER 82 Pb, LERD
1979 1980 1979 1983
Fig. 2. Monthly geometric mean concentrations in nge3 for selected elements at NORD 1979-1980.
100 1980 1981 1980 1981
: : 1oL ::.::::::,--t_-
5
‘59 w w TT, ui u ud Pp w Ih OF: Ri m WI? m m FE3_Ffle.?-Fn :>‘ILac~mIc‘m mIIsm~m
Fig. 3. Monthly geometric mean concentrations in ng m -3 for selected elements at THUL 1980-1981.
Crustal enrichments in the Arctic aerosol 2087
tion engine exhausts was identified at GOVN and NORD, where it is represented by Pb in Fig. 2. At GOVN this component peaks during summer and is, therefore, taken to be of local origin. At NORD it is presumably of distant origin in winter and spring but the high value in August 1980 points to a local origin. At KATO and THUL Pb belongs to the combustion factor.
The annual variations of ~ncentmtion levels and aerosol com~sition can be explained in terms of a reservoir model. In winter, the high Arctic troposphere constitutes a mixed aerosol reservoir which is subject to a series of injections of pollutants from lower latitudes. In spring, the polar front migrates north from latitudes south of the major source areas and isolates with increasing efficiency the Arctic from midlatitude influences. In autumn, the polar front moves south again, allowing an increasing number of injections from populated and industrialized regions to penetrate into the Arctic.
In accordance with this model the enhanced levels of the aerosol com~nents observed at the northern sites appearsimuitaneouslyandremain~~yphase-iocked throughout the winter. A corroborating observa- tion is that the enhanced winter aerosol levels appear at the northern sites about a month earlier than at the more southerly stations. A similar north-south time lag has been observed in the Canadian Arctic by Hopper (1986). The model can also explain why the crustal component appears later in winter than the anthropogenic components. As the polar front moves south in the autumn it incorporates industrialized regions with wet soils, and it is not until later that the more southerly and dry regions are also incorporated in the northern air mass.
According to the model, the identification of source areas is difficult because the origin of individual injections is masked by the mixing in the reservoir. Consequently, aerosol component episodes with en- hanced concentration levels are rare; the levels just increase smoothly during winter. In some cases it has been possible, nevertheless, to link episodes at NORD with source areas by a study of concurrent synoptic weather maps.
The sample of episodes available showed that combustion products may arrive in Greenland from both North American and European sources. The major source for the metallic component probably is the Ural region with its vast complex of mines, smelters and other metal processing plants. Similar conclusions were reached by Ottar and Pacyna from studies of the spring aerosol at Spitzbergen in 1983 (Ottar and Pacyna, 1984; Pacyna, 1985) and estimates of metal emissions in the Ural region (Pacyna, 1984).
3. CRUSTAL ENRICHMENT FACI’ORS
Enrichment factors are measures of the excess concentrations of constituents relative to a specitic
source. The definition of enrichment factors is based on the assumption that constituents from the source are found in the sample in the same proportion as they occur in the source. To a good approximation, some constituents are specific to a particular source and, if sufficiently abundant, they can be used as a reference to the source.
For elemental aerosol concentrations ck the crustal en~chment factor of element k is defined as
ck/% & =-
ek/% ’ where ek is the abundance of element k in the globally averaged crust (Mason, 1966) and subscript zero designates the reference element. The enrichment factor can be written as
Ek = CL/‘% (2)
which is the ratio of the actually occurring concen- tration ck and the concentration to be expected if the crust were the only source of element k,
ek ck(, =-c,,.
“0
In order to avoid confusion with the statistical factors introduced in the next section the enrichment factors will often be referred to simply as ‘enrichments’.
Constituents that derive from sources other than the Earth’s crust will have high crustal enrichments 9 1. Elements with low enrichments are assumed to be of crustal origin only, whereas enrichments less than 1, signify depletion with respect to the crustal source.
As demonstrate by Schiitz and Rahn (1982), the basic assumption about enrichment factors, i.e. that the ratios of crustal abundancies are preserved from source to sampling site, is well founded for particles less than 10 @rn in diameter. At remote locations such as the Greenland sites, long-range transported par- ticles will most likely be in this size range.
The elements Al, Si, Ti and Fe are all well suited as crustal reference elements. They area11 abundant in the crust (Mason, 1966) for which they are highly specific. Thus, they occur in very low concentrations in sea water @rewer, 1975). Of these crustal reference candi- dates, Al is usually preferred. Si is often somewhat depleted with respect to Al and Fe exhibits somewhat varying enrichments with respect to Al (Rahn, 1976). The element Ti is an excellent reference element (op. tit), but is rarely used because it is rarely de- termined. In the present studies Ti has been selected as the crustal reference element. By the PIXE method Ti is easily detected precisely in very low concentrations. Furthermore, it consistently had very large corre- lations with the crustal aerosol components, 0.90-0.98, except for 0.80 at KATO (Heidam, 1983).
The main reason for discarding Al is that it is the lightest element detectable by PIXE. It is, therefore, not very well determined and quite often it falls below detection limits. The second candidate, Si, is also

2088 NEELS Z. H EIDAM
discarded because it appears to be quite enriched relative to Al at the SAGA stations, in contrast to Rahn’s findings above. The enrichment of Si relative to Ti is considerably less.
Thus, the crustal enrichments reported are the enrichment factors with respect to Ti and with crustal abundancies taken from Mason (1966). The enrich- ment factors pertain to the elements used in the factor analyses of the total aerosols (Table 1). Any missing data have been substituted by reconstructed values from these analyses (Heidam, 1982).
That enrichment factors are proper statistical measures of excess concentrations can be seen in the following way: it has been demonstrated (Heidam, 1982, 1983) that the concentrations of elements in the Arctic aerosol are to a good approximation log- normally distributed, i.e. the logarithms of the concen- trations are normally distributed. Taking logarithms in Equation (2) yields
log & = log ck -log eke, (4)
i.e. a difference of normally distributed variables. Since any linear combination of normally dis-
tributed variables is itself so distributed (Mardia et ai., 1979), log E is expected to be approximately normally distributed. The approximation is actually quite good as can be seen from the cumulative plots for selected elements in Fig. 4.
The quantity log E is the difference between the actually observed and the expected quantities, i.e. it is a residual in the statistical sense. If element k does indeed derive from the crust, then Ek is close to unity and log Ek is a random residual with a mean value of zero.
The physical measure of excess (i.e. non-crustal) material used most often is
ckx = ck -Ckor
but neither this quantity nor its logarithm,
(5)
log ckx = log ck + log( 1 - i/I&), (6)
are simply distributed for values of E < 10; for E < 1 even the last equation loses its meaning. It is, therefore, our contention that log E is the proper statistical measure of excess or residual material, positive values signifying enrichment, negative ones depletion. In general log E should be preferred over cX, especially in cases with E < 10.
The total geometric means and standard deviations for Ti-enrichments relative to the average global crust are shown in Table 2 and Fig. 5. In general, there is a pronounced homogeneity in the geographical distri- bution of the excess material in the atmosphere over Greenland, in particular for the non-enriched ele- ments. The annual east-west deviations are within a factor of 3 (dotted lines in Fig. 5). Enriched elements are, however, more enriched at the northern sites, The exceptional case is excess S which exhibits a large latitudinal gradient on the west coast and no gradient on the east coast.
The other characteristic feature of the distribution
8P.S
98.5
98.0
SO.0
75.0
50.0
25.0
10.0 TH”L 1980-81, cunlu l&Z.
NOR0 1979-80. Curves M4. 2.0
0.5
0.t
IO-’ 109 IO’ 102 103
ENRICHMENT FACTORS
99.9 c -I L-
99.5 2 - 31 4”
- 98.0 TH”L 1980-81. curve. l&2, -
_ NORD 1979-80. Curves J&4. w 90.0 -
10' to2 103 10' 105
ENRICHMENT FACTORS
Fig 4. Cumulative plots for log E of selected elements. (a) THUL, 124 samples. Curve 1: K, Curve 2: Cu. NORD, 99 samples. Curve 3: Cr, Curve 4: Mn. (b)THUL, 124 samples. Curve 1: S, Curve 2: Pb. NORD, 99 samples.
Curve 3: S, Curve 4: Br.
of non-crustal material is the large difference in enrichments among groups of aerosol constituents.
The crustal elements Al, Si, K, Ca, Mn and Fe are characterized by low enrichment factors from 1.0 to 3.0 at all stations, except that Al appears to be somewhat depleted. That may, however, have been an effect of fairly high detection limits. The metals Ni and Sr also fall in this group of non-enriched elements. In the group of metals consisting of Cr, Cu and Zn there are considerable enrichments, 5-100, so they do not appear to be crustally derived. Finally, there is a group of highly enriched elements S, Cl, Br and Pb. The enrichments range from 120 to 7200 and the geo- graphic spread is considerable in this group.
Reports on crustal en~chments in the Arctic aerosol are scarce, and the majority of such results are given as excess concentrations in the sense of Equation (5). However, the enrichments found by Flyger and Heidam (1978) in a study of the summer aerosol in central North Greenland showed similar groupings, as did enrichments observed in rural Sweden by Lannefors et al. (1983), who, incidentally, also used Ti as a crustal reference. The annual mean Ti-enrichments in Greenland are, in general, considerably less than enrichments in rural Sweden. The exceptions are Sand

Crustal enrichments in the Arctic aerosol 2089
Table 2. Annual geometric means and standard deviations for Ti-enrichments, SAGA 1979-1980
THUL* NORD GOVN KATO Enrich Dev. Enrich Dev. Enrich Dev. Enrich Dev.
13 Al 14 Si 16 S 17 Cl 19 K 20 Ca 24 Cr 25 Mn 26 Fe 28 Ni 29 Cu 30 Zn 35 Br 38 Sr 82 Pb
0.65 1.73 0.35 1.34 0.79 1.83 1.99 1.73
5410 2.64 2350 5.96
2.48 1.95 1.39 2.08
1.94 1.78 1.39 1.35
2.10 2.01 1.81 1.88 5.58 2.62 1.80 2.07 1.66 1.28
18.0 2.90 19.0 4.96 97.2 3.43 96.4 5.33
7200 3.36 5100 5.58 2.64 2.22 2.21 3.12
1330 3.16 1310 5.70
0.28 1.78 1.16 2.40
979 4.39 4800 4.33
1.60 2.37 1.74 1.79 1.77 1.92 1.00 1.43 1.31 1.25 2.74 2.31 4.68 2.50
27.0 4.31 2010 4.21
3.30 2.17 122 3.71
1.41 2.24 2420 2.80 3990 3.92
2.40 1.87 1.76 1.81
1.22 1.60 1.41 1.25
12.0 2.91 47.6 3.79
2320 2.64 3.07 2.06
348 3.60
*Feb. 198CkMay 1981.
CRUSTAL ENRICHMENTS
100 10' 102 103 10'
@-a Western sites: THUL. GOVN
Fig. 5. Geometric mean enrichments at the western sites THUL and GOVN plotted a&nst the values at eastern sites NORD and KATO. Annual values. The dotted lines represent factors of three. Squares: southern sites GOVN and KATO. Trianglec northern sites THUL and NORD.
Br which are similarly enriched in these two areas separated by 4000 km.
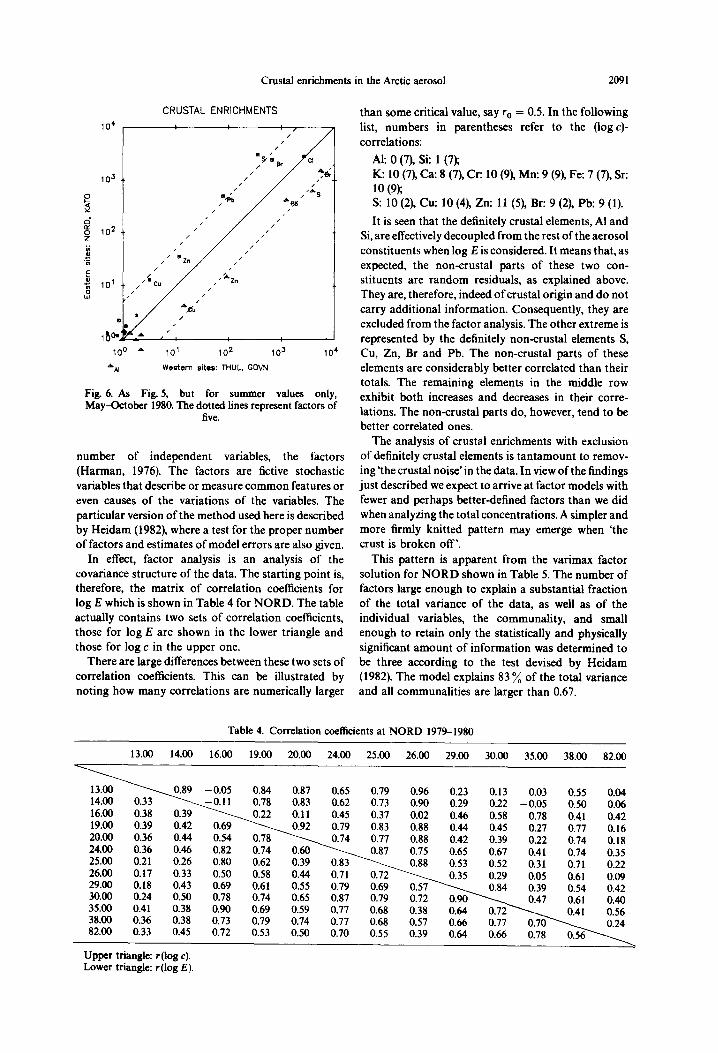
A similar summer difference is found for THUL by a comparison with the enrichments observed in June and July 1974 in central north Greenland by Flyger and Heidam (1978). Thus, an east-west gradient of non- crustal material seems to exist in north Greenland in the summer. Figure 6 also shows that at the southern stations the reverse situation exists, the enrichments on the west coast are about five times lower than on the east. The reasons for the existence of these gradients are not known but they can possibly be caused by differences in local emissions, as the non-crustal ele- ments are still considerably enriched.
A roughly similar grouping of elements is obtained from Table 2 if they are arranged according to the geometric standard deviations which measure the scale of relative variations over the year. The non-enriched metals have low standard deviations, from 1.25 to 2.5, whereas the enriched metals and the highly enriched elements vary with factors from 2.5 to 6, with a tendency for larger variations for the larger enrich- ment factors.
4. COMPONENTS OF THE NON-CRWTAL ARCTIC
AEROSOL
In order to investigate the occurrence of high and low enrichments, their mutual relation and their causes in more detail, the logarithms of the enrichment factors have been subjected to factor analysis.
Factor analysis is a statistical technique by which it is possible to build a linear model which relates a large
The annual variations are illustrated by the monthly number of interdependent variables to a smaller
geometric mean enrichment factors at THUL listed in Table 3. For the majority of elements maximum values occur in winter or Iate spring, just as for the concen- trations, but as expected it is only for the enriched elements that variations are large. Very large enrich- ments are attained by S and Br in midwinter.
A comparison of the monthly values at THUL and NORD shows that geographical homogeneity does not exist for all seasons. In winter the enrichments at THUL and NGRD are comparable; they compare well with enrichments found at Spitzbergen reported by Pacyna (1985) for March 1983. In summer, however, the enrichments for noncrustal elements are about five times larger at THUL than at NORD as can be seen from Fig. 6.

Tab
le 3
. M
onth
ly
geom
etri
c m
ean
s of
en
rich
men
ts a
t T
HU
L
1980
-198
1
Jan
. F
eb.
Mar
. A
pr.
May
Ju
n.
Jul.
Au
g.
Sep
. O
ct.
Nov
. D
ec.
1980
Nu
mbe
r 6
13 A
l 0.
47
14 S
i 0.
91
16 s
99
80
19 K
3.
12
20 C
a 1.
89
25 M
n
3.26
26
Fe
1.97
29
Cu
30
.5
30 Z
n
195
35 B
r 17
300
38 S
r 4.
63
82 P
b 17
90
Nu
mbe
r 9
8 13
Al
0.12
0.
45
14 S
i 0.
47
0.38
16
S
13tm
O
5310
19
K
3.75
3.
32
20 C
a 2.
07
2.39
25
Mn
3.
29
1.79
26
Fe
1.72
1.
20
29 C
u
62.3
22
.7
30 Z
n
208
96.3
35
Br
1200
0 80
10
38 S
r 3.
62
4.60
82
Pb
2730
10
70
8 0.56
1.
43
1820
0 3.72
2.
04
3.57
1.
81
37.2
30
6 49
200 5.
01
4860
1981
9 0.
69
0.50
31
70 2.05
1.
83
1.46
1.
12
9.39
42
.0
4090
1.94
10
60
4 7
9 8
9 9
9 8
9 0.
67
0.55
0.
32
0.43
0.
53
1.28
0.
81
1.62
0.
92
1.97
1.
23
1.13
1.
61
1.13
0.
96
0.61
0.
66
0.62
19
000
5830
55
50
3110
35
20
4850
21
00
7360
72
00
3.43
2.
13
2.23
2.
86
3.99
1.
99
1.07
2.
68
3.35
2.
18
1.01
0.
78
1.06
1.
88
0.96
0.
53
1.45
1.
91
2.91
2.
10
2.06
2.
32
2.58
1.
42
0.87
1.
41
2.12
1.
79
1.53
1.
59
1.48
1.
09
1.44
1.
18
1.24
1.
47
21.6
13
.2
15.0
21
.5
30.2
13
.6
5.03
24
.7
32.1
21
2 11
1 94
.5
191
273
60.7
19
.5
109
81.6
58
100
2640
0 10
300
4170
76
70
4910
97
6 40
60
3760
3.
32
2.3
1 1.
76
2.55
4.
21
2.39
1.
12
2.56
3.
42
6190
24
40
1700
16
80
3110
93
4 19
8 85
9 10
50
9 3
0.61
0.
56
0.43
0.
56
3490
89
1 1.
57
0.89
1.
37
0.97
1.
51
0.94
1.
13
1.02
7.
77
2.81
49
.8
14.8
63
00
1470
1.
68
1.00
83
9 12
2
Crustal enrichments in the Arctic aerosol 2091
CRUSTAL ENRICHMENTS
10’ I /
I I
100 A 10' 102 103 10' **I Western sites: MUL. COVN
Fig. 6. As Fig. 5, but for summer values only, May-October 1980. The dotted lines represent factors of
five.
number of independent variables, the factors (Harman, 1976). The factors are fictive stochastic variables that describe or measure common features or even causes of the variations of the variables. The particular version of the method used here is described by Heidam (1982), where a test for the proper number of factors and estimates of model errors are also given.
In effect, factor analysis is an analysis of the covariance structure of the data. The starting point is, therefore, the matrix of correlation coefficients for log E which is shown in Table 4 for NORD. The table actually contains two sets of correlation coefficients, those for log E are shown in the lower triangle and those for log c in the upper one.
There are large differences between these two sets of correlation coefficients. This can be illustrated by noting how many correlations are numerically larger
than some critical value, say r. = 0.5. In the following list, numbers in parentheses refer to the (logc)- correlations:
Al: 0 (7), Si: 1 (7); K: 10 (7), Ca: 8 (7), Cr: 10 (9), Mn: 9 (9), Fe: 7 (7), Sr:
10 (9); S: 10 (2), Cu: 10 (4), Zn: 11 (5), Br: 9 (2), Pb: 9 (1).
It is seen that the definitely crustal elements, Al and Si, are effectively decoupled from the rest of the aerosol constituents when log E is considered. It means that, as expected, the non-crustal parts of these two con- stituents are random residuals, as explained above. They are, therefore, indeed of crustal origin and do not carry additional information. Consequently, they are excluded from the factor analysis. The other extreme is represented by the definitely noncrustal elements S, Cu, Zn, Br and Pb. The non-crustal parts of these elements are considerably better correlated than their totals. The remaining elements in the middle row exhibit both increases and decreases in their corre- lations. The non-crustal parts do, however, tend to be better correlated ones.
The analysis of crusts1 enrichments with exclusion of definitely crustal elements is tantamount to remov- ing ‘the crustal noise’in the data. In view of the findings just described we expect to arrive at factor models with fewer and perhaps better-defined factors than we did when analyzing the total concentrations. A simpler and more firmly knitted pattern may emerge when ‘the crust is broken off’.
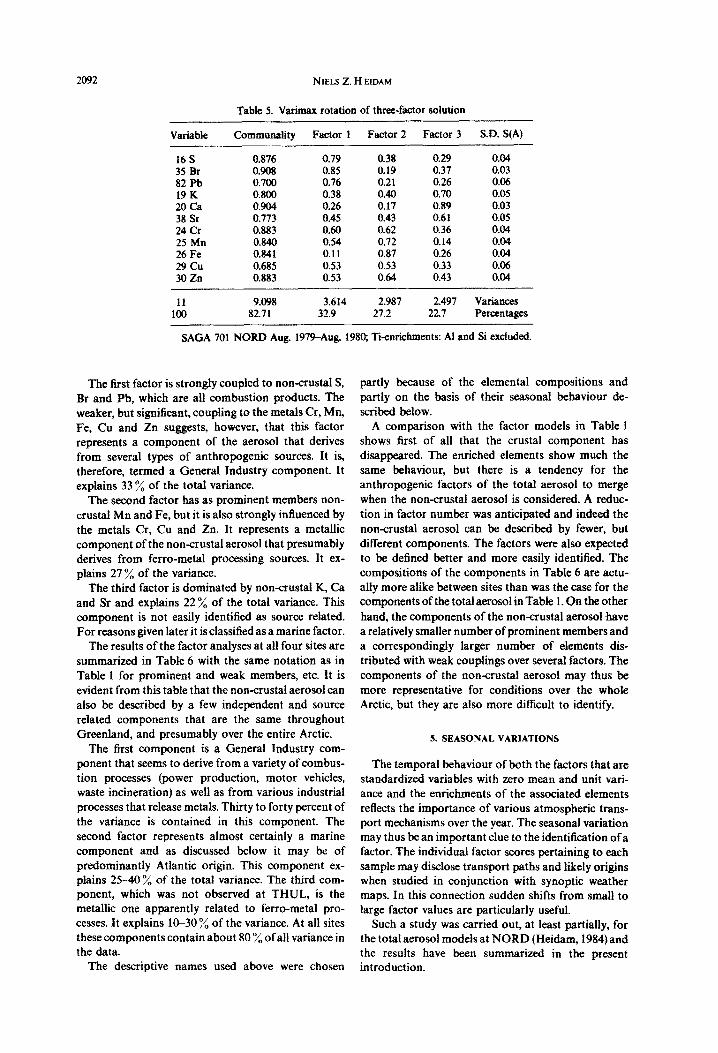
This pattern is apparent from the varimax factor solution for NORD shown in Table 5. The number of factors large enough to explain a substantial fraction of the total variance of the data, as well as of the individual variables, the communality, and small enough to retain only the statistically and physically significant amount of information was determined to be three according to the test devised by Heidam (1982). The mode1 explains 83 % of the total variance and all communalities are larger than 0.67.
Table 4. Correlation coefficients at NORD 1979-1980
13.00 14.00 16.00 19.00 20.00 24.00 25.00 26.00 29.00 30.00 35.00 38.00 82.00
0.55 0.04 0.50 0.06
20.00 0.36 0.44 24.00 0.36 0.46
26.00 0.17 0.33 0.50 0.58 0.44
35.00 0.41 0.38 0.90 0.69 0.59 0.77 0.68 0.38 0.64 38.00 0.36 0.38 0.73 0.79 0.74 0.77 0.68 0.57 0.66
Upper triangle: r(log c). Lower triangle: r (log E).
2092 NIELS Z. H EIDAM
Table 5. Varimax rotation of three-factor solution
Variable ~o~u~ty Factor 1 Factor 2 Factor 3 S.D. S(A)
16 s 0.876 0.79 0.38 0.29 0.04 35 Br 0.908 0.85 0.19 0.37 0.03 82 Pb 0.700 0.76 0.21 0.26 0.06 19 K 0.800 0.38 0.40 0.70 0.05 20 ca 0.904 0.26 0.17 0.89 0.03 38 Sr 0.773 0.45 0.43 0.61 0.05 24 Cr 0.883 0.60 0.62 0.36 0.04 25 Mn 0.840 0.54 0.72 0.14 0.04 26 Fe 0.841 0.11 0.87 0.26 0.04 29 Cu 0.685 0.53 0.53 0.33 0.06 30 Zn 0.883 0.53 0.64 0.43 0.04
11 9.098 3.614 2.987 2.497 Variances 100 82.71 32.9 27.2 22.7 Percentages
SAGA 701 NORD Aug. 197eAug. 1989 Ti-enrichments: Al and Si excluded.
The first factor is strongly coupled to noncrustal S, Br and Pb, which are all combustion products. The weaker, but signi~~nt, coupling to the metals Cr, Mn, Fe, Cu and Zn suggests, however, that this factor represents a component of the aerosol that derives from several types of anthropogenic sources. It is, therefore, termed a General Industry component. It explains 33 T/, of the total variance.
The second factor has as prominent members non- crustal Mn and Fe, but it is also strongly influenced by the metals Cr, Cu and Zn. It represents a metallic component of the non-crustal aerosol that presumably derives from ferro-metal processing sources. It ex- plains 27 % of the variance.
The third factor is dominated by non-crustal K, Ca and Sr and explains 22 ‘A of the total variance. This component is not easily identified as source related. For reasons given later it is classified as a marine factor.
The results of the factor analyses at all four sites are summarized in Table 6 with the same notation as in Table 1 for pro~nent and weak members, etc. It is evident from this table that the non-crustai aerosol can also be described by a few independent and source related components that are the same throughout Greenland, and presumably over the entire Arctic.
The first component is a General Industry com- ponent that seems to derive from a variety of combus- tion processes (power production, motor vehicles, waste incineration) as well as from various industrial processes that release metals. Thirty to forty percent of the variance is contained in this component. The second factor represents almost certainly a marine component and as discussed below it may be of pr~ominantly Atlantic origin. This component ex- plains 25-400/, of the total variance. The third com- ponent, which was not observed at THUL, is the metallic one apparently related to ferro-metal pro- cesses. It explains l&30% of the variance. At all sites these components contain about 80 % of all variance in the data.
The descriptive names used above were chosen
partly because of the elemental compositions and partly on the basis of their seasonal behaviour de- scribed below.
A comparison with the factor models in Table 1 shows first of all that the crustal component has disappeared. The enriched elements show much the same behaviour, but there is a tendency for the anthropogenic factors of the total aerosol to merge when the non-crustal aerosol is considered. A reduc- tion in factor number was anticipated and indeed the noncrustal aerosol can be described by fewer, but different components. The factors were also expected to be defined better and more easily identified. The compositions of the components in Table 6 are actu- ally more alike between sites than was the case for the components of the total aerosol in Table 1. On the other hand, the components of the non-crustal aerosol have a relatively smaller number of prominent members and a correspondingly larger number of elements dis- tributed with weak couplings over several factors. The components of the non-crustal aerosol may thus be more representative for conditions over the whole Arctic, but they are also more difficult to identify.
5. SEASONAL VARIATIONS
The temporal behaviour of both the factors that are standardized variables with zero mean and unit vari- ance and the enrichments of the associated elements reflects the importance of various atmospheric trans- port mechanisms over the year. The seasonal variation may thus be an important clue to the identification of a factor. The individual factor scores pertaining to each sample may disclose transport paths and likely origins when studied in conjunction with synoptic weather maps. In this connection sudden shifts from small to large factor values are particularly useful.
Such a study was carried out, at least partially, for the total aerosol models at NORD (Heidam, 1984) and the results have been summarize in the present introduction.

Crustal enrichments in the Arctic aerosol
Table 6. The components of the non-crustal Arctic aerosol, the Ti-enrichments, factor model survey 1979-1980
Station Sums General industry Marine Ferro-metal
601 THUL* Prominent S, Br, Pb, K, Ca, Sr, Weak Mn, Zn; cu;
K, Cu, Sr, S, Mn, Zn, Pb, Variance 9 7.2 3.7 3.9
Percentage 100 80 41 39 -
701 NORD Prominent S, Br, Pb K, Ck Mn, Fe,
Weak - Sr; Cr, Cut, Zn; K, Cr, Mn, S, Cr, Cut S, K, Sr, Cut, Sr, Zn, Br, Sr,
Variance 11 9.1 3.6 2.5 3.0
Percentage 100 83 33 23 27
801 GOVN Prominent S, Cu, Zn, Br, Pb, Cl, Sr, Mn, Fe
Weak Cr, Ni; K, Ca; K Ca Mn, Sr, S, Cr, Ni, Sk Ca, Cr,
Zn, Br, Ni, Br, Sr,
Variance 10.9 4.8 3.2 2.9
Percentage 100 84 37 25 22
901 KATO MMC Prominent S, Cy Zn, Pb Cl& K, Ca, Sr, Fe, Weak Mnt; Brt; Mnt;
K, Ca, Brt, S, Variance 11 8.7 3.6 3.8 1.3
Percentage 100 79 33 34 12
*Feb. 198tkMay 1981, 124 samples. t Communality h2 c 0.7. $ Many data below d.1.; reconstructed.
2093
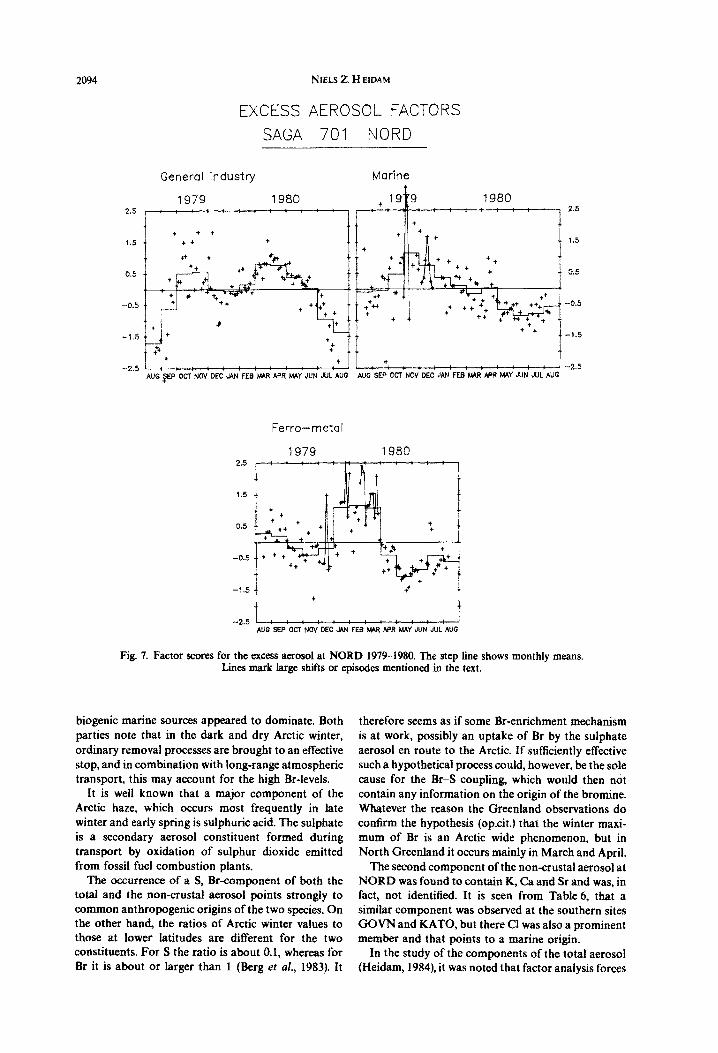
For the non-crustal aerosol, in general it should suffice to present the seasonal variations with anno- tations as to similarities and dissimilarities with the earlier findings. The monthly mean values of estimated factor values for the non-crustal aerosol at NORD are presented in Fig. 7, together with the individual values.
The General Industry component has a clear annual variation from low summer to high winter values in March and April with comparatively little scatter. In this respect it is quite similar to the combustion component of the total aerosol. The October- November maximum may not be significant, the scatter is considerable. The General Industry com- ponent of the non-crustal aerosol and the combustion component of the total aerosol also resemble each other in that they are non-episodic. The origins are presumably the same distant source areas, but there is rarely direct transport of these components to North Greenland.
The enrichments of the prominent member S and the weak member Zn at NORD are shown as monthly geometric values in Fig. 8. It is to be noted that the
seasonal variations range over two orders of magni- tude, which is even more impressive than was found for the concentrations (see Fig. 2).
The strong coupling of S and Br and the large winter values both in the total and the non-crustal aerosol are interesting since Br in the Arctic recently has been the subject of several investigations, which, however, left the origins of the brominated species largely un- decided. From the previous study (Heidam, 1984) it was, however, concluded that particulate Br could scarcely be marine but was almost certainly of anthro- pogenic origin.
Rasmussen and Khalil (1984) found significantly elevated levels of anthropogenically derived gaseous Br inside Arctic haze layers, but no such enhancement was found for methylbromide which is assumedly of biogenic origin. The annual variations were also much less pronounced. Berg et al. (1983, 1984) found ex- tremely high levels of both gaseous and particulate Br in the Arctic in February and March, about twice as high as at THUL and NORD, but were unable to specify the sources. For the remainder of the year
2094 NIELS Z. H EIDAM
EXCESS AEROSOL FACTORS
SAGA 701 NORD
General Industry
1979 1980
i.: : : : : : : : : 1 : :‘I A”0 $EP OCT NOV DEC JAN FEB h@R APR MAY JUN JUL AUC
Fig. 7. Factor scores
Ferro-metal
Marine
A”0 SEP OCT NOV DEC JAN FE6 NAR APR WY JUN JUL AU0
1::: AUG SEP OCT NOV DEC JAN FEB !4AR APR MAY JUN JUL AUG
for the excess aerosol at NORD 1979-1980. The step line shows Lines mark large shifts or episodes mentioned in the text.
biogenic marine sources appeared to dominate. Both parties note that in the dark and dry Arctic winter, ordinary removal processes are brought to an effective stop, and in combination with long-range atmospheric transport, this may account for the high Br-levels.
It is well known that a major component of the Arctic haze, which occurs most frequently in late winter and early spring is sulphuric acid. The sulphate is a secondary aerosol constituent formed during transport by oxidation of sulphur dioxide emitted from fossil fuel combustion plants.
The occurrence of a S, Br-component of both the total and the non-crustal aerosol points strongly to common anthropogenic origins of the two species. On the other hand, the ratios of Arctic winter values to those at lower latitudes are different for the two constituents. For S the ratio is about 0.1, whereas for Br it is about or larger than 1 (Berg et al., 1983). It
monthly ItlWS.
therefore seems as if some Br-enrichment mechanism is at work, possibly an uptake of Br by the sulphate aerosol en route to the Arctic. If sufficiently effective such a hypothetical process could, however, be the sole cause for the Br-S coupling, which would then not contain any information on the origin of the bromine. Whatever the reason the Greenland observations do confirm the hypothesis (opeit.) that the winter maxi- mum of Br is an Arctic wide phenomenon, but in North Greenland it occurs mainly in March and April.
The second component of the non-crustal aerosol at NORD was found to contain K, Ca and Sr and was, in fact, not identified. It is seen from Table 6, that a similar component was observed at the southern sites GOVN and KATO, but there Cl was also a prominent member and that points to a marine origin.
In the study of the components of the total aerosol (Heidam, 1984), it was noted that factor analysis forces

Crustal enrichments in the Arctic aerosol
CRUSTRL T i -EP IR I CH”IEPiTS
SFiGR 701 PlORD
16 S, SULFUR 30 Zn, ZINC
1979 1980 1979 1980 2 : : ! : : : : : : : 103 : : : : : !
10’. 5 .,
5 ,, 1
1979 1980
25 I%, MFINGANESE
1979 1980
Fig. 8. Monthly geometric mean enrichments for selected elements at NORD 197991980.
the data to split into orthogonal, i.e. independent components. Considering that transport to Greenland in many cases may be over the ocean it is hardly to be expected that the aerosol components would be in- dependent of the marine component. It was hypo- thesized that a marine component, when observed at all, might be coupled to mesoscale transport only, because that mechanism could be independent of really long-range transport and also of any local contamination.
In the non-crustal aerosol as measured by the enrichments, the crustal influence appears to have been effectively removed, but then we may also have re- moved the soil-influenced part of the marine elements. The remaining, non-crustal part of such elements may well represent an independent long distance transport from large ocean sources. The seasonal behaviour of this component is seen in Fig. 7 and is well represented by Ca in Fig. 8. The high values in October, November and December are significant and some large shifts in factor values are seen (marked with connecting lines). These shifts are coincident with large shifts of the metal factor of the total aerosol and the result of a study of synoptic weather maps for these periods has already been reported (Heidam, 1984). It was con- cluded that the rise in metallic concentrations in
2095
October-November was caused by a strong flow from Europe, in particular Great Britain, over the North Atlantic. The shift in December was linked to a short episode of transport at 500 mb from North America over the Atlantic. It now appears that these flows also manifested themselves by a corresponding increase in non-crustal K, Ca and Sr.
The weather maps show that the whole of eastern Greenland was influenced by these circulations. A study of factor values at KATO reveals that the marine factor here also oscillates between high and low values in the same sequence as at NORD and almost coincides with it. Furthermore, the metallic concen- tration factor at KATO is also very high in these periods, just as at NORD.
Finally, we note that the sequence of elements most abundant in sea water, Cl, Na, Mg and S is followed by K and Ca with concentrations of about 400 ppm, about half the concentration of S (Brewer, 1975). Taken together this evidence makes it highly likely that the (K, Ca, Sr) factor at NORD is indeed a marine component. By means of Table 5 we infer that the non- crustal K and Ca observed there is primarily of marine and secondarily of anthropogenic origin, presumably from coal combustion.
The third component of the non-crustal aerosol is
AE 19:12-H
2096 N~ELS Z. H EEDAM
metallic and is composed primarily of Fe and Mn. That indicates an origin from ferro-metal processing. The behaviour is shown in Fig. 7 and the low enrichment of Mn in Fig. 8 exhibits the same behaviour. The winter maximum is very prominent and significant. This factor is very similar to the metal factor of the total aerosol. A comparison of individual factor values reveals a high degree of coincidence or near coinci- dence of episodic values larger than 1. That is true not only for the long, important episodes in January-March (marked), which were dominated by transport from the Ural region (Heidam, 1984), but also for the short episodes in early winter. A particu- larly clear case is the December episode (marked), which, as discussed above, was related to a transport event at 500 mb from North America. For the sample collected from 17 to 20 December 1979, the metal factor of the total aerosol was 1.97 and the ferro-metal factor of the noncrustal aerosol was 1.48. That large- scale transport took place over the ocean is evidenced by high values of long distance marine factors of the non-crustal aerosols at both NORD and KATO, the values being 1.67 and 1.88, respectively.
It is remarkable that a study of the small excess of the predominantly crustal elements Mn and Fe can reveal so clearly an anthropogenic component in the aerosol In fact it is a very good demonstration of our earlier postulate that log E, although a bit difficult to interpret physically, is a useful quantity to consider because of the significant information it carries. This information is obscured by crustal noise in the concen-
trations, and in cases of low enrichment it is completely buried.
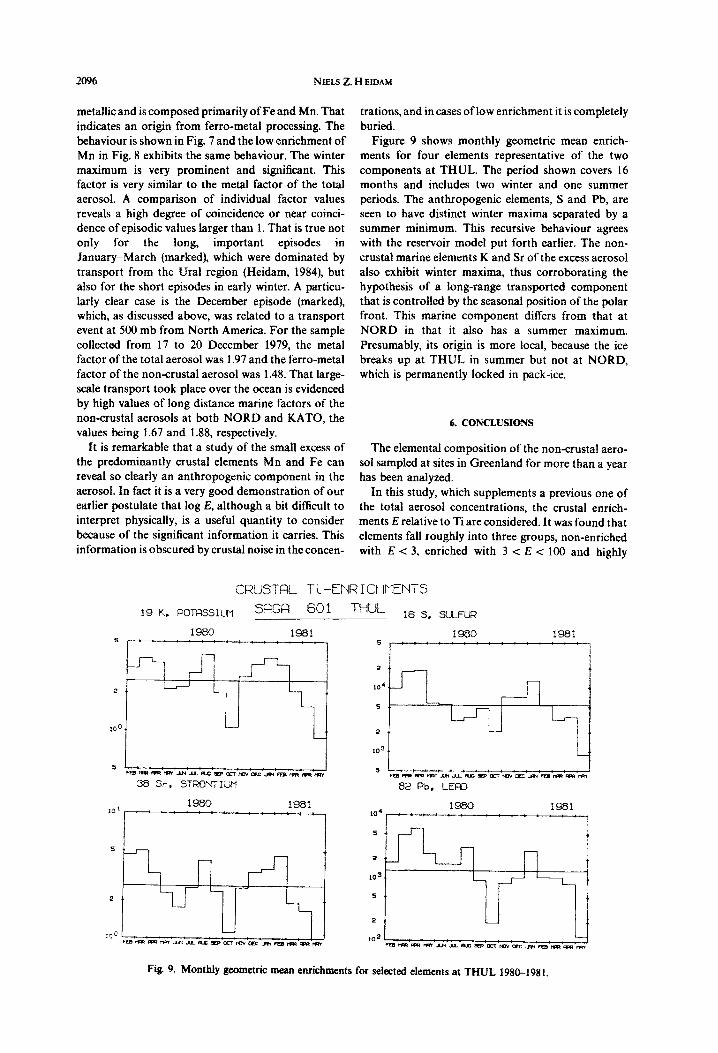
Figure 9 shows monthly geometric mean enrich- ments for four elements representative of the two components at THUL. The period shown covers 16 months and includes two winter and one summer periods. The anthropogenic elements, S and Pb, are seen to have distinct winter maxima separated by a summer minimum. This recursive behaviour agrees with the reservoir model put forth earlier. The non- crustal marine elements K and Sr of the excess aerosol also exhibit winter maxima, thus ~o~o~rating the hypothesis of a long-range transported component that is controlled by the seasonal position of the polar front. This marine component differs from that at NORD in that it also has a summer maximum. Presumably, its origin is more local, because the ice breaks up at THUL in summer but not at NORD, which is permanently locked in pack-ice.
6. CONCLUSIONS
The elemental composition of the non-crustal aero- sol sampled at sites in Greenland for more than a year has been analyzed.
In this study, which supplements a previous one of the total aerosol concentrations, the crustal enrich- ments E relative to Ti are considered. It was found that elements fall roughly into three groups, non-enriched with E < 3, enriched with 3 < E < 100 and highly
CRUST9L T i -ENR I CHNENTS
19 K. PCJTF~SSIUM SFiGFI 601 THUL I6 c., SULFUR
1980 1981 sir: .:;:::-::::...
f980 1981 5,::::‘:::.::::.‘,
Fig. 9. Monthly geometric mean enrichments for selected elements at THUL 1980-1981.
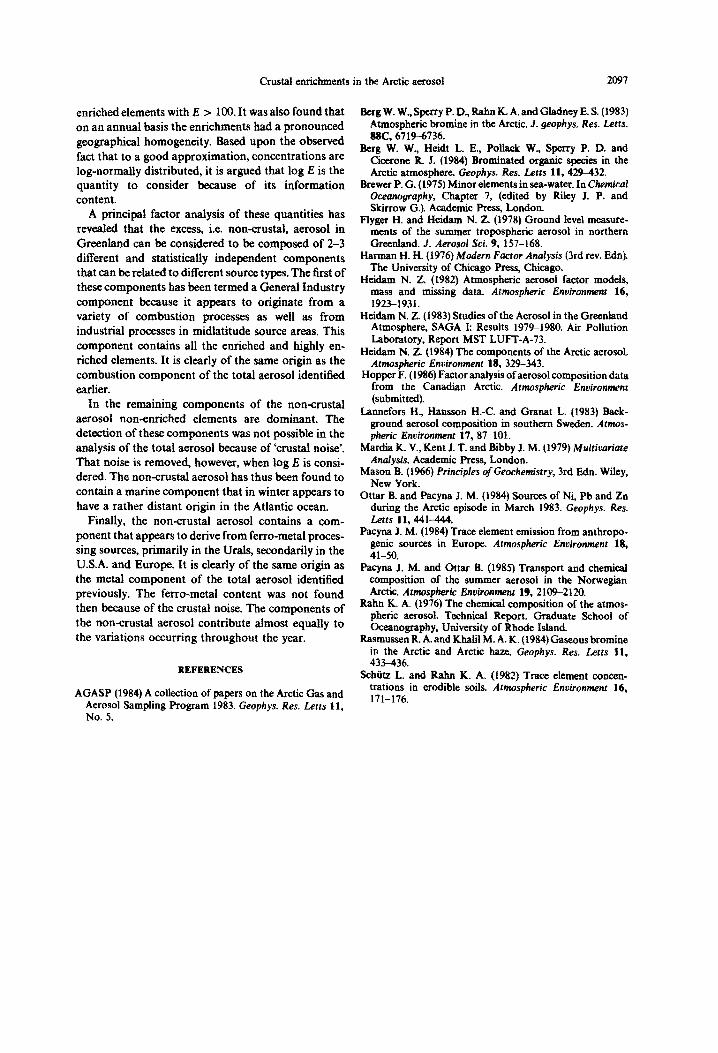
Crustal em&men& in the Arctic aerosol 2097
enriched elements with E > 100. It was also found that on an annual basis the enrichments had a pronounced geographical homogeneity. Based upon the observed fact that to a good approximation, concentrations are log-normally distributed, it is argued that log E is the quantity to consider because of its information content.
A principal factor analysis of these quantities has revealed that the excess, i.e. non-crustal, aerosol in Greenland can be considered to be composed of 2-3 different and statistically independent components that can be related to different source types. The first of these components has been termed a General Industry component because it appears to originate from a variety of combustion processes as well as from industrial processes in midlatitude source areas. This component contains all the enriched and highly en- riched elements. It is clearly of the same origin as the combustion component of the total aerosol identified earlier.
In the remaining components of the noncrustal aerosol non-enriched elements are dominant. The detection of these components was not possible in the analysis of the total aerosol because of ‘crustal noise’. That noise is removed, however, when log E is consi- dered. The non-crustal aerosol has thus been found to contain a marine component that in winter appears to have a rather distant origin in the Atlantic ocean.
Finally, the non-crustal aerosol contains a com- ponent that appears to derive from ferro-metal proces- sing sources, primarily in the Urals, secondarily in the U.S.A. and Europe. It is clearly of the same origin as the metal component of the total aerosol identified previously. The ferro-metal content was not found then because of the crustal noise. The components of the noncrustal aerosol contribute almost equally to the vacations occurring throughout the year.
REFERENCES
AGASP (1984) A collection of Papers on the Arctic Gas and Aerosol Sampling Program 1983. Geophys. Rex Letts 11, No. 5.
Berg W. W., Sperry P. D., Rahn K. A. and GIadney E. S. (1983) Atmospheric bromine in the Arctic. J. geophys. Res. Letts. WC, 6719-6736.
Berg W. W., Heidt L. E., Pollack W., Sperry P. D. and Cicerone R. J. (1984) Brominated organic species in the Arctic atmosphere. Geophys. Res. Letts 11,429-432.
Brewer P. G. (1975) Minor elements in sea-water. In Chemical Oceanography, Chapter 7. (edited by Riley J. P. and Skirrow G.). Academic Press, London.
Flyger H. and Heidam N. 2. (1978) Ground level measure- ments of the summer tropospheric aerosol in northern Greenland. J. Aerosol Sci. 9, 157-168.
Harman H. H. (1976) Modern Factor Analysis (3rd rev. Edn). The University of Chicago Press, Chicago.
He&m N. Z. (1982) Atmospheric aerosol factor modeIs, mass and missing data. Af~sp~eric Environ~nt 16, 1923-1931.
Heidam N. 2. (1983) Studies of the Aerosol in the Greenland Atmosphere, SAGA I: Results 1979-1980. Air Pollution Laboratory, Report MST LUFT-A-73.
Heidam N. Z. (1984) The components of the Arctic aerosol. Atmospheric Enviranmenr 18, 329-343.
Hopper F. (1986) Factor analysis of aerosol composition data from the Canadian Arctic. Atmospheric Environment (submitted).
Lannefors H., Hansson H.-C. and Granat L. (1983) Back- ground aerosol composition in southern Sweden. Atmos- pheric Enviro~~~~ 17, 87-101.
Mardia K. V., Kent J. T. and Bibby J. M. (1979) ~u~ti~riure Analysis. Academic Press, London.
Mason B. (1966) Principles O~Ge~~mistry, 3rd Edn. Wiley, New York.
Ottar B. and Pacyna J. M. (1984) Sources of Ni, Pb and Zn during the Arctic episode in March 1983. Geophys. Res. Letts 11,441-444.
Pacyna J. M. (1984) Trace element emission from anthropo- genie sources in Europe. Atmospheric Environment 18, 41-50.
Pacyna J. M. and Ottar B. (1985) Transport and chemical composition of the summer aerosol in the Norwegian Arctic. Atmospheric Environment 19, 2109-2120.
Rahn K. A. (1976) The chemical composition of the atmos- pheric aerosol. Technical Report. Graduate School of Oceanography, University of Rhode Island.
Rasmussen R. A. and Khalil M. A. K. (1984) Gaseous bromine in the Arctic and Arctic haze. Geophys. Res. Letts 11, 43S436.
Schiitz L. and Rahn K. A. (1982) Trace element concen- trations in erodible soils. Atmospheric Environment 16, 171-176.