Embed Size (px)
Citation preview

8/3/2019 Crustal Age Domains in Kibaran Belt of SW-Uganda - Combined Zr Geochronol and Sm-Nd Isotopic Investig
http://slidepdf.com/reader/full/crustal-age-domains-in-kibaran-belt-of-sw-uganda-combined-zr-geochronol-and 1/17
Crustal age domains in the Kibaran belt of SW-Uganda:Combined zircon geochronology and Sm – Nd isotopic investigation
Robert Buchwaldt a,b,c,*, Theofilos Toulkeridis d,b, Wolfgang Todt c, Elias K. Ucakuwun e
a Department of Earth and Planetary Sciences, Washington University, St. Louis, MO 63130-4899, USAb Institut fur Geowissenschaften, Johannes Gutenberg-Universitat, Becherweg 21, D-55099 Mainz, Germany
c Max-Planck Institut fu r Chemie, Postfach 3060, 55020 Mainz, Germanyd Center of Geology, Volcanology and Geodynamics, Universidad San Francisco de Quito, Campus Cumbaya ,
Via Interoceanica y Jardines del Este, A.P. 17-12-841, Quito, Ecuadore School of Environmental Studies, Moi University, P.O. Box 3900, Eldoret, Kenya
Received 8 November 2006; received in revised form 25 October 2007; accepted 1 November 2007Available online 7 November 2007
Abstract
Combination of geochemistry, Nd mean crustal residence ages and single zircon ages reveal distinct provinces not recognized previ-ously within the Kibaran belt of SW-Uganda. Geochemical analyses (HFSE and REE) of four granitoids, namely the Ntungamo, Chit-we, Rwentobo and Kamwezi from the Karagwe Tinfield have been interpreted to be mainly composed of melt components fromsubduction modified parts of the continental lithospheric mantle. In addition we can demonstrate, from these distinctive batholiths crys-tallization ages that lead to the result of three age groups, one at around 1566 Ma, the second at 1444 Ma to and the third clustersbetween 1329 Ma and 1363 Ma. The eNd(t) values from the now precisely dated intrusions of the Kibaran belt indicate subsequentlytwo distinctive groups. The older granites have eNd(t) values of À20.1 to À23.1 and Nd mean crustal residence ages, based on a depleted
mantle model, from 3.52 Ga to 3.84 Ga while the younger granite batholiths show lower eNd(t) values of À10.1 to À14.0 and Nd meancrustal residence ages from 2.86 Ga to 3.06 Ga, respectively. The distinct geochemical, geochronological and isotopic characteristics andthe unrelated geological evolution reconstructed from these data strongly implies that the two now adjacent Precambrian complexes weregeologically unrelated crustal packages prior to high grade metamorphism and, as such, represent ‘‘suspect terranes ” which were mostprobably brought together during a middle Proterozoic collision event.Ó 2007 Elsevier Ltd. All rights reserved.
Keywords: Uganda; Kibaran; Granites; Zircon; Suspect terranes
1. Introduction
The study of ancient granitic plutons provides an impor-tant insight into geodynamic orogenic processes that com-monly cannot be observed in modern active orogenic beltsbecause most of these expose only the upper brittle part thecontinental crust (e.g. Ring et al., 1999). In such old erodedbelts Nd isotopes together with single zircon geochronol-
ogy supply particularly valuable information on crustalgenesis, evolution and terrane amalgamation, and can be
used to distinguish between old, reworked and juvenilecrust (e.g. Mezger et al., 1993; Moller et al., 1998).The middle Proterozoic Kibaran orogeny affected large
areas of central and southern Africa. Although the Kiba-ran orogeny was initially defined in the Kibaran Mountainsof Congo, it has now been recognized that several linearand mostly parallel belts of Kibaran age exist in the easternpart of Africa and occupy a critical place within the com-plex network of Proterozoic mobile belts that surroundand separate the Archean cratonic nuclei of southern andcentral Africa.
1464-343X/$ - see front matter Ó 2007 Elsevier Ltd. All rights reserved.
doi:10.1016/j.jafrearsci.2007.11.001
* Corresponding author. Address: Department of Earth and PlanetarySciences, Washington University, St. Louis, MO 63130-4899, USA. Tel.:+314 935 8069; fax: +314 935 7361.
E-mail address: [email protected] (R. Buchwaldt).
www.elsevier.com/locate/jafrearsci
Available online at www.sciencedirect.com
Journal of African Earth Sciences 51 (2008) 4 – 20

8/3/2019 Crustal Age Domains in Kibaran Belt of SW-Uganda - Combined Zr Geochronol and Sm-Nd Isotopic Investig
http://slidepdf.com/reader/full/crustal-age-domains-in-kibaran-belt-of-sw-uganda-combined-zr-geochronol-and 2/17
In this reconnaissance study, we present the first precisegeochronological, geochemical and Nd-isotopic data fromgranitoid bodies of the Karagwe Tinfield in SW-Uganda.These data place new constraints upon their origin and tim-ing of emplacement and impose better insights of theNorthern Kibaran evolution.
2. Geologic setting and sampling
The NE-NNE-trending Kibaran Belt can be followedpractically continuously for more than 1500 km from south-ern Zambia through Tanzania and Burundi to Rwanda,where it swings to the Northwest, ending in Uganda andnorthern Zaire (Fig. 1). This predominantly low-grade pelit-ic-arenaceous belt, which occupies a restricted fault boundedzone, ranges from 100 km to 500 km in width and consistmainly out of two dominant Supergroups (Schluter, 1997).The Kibaran Supergroup is about 10,500 m thick in the typearea (Kibara Mountains of central Congo). It comprises a
rather monotonous sequence of phyllites and shists withsome intercalated quartzites, conglomerates, mafic – felsicvolcanic rocks, carbonaceous shale and stromatolitic car-bonates. Deformed mafic – ultramafic rocks locally presentalong the 350 km long Kibaran belt, including peridotites,norites and anorthosites (Tack et al., 1990, 1992) are tenta-tively interpreted as ophiolites (Moores, 1993). Northwardalong strike, the corresponding Burundian Supergroup,about 12,000 m thick is also dominated by pelitic rocks withquartzitic intercalations, which are mature and well sorted in
lower levels, but progressively more immature and poorlysorted above (Klerkx et al., 1987). The Kibaran belt has beeninterpreted as an intracontinental belt characterised byabundant peraluminous two mica granites of crustal originassociated with a crustal extensional process. Extensionwas followed by compression and a late shear event with
alkaline granitic magmatism (Klerkx et al., 1987; Tacket al., 1994).Granitic rocks emplaced at 1330 – 1260 Ma and again at
$1249 Ma, mainly in lower stratigraphic levels, formextensive and complex intrusions that are typically associ-ated with smaller mafic intrusions (Tack et al., 1994). Thelate granites are allied with cassiterite, tantalite and wol-framite mineralization.
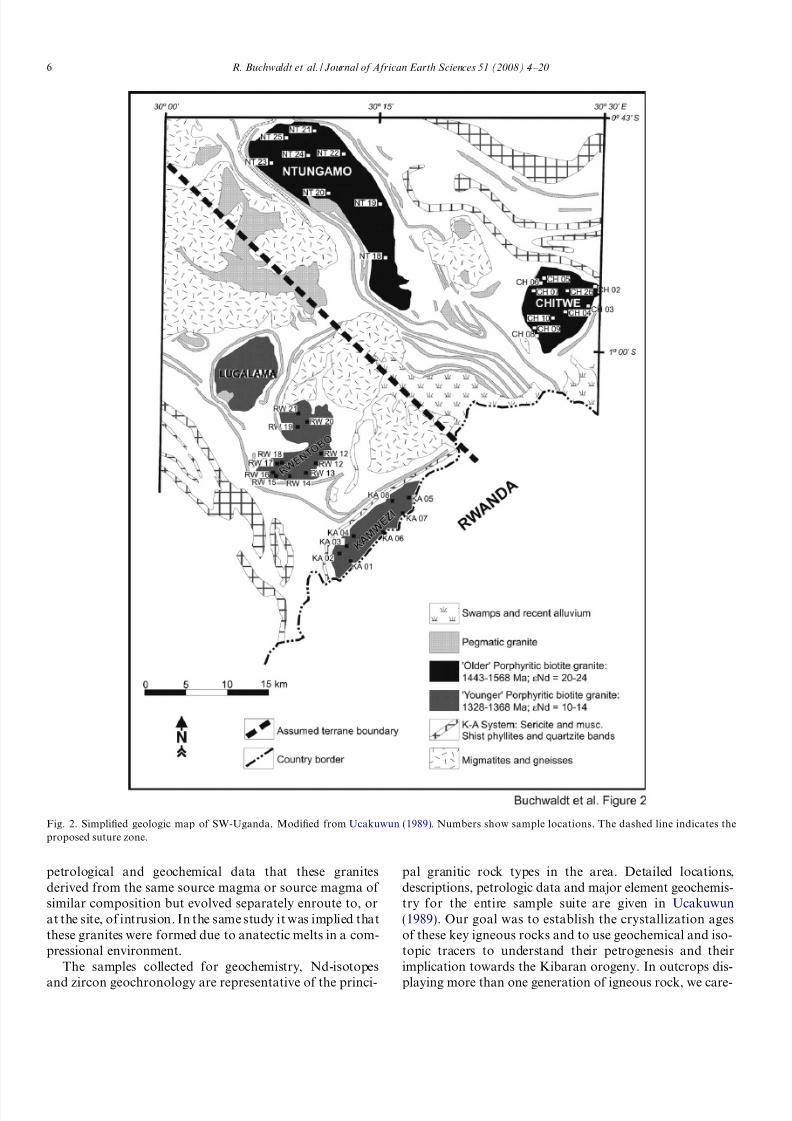
We focus attention on an area in SW-Uganda between30°000E – 30°300E longitude and 0°430S – 1°150S latitude(Fig. 2). Known generally as the Karagwe Tinfield, geologicmapping in the 1930s and 1980s resulted in publication of several significant maps and related reports (e.g. Barnes,
1956; Cahen and Snelling, 1966; Ucakuwun, 1989) all of which form the foundation of our work. A striking featureof the geology is the occurrence of a sequence of slightlymetamorphosed sedimentary rocks, the Karagwe-Ankole-an group (K-A), that occupy an almost continuous areain SW-Uganda. These sediments are only interrupted inplaces with intercalated gneisses and intruded by five youn-ger suites of porphyroid calc-alkaline biotite granites,namely the Ntungamo, Chitwe, Lugalama, Rwentobo andKamwezi plutons. Ucakuwun (1989) suggested based on
Fig. 1. The Mesoproterozoic Kibaran belt in central East Africa.
R. Buchwaldt et al. / Journal of African Earth Sciences 51 (2008) 4 – 20 5
8/3/2019 Crustal Age Domains in Kibaran Belt of SW-Uganda - Combined Zr Geochronol and Sm-Nd Isotopic Investig
http://slidepdf.com/reader/full/crustal-age-domains-in-kibaran-belt-of-sw-uganda-combined-zr-geochronol-and 3/17
petrological and geochemical data that these granitesderived from the same source magma or source magma of similar composition but evolved separately enroute to, orat the site, of intrusion. In the same study it was implied thatthese granites were formed due to anatectic melts in a com-pressional environment.
The samples collected for geochemistry, Nd-isotopes
and zircon geochronology are representative of the princi-
pal granitic rock types in the area. Detailed locations,descriptions, petrologic data and major element geochemis-try for the entire sample suite are given in Ucakuwun(1989). Our goal was to establish the crystallization agesof these key igneous rocks and to use geochemical and iso-topic tracers to understand their petrogenesis and theirimplication towards the Kibaran orogeny. In outcrops dis-
playing more than one generation of igneous rock, we care-
Fig. 2. Simplified geologic map of SW-Uganda. Modified from Ucakuwun (1989). Numbers show sample locations. The dashed line indicates theproposed suture zone.
6 R. Buchwaldt et al. / Journal of African Earth Sciences 51 (2008) 4 – 20

8/3/2019 Crustal Age Domains in Kibaran Belt of SW-Uganda - Combined Zr Geochronol and Sm-Nd Isotopic Investig
http://slidepdf.com/reader/full/crustal-age-domains-in-kibaran-belt-of-sw-uganda-combined-zr-geochronol-and 4/17
fully isolated individual components and attempted to ana-lyse them separately. The sample locations are given inFig. 2.
3. Analytical procedure
3.1. XRF and ICP-MS whole-rock analyses
The major and some trace elements were determined byXRF (Phillips PW 1404) at the University Mainz usingglass-fusion disks and press-powder pellets following amethod described by Stern (1972). Operating conditionswere between 40 and 80 kV and 30 – 60 mA, depending onwhich element was analyzed. The analytical precision forthe major elements is usually better than 0.6 rel. % exceptfor Mn (1.7 rel. %), whereas the analytical precision fortrace elements is between 0.3 and 7 rel. %. Additional trace(Co, U, Th, Nb, Hf, Ta) and rare earth elements (REE)were determined by ICP-MS (Fisions VG Isoplasma) at
the Centre de Geochimie de la Surface in Strasbourg fol-lowing a combined and similar procedure described inSamuel et al. (1985) and Roberts and Ruiz (1989). Repli-cate analyses from samples and standards indicate thatthe accuracy of the REE and trace element determinationsis within 5%.
3.2. Zircon dating
The evaporation technique for single zircon chronologyhas been previously described by Kober (1986, 1987). Isoto-pic analysis was carried out on a Finnigan MAT 261 mass
spectrometer in the Max-Planck Institute fur Chemie. Themethod involves repeated evaporation and deposition of Pb-isotopes from chemically untreated single zircons in adouble filament arrangement (Kober, 1987). In our experi-ments, evaporation temperatures were gradually increasedin 20 – 50 °C steps during repeated evaporation depositcycles until no Pb intensity was left. Only data from the hightemperature runs or those with no changes in the Pb isotoperatios were considered for geochronological evaluation.The calculated 207Pb/206Pb ratios and their two-sigma meanerrors are based on the mean of all measurements evaluated.Ages and errors for several zircons from the same sampleare presented as weighted means of the entire population.The 207Pb/206Pb spectra are shown in histograms that per-mit visual assessment of the data distribution from whichthe ages are derived. For a geologically realistic error assess-ment an internal zircon standard from the PhalaborwaComplex in South Africa was analysed. The weighted mean207Pb/206Pb ratio of eight grains was 0.127177 ± 36 corre-sponding to an age of 2059.3 ± 0.5 Ma. This error is consid-ered the best estimate for the reproducibility of evaporationdata and approximately corresponds to the two-sigmamean error reported in this study.
In addition abraded zircons of all samples were analyzedusing conventional U – Pb isotope dilution analysis follow-
ing the procedures outlined by Krogh (1973, 1982) with
slight modification described by Tucker and others(1987). Lead fractions smaller than 1 ng and all uraniumfractions were analyzed in a VG sector 54 mass spectrom-eter using a single collector procedure with a Daly-typephotomultiplier detector operating in pulse counting mode.Total-procedure blanks over the period of analysis aver-
aged between 2 pg for Pb and 0.5 pg for U. Common-Pbcorrections were made by first correcting the measuredratio for mass dependent fractionation and introducedspike, then subtracting Pb equal in amount and composi-tion to the laboratory blank. Any remaining Pb is assumedto represent a model lead composition given by Stacey andKramers (1975). The U – Pb ages are calculated using theExcel macro of Ludwig (1982).
3.3. Sm – Nd isotopic analyses
Sample preparation followed (White and Patchett,1984). Whole-rock powder samples of 40 – 100 mg were
spiked with a mixed 149Sm – 150Nd tracer and dissolved,using a mixture of concentrated HF/HNO3, in a sealed Tef-lon vial inside a bomb at 200 °C for at least 1 – 2 days. REEconcentrates were separated following standard ionexchange procedures employing 4.5 ml of AG50W-X12ion exchange resin in a column of 9.5-cm length. Afterpre-concentration of REE, Sm and Nd were separated in2 ml Teflon powder coated with di-2-ethylhexyl orthophos-phoric acid. Sm and Nd were loaded and measured in a Redouble filament arrangement. Isotopic analysis was carriedout on a Finnigan MAT 261 mass spectrometer in theMax-Planck Institute fur Chemie in static multi-collecting
mode. During the course of this study the internationalstandard La Jolla was analyzed and yielded: LaJolla = 0.511861 ± 14 (n = 12, 1r).
4. Results
4.1. Geochemical effects of hydrothermal alteration
All of the samples analyzed have suffered at least minorhydrothermal alteration, as has been documented by previ-ous workers (e.g. Pohl, 1994; Ucakuwun, 1989). The mostimportant effects are noted briefly here because they mustbe resolved from magmatic effects in order to understandthe petrogenesis of the granitic rocks. Sr isotopic data forthe same sample suite indicate that Rb/Sr ratios have beenincreased by up to about 25% from magmatic values, pre-sumably by hydrothermal alteration (Buchwaldt, unpubl.data). There is no mineralogical evidence for significant lossof Ca, and hence Sr, from acid plutonics as sericitizationand other alteration of feldspars is generally slight. Minorsecondary calcite is a common constituent, indicatingmobility of Ca and Sr, but it is not known whether thisreflects input from surrounding rocks or purely internalchemical redistribution. Assuming that the change in Rb/Sr ratio is entirely due to increases of up to 25% in Rb con-
centration, these concentrations must be treated with cau-
R. Buchwaldt et al. / Journal of African Earth Sciences 51 (2008) 4 – 20 7
8/3/2019 Crustal Age Domains in Kibaran Belt of SW-Uganda - Combined Zr Geochronol and Sm-Nd Isotopic Investig
http://slidepdf.com/reader/full/crustal-age-domains-in-kibaran-belt-of-sw-uganda-combined-zr-geochronol-and 5/17
tion but will have only a modest effect on geochemical var-iation diagrams in which they are displayed on a logarith-mic scale. K/Ca ratios were presumably increased in thesame event as Rb/Sr ratios, so that the acidic rocks were lesspotassic at the time of their emplacement than they are now.As discussed in the next section, all of the acid melts appear
to display peraluminous characteristics using the Shandindex. It has been suggested that replacement of Na by Kcan increase the Shand index (Kisvarsanyi and Kisvarsanyi,1990) and destroy original peralkaline characteristics. If metasomatism was an important process, veining (fluidpathways) and K-bearing secondary alteration minerals,e.g. micas, should be more abundant, whereas they arescarce in the majority of samples, though some alterationby pore-filling solutions during devitrification may havetaken place without leaving an obvious petrographic signa-ture. Secondly, K-metasomatism would not only change theK content of the rock, but would also produce significantchanges in trace element contents. However, K and Rb vary
coherently with LREE and HFSE, suggesting that large-scale chemical changes were not induced during hydrother-mal alteration. Neither is there any correlation between K/Na ratio and the Shand index. The lack of petrographic andgeochemical evidence to support K-metasomatism suggeststhat this process did not produce a substantial effect formost samples and that their major element concentrationsapproximate magmatic values. The REE patterns, andhence Sm – Nd isotopic systems, of the plutonic rocks giveno indication of hydrothermal alteration The consequencesof the deductions regarding hydrothermal alteration arethat alkali, and possibly alkaline earth element, concentra-
tions must be treated with caution for all samples, but havenot been altered so greatly as to preclude their use in under-standing magmatic processes.
4.2. Geochemistry
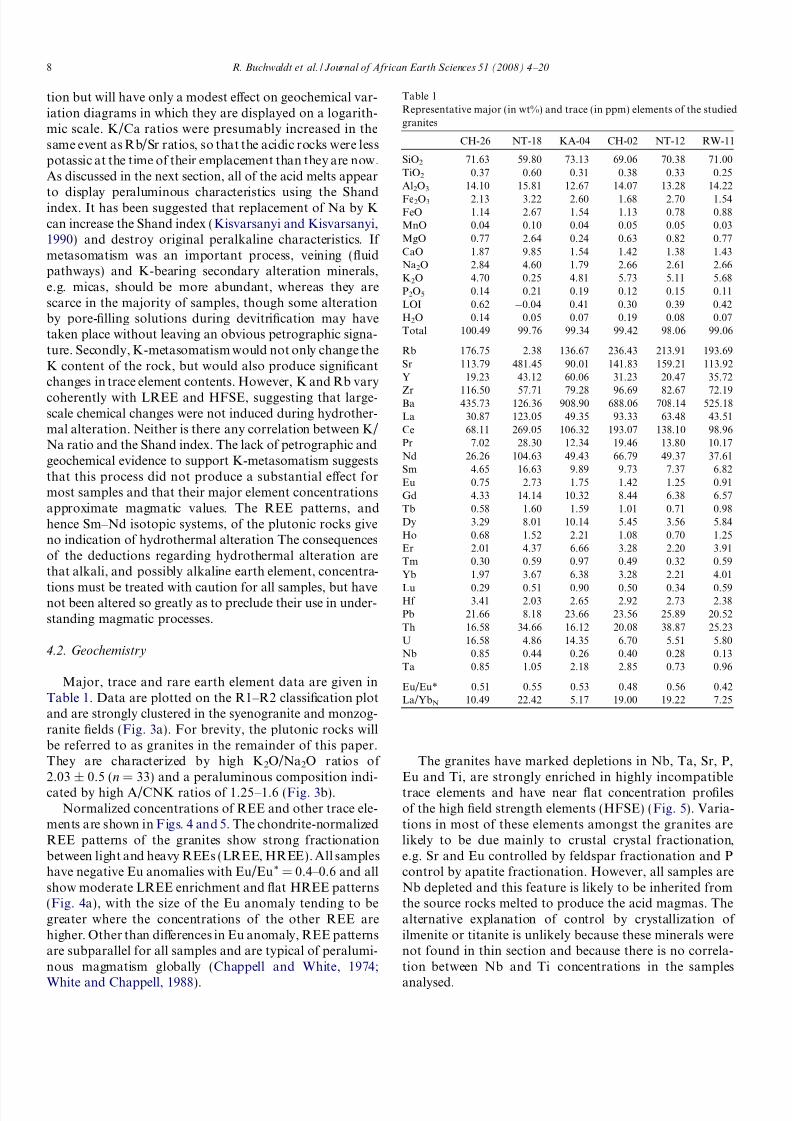
Major, trace and rare earth element data are given inTable 1. Data are plotted on the R1 – R2 classification plotand are strongly clustered in the syenogranite and monzog-ranite fields (Fig. 3a). For brevity, the plutonic rocks willbe referred to as granites in the remainder of this paper.They are characterized by high K2O/Na2O ratios of 2.03 ± 0.5 (n = 33) and a peraluminous composition indi-cated by high A/CNK ratios of 1.25 – 1.6 (Fig. 3b).
Normalized concentrations of REE and other trace ele-ments are shown in Figs. 4 and 5. The chondrite-normalizedREE patterns of the granites show strong fractionationbetween light and heavy REEs (LREE, HREE). All sampleshave negative Eu anomalies with Eu/Eu* = 0.4 – 0.6 and allshow moderate LREE enrichment and flat HREE patterns(Fig. 4a), with the size of the Eu anomaly tending to begreater where the concentrations of the other REE arehigher. Other than differences in Eu anomaly, REE patternsare subparallel for all samples and are typical of peralumi-nous magmatism globally (Chappell and White, 1974;
White and Chappell, 1988).
The granites have marked depletions in Nb, Ta, Sr, P,Eu and Ti, are strongly enriched in highly incompatibletrace elements and have near flat concentration profilesof the high field strength elements (HFSE) (Fig. 5). Varia-tions in most of these elements amongst the granites arelikely to be due mainly to crustal crystal fractionation,e.g. Sr and Eu controlled by feldspar fractionation and Pcontrol by apatite fractionation. However, all samples areNb depleted and this feature is likely to be inherited fromthe source rocks melted to produce the acid magmas. Thealternative explanation of control by crystallization of ilmenite or titanite is unlikely because these minerals werenot found in thin section and because there is no correla-tion between Nb and Ti concentrations in the samples
analysed.
Table 1Representative major (in wt%) and trace (in ppm) elements of the studiedgranites
CH-26 NT-18 KA-04 CH-02 NT-12 RW-11
SiO2 71.63 59.80 73.13 69.06 70.38 71.00TiO2 0.37 0.60 0.31 0.38 0.33 0.25Al2O3 14.10 15.81 12.67 14.07 13.28 14.22
Fe2O3 2.13 3.22 2.60 1.68 2.70 1.54FeO 1.14 2.67 1.54 1.13 0.78 0.88MnO 0.04 0.10 0.04 0.05 0.05 0.03MgO 0.77 2.64 0.24 0.63 0.82 0.77CaO 1.87 9.85 1.54 1.42 1.38 1.43Na2O 2.84 4.60 1.79 2.66 2.61 2.66K2O 4.70 0.25 4.81 5.73 5.11 5.68P2O5 0.14 0.21 0.19 0.12 0.15 0.11LOI 0.62 À0.04 0.41 0.30 0.39 0.42H2O 0.14 0.05 0.07 0.19 0.08 0.07Total 100.49 99.76 99.34 99.42 98.06 99.06
Rb 176.75 2.38 136.67 236.43 213.91 193.69Sr 113.79 481.45 90.01 141.83 159.21 113.92Y 19.23 43.12 60.06 31.23 20.47 35.72
Zr 116.50 57.71 79.28 96.69 82.67 72.19Ba 435.73 126.36 908.90 688.06 708.14 525.18La 30.87 123.05 49.35 93.33 63.48 43.51Ce 68.11 269.05 106.32 193.07 138.10 98.96Pr 7.02 28.30 12.34 19.46 13.80 10.17Nd 26.26 104.63 49.43 66.79 49.37 37.61Sm 4.65 16.63 9.89 9.73 7.37 6.82Eu 0.75 2.73 1.75 1.42 1.25 0.91Gd 4.33 14.14 10.32 8.44 6.38 6.57Tb 0.58 1.60 1.59 1.01 0.71 0.98Dy 3.29 8.01 10.14 5.45 3.56 5.84Ho 0.68 1.52 2.21 1.08 0.70 1.25Er 2.01 4.37 6.66 3.28 2.20 3.91Tm 0.30 0.59 0.97 0.49 0.32 0.59Yb 1.97 3.67 6.38 3.28 2.21 4.01
Lu 0.29 0.51 0.90 0.50 0.34 0.59Hf 3.41 2.03 2.65 2.92 2.73 2.38Pb 21.66 8.18 23.66 23.56 25.89 20.52Th 16.58 34.66 16.12 20.08 38.87 25.23U 16.58 4.86 14.35 6.70 5.51 5.80Nb 0.85 0.44 0.26 0.40 0.28 0.13Ta 0.85 1.05 2.18 2.85 0.73 0.96
Eu/Eu* 0.51 0.55 0.53 0.48 0.56 0.42La/YbN 10.49 22.42 5.17 19.00 19.22 7.25
8 R. Buchwaldt et al. / Journal of African Earth Sciences 51 (2008) 4 – 20

8/3/2019 Crustal Age Domains in Kibaran Belt of SW-Uganda - Combined Zr Geochronol and Sm-Nd Isotopic Investig
http://slidepdf.com/reader/full/crustal-age-domains-in-kibaran-belt-of-sw-uganda-combined-zr-geochronol-and 6/17
4.3. Geochronology
The internal structure of zircon was investigated withthe cathodoluminescence technique (CL) in order to obtaininformation about magmatic zoning, inherited xenocrysts,and overgrowth. More than 50 zircon grains from eachof the granite samples, which have predominantly a pris-matic habit of magmatic origin, were analyzed by the CLtechnique. Characteristic CL populations are shown inFig. 6. The CL photographs demonstrate that post mag-matic overprint or recrystallization can be barely observedat the grain margins in almost all grains. Around 40% of the grains contain xenocrystic cores, which occur in bothgrain types of stubby and long prismatic habitus. Mag-
matic oscillatory zoning is still well preserved in most of
the xenocrystic cores. In such grains magmatic zoningcan still be observed at the margins of the grains. Recrystal-lization can often be observed along the xenocrystic cores.Zircons without obvious xenocrystic domains mainly havethin crystal habitus and show oscillatory zoning indicatingmagmatic origin.
Zircons from the Chitwe Granite are euhedral, prismaticand range in size between 200 lm and 250 lm. Cathodolu-minescence (CL) images of the zircons usually show typi-cally a core surrounded by overgrowth with regularmagmatic growth zoning (Fig. 6). Four grains from sampleCH 26 were analysed and yielded identical 207Pb/206Pbratios that combine to a mean age of 1565.8 ± 0.3 Ma(Fig. 7a, Table 2) using the evaporation method. To con-
firm the age four single abraded zircons, each carefully
Fig. 3. Classification diagrams (a) R1 – R2 plot after Didier et al. (1982). (b) Molar Al2O3/(Na2O + K2O) plotted against molar Al2O3/(CaO + Na2O + K2O) (Shand, 1951).
R. Buchwaldt et al. / Journal of African Earth Sciences 51 (2008) 4 – 20 9

8/3/2019 Crustal Age Domains in Kibaran Belt of SW-Uganda - Combined Zr Geochronol and Sm-Nd Isotopic Investig
http://slidepdf.com/reader/full/crustal-age-domains-in-kibaran-belt-of-sw-uganda-combined-zr-geochronol-and 7/17
selected, completely transparent, idiomorphic without visi-ble cores were analyzed using the conventional U – Pb iso-tope dilution analysis, and the results are presented in
Table 3 and the Concordia diagram of Fig. 7a. Two anal-yses are concordant and the other two are slightly discor-dant. When all four analyses are plotted on a discordiathe upper intercept age is 1566.0 ± 2.9 Ma indistinguish-able from the results obtained by the evaporation tech-nique discussed above and are interpreted here as thecrystallization age of the Chitwe pluton.
The zircons from the Ntungamo Granite of sample NT12 are colourless to pale pink, euhedral and ca. 200 lmlong. The CL and back scatter electron (BSE) images revealmagmatic growth patterns and cores can be observed(Fig. 6). Four grains were analyzed and yielded a mean207
Pb/206
Pb age of 1445 ± 7.7 Ma (Fig. 7b). Again to con-
firm the evaporations age three abraded zircons analyzedusing the conventional U – Pb isotope dilution analysis forthe sample NT 12 and they exhibit slight discordance with
an excellent linear arrangement (MSWD = 0.7) and consti-tute an array intersecting the concordia at 1445.6 ± 2.9.The resulted age is identical to the evaporation age andwe therefore interpret this age as the crystallization ageof the Ntungamo Granite.
The zircons from sample RW 11, the Rwentobo Gran-ite, are light brown to colourless and have a prismatic mor-phology with a length width ratio of $1.7. These zirconsreveal magmatic growth zoning under CL and lack obviousinherited cores (Fig. 6). This suggests that the zircons crys-tallized during only one single magmatic event. Evapora-tion of three zircons grains from the Sample RW 11
produces consistent207
Pb/206
Pb ratios that combine to a
Fig. 4. REE concentrations, chondrite normalized after Nakamura (1974).
Fig. 5. Primitive Mantle-normalized (McDonough and Sun, 1995) multi-element diagram for trace element abundance in the granites from SW-Uganda.
10 R. Buchwaldt et al. / Journal of African Earth Sciences 51 (2008) 4 – 20

8/3/2019 Crustal Age Domains in Kibaran Belt of SW-Uganda - Combined Zr Geochronol and Sm-Nd Isotopic Investig
http://slidepdf.com/reader/full/crustal-age-domains-in-kibaran-belt-of-sw-uganda-combined-zr-geochronol-and 8/17
mean age of 1367.4 ± 4.6 Ma (Fig. 8a) and that we con-sider to most closely reflect the time of emplacement of thisgranite. This interpretation is confirmed by U – Pb agesfrom three abraded zircons which align themselves alonga discordia with an upper intercept of 1367.9 ± 3.4 Ma.
Our additional sample from this pluton sample (OG 05)contained abundant zircons of similar morphology andinternal structures. Three idiomorphic grains were evapo-rated separately and yielded statistically indistinguishable207Pb/206Pb ratios, which combine to a mean age of 1362.0 ± 4.2 Ma (Fig. 8b). The four abraded transparentzircons analyzed using the conventional U – Pb isotope dilu-tion method fortify the results obtained from the evapora-tion method and yielded in an upper intercept age of 1361.8 ± 0.8 Ma (Fig. 8b). Never the less both samplesindicate that the emplacement history of the Rwentobogranite is probably more complex than we can resolve withour samples. We interpret both of our age’s crystallizationages and that there was a period of $5 Ma of extendedmagmatic activity. If the Rwentobo granite itself has beenformed as a continuous magmatic event or by several dis-crete magmatic events is beyond of the scope of this paper.
Three ca. 200 lm long, needle-like prismatic, idiomor-phic, light brown, and inclusion free zircons with internalmagmatic zonation (Fig. 6) from sample KA 04 of theKamwezi Granite were evaporated and yielded a mean207Pb/206Pb age of 1330.0 ± 22 Ma (Fig. 8c). Four abradedclear zircons resulted in an indistinguishable slightly discor-dant age of 1332.2 ± 1.6 Ma (Fig. 8c) confirming the inter-pretation of the crystallization age for the Kamwezi
granite.
The results of our zircon dating indicate no clear distinctmain age groups for the granites in SW-Uganda. Withsome degree of freedom three main magmatic events basedon the chronology can be distinguished. The oldest is theChitwe pluton at around 1565 then the Ntungato pluton
at around 1445 Ma and the younger Rwentobo and theKamwezi plutons can be grouped together ranging from1367 Ma to 1330 Ma. If these ages in these Granites mightreflect a whole geologic history or several phases within thegranites, could not be resolved at this point in this recon-naissance study.
4.4. Nd evolution of the depleted mantle and parent/daughter
ratio
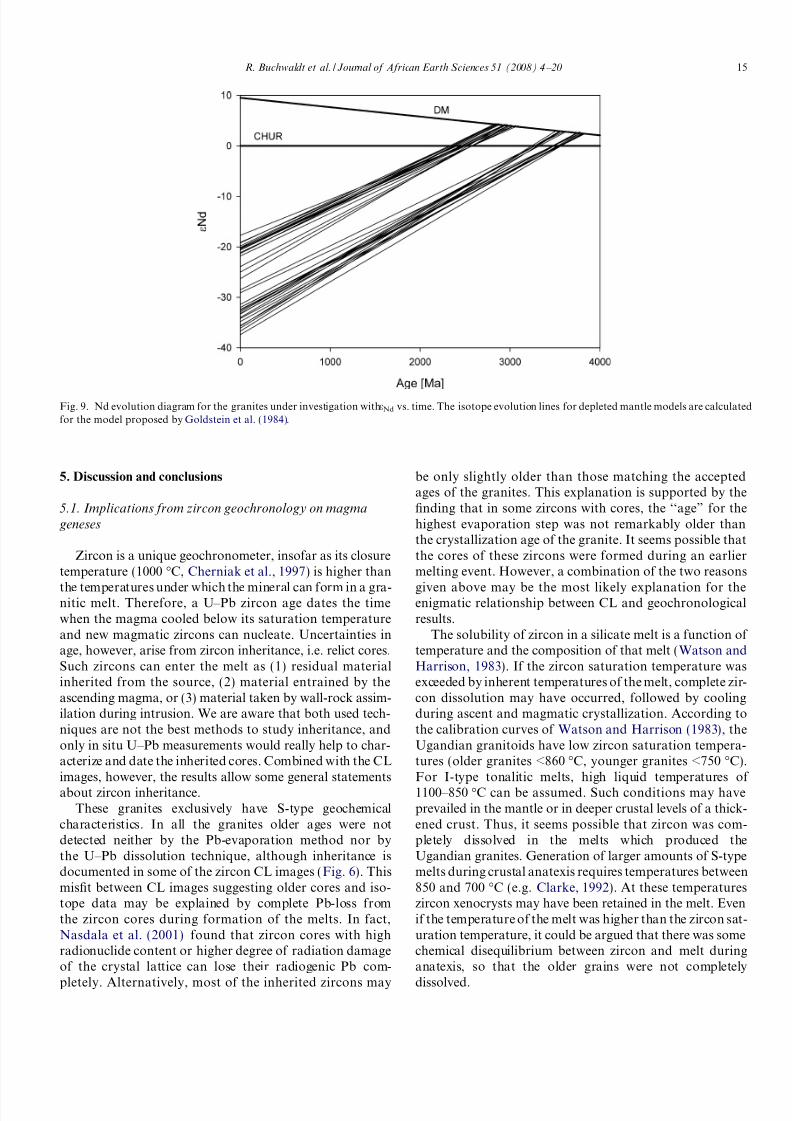
Various models have been proposed for the evolution of the depleted mantle (e.g. DePaolo, 1981; Goldstein et al.,1984; Liew and Hofmann, 1988). For the discussion herethe model proposed by Goldstein et al. (1984) was selected.This model assumes a linear evolution of 143Nd/144Nd in thedepleted mantle from a 4.6 Ga deviation from CHUR to amodern eNd value of approximately +10 (Fig. 9) based onthe highest eNd values of young mantle derived rocks. Thesevalues represent the most likely depleted mantle composi-tion, because crustal contamination would lower the143Nd/144Nd values significantly (Goldstein et al., 1984).
The 147Sm/144Nd ratios of most of the rocks from SW-Uganda are within, or slightly higher than, the typicalrange for crustal rocks of 0.09 – 0.13 (Taylor and McLen-nan, 1985), but only three samples show values higher than
0.15. Nevertheless these samples have similar Nd mean
Fig. 6. Cathodoluminescence photographs of zircons of the granites in SW-Uganda (a) Kamwezi Granite sample, (b) Chitwe Granite sample, (c)Rwentobo Granite sample and (d) Ntungamo Granite samples.
R. Buchwaldt et al. / Journal of African Earth Sciences 51 (2008) 4 – 20 11

8/3/2019 Crustal Age Domains in Kibaran Belt of SW-Uganda - Combined Zr Geochronol and Sm-Nd Isotopic Investig
http://slidepdf.com/reader/full/crustal-age-domains-in-kibaran-belt-of-sw-uganda-combined-zr-geochronol-and 9/17
crustal residence ages as the other samples from the samepluton. However, because of the possibility that these highSm/Nd values are caused by alteration in the crust thesesamples are not taken into account in the discussion of the crustal residence ages.
There is little correlation between sample provenanceand the parent/daughter ratio except for lower147Sm/144Nd values that are restricted to the youngestgranitoid intrusion, the Kamwezi pluton, in the southernpart of the investigated study area. All initial eNd valueseNd(t) were calculated for the respective emplacement agedetermined by dating of zircons and plotted in a Nd isoto-pic evolution diagram (Fig. 9). The eight samples from theKamwezi pluton have eNd(t) values between À19.6 andÀ23.1 respectively, and T DM model ages of 3.5 – 3.8 Ga.
The Rwentobo granite is isotopically similar to the Kam-
wezi pluton in showing eNd(t) values between À20.3 andÀ23.2 and T DM model ages of 3.6 – 3.8 Ga.
The eight samples from the Ntungamo granite do notseem to be genetically related to the previous two samplesets. They have a distinctly higher eNd(t) value range of À10.4 to À13.2 and an younger T DM model ages of 2.9 – 3.1 Ga. The eNd(t) values from the 10 sample of theChitwe granite show a narrow range between À10.4 andÀ11.6. The total range in T DM model ages varies fromÀ3.0 Ga to 3.1 Ga and therefore they are undistinguishablefrom the Ntungamo granite.
In summary, the Nd isotopic data are compatible with ascenario whereby the granitoid bodies, Ntungamo and Chit-we plutons are all derived from broadly the same source. Theyounger granites, the Rwentobo and Kamwezi plutons sug-
gest a different and distinctly more enriched source.
Fig. 7. Concordia plots and Histograms showing distribution of radiogenic Uranium and lead isotope ratios derived from evaporation and conventionalU – Pb analysis of single zircons from magmatic rocks of SW Uganda: (a) Chitwe Granite sample; (b) Ntungamo Granite samples. The weighted mean agesare given with a 2r mean error.
12 R. Buchwaldt et al. / Journal of African Earth Sciences 51 (2008) 4 – 20

8/3/2019 Crustal Age Domains in Kibaran Belt of SW-Uganda - Combined Zr Geochronol and Sm-Nd Isotopic Investig
http://slidepdf.com/reader/full/crustal-age-domains-in-kibaran-belt-of-sw-uganda-combined-zr-geochronol-and 10/17
Table 2Isotopic data from single grain zircon evaporation of the Granites from SW-Uganda
Sample no. Zircon colour and morphology Grainno.
Massscansa
Evaporationtemp. in °C
Mean 207Pb/206Pb ratioand 2rm errorb
Mean 207Pb/206Pbage and errorc
OG 5 Prismatic, clear to light brown 4 152 1590 0.087098 ± 52 1362.7 ± 3.53 224 1580 0.086981 ± 32 1360.1 ± 0.74 250 1600 0.087111 ± 22 1363.0 ± 0.5
Mean of three grains 3 – 4 626 0.087061 ± 32 1362.0 ± 4.2
KA 04 Long prismatic, light brown to brown,idiomorph, $180 – 200 lm
4 292 1590 0.085998 ± 20 1338.1 ± 0.44 274 1610 0.085524 ± 68 1327.5 ± 1.54 441 1580 0.085330 ± 19 1323.1 ± 0.4
Mean of four grains 4 1007 0.085576 ± 33 1330.0 ± 22
4 212 1590 0.055974 ± 135 451.3 ± 5.3
RW 11 Long prismatic, light brown idiomorphic, $100 lm 4 385 1590 0.086804 ± 84 1356.2 ± 1.94 166 1580 0.087313 ± 36 1367.4 ± 0.84 61 1590 0.087455 ± 80 1370.5 ± 1.84 283 1580 0.087337 ± 24 1367.9 ± 0.5
Mean of four grains 4 868 0.087121 ± 31 1367.4 ± 4.6
NT 12 Long prismatic, idiomorph, clear $100 lm 4 360 1580 0.090867 ± 47 1443.8 ± 0.93 224 1600 0.091021 ± 22 1447.1 ± 0.4
4 324 1590 0.090751 ± 30 1441.4 ± 0.6Mean of three grains 3 – 4 908 0.090863 ± 34 1445.2 ± 7.7
CH 26 Long prismatic, idiomorph, light brown to brown 4 225 1590 0.096928 ± 20 1565.8 ± 0.44 150 1590 0.096926 ± 27 1565.8 ± 0.54 252 1600 0.096930 ± 31 1565.9 ± 0.6
Mean of three grains 4 627 0.096928 ± 26 1565.8 ± 0.3
a Number of 207Pb/206Pb ratios evaluated for age assessment.b Observed mean ratio corrected for non-radiogenic Pb where necessary. Errors based on uncertainties in counting statistics.c Error based on reproducibility of internal standard.
Table 3U – Pb data of the different granite intrusions obtained by using single zircon vapour digestion method
Sample Zircon colour and morphology U tot/Pb*
Measured isotopic ratios 207Pb/206Pbage206Pb/204Pb 207Pb/ 206Pb 207Pb/235U 206Pb/238U q
OG05 Prismatic, clear to light brown 11.32 3797 ± 12 0.08698 ± 13 2.8234 ± 27 0.23507 ± 23 0.93234 1360.05 ± 2.01OG05 Prismatic, clear to light brown 10.91 4298 ± 05 0.08701 ± 09 2.8193 ± 31 0.23439 ± 33 0.98564 1360.72 ± 1.99OG05 Prismatic, clear to light brown 10.95 2089 ± 04 0.08699 ± 11 2.8221 ± 35 0.23499 ± 55 0.97234 1360.27 ± 2.43OG05 Prismatic, clear to light brown 11.52 3367 ± 07 0.08693 ± 10 2.8215 ± 34 0.23486 ± 44 0.92377 1358.94 ± 2.22
RW 11 Long prismatic, light brown, idiomorphic,
$100 lm11.06 2565 ± 02 0.08703 ± 12 2.8441 ± 22 0.23614 ± 22 0.91324 1361.16 ± 2.65
RW 11 Long prismatic, light brown, idiomorphic,
$100 lm10.81 3176 ± 06 0.08722 ± 22 2.8432 ± 34 0.23605 ± 34 0.99342 1365.36 ± 4.05
RW 11 Long prismatic, light brown, idiomorphic,
$100 lm11.36 3312 ± 12 0.08716 ± 15 2.8439 ± 27 0.23612 ± 21 0.92332 1364.03 ± 3.31
KA 04 Long prismatic, light brown to brown, idiomorph,
$180 – 200 lm10.22 2298 ± 22 0.08564 ± 12 2.7103 ± 27 0.22911 ± 44 0.92346 1330.07 ± 2.71
KA 04 Long prismatic, light brown to brown, idiomorph,
$180 – 200 lm11.67 3217 ± 14 0.08571 ± 08 2.7093 ± 33 0.22905 ± 41 0.92463 1331.65 ± 1.81
KA 04 Long prismatic, light brown to brown, idiomorph,
$180 – 200 lm9.76 2226 ± 18 0.08568 ± 21 2.7081 ± 35 0.22902 ± 42 0.92358 1330.97 ± 4.74
KA 04 Long prismatic, light brown to brown, idiomorph,
$180 – 200 lm10.84 2988 ± 03 0.08566 ±10 2.7022 ± 34 0.22825 ± 31 0.92435 1330.52 ± 2.26
NT 12 Long prismatic, idiomorph, clear, $100 lm 7.5 1256 ± 11 0.09090 ± 10 3.1523 ± 23 0.25125 ± 21 0.97324 1444.51 ± 2.09NT 12 Long prismatic, idiomorph, clear, $100 lm 5.52 2734 ± 15 0.09089 ± 09 3.1511 ± 41 0.25135 ± 44 0.92090 1444.51 ± 1.89NT 12 Long prismatic, idiomorph, clear, $100 lm 8.86 1167 ± 18 0.09087 ± 11 3.1464 ± 33 0.25042 ± 31 0.95716 1443.88 ± 2.31
CH 26 Long prismatic, idiomorph, light brown to brown 12.6 2754 ± 11 0.09682 ± 12 3.6734 ± 31 0.27486 ± 46 0.92467 1563.73 ± 2.32CH 26 Long prismatic, idiomorph, light brown to brown 11.95 2618 ± 05 0.09684 ± 15 3.6698 ± 24 0.27394 ± 44 0.94782 1564.12 ± 2.91CH 26 Long prismatic, idiomorph, light brown to brown 11.33 2987 ± 02 0.09682 ± 07 3.6742 ± 29 0.27473 ± 53 0.92897 1563.73 ± 1.35
CH 26 Long prismatic, idiomorph, light brown to brown 10.92 2543 ± 07 0.09687 ± 11 3.6653 ± 22 0.273432 ± 21 0.95183 1564.70 ± 2.13
R. Buchwaldt et al. / Journal of African Earth Sciences 51 (2008) 4 – 20 13

8/3/2019 Crustal Age Domains in Kibaran Belt of SW-Uganda - Combined Zr Geochronol and Sm-Nd Isotopic Investig
http://slidepdf.com/reader/full/crustal-age-domains-in-kibaran-belt-of-sw-uganda-combined-zr-geochronol-and 11/17
Fig. 8. Concordia plots and Histograms showing distribution of radiogenic Uranium and lead isotope ratios derived from evaporation and conventional
U –
Pb analysis of single zircons from magmatic rocks of SW Uganda: (a –
b) Rwentobo Granite sample; (c) Kamwezi Granite samples. The weighted meanages are given with a 2r mean error.
14 R. Buchwaldt et al. / Journal of African Earth Sciences 51 (2008) 4 – 20
8/3/2019 Crustal Age Domains in Kibaran Belt of SW-Uganda - Combined Zr Geochronol and Sm-Nd Isotopic Investig
http://slidepdf.com/reader/full/crustal-age-domains-in-kibaran-belt-of-sw-uganda-combined-zr-geochronol-and 12/17
5. Discussion and conclusions
5.1. Implications from zircon geochronology on magma
geneses
Zircon is a unique geochronometer, insofar as its closuretemperature (1000 °C, Cherniak et al., 1997) is higher than
the temperatures under which the mineral can form in a gra-nitic melt. Therefore, a U – Pb zircon age dates the timewhen the magma cooled below its saturation temperatureand new magmatic zircons can nucleate. Uncertainties inage, however, arise from zircon inheritance, i.e. relict cores.Such zircons can enter the melt as (1) residual materialinherited from the source, (2) material entrained by theascending magma, or (3) material taken by wall-rock assim-ilation during intrusion. We are aware that both used tech-niques are not the best methods to study inheritance, andonly in situ U – Pb measurements would really help to char-acterize and date the inherited cores. Combined with the CLimages, however, the results allow some general statementsabout zircon inheritance.
These granites exclusively have S-type geochemicalcharacteristics. In all the granites older ages were notdetected neither by the Pb-evaporation method nor bythe U – Pb dissolution technique, although inheritance isdocumented in some of the zircon CL images (Fig. 6). Thismisfit between CL images suggesting older cores and iso-tope data may be explained by complete Pb-loss fromthe zircon cores during formation of the melts. In fact,Nasdala et al. (2001) found that zircon cores with highradionuclide content or higher degree of radiation damageof the crystal lattice can lose their radiogenic Pb com-
pletely. Alternatively, most of the inherited zircons may
be only slightly older than those matching the acceptedages of the granites. This explanation is supported by thefinding that in some zircons with cores, the ‘‘age” for thehighest evaporation step was not remarkably older thanthe crystallization age of the granite. It seems possible thatthe cores of these zircons were formed during an earliermelting event. However, a combination of the two reasons
given above may be the most likely explanation for theenigmatic relationship between CL and geochronologicalresults.
The solubility of zircon in a silicate melt is a function of temperature and the composition of that melt (Watson andHarrison, 1983). If the zircon saturation temperature wasexceeded by inherent temperatures of the melt, complete zir-con dissolution may have occurred, followed by coolingduring ascent and magmatic crystallization. According tothe calibration curves of Watson and Harrison (1983), theUgandian granitoids have low zircon saturation tempera-tures (older granites <860 °C, younger granites <750 °C).For I-type tonalitic melts, high liquid temperatures of 1100 – 850 °C can be assumed. Such conditions may haveprevailed in the mantle or in deeper crustal levels of a thick-ened crust. Thus, it seems possible that zircon was com-pletely dissolved in the melts which produced theUgandian granites. Generation of larger amounts of S-typemelts during crustal anatexis requires temperatures between850 and 700 °C (e.g. Clarke, 1992). At these temperatureszircon xenocrysts may have been retained in the melt. Evenif the temperature of the melt was higher than the zircon sat-uration temperature, it could be argued that there was somechemical disequilibrium between zircon and melt duringanatexis, so that the older grains were not completely
dissolved.
Fig. 9. Nd evolution diagram for the granites under investigation with eNd vs. time. The isotope evolution lines for depleted mantle models are calculatedfor the model proposed by Goldstein et al. (1984).
R. Buchwaldt et al. / Journal of African Earth Sciences 51 (2008) 4 – 20 15
8/3/2019 Crustal Age Domains in Kibaran Belt of SW-Uganda - Combined Zr Geochronol and Sm-Nd Isotopic Investig
http://slidepdf.com/reader/full/crustal-age-domains-in-kibaran-belt-of-sw-uganda-combined-zr-geochronol-and 13/17
5.2. Origin of the melts
Apart from some differences in grain size, the Ugandiangranites have similar geochemical characteristics. Thechemical and isotopic features are similar to those of typi-cal S-type granites (Chappell and White, 1974). As shown
in normalized trace element diagrams (Fig. 5), the granitesexhibit distinct negative anomalies of Ba, Nb, Sr, Eu andTi. These features resemble those of shales and greywackes(Fig. 5). The Rb/Sr ratios are lower compared with other S-type granites and show that the samples were probably notstrongly fractionated during differentiation processes. Anegative Eu anomaly can result from plagioclase fraction-ation from the melt and/or inherited from the precursors(DePaolo, 1988; Lipin et al., 1989). The Nd isotopic com-positions of the granites offer no clear evidence for aninvolvement of mantle melts during the granite formation.Therefore, it can be suggested that the granite magmaresulted from a source comprising substantial sedimentary
or metasedimentary rocks, from which the chemical featurewas inherited.
Looking at this chemical fingerprint of the granites,there are strong similarities to less contaminated dioriteand syenites from the Scottish Caledonides (Thompsonand Fowler, 1986). The Scottish diorites and syenites arethought to be related to active subduction or magmatismimmediately preceding subduction of oceanic crust. There-fore we suggest derivation of the Ugandian granites from asource relative enriched in LILE and LREE by fluids ormelts from subducted oceanic crust but not enriched inHFSE (cf. Tatsumi et al., 1986). Alternatively the relative
Nb, Ta depletion could be caused by stabilization of resid-ual Ti-phase in the mantle source. The stability of Ti phaseswas experimentally shown to be favored by high oxygenfugacities (Green and Pearson, 1986) which is typical formantle domains previously affected by subduction zone flu-ids (e.g. Lange et al., 1993). Nevertheless as discussedabove the observed fingerprint is originated during an ear-lier event.
Both suites of granite exhibit similar negative but dis-tinctive initial variable eNd values. This suggests thatLREE-enriched sources with different Sm/Nd fractionationand/or residence ages were involved in the genesis of thesegranites. The regional distribution of Nd mean crustal res-idence ages and the crystallization ages obtained by zirconsis portrayed on the geologic map of SW-Uganda showingthe four granite plutons under investigation (Fig. 2). Thisdistribution suggests that there are two different age prov-inces within the orogenic belt, each with its own history.Hereby shows the first group which is represented by twogranitoid bodies namely the Ntungamo and Chitwe plutona magmatic phase at around 1565 – 1443 Ma with T DM
model ages between 2.9 and 3.1 Ga. The magmatic phasein the southern part of the research area, the Rwentoboand Kamwezi granite, took place from 1328 Ma to1363 Ma and T DM model ages cluster between 3.5 and
3.8. The possible boundary between these two crustal
domains lies after this reconnaissance approach withinthe Migmatite and Gneiss region of SW Uganda. Thereforethe tentative boundary is not clearly defined by the Kiba-ran metamorphic history, and it may possibly be maskedby a later metamorphic event.
There are two main scenarios which would account for
the differences observed in the granitoids. (1) The granitesshow reworking of Archean crust in a Kibaran Andean-type continental margin. If this is the case we would expectthat the older group would have inherited the largest pro-portion of old crust, and the younger group the smallest.The relative proportions of old crust would also correlatewith the relative distance of the Andean-type margins fromthe site of magma generation. Never the less the dataobtained in this study indicate that the relationship isinverse and that the younger group inherited the largestamount of old crust.
The second scenario would be reworking of predomi-nantly Archean-age crust during Kibaran magmatism:
Nd model ages give values between 4 Ga and 2.5 Ga ( Table4), similar to the Nd model ages of the metasedimentaryrocks from the Bangweulu Craton Formation and preexist-ing igneous rocks (De Waele et al., 2006), which suggestlate-Archean sources. However, these ages do not refer toany specific crust formation age, but they provide an esti-mate of the average crustal residence age of the REE inthe granite protolith, which presumably resulted from mul-tiple mixing of recycled and newly formed components inpre-Kibaran times. The apparent Nd model age equilib-rium signature shown by the granites and metasedimentaryand pre-existing igneous rocks indicate that there was no
large-scale juvenile addition to this segment of the crustduring the Pan-African orogeny, which is consistent withthe published results from the southern part of the Irumidebelt (De Waele et al., 2006). The absence of juvenile mate-rial is consistent with intracrustal melting rather than anarc-type setting. An alternative model that may explainthe striking uniformity of Nd model ages for gneisses fromTanzania and Malawi would be melting of sediments in atrench environment. Melting of well-mixed sedimentderived from Archean as well as Neoproterozoic juvenilecrust provides a suitable process to explain uniform Ndmodel ages in a magmatic arc. This scenario would alsobe consistent with the initial assembly along Andean-typemargins.
5.3. Regional implications
Our geochronological study of Late Archean granitoidrocks from the Kibaran belt of Northern Uganda revealsat least three distinctive events ranging from 1000 Ma to1800 Ma, which are consistent with granite emplacementages in various parts of the Kibaran belt. The intraconti-nental setting for the Kibaran belt throughout its evolution(e.g. De Waele et al., 2006, 2003; Klerkx et al., 1987; Pohl,1994; Tack et al., 1994, 1992) due to the interaction
between the Congo and the Tanzania cratons, appear quite
16 R. Buchwaldt et al. / Journal of African Earth Sciences 51 (2008) 4 – 20

8/3/2019 Crustal Age Domains in Kibaran Belt of SW-Uganda - Combined Zr Geochronol and Sm-Nd Isotopic Investig
http://slidepdf.com/reader/full/crustal-age-domains-in-kibaran-belt-of-sw-uganda-combined-zr-geochronol-and 14/17
well documented. Over the entire Kibaran belt five promi-nent distinct tectonic phases associated with magmaticactivity can be distinguished, as follows.
The first two observed events of the Usagaran(2.04 – 1.95 Ga) and the Ubendian phase (1.88 – 1.85 Ga)have been predominantly recognized along the southernmargin of the Congo Craton (De Waele et al., 2006). Bothevents have been interpreted as associated to Convergencetectonic and/or metacratonic reactivation. Neither Usaga-ran ages nor Ubendian ages have been detected in theNorthern Kibaran belt. Nevertheless we observed in CLimages remnants of zircon cores which as we discussedabove had been isotopically reset during high temperatureevents. The origin of the zircons of these cores could becrystallized during these two magmatic phases, which also
allowed to create the chemical fingerprint.
A third magmatic event would be the Lukamfwa phaseat around 1.6 – 1.4 Ga. This phase can be observed inalmost all parts of the Kibaran belt in north eastern sectionPohl (1987, 1994) reports ages of around 1.4 Ga. In thecentral part Tack et al. (1994, 1992) mentions ages of upto 1.5 Ga and De Waele et al. (2006) reports granitic intru-sions in the southern part of the belt. Our data indicate aswell at least two phases within this time period. There seemto be a general consensus that the magmatic activity isintracontinental in nature. The Nd isotope data set is lim-ited but De Waele et al. (2006) and this study indicate sim-ilar T DM values indicating that the source for both areasalso relatively far apart might have been the same. Andtherefore indicate a widespread phase of magmatic activity.
A fourth phase ranging from 1.3 to 1.2 Ga has been
reported by Tack et al. (1994, 1992), Klerkx et al. (1987)
Table 4Sm – Nd whole rock isotope data of the studied granites
Sample no. Rock-type Sm (ppm) Nd (ppm) 147Sm/144Nd 143Nd/144Nd t(Ma) T DM eNd(t=0) eNd(t)
Kamwezi granite
KA 01 Granite 5.36 44.1 0.1217 0.510952 ± 11 1328.6 3.57 À32.9 À20.2KA 02 Granite 3.41 32.2 0.1059 0.510790 ± 15 1328.6 3.61 À36.1 À20.7KA 03 Granite 4.84 40.5 0.1196 0.510931 ± 12 1328.6 3.57 À33.3 À20.3
KA 04 Granite 2.14 21.2 0.1014 0.510808 ± 11 1328.6 3.52 À35.7 À19.6KA 05 Granite 4.34 43.6 0.0996 0.510759 ± 14 1328.6 3.57 À36.7 À20.2KA 06 Granite 3.56 31.1 0.1145 0.510897 ± 11 1328.6 3.56 À34.0 À20.1KA 07 Granite 4.16 37.1 0.1120 0.510719 ± 10 1328.6 3.81 À37.4 À23.1KA 08 Granite 2.57 19.1 0.1344 0.511027 ± 09 1328.6 3.63 À31.4 À20.9
Rwentobo granite
RW 11 Granite 5.35 37.6 0.1423 0.510979 ± 11 1363.2 3.82 À32.4 À23.0RW 12 Granite 5.61 40.2 0.1397 0.510995 ± 17 1363.2 3.76 À32.0 À22.2RW 13 Granite 5.3 33.3 0.1591 0.511148 ± 11 1363.2 3.79 À29.1 À22.6RW 14 Granite 6.42 44.2 0.1452 0.510998 ± 13 1363.2 3.83 À32.0 À23.1RW 15 Granite 3.22 24.3 0.1325 0.510935 ± 12 1363.2 3.75 À33.2 À22.1RW 16 Granite 4.5 35.7 0.1263 0.510856 ± 10 1363.2 3.79 À34.8 À22.6RW 17 Granite 4.37 33.3 0.1312 0.510886 ± 12 1363.2 3.81 À34.2 À22.8RW 18 Granite 5.45 37.4 0.1455 0.510997 ± 11 1363.2 3.84 À32.0 À23.2
RW 19 Granite 5.35 45.1 0.1187 0.510813 ± 15 1363.2 3.75 À35.6 À22.1RW 20 Granite 4.64 31.1 0.1494 0.511178 ± 12 1363.2 3.61 À28.5 À20.3RW 21 Granite 3.73 27.1 0.1376 0.510966 ± 11 1363.2 3.78 À32.6 À22.4
Ntungamo granite
NT 18 Granite 15.57 104.6 0.1489 0.511655 ± 10 1443.8 2.86 À19.2 À10.4NT 19 Granite 12.32 89.3 0.1379 0.511549 ± 11 1443.8 2.86 À21.3 À10.4NT 20 Granite 9.65 66.4 0.1453 0.511595 ± 16 1443.8 2.90 À20.3 À10.9NT 21 Granite 14.35 100.8 0.1424 0.511606 ± 15 1443.8 2.84 À20.1 À10.1NT 22 Granite 11.69 73.8 0.1584 0.511602 ± 12 1443.8 3.09 À20.2 À13.2NT 23 Granite 12.29 84.3 0.1458 0.511621 ± 11 1443.8 2.87 À19.8 À10.5NT 24 Granite 13.32 89.4 0.1489 0.511588 ± 12 1443.8 2.97 À20.5 À11.7NT 25 Granite 10.04 72.3 0.1388 0.511546 ± 10 1443.8 2.88 À21.3 À10.6
Chitwe granite
CH 26 Granite 3.86 26.3 0.1471 0.511599 ± 10 1565.8 2.96 À20.3 À10.4
CH 02 Granite 9.67 66.4 0.1457 0.511582 ± 10 1565.8 2.96 À20.6 À10.4CH 03 Granite 7.49 45.1 0.1659 0.511729 ± 07 1565.8 3.06 À17.7 À11.6CH 04 Granite 4.82 36.4 0.1326 0.511413 ± 11 1565.8 3.02 À23.9 À11.1CH 05 Granite 8.49 58.3 0.1456 0.511557 ± 12 1565.8 3.00 À21.1 À10.9CH 06 Granite 10.56 69.4 0.1523 0.511659 ± 09 1565.8 2.95 À19.1 À10.3CH 07 Granite 5.14 44.3 0.1159 0.511290 ± 10 1565.8 2.94 À26.3 À10.1CH 08 Granite 3.72 25.6 0.1457 0.511521 ± 11 1565.8 3.06 À21.8 À11.6CH 09 Granite 8.35 66.3 0.1259 0.511356 ± 12 1565.8 3.00 À25.0 À10.9CH 10 Granite 5.71 38.2 0.1497 0.511598 ± 15 1565.8 3.00 À20.3 À10.9
R. Buchwaldt et al. / Journal of African Earth Sciences 51 (2008) 4 – 20 17

8/3/2019 Crustal Age Domains in Kibaran Belt of SW-Uganda - Combined Zr Geochronol and Sm-Nd Isotopic Investig
http://slidepdf.com/reader/full/crustal-age-domains-in-kibaran-belt-of-sw-uganda-combined-zr-geochronol-and 15/17
and Pohl (1987, 1994) in the Northeastern and in the Northcentral part of the Kibaran belt. Our results confirm theexistence of such an event in the NW part of the Kibaranbelt. Nevertheless these ages have not been reported inthe southern part and seem to be absent there. This mag-matic phase has been interpreted by all three authors as
associated to orogenic extensional collapse. Associated tothe collapse are lithosphere scale late Kibaran shear events.If this is the case the question need to be addressed why thecollapse only occurred within the northern part of the beltand not within the southern end.
Finally several authors observed a late phase of postorogenic magmatic activity throughout the Irumide period(1.1 – 0.9 Ga) caused by large scale reworking of crust alongconjugate margins (De Waele et al., 2006; Ikingura et al.,1992; Klerkx et al., 1987). This event could so far not beenfound in the granites of SW-Uganda.
5.4. Suggestions for a geodynamic framework for the
Kibaran plutonism in the Uganda orogen and consequences for crustal evolution
There are two strongly divergent views regarding theinterpretation of the structural behavior of the northeast-ern Kibaran region. (Klerkx et al., 1987; Theunissen,1988) for example based their argument on field evidence,whole rock Rb/Sr and some U/Pb geochronology and con-cluded that the belt was produced during an intracontinen-tal event which than was followed by the then prevailing‘decollement model’. More recently, Tack et al. (1994)investigated geochronological, geochemical and petro-
chemical characteristics of the alkaline intrusive suite incentral Burundi and they repositioned the former1100 Ma age of this event at 1250 Ma. They also proposedan alternative interpretation for Kibaran evolution, inwhich mantle derived intrusions reflect tectonic collapsefollowing crustal thickening. Looking at these three scenar-ios three different geological environments need to be dis-cussed for the magma sources, located in a subductedoceanic crust, the lower continental crust or the upper con-tinental crust metamorphosed at amphibolite facies tolower granulite facies conditions. The first model wouldfit a classical plate-tectonic scenario, but the scarcity of fea-tures which are characteristic of modern active continentalmargins, namely andesitic to granodioritic magmatism, lin-ear batholiths with high-pressure/low-temperature envi-ronments, ophiolites, etc. rule out such a scenario for thegranitic magmatism.
The degree of crustal melting required to generate thelarge amount of granitic material demands temperaturesin excess of $900 °C in the deep crust (e.g. Vielzeuf andMontel, 1994). Mafic plutonism is extremely rare in theKibaran orogen of Uganda and cannot account for ele-vated temperatures at the peak of metamorphism. If thecontinental crust is thickened by stacking several nappes,crustal rocks will be depressed to depths in which partial
melting is likely. This suggestion is confirmed by the pres-
ent results, since the granites from SW-Uganda have initialvar eNd values of À10 to À20 and Ucakuwun (1989) sug-gested pressures of $8 kbar corresponding to depths of $24 km based on the occurring mineral assemblages.Metasedimentary rocks from the Intruded migmatitesand gneisses have rather similar initial var eNd values of
aroundÀ
15, but show Mineral assemblages for pressuresof not more than $5 kbar (Ucakuwun, 1989). It thereforeseems very likely that metapelitic material similar in com-position to the gneisses and migmatites has been depressedinto the deeper crust.
The huge volumes of granitic material in the Kibaranorogen could be the result of an unusual abundance of fertile material in the pre-Kibaran crust, combined withspecial thermal circumstances during orogenesis. Petro-logical and experimental investigations have shown thatsources containing abundant hydrous minerals can pro-duce large volumes of felsic melt, whereas fluid-poorlithologies such as high-grade crystalline basement rocks
cannot generate large volumes of granite under condi-tions of crustal melting (e.g. Clemens and Vielzeuf,1987). The emplacement of the granites falls within aperiod of only limited tectonic activity along transversefaults and shows no evidence of an active margin. Asa consequence, the crust needs to be characterized byhigh radioactive heat production.
Nyblade et al. (1990) calculated average heat productionratios of $5 lW mÀ3 for meta-igneous rocks and1.7 – 2.1 lW mÀ3 for metapelites from the Kibaran orogen.These values are much higher than those used in theoreticalmodels of anatexis in tectonically-thickened crust (England
and Thompson, 1984, 0.9 –
1.3 lW mÀ3
). According to Eng-land and Thompson (1984), a 50% increase in internal heatproduction raises peak temperatures by 150 – 200 °C at thebottom of the crust and thickening of the crust by 1.5 – 2times must result in widespread anatexis at mid-crustal lev-els. It is also predicted that the melting event lags behindinitiation of thrusting several tens to hundreds of millionsof years (Zen, 1988). This view is also compatible withthe observation that this period of crustal melting in theKibaran orogen occurred after the peak of metamorphism.It is very likely that the Kibaran continental crust in SW-Uganda was enriched in heat-producing elements, makingit a good candidate for the massive production of graniteduring an orogeny. Existing temperature gradients will besteepened by the high radioactivity of subducted uppercrustal rocks. Melting can begin in situ or can be triggeredby the development of gravitational instabilities followedby rapid adiabatic decompression.
Collision tectonics could have contributed to the gener-ation of granites in several ways including thickening of fertile metasedimentary piles, fluxing of aqueous fluidsintroduced by continuous underthrusting of low-grademetasedimentary rocks, stacking of crustal units (Schluter,1997) with different thermal conductivities (metasedimenta-ry rocks vs. dry basement lithologies) and shear heating. In
addition to these intracrustal processes, delamination of
18 R. Buchwaldt et al. / Journal of African Earth Sciences 51 (2008) 4 – 20

8/3/2019 Crustal Age Domains in Kibaran Belt of SW-Uganda - Combined Zr Geochronol and Sm-Nd Isotopic Investig
http://slidepdf.com/reader/full/crustal-age-domains-in-kibaran-belt-of-sw-uganda-combined-zr-geochronol-and 16/17
the sub-continental lithosphere could have occurred, givingrise to the unusual geochemistry of syn- to post-collisionalgranites (De Waele et al., 2006; Klerkx et al., 1987; Tacket al., 1994).
Extension of this approach to larger parts of the Kiba-ran province will allow a more robust reconstruction of
ancient terrane boundaries and will lead to a reliable modelfor the evolution and geodynamic setting of Precambriancrustal domains in the Kibaran orogenic belt.
Acknowledgements
This paper benefited by very constructive comments byJ.P. Liegeois and Sospeter Muhongo and an anonymousreviewer. Technical support by H. Feldman with the isoto-pic analysis at the Max-Planck Institute fur Chemie isacknowledged as well as stimulating discussions with A.Kroner, Th. Wenzel, R. Valentine and K. Mezger. Wethank N. Clauer from the Centre de Geochimie de la Sur-
face (CNRS), Strasbourg, France who kindly provided ac-cess to the ICPMS. Financial support by the ‘GermanIndustrial Fund’ to R. Buchwaldt is gratefullyacknowledged.
References
Barnes, J.W., 1956. Precambrian structure and the origin of the granotoidrocks in SW-Uganda. PhD Thesis, University London, London.
Cahen, L., Snelling, N.J., 1966. The Geochronology of Equitorial Africa.Clarendon Press, Oxford, 512 pp.
Chappell, B.W., White, A.J.R., 1974. Two contrasting granite types.Pacific Geology 8, 173 – 174.
Cherniak, D.J., Hanchar, J.M., Watson, E.B., 1997. Diffusion of teravalent cations in zircon. Contribution to Mineralogy and Petrol-ogy 127, 383 – 390.
Clarke, D.B., 1992. Granitoid rocks. Topics in Earth Sciences, vol. 7.Chapman and Hall, London.
Clemens, J.D., Vielzeuf, D., 1987. Constraints on melting and magmaproduction in the crust. Earth and Planetary Science Letters 86 (2 – 4),287 – 306.
De Waele, B., Liegeois, J.-P., Nemchin, A.A., Tembo, F., 2006. Isotopicand geochemical evidence of proterozoic episodic crustal reworkingwithin the Irumide belt of south-central Africa, the southern metacr-atonic boundary of an Archaean Bangweulu Craton. PrecambrianResearch 148 (3 – 4), 225 – 256.
De Waele, B., Wingate, M.T.D., Fitzsimons, I.C.W., Mapani, B.S.E.,2003. Untying the Kibaran knot: a reassessment of Mesoproterozoic
correlations in southern Africa based on SHRIMP U –
Pb data fromthe Irumide belt. Geology 31 (6), 509 – 512.
DePaolo, 1988. Neodymium isotope geochemistry. Minerals and Rocks,vol. 20. Springer, New York, 187 pp.
DePaolo, D.J., 1981. Nd isotopic studies: some new perspectives on earthstructure and evolution. EOS 62 (14), 137 – 140.
Didier, J., Duthou, J.L., Lameyre, J., 1982. Mantle and crustal granites:genetic classification of orogenic granites and the nature of theirenclaves. Journal of Volcanology and Geothermal Research 14,125 – 132.
England, P.C., Thompson, A.B., 1984. Pressure – temperature – time pathsof regional metamorphism I. Heat transfer during the evolution of thickened continental crust. Journal of Petrology 25, 894 – 928.
Goldstein, S.L., O’Nions, R.K., Hamilton, P.J., 1984. A Sm – Nd isotopicstudy of atmospheric dust and particulates from major river systems.
Earth and Planetary Science Letters 70, 221 –
236.
Green, T.H., Pearson, N.J., 1986. Ti-rich accessory phase saturation inhydrous mafic – felsic composition at high P – T. Chemical Geology 54,185 – 201.
Ikingura, J.R., Reynolds, P.H., Watkinson, D.H., Bell, K., 1992. 40Ar/39Ar dating of micas from granites of NE Kibaran Belt (Karagwe-Ankolean), NW Tanzania. Journal of African Earth Sciences 15 (3 – 4),501 – 511.
Kisvarsanyi, E.B., Kisvarsanyi, G., 1990. Alkaline granite ring complexesand metallogeny in the middle proterozoic St. Francois Terrane,Southeastern Missouri, USA. In: Gower, C., River, T., Ryan, B.(Eds.), Mid-Proterozoic Laurentia – Baltica. Geological AssociationCanada, Special Paper 38, pp. 433 – 446.
Klerkx, J., Liegeois, J.P., Lavreau, J., Claessens, W., 1987. Crustalevolution of the Northeastern Kiberan belt, eastern and central Africa.In: Kroner, A. (Ed.), Proterozoic Lithospheric Evolution. AmericanGeophysical Union, Geodynamic Series, pp. 217 – 233.
Kober, B., 1986. Whole-grain evaporation for 207Pb/206Pb age investiga-tions on single zircons using a double filament thermal ion source.Contributions to Mineralogy and Petrology 93, 482 – 490.
Kober, B., 1987. Single-zircon evaporation combined with Pb+ emitterbedding for 207Pb/206Pb-age investigations using thermal ion massspectrometry, an implication on zirconology. Contribution to Miner-alogy and Petrology (96), 63 – 71.
Krogh, T.E., 1973. A low-contamination method for decomposition of zircon and extraction of U and Pb for isotopic age determination.Geochimica et Cosmochimica Acta 37, 488 – 494.
Krogh, T.E., 1982. Improvement accuracy of U – Pb zircon ages by thecreation of more concordant systems using an air abrasion technique.Geochimica at Cosmochimica Acta 46, 637 – 649.
Lange, R.A., Carmichael, I.S.E., Renne, P.R., 1993. Potassic volcanismnear Mono basin, California: evidence for high water and oxygenfugacities inherited from subduction. Geology 21, 949 – 952.
Liew, T.C., Hofmann, A.W., 1988. Precambrian crustal components,plutonic associations, plate environment of the Hercznian Fold Belt of central Europe: indications from a Nd and Sr isotopic study.Contributions to Mineralogy and Petrology 98, 129 – 138.
Lipin, B.R., McKay, G.A., Boynton, W.V., 1989. Geochemistry andmineralogy of rare earth elements. Reviews in Mineralogy, vol. 21.Mineralogical Society of America, Washington, DC, ix, 348 pp.
Ludwig, K.R., 1982. A computer program to convert raw U – Th – Pbisotope ratios to blank corrected isotope ratios and concentrationswith associated error-correlations. OF-82-820, USGS.
McDonough, W.F., Sun, S.-s., 1995. The composition of the Earth.Chemical Geology 120 (3 – 4), 223 – 253.
Mezger, K., Essene, E.J., van der Pluijm, B.A., Halliday, A.N., 1993.U – Pb geochronology of the Grenville Orogen of Ontario and NewYork; constraints on ancient crustal tectonics. Contributions toMineralogy and Petrology 114, 13 – 26.
Moller, A., Mezger, K., Schenk, V., 1998. Crustal age domains and theevolution of the continental crust in the Mozambique belt of Tanzania:combined Sm – Nd, Rb – Sr, and Pb – Pb isotopic evidence. Journal of Petrology 39, 749 – 783.
Moores, E.M., 1993. Neoproterozoic oceanic crustal thinning emergenceof continents, and origin of the phanerozoic ecosystem: a model.Geology 21, 5 – 8.
Nakamura, N., 1974. Determination of REE, Ba, Fe, Mg, Na and K incarbonaceous and ordinary chondrites. Geochimica et CosmochimicaActa 38, 757 – 775.
Nasdala, L. et al., 2001. Metamictisation of natural zircon: accumulationversus thermal annealing of radioactivity-induced damage. Contribu-tions to Mineralogy and Petrology 141 (2), 125 – 144.
Nyblade, A.A., Mushayandebvu, M., Pollack, H.N., Jones, D.L.,Podmore, F., 1990. Terrestrial heat flow in east and southern Africa.Journal of Geophysical Research 95 (B11), 17,371 – 17,384.
Pohl, W., 1987. Metallogeny of northeastern Kibaran Belt, Central Africa.Geological Journal 22, 103 – 119.
Pohl, W., 1994. Metallogeny of the northeastern Kibera belt, Central
Africa–
recent perspectives. Ore Geology Reviews 9, 105 –
130.
R. Buchwaldt et al. / Journal of African Earth Sciences 51 (2008) 4 – 20 19

8/3/2019 Crustal Age Domains in Kibaran Belt of SW-Uganda - Combined Zr Geochronol and Sm-Nd Isotopic Investig
http://slidepdf.com/reader/full/crustal-age-domains-in-kibaran-belt-of-sw-uganda-combined-zr-geochronol-and 17/17
Ring, U., Kroner, A., Layer, P., Buchwaldt, R., Toulkeridis, T., 1999.Deformed A-type granites in northern Malawi, east central Africa: pre-or syntectonic? Journal of the Geological Society London 156,695 – 714.
Roberts, S.J., Ruiz, J., 1989. Geochemistry of exposed granulite faciesterrains and lower crustal xenoliths in Mexico. Journal of GeophysicalResearch 94, 7961 – 7974.
Samuel, J., Rouault, R., Besnus, Y., 1985. Analyse multielementairestandardisee des materiaux geologiques en spectrometrie d’emissionpar plasma a couplage inductif. Analusis 13, 312 – 317.
Schluter, T., 1997. Geology of East Africa. Beitrage zur regionalenGeologie der Erde, 27, 484 pp.
Shand, S.J., 1951. Eruptive Rocks: Their Genesis, Composition, Classi-fication, and their Relation to Ore-Deposits, with a Chapter onMeteorites. Wiley, New York, 788 pp.
Stacey, J.S., Kramers, J.D., 1975. Approximation of terrestrial leadisotope evolution by a two-stage model. Earth and Planetary ScienceLetters 26, 207 – 221.
Stern, W.B., 1972. Zur rontgenspectrometrischen Analyse von silikatis-chen Gesteinen und Mineralien. Schweizerische Mineralogische undPetrographische Mitteilungen 52, 1 – 25.
Tack, L. et al., 1990. Late Kibaran magmatism in Burundi. Journal of African Earth Sciences 10, 733 – 738.
Tack, L., Liegeois, J.P., Deblond, A., Duchesne, J.C., 1994. Kiberan A-type granitoids and mafic rocks generated by two mantle sources ina late orogenic setting (Burundi). Precambrian Research 68,323 – 356.
Tack, L., Theunissen, K., Lavreau, J., Deblond, A., Duchesne, J.C., 1992.Ensialic Middle and Upper Proterozoic evolution of the East Africansubcontinent between Lake Victoria and Lake Tanganyika. EOS(Transaction, American Geophysical Union) 73, 366.
Tatsumi, Y., Hamilton, D.L., Nesbitt, R.W., 1986. Chemical charac-teristics of fluid phase released from a subducted lithosphere andorigin of arc magmas: evidence from high pressure experiments and
natural rocks. Journal of Volcanic and Geothermal Research 29,293 – 309.
Taylor, S.R., McLennan, S.M., 1985. The Continental Crust: Its compo-sition and Evolution. Blackwell, Oxford.
Theunissen, K., 1988. Kiberan thrust fold belt (D1-2) and shear belt (D2 0).Newsletter/Bulletin 1, 55 – 64 (IGCP no. 255).
Thompson, R.N., Fowler, M.B., 1986. Subduction-related shoshoniticand ultra-potassic magmatism: a study of Siluro-Ordovician syenitesfrom the Scotish Caledonides. Contribution to Mineralogy andPetrology 94, 507 – 522.
Tucker, R.D., Raheim, A., Krogh, T.E., Corfu, F., 1987. Uranium-leadzircon and titanite ages from the northern portion of the western gneissregion, south central Norway. Earth Planetary Science Letters 81,203 – 211.
Ucakuwun, E.K., 1989. A study of the structural control, geology andgenesis of the tin and Pegmatite mineralization in SW Ankole, SWUganda. PhD Thesis, Johannes Gutenberg Universitat Mainz, Mainz,266 pp.
Vielzeuf, D., Montel, J.M., 1994. Partial melting of metagreywackes. PartI. Fluid-absent experiments and phase relationships. Contributions toMineralogy and Petrology 117 (4), 375 – 393.
Watson, E.B., Harrison, T.M., 1983. Zircon saturation revisited: temper-ature and composition effects in a variety of crustal magma types.Earth and Planetary Science Letters 64, 295 – 304.
White, A.J.R., Chappell, B.W., 1988. Some supracrustal (S-Type) granitesof the Lachlan Fold Belt. Transaction of the Royal Society of Edinburgh: Earth Sciences 79, 169 – 181.
White, W.M., Patchett, P.J., 1984. Hf – Nd – Sr isotopes and incompatibleelement abundances in island arcs: implication for magma origins andcrust mantle evolution. Earth and Planetary Science Letters, 167 – 185.
Zen, E.A., 1988. Thermal modelling of stepwise anatexis in a thrust-thickened sialic crust. Transactions – Royal Society of Edinburgh:Earth Sciences 79 (2 – 3), 223 – 235.
20 R. Buchwaldt et al. / Journal of African Earth Sciences 51 (2008) 4 – 20


![Investig Compu[1]](https://img.dokumen.tips/doc/110x75/5599d7431a28aba9068b4708/investig-compu1.jpg)