Embed Size (px)
Citation preview

CRUISE VESSEL BIOMASS MANAGEMENT STUDY
DRAFT PHASE 1A
Data Compilation and Initial Assessment
DRAFT JANUARY 2, 2009

CRUISE VESSEL BIOMASS MANAGEMENT STUDY DRAFT PHASE 1A STUDY Data Compilation and Initial Assessment
Cruise Vessel Biomass Management Study Draft Phase 1A Study, December 30, 2008
Table of Contents Executive Summary ........................................................................................................................ 2
Conclusions..................................................................................................................................... 5
Methodology................................................................................................................................... 6
Description of Seattle-Alaska Cruise Industry ............................................................................... 9
Northwest Cruise Ship Association........................................................................................... 10
Memorandum of Understanding between NWCA and State of Washington ........................... 10
Alaska Discharge Standards ......................................................................................................... 14
Description of Current Cruise Vessel Wastewater and Biomass Operations ............................... 15
Advanced Wastewater Treatment Systems ............................................................................... 15
Type II MSDs............................................................................................................................ 18
Characterization of Cruise Ship Biomass ..................................................................................... 18
Disposal of Cruise Ship Biomass .............................................................................................. 18
Chemical Properties of Biomass Generated.............................................................................. 19
Wastewater Management in Scandinavia ..................................................................................... 26
Copenhagen Malmö Ports, Denmark ........................................................................................ 27
Port of Oslo, Norway ................................................................................................................ 27
Port of Helsinki, Finland ........................................................................................................... 28
Port of Stockholm, Sweden....................................................................................................... 29
Cruise Vessel Wastewater and Biomass Operations .................................................................... 33
Onboard Wastewater Treatment................................................................................................ 33
Alternatives to Open-Ocean Discharge of Cruise Ship Biomass.................................................. 33
Incineration................................................................................................................................ 33
Shore Transfer ........................................................................................................................... 33
Existing Shoreside Operations...................................................................................................... 34
Shore Transfer of Biomass............................................................................................................ 44
Direct Discharge to Tanker Truck............................................................................................. 49
Direct Discharge to Barge ......................................................................................................... 50
Direct Discharge to Piping on Pier............................................................................................ 50

CRUISE VESSEL BIOMASS MANAGEMENT STUDY DRAFT PHASE 1A STUDY Data Compilation and Initial Assessment
Cruise Vessel Biomass Management Study Draft Phase 1A Study, December 30, 2008
Future Methods for Biomass Disposal.......................................................................................... 49
Conclusion .................................................................................................................................... 54
References..................................................................................................................................... 56
Figures Figure 1. Growth in Port of Seattle Cruise Ship Usage from 1999 to 2009 (est.) .......................... 9
Figure 2. MOU Boundaries........................................................................................................... 13
Figure 3. Schematic of biological-chlorination Type II MSD (Source: EPA 2007) ............. Error! Bookmark not defined.18
Figure 4. Chemical Comparison of Cruise Ship Biosludge and Treatment Plant Solid Waste: All Selected Metals ............................................................................................................................. 23
Figure 5. Chemical Comparison of Cruise Ship Biosludge and Treatment Plant Solid Waste: Lowest Concentration Metals ....................................................................................................... 24
Figure 6. Chemical Comparison of Cruise Ship Biosludge and Treatment Plant Solid Waste: Lowest Concentration Metals ....................................................................................................... 24
Figure 7. Chemical Comparison of Cruise Ship Biosludge and Treatment Plant Solid Waste: Mid-High Concentration Metals ................................................................................................... 25
Figure 8. Chemical Comparison of Cruise Ship Biosludge and Treatment Plant Solid Waste: Highest Concentration Metals....................................................................................................... 25
Figure 9. Baltic Sea Wastewater Reception Facility Locations.................................................... 27
Figure 10. Vessel Mooring Lines (Terminal 30) .......................................................................... 35
Figure 11. Rendering of T-91 Gangways ..................................................................................... 36
Figure 12. Crew Gangway (Pier 66) ............................................................................................. 37
Figure 13. Baggage Loading (Pier 66).......................................................................................... 38
Figure 14. Baggage Loading and Crew Gangway ........................................................................ 38
Figure 15. Vessel Provisioning (Terminal 30).............................................................................. 39
Figure 16. Utility Connection (Terminal 30)................................................................................ 40
Figure 17. Vessel Shore Power Connection (Terminal 30) .......................................................... 41
Figure 18. Typical Bunker Oil Truck ........................................................................................... 42
Figure 19. Pier Access (Pier 66) ................................................................................................... 43

CRUISE VESSEL BIOMASS MANAGEMENT STUDY DRAFT PHASE 1A STUDY Data Compilation and Initial Assessment
Cruise Vessel Biomass Management Study Draft Phase 1A Study, December 30, 2008
Tables Table 1. Seattle/Alaska Homeport Industry.................................................................................. 12
Table 2. Summary of Washington State Department of Ecology Information Regarding NWCA Cruise Ships, Wastewater Treatment and Biomass Management ................................................ 17
Table 3. Cruise Ship Chemical Data Summary ............................................................................ 20
Table 4. Summary of Cruise Ship and King County Biomass Concentrations ............................ 22
Table 5. Wastewater Reception Facilities at Ports in the Baltic Sea ............................................ 30

CRUISE VESSEL BIOMASS MANAGEMENT STUDY DRAFT PHASE 1A STUDY Data Compilation and Initial Assessment
Section 1
Executive Summary

CRUISE VESSEL BIOMASS MANAGEMENT STUDY DRAFT PHASE 1A STUDY Data Compilation and Initial Assessment
2 Cruise Vessel Biomass Management Study Draft
Executive Summary
On February 16, 2007, the Port of Seattle Commission passed a motion containing numerous environmental initiatives. The fourth item in this motion states:
In April 2007, the King County Council passed a complimentary motion (No. 12498), which directed the King County Wastewater Treatment Division to work cooperatively with the Port of Seattle and other affected agencies to undertake a study of the potential for processing marine cruise industry-generated wastewater through the county’s wastewater treatment system. This work culminated in the August 2007 report titled “Cruise Ship Wastewater Management Report” prepared by the King County Wastewater Treatment Division.
That study provided several recommendations including identification of the following:
1. There is no identified benefit of channeling wastewater from cruise ships to the regional conveyance and treatment system.
2. The South Treatment Plant could receive and incorporate biomass into the existing treatment process without any expansion or modification of the South Treatment Plant. King County recycles all of its biosolids.
The focus of this King County study was on cruise vessel wastewater, not on biomass.
For the purpose of this study “biomass” refers to the partially treated solids residuals from the on-board wastewater treatment process.
As follow-on to the King County study, and with the knowledge that the King County system can receive cruise vessel biomass, Port staff has initiated this Phase 1A Study, to compile data and provide an initial assessment of the physical ability to store on-board, manage, and transfer to on-shore infrastructure the biomass generated by cruise vessels calling at Port of Seattle facilities. The intent of this work is to gain an understanding of
Phase 1A Study, December 30, 2008

CRUISE VESSEL BIOMASS MANAGEMENT STUDY DRAFT PHASE 1A STUDY Data Compilation and Initial Assessment
3 Cruise Vessel Biomass Management Study Draft Phase 1A Study, December 30, 2008
the impacts to the vessels on-board infrastructure, pier side operations and facility on-shore infrastructure in order to determine if it is physically possible to store biomass and off-load it at the pier.
Existing Operational Procedures
In April 2004, the Northwest Cruise Association (NWCA), the Port of Seattle and the Washington State Department of Ecology entered into a Memorandum of Understanding (MOU) to formally acknowledge and implement common environmental goals, policies and practices around the management of solid waste, hazardous waste and wastewater within the boundaries of the MOU. The current boundaries of the MOU include Puget Sound, the Strait of Juan de Fuca south of the international boundary with Canada, and three miles from shore on the West side of the State. The MOU does not specifically define the term “biomass”.
The majority of cruise vessels operating from Port of Seattle facilities utilize Advance Wastewater Treatment Systems (AWTS’s). AWTS’s are on-board treatment systems that treat sewage and usually graywater in a combined system. While these systems produce relatively clean effluent, they also produce large amounts of biomass that must be dealt with. The 2007 study conducted by King County estimated that cruise ships generate 35 tons (including water content) of biomass each day. This number is consistent with 15 to 40 tons identified in responses received by the Port of Seattle to questionnaires sent to NWCA member cruise lines.
Sampling accomplished by the EPA and discussed in more detail in Section 2 illustrate that concentrations of nearly all parameters in the cruise ship biomass are well below King County biomass concentrations for metals. Only the four organic constituents were detected in the cruise ship biomass, with phenol slightly exceeding the King County biomass concentration. While there is no ambient water quality criteria for phenols, in both cases the concentrations are below water quality criteria for the consumption of organisms established under EPA’s water quality criteria.
Comparison to Scandinavian Operations
A discussion of Cruise Vessels operations in Scandinavia is provided in Section 2. Scandinavian Cruise Vessel operations occur on the Baltic Sea, which has been experiencing eutrophication resulting from high nutrient loading, primarily nitrogen and phosphorus. These conditions differ from North Pacific waters where biomass discharge occurs from Port of Seattle operating cruise vessels.
As described in Section 2, the Baltic Sea ports have invested in numerous dockside waste reception facilities. However, only some of the shipping companies utilize these

CRUISE VESSEL BIOMASS MANAGEMENT STUDY DRAFT PHASE 1A STUDY Data Compilation and Initial Assessment
4 Cruise Vessel Biomass Management Study Draft Phase 1A Study, December 30, 2008
facilities. Those ships that utilize shore-side wastewater hook-ups have placed the ships wastewater treatment systems on “stand-by”. Thus, a separate biomass waste stream would not be generated and all wastewaters would be landed ashore.
As such, when wastewater off-load does occur, it delivers all wastewater into the upland (municipal) sewage system rather than just delivering the biomass (residual) as proposed at Port of Seattle facilities. Accordingly, the Baltic Sea operations do not represent a direct comparison to proposed activities within Puget Sound. Further, and as identified in the 2007 King County report, there is no identified benefit of channeling wastewater from cruise ships to the regional conveyance and treatment system.
Existing Shoreside Operations
Pier-side activities are significant at facilities accommodating cruise homeport operations such as those provided by the Port of Seattle at Pier 66 and Terminal 91. Pier space is used simultaneously for vessel moorage, cold ironing, utility connection, all necessary crew and passenger embarkation/debarkation, provisioning, luggage transfer, fueling/bunkering as well as providing space for vehicular access. These ongoing activities currently utilize most of the available pier space in order to accomplish all necessary tasks in the short time vessels are alongside Port facilities. A general discussion of each of these operations including identification of their pier operational impact is provided in Section 3. A description of these activities is included because offloading of biomass would need to happen concurrently with these other activities and in the same pier side area.
Alternatives to Open-Ocean Discharge of Cruise Ship Biomass
The two alternatives to open ocean discharge of biomass that are practiced within the cruise industry are incineration and shore transfer. Both operations are discussed in detail in Section 3. Shore transfer alternatives discussed include direct discharge to tanker truck (staged on the adjacent pier), direct discharge to barge (staged opposite the pier on the waterside of the cruise vessel), and direct discharge to piping located on/under the pier.
Shoreside infrastructure improvements necessary to support off-loading biomass at the pier are discussed in Section 3. For each alternative discussed, it is assumed that biomass would ultimately be discharged at off-site King County Wastewater facilities in Renton. This discussion notes that, at a minimum, the following requirements must be met for shore transfer to be practical:
1. Vessels must have the ability to store biomass on board
2. The Biomass must be pumpable

CRUISE VESSEL BIOMASS MANAGEMENT STUDY DRAFT PHASE 1A STUDY Data Compilation and Initial Assessment
5 Cruise Vessel Biomass Management Study Draft Phase 1A Study, December 30, 2008
3. The vessels must be configured to pump ashore
4. The vessels must have engineering crew available to oversee the transfer operation
5. The operation must be completed within the time the vessel is in port
The three methods of shore transfer discussed herein would have varying levels of impact to pier side operations and space. Direct discharge to tanker trucks would have the greatest impact and direct discharge to barge would have the least impact.
Conclusions
Based on the data provided herein, the following primary conclusions are apparent, each is described in more detail in Section 4 of this report:
• As currently configured, it is not possible for all vessels to store the entire volume of biomass generated in a week long cruise voyage. Two vessels reported they could store all biomass generated in a week. For the remaining vessels, the storage capacity varied from 47% to 94% of weekly generation (3.3 to 6.6 days of storage capacity). At this time, it is not known on a vessel by vessel basis if adding storage is possible.
• Biomass is pumpable and could potentially be pumped on shore.
• On-shore transfer would have significant impacts to pier side operations. The extent of these impacts would vary by vessel, dock facility, volume of biomass to discharge, and method chosen for transfer to shore facilities. However, it is clear that for at least some of the vessels currently calling at the Port, the requisite disembarkation/embarkation of passengers, bunkering and provisioning, as well as the scheduling demands of an Alaskan itinerary sailing from Seattle, make it unlikely that the vessel could unload all of its biomass during the short time they are alongside Port facilities.
• Further study would be needed for evaluation of the potential environmental impact(s) from off-loading biomass at the pier, including determination of the net environmental benefit/impact of both the off-load operation as well as introduction of this biomass into King County systems.
CRUISE VESSEL BIOMASS MANAGEMENT STUDY DRAFT PHASE 1A STUDY Data Compilation and Initial Assessment
6 Cruise Vessel Biomass Management Study Draft Phase 1A Study, December 30, 2008
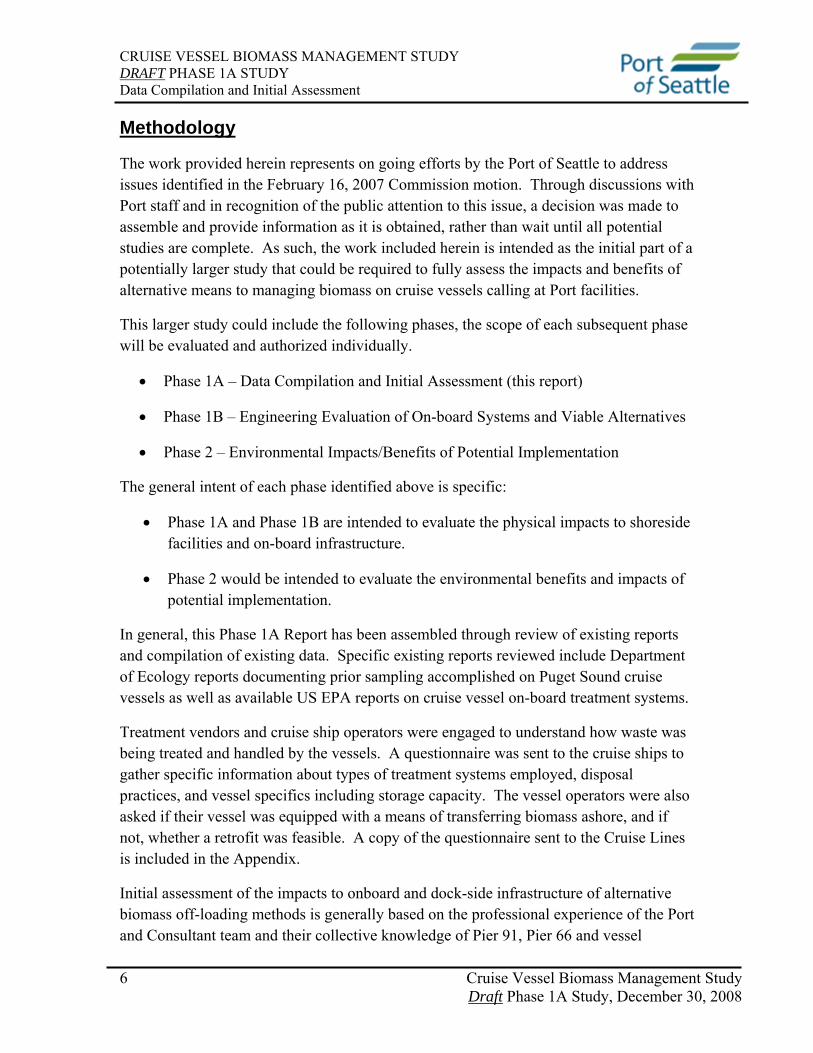
Methodology
The work provided herein represents on going efforts by the Port of Seattle to address issues identified in the February 16, 2007 Commission motion. Through discussions with Port staff and in recognition of the public attention to this issue, a decision was made to assemble and provide information as it is obtained, rather than wait until all potential studies are complete. As such, the work included herein is intended as the initial part of a potentially larger study that could be required to fully assess the impacts and benefits of alternative means to managing biomass on cruise vessels calling at Port facilities.
This larger study could include the following phases, the scope of each subsequent phase will be evaluated and authorized individually.
• Phase 1A – Data Compilation and Initial Assessment (this report)
• Phase 1B – Engineering Evaluation of On-board Systems and Viable Alternatives
• Phase 2 – Environmental Impacts/Benefits of Potential Implementation
The general intent of each phase identified above is specific:
• Phase 1A and Phase 1B are intended to evaluate the physical impacts to shoreside facilities and on-board infrastructure.
• Phase 2 would be intended to evaluate the environmental benefits and impacts of potential implementation.
In general, this Phase 1A Report has been assembled through review of existing reports and compilation of existing data. Specific existing reports reviewed include Department of Ecology reports documenting prior sampling accomplished on Puget Sound cruise vessels as well as available US EPA reports on cruise vessel on-board treatment systems.
Treatment vendors and cruise ship operators were engaged to understand how waste was being treated and handled by the vessels. A questionnaire was sent to the cruise ships to gather specific information about types of treatment systems employed, disposal practices, and vessel specifics including storage capacity. The vessel operators were also asked if their vessel was equipped with a means of transferring biomass ashore, and if not, whether a retrofit was feasible. A copy of the questionnaire sent to the Cruise Lines is included in the Appendix.
Initial assessment of the impacts to onboard and dock-side infrastructure of alternative biomass off-loading methods is generally based on the professional experience of the Port and Consultant team and their collective knowledge of Pier 91, Pier 66 and vessel

CRUISE VESSEL BIOMASS MANAGEMENT STUDY DRAFT PHASE 1A STUDY Data Compilation and Initial Assessment
7 Cruise Vessel Biomass Management Study Draft Phase 1A Study, December 30, 2008
infrastructure. Further detail engineering analysis could be accomplished as part of Phase 1B for those alternatives considered viable.
This report has been prepared by KPFF Consulting Engineers, ENSR/AECOM, and the Glosten Associates in cooperation with Port of Seattle staff.
CRUISE VESSEL BIOMASS MANAGEMENT STUDY DRAFT PHASE 1A STUDY Data Compilation and Initial Assessment
Section 2
Description of Seattle-Alaska Cruise Industry
Current Cruise Vessel Wastewater and Biomass Operations
Characterization of Cruise Ship Biomass
Wastewater Management in Scandinavia

CRUISE VESSEL BIOMASS MANAGEMENT STUDY DRAFT PHASE 1A STUDY Data Compilation and Initial Assessment
9 Cruise Vessel Biomass Management Study Draft
Description of Seattle-Alaska Cruise Industry
The Port of Seattle (POS) has experience significant growth both in the number of vessels calling at the port as well as the number of passengers embarking from the POS.
0
100,000
200,000
300,000
400,000
500,000
600,000
700,000
800,000
900,000
1998 2000 2002 2004 2006 2008 2010Year
Pass
enge
rs
0
50
100
150
200
250
Vess
els
Number ofPassengers
Vessels
Figure 1. Growth in Port of Seattle Cruise Ship Usage from 1999 to 2009 (est.)
In the 2008 season, the Port of Seattle will welcome an estimated 211 cruise ship port calls and over 800,000 passengers (Port of Seattle, 2008). This industry has been steadily expanding since its inception in 1999, when only 6 cruise ships and 6,615 passengers left Seattle bound for Alaska. Ports of call for cruise ships in Alaska include:
• Anchorage • Campbell River • College Fjord • Dutch Harbor • Glacier Bay • Haines
• Homer • Hubbard Glacier • Juneau • Ketchikan • Kodiak • Seward
• Sitka • Skagway • Tracy Arm • Valdez • Whittier • Wrangell
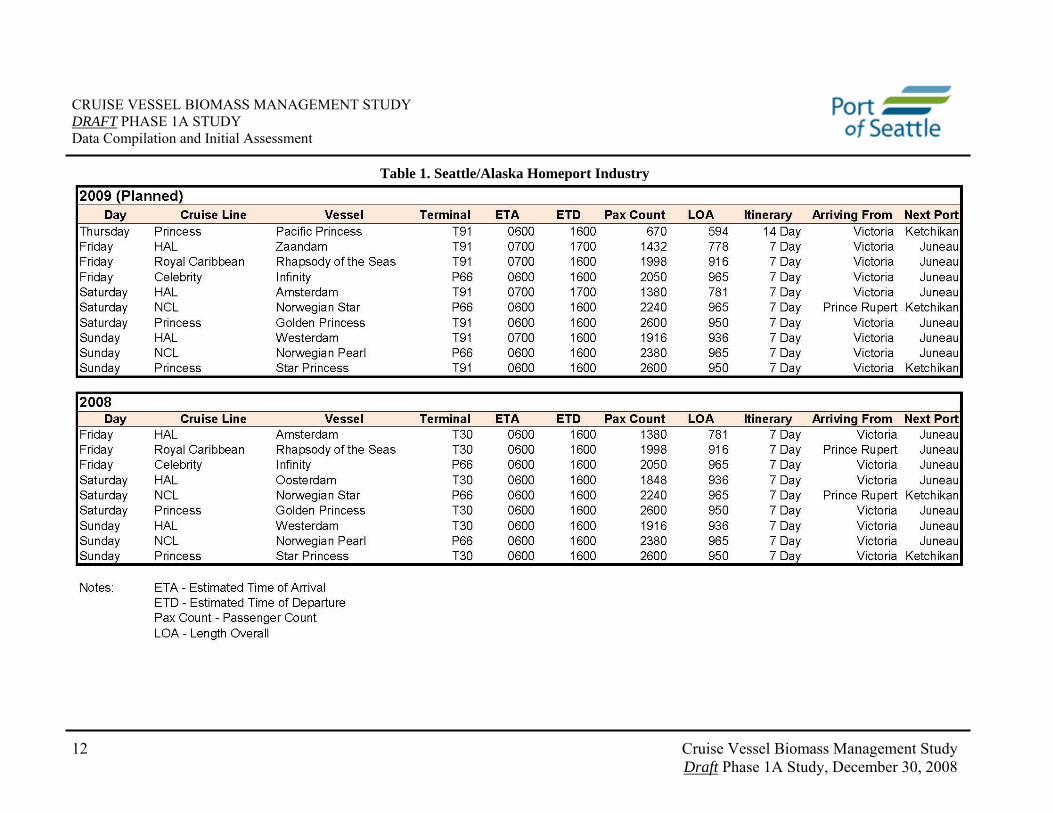
The POS operates as a “homeport” and more specifically, what is commonly called in the cruise industry a “turnaround port”. This term refers to the fact that the Seattle-Alaska cruises originate from the POS where they disembark and embark passengers as well as provisioning (food, fuel, etc.) for their voyages. Table 1 below summarizes the Seattle-Alaska cruise industry for 2008 as well as what is planned for 2009. In general, ten ships originate their cruises to Alaska from Seattle, three each on Friday, Saturday and Sunday and one every other
Phase 1A Study, December 30, 2008

CRUISE VESSEL BIOMASS MANAGEMENT STUDY DRAFT PHASE 1A STUDY Data Compilation and Initial Assessment
10 Cruise Vessel Biomass Management Study Draft Phase 1A Study, December 30, 2008
Thursday from two POS dock locations. In 2008, those dock locations were Terminal 30 and Pier 66. In 2009, activities at Terminal 30 will move to Terminal 91.
Northwest Cruise Ship Association The Northwest Cruise Ship Association (NWCA) is a not-for-profit organization founded in 1986 and was originally intended to provide security services to member lines (Northwest Cruise Ship Association, 2008). Its role has since been expanded to include government relations on legal and regulatory issues. The Association often works with local organizations to mitigate concerns regarding the cruise industry. In addition, it funds economic and environmental studies and works with government agencies on cruise-related issues. Member lines of the NWCA that embark from Seattle include Celebrity, Holland America, Norwegian, Princess, and Royal Caribbean cruise lines.
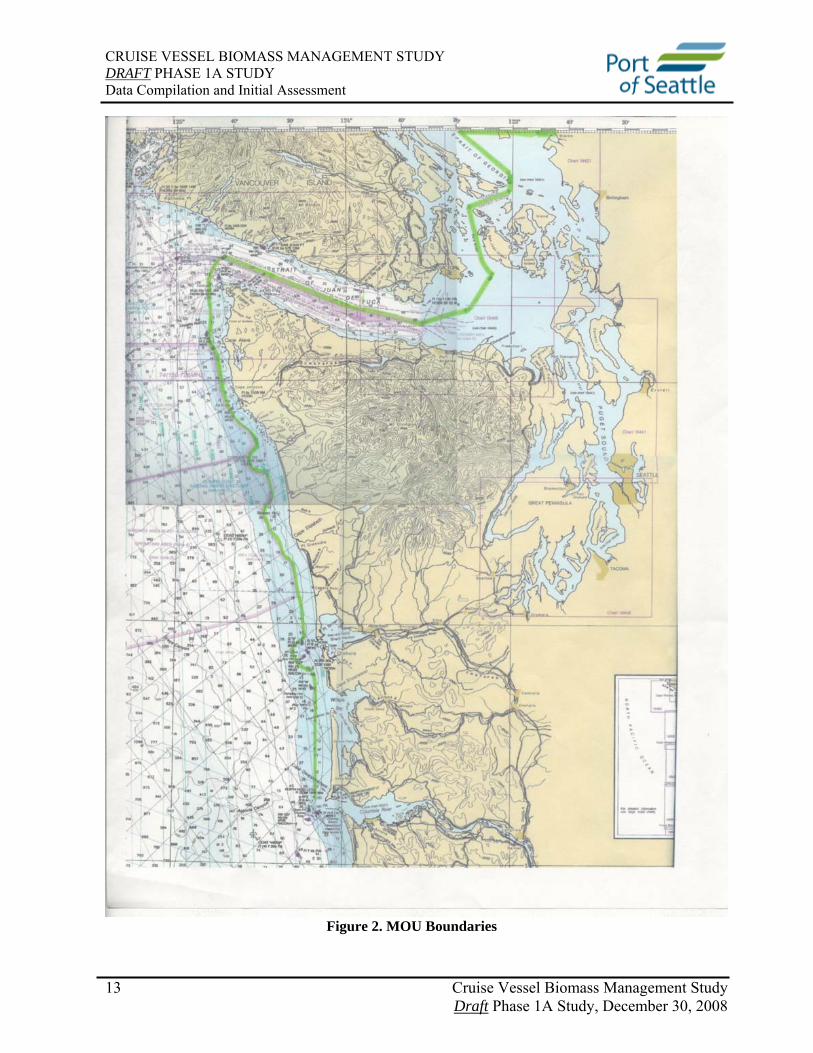
Memorandum of Understanding between NWCA and State of Washington In April 2004, the NWCA, the Port of Seattle and the Washington State Department of Ecology entered into a Memorandum of Understanding (MOU) to formally acknowledge and implement common environmental goals, policies and practices around management of solid waste, hazardous waste and wastewater within the boundaries of the MOU. The current boundaries of the MOU include Puget Sound, the Strait of Juan de Fuca south of the international boundary with Canada, and three miles from shore on the west side of the state (see Figure 2). The original MOU has amended each year since 2004. The most recent amendment (No. 4) was signed May 19, 2008 (http://www.ecy.wa.gov/programs/wq/wastewater/cruise_mou/FINALamendment4MOU051908.pdf).
The MOU provides the following important definitions for the purposes of this report:
“blackwater” means waste from toilets, urinals, medical sinks and other similar facilities.
“graywater” includes drainage from dishwasher, shower, laundry, bath, galley drains and washbasin drains.
“residual solids” include grit or screenings, ash generated during the incineration of sewage sludge and sewage sludge, which is solid, semi-solid, or liquid residual generated during the treatment of domestic sewage in the treatment works. Sewage sludge includes, but is not limited to, domestic septage; scum or solids removed in primary, secondary or advanced wastewater treatment processes; and a material derived from sewage sludge.
For “blackwater” and “graywater”, all conditions of the MOU apply within “waters subject to this MOU” which include all Puget Sound water areas up to the Canadian border and coastal waters up to 3 miles off the shoreline coast of Washington. For “residual solids”, the MOU boundaries are extended to 12 nautical miles from shoreline coast and the entire Olympic Coast National Marine Sanctuary.
CRUISE VESSEL BIOMASS MANAGEMENT STUDY DRAFT PHASE 1A STUDY Data Compilation and Initial Assessment
11 Cruise Vessel Biomass Management Study Draft Phase 1A Study, December 30, 2008
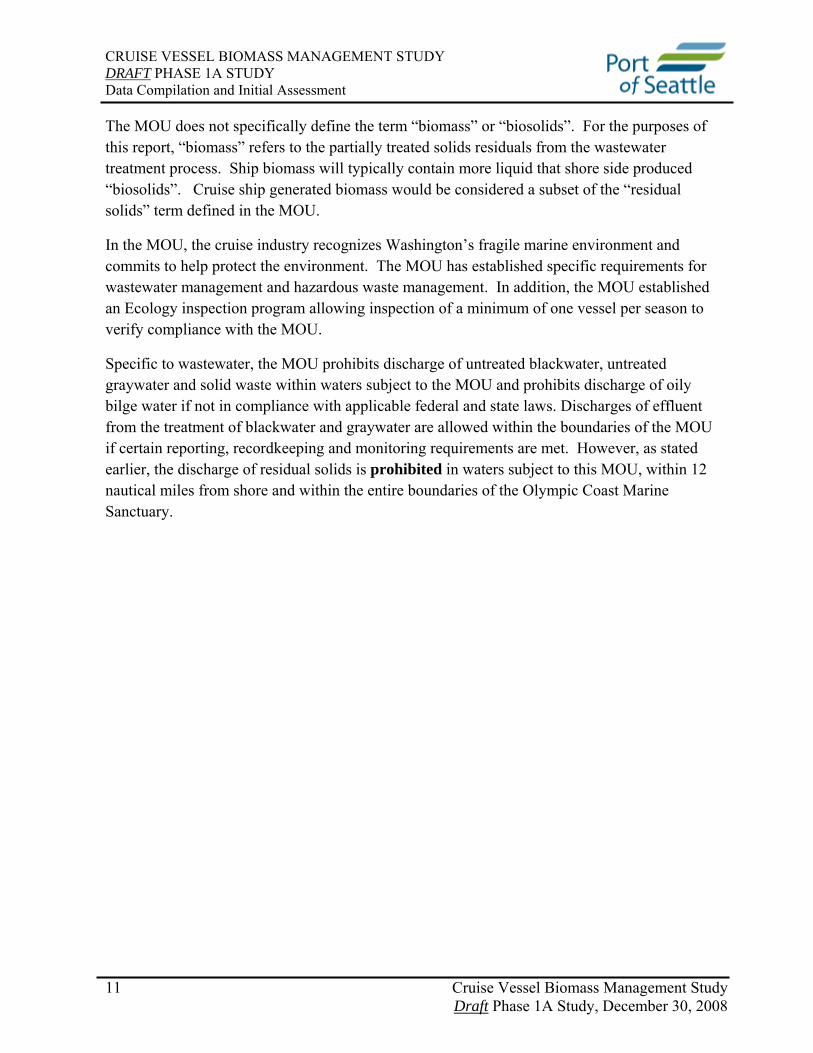
The MOU does not specifically define the term “biomass” or “biosolids”. For the purposes of this report, “biomass” refers to the partially treated solids residuals from the wastewater treatment process. Ship biomass will typically contain more liquid that shore side produced “biosolids”. Cruise ship generated biomass would be considered a subset of the “residual solids” term defined in the MOU.
In the MOU, the cruise industry recognizes Washington’s fragile marine environment and commits to help protect the environment. The MOU has established specific requirements for wastewater management and hazardous waste management. In addition, the MOU established an Ecology inspection program allowing inspection of a minimum of one vessel per season to verify compliance with the MOU.
Specific to wastewater, the MOU prohibits discharge of untreated blackwater, untreated graywater and solid waste within waters subject to the MOU and prohibits discharge of oily bilge water if not in compliance with applicable federal and state laws. Discharges of effluent from the treatment of blackwater and graywater are allowed within the boundaries of the MOU if certain reporting, recordkeeping and monitoring requirements are met. However, as stated earlier, the discharge of residual solids is prohibited in waters subject to this MOU, within 12 nautical miles from shore and within the entire boundaries of the Olympic Coast Marine Sanctuary.
CRUISE VESSEL BIOMASS MANAGEMENT STUDY DRAFT PHASE 1A STUDY Data Compilation and Initial Assessment
12 Cruise Vessel Biomass Management Study Draft Phase 1A Study, December 30, 2008
Table 1. Seattle/Alaska Homeport Industry
CRUISE VESSEL BIOMASS MANAGEMENT STUDY DRAFT PHASE 1A STUDY Data Compilation and Initial Assessment
13 Cruise Vessel Biomass Management Study Draft
Figure 2. MOU Boundaries
Phase 1A Study, December 30, 2008
CRUISE VESSEL BIOMASS MANAGEMENT STUDY DRAFT PHASE 1A STUDY Data Compilation and Initial Assessment
14 Cruise Vessel Biomass Management Study Draft Phase 1A Study, December 30, 2008
Alaska Discharge Standards
Cruise ships that travel in Alaska waters are subject to rigorous state and federal regulations regarding discharge of wastewater. Specific to federal rules, “Title XIV—Certain Alaskan Cruise Ship Operations” applies to large commercial passenger vessels only, which are defined as those vessels having more than 500 passengers. Effluent standards are set for blackwater only and allows continuous discharge if secondary treatment standards are met and compliance is demonstrated through semi-monthly sampling. Federal law closed former “donut holes”.
“Donut holes” were areas greater than three nautical miles from shore but within Alexander Archipelago that provided an unregulated location for ships to discharge raw sewage. The US Coast Guard enforces the federal law. EPA is authorized to create additional standards at its discretion. EPA has begun the process of evaluating current cruise ship wastewater discharge requirements in Alaska.
Beginning in 2008, vessels carrying 250 or more passengers were required to obtain a permit to discharge in Alaskan waters (Alaska DEC, 2008). The new permit includes increased reporting to DEC and more stringent effluent limitations for several water quality parameters, especially copper.
All large vessels under the federal program (500+ passengers) pay a third party sampler and laboratory to take at least two samples of effluent per season. The U.S. Coast Guard requires large cruise ships that have been certified for continuous discharge to sample twice per month. Small vessels can use their crew members only after they prove to the DEC that their crew members have appropriate background and training to perform wastewater sampling.
DEC approves the protocol and procedures used by the industry samplers and the laboratory and also conduct audits of the third party sampler or crew member. In addition, the DEC (or its contractor) takes its own wastewater samples in Southeast and Southcentral Alaska.
Due to the overlap of the state and federal law, large cruise ships have one of three options for their wastewater discharge:
1. Vessels may hold their wastewater and only discharge it once they are outside of Alaska waters (roughly 3 nautical miles from shore but excluding former “donut holes”). The wastewater from these vessels is excluded from the State-required sampling regime and effluent standards.
2. Vessels may discharge their wastewater only when the vessel is at least 1 nautical mile from shore and traveling at least 6 knots. The gray and blackwater must meet the strict effluent limits.

CRUISE VESSEL BIOMASS MANAGEMENT STUDY DRAFT PHASE 1A STUDY Data Compilation and Initial Assessment
15 Cruise Vessel Biomass Management Study Draft Phase 1A Study, December 30, 2008
3. Vessels may operate advanced wastewater treatment systems that meet the stringent requirements that enable them to be certified by the U.S. Coast Guard for continuous discharge.
Most large cruise ships operate under option 1 or 3. Vessels typically only operate under condition 2 while they are seeking certification from the U.S. Coast Guard for continuous discharge (option 3).
For a list of large cruise ships that have been allowed to continuously discharge as well as those that hold wastewater, see http://www.dec.state.ak.us/water/cruise_ships/index.htm.
Description of Current Cruise Vessel Wastewater and Biomass Operations
There are primarily two types of wastewater treatment systems on board cruise ships: Advanced Wastewater Treatment Systems (AWTSs) and Type II Marine Sanitation Devices (MSDs). Only one of the cruise vessels homeporting in Seattle in 2009 had MSD, however, both systems are described below to provide a brief synopsis of the major operational features of each treatment system.
Advanced Wastewater Treatment Systems AWTS’s are treatment systems that treat sewage and usually graywater in a combined system. EPA’s Draft Cruise Ship Discharge Analysis states, “These systems generally provide improved screening, biological treatment, solids separation (using filtration or flotation), disinfection (using ultraviolet light), and sludge processing as compared to traditional Type II MSDs.” According to EPA, 23 of 28 large cruise ships traveling in Alaskan waters were equipped with AWTS’s as of 2006 (EPA, 2007). While these systems produce relatively clean effluent, they produce large amounts of biomass that must be dealt with. A 2007 study conducted by King County estimated that cruise ships generate 35 tons (including water content) of biomass each day. This number is consistent with the 15-40 metric tons of biomass per day that was reported by respondents to the questionnaire issued for this study.
There are several types AWTS’s produced by different companies that vary slightly in their operational characteristics. These include Hamworthy’s Membrane Bioreactor system, ROCHEM’s ROCHEM LPRO and Bio-Filt® systems, Zenon’s ZeeWeed® MBR system, the Scanship Treatment System, and the Hydroxyl CleanSea® system. Table 2 shows the different systems utilized on cruise ships that have called at Port of Seattle terminals since 2004 based on an inspection report prepared by the Department of Ecology.
Modern AWTS’s for cruise ships have several stages. First the black and grey water is combined; next there is a screening process that removes large solids and non-biodegradable material. The water then enters a biological reactor where it is broken down by bacteria. Following the bioreactor it is necessary to clarify (remove solids) the water. The two main

CRUISE VESSEL BIOMASS MANAGEMENT STUDY DRAFT PHASE 1A STUDY Data Compilation and Initial Assessment
16 Cruise Vessel Biomass Management Study Draft Phase 1A Study, December 30, 2008
methods applied on cruise ships are ultrafiltration (UF) and dissolved air floatation (DAF). Ultrafiltration involves pumping water through a semi permeable membrane under high pressure. The solids are left on one side and the clarified water passes through the membrane. The DAF method involves dissolving air into the wastewater under pressure then allowing the air to come out of solution at a lower or ambient pressure. When the air comes out of solution it forms tiny bubbles that adhere to the suspended solids and carry them to the surface where they can be skimmed. The last step of treating the clarified water is to sterilize it, typically with ultraviolet light before discharging it overboard.

CRUISE VESSEL BIOMASS MANAGEMENT STUDY DRAFT PHASE 1A STUDY Data Compilation and Initial Assessment
17 Cruise Vessel Biomass Management Study Draft
Table 2. Summary of Washington State Department of Ecology Information Regarding NWCA Cruise Ships, Wastewater Treatment and Biomass Management
Phase 1A Study, December 30, 2008
CRUISE VESSEL BIOMASS MANAGEMENT STUDY DRAFT PHASE 1A STUDY Data Compilation and Initial Assessment
18 Cruise Vessel Biomass Management Study Draft
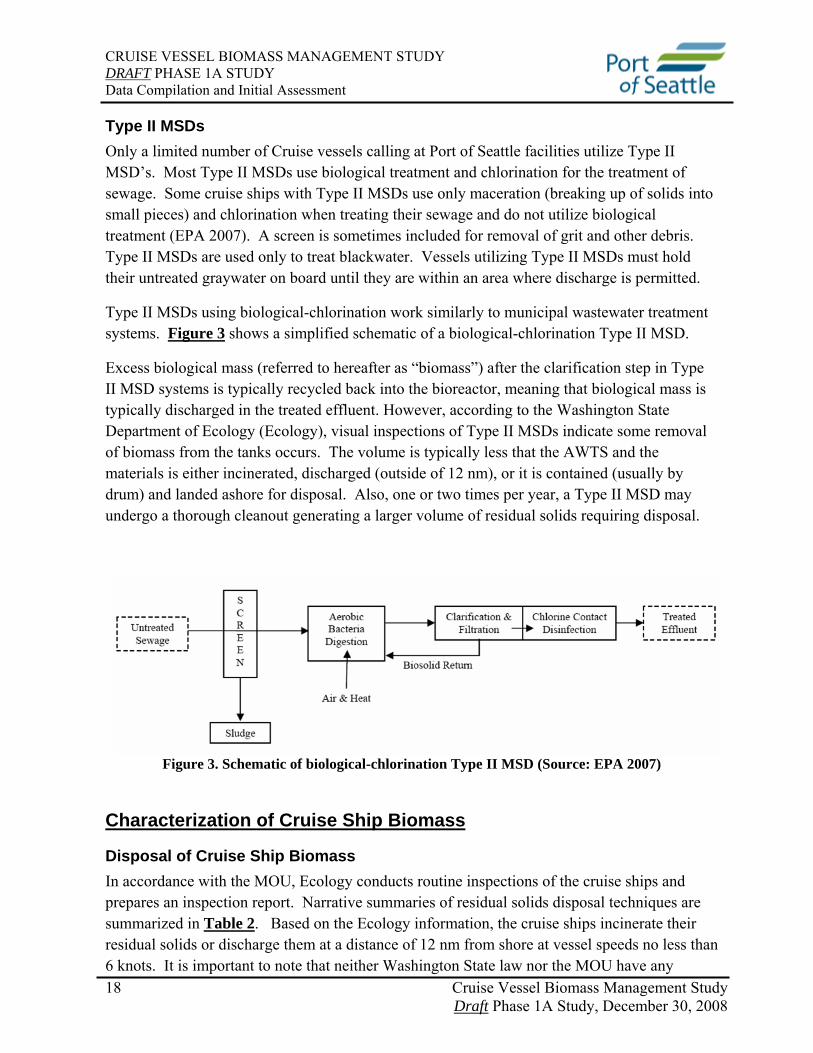
Type II MSDs Only a limited number of Cruise vessels calling at Port of Seattle facilities utilize Type II MSD’s. Most Type II MSDs use biological treatment and chlorination for the treatment of sewage. Some cruise ships with Type II MSDs use only maceration (breaking up of solids into small pieces) and chlorination when treating their sewage and do not utilize biological treatment (EPA 2007). A screen is sometimes included for removal of grit and other debris. Type II MSDs are used only to treat blackwater. Vessels utilizing Type II MSDs must hold their untreated graywater on board until they are within an area where discharge is permitted.
Type II MSDs using biological-chlorination work similarly to municipal wastewater treatment systems. Figure 3 shows a simplified schematic of a biological-chlorination Type II MSD.
Excess biological mass (referred to hereafter as “biomass”) after the clarification step in Type II MSD systems is typically recycled back into the bioreactor, meaning that biological mass is typically discharged in the treated effluent. However, according to the Washington State Department of Ecology (Ecology), visual inspections of Type II MSDs indicate some removal of biomass from the tanks occurs. The volume is typically less that the AWTS and the materials is either incinerated, discharged (outside of 12 nm), or it is contained (usually by drum) and landed ashore for disposal. Also, one or two times per year, a Type II MSD may undergo a thorough cleanout generating a larger volume of residual solids requiring disposal.
Figure 3. Schematic of biological-chlorination Type II MSD (Source: EPA 2007)
Characterization of Cruise Ship Biomass
Disposal of Cruise Ship Biomass In accordance with the MOU, Ecology conducts routine inspections of the cruise ships and prepares an inspection report. Narrative summaries of residual solids disposal techniques are summarized in Table 2. Based on the Ecology information, the cruise ships incinerate their residual solids or discharge them at a distance of 12 nm from shore at vessel speeds no less than 6 knots. It is important to note that neither Washington State law nor the MOU have any
Phase 1A Study, December 30, 2008

CRUISE VESSEL BIOMASS MANAGEMENT STUDY DRAFT PHASE 1A STUDY Data Compilation and Initial Assessment
19 Cruise Vessel Biomass Management Study Draft Phase 1A Study, December 30, 2008
jurisdiction over the current biomass management practice, which is fully compliant with all applicable laws and regulations.
Chemical Properties of Biomass Generated Data on the physical and chemical characteristics of biomass from four cruise ships were collated from EPA reports from 2006 (EPA 2006a-d) and raw data files obtained directly from the EPA authors of the reports. A summary of the biomass data from these reports are presented in Table 3. These were compared to the biomass data contained in the 2008 report of two King County, Washington, treatment facilities (see Table 4) (King County 2008).
Data from the King County Wastewater Treatment Division represents data from both the West Point Treatment Plant (WPTP) and the South Treatment Plant (STP) at Renton. Both plants receive wastewater from numerous cities and industries in King County. The plants provide secondary wastewater treatment with anaerobic digestion of all solids followed by a dewatering process. The materials sampled are the treated biosolids prior to being beneficially recycled in forestry agriculture, soil reclamation and compost (King County 2008).
Note, due to the unavailability of percent solids data for the Norwegian Star, the data from that ship has not been used in the determination of average concentrations. In all cases, the percent solids information was used to determine a mg/kg concentration so that the variation in the solids content of the biomass could be normalized. This is an important factor as organic constituents as well as most metals tend to absorb to solids particulate and this methodology also results in a conservative assumption regarding constituent concentrations in the biomass materials. Data is also presented in mg/l for full comparison of the sample data.

CRUISE VESSEL BIOMASS MANAGEMENT STUDY DRAFT PHASE 1A STUDY Data Compilation and Initial Assessment
20 Cruise Vessel Biomass Management Study Draft
Table 3. Cruise Ship Chemical Data Summary
Phase 1A Study, December 30, 2008

CRUISE VESSEL BIOMASS MANAGEMENT STUDY DRAFT PHASE 1A STUDY Data Compilation and Initial Assessment
21 Cruise Vessel Biomass Management Study Draft
Phase 1A Study, December 30, 2008

CRUISE VESSEL BIOMASS MANAGEMENT STUDY DRAFT PHASE 1A STUDY Data Compilation and Initial Assessment
22 Cruise Vessel Biomass Management Study Draft
Table 4. Summary of Cruise Ship and King County Biomass Concentrations
Phase 1A Study, December 30, 2008

CRUISE VESSEL BIOMASS MANAGEMENT STUDY DRAFT PHASE 1A STUDY Data Compilation and Initial Assessment
23 Cruise Vessel Biomass Management Study Draft
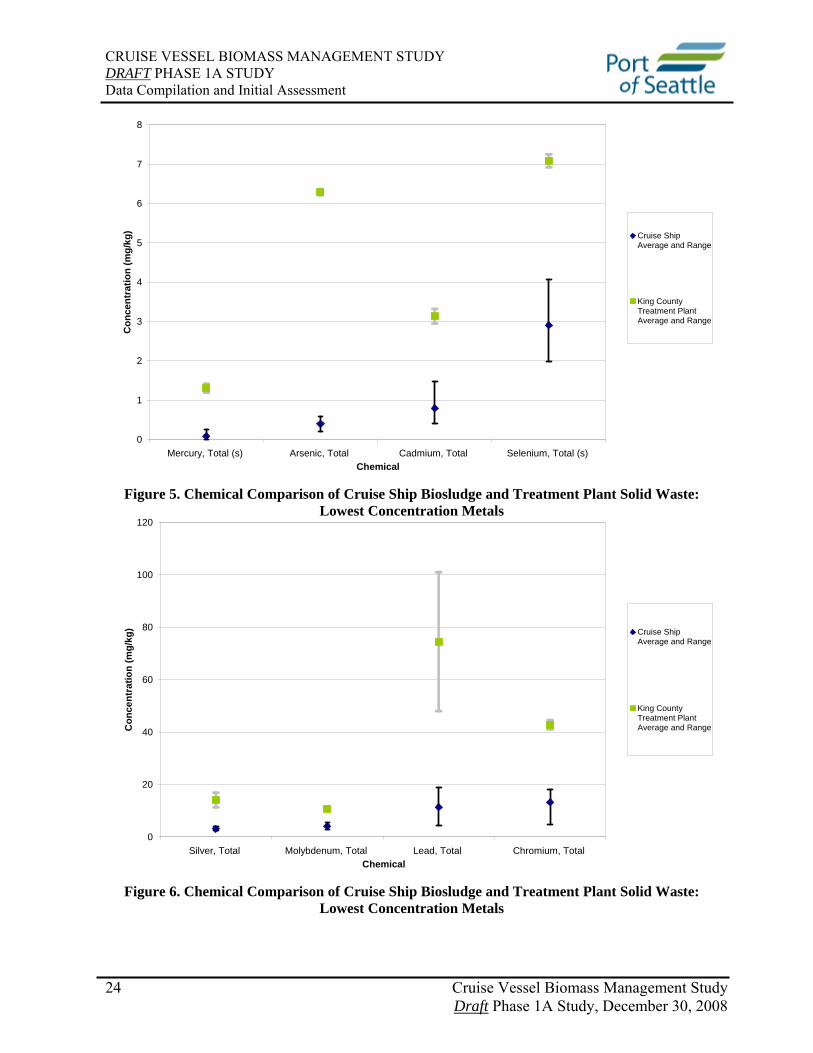
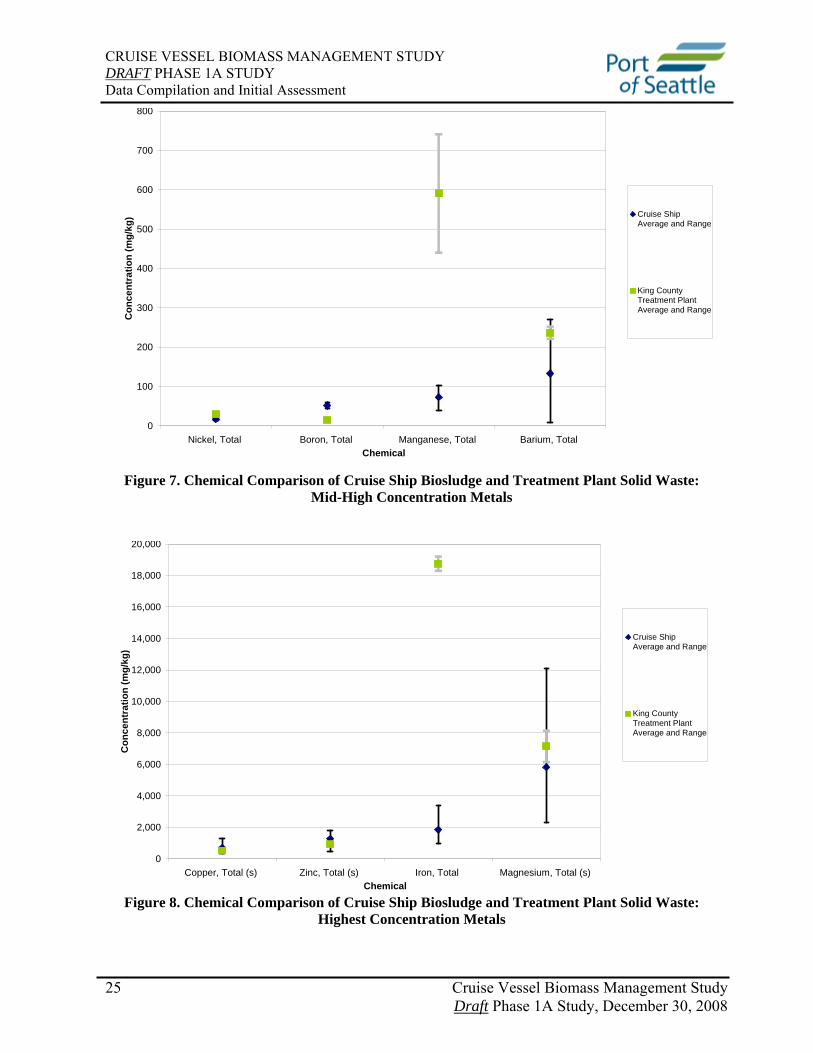
As shown by Table 4 and Figures 4 through 8, concentrations of nearly all parameters in the cruise ship biomass are well below King County biomass concentrations for metals. Only the four organic constituents were detected in the cruise ship biomass, with phenol slightly exceeding the King County biomass concentration. While there is no ambient water quality criteria for phenols, in both cases the concentrations are below water quality criteria for the consumption of organisms established under EPA’s water quality criteria.
0.0001
0.0010
0.0100
0.1000
1.0000
10.0000
100.0000
1,000.0000
10,000.0000
100,000.0000
Mercury
, Tota
l (s)
Arsenic
, Tota
l
Cadmium
, Tota
l
Seleniu
m, Tota
l (s)
Silver,
Total
Molybd
enum
, Tota
l
Lead
, Tota
l
Chromium
, Tota
l
Nickel,
Total
Boron,
Total
Manga
nese
, Tota
l
Barium
, Tota
l
Coppe
r, Tota
l (s)
Zinc, T
otal (s
)
Iron,
Total
Magne
sium, T
otal (s
)
Chemical
Con
cent
ratio
n (m
g/kg
)
Cruise ShipAverageand Range
King CountyTreatmentPlantAverageand Range
Figure 4. Chemical Comparison of Cruise Ship Biosludge and Treatment Plant Solid Waste: All
Selected Metals
Phase 1A Study, December 30, 2008
CRUISE VESSEL BIOMASS MANAGEMENT STUDY DRAFT PHASE 1A STUDY Data Compilation and Initial Assessment
24 Cruise Vessel Biomass Management Study Draft
0
1
2
3
4
5
6
7
8
Mercury, Total (s) Arsenic, Total Cadmium, Total Selenium, Total (s) Chemical
Con
cent
ratio
n (m
g/kg
) Cruise ShipAverage and Range
King CountyTreatment PlantAverage and Range
Figure 5. Chemical Comparison of Cruise Ship Biosludge and Treatment Plant Solid Waste: Lowest Concentration Metals
0
20
40
60
80
100
120
Silver, Total Molybdenum, Total Lead, Total Chromium, Total Chemical
Con
cent
ratio
n (m
g/kg
) Cruise ShipAverage and Range
King CountyTreatment PlantAverage and Range
Figure 6. Chemical Comparison of Cruise Ship Biosludge and Treatment Plant Solid Waste:
Lowest Concentration Metals
Phase 1A Study, December 30, 2008
CRUISE VESSEL BIOMASS MANAGEMENT STUDY DRAFT PHASE 1A STUDY Data Compilation and Initial Assessment
25 Cruise Vessel Biomass Management Study Draft
800
0
100
200
300
400
500
600
700
Cruise ShipAverage and Range
Nickel, Total Boron, Total Manganese, Total Barium, Total Chemical
Con
cent
ratio
n (m
g/kg
)
King CountyTreatment PlantAverage and Range
Figure 7. Chemical Comparison of Cruise Ship Biosludge and Treatment Plant Solid Waste: Mid-High Concentration Metals
0
2,000
4,000
6,000
8,000
10,000
12,000
14,000
16,000
18,000
20,000
Copper, Total (s) Zinc, Total (s) Iron, Total Magnesium, Total (s) Chemical
Con
cent
ratio
n (m
g/kg
)
Cruise ShipAverage and Range
King CountyTreatment PlantAverage and Range
Figure 8. Chemical Comparison of Cruise Ship Biosludge and Treatment Plant Solid Waste: Highest Concentration Metals
Phase 1A Study, December 30, 2008

CRUISE VESSEL BIOMASS MANAGEMENT STUDY DRAFT PHASE 1A STUDY Data Compilation and Initial Assessment
26 Cruise Vessel Biomass Management Study Draft Phase 1A Study, December 30, 2008
Wastewater Management in Scandinavia
Much like the Alaskan cruise industry, growth of the Scandinavian cruise industry has greatly increased over the past decade. The Baltic Sea has been experiencing eutrophication resulting from high nutrient loading, primarily nitrogen and phosphorus. The most visible sign of this environmental problem has been the massive blue green algae blooms visible along the shorelines of the Baltic Sea. Municipal treatment systems in at least parts of Baltic Area include treatment to remove these nutrients, while treatment plants in King County do not.
Note that Cruise vessels sailing from Port of Seattle facilities currently discharge biomass in North Pacific waters (no discharge of biomass occurs within the Puget Sound) at distances greater than 12 nautical miles from shore at vessel speeds in excess of 6 knots. Further it is noted that the population, physical and environmental characteristics of the Northern Pacific waters differ from those of the Baltic Sea.
The Baltic Sea can be characterized as a relatively shallow, enclosed body of water with minimal tidal exchange surrounded by dense population. A report on the estimated nutrient load originating from ship’s wastewater into the Baltic Sea found that approximately 0.05% of the total nitrogen and 0.5% of the total phosphorus load could be attributable to ship’s wastewater (Hanna-Kaisa Huhta et al, 2007). Note, this study addresses wastewater from all ships and assumed no wastewater treatment. The rise in maritime traffic in the Baltic is primarily attributable to tankers and cargo ships. Albeit small, discharges of phosphorus and nitrogen from ship wastewater are readily controlled when compared to atmospheric depositions or nutrient inputs from land-based sources. Due to the “no special fee” system in this area, the Baltic Sea ports have invested in numerous waste reception facilities (see Figure 9 and Table 5). The “no special fee” system was developed to encourage ships to deliver waste ashore and to avoid undesirable waste streams between ports, thereby encouraging a sound sharing of waste burden. However, only some of the shipping companies utilize these facilities. Those ships that utilize shore-side wastewater hook-ups have placed the ships wastewater treatment systems on “stand-by”. Thus, a separate biomass waste stream would not be generated and all wastewaters would be landed ashore.
Additional information on management of wastewater was collected as part of this study via e-mail correspondence with the Copenhagen Malmö Ports in Denmark, The Port of Oslo in Norway and the Port of Helsinki, Finland and Port of Stockholm, Sweden as described below. In all instances, no distinction was made in the management of wastewater versus the management of biomass. As stated earlier, ships that plan to discharge wastewater on-shore typically do not operate their wastewater treatment systems and thus no biomass is produced.
An additional information request regarding total off-load time, logistical shore-side considerations (i.e., number of tanker trucks on the dock, etc.), and odor mitigation and system
CRUISE VESSEL BIOMASS MANAGEMENT STUDY DRAFT PHASE 1A STUDY Data Compilation and Initial Assessment
27 Cruise Vessel Biomass Management Study Draft Phase 1A Study, December 30, 2008
reliability have been requested. Only limited information from the Port of Stockholm has been received at the time of this publication and is provided below.
Copenhagen Malmö Ports, Denmark Copenhagen Malmö Ports in Denmark utilize tanker trucks to collect wastewater from cruise ships. After collection, the wastewater is pumped via pump station and sewer system to the local municipal wastewater treatment facility (e-mail correspondence with Leif Kurdahl of Copenhagen Malmö Ports). Ships can transfer waste to the tankers with no special fee if they meet the following conditions:
1. The ship can deliver the sewage at the shipside at a pump capacity of 50 m3 per hour. 2. Tankers can obtain unhindered access to and from the place of collection without delay 3. The ship is fitted with a standard flange
Copenhagen Malmö Ports charge a fee for disproportionately large amounts of waste (i.e. more than 130 liters per person per day since the last port of call).
Port of Oslo, Norway In Norway, the general rule is to discharge wastewater no less than 300 meters away from shore (Correspondence with Lisbeth Petterson, Port of Oslo). However, there are several protected areas in Norwegian waters that have more restrictive dumping rules (usually 12 nautical miles from shore). Despite the overall less restrictive dumping rules, the Port of Oslo does offer means of onshore disposal of cruise ship wastewater. The wastewater is collected via tanker truck and then delivered to a local municipal treatment facility, but the exact method by which the waste is collected is unclear. The Port of Oslo finances this service by charging all vessels a waste fee, regardless of whether or not waste is disposed of onshore. This waste fee also covers collection and disposal of garbage, recyclables, varnish waste, and bilge water (as long as the amount of waste generated is considered reasonable given a ship’s size and time at sea).

CRUISE VESSEL BIOMASS MANAGEMENT STUDY DRAFT PHASE 1A STUDY Data Compilation and Initial Assessment
28 Cruise Vessel Biomass Management Study Draft
Figure 9. Baltic Sea Wastewater Reception Facility Locations
Port of Helsinki, Finland The Port of Helsinki, Finland also has facilities for cruise ships to pump their wastewater to municipal treatment systems (e-mail correspondence with Vuorivirta Kaarina of Port of Helsinki). The Port of Helsinki recently extended its program for cruise ships wastewater management in June 2008 (Voss, 2008). In order to make on-shore discharge possible, the Port of Helsinki built sewers and receiving bays at all cruise terminals and ferry docks that connect to the city’s sewer system and have a receiving capacity of approximately 100m³/hr through port-provided wastewater hoses.
Phase 1A Study, December 30, 2008
CRUISE VESSEL BIOMASS MANAGEMENT STUDY DRAFT PHASE 1A STUDY Data Compilation and Initial Assessment
29 Cruise Vessel Biomass Management Study Draft Phase 1A Study, December 30, 2008
Prior to 2008 the City of Helsinki enacted a separate charge for wastewater discharged into the city sewer system. However, the Port recently formed a five-year agreement with Helsinki Water (Helsingin Vesi) to pay only a fixed fee regardless of the amount of water discharged, enabling them to lower their prices and encourage cruise companies to use the system. The long-term plan is to charge a standard fee for cruise vessels to discharge wastewater on shore, and then at the end of the season to reward the ship or company with the biggest increase in wastewater pumped into the system with a discount on their discharge fees (Voss, 2008).
Port of Stockholm, Sweden Like all ports in the Baltic Sea, the Port of Stockholm, Sweden is regulated by maritime EU rules and regulations that include a general port fee. The port has chosen to include the waste disposal service in the general port fee to encourage proper handling of wastewater (e-mail correspondence with Melissa Feldtmann). It should be noted that ships in the Baltic do maintain the right to discharge their wastewater and biomass in international waters (>12 nm from shore). The Port of Stockholm does not use trucks to offload the ships but has a sewage system in place with a number of connections points which transfer the wastewater to munciple treatment facilities. Tank trucks are used very rarely in this port.
While the Port of Stockholm reports a high level of reliability with their wastewater reception facilities, they have had continuous problems with hydrogenated sulphur compounds in the wastewater forming into sulphuric acid. This mist above the water surface at the port eats away and corrodes the upper parts of the sewage pipes requiring a lot of maintenance. The port is working with the ships to find solutions to minimize the production of hydrogenated sulphur in the wastewater tanks in the ships. The port also must maintain a lot of different fittings to be able to connect to the ships as there are not a standard fitting requirement at this time. The Port of Stockholm has also had odor complaints around wastewater off-loading operations. The specific frequency of odor complaints was not reported.

CRUISE VESSEL BIOMASS MANAGEMENT STUDY DRAFT PHASE 1A STUDY Data Compilation and Initial Assessment
30 Cruise Vessel Biomass Management Study Draft Phase 1A Study, December 30, 2008
Table 5. Wastewater Reception Facilities at Ports in the Baltic Sea
Finland Reception facility Hanko ROPAX ships pump sewage straight into the sewer network. Ro-Ro ships can pump
sewage to a tank truck Helsinki Eteläsatama: 17 waste water reception points. Länsisatama: 9 waste water reception
points. Sörnäisten satama: 1 waste water reception point. Other harbour parts: totally 24 waste
water reception points. The waste water reception points are for passenger ships. The port of Helsinki arranges waste water reception for cargo ships using the tank truck if needed.
Inkoo Shipping Ships can pump sewage to a tank truck.
Kaskinen Ships can pump sewage to a tank truck. Naantali Ships can pump sewage to a tank truck; there are waste stations for solid waste. Oulu Ships can pump sewage to a tank truck. Pori Ships can pump sewage to a tank truck; Ekokem Oy Ab collects oily waste. Rauma Ships can pump sewage to a tank truck. Sköldvik Ships can pump sewage toa tank truck. Turku Silja and Viking Line ships pump the sewage straight into the sewer network. Other
domestic traffic has a possibility to use a tank truck by Hans Langh Oy. Uusikaupunki There are waste wells near the pier where ships can pump sewage. Ships can also pump
sewage to a tank truck. Vaasa In the passenger port there is a reception pipeline at ro-ro piers1&2. Ships can also
pump sewage to a tank truck. Denmark
Copenhagen Sewage is pumped to the tank trucks and is then discharged into the municipal waste water plant (biological and chemical waste water treatment).
Frederikshavn Black water is pumped to the tank trucks and grey water is discharged into the Frederikshavn's sewer network.
Rönne Black water and grey water are pumped to the tank trucks. Part of the grey water is discharged into the sewer network.
Århus Private company collects sewage from ships. Germany
Sassnitz No reception facilities for waste water. Sewage is pumped to the tank truck from a local waste disposal company.
Latvia
Ventspils Sewage is transported to JSC Ventbunkers for treatment. Riga Sewage is transported to Riga Municipal Waste Water Treatment Plant. Poland
Gdansk Sewage is discharged into the sewer network from the tank trucks (WUKO) and after that there are several treatment plants: mechanical-biological sewage treatment plant in Port Północny, sewage treatment plant KOS 2x3 in Basen Górniczy, sewage treatment plant Bioclere at Przemysłowe Berth.
Gdynia Sewage is pumped to the tank trucks. Sweden

CRUISE VESSEL BIOMASS MANAGEMENT STUDY DRAFT PHASE 1A STUDY Data Compilation and Initial Assessment
31 Cruise Vessel Biomass Management Study Draft Phase 1A Study, December 30, 2008
Halmstad Reception facilities only for oil sludge and bilge water. Helsingborg The passenger ships discharge sewage into the sewer network; other ships pump
sewage to the tank truck. Kalmar Local waste management company collects the sludge from ships. It is transported by
trucks to a terminal situated in the harbour. Landskrona Waste water is pumped into the sewer network. Oskarshamn No reception facilities. Oxelösund The type of reception facility is not described. Sölvesborg Sewage is pumped to the tank trucks. Umeå No reception facilities. Waste water reception facilities in the ports in the year 2005 based on the inquiry results (Huhta et al., 2007).

CRUISE VESSEL BIOMASS MANAGEMENT STUDY DRAFT PHASE 1A STUDY Data Compilation and Initial Assessment
Section 3
Cruise Vessel Wastewater and Biomass Operations
Alternatives to Open-Ocean Discharge of Cruise Ship Biomass
Existing Shoreside Operations
Shore Transfer of Biomass
Future Methods of Biomass Disposal

CRUISE VESSEL BIOMASS MANAGEMENT STUDY DRAFT PHASE 1A STUDY Data Compilation and Initial Assessment
33 Cruise Vessel Biomass Management Study Draft Phase 1A Study, December 30, 2008
Cruise Vessel Wastewater and Biomass Operations
Onboard Wastewater Treatment Cruise vessels calling on the Port of Seattle utilize a variety of AWTS systems. Some systems combine blackwater and graywater for treatment, and some have separate systems for treating each.
The biomass is separated from the wastewater and stored using different methods. Some systems discharge the biomass to a storage tank where it is later discharged outside the 12 nautical mile boundary. Some vessels dewater the solids and incinerate them onboard.
All five major operators calling at the Port of Seattle completed the survey. The survey provided specific information on vessel operations, systems and capacities for eleven vessels that they operate although only ten had AWTS systems onboard. There was not an opportunity to ask follow up questions to the information provided.
Alternatives to Open-Ocean Discharge of Cruise Ship Biomass
The two alternatives to open ocean discharge of biomass that are practiced within the cruise industry are incineration and shore transfer.
Incineration Before the biomass can be incinerated it must be dewatered and dried. This requires special equipment for conveying the waste, as well as heat for drying. The incineration of biomass consumes fuel for drying and incineration. Vessels incinerating biomass are also incinerating even larger volumes of solid combustible garbage. The ash from the biomass is a small percentage of the total ash volume and completely mixed with the other ash.
Half of the 12 vessels in the survey are incinerating residual solids, but only three vessels are incinerating all biomass, and one vessel is incinerating 50-75% of their biomass. The other two vessels only incinerate ‘screened solids’ (the coarse debris that is initially screened off and bagged). All three lines that incinerate biomass transfer the ash to shore for disposal.
Shore Transfer This method involves the transfer the biomass from the on board storage tanks to a shore facility for treatment. There are several methods by which shipboard waste can be conveyed to a shore based treatment facility including the following:
o Direct Discharge to Tanker Truck - This alternative would involve pumping biomass from onboard storage tanks directly to tanker trucks positioned on the pier. Vessel to tanker discharge would occur through flexible hoses.
o Direct Discharge to Barge - This alternative would include positioning a tanker barge on the off-shore side of the cruise vessel and direct discharge via flexible hose

CRUISE VESSEL BIOMASS MANAGEMENT STUDY DRAFT PHASE 1A STUDY Data Compilation and Initial Assessment
34 Cruise Vessel Biomass Management Study Draft Phase 1A Study, December 30, 2008
connections to the on-board vessel infrastructure. Following completion of discharge from the Cruise vessel to the barge, the barge would need to be moved to a separate pier where off loading of the barge to a shoreside tanker truck would occur prior to disposal of the biomass at an upland facility.
o Direct Discharge to Piping on Pier - This operation would allow discharge from the vessel via flexible hose to supplemental deck mounted pumps which would be connected to under-pier piping through access ports in the pier deck. Discharged biomass would be pumped via the under-pier piping to a remote storage facility where the biomass can be stored and ultimately delivered to tanker trucks for off site disposal.
Specific issues associated with each of these shore transfer scenarios are discussed later in this section.
Existing Shoreside Operations
Many pier side activities occur during cruise homeport operations. Pier space is used simultaneously for all of the following operations to support the efficient and timely turn-around of the vessel during the relatively short time at pier.
Placement of the vessels at each pier requires coordination between facility owner, facility operations, longshore staff, and vessel operator. This process results in a detailed vessel docking plan unique to each vessel and port facility.
In addition, the specific location where a vessel can be berthed at facilities is controlled by the vessel size, location of the pier-mounted mooring bollards, location of the shore-power connection, and the gangway access location. For vessels calling at Terminal 91, the shore-power connection controls the mooring location of the vessel as this hardware is fixed to the pier and requires the vessel be moored at a specific location in order to be connected to the shore-power services. This varies by vessel.
Pier side operations include the following activities (many of these are illustrated at existing Port of Seattle facilities in Figures 10 through 19).
• Vessel Mooring and Fendering: Cruise vessels require a number of mooring lines fixed to the pier to adequately secure the vessel in the wind conditions that occur at both Pier 66 and Terminal 91. Typically, this includes vessel moorage to as many as 10 different pier mounted mooring bollards. Generally, these lines are cast from the extreme bow and stern sections of the vessel. Pier side impacts from line handling operations are generally limited to the time preceding vessel arrival and departure where longshore crews require unrestricted access to the pier to set the lines. Due primarily to tidal fluctuations and risks to dock personnel, it is not possible to access the vessel

CRUISE VESSEL BIOMASS MANAGEMENT STUDY DRAFT PHASE 1A STUDY Data Compilation and Initial Assessment
35 Cruise Vessel Biomass Management Study Draft
within the span of the various mooring lines for the duration of the vessels time alongside the pier.
Figure 10. Vessel Mooring Lines (Terminal 30)
• Passenger Debarkation and Embarkation: As many as 3,000 passengers can arrive for debarkation on the cruise vessels serving both Pier 66 and Terminal 91. A similar amount of passengers embark onto the vessel during the approximately 7 hour unload/loading period. The gangways used to transit this many passengers must also allow for dock-side vehicular movement, adjust for vessel movement and tides, and be fully ADA compliant. The result is a gangway structure with a substantial pier footprint and commensurate operational impact.
Phase 1A Study, December 30, 2008

CRUISE VESSEL BIOMASS MANAGEMENT STUDY DRAFT PHASE 1A STUDY Data Compilation and Initial Assessment
36 Cruise Vessel Biomass Management Study Draft
Figure 11. Rendering of T-91 Gangways
Courtesy PND Engineers, 2008
Phase 1A Study, December 30, 2008

CRUISE VESSEL BIOMASS MANAGEMENT STUDY DRAFT PHASE 1A STUDY Data Compilation and Initial Assessment
37 Cruise Vessel Biomass Management Study Draft
• Crew Debarkation and Embarkation: Unlike the passenger loading gangway, the crew gangway is more modest and takes up substantially less dock area. Accordingly, the crew gangways offer substantially less clearance underneath and do not accommodate pier traffic under the gangways. Crew gangway systems in Seattle typically include a gangway connection from the vessel to a platform located on the pier and then a second gangway from the platform to the dock surface. USCG regulations require that the crew gangway is in place and operational prior to commencement of any fueling or bunkering activities.
Figure 12. Crew Gangway (Pier 66)
Phase 1A Study, December 30, 2008

CRUISE VESSEL BIOMASS MANAGEMENT STUDY DRAFT PHASE 1A STUDY Data Compilation and Initial Assessment
38 Cruise Vessel Biomass Management Study Draft
Luggage Unloading and Loading: Luggage movement occurs by forklift and baggage handling carriage from the first floor of the cruise building to the vessel luggage ports. Individual luggage carriages are moved by the forklifts to a point on the pier within reach of mobile cranes and loaded onto loading cages which are lifted overside of the pier and positioned such that the luggage carriage can be removed from the cage and onto the vessel through a shell door.
Figure 13. Baggage Loading (Pier 66)
Figure 14. Baggage Loading and Crew Gangway
(Note: Crew gangway shown prior to final placement on vessel. Terminal 30 North berth not occupied at time this photo was taken.)
Phase 1A Study, December 30, 2008

CRUISE VESSEL BIOMASS MANAGEMENT STUDY DRAFT PHASE 1A STUDY Data Compilation and Initial Assessment
39 Cruise Vessel Biomass Management Study Draft
• Provisioning: All of food, beverage, spare parts and sundries necessary to serve passengers and crew (up to 4,000 people for a full week) must be loaded in similar fashion to the luggage during the vessel call. In addition, all or some of the used expendables, garbage, and recycle wastes from the prior week’s excursion are off loaded at the pier. These products are delivered and received on the pier space adjacent to the vessel by delivery trucks of varying sizes. All material is moved through the vessel access ports, via crane to deck, then by forklift onto the pier for sorting and delivery to waiting trucks for transport off site to appropriate disposal facilities.
Figure 15. Vessel Provisioning (Terminal 30) (Note: Luggage handling shown, provisioning requires a similar operational area.)
Phase 1A Study, December 30, 2008
CRUISE VESSEL BIOMASS MANAGEMENT STUDY DRAFT PHASE 1A STUDY Data Compilation and Initial Assessment
40 Cruise Vessel Biomass Management Study Draft
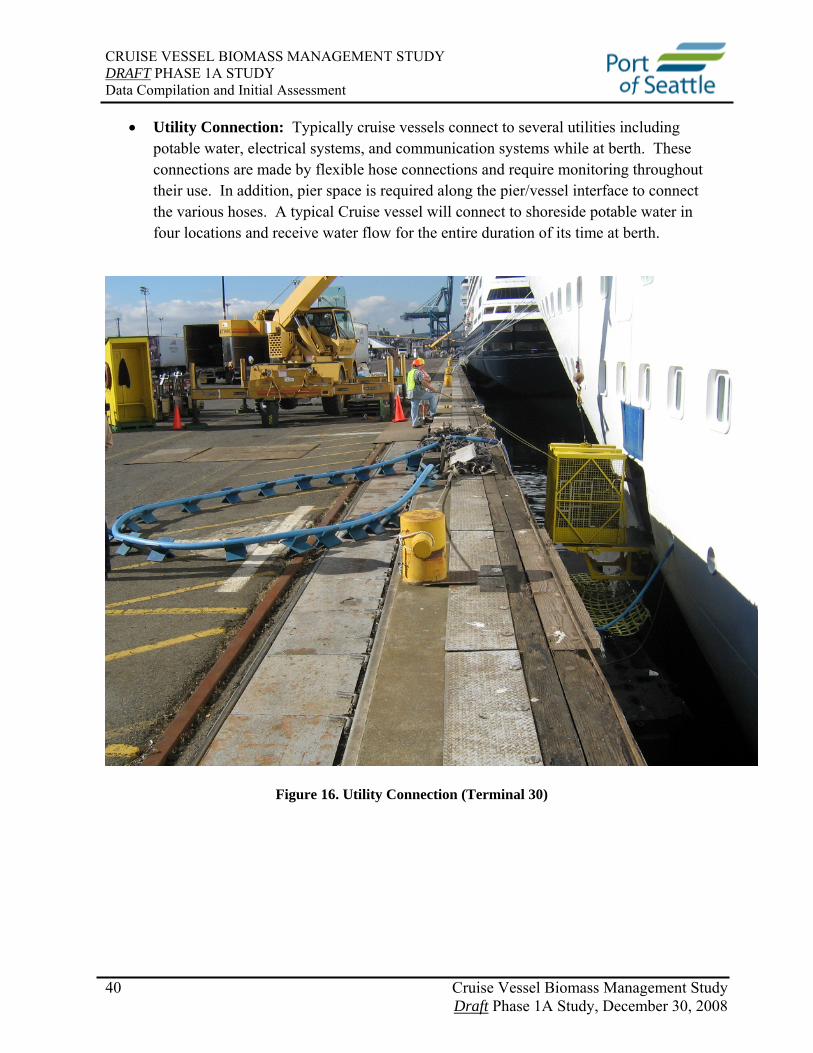
• Utility Connection: Typically cruise vessels connect to several utilities including potable water, electrical systems, and communication systems while at berth. These connections are made by flexible hose connections and require monitoring throughout their use. In addition, pier space is required along the pier/vessel interface to connect the various hoses. A typical Cruise vessel will connect to shoreside potable water in four locations and receive water flow for the entire duration of its time at berth.
Figure 16. Utility Connection (Terminal 30)
Phase 1A Study, December 30, 2008

CRUISE VESSEL BIOMASS MANAGEMENT STUDY DRAFT PHASE 1A STUDY Data Compilation and Initial Assessment
41 Cruise Vessel Biomass Management Study Draft
• Shore Power Connection: Typically, Homeporting cruise vessels calling at the Terminal 91 facility will connect to “cold ironing” shore power facilities. This infrastructure includes 4” diameter cables, pier mounted or mobile cranes, and substation infrastructure to supply the high voltage requirements of the vessel. Due to the safety and operational considerations of the high voltage systems, minimum clear distances to this operations are required which impacts the ability to utilize pier area adjacent to the shore power connection.
Figure 17. Vessel Shore Power Connection (Terminal 30)
(Note: Blue hose in foreground is ships potable water utility connection.)
Phase 1A Study, December 30, 2008
CRUISE VESSEL BIOMASS MANAGEMENT STUDY DRAFT PHASE 1A STUDY Data Compilation and Initial Assessment
42 Cruise Vessel Biomass Management Study Draft
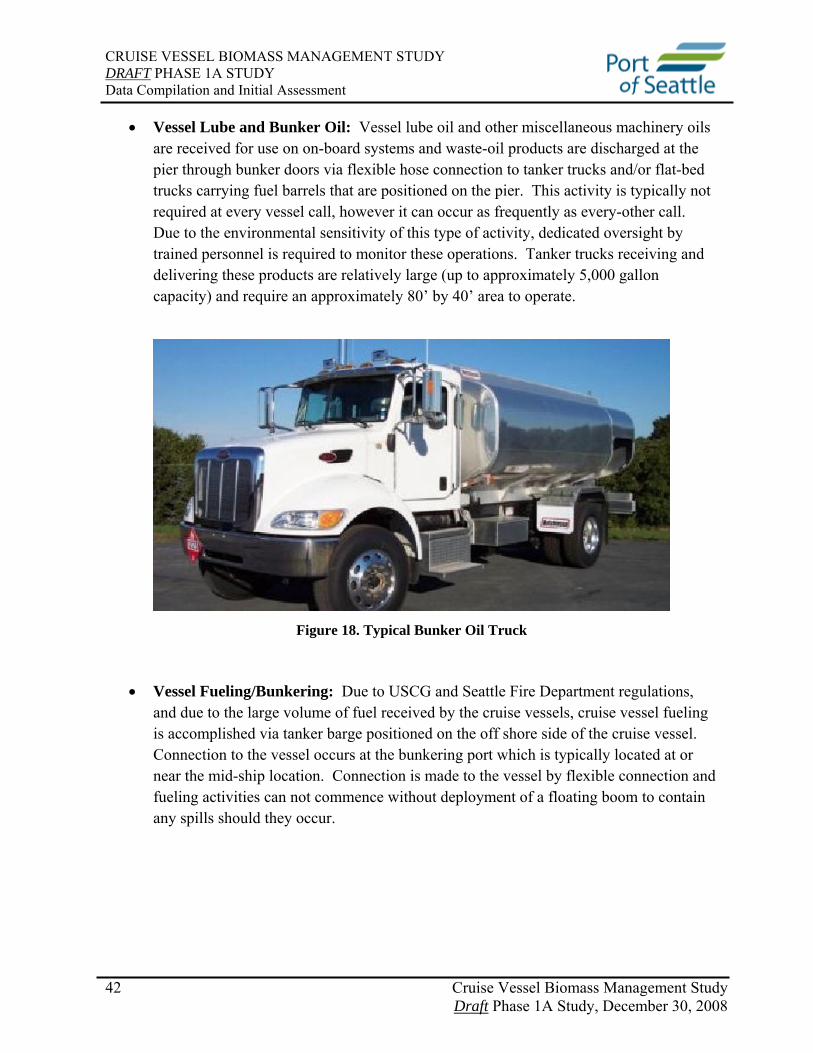
• Vessel Lube and Bunker Oil: Vessel lube oil and other miscellaneous machinery oils are received for use on on-board systems and waste-oil products are discharged at the pier through bunker doors via flexible hose connection to tanker trucks and/or flat-bed trucks carrying fuel barrels that are positioned on the pier. This activity is typically not required at every vessel call, however it can occur as frequently as every-other call. Due to the environmental sensitivity of this type of activity, dedicated oversight by trained personnel is required to monitor these operations. Tanker trucks receiving and delivering these products are relatively large (up to approximately 5,000 gallon capacity) and require an approximately 80’ by 40’ area to operate.
Figure 18. Typical Bunker Oil Truck
• Vessel Fueling/Bunkering: Due to USCG and Seattle Fire Department regulations, and due to the large volume of fuel received by the cruise vessels, cruise vessel fueling is accomplished via tanker barge positioned on the off shore side of the cruise vessel. Connection to the vessel occurs at the bunkering port which is typically located at or near the mid-ship location. Connection is made to the vessel by flexible connection and fueling activities can not commence without deployment of a floating boom to contain any spills should they occur.
Phase 1A Study, December 30, 2008
CRUISE VESSEL BIOMASS MANAGEMENT STUDY DRAFT PHASE 1A STUDY Data Compilation and Initial Assessment
43 Cruise Vessel Biomass Management Study Draft
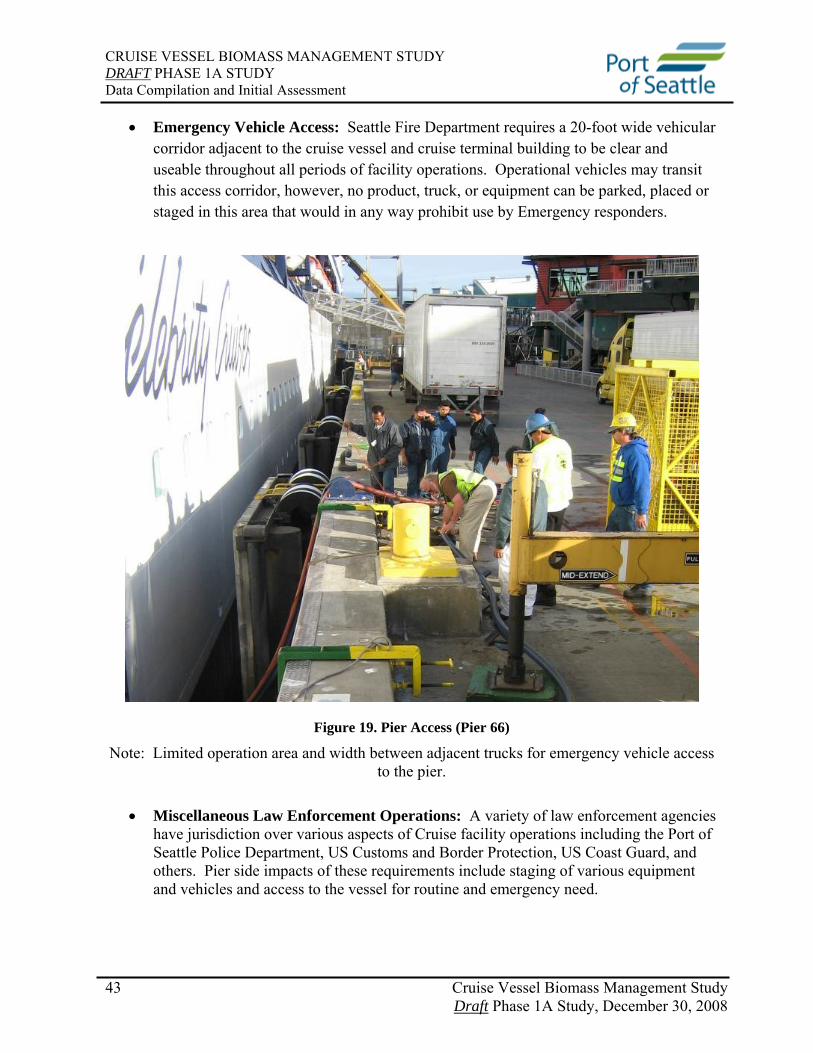
• Emergency Vehicle Access: Seattle Fire Department requires a 20-foot wide vehicular corridor adjacent to the cruise vessel and cruise terminal building to be clear and useable throughout all periods of facility operations. Operational vehicles may transit this access corridor, however, no product, truck, or equipment can be parked, placed or staged in this area that would in any way prohibit use by Emergency responders.
Figure 19. Pier Access (Pier 66)
Note: Limited operation area and width between adjacent trucks for emergency vehicle access to the pier.
• Miscellaneous Law Enforcement Operations: A variety of law enforcement agencies
have jurisdiction over various aspects of Cruise facility operations including the Port of Seattle Police Department, US Customs and Border Protection, US Coast Guard, and others. Pier side impacts of these requirements include staging of various equipment and vehicles and access to the vessel for routine and emergency need.
Phase 1A Study, December 30, 2008

CRUISE VESSEL BIOMASS MANAGEMENT STUDY DRAFT PHASE 1A STUDY Data Compilation and Initial Assessment
44 Cruise Vessel Biomass Management Study Draft Phase 1A Study, December 30, 2008
Shore Transfer of Biomass
As discussed earlier in this section transfer of the ships biomass to shore is one of the alternatives to open ocean discharge. Some of the issues associated with each scenario for shore transfer are discussed below.
All alternative discharge methods discussed below could have varying levels of impact related to the transfer of the biomass. Potential impacts will be studied as part of future phases of this study and could include:
• Impacts caused by potential spills during off-loading.
• Possible emission of sewage odor in close proximity to boarding passengers, adjacent businesses, and dock workers.
• Noise impacts from discharge pump equipment in close proximity to boarding passengers.
Shoreside infrastructure improvements could be necessary to support off-loading biomass at the pier. For each alternative, it is assumed that biomass would ultimately be discharged at off-site King County Wastewater facilities in Renton.
As a minimum the following requirements must be met for shore transfer to be practical:
1. Vessels must have the ability to store biomass on board:
The vessel will need to have adequate dedicated storage capacity to hold the biomass to be transferred to shore. The typical voyage time is one week. If the vessel does not have enough storage capacity for a full voyage, then the excess biomass must be offloaded at sea (as currently practiced by most carriers), at another port, or incinerated. It should be noted that offloading at ports other than Seattle was not investigated here and is beyond the scope of this study.
Available biomass storage capacity among the cruise ships varies. Two vessels reported they could store all biomass generated in a week. For the remaining vessels the storage capacity varied from 47% to 94% of weekly generation (3.3 to 6.6 days of storage capacity). At this time it is not known on a vessel by vessel basis if adding storage is possible. However, many of the tanks on board the vessels are flexible as to what can be stored in them but increasing storage would likely require modifications to the vessels.
2. The Biomass must be pumpable:
The waste must have a consistency that will allow it to be pumped, implying a high percentage of water. For the vessels that are incinerating, the biomass must be dewatered after it is generated. Once it is dewatered it generally cannot be pumped by
CRUISE VESSEL BIOMASS MANAGEMENT STUDY DRAFT PHASE 1A STUDY Data Compilation and Initial Assessment
45 Cruise Vessel Biomass Management Study Draft Phase 1A Study, December 30, 2008
conventional means so shore transfer must occur before dewatering. The vessels surveyed reported that, prior to dewatering, the biomass ranged from 80 - 98% liquids and is therefore pumpable.
3. The vessels must be configured to pump ashore:
The vessel needs to be properly configured for transferring the waste ashore. At the very least the vessel will need to have piping of an adequate diameter to the storage tank(s) and a properly configured and sized onboard pump. The vessel must also have piping manifold that is accessible from either the pier or a waterside access break (door) that has the adequate closures, valves, spill containment, etc. that will be required for the operation.
Of the 10 vessels with an AWTS, 9 report that they have at least some ability to transfer biomass to shore. However, more information is needed to understand specific modifications that may be required in order to support regular and consistent shore-side transfer.
4. The vessels must have engineering crew available to oversee the transfer operation:
At least one operating engineer must be available to supervise the transfer operation. Depending on how the ships systems are configured, or what type of shore transfer will be done, other crew may also be required to operate pumps, open and close valves, maintain radio contact with shore side personnel, monitor tank levels, monitor pump discharge pressures, etc.
The survey did not cover the questions of crew availability, due in part to the fact that the demands on the crew were not known before the survey. The demands on the crew cannot be well understood until a vessel by vessel evaluation of the off-load process can be done. However, it is anticipated that the biomass off-load operations will require additional service time by available crews and/or the need to hire crews specifically to perform and oversee the off-load operations.
5. The operation must be completed within the time the vessel is in port:
The duration of the operation must fit within the allotted time in port. Vessels are in port approximately 10 hours total. However, due to Customs and Border Protection regulations and various operational requirements on arrival and departure such as handling mooring lines, gangway hook up and disconnect, hook up and disconnect shoreside facilities, etc., the available time for unloading and off-loading is approximately 7 hours.
As illustrated in Figures 3-1 and 3-2, the existing pier side operations currently utilize most available deck space at both Port of Seattle’s cruise facilities at Pier 66 and Terminal 91. At Terminal 91, based on discussions with Longshore and operations staff, it is clear that even without consideration of biomass disposal operations, concerns exist about the relatively

CRUISE VESSEL BIOMASS MANAGEMENT STUDY DRAFT PHASE 1A STUDY Data Compilation and Initial Assessment
46 Cruise Vessel Biomass Management Study Draft Phase 1A Study, December 30, 2008
limited amount of pier area (which at 90’ wide is roughly half that which was available at the former Terminal 30 facility) to accomplish all the currently required operations. Pier 66 operations are further limited by the small 55’ wide apron.
The three methods of shore transfer discussed in this section would have varying levels of impact to pier side operations and space. Direct discharge to tanker trucks would have the greatest impact and Direct discharge to barge would have the least impact.

47 Cruise Vessel Biomass Management Study Draft
Phase 1A Study, December 30, 2008

CRUISE VESSEL BIOMASS MANAGEMENT STUDY DRAFT PHASE 1A STUDY
48 Cruise Vessel Biomass Management Study Draft
Data Compilation and Initial Assessment
Phase 1A Study, December 30, 2008

CRUISE VESSEL BIOMASS MANAGEMENT STUDY DRAFT PHASE 1A STUDY Data Compilation and Initial Assessment
49 Cruise Vessel Biomass Management Study Draft Phase 1A Study, December 30, 2008
Direct Discharge to Tanker Truck Discharging various types of waste from ships to tanker trucks is a common practice in the marine industry. However due to the volume of waste involved in biomass transfer, and the pier side congestion during existing turnaround operations, specific challenges arise that are discussed below. It is anticipated that this alternative for biomass transfer would have the largest impact on existing pier side operations.
Emerald Services of Seattle has been servicing the marine industry with vacuum truck services for a number of years. They are currently located on East Marginal Way where they transfer waste via pipeline directly to the South King County treatment facility. Emerald Services has a fleet of 11 ‘large’ vacuum trucks and 12 ‘small’ vacuum trucks. There are approximately 4 trucks with a 6500 gallon capacity, 7 trucks with a 5000 gallon capacity and 12 with a 3000 gallon capacity. All trucks are equipped with vacuum pumps. The large trucks are 50-60 feet long.
The total biomass loads based on all vessels surveyed varied from 15,000 gallons per week to 74,000 gallons per week. The vessels with the two largest weekly generation quantities were 74,000 gallons each. If these are considered outliers and the remaining vessels are averaged, the biomass off-load volume is approximately 35,000 gallons.
Using the information gathered from speaking with Emerald Services an analysis was done to determine how a series filling operation would work, and what the likely fill times would be to transfer a weeks worth of biomass from the surveyed vessels.
For all but three of the vessels surveyed, it is possible to unload a full weeks worth of biomass in 7 hours or less with a total of three large trucks using series loading.
The three truck series loading scenario allows for time for hooking up, loading, unhooking, paperwork processing, transit to the unloading location, unloading, transit back to the pier, and waiting in a queuing area to fill again. Using the data provided by the vendor it is estimated that one large truck can be filled continuously, every 70 minutes. One truck is on the pier at all times, and one truck is in waiting at the designated queuing area. The third truck is in transit or unloading. The advantage of this scenario is that only one truck is on the pier for the entire 70 minute loading, however a second truck would need to be staged at a queuing area and then moved into position adjacent to the first truck (prior to the first trucks departure) for the period of time required to connect hoses in order that the 70-minute cycle time be realized.
For the three remaining vessels to be off-loaded in the 7 hour timeframe, it is only possible if two trucks are loaded in parallel on the pier. The vessels cannot currently support this. This scenario doubles the total number of large trucks in the entire operation from three to six. The whole scenario requires two large trucks on the dock at all times, two trucks in the queuing area, and two trucks offloading or transiting. The loading rate is twice what would be required
CRUISE VESSEL BIOMASS MANAGEMENT STUDY DRAFT PHASE 1A STUDY Data Compilation and Initial Assessment
50 Cruise Vessel Biomass Management Study Draft Phase 1A Study, December 30, 2008
for single truck loading. According to Emerald Services the vessels and the trucks are configured with 3” quick disconnect fittings. Two large trucks loaded in one hour would mean an average loading rate of 13,000 gallons per hour or 217 gallons per minute. 217 gallons per minute is not an unreasonable flow rate for a 3” fitting, resulting in velocities of fewer than 10 feet per second. However, loading two trucks in parallel would require modification to existing on-board systems as the vessels are not currently outfitted to support this type of operation. In addition, for this proposed operation to occur, it would be necessary to confirm that the ship’s pumps and piping are adequate for this pumping rate.
Direct Discharge to Barge
This alternative would include use of marine barges to remove the biomass using similar methodology to how marine fuels are currently loaded onto cruise vessels. A marine barge would be positioned by tug alongside the cruise vessel, a floating boom would deployed around the tug and barge to contain the off-load operations, and biomass would be transferred to the barge using vessel on-board pumps.
This scenario has the benefit of not impacting pier side operations, however it would require the purchase or lease of barges specifically designed/constructed for this unique use. A complexity of this scenario is that on most vessels the location for biomass transfer and vessel fueling occur at the same “break” or access door in the vessel hull. Due to the size of the barges involved and complexity of marine fueling operations, it would not be possible to simultaneously fuel the vessel from a barge while also removing biomass to a second barge located in close proximity. Accordingly, in order to accomplish simultaneous transfer of fuel (onboard) and biomass (offload), modification to onboard piping systems including potentially creation of a new access break served by biomass piping would be required. It is unknown if regulatory agencies with oversight capacity of marine fueling operations would have any concerns about the simultaneous fueling and biomass off-loading.
Direct Discharge to Piping on Pier
The location of biomass transfer varies by vessel due to the variable access port location where on-board piping systems can deliver biomass to the shore. In order to accommodate this variability of off-load location, it would likely be most efficient if the shore side pumps, required to support off-loading and transfer of biomass product to the remote storage facility, were mounted on a chassis or similar device to allow efficient positioning at any of the unique off-load location required by each vessel. However, the need to service the variable discharge locations on the vessels requires a similar ability to connect to the under-pier piping at several, perhaps many, discrete locations through access points (“manholes”) in the pier.
Note that while the Terminal 91 cruise facility is currently in the final stages of construction, the piers structures adjacent to the new building were constructed in 1992 (West side) and 1997 (East side).
CRUISE VESSEL BIOMASS MANAGEMENT STUDY DRAFT PHASE 1A STUDY Data Compilation and Initial Assessment
51 Cruise Vessel Biomass Management Study Draft Phase 1A Study, December 30, 2008
Creation of this type of access points through the pier deck requires structural analysis of the pier to ensure all existing and proposed load conditions meet applicable codes. In addition, construction work of this kind is generally expensive as it requires work in the over-water environment and due to the relative inaccessibility of the area under the pier.
Piping to transfer the biomass to an upland facility would be placed under approximately 1,200 to 1,500 lineal feet of pier at both Pier 66 and Terminal 91. At both facilities, it is not anticipated that piping could be placed in upland soils adjacent to the piers. These soil areas already are located below existing building structures or contain the utility infrastructure necessary to support the current operations. At Terminal 91 for example, only approximately 8 feet of soil area exists between the new cruise facility and the pier, and this area currently carries several utilities including storm water, as well as potable and fire water supply to the building.
Under-pier piping of this kind requires thoughtful placement and protection to minimize damage from floating debris which occasionally float under the pier spaces and can damage piping on a rising tide or in wave conditions. Potential environmental issues associated with placement of biomass pipes under the pier where they could be damaged are unknown and would need to be evaluated.
Due to the significant weight of storage tanks, it is not practical to store the biomass on the pier structure itself. Accordingly, it would be necessary to develop storage areas for the biomass in the upland areas adjacent to the cruise piers at either Pier 66 or Terminal 91. The specific location where such storage facility could be placed at either cruise facility is unknown. However, it is anticipated that such a facility would require an area of sufficient size for storage tanks, discharge piping and tanker truck access. It is unlikely that a facility of this size could be placed at Pier 66 due to the relatively small and constrained nature of the site.
The benefit of a direct discharge type of installation would be the smaller pier foot print area required to support the biomass off-loading which would likely have a similar lesser impact (than tanker truck off-loading) on current pier side operations. Disadvantages of this type of installation include the cost to purchase the pumping infrastructure, install the pipes under the piers, and construct the storage facility. In addition, and as noted above, the exposed location of the pipes under the pier increases the risk of potential spills due to damage caused by floating debris.
Future Methods for Biomass Disposal
A significant effort is underway by industry to develop innovative ways to achieve better environmental performance in the disposal of waste from ships.

CRUISE VESSEL BIOMASS MANAGEMENT STUDY DRAFT PHASE 1A STUDY Data Compilation and Initial Assessment
52 Cruise Vessel Biomass Management Study Draft Phase 1A Study, December 30, 2008
The company PyroGenesis with support from the US Navy and in cooperation with Carnival Cruise Lines has developed the PAWDS (Plasma Arc Waste Destruction System) as an alternative to shipboard incineration. According to website information the system is scalable and has the option for energy recovery with system capacities ranging from 0.1 to 15m3/day. The final product is an inert sand like ash which can either be off-loaded in port or disposed of at sea. The system has been in operation on Carnival Cruise Lines M/S Fantasy since 2003 and is now solely operated by the vessel crew. The system handles 5m3/day of waste. PAWDS is currently being marketed as Plasma King Waste Destruction System by Deerberg-Systems.
Scanship Environmental which makes waste treatment and handling systems for a significant portion of the cruise ship market has recently entered into and agreement with ITI Energy Limited whereby Scanship will promote, install and support ITI’s marine gasification technology according to a company press release. The agreement covers the full integration and use of ITI’s technology with Scanships ‘Clean Ship Solutions’ system. According to Scanship the system will be on the market soon and will be suitable for new build and retrofit markets. Scanship claims the system will not only produce ultra low emissions but will also produce a gas that can be fed into an internal combustion engine to generate a considerable amount of electricity. More detailed information about this system was not available and it is not known if any pilot projects are underway using the Scanship gasification technology. While this may hold promise for future applications, more data from demonstration projects are needed to determine the viability of the technology.

53 Cruise Vessel Biomass Management Study Draft
Phase 1A Study, December 30, 2008
CRUISE VESSEL BIOMASS MANAGEMENT STUDY DRAFT PHASE 1A STUDY Data Compilation and Initial Assessment
Section 4
Conclusion
References

CRUISE VESSEL BIOMASS MANAGEMENT STUDY DRAFT PHASE 1A STUDY Data Compilation and Initial Assessment
54 Cruise Vessel Biomass Management Study Draft Phase 1A Study, December 30, 2008
Conclusion
Based on the data provided herein, the following primary conclusions are apparent:
• As currently configured, it is not possible for all vessels to store the entire volume of biomass generated in a week long cruise voyage. Two vessels reported they could store all biomass generated in a week. For the remaining vessels the storage capacity varied from 47% to 94% of weekly generation (3.3 to 6.6 days of storage capacity). At this time it is not known on a vessel by vessel basis if adding storage is possible.
Accordingly, for all vessels that do not currently have sufficient capacity to store the biomass generated during a full week voyage, the available alternatives include:
o biomass off-shore disposal as currently allowed,
o mid-voyage transfer to other (not-in-Seattle) on-shore facility at other Port’s-of-call,
o or, modification of the existing on-board treatment, transfer and storage systems.
The costs and environmental impact of all of these alternatives are unknown and beyond the scope of this phase of the study.
• Biomass is pumpable and could potentially be pumped on shore.
• On-shore transfer would have significant impacts to pier side operations. The extent of these impacts would vary by vessel, dock facility, volume of biomass to discharge, and method chosen for transfer to shore facilities. However, it is clear that for at least some of the vessels currently calling at the Port, the requisite disembarkation/embarkation of passengers, bunkering and provisioning, as well as the scheduling demands of an Alaskan itinerary sailing from Seattle, make it unlikely that the vessel could unload all of its biomass during the short time they are alongside Port facilities.
• Further study would be needed for evaluation of the potential environmental impact(s) from off-loading biomass at the pier, including determination of the net environmental benefit/impact of both the off-load operation as well as introduction of this biomass into King County systems.
Before proceeding with alternative methods for managing and disposing of biomass, more study is needed both regarding the feasibility and cost of vessel retrofits as well as the environmental benefits or impacts of offloading biomass at the Port of Seattle.
The survey that was sent to Cruise Line operators is a first step in answering some of the questions related to upgrades necessary to the cruise vessels associated with biomass unloading. However, as part of a potential Phase 1B, more detail discussions with each vessel

CRUISE VESSEL BIOMASS MANAGEMENT STUDY DRAFT PHASE 1A STUDY Data Compilation and Initial Assessment
55 Cruise Vessel Biomass Management Study Draft Phase 1A Study, December 30, 2008
operator could be addressed to reach stronger conclusions about the physical impacts of proposed methods for onboard storage and transfer. Specific questions to be asked within these follow-up interviews include:
The following additional tasks are recommended as part of continued Phase 1B study:
1. Onboard visits of at least three vessels to determine biomass storage capacity, pumping capacity, shore transfer capability and rate(s) etc.
2. Meet with crew to better understand shore transfer and waste treatment operations and vessel system functions.
3. Preliminary engineering cost estimates for modifications of vessels surveyed.
4. Meet with shore side operator terminal operator to discuss impacts and mitigation for on-pier impact(s).
5. Preliminary engineering cost estimates for pier side modifications and additional infrastructure.
Phase 2 would focus on assessment of potential environmental impacts/benefits of alternative methods of biomass disposal and management. It may make sense to complete Phase 2 prior to proceeding Phase 1B.

CRUISE VESSEL BIOMASS MANAGEMENT STUDY DRAFT PHASE 1A STUDY Data Compilation and Initial Assessment
56 Cruise Vessel Biomass Management Study Draft Phase 1A Study, December 30, 2008
References
Alaska Department of Environmental Conservation (DEC). “Division of Water, Cruise Ship Program.” Accessed September 28, 2008. http://www.dec.state.ak.us/water/cruise_ships/index.htm
Hamworthy. “Membrane BioReactor Gray and Blackwater Treatment.” Accessed September 28, 2008 http://www.hamworthy.com/docGallery/415.PDF
Huhta, Hanna-Kaisa, Jorma Rytkonen & Jukka Sassi. “Estimating nutrient load from waste waters originating from ships in the Baltic Sea Area” Espoo 2007. VTT Tiedotteita – Research Notes 2370. 58 p. + app. 13 p.
Hydroxyl. “Hydroxyl Sea Clean.” Accessed September 28, 2008 http://www.hydroxyl.com/products_cleansea.php
King County Department of Natural Resources and Parks Wastewater Treatment Division, 2008. 2007 Biosolids Quality Summary. Seattle, WA.
MEPC (Marine Environment Protection Committee), adopted 13 October 2006. Annex 26 Resolution MEPC.159(55), Revised Guidelines on Implementation of Effluent Standards and Performance Tests for Sewage Treatment Plants. International Maritime Organization.
Northwest CruiseShip Association. “NWCruiseShip.org.” Accessed September 28, 2008 www.alaska.nwcruiseship.org/
Port of Seattle. “Cruise Seattle.” Accessed September 28, 2008 http://www.portseattle.org/seaport/cruise/
ROCHEM (n.d.). “Clearly Superior in Waste Water Treatment,” Accessed September 28, 2008. http://www.rochem.com/Home/home.html
U.S. Environmental Protection Agency. 2006a. Holland America Veendam Sampling Episode Report. Washington, DC. http://www.epa.gov/owow/oceans/cruise_ships/veendam.html
U.S. Environmental Protection Agency. 2006b. Norwegian Star Sampling Episode Report. Washington, DC http://www.epa.gov/owow/oceans/cruise_ships/finalstar.html
U.S. Environmental Protection Agency. 2006c. Princess Cruise Lines Island Princess Sampling Episode Report. Washington, DC. http://www.epa.gov/owow/oceans/cruise_ships/island.html
U.S. Environmental Protection Agency. 2006d. Sampling Episode Report Holland America Oosterdam Sampling Episode 6506. Washington, DC. http://www.epa.gov/owow/oceans/cruise_ships/oosterdam.html

CRUISE VESSEL BIOMASS MANAGEMENT STUDY DRAFT PHASE 1A STUDY Data Compilation and Initial Assessment
57 Cruise Vessel Biomass Management Study Draft Phase 1A Study, December 30, 2008
U.S. Environmental Protection Agency. 2007. Draft Cruise Ship Discharge Assessment Report. Washington, DC.
U.S. Environmental Protection Agency. 40cfr133.102. Washington, DC.
Voss, Kelly. “The Port of Helsinki Current Environmental Projects. September 3, 2008” Prepared for the Port of Seattle.

1 Cruise Vessel Biomass Management Study Draft Phase 1A Study, December 30, 2008
CRUISE VESSEL BIOMASS MANAGEMENT STUDY DRAFT PHASE 1A STUDY Data Compilation and Initial Assessment
Appendix
Blank Survey – As Sent to Cruise Lines

P.O. Box 1209 Seattle, WA U.S.A. 98111
BIOMASS MANAGEMENT STUDY
The Port of Seattle is in the process of studying the feasibility of alternatives to open-ocean discharge of cruise vessel biomass. The first step of this process is to gather information on cruise vessels currently calling at the port. In support of this study, the Port of Seattle is requesting that you please answer the following questions regarding the current methods for handling biomass produced within the vessel. Please return the completed survey to Marie Fritz ([email protected]) no later than noon on July 16, 2008. For the purposes of this study, “Biomass” refers to the partially-treated solids residuals from the wastewater treatment process. 1. Cruise line and name of the vessel:
2. Type (make/model) of advanced wastewater treatment system(s) or marine sanitation device
(please include schematic of treatment system if available): 3. Identify on-board waste water types that generate flow which enter the AWTS for treatment
(gray water, black water, etc.): 4. For each system identified above, provide the approximate quantity of blackwater and
graywater generated daily:
5. Identify the storage capacity of untreated wastewater within the vessel:
6. Identify the storage capacity of treated wastewater within the vessel:
7. Identify the daily treatment (process) capacity of the AWTS system (example – gallons or
cubic meters per day):

P.O. Box 1209 Seattle, WA U.S.A. 98111
8. Identify the daily volume of biomass generated and the volume of biomass generated on a
normal cruise evolution (7-days):
9. Estimated consistency of biomass (%liquid, % solid): 10. Identify the capacity of biomass that can be held on-board and the method of storage (dry,
wet, in tanks, in containers, etc.):
11. What is the current method of biomass disposal:
12. In a normal cruise evolution (7-day voyage), how often is biomass discharged:
13. Is the point where biomass is discharged determined based on capacity or by vessel location:
14. If the vessel conducts shorter cruises (3-4 days), how often and where is biomass discharged: 15. Has the vessel’s biomass ever been sampled for conventional pollutants or any other
parameters?

P.O. Box 1209 Seattle, WA U.S.A. 98111
16. Is this vessel currently fitted to store and discharge biomass to a shoreside facility? 17. If “No” to question 16:
a) What would it take to modify the existing on-board systems to allow discharge to a shoreside facility:
b) Is the consistency of the biomass material conducive to pumping to a shoreside facility:
18. If “Yes” to question 16:
a) How is the biomass transferred shoreside (pumped, water-added then pumped, vacuumed, etc.):
b) Identify company that receives the biomass shoreside and (if possible) the location where the biomass is ultimately disposed:
c) How long does it currently take to transfer biomass to the shoreside facilities:
19. If all or portions of the biomass is incinerated:
a) Describe what portion of the biomass is incinerated (screened solids, etc.):
b) How is this biomass transferred to the incinerator:
c) How much time does it take to transfer and incinerate the biomass:
d) How much fuel is consumed in the incineration of the biomass:
e) How is the remnant ash (left over following incineration) typically disposed: