Embed Size (px)
Citation preview
Crude Oil Movement by Rail and Pipeline
Quarterly Report: July 1, 2019 through September 30, 2019
November 2019 Publication 19-08-022

Publication and Contact Information This report is available on the Department of Ecology’s website at https://fortress.wa.gov/ecy/publications/SummaryPages/1908022.html
For more information contact:
Spill Prevention, Preparedness, and Response Program P.O. Box 47600 Olympia, WA 98504-7600 Phone: 360-407-7455
Washington State Department of Ecology — www.ecology.wa.gov
• Headquarters, Olympia 360-407-6000 • Northwest Regional Office, Bellevue 425-649-7000 • Southwest Regional Office, Olympia 360-407-6300 • Central Regional Office, Union Gap 509-575-2490 • Eastern Regional Office, Spokane 509-329-3400
To request ADA accommodation including materials in a format for the visually impaired, call Ecology at 360-407-6831 or visit https://ecology.wa.gov/accessibility. People with impaired hearing may call Washington Relay Service at 711. People with speech disability may call TTY at 877-833-6341.
Crude Oil Movement by Rail and Pipeline Quarterly Report: July 1, 2019 through September 30, 2019
Spill Prevention, Preparedness, and Response Program Washington State Department of Ecology
Olympia, Washington

This page is purposely left blank.

Publication 19-08-022 i November 2019
Table of Contents Page
List of Figures and Tables............................................................................................................... ii Introduction ......................................................................................................................................1
Crude Oil by Rail Summary ............................................................................................................2
Crude Oil by Pipeline Summary ......................................................................................................9
Crude Oil Spills – Rail and Pipeline ................................................................................................9
Crude Oil Movement by Vessel .....................................................................................................10
An Overview of Crude Oil Movement in Washington ..................................................................11
Contact Information .......................................................................................................................13
Appendix A – Washington Railroad Routes ..................................................................................14
Appendix B – API Gravity and Crude Oil Types ..........................................................................15
Publication 19-08-022 ii November 2019
List of Figures and Tables Page
Figures Figure 1: Weekly total volumes of crude oil by rail for the 3rd Quarter of 2019 ........................... 7
Figure 2: Crude oil movement by route for the 3rd Quarter of 2019 ............................................. 8
Figure 3: 12-month crude oil movement by mode ........................................................................ 11
Figure 4: Quarterly crude oil movement by mode, January 2017 – September 2019 .................. 12
Figure 5: Railroad routes in Washington ...................................................................................... 14
Tables Table 1: Crude oil movement by rail .............................................................................................. 3
Table 2: Crude oil movement by pipeline....................................................................................... 9
Table 3: Crude oil movement by vessel, July – September 2019 ................................................. 10
Table 4: Crude type by API gravity .............................................................................................. 15
Publication 19-08-022 1 November 2019
Introduction To enhance crude oil spill preparedness and response in Washington State, on August 24, 2016, Ecology adopted the rule, Oil Movement by Rail and Pipeline Notification. The rule establishes reporting standards for facilities that receive crude oil by rail and pipelines that transport crude oil in or through the state.1 Additionally, the rule identifies reporting standards for Ecology to share information with emergency responders, local governments, tribes, and the public. This rule is the result of 2015 Legislative direction to provide a better understanding of the changing risk picture for crude oil transported in Washington State as a result of the introduction of crude oil transport by rail and the associated changes in both the volume and properties of crude moving through Washington. Timely notice of oil movement information is necessary for emergency responders and planners to effectively prepare for and respond to oil spills and other incidents associated with transporting crude oil by rail and pipeline. Providing adequate information about the dates, routes, and properties of crude oil can help protect people living and working near railroads and pipelines, the economy, and environmental resources of Washington State. Ecology is required to publish information collected under the rule to its website on a quarterly basis. The quarterly reports provide:
• Aggregated information on crude oil transported by rail to facilities in Washington. • Information about crude oil movement by pipeline in or through the state. • Reported spills during transport and delivery of crude by rail and pipeline. • Volume of crude oil transported by vessel.
The reports are intended to inform the public about the nature of crude oil movement through their communities. The reporting period for this quarterly report is July 1, 2019 through September 30, 2019.
1 Chapter 173-185 WAC, Oil Movement by Rail and Pipeline Notification

Publication 19-08-022 2 November 2019
Crude Oil by Rail Summary Movement of crude oil by rail in Washington State began in 2012 and has continued to increase since that time. Rail routes transporting crude oil enter the state from Idaho near Spokane and from British Columbia near Bellingham, and Ecology continues to monitor other potential routes. Large segments of the rail routes travel along the I-5 corridor, and cross or run next to major waterways, including the Columbia River and Puget Sound. (See Appendix A for a map of railroad routes in the state.) Capturing information on the properties of crude oil, the volume transported, and the routes used to transport it allows for proper planning, placement of resources, and opportunities to provide detailed information to responders in the event of a spill, ensuring a more effective overall response. The rule directs Ecology to gather this information by requiring facilities receiving crude oil by rail to report all scheduled crude oil deliveries to be received by the facility each week for the succeeding seven-day period. Facilities enter this information into Ecology’s Advance Notice of Transfer (ANT) database. Information reported by facilities on scheduled crude oil deliveries includes the region of origin of crude oil, the railroad route taken to the facility within the state (if known), scheduled time and volume in barrels (bbls) of the delivery, and gravity of the oil. Ecology uses the standard American Petroleum Institute (API) gravity ranges to define the crude type in the ANT database. (See Appendix B for the API gravity definition and crude type ranges.) Ecology is required to aggregate the information provided on a statewide basis by route, week, and type of crude oil. Aggregate information from the ANT database is provided in Table 1 for the period July 1, 2019 through September 30, 2019, representing the 3rd Quarter of 2019. Each week is numbered by calendar week and is aggregated by route and type of crude. The information provided includes:
• Total weekly volume in barrels (bbls) of crude oil transported by rail • Route • Region of origin • Crude type • Route volume • Estimated number of railcars per route delivering crude oil (assumes each car holds 680 bbls)
Fourteen calendar weeks are reported in the 3rd Quarter of 2019 starting at calendar week 27 and ending at calendar week 40.

Publication 19-08-022 3 November 2019
Table 1: Crude oil movement by rail Calendar week 27 Week 27 consists of only six days of reported ANT volumes due to the dates of the reporting period.
Route Segments Region of Origin Crude Type Volume (bbls) Est # Cars 1A, 2, 3 North Dakota Light Crude 198,145 291
1A, 2, 3, 4 North Dakota Light Crude 390,000 573
1A, 2, 3, 4, 5 North Dakota Light Crude 623,366 916
5 Alberta Light Crude 15,750 23
Weekly totals Not applicable Not applicable 1,227,261 1,803
Calendar week 28
Route Segments Region of Origin Crude Type Volume (bbls) Est # Cars 1A, 2, 3 North Dakota Light Crude 136,654 200
1A, 2, 3, 4 North Dakota Light Crude 455,000 669
1A, 2, 3, 4, 5 North Dakota Light Crude 773,196 1,137
1B, 2, 3 Alberta Heavy Crude 116,965 172
5 Alberta Light Crude 1,890 2
Weekly totals Not applicable Not applicable 1,483,705 2,180
Calendar week 29
Route Segments Region of Origin Crude Type Volume (bbls) Est # Cars 1A, 2, 3 North Dakota Light Crude 198,297 291
1A, 2, 3, 4 North Dakota Light Crude 455,000 669
1A, 2, 3, 4, 5 North Dakota Light Crude 622,531 915
1B, 2, 3 Alberta Heavy Crude 117,828 173
5 Alberta Light Crude 11,340 16
5 Saskatchewan Light Crude 64,054 94
Weekly totals Not applicable Not applicable 1,469,050 2,158
Calendar week 30
Route Segments Region of Origin Crude Type Volume (bbls) Est # Cars 1A, 2, 3 North Dakota Light Crude 197,931 291
1A, 2, 3, 4 North Dakota Light Crude 390,000 573
1A, 2, 3, 4, 5 North Dakota Light Crude 625,904 920
1B, 2, 3 Alberta Heavy Crude 58,075 85
5 Alberta Light Crude 9,450 13
5 Saskatchewan Light Crude 63,785 93
Weekly totals Not applicable Not applicable 1,345,145 1,975

Publication 19-08-022 4 November 2019
Calendar week 31
Route Segments Region of Origin Crude Type Volume (bbls) Est # Cars 1A, 2, 3 North Dakota Light Crude 197,577 290
1A, 2, 3, 4 North Dakota Light Crude 455,000 669
1A, 2, 3, 4, 5 North Dakota Light Crude 626,716 921
1B, 2, 3 Alberta Heavy Crude 119,300 175
5 Alberta Light Crude 6,930 10
5 Saskatchewan Light Crude 64,225 94
Weekly totals Not applicable Not applicable 1,469,748 2,159
Calendar week 32
Route Segments Region of Origin Crude Type Volume (bbls) Est # Cars 1A, 2, 3 North Dakota Light Crude 133,926 196
1A, 2, 3, 4 North Dakota Light Crude 390,000 573
1A, 2, 3, 4, 5 North Dakota Light Crude 553,935 814
1B, 2, 3 Alberta Heavy Crude 116,875 171
5 Alberta Light Crude 5,040 7
Weekly totals Not applicable Not applicable 1,199,776 1,761
Calendar week 33
Route Segments Region of Origin Crude Type Volume (bbls) Est # Cars 1A, 2, 3 North Dakota Light Crude 203,221 298
1A, 2, 3, 4 North Dakota Light Crude 455,000 669
1A, 2, 3, 4, 5 North Dakota Light Crude 693,527 1,019
1B, 2, 3 Alberta Heavy Crude 58,228 85
5 Alberta Light Crude 3,150 4
5 Saskatchewan Light Crude 64,215 94
Weekly totals Not applicable Not applicable 1,477,341 2,169
Calendar week 34
Route Segments Region of Origin Crude Type Volume (bbls) Est # Cars 1A, 2, 3 North Dakota Light Crude 204,002 300
1A, 2, 3, 4 North Dakota Light Crude 390,000 573
1A, 2, 3, 4, 5 North Dakota Light Crude 343,432 505
1B, 2, 3 Alberta Heavy Crude 59,476 87
5 Alberta Light Crude 10,080 14
5 Saskatchewan Light Crude 64,380 94
Weekly totals Not applicable Not applicable 1,071,370 1,573

Publication 19-08-022 5 November 2019
Calendar week 35
Route Segments Region of Origin Crude Type Volume (bbls) Est # Cars 1A, 2, 3 North Dakota Light Crude 137,150 201
1A, 2, 3, 4 North Dakota Light Crude 455,000 669
1A, 2, 3, 4, 5 North Dakota Light Crude 350,933 516
1B, 2, 3 Alberta Heavy Crude 116,578 171
5 Alberta Light Crude 8,190 12
5 Saskatchewan Light Crude 64,240 94
Weekly totals Not applicable Not applicable 1,132,091 1,663
Calendar week 36
Route Segments Region of Origin Crude Type Volume (bbls) Est # Cars 1A, 2, 3 North Dakota Light Crude 207,142 304
1A, 2, 3, 4 North Dakota Light Crude 390,000 573
1A, 2, 3, 4, 5 North Dakota Light Crude 484,069 711
1B, 2, 3 Alberta Heavy Crude 58,215 85
1B, 2, 3, 4, 5 North Dakota Light Crude 69,423 102
5 Alberta Light Crude 8,820 12
5 Saskatchewan Light Crude 64,039 94
Weekly totals Not applicable Not applicable 1,281,708 1,881
Calendar week 37
Route Segments Region of Origin Crude Type Volume (bbls) Est # Cars 1A, 2, 3 North Dakota Light Crude 137,386 202
1A, 2, 3, 4 North Dakota Light Crude 390,000 573
1A, 2, 3, 4, 5 North Dakota Light Crude 489,274 719
5 Saskatchewan Light Crude 64,348 94 Weekly totals Not applicable Not applicable 1,081,008 1,588
Calendar week 38
Route Segments Region of Origin Crude Type Volume (bbls) Est # Cars 1A, 2, 3 North Dakota Light Crude 138,090 203
1A, 2, 3, 4 North Dakota Light Crude 390,000 573
1A, 2, 3, 4, 5 North Dakota Light Crude 276,896 407
1B, 2, 3 Alberta Heavy Crude 58,876 86
4, 5 Alberta Heavy Crude 58,000 85
5 Alberta Light Crude 7,560 11 Weekly totals Not applicable Not applicable 929,422 1,365
Publication 19-08-022 6 November 2019
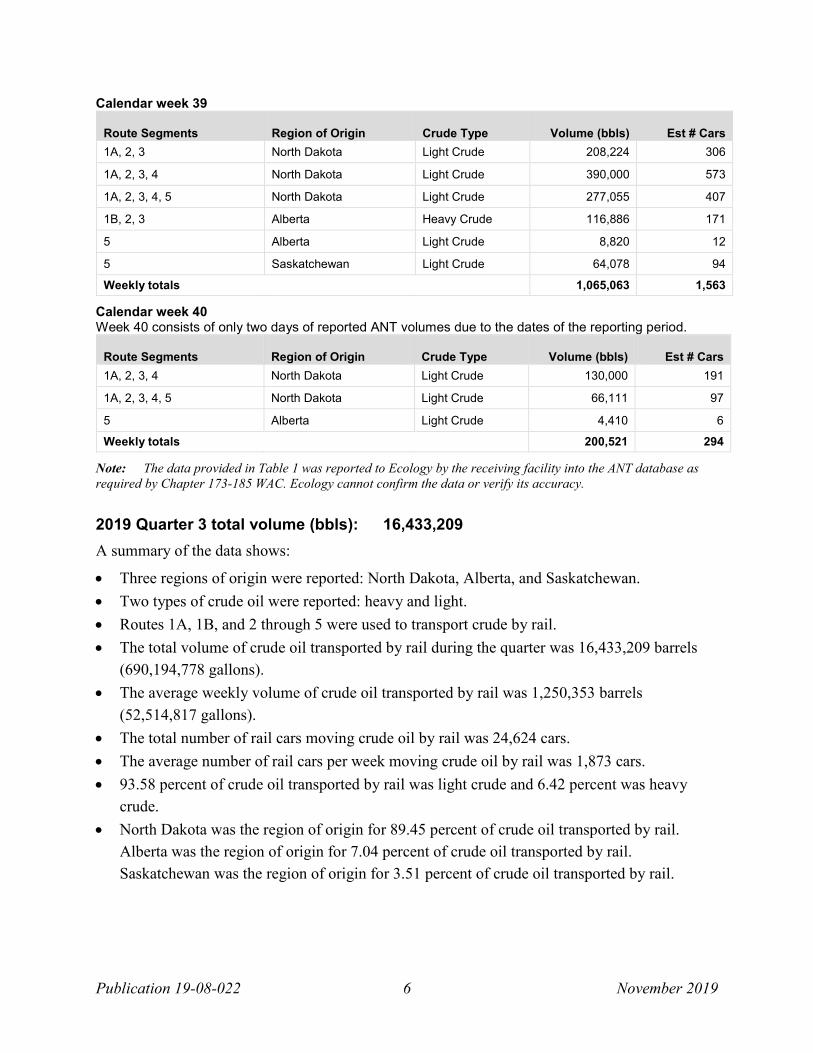
Calendar week 39
Route Segments Region of Origin Crude Type Volume (bbls) Est # Cars 1A, 2, 3 North Dakota Light Crude 208,224 306
1A, 2, 3, 4 North Dakota Light Crude 390,000 573
1A, 2, 3, 4, 5 North Dakota Light Crude 277,055 407
1B, 2, 3 Alberta Heavy Crude 116,886 171
5 Alberta Light Crude 8,820 12
5 Saskatchewan Light Crude 64,078 94
Weekly totals Not applicable Not applicable 1,065,063 1,563
Calendar week 40 Week 40 consists of only two days of reported ANT volumes due to the dates of the reporting period.
Route Segments Region of Origin Crude Type Volume (bbls) Est # Cars 1A, 2, 3, 4 North Dakota Light Crude 130,000 191
1A, 2, 3, 4, 5 North Dakota Light Crude 66,111 97
5 Alberta Light Crude 4,410 6
Weekly totals Not applicable Not applicable 200,521 294
Note: The data provided in Table 1 was reported to Ecology by the receiving facility into the ANT database as required by Chapter 173-185 WAC. Ecology cannot confirm the data or verify its accuracy.
2019 Quarter 3 total volume (bbls): 16,433,209
A summary of the data shows:
• Three regions of origin were reported: North Dakota, Alberta, and Saskatchewan. • Two types of crude oil were reported: heavy and light. • Routes 1A, 1B, and 2 through 5 were used to transport crude by rail. • The total volume of crude oil transported by rail during the quarter was 16,433,209 barrels
(690,194,778 gallons). • The average weekly volume of crude oil transported by rail was 1,250,353 barrels
(52,514,817 gallons). • The total number of rail cars moving crude oil by rail was 24,624 cars. • The average number of rail cars per week moving crude oil by rail was 1,873 cars. • 93.58 percent of crude oil transported by rail was light crude and 6.42 percent was heavy
crude. • North Dakota was the region of origin for 89.45 percent of crude oil transported by rail.
Alberta was the region of origin for 7.04 percent of crude oil transported by rail. Saskatchewan was the region of origin for 3.51 percent of crude oil transported by rail.

Publication 19-08-022 7 November 2019
Figure 1 shows the weekly total volumes of crude transported by rail for each calendar week in the 3rd Quarter of 2019.
Note: Week 27 consists of only 6 days of reported ANT volumes due to the dates of the reporting period. Week 40 consists of only 2 days of reported ANT volumes due to the dates of the reporting period.
Figure 1: Weekly total volumes of crude oil by rail for the 3rd Quarter of 2019
The lowest weekly volume was 929,422 barrels (39,035,724 gallons) in Week 38. The highest weekly volume of crude transported by rail was 1,483,705 barrels (62,315,610 gallons) in Week 28.
1,227,261
1,483,705
1,469,050
1,345,145
1,469,748
1,199,776
1,477,341
1,071,370
1,132,091
1,281,708
1,081,008
929,422
1,065,063
200,521
0
200,000
400,000
600,000
800,000
1,000,000
1,200,000
1,400,000
1,600,000
27 28 29 30 31 32 33 34 35 36 37 38 39 40
Volu
me
in b
arre
ls (b
bls)
Calendar Week
Weekly Total Volumes of Crude Oil by Rail
Publication 19-08-022 8 November 2019
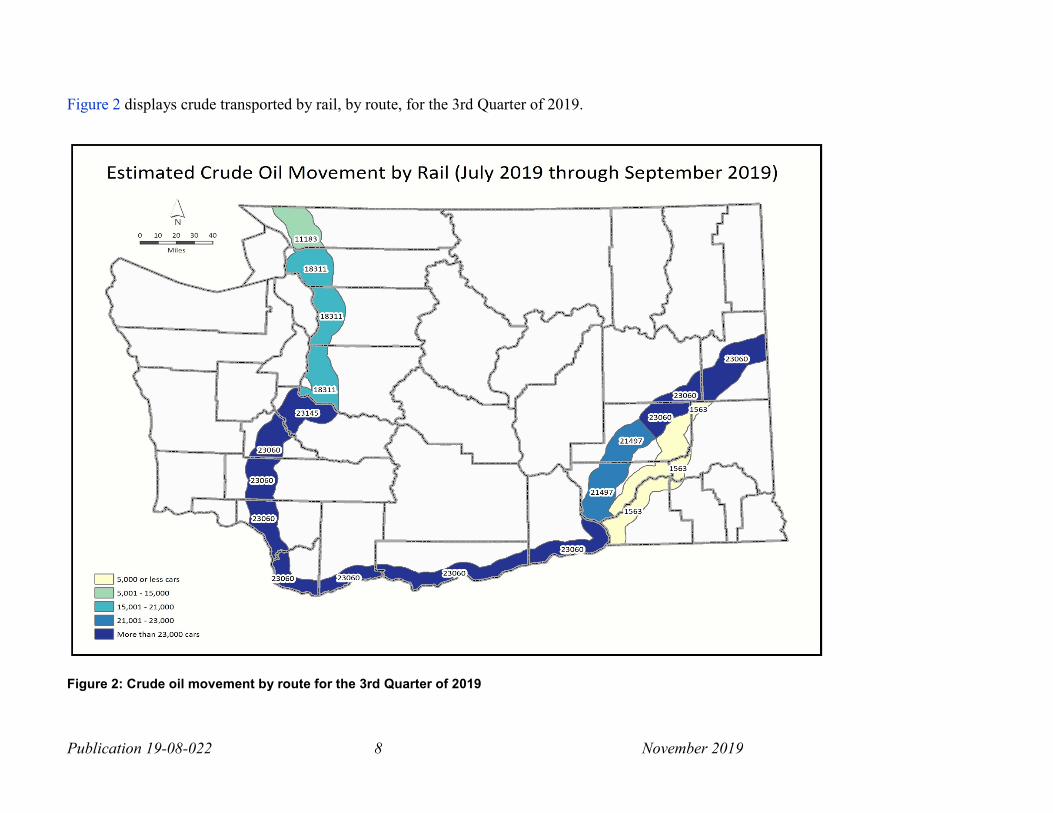
Figure 2 displays crude transported by rail, by route, for the 3rd Quarter of 2019.
Figure 2: Crude oil movement by route for the 3rd Quarter of 2019

Publication 19-08-022 9 November 2019
Crude Oil by Pipeline Summary Pipelines exist inland and may be located near waterbodies and populated areas. Knowing the types and quantities of crude oil transported through pipelines in Washington State helps Ecology properly plan for and execute a rapid, aggressive, and well-coordinated response to a spill. Under the rule, transmission pipelines that transport crude oil in or through the state must provide Ecology biannual notice of all crude oil transported in or through the state.2 Biannual notice must be submitted each year by July 31 for the period from January 1 through June 30, and by January 31 for the period from July 1 through December 31. Biannual notice provided by pipelines includes contact information for the pipeline and the total volume of crude oil transported in or through the state during the reporting period by state or province of origin. The most recent biannual notices from pipelines covered the period from January 1, 2019 through June 30, 2019. Table 2 below provides the total volume of crude oil transported in or through the state by pipelines during this period.
Table 2: Crude oil movement by pipeline Period State or Province of
Origin Volume (bbls)
January 1, 2019 – June 30, 2019 Alberta 36,184,994
Note: The data provided in Table 2 was reported to Ecology by the pipelines transporting crude oil in or through the state, as required by Chapter 173-185 WAC. Ecology cannot confirm the data or verify its accuracy.
The next biannual notices from pipelines will cover the period from July 1, 2019 through December 31, 2019 and must be submitted to Ecology by January 31, 2020.
Crude Oil Spills – Rail and Pipeline Oil spills can have significant impacts to the public, environment, and economy. Ecology strives to protect Washington’s environment, economy, and public health and safety through a comprehensive spill prevention, preparedness, and response program. The rule directs Ecology to provide the number and volume of spills to the waters of the state during the transport and delivery of crude oil by rail and pipeline in each quarterly report.3 For the period of July 1, 2019 through September 30, 2019, zero crude oil spills to the environment by rail or pipeline were reported. In the event there are spills to report in the future, Ecology will provide this information and include the date of the spill, the county where the spill occurred, the source, material, and volume of the spill.
2 Chapter 173-185 WAC, Oil Movement by Rail and Pipeline Notification 3 Chapter 173-185 WAC, Oil Movement by Rail and Pipeline Notification

Publication 19-08-022 10 November 2019
Crude Oil Movement by Vessel In 2006, the state adopted rules for advance notice of oil transfers for vessels and facilities. Ecology has been receiving advance notice of transfer data for all transfers to or from vessels in Washington State since that time. In order to provide a full picture of crude oil movement in Washington State, a summary of crude oil movement by vessel is provided below, which is in addition to the requirement for this quarterly report as described in the rule.4 Table 3 below provides the total volume of crude oil in barrels of inbound and outbound vessel transfers for the period of July 1, 2019 through September 30, 2019. Inbound vessel transfers refers to crude oil movement from vessels to facilities, while outbound vessel transfers refers to crude oil movement from facilities to vessels.
Table 3: Crude oil movement by vessel, July – September 2019 Vessel transfers Volume (bbls) Volume (gallons)
Inbound 23,835,164 1,001,076,922
Outbound 421,601 17,707,260
Total 24,256,765 1,018,784,182
Note: The data provided in Table 3 was reported to Ecology into the ANT database as required by Chapter 173-180 WAC and Chapter 173-184 WAC. Ecology cannot confirm the data or verify its accuracy.
A summary of vessel transfer data for the quarter shows: • There were 65 total vessel transfers of crude oil (inbound or outbound). • The average volume of crude oil transferred to or from vessels per week was 1,845,623
barrels (77,516,187 gallons).
4 Chapter 173-185 WAC, Oil Movement by Rail and Pipeline Notification

Publication 19-08-022 11 November 2019
An Overview of Crude Oil Movement in Washington A broad view of crude oil movement in Washington State can be seen when comparing the movement of crude oil transported into the state by vessel, rail, and pipeline. Figure 3 shows the estimated percentage of crude oil transported by vessel (inbound only), rail, and pipeline for the last four quarters, covering the period of October 1, 2018 through September 30, 2019.5
Figure 3: 12-month crude oil movement by mode
Between October 1, 2018 and September 30, 2019, vessels were responsible for 40 percent of reported crude oil movement into the state, rail was responsible for 30 percent, and pipeline for 30 percent.
5 The most recent biannual notices from pipelines were submitted to Ecology for the period from January 1, 2019 through June 30, 2019. The next biannual notices submitted by pipelines will cover the period from July 1, 2019 through December 31, 2019, and must be submitted to Ecology by January 31, 2020.
Vessel (Inbound)88,092,155
40%
Rail66,601,590
30%
Pipeline67,232,448
30%
Reported Crude Oil Movement by Mode in BarrelsOctober 1, 2018 - September 30, 2019

Publication 19-08-022 12 November 2019
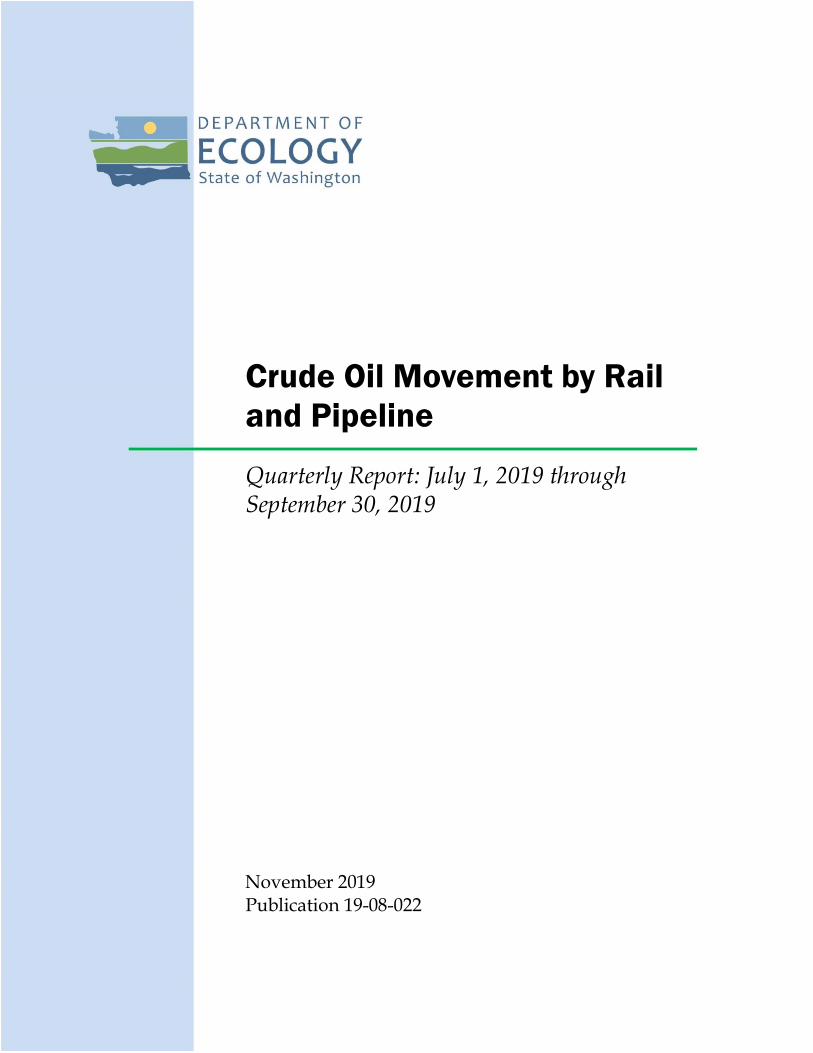
Figure 4 shows crude oil movement, by mode, for each quarter that rail and pipeline crude oil data has been collected, covering the period of January 1, 2017 through September 30, 2019.
Mode 1st Qtr 2017
2nd Qtr 2017
3rd Qtr 2017
4th Qtr 2017
1st Qtr 2018
2nd Qtr 2018
3rd Qtr 2018
4th Qtr 2018
1st Qtr 2019
2nd Qtr 2019
3rd Qtr 2019
Vessel (Inbound) 44.7% 45.7% 47.7% 45.7% 46.0% 38.6% 48.3% 47.2% 37.8% 32.4%
40.8%
Rail 26.1% 26.8% 24.5% 24.8% 25.7% 28.7% 28.7% 29.8% 29.1% 33.2% 28.2%
Pipeline 29.2% 27.5% 27.8% 29.5% 28.2% 32.7% 23.0% 23.0% 33.1% 34.4% 31.0%
*Note: The most recent biannual notices from pipelines were submitted to Ecology for the period from January 1, 2019, through June 30, 2019. For the most recent quarter, Ecology estimated crude oil movement by pipeline for the period based on data provided in that previous biannual notice.
Figure 4: Quarterly crude oil movement by mode, January 2017 – September 2019
Ecology will continue to receive information about crude oil movement and use the data to summarize changes over time.
44.7% 45.7% 47.7% 45.7% 46.0%38.6%
48.3% 47.2%37.8% 32.4%
40.8%
26.1% 26.8% 24.5%24.8% 25.7%
28.7%
28.7% 29.8%29.1% 33.2%
28.2%
29.2%27.5% 27.8%
29.5% 28.2%32.7%
23.0% 23.0%33.1% 34.4%
31.0%
0
10
20
30
40
50
60
70
1st Qtr2017
2nd Qtr2017
3rd Qtr2017
4th Qtr2017
1st Qtr2018
2nd Qtr2018
3rd Qtr2018
4th Qtr2018
1st Qtr2019
2nd Qtr2019
3rd Qtr2019
Volu
me
(bar
rels
)
Mill
ions
Crude Volume by Mode by Quarter
Reported Crude Oil Movement in Washington
Pipeline*
Rail
Vessel (Inbound)
Totals
Publication 19-08-022 13 November 2019
Contact Information Rebecca Ames Department of Ecology Spills Program P.O. Box 47600 Olympia, WA 98504-7600
Phone: (360) 970-7688 Email: [email protected]
Kevin Truong Department of Ecology Spills Program P.O. Box 47600 Olympia, WA 98504-7600
Phone: (206) 276-7286 Email: [email protected]
Publication 19-08-022 14 November 2019
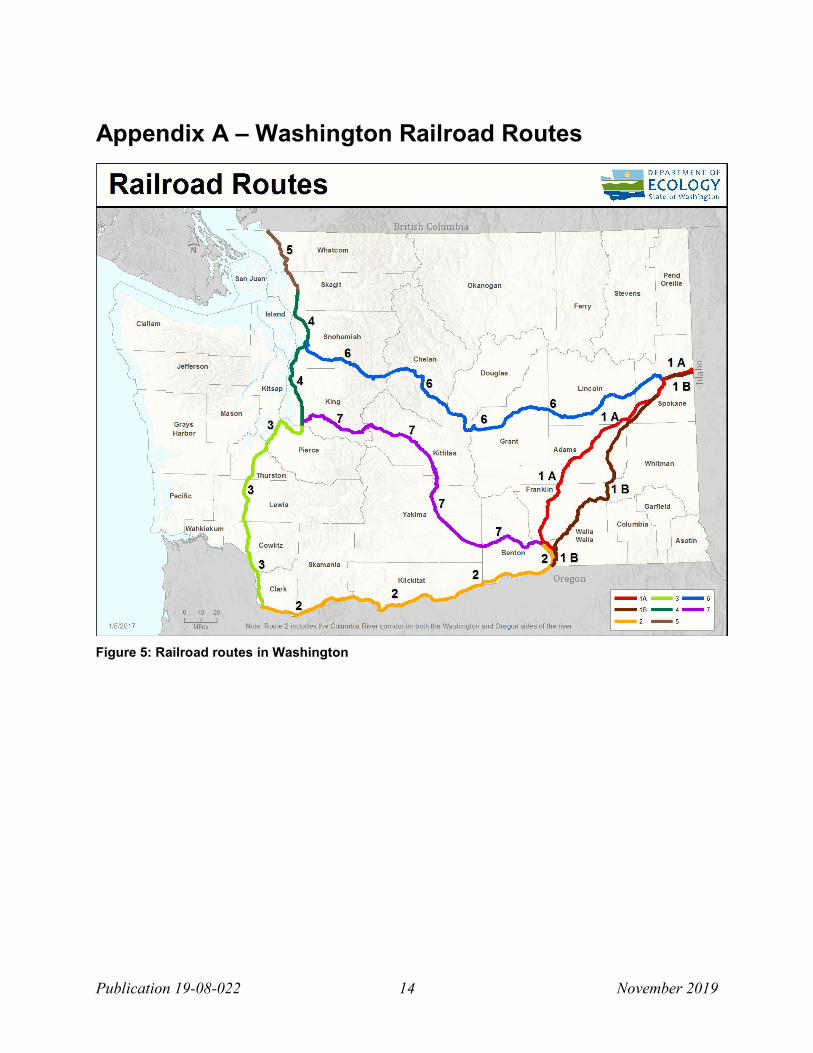
Appendix A – Washington Railroad Routes
Figure 5: Railroad routes in Washington
Publication 19-08-022 15 November 2019
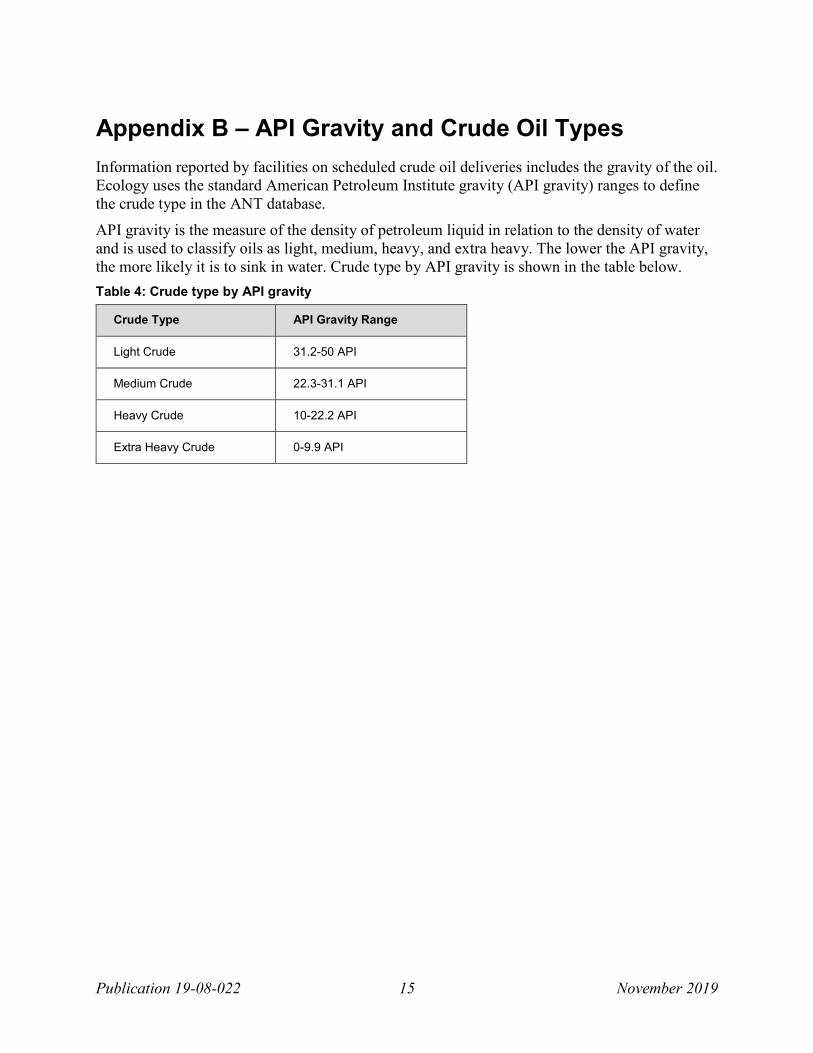
Appendix B – API Gravity and Crude Oil Types Information reported by facilities on scheduled crude oil deliveries includes the gravity of the oil. Ecology uses the standard American Petroleum Institute gravity (API gravity) ranges to define the crude type in the ANT database. API gravity is the measure of the density of petroleum liquid in relation to the density of water and is used to classify oils as light, medium, heavy, and extra heavy. The lower the API gravity, the more likely it is to sink in water. Crude type by API gravity is shown in the table below. Table 4: Crude type by API gravity
Crude Type API Gravity Range
Light Crude 31.2-50 API
Medium Crude 22.3-31.1 API
Heavy Crude 10-22.2 API
Extra Heavy Crude 0-9.9 API