Embed Size (px)
Citation preview

Copyright © Andrew W. Moore Slide 1
Cross-validation for detecting and preventing
overfittingAndrew W. Moore
ProfessorSchool of Computer ScienceCarnegie Mellon University
www.cs.cmu.edu/[email protected]
412-268-7599
Note to other teachers and users of these slides. Andrew would be delighted if you found this source material useful in giving your own lectures. Feel free to use these slides verbatim, or to modify them to fit your own needs. PowerPoint originals are available. If you make use of a significant portion of these slides in your own lecture, please include this message, or the following link to the source repository of Andrew’s tutorials: http://www.cs.cmu.edu/~awm/tutorials . Comments and corrections gratefully received.

Copyright © Andrew W. Moore Slide 2
A Regression Problem
x
y
y = f(x) + noise
Can we learn f from this data?
Let’s consider three methods…

Copyright © Andrew W. Moore Slide 3
Linear Regression
x
y

Copyright © Andrew W. Moore Slide 6
Linear RegressionUnivariate Linear regression with a constant term:
::3173
YX
:13
:37X= y=
x1=(3).. y1=7..
13
:11
:37
Z= y=
z1=(1,3)..
zk=(1,xk)
y1=7..
β=(ZTZ)-1(ZTy)
yest = β0+ β1 x

Copyright © Andrew W. Moore Slide 7
Quadratic Regression
x
y

Copyright © Andrew W. Moore Slide 8
Quadratic Regression
::3173
YX
:13
:37X= y=
x1=(3,2).. y1=7..
19
13
:11
:37Z=
y=
z=(1 , x, x2,)
β=(ZTZ)-1(ZTy)
yest = β0+ β1 x+ β2 x2
Much more about this in the future Andrew Lecture: “Favorite Regression Algorithms”

Copyright © Andrew W. Moore Slide 9
Join-the-dots
x
y
Also known as piecewise linear nonparametric
regression if that makes you feel better

Copyright © Andrew W. Moore Slide 10
Which is best?
x
y
x
y
Why not choose the method with the best fit to the data?

Copyright © Andrew W. Moore Slide 11
What do we really want?
x
y
x
y
Why not choose the method with the best fit to the data?
“How well are you going to predict future data drawn from the same
distribution?”

Copyright © Andrew W. Moore Slide 12
The test set method
x
y
1. Randomly choose 30% of the data to be in a test set
2. The remainder is a training set

Copyright © Andrew W. Moore Slide 13
The test set method
x
y
1. Randomly choose 30% of the data to be in a test set
2. The remainder is a training set
3. Perform your regression on the training set
(Linear regression example)

Copyright © Andrew W. Moore Slide 14
The test set method
x
y
1. Randomly choose 30% of the data to be in a test set
2. The remainder is a training set
3. Perform your regression on the training set
4. Estimate your future performance with the test set
(Linear regression example)
Mean Squared Error = 2.4

Copyright © Andrew W. Moore Slide 15
The test set method
x
y
1. Randomly choose 30% of the data to be in a test set
2. The remainder is a training set
3. Perform your regression on the training set
4. Estimate your future performance with the test set
(Quadratic regression example)
Mean Squared Error = 0.9

Copyright © Andrew W. Moore Slide 16
The test set method
x
y
1. Randomly choose 30% of the data to be in a test set
2. The remainder is a training set
3. Perform your regression on the training set
4. Estimate your future performance with the test set
(Join the dots example)
Mean Squared Error = 2.2

Copyright © Andrew W. Moore Slide 17
The test set methodGood news:
•Very very simple
•Can then simply choose the method with the best test-set score
Bad news:
•What’s the downside?

Copyright © Andrew W. Moore Slide 18
The test set methodGood news:
•Very very simple
•Can then simply choose the method with the best test-set score
Bad news:
•Wastes data: we get an estimate of the best method to apply to 30% less data
•If we don’t have much data, our test-set might just be lucky or unlucky
We say the “test-set estimator of performance has high variance”

Copyright © Andrew W. Moore Slide 19
LOOCV (Leave-one-out Cross Validation)
x
y
For k=1 to R
1. Let (xk,yk) be the kth record

Copyright © Andrew W. Moore Slide 20
LOOCV (Leave-one-out Cross Validation)
x
y
For k=1 to R
1. Let (xk,yk) be the kth record
2. Temporarily remove (xk,yk)from the dataset

Copyright © Andrew W. Moore Slide 21
LOOCV (Leave-one-out Cross Validation)
x
y
For k=1 to R
1. Let (xk,yk) be the kth record
2. Temporarily remove (xk,yk)from the dataset
3. Train on the remaining R-1 datapoints

Copyright © Andrew W. Moore Slide 22
LOOCV (Leave-one-out Cross Validation)For k=1 to R
1. Let (xk,yk) be the kth record
2. Temporarily remove (xk,yk)from the dataset
3. Train on the remaining R-1 datapoints
4. Note your error (xk,yk)
x
y

Copyright © Andrew W. Moore Slide 23
LOOCV (Leave-one-out Cross Validation)For k=1 to R
1. Let (xk,yk) be the kth record
2. Temporarily remove (xk,yk)from the dataset
3. Train on the remaining R-1 datapoints
4. Note your error (xk,yk)
When you’ve done all points, report the mean error.
x
y

Copyright © Andrew W. Moore Slide 24
LOOCV (Leave-one-out Cross Validation)For k=1 to R
1. Let (xk,yk) be the kth
record
2. Temporarily remove (xk,yk) from the dataset
3. Train on the remaining R-1 datapoints
4. Note your error (xk,yk)
When you’ve done all points, report the mean error.
x
y
x
y
x
y
x
y
x
y
x
y
x
y
x
y
x
y
MSELOOCV = 2.12

Copyright © Andrew W. Moore Slide 25
LOOCV for Quadratic RegressionFor k=1 to R
1. Let (xk,yk) be the kth
record
2. Temporarily remove (xk,yk) from the dataset
3. Train on the remaining R-1 datapoints
4. Note your error (xk,yk)
When you’ve done all points, report the mean error.
x
y
x
y
x
y
x
y
x
y
x
y
x
y
x
y
x
y
MSELOOCV=0.962

Copyright © Andrew W. Moore Slide 26
LOOCV for Join The DotsFor k=1 to R
1. Let (xk,yk) be the kth
record
2. Temporarily remove (xk,yk) from the dataset
3. Train on the remaining R-1 datapoints
4. Note your error (xk,yk)
When you’ve done all points, report the mean error.
x
y
x
y
x
y
x
y
x
y
x
y
x
y
x
y
x
y
MSELOOCV=3.33
Copyright © Andrew W. Moore Slide 27
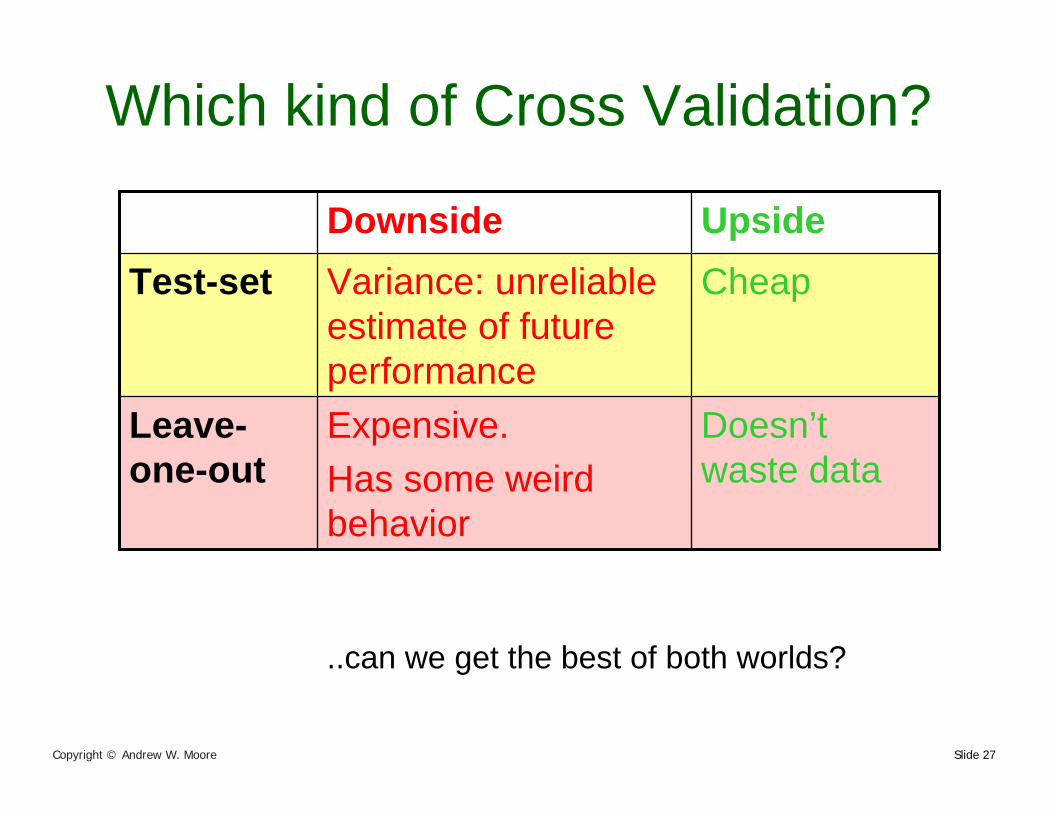
Which kind of Cross Validation?
Doesn’t waste data
Expensive. Has some weird behavior
Leave-one-out
CheapVariance: unreliable estimate of future performance
Test-setUpsideDownside
..can we get the best of both worlds?

Copyright © Andrew W. Moore Slide 28
k-fold Cross Validation
x
y
Randomly break the dataset into k partitions (in our example we’ll have k=3 partitions colored Red Green and Blue)

Copyright © Andrew W. Moore Slide 29
k-fold Cross Validation
x
y
Randomly break the dataset into k partitions (in our example we’ll have k=3 partitions colored Red Green and Blue)
For the red partition: Train on all the points not in the red partition. Find the test-set sum of errors on the red points.

Copyright © Andrew W. Moore Slide 30
k-fold Cross Validation
x
y
Randomly break the dataset into k partitions (in our example we’ll have k=3 partitions colored Red Green and Blue)
For the red partition: Train on all the points not in the red partition. Find the test-set sum of errors on the red points.
For the green partition: Train on all the points not in the green partition. Find the test-set sum of errors on the green points.

Copyright © Andrew W. Moore Slide 31
k-fold Cross Validation
x
y
Randomly break the dataset into k partitions (in our example we’ll have k=3 partitions colored Red Green and Blue)
For the red partition: Train on all the points not in the red partition. Find the test-set sum of errors on the red points.
For the green partition: Train on all the points not in the green partition. Find the test-set sum of errors on the green points.
For the blue partition: Train on all the points not in the blue partition. Find the test-set sum of errors on the blue points.

Copyright © Andrew W. Moore Slide 32
k-fold Cross Validation
x
y
Randomly break the dataset into k partitions (in our example we’ll have k=3 partitions colored Red Green and Blue)
For the red partition: Train on all the points not in the red partition. Find the test-set sum of errors on the red points.
For the green partition: Train on all the points not in the green partition. Find the test-set sum of errors on the green points.
For the blue partition: Train on all the points not in the blue partition. Find the test-set sum of errors on the blue points.
Then report the mean errorLinear Regression MSE3FOLD=2.05

Copyright © Andrew W. Moore Slide 33
k-fold Cross Validation
x
y
Randomly break the dataset into k partitions (in our example we’ll have k=3 partitions colored Red Green and Blue)
For the red partition: Train on all the points not in the red partition. Find the test-set sum of errors on the red points.
For the green partition: Train on all the points not in the green partition. Find the test-set sum of errors on the green points.
For the blue partition: Train on all the points not in the blue partition. Find the test-set sum of errors on the blue points.
Then report the mean errorQuadratic Regression MSE3FOLD=1.11

Copyright © Andrew W. Moore Slide 34
k-fold Cross Validation
x
y
Randomly break the dataset into k partitions (in our example we’ll have k=3 partitions colored Red Green and Blue)
For the red partition: Train on all the points not in the red partition. Find the test-set sum of errors on the red points.
For the green partition: Train on all the points not in the green partition. Find the test-set sum of errors on the green points.
For the blue partition: Train on all the points not in the blue partition. Find the test-set sum of errors on the blue points.
Then report the mean errorJoint-the-dots MSE3FOLD=2.93

Copyright © Andrew W. Moore Slide 35
Which kind of Cross Validation?
Doesn’t waste dataExpensive. Has some weird behavior
Leave-one-out
Only wastes 10%. Only 10 times more expensive instead of R times.
Wastes 10% of the data. 10 times more expensive than test set
10-fold
Slightly better than test-set
Wastier than 10-fold. Expensivier than test set
3-fold
Identical to Leave-one-outR-fold
CheapVariance: unreliable estimate of future performance
Test-set
UpsideDownside

21
The bootstrapCV uses sampling without replacement
The same instance, once selected, can not beselected again for a particular training/test set
The bootstrap uses sampling withreplacement to form the training setSample a dataset of n instances n times with
replacement to form a new datasetof n instances
Use this data as the training setUse the instances from the original
dataset that don’t occur in the newtraining set for testing

22
The 0.632 bootstrap
Also called the 0.632 bootstrap A particular instance has a probability of
1–1/n of not being picked Thus its probability of ending up in the test
data is:
This means the training data will containapproximately 63.2% of the instances
368.01
11=!"
#
$%&
' ( (e
n
n

23
Estimating errorwith the bootstrap
The error estimate on the test data will bevery pessimistic Trained on just ~63% of the instances
Therefore, combine it with theresubstitution error:
The resubstitution error gets less weightthan the error on the test data
Repeat process several times with differentreplacement samples; average the results
instances traininginstancestest 368.0632.0 eeerr !+!=

Copyright © Andrew W. Moore Slide 37
CV-based Model Selection• We’re trying to decide which algorithm to use.• We train each machine and make a table…
f44f55f66
⌦f33f22f11
Choice10-FOLD-CV-ERRTRAINERRfii

Copyright © Andrew W. Moore Slide 39
CV-based Model Selection• Example: Choosing “k” for a k-nearest-neighbor regression.• Step 1: Compute LOOCV error for six different model
classes:
• Step 2: Whichever model class gave best CV score: train it with all the data, and that’s the predictive model you’ll use.
⌦K=4
K=5
K=6
K=3
K=2
K=1Choice10-fold-CV-ERRTRAINERRAlgorithm

7
Note on parameter tuning
It is important that the test data is notused in any way to create the classifier
Some learning schemes operate in twostages: Stage 1: build the basic structure Stage 2: optimize parameter settings
The test data can’t be used for parametertuning!
Proper procedure uses three sets: trainingdata, validation data, and test data Validation data is used to optimize parameters

Copyright © Andrew W. Moore Slide 45
⌦Quad reg’n
LWR, KW=0.1
LWR, KW=0.5
Linear Reg’n
10-NN
1-NNChoice10-fold-CV-ERRTRAINERRAlgorithm
CV-based Algorithm Choice• Example: Choosing which regression algorithm to use• Step 1: Compute 10-fold-CV error for six different model
classes:
• Step 2: Whichever algorithm gave best CV score: train it with all the data, and that’s the predictive model you’ll use.

Copyright © Andrew W. Moore Slide 52
Cross-validation for classification• Instead of computing the sum squared
errors on a test set, you should compute…

Copyright © Andrew W. Moore Slide 53
Cross-validation for classification• Instead of computing the sum squared
errors on a test set, you should compute…The total number of misclassifications on
a testset.

38
Counting the cost
In practice, different types of classificationerrors often incur different costs
Examples: Terrorist profiling
“Not a terrorist” correct 99.99% of the time
Loan decisions Oil-slick detection Fault diagnosis Promotional mailing

39
Counting the cost
The confusion matrix:
There many other types of cost!E.g.: cost of collecting training data
Actualclass True negativeFalse positiveNo
False negativeTrue positiveYes
NoYes
Predicted class

40
Lift charts
In practice, costs are rarely known Decisions are usually made by comparing
possible scenarios Example: promotional mailout to 1,000,000
households• Mail to all; 0.1% respond (1000)• Data mining tool identifies subset of 100,000
most promising, 0.4% of these respond (400)40% of responses for 10% of cost may pay off
• Identify subset of 400,000 most promising,0.2% respond (800)
A lift chart allows a visual comparison
41
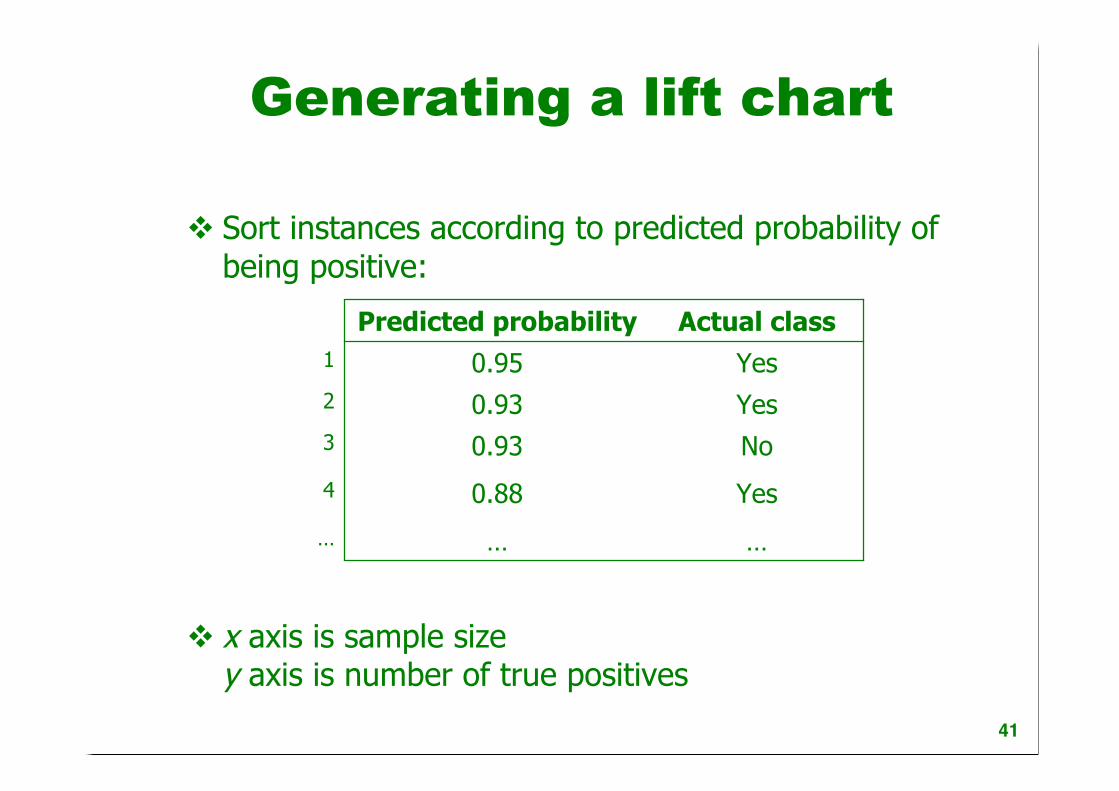
Generating a lift chart
Sort instances according to predicted probability ofbeing positive:
x axis is sample sizey axis is number of true positives
………
Yes0.884
No0.933
Yes0.932
Yes0.951
Actual classPredicted probability

42
A hypothetical lift chart
40% of responsesfor 10% of cost
80% of responsesfor 40% of cost

43
ROC curves
ROC curves are similar to lift charts Stands for “receiver operating characteristic” Used in signal detection to show tradeoff
between hit rate and false alarm rate overnoisy channel
Differences to lift chart: y axis shows percentage of true positives in
sample rather than absolute number
x axis shows percentage of false positives insample rather than sample size

44
A sample ROC curve
Jagged curve—one set of test data Smooth curve—use cross-validation

46
ROC curves for twoschemes
For a small, focused sample, use method A For a larger one, use method B In between, choose between A and B with appropriate probabilities

17
Precision and Recall
• typically used in document retrieval
• Precision:– how many of the returned documents are correct
– precision(threshold)
• Recall:– how many of the positives does the model return
– recall(threshold)
• Precision/Recall Curve: sweep thresholds

19