Embed Size (px)
Citation preview

Cross-National Patterns of Gender Differences in Mathematics:A Meta-Analysis
Nicole M. Else-QuestVillanova University
Janet Shibley HydeUniversity of Wisconsin—Madison
Marcia C. LinnUniversity of California, Berkeley
A gender gap in mathematics achievement persists in some nations but not in others. In light of theunderrepresentation of women in careers in science, technology, mathematics, and engineering, increas-ing research attention is being devoted to understanding gender differences in mathematics achievement,attitudes, and affect. The gender stratification hypothesis maintains that such gender differences areclosely related to cultural variations in opportunity structures for girls and women. We meta-analyzed 2major international data sets, the 2003 Trends in International Mathematics and Science Study and theProgramme for International Student Assessment, representing 493,495 students 14–16 years of age, toestimate the magnitude of gender differences in mathematics achievement, attitudes, and affect across 69nations throughout the world. Consistent with the gender similarities hypothesis, all of the mean effectsizes in mathematics achievement were very small (d � 0.15); however, national effect sizes showedconsiderable variability (ds � �0.42 to 0.40). Despite gender similarities in achievement, boys reportedmore positive math attitudes and affect (ds � 0.10 to 0.33); national effect sizes ranged from d � �0.61to 0.89. In contrast to those of previous tests of the gender stratification hypothesis, our results point tospecific domains of gender equity responsible for gender gaps in math. Gender equity in schoolenrollment, women’s share of research jobs, and women’s parliamentary representation were the mostpowerful predictors of cross-national variability in gender gaps in math. Results are situated within thecontext of existing research demonstrating apparently paradoxical effects of societal gender equity andhighlight the significance of increasing girls’ and women’s agency cross-nationally.
Keywords: gender differences, mathematics, gender equity, international data sets
The question of gender differences in mathematics achievement,attitudes, and affect is a continuing concern as scientists seek toaddress the underrepresentation of women at the highest levels ofscience, technology, mathematics, and engineering (STEM; Halp-ern et al., 2007; National Academy of Sciences, 2006). Stereotypesthat girls and women lack mathematical ability persist, despitemounting evidence of gender similarities in math achievement(Hedges & Nowell, 1995; Hyde, Fennema, & Lamon, 1990; Hyde,Lindberg, Linn, Ellis, & Williams, 2008). Because much of the
research on gender differences in math has been based on NorthAmerican samples, the current study aimed to examine the mag-nitude of gender differences in mathematics achievement,attitudes, and affect cross-nationally. Furthermore, some have pro-posed the gender stratification hypothesis, arguing that cross-national patterns of gender differences in math achievement reflectgender inequities in educational and economic opportunities avail-able in a given culture (Baker & Jones, 1993; Guiso, Monte,Sapienza, & Zingales, 2008; Riegle-Crumb, 2005). In the currentstudy, we meta-analyzed two large international data sets to ex-amine cross-national patterns of gender differences in mathematicsachievement, attitudes, and affect and assessed the links of thesepatterns to gender equity at the national level.
Gender Differences and Similarities in Mathematics
Stereotypes about female inferiority in mathematics (Bhana,2005; Fennema, Peterson, Carpenter, & Lubinski, 1990; Fennema& Sherman, 1977; Hyde, Fennema, Ryan, Frost, & Hopp, 1990;Li, 1999) stand in distinct contrast to the actual scientific datareported in previous studies. This discrepancy is particularly prob-lematic because such negative stereotypes can impair math testperformance and cause anxiety via stereotype threat (Blascovich,Spencer, Quinn, & Steele, 2001; Spencer, Steele, & Quinn, 1999).Reviewing evidence from research with infants and preschoolers,
Nicole M. Else-Quest, Department of Psychology, Villanova Univer-sity; Janet Shibley Hyde, Department of Psychology, University of Wis-consin—Madison; Marcia C. Linn, Graduate School of Education, Univer-sity of California, Berkeley.
Portions of these data were presented at the Gender DevelopmentResearch Conference, San Francisco, California, April 2008, as well as atthe meeting of the Society for Research in Child Development, Denver,Colorado, April 2009. This research was funded through National ScienceFoundation Grant REC 0635444. Any findings, conclusions, or recommen-dations expressed in this material are our own and do not necessarily reflectthe views of the National Science Foundation.
Correspondence concerning this article should be addressed to NicoleM. Else-Quest, Villanova University, Department of Psychology, 800Lancaster Avenue, Villanova, PA 19085. E-mail: [email protected]
Psychological Bulletin © 2010 American Psychological Association2010, Vol. 136, No. 1, 103–127 0033-2909/10/$12.00 DOI: 10.1037/a0018053
103

Spelke (2005) concluded that gender similarities are the rule in thedevelopment of early number concepts. Girls earn better grades inmathematics courses through the end of high school (Dwyer &Johnson, 1997; Kenney-Benson, Pomerantz, Ryan, & Patrick,2006; Kimball, 1989).
In the United States, gender differences in mathematics perfor-mance are declining. A meta-analysis in 1990 (Hyde, Fennema, &Lamon., 1990) found an effect size of d � �0.05 for the genderdifference in math performance among the general population,indicating a negligible female advantage (note that positive valuesof d represent higher scores for males than females, whereasnegative values represent higher scores for females). At that timethe gender gap increased during high school. Another meta-analysis used data sets representing large probability samples ofAmerican adolescents and found d � 0.03 to 0.26 across thedifferent data sets (Hedges & Nowell, 1995). More recent dataindicate that the gender difference in math achievement has beeneliminated. A study of statewide mathematics tests administeredbetween 2005 and 2007 for Grades 2–11 found d � 0.0065,without the increased gender gap in adolescence found with earlierdata (Hyde et al., 2008). These findings, for U.S. samples, areconsistent with the gender similarities hypothesis, which maintainsthat males and females are similar on most, but not all, psycho-logical variables (Hyde, 2005).
For the United States, meta-analytic studies of gender differ-ences in attitudes and affect toward mathematics demonstrate thatmales tend to hold more positive attitudes about math, though thegap is small (Hyde, Fennema, Ryan, et al., 1990). Hyde et al.(1990) found that, developmentally, the gap widens during highschool, when males report greater self-confidence (d � 0.25).Gender differences in math anxiety and self-concept have receivedconsiderable research attention, with girls tending to report higheranxiety and lower self-concept about their math abilities (Casey,Nuttall, & Pezaris, 1997; Fredricks & Eccles, 2002; Hyde, Fen-nema, Ryan, et al., 1990; McGraw, Lubienski, & Strutchens, 2006;Meece, Wigfield, & Eccles, 1990; Pajares & Miller, 1994); yet,these effects tend to be small to medium in magnitude. Althoughcross-cultural research has demonstrated similar findings (Stet-senko, Little, Gordeeva, Grasshof, & Oettingen, 2000), most ofthese reports have been based on North American samples; thus, itis unclear if these patterns of gender differences are generalizableto other cultures. Therefore, a focus in this paper is to estimate themagnitude of gender differences in math achievement, attitudes,and affect across two international data sets totaling 69 nations.
Others have focused not on mean gender differences but ongender differences in the upper tail of the distribution and thegreater male variability hypothesis (Hyde & Mertz, 2009). Theargument is that greater variance in test scores is displayed bymales than females, so that, even if there is no average genderdifference, there will still be more males among the very topperformers. One statistic used to test this hypothesis is the varianceratio, VR, or the male variance divided by the female variance.Analysis of variance ratios in cross-national data (using the 2003cycle of the Programme for International Student Assessment, orPISA) indicates that males are sometimes more variable, althoughthe variance ratios do not indicate widely divergent differences(Hyde & Mertz, 2009; Machin & Pekkarinen, 2008). For example,VR equals 1.19 for the United States and 1.06 for the UnitedKingdom. However, other countries display variance ratios that do
not differ significantly from 1.0 or are even significantly less than1.0. For example, VR equals 0.99 for Denmark and 0.95 forIndonesia. Thus, despite some claims (Machin & Pekkarinen,2008), the phenomenon of greater male variance in mathematicsperformance is not universal (Penner, 2008). Another method oftesting the greater male variability hypothesis is to examine meangender differences in achievement on assessments of varying dif-ficulty level. That is, if males are overrepresented in the upper tailsof the distribution, gender differences in achievement should belarger on difficult or complex problems than on easy or moderateproblems. Although Hyde, Fennema, and Lamon’s (1990) meta-analysis showed that males outperformed females in complexproblem solving by d � 0.29 in high school, recent data suggestthat this gap has closed. In their analyses of gender differences onthe math portion of the National Assessment of EducationalProgress, Hyde et al. (2008) found that gender differences were notlarger on the most challenging problems. This finding providedlittle support for the argument that males outperform females incomplex problem solving.
Assessing Mathematics Achievement, Attitudes, andAffect Cross-Nationally
Efforts to measure the mathematics achievement, attitudes, andaffect of students cross-nationally have produced two large-scalerecurring assessments, the Trends in International Mathematicsand Science Study (TIMSS) and PISA. TIMSS is an internationalassessment of mathematics and science learning in eighth graders,conducted on a 4-year cycle by the International Association forthe Evaluation of International Achievement (IEA), in collabora-tion with Statistics Canada and the Educational Testing Service.PISA is an international assessment of mathematics, reading, sci-ence, and problem-solving literacy in 15-year-olds, conducted on a3-year cycle by the Organisation for Economic Co-operation andDevelopment (OECD). The current study uses data from the 2003round of TIMSS (Mullis, Martin, Gonzalez, & Chrostowski, 2004)and PISA (OECD, 2004). With regard to issues such as measure-ment and sampling, in light of the complex methodological issuesinvolved in analyzing cross-national surveys of student achieve-ment, experts regard the TIMSS and PISA data sets as high-quality(e.g., Porter & Gamoran, 2002). Nonetheless, it is important tonote the differences between these two oft-cited data sets, as wellas to acknowledge any limitations.
At the outset, it is important to recognize that TIMSS and PISAhave explicitly different goals. TIMSS focuses on assessing theattained curriculum, or what students have learned in the class-room, as well as teacher- and school-level variables. In contrast,OECD emphasizes that the PISA test of mathematics assessesmathematics literacy, which is defined as “the capacity to identifyand understand the role that mathematics plays in the world, tomake well-founded judgments and to use and engage with math-ematics in ways that meet the needs of that individual’s life as aconstructive, concerned and reflective citizen” (OECD, 2004, p.26). In light of these differing aims, one can expect TIMSS to bemore curriculum-based and PISA to be more applied. The impli-cation that this distinction has for comparing results from the datasets is that PISA may be a more challenging assessment requiringa deeper understanding of mathematics.
104 ELSE-QUEST, HYDE, AND LINN

The quality of any academic achievement assessment is partlydetermined by the depth of knowledge (DoK) or degree of diffi-culty assessed with its items. Ideally, a standardized indicator ofDoK would be applied to TIMSS and PISA to determine whetherone assessment is more challenging than the other. Because theIEA and OECD do not release to the public the full batteries ofTIMSS and PISA items, respectively, it is not possible to code theDoK assessed by the test items on both assessments. However,both the IEA and OECD attempt to address this concern with theirown respective coding scheme. The IEA classifies TIMSS itemsinto three “cognitive domains,” which reflect the complexity ofcognitive processes required for those items (International Asso-ciation for the Evaluation of International Achievement [IEA],2007). Items in the Knowing Facts, Procedures, and Conceptsdomain make up 33.5% of the TIMSS items; they require recall offacts, procedures, and mathematical concepts; computation; rec-ognition and identification of mathematical equivalence; and useof mathematics and measuring instruments. For example, “If x ��3, what is the value of �3x?” The Applying Knowledge andUnderstanding domain entails the application of mathematicalknowledge of facts, skills, procedures, and concepts to createrepresentations and solve routine problems. For example, “Jackwants to find how far an airplane will travel in 3.5 hours at its topspeed of 965 kph. He uses his calculator to multiply 3.5 by 965 andtells his friend Jenny that the answer is 33,775 km. Jenny says ‘thatcan’t be right.’ How does she know?” This domain represents thelargest component of the assessment and includes 43.9% of theitems. At the deepest level is the Reasoning domain, which con-stitutes 18.6% of the items. It requires logical, systematic thinking,such as the ability to hypothesize, analyze, evaluate, generalize,synthesize, and prove, as well as nonroutine problem solving. Forexample, “Twin primes are prime numbers with one other numberbetween them. Thus, 5 and 7, 11 and 13, and 17 and 19 are pairsof twin primes. Make a conjecture about the numbers between twinprimes.” Based on the breakdown of items within each cognitivedomain, an emphasis in the TIMSS on basic knowledge androutine problem-solving is evident.
OECD attempts to address the DoK issue by classifying PISAmath items into three “competency clusters,” which are based onthe cognitive processes used to complete the items (OECD, 2003).Items in the Reproduction cluster make up 31% of the assessmentand involve recall of facts, recognition of equivalents, manipula-tion of expressions, routine procedures, computations, and appli-cation of standard algorithms and skills. For example, “Write 69%as a fraction.” The Connections cluster represents nearly half of thePISA math test (47%) and involves solving nonroutine problems infamiliar or quasifamiliar situations. For example, “A pizzeriaserves two round pizzas of the same thickness in different sizes.The smaller one has a diameter of 30 cm and costs 30 zeds. Thelarger one has a diameter of 40 cm and costs 40 zeds. Which pizzais better value for money? Show your reasoning.” The third clus-ter, Reflection, comprises 22% of the items and involves advancedreasoning, insight, and creativity, requiring students to plan andimplement problem-solving strategies. For example, students areshown a graph modeling combined fish growth (in kilograms) overtime (in years); the item states “Suppose a fisherman plans to waita number of years and then start catching fish from the waterway.How many years should the fisherman wait if he or she wishes tomaximize the number of fish he or she can catch annually from
that year on? Provide an argument to support your answer.” Anemphasis in the PISA on more challenging and complex mathe-matics is evident from the breakdown of items within each cog-nitive cluster. Thus, it may be surmised that PISA is a morechallenging mathematics assessment than is TIMSS. Previous re-ports have suggested that gender differences in mathematics ap-pear only at the level of complex problem solving (Hyde, Fen-nema, & Lamon, 1990), and the greater male variability hypothesispredicts larger gender differences in more challenging mathemat-ics assessments. Thus, this apparent difference in DoK accessed onthe two assessments might foreshadow larger gender differenceson PISA than on TIMSS, as would be consistent with the greatermale variability hypothesis.
In terms of samples, PISA differs from TIMSS insofar as it isbased on age (15 years 3 months to 16 years 2 months) ratherthan grade level. Because the majority of nations begin formalschooling at age 6, most of the eighth graders assessed inTIMSS were between 14 and 15 years of age, approximatelyone year younger than those in the PISA sample. The develop-mental importance of this age difference in samples is unclear.Although previous reports have demonstrated a widening of thegender gap in math achievement and attitudes during this de-velopmental period (Hyde, Fennema, & Lamon, 1990; Hyde,Fennema, Ryan, et al., 1990), recent data suggest that the gaphas closed (Hyde et al., 2008). Regardless, students of this agerange (14 –16 years) are old enough to be capable of complexmathematical problem solving.
Both TIMSS and PISA hold participating nations to strict stan-dards in terms of sampling and test administration. This providesconfidence in the reliability and quality the data. Yet, these stan-dards incur major costs on the nations that participate in thesevoluntary assessments (Hutchison & Schagen, 2007); thus, nationsmust have organized formal schooling systems and enjoy a certainlevel of prosperity in order to participate. None of the nations inthe TIMSS or PISA data sets are characterized as low in humandevelopment (i.e., having a Human Development Index, or HDI, ofless than 0.50), according to the1995 Human Development Report(UN Development Programme, 2003). Instead, over half of thenations included in TIMSS and 84% of the nations in PISA samplewere characterized as high in human development in 2003. It isnoteworthy that TIMSS represents a more diverse and less devel-oped sample of nations than does PISA, as the PISA samplereflects membership in the OECD. The overrepresentation of de-veloped nations in the TIMSS and PISA samples is a limitationthat is difficult to overcome with international academic achieve-ment assessments.
In sum, TIMSS and PISA differ somewhat with regard to thesample age and level of development and the difficulty level ofthe test items. These differences could be reflected in thefindings of the current study, insofar as results from TIMSS andPISA may vary. Insofar as the greater male variability hypoth-esis maintains that males should be overrepresented at the uppertails of the distribution in mathematics ability, a male advantagein the most difficult math problems should exist. Thus, if thegreater male variability hypothesis is valid, we would expectlarger gender differences in more challenging assessments ofmath achievement, such as PISA, or on problems assessingdeeper levels of processing, such as the TIMSS cognitive do-main of Reasoning.
105GENDER DIFFERENCES IN MATH

Theoretical Framework
What factors might contribute to gender differences or similar-ities in math achievement, attitudes, and affect? Dozens of expla-nations have been proposed, including hormones and prenatalbrain differentiation, stereotype threat, and other factors (Byrnes,2005; Ceci & Williams, 2007; Halpern et al., 2007). Of primaryinterest here is a sociological hypothesis proposed by Baker andJones (1993), who argued that girls’ poorer math achievement andmore negative math attitudes are the result of societal genderstratification. The gender stratification hypothesis proposes that inpatriarchal cultures, male students link their achievement to futureopportunities and outcomes. As a result of the decreased opportu-nities afforded to females, girls do not perceive such a link andthus do not achieve as boys do in domains that they perceive to beless useful. Baker and Jones (1993) argued that
female students, who are faced with less opportunity, may see math-ematics as less important for their future and are told so in a numberof ways by teachers, parents, and friends. In short, opportunity struc-tures can shape numerous socialization processes that shape perfor-mance. (p. 92)
Broadly, the gender stratification hypothesis proposes that, wherethere is more societal stratification based on gender, and thus moreinequality of opportunity, girls will report less positive attitudesand more negative affect and will perform less well on mathemat-ics achievement tests than will their male peers. Yet, where thereis greater gender equity, gender similarities in math will be evi-dent.
Three theoretical approaches within psychology provide someinsight into socialization processes that might account for theeffects proposed by the gender stratification hypothesis. Eccles andher colleagues (e.g., Eccles, 1994; Jacobs, Davis-Kean, Bleeker,Eccles, & Malanchuk, 2005; Meece, Eccles-Parsons, Kaczala,Goff, & Futterman, 1982) have proposed and tested anexpectancy-value theoretical model to explain the gender gap inmathematics achievement, attitudes, and affect and the underrep-resentation of women in careers in science and engineering. Ac-cording to the Eccles model, people do not undertake a challengeunless they value it and have some expectation of success. Per-ceptions of the value of the task (e.g., taking a challenging math-ematics course) are shaped by the cultural milieu (e.g., gendersegregation of occupations, cultural stereotypes about the subjectmatter) and the person’s short-term and long-term goals (e.g.,becoming an elementary school teacher and thinking one does notneed advanced mathematics or becoming a civil engineer andknowing that one does). Expectations of success are shaped bythe person’s aptitude, relevant past events such as grades in thesubject and scores on standardized tests, the person’s interpre-tations of and attributions for these events, and the person’sself-concept of ability. Sociocultural forces such as parents’ andteachers’ attitudes and expectations, including stereotypes, alsoshape self-concept and attitudes toward the subject; empiricalresearch on the awareness of negative stereotypes supports thislink (Aronson & McGlone, 2008; Pinel, 1999). According to theexpectancy-value model, if a girl believes that the career oppor-tunities available to or appropriate for women do not requiremathematics skills, she is less likely to invest in developing hermathematics skills by working hard in her required math courses
or by taking elective math courses. She may see math as less usefulor valuable and may think she is not capable of doing math. Thetheory has received abundant empirical support (e.g., Eccles, 1994;Frome & Eccles, 1998) and provides a clear model for whycultural inequities in educational or career opportunities have anadverse impact on girls and women considering STEM careers.Eccles’s (1994) expectancy-value theoretical model is consistentwith the gender stratification hypothesis in maintaining that indi-viduals do not engage in tasks that are perceived to have littlevalue and arguing that individuals make cost–benefit judgmentsregarding their academic choices.
Another psychological theory that is consistent with the genderstratification hypothesis is cognitive social learning theory (Ban-dura, 1986; Bussey & Bandura, 1999), which maintains that anumber of social processes contribute to the development ofgender-typed behavior, including reinforcements, modeling, andcognitive processes, such as self-efficacy. Role models and social-izing agents, as well as perceptions of gender-appropriate behav-ior, have an important influence on an individual’s academicchoices. As with Eccles’s model, this theory also emphasizes therole of self-efficacy in gender-typed behaviors, such as choosing tomajor in physics. This theory maintains that girls are attentive tothe behaviors that women in their culture engage in and thus feelefficacious in and model those behaviors. That is, if girls observethat women in their culture do not become engineers or scientists,they may believe that such careers (and, by extension, STEMsubjects) are outside the realm of possibilities for girls and feelanxious about and/or avoid these subjects. In emphasizing the rolesof observational learning and the internalization of cultural norms,cognitive social learning theory provides an individual-level ex-planation of why girls and women make gendered educational andvocational choices that recapitulate societal-level gender stratifi-cation.
Social structural theory (sometimes referred to as social roletheory; Eagly, 1987; Eagly & Wood, 1999) is another relevantpsychological theory in that it maintains that psychological genderdifferences are rooted in sociocultural factors, such as the gendereddivision of labor. A society’s gendered division of labor fosters thedevelopment of gender differences in behavior by affording dif-ferent restrictions and opportunities to males and females on thebasis of their social roles. Accordingly, if girls are expected to carefor younger siblings or prepare meals rather than learn algebra,their access to formal schooling may be limited. Eagly and Wood’s(1999) cross-cultural analyses tend to support social structuraltheory, demonstrating substantial correlations between compositeindicators of gender equity and gender differences in mate prefer-ences (including earning capacity, domestic skills, and age). Al-though Eagly and Wood did not analyze gender differences inmathematics, social structural theory can be applied to access tomathematics education. That is, if the cultural roles that womenfulfill do not include math, girls may face both structural obstacles(e.g., formal access to education is limited to boys) and socialobstacles (e.g., stereotypes that math is a male domain) that im-pede their mathematical development. According to social struc-tural theory, across nations, gender equity in educational andemployment opportunities should be associated with gender sim-ilarities in mathematics achievement, attitudes, and affect.
106 ELSE-QUEST, HYDE, AND LINN

Previous Tests of the Gender Stratification Hypothesis
To test the gender stratification hypothesis, Baker and Jones(1993) used cross-national data from the Second InternationalMathematics Study (SIMS; an early precursor to TIMSS), whichadministered the same mathematics test to a representative sampleof 13-year-old students in each of 19 countries around the globe in1982. Using United Nations Development Programme (UNDP)data, Baker and Jones constructed several variables measuringgender equity in the countries (e.g., percentage of females inhigher education and percentage of females in the labor force).They then computed correlations between the magnitude of genderdifferences in mathematics achievement and each of the genderinequality variables, essentially testing whether gender equitymoderated the gender difference in math performance on theSIMS. Their results showed that boys significantly outperformedgirls in seven of the 19 nations and that girls significantly outper-formed boys in four. There were no significant gender differencesin the remaining eight nations. Baker and Jones also found supportfor the gender stratification hypothesis; a smaller gender gap inmath was significantly correlated with greater women’s labor forceparticipation, the percentage of women in higher education, andthe percentage of women working in the industrial and serviceeconomic sectors. Gender occupational segregation, the ratio ofwomen in university–nonuniversity programs, and the percentageof women working in the agricultural economic sector were notsignificantly correlated with the gender gap in math performancebut were significantly correlated with perceived parental encour-agement for math achievement. Although these findings provideevidence of cultural influence—specifically, the importance ofequal opportunity in a culture—they are limited by several meth-odological constraints.
The SIMS is now more than 26 years old, and international mathassessments have improved greatly since then in terms of itemsand administration (Mullis & Martin, 2007). The sample of nationsparticipating in the SIMS was primarily limited to developednations, in which there tends to be relatively greater gender equity(Hausmann, Tyson, & Zahidi, 2007; UN Development Programme[UNDP], 1995; but see Riegle-Crumb, 2005, for an opposingview). What do analyses with more recent data suggest about thegender stratification hypothesis?
Riegle-Crumb (2005) used cross-national data from the ThirdInternational Mathematics and Science Study (TIMSS-1995) totest the gender stratification hypothesis. An update to the SIMSand precursor to the TIMSS 2003 used in the current study,TIMSS-1995 included more than twice as many countries as didthe 1982 SIMS assessment. Riegle-Crumb argued that, when girlswitness a lack of women in power, the status quo in genderinequality is maintained by limiting their expectations of successand achievement. To measure gender equity in the domains oflabor force and government representation, Riegle-Crumb usedvariables similar to those used by Baker and Jones and addedmeasures to assess gender equity in the home and family (indicatedby fertility rate and availability of legal abortion). Her analysesdemonstrated that boys outperformed girls in 80% of the nationssampled. In addition, although greater female representation innational governments predicted a smaller gender difference inmath achievement, women’s economic development and relativestatus in the home and family did not significantly predict the
gender gap in math achievement. These findings indicate that thepicture is more complex than first theorized. They provide mixedsupport for the gender stratification hypothesis, suggesting thatspecific domains of gender equity are important in understandinghow societal gender inequities are linked to the gender gap in mathperformance.
In a more widely publicized report, Guiso et al. (2008) tested thegender stratification hypothesis using different indicators of bothmath achievement and gender equity than those Baker and Jonesand Riegle-Crumb had used in their studies. To measure the gendergap in math performance, Guiso et al. used the 2003 PISA data. Toassess gender equity, they used the World Economic Forum’sGender Gap Index (GGI; Hausmann et al., 2007), a compositeindicator that includes many of the social, economic, and politicalvariables used by both Baker and Jones (1993) and Riegle-Crumb(2005). Guiso et al. found that girls’ performance was, on average,only 2% lower than boys’ performance. Their analyses supportedthe gender stratification hypothesis in that the GGI significantlypredicted the magnitude of the (albeit small) gender gap in mathperformance. In addition, analyses of genetic distance suggestedthat biological differences across countries could not explain thecross-national pattern of gender differences in math performance.Although this study suggests that a multidimensional indicator ofgender equity is a good predictor of gender differences in math testscores, it does not shed light on the specific domains of genderequity that are most relevant to math achievement and leaves thedebate about the mechanisms of the gender stratification hypoth-esis unresolved.
Several studies have assessed the gender stratification hy-pothesis with regard to greater male variability, though withsomewhat conflicting findings. Machin and Pekkarinen (2008),using 2003 PISA data, found no correlation between VR inmath achievement and national gender equity. In contrast, Hydeand Mertz (2009) used PISA 2003 data and found a negativecorrelation between gender equity and the ratio of males tofemales scoring above the 95th percentile on the 2003 PISA.Similarly, Penner (2008) used TIMSS-1995 data and found thatthe proportion of girls scoring above the 95th percentile waslinked to national gender equity.
Considered together, the results of previous tests of thegender stratification hypothesis indicate the need for severalmethodological revisions. With regard to cross-national pat-terns of gender differences in math achievement, it must first bedemonstrated that a gap still exists. There is increasing agree-ment among researchers that the gender difference in mathperformance is very small in some nations, such as the UnitedStates (Hedges & Nowell, 1995; Hyde, Fennema, & Lamon,1990; Hyde et al., 2008); however, it is unclear to what extentthis gender gap varies across countries. Similarly, the extent ofcross-national variations in gender differences in math attitudesand affect is not well understood, despite their links to mathachievement (e.g., Bandura, Barbaranelli, Caprara, & Pastorelli,2001; Eccles, 1994). Also, the sample of nations included in theanalyses should be maximized, as occurs in the more recentcross-national assessments. Use of multiple cross-national as-sessments of math achievement would ensure a more reliableand thorough test of the gender stratification hypothesis.
107GENDER DIFFERENCES IN MATH

Defining Gender Equity
In terms of assessing gender equity across nations, these find-ings point to the importance of how gender equity is defined andmeasured in the context of predicting gaps in math achievement,attitudes, and affect. Various composite indicators of nationalgender equity have been developed, though there is controversyregarding their use and relative strengths. Table 1 lists the mostwidely used composite indicators, their components, and limita-tions. It is noteworthy that one of the most widely used indices, theGender Development Index (GDI; UNDP, 1995), is not actually anindicator of gender equity per se. The GDI, which was firstpublished in the 1995 Human Development Report (HDR 1995)focusing on women’s empowerment, has been and continues to bemisconstrued as an indicator of national gender equity and misusedas such in a variety of popular press and academic publications(Schuler, 2006). For example, Eagly and Wood (1999) as well asSchmitt, Realo, Voracek, and Allik (2008) used the GDI, amongother indicators, as a measure of gender equality in their analyses.In fact, the GDI is an indicator of human development that isdiscounted for gender inequity. Also developed by the UNDP forHDR 1995, the Gender Empowerment Measure (GEM) assessesnational gender equity in political, health, and economic domains.Although the GEM is perhaps the most widely used compositeindicator, its utility is limited by its omission of gender equity ineducation, which is of particular relevance for the current study.
In response to the challenge of measuring societal or nationalgender equity, social scientists have developed several compositeindices, including the Gender Equality Index (GEQ; White, 1997),the Standardized Index of Gender Equality (SIGE; Dijkstra, 2002),and the GGI used by Guiso et al. (2008). Like the GEM, these
types of composite indices typically are computed using male-to-female ratios in a variety of domains, such as health (e.g., lifeexpectancy and legal access to elective abortion), education (e.g.,enrollment ratios and literacy rates), economics (e.g., earned in-come, economic activity rates, labor market participation), andpolitics (e.g., proportion of parliamentary seats held by women),with some domains being weighted more than others (Dijkstra,2006). Because these composite indices are each computed differ-ently, reflecting some domains more than or instead of others, theirpredictive validity also varies.
Some aspects of gender equity may be more germane to mathachievement than others; for example, equal access to formalschooling (at all levels) surely has a profound impact on girls’math skills, but women’s greater life expectancy is probably lessrelevant. A cross-national measure of women’s involvement inSTEM careers would test the gender stratification hypothesis moredirectly. Thus, indicators in multiple individual domains germaneto math achievement, attitudes, and affect—including educational,economic, and political—as well as composite measures (e.g.,GEQ, SIGE, GGI, GEM) should be used to provide the broadesttest of the gender stratification hypothesis. This approach wouldalso indicate the societal domains with the strongest links to thegender gap in math, thus providing insight into the mechanisms inquestion.
The Current Study
There were two major goals in the current study. The first wasto use meta-analysis to estimate the magnitude of gender differ-ences in mathematics achievement, attitudes, and affect using themost recent data from TIMSS and PISA. Because recent research
Table 1Composite and Domain-Specific Indicators of Societal Gender Equity
Indicator type Description
CompositeGender Empowerment Measure (GEM) Includes women’s and men’s percentage shares of parliamentary seats; positions as legislators,
senior officials, and managers; and professional and technical positions; includes women’sand men’s estimated earned income; omits education domain
Gender Equality Index (GEQ) Assesses underlying gender equality in Gender Development Index (GDI); calculated as GDI/HDI; omits political domain
Standardized Index of Gender Equality (SIGE) Includes relative female-to-male access to education, life expectancy, economic activity rate;women’s share in higher labor market occupations; women’s share in parliamentary seats;weights economic domain heavily
Gender Gap Index (GGI) Composed of four subindices based on economic participation and opportunity, educationalattainment, political empowerment, and health/survival
Domain-specificPrimary enrollment ratio % of female population of official school age enrolled in primary education/% of male
population of official school age enrolled in primary educationSecondary enrollment ratio % of female population of official school age enrolled in secondary education/% of male
population of official school age enrolled in secondary educationTertiary enrollment ratio % of female population of official school age enrolled in tertiary education/% of male
population of official school age enrolled in tertiary educationEconomic activity rate ratio the ratio of the proportion of females age 15 or older who supply or are available to supply
labor for the production of goods and services to the proportion of males age 15 or olderwho supply or are available to supply labor for the production of goods and services
Women’s share of higher labor market positions % of higher labor market positions (technical and professional, as well as administrative andmanagement positions) held by women
Women’s share of research positions % of research positions (according to International Labour Organization, 1990) held by womenWomen’s share of parliamentary seats % of parliamentary seats held by women
Note. For all indicators, higher values indicate higher status of women. HDI � Human Development Index.
108 ELSE-QUEST, HYDE, AND LINN

with North American samples has indicated little evidence ofgender differences in math achievement, and as consistent with thegender similarities hypothesis, we predicted that the data wouldshow a pattern of gender similarities in math achievement in manynations. However, because TIMSS and PISA appear to differ in thedifficulty level of the items, it was expected that mean effect sizesfrom PISA would be slightly larger than those found with TIMSS.On the basis of previous findings in math attitudes and affect, wepredicted that males would show more positive math attitudes andaffect. We also predicted that there would be variability in thedirection and magnitude of gender differences in math achieve-ment, attitude, and affect across nations.
The second goal in the current study was to explain cross-national variability in these gender differences, using the mostrecent data from two international data sets (TIMSS and PISA),expanding upon the findings of Baker and Jones (1993), Riegle-Crumb (2005), and Guiso et al. (2008), and testing the genderstratification hypothesis. Our study improves upon those reportsinsofar as it includes data that (a) are from the most recent yearsavailable; (b) are from a larger sample of nations; (c) are from twointernational studies; (d) assess gender differences in math atti-tudes and affect in addition to achievement; and (e) reflect multipledomains of societal gender equity. This study is therefore wellpositioned to provide powerful clues regarding the cultural factorsassociated with narrowing or perhaps reversing the gender gaps inmathematics achievement, attitudes, and affect. We hypothesizedthat global composite indicators of societal gender equity (includ-ing GEM, GEQ, SIGE, and GGI) would explain the cross-nationalvariation in the math gender gap. To focus on specific mecha-nisms, we predicted that indicators from domains most germane tomathematics achievement, attitudes, and affect would be the mostrobust moderators of the gender gap; these indicators includewomen’s representation in scientific research, technical/professional, and administrative/management jobs, as well as girls’access to primary, secondary, and tertiary education. It was ex-pected that indicators that most directly and closely reflect themechanisms specified by theoretical models such as Eccles’sexpectancy-value theory, Bandura’s social cognitive theory, andEagly and Wood’s social structural theory would be the bestpredictors of gender differences in math. For example, the indica-tor of women’s share of research positions was expected to be thestrongest predictor of the gender gap in math because it measureswomen’s STEM representation, which signifies the STEM-relatedopportunity structures available to girls and women. Indicators ofsocietal gender equity that seem less directly related (but stillrelevant) to girls’ and women’s opportunities in STEM—such asparliamentary representation—were expected to be less robustpredictors of gender differences in math achievement, attitudes,and affect.
Method
International Data Sets of Mathematics Achievement,Attitudes, and Affect
TIMSS 2003. TIMSS 2003 was conducted in 49 countries,although two (Syrian Arab Republic and Yemen) were excludedbecause of sampling problems; in addition, the data from onenation (Argentina) were not available for the final TIMSS report
(Mullis et al., 2004). The TIMSS data used in the meta-analysis arefrom the remaining 46 countries and represent the achievement,attitudes, and affect of 219,612 students. Countries and their sam-ple sizes appear in Table 2.
Achievement. To assess mathematics achievement, TIMSS2003 included five content domains in addition to a Math com-posite, which comprises the five content domains; these contentdomains are Number, Algebra, Measurement, Geometry, and Data.The Number content domain includes whole numbers, fractions,decimals, integers, ratios, proportion, and percentages. The contentdomain of Algebra assesses understanding of patterns, algebraicexpressions, equations and formulas, and relationships. Measure-ment includes the topics of attributes and units and tools, tech-niques, and formulas. The Geometry content domain assessesknowledge of lines and angles, two- and three-dimensional shapes,congruence and similarity, locations and spatial relationships, andsymmetry and transformations. The Data domain includes thetopics of data collection and organization, data representation, datainterpretation, and uncertainty and probability. As described in theIntroduction, TIMSS items fall into three cognitive domains(Knowing, Applying, and Reasoning). Gender differences in thesethree cognitive domains appear in Mullis, Martin, and Foy (2005)and are meta-analyzed in the current study.
Attitudes and affect. In addition to assessing achievement,TIMSS administered two scales of students’ math attitudes andaffect (Martin, Mullis, & Chrostowski, 2004). The first scale,Self-Confidence in Mathematics, is based on the mean of fouritems with which students rate their agreement (e.g., “I learn thingsquickly in mathematics”). The second scale, Students’ ValuingMathematics, is composed of the mean of seven items with whichstudents rate their agreement (e.g., “I need to do well in mathe-matics to get the job I want”). Effect sizes for gender differencesin achievement and attitudes on the TIMSS appear in Table 2.
PISA 2003. PISA 2003 included 41 countries and representedthe achievement, attitudes, and affect of 273,883 students. Thecurrent study meta-analyzed findings from the 2003 assessmentbecause it focused predominantly on mathematics. Countries andtheir sample sizes are displayed in Table 2.
Achievement. The mathematics section of PISA includes fourcontent domains in addition to a Math composite that comprisesthe content domains; these content domains are Quantity, Space/Shape, Change/Relationships, and Uncertainty. The Quantity con-tent domain assesses understanding of numeric phenomena, quan-titative relationships, and patterns; it is somewhat comparable tothe TIMSS content domain of Number. The content domain ofSpace/Shape assesses understanding of spatial and geometric phe-nomena and relationships; it is somewhat comparable to theTIMSS content domain of Geometry. The Change/Relationshipscontent domain assesses understanding of mathematical manifes-tations of change, functional relationships, and dependency amongvariables; it is to some extent comparable to the TIMSS contentdomain of Algebra. The content domain of Uncertainty assessesunderstanding of probabilities and statistics; this content domain issomewhat comparable to the TIMSS domain of Data.
Attitudes and affect. PISA assessed attitudes and affect aboutmathematics with five scales (OECD, 2003). Extrinsic Motivationis based on the mean of four items; students rated their agreementwith statements such as “I will learn many things in Mathematicsthat will help me get a job.” Intrinsic Motivation is composed of
109GENDER DIFFERENCES IN MATH

Table 2Sample Sizes and Unweighted Effect Sizes (d) for Gender Differences in Math Achievement, Attitudes, and Affect, by Nation
Nation
TIMSS
NF NM Math Algebra Data Geometry Measurement Number SCM VM
Armenia 3,035 2,691 �0.12 �0.16 �0.14 �0.13 �0.01 �0.13 0.04 0.18Australia 2,443 2,348 0.15 0.06 0.12 0.15 0.18 0.20 0.19 0.17Austria b b b b b b b b b b
Bahrain 2,100 2,100 �0.42 �0.55 �0.36 �0.43 �0.13 �0.28 �0.12 0.11Belgium 2,684 2,286 0.14 0.07 0.15 0.14 0.18 0.22 0.25 0.38Botswana 2,627 2,524 �0.04 �0.14 �0.01 0.17 0.04 �0.12 0.10 �0.12Brazil b b b b b b b b b b
Bulgaria 1,976 2,141 0.01 �0.10 0.09 0.04 0.03 �0.01 0.21 0.07Canada b b b b b b b b b b
Chile 3,061 3,316 0.18 0.10 0.16 0.19 0.28 0.20 0.29 0.19Chinese Taipei 2,582 2,797 �0.07 �0.12 �0.05 �0.13 0.03 �0.06 0.25 0.20Cyprus 1,961 2,041 �0.19 �0.31 �0.19 �0.17 �0.09 �0.17 �0.03 0.00Czech Republic b b b b b b b b b b
Denmark b b b b b b b b b b
Egypt 3,264 3,831 �0.01 �0.10 0.01 0.02 0.10 0.01 0.22 0.12England 1,415 1,415 �0.01 �0.05 0.00 0.05 0.03 0.03 0.32 0.23Estonia 2,020 2,020 �0.03 �0.02 �0.08 0.02 �0.05 �0.07 �0.06 �0.02Finland b b b b b b b b b b
France b b b b b b b b b b
Germany b b b b b b b b b b
Ghana 2,295 2,805 0.19 0.12 0.13 0.33 0.11 0.13 0.20 �0.04Greece b b b b b b b b b b
Hong Kong 2,486 2,486 �0.03 �0.06 �0.06 0.03 0.03 �0.03 0.43 0.19Hungary 1,651 1,651 0.09 �0.04 0.06 0.14 0.19 0.11 0.15 0.11Iceland b b b b b b b b b b
Indonesia 2,881 2,881 �0.01 �0.09 0.04 0.12 0.00 �0.07 0.11 �0.07Iran, Islamic Republic of 1,977 2,965 �0.12 �0.38 �0.05 �0.19 0.11 �0.08 0.10 0.10Ireland b b b b b b b b b b
Israel 2,245 2,073 0.09 �0.03 0.12 0.01 0.18 0.13 0.15 0.19Italy 2,139 2,139 0.06 �0.04 0.15 0.07 0.15 0.08 0.18 0.27Japan 2,379 2,477 0.03 �0.05 0.07 �0.04 0.00 0.07 0.38 0.23Jordan 2,200 2,289 �0.30 �0.38 �0.26 �0.21 �0.18 �0.27 0.07 0.05Korea, Republic of 2,548 2,761 0.07 0.02 0.14 0.09 0.05 0.08 0.34 0.23Latvia 1,779 1,851 �0.07 �0.19 �0.16 �0.08 0.10 �0.03 0.09 0.13Lebanon 2,174 1,640 0.15 �0.01 0.08 0.21 0.30 0.10 0.16 0.10Liechtenstein b b b b b b b b b b
Lithuania 2,482 2,482 �0.05 �0.19 0.02 �0.04 0.03 �0.04 0.13 0.02Luxembourg b b b b b b b b b b
Macao b b b b b b b b b b
Macedonia 1,908 1,985 �0.09 �0.21 �0.05 �0.08 0.02 �0.09 0.07 0.14Malaysia 2,657 2,657 �0.09 �0.17 �0.06 0.01 �0.02 �0.14 0.02 �0.14Mexico b b b b b b b b b b
Moldova, Republic of 2,057 1,976 �0.12 �0.20 �0.08 �0.10 0.00 �0.14 �0.02 �0.06Morocco 1,472 1,472 0.18 0.03 0.25 0.23 0.22 0.25 0.26 0.05Netherlands 1,502 1,563 0.10 �0.03 0.11 0.03 0.19 0.15 0.39 0.46New Zealand 1,977 1,824 �0.03 �0.12 �0.10 �0.05 0.06 0.04 0.23 0.18Norway 2,067 2,067 �0.04 �0.10 �0.04 �0.06 0.06 �0.03 0.24 0.24Palestinian National Authority 2,946 2,411 �0.09 �0.26 �0.18 �0.08 0.13 �0.04 0.01 �0.05Philippines 4,012 2,905 �0.15 �0.19 �0.14 0.02 �0.04 �0.20 �0.02 �0.16Poland b b b b b b b b b b
Portugal b b b b b b b b b b
Romania 2,134 1,970 �0.04 �0.15 0.00 0.06 0.03 �0.06 0.14 0.05Russian Federation 2,287 2,380 �0.04 �0.17 0.03 �0.05 0.06 �0.02 �0.08 0.00Saudi Arabia 1,847 2,448 0.13 �0.04 �0.13 0.01 0.27 0.29 0.06 0.19Scotland 1,758 1,758 �0.07 �0.11 �0.05 �0.07 0.00 �0.05 0.27 0.15Serbia 2,105 2,191 �0.08 �0.18 0.04 �0.09 0.02 �0.06 0.02 0.04Singapore 2,949 3,069 �0.13 �0.16 �0.04 �0.11 �0.06 �0.14 0.20 0.09Slovak Republic 2,023 2,192 0.00 �0.13 0.16 0.09 0.08 0.00 0.12 0.17Slovenia 1,789 1,789 �0.06 �0.21 �0.04 �0.08 0.08 �0.01 0.10 0.09South Africa 4,566 4,386 0.02 0.02 �0.03 �0.01 0.05 0.01 0.05 �0.06Spain b b b b b b b b b b
Sweden 2,171 2,085 0.00 �0.05 �0.01 �0.05 0.09 0.03 0.34 0.22Switzerland b b b b b b b b b b
110 ELSE-QUEST, HYDE, AND LINN

PISA
NF NM Math Quantity Space Change Uncertainty EM IM Anx. MSC MSE
a a a a a a a a a a a a
6,171 6,380 0.06 0.01 0.11 0.04 0.07 0.24 0.23 �0.31 0.34 0.372,294 2,303 0.08 0.04 0.17 0.05 0.08 0.58 0.40 �0.36 0.44 0.46
a a a a a a a a a a a a
4,210 4,586 0.07 0.01 0.16 0.07 0.07 0.32 0.20 �0.32 0.35 0.36a a a a a a a a a a a a
2,383 2,067 0.16 0.17 0.15 0.16 0.18 0.10 0.17 �0.34 0.33 0.30a a a a a a a a a a a a
13,037 12,688 0.13 0.05 0.20 0.15 0.15 0.12 0.17 �0.33 0.33 0.34a a a a a a a a a a a a
a a a a a a a a a a a a
a a a a a a a a a a a a
3,118 3,202 0.16 0.06 0.25 0.13 0.18 0.26 0.26 �0.26 0.36 0.422,147 2,071 0.18 0.10 0.16 0.21 0.24 0.43 0.29 �0.38 0.48 0.45
a a a a a a a a a a a a
a a a a a a a a a a a a
a a a a a a a a a a a a
2,906 2,890 0.09 0.04 0.03 0.12 0.14 0.36 0.34 �0.39 0.45 0.562,262 2,038 0.09 0.02 0.17 0.04 0.12 0.35 0.24 �0.39 0.37 0.312,290 2,322 0.09 0.01 0.10 0.11 0.19 0.45 0.37 �0.38 0.50 0.46
a a a a a a a a a a a a
2,392 2,234 0.21 0.23 0.19 0.17 0.23 0.26 0.31 �0.26 0.30 0.442,231 2,247 0.04 �0.03 0.04 0.01 0.12 0.20 0.27 �0.28 0.35 0.302,251 2,514 0.08 0.02 0.14 0.10 0.09 0.22 0.12 �0.20 0.24 0.351,620 1,730 �0.17 �0.30 �0.16 �0.10 �0.08 0.06 0.07 �0.27 0.22 0.255,419 5,342 0.04 0.02 0.18 0.04 �0.07 �0.05 0.08 �0.13 0.18 0.08
a a a a a a a a a a a a
1,925 1,955 0.17 0.10 0.27 0.14 0.17 0.32 0.04 �0.28 0.23 0.30a a a a a a a a a a a a
6,041 5,598 0.19 0.12 0.17 0.20 0.25 0.23 0.11 �0.17 0.14 0.362,433 2,273 0.08 0.03 0.08 0.06 0.14 0.31 0.26 �0.26 0.36 0.31
a a a a a a a a a a a a
2,206 3,238 0.25 0.24 0.23 0.25 0.24 0.20 0.16 �0.14 0.26 0.202,408 2,219 0.03 0.03 0.14 �0.01 0.00 0.18 0.20 �0.26 0.31 0.34
a a a a a a a a a a a a
162 170 0.29 0.23 0.36 0.24 0.32 0.89 0.60 �0.61 0.77 0.65a a a a a a a a a a a a
1,992 1,931 0.19 0.09 0.28 0.14 0.23 0.42 0.32 �0.44 0.46 0.43642 608 0.24 0.19 0.24 0.20 0.20 0.24 0.34 �0.46 0.47 0.38a a a a a a a a a a a a
a a a a a a a a a a a a
15,546 14,437 0.13 0.13 0.18 0.08 0.06 0.03 0.16 �0.13 0.15 0.18a a a a a a a a a a a a
a a a a a a a a a a a a
1,956 2,036 0.06 �0.04 0.09 0.06 0.11 0.50 0.34 �0.38 0.55 0.592,256 2,255 0.15 0.12 0.17 0.17 0.12 0.17 0.23 �0.31 0.35 0.372,015 2,049 0.07 0.00 0.07 0.04 0.10 0.23 0.25 �0.36 0.42 0.37
a a a a a a a a a a a a
a a a a a a a a a a a a
2,197 2,186 0.06 0.02 0.12 0.08 0.03 0.05 0.11 �0.03 0.18 0.172,416 2,192 0.14 0.15 0.16 0.13 0.12 0.06 0.03 �0.22 0.21 0.24
a a a a a a a a a a a a
3,007 2,967 0.11 0.07 0.18 0.03 0.09 0.09 0.01 �0.16 0.07 0.33a a a a a a a a a a a a
a a a a a a a a a a a a
2,228 2,177 0.01 �0.03 0.03 0.01 0.06 0.21 0.18 �0.04 0.14 0.27a a a a a a a a a a a a
3,585 3,761 0.20 0.13 0.30 0.16 0.20 0.23 0.17 �0.25 0.30 0.33a a a a a a a a a a a a
a a a a a a a a a a a a
5,482 5,308 0.10 0.05 0.20 0.08 0.09 0.09 0.03 �0.34 0.25 0.282,310 2,314 0.07 0.04 0.10 0.01 0.09 0.32 0.19 �0.30 0.35 0.274,063 4,357 0.17 0.07 0.23 0.13 0.20 0.67 0.58 �0.44 0.67 0.54
(table continues)
111GENDER DIFFERENCES IN MATH

the mean of four items; students rated their agreement with state-ments such as “I am interested in the things I learn in Mathemat-ics.” Anxiety in Mathematics is assessed with the mean of fiveitems; students rated their agreement with statements such as “I getvery nervous doing Mathematics problems.” Self-Concept inMathematics is based on the mean of five items; students ratedtheir agreement with statements such as “I learn Mathematicsquickly.” Self-Efficacy in Mathematics is composed of the meanof eight items; students rated how confident they felt about doingmathematics tasks by agreeing with statements such as “Solving anequation like 3x � 5 � 17.” Effect sizes for gender differences inachievement, attitudes, and affect on these scales are shown inTable 2.
Gender Equity Indicators
Composite indicators. Key to testing the gender stratifica-tion hypothesis is the valid assessment of gender equity on thenational level. Given the theoretical emphasis on economic, edu-cational, and political opportunities being greater for males, ourmeasurement of gender equity should weight these dimensionsmore heavily than the dimension of health. Four of the mostcommonly used and well-regarded composite indicators of genderequity were chosen for the current study. When possible, data wereobtained from HDR 2003 (UNDP, 2003). Although the HDR ispublished annually, data from the 2003 report were chosen becausethey were collected during the same time period as the TIMSS andPISA data used in the meta-analysis. The UNDP sample, whichincludes up to 180 nations, includes 41 of the 46 TIMSS and 38 ofthe 41 PISA nations used in the meta-analysis; however, completedata were not available for all nations. Values for all compositeindices, by nation, appear in Table 3. Intercorrelations among allcomposite indices of gender equity are shown in Table 4.
GEM. The GEM was developed by the UNDP (1995) for thepurpose of assessing women’s empowerment in political and eco-nomic spheres. It is composed of three factors: the extent ofwomen’s political participation and decision making (as measuredby women’s and men’s percentage shares of parliamentary seats),economic participation and decision-making power (as measuredby women’s and men’s percentage shares of positions as legisla-tors, senior officials, and managers and women’s and men’s per-
centage shares of professional and technical positions), and thepower exerted by women over economic resources (as measuredby women’s and men’s estimated earned income). Higher valueson the GEM indicate greater female empowerment. For furtherdetails on calculating the GEM, see UNDP (1995, 2003). It isnotable that, although the GEM emphasizes the economic andpolitical dimensions of gender equity, it omits the education di-mension.
GEQ. The GEQ (White, 1997) was designed to tap into theimplicit or underlying index of gender equality in the GDI (UNDP,1995). Not a measure of gender equity as such, the GDI is avariation of the Human Development Index (HDI), which is acomposite indicator of the areas of education (enrollment andliteracy rates), health (life expectancy), and earned income. TheGDI assesses the same components as the HDI but discounts thosecomponents for their gender disparities. Because the GDI is oftenmistaken and misused as an indicator of gender equality, severalalternative indicators composed of the same elements (education,health, and earned income) have been proposed (Dijkstra, 2006;Schuler, 2006). The GEQ is one such alternative; it is simply theratio of the GDI to the HDI. The GEQ’s equal weighting of theeducation, economic, and health dimensions is a limitation inthe context of a focus on math achievement. It was therefore predictedto correlate less strongly with gender differences in math performancethan would other gender equity measures.
SIGE. The SIGE (Dijkstra, 2002) was developed in responseto a workshop held at The Hague, in which social scientistsidentified eight dimensions of gender equality that could be ob-served across many different cultures. The SIGE attempts to buildupon the GDI and GEM by using some of the components of thosecomposite indices. Five variables make up the SIGE: (a) relativefemale-to-male access to education (1/3 combined primary, sec-ondary, and tertiary enrollment; 2/3 adult literacy); (b) relativefemale-to-male life expectancy; (c) relative female-to-male labormarket participation or economic activity rate; (d) women’s sharein higher labor market occupations (e.g., technical, professional,administrative, and management positions); and (e) women’s sharein parliamentary seats. Each of the five variables is standardizedand is computed as the difference of the arithmetic mean of scoreson all nations on indicator j from the score of nation i on indicator
Table 2 (continued)
Nation
TIMSS
NF NM Math Algebra Data Geometry Measurement Number SCM VM
Thailand b b b b b b b b b b
Tunisia 2,613 2,318 0.40 0.21 0.40 0.30 0.37 0.39 0.27 0.12Turkey b b b b b b b b b b
United Kingdom b b b b b b b b b b
United States 4,634 4,278 0.06 �0.01 0.01 0.08 0.15 0.10 0.26 0.05Uruguay b b b b b b b b b b
Note. Positive values of d represent higher scores for males than females, whereas negative values represent higher scores for females. TIMSS � Trendsin International Mathematics and Science Study; PISA � Programme for International Student Assessment; SCM � Self-Confidence in Mathematics;VM � Valuing Mathematics; EM � Extrinsic Motivation; IM � Intrinsic Motivation; Anx. � Math Anxiety; MSC � Mathematics Self-Concept; MSE �Mathematics Self-Efficacy.a Nation did not participate in PISA. b Nation did not participate in TIMSS. c Data not available.
112 ELSE-QUEST, HYDE, AND LINN

j, divided by the standard deviation of scores of all nations onindicator j. Depending on skew and kurtosis, variables may un-dergo transformation to normalize their distributions (as was donefor the education variable). The SIGE places relatively moreemphasis on the economic dimension than on the educational,health, and political dimensions.
GGI. The GGI (Hausmann et al., 2007), published by theWorld Economic Forum, was designed to assess gender inequitiesin access to resources and opportunities. As with the other GDIand GEM alternatives, it does not take into account overallhuman development of a nation and is not framed as a measureof women’s empowerment. It is composed of four subindices,including economic participation and opportunity, educationalattainment, political empowerment, and health and survival.The economic subindex is based on female-to-male ratios infive areas: labor force participation; wage equality; earnedincome; share of legislators, senior officials, and managers; andshare of professional and technical positions. The educationsubindex is based on female-to-male ratios in four areas: liter-acy, primary enrollment, secondary enrollment, and tertiaryenrollment. The political subindex is based on the female-to-male ratios in parliamentary seats and ministerial positions andthe number of years during the past 50 with a female head ofstate. The health subindex includes the female-to-male lifeexpectancy ratio and the sex ratio at birth. All but the healthratios are truncated at the “equality benchmark,” which is set at1. Next, the subindices are computed using the weighted meanof the ratios. The GGI is computed using the unweighted meanof the four subindices. For the current study, we used the 2007GGI values, which appear in the Global Gender Gap Report2007 and are based on 2005 data. For further details on com-putation of the GGI, see Hausmann et al. (2007). Because theGGI is the unweighted average of the four subindices, theeducational, economic, political, and health dimensions contrib-ute equally to a nation’s gender equity assessment.
Of the four composite indices of gender equity used in thecurrent study, the GEM is perhaps the most theoretically relevant,as it is composed only of economic and political dimensions.However, its exclusion of the educational dimension is a nota-ble shortcoming. Although the GEQ, SIGE, and GGI all includethe education dimension, which is fundamental to the gender
stratification hypothesis, these composites include the healthdimension, which is theoretically less relevant. Because ofthese limitations in the composite indices, we chose sevendomain-specific indicators that were used in the computation ofthe above composite indices of gender equity and were theo-retically relevant to the gender stratification hypothesis to as-sess the relationship between the gender gap in math andspecific domains of gender equity.
Domain-specific indicators. The seven domain-specific indi-cators encompass education, political, and economic domains ofgender equity. The education domain includes (a) net primaryschool enrollment, (b) net secondary school enrollment, and (c)gross tertiary school enrollment, which are calculated as ratio ofthe number of female students enrolled in that level of education asa percentage of the female population of official school age for thatlevel to the number of male students enrolled in that level ofeducation as a percentage of the male population of official schoolage for that level. The political domain is assessed by women’sshare (as percentage of total) of parliamentary seats. The economicdomain includes (a) the female-to-male ratio in economic activityrate (the ratio of the proportion of females age 15 or older whocontribute or are available to contribute to the production of goodsand services to the proportion of males age 15 or older whocontribute or are available to contribute to the production of goodsand services); (b) women’s share (as percentage of total) of higherlabor market positions (technical and professional, as well asadministrative and management positions); and (c) women’s share(as percentage of total) of research positions (according to theInternational Standard Classification of Occupations [InternationalLabour Organization, 1990]). When possible, data for domain-specific indicators (except women’s share of research positions)were obtained from HDR 2003 (UNDP, 2003); due to improve-ments in statistical reporting among some nations, some data wereavailable only in later editions of the HDR. Data for the indicatorof women’s share of research positions refer to the year 2003 andwere obtained from UNESCO Institute for Statistics (2006) andOECD.Stat (http://stats.oecd.org/). Values for each of the domain-specific gender equity indicators, by nation, appear in Table 3.Intercorrelations among domain-specific and composite indicatorsof gender equity appear in Table 4.
PISA
NF NM Math Quantity Space Change Uncertainty EM IM Anx. MSC MSE
2,876 2,360 �0.05 �0.05 0.05 �0.10 �0.07 �0.20 0.06 �0.11 0.28 0.132,395 2,326 0.15 0.18 0.18 0.11 0.09 0.17 0.27 �0.35 0.34 0.272,184 2,671 0.14 0.16 0.12 0.05 0.19 �0.06 0.10 �0.20 0.19 0.255,073 4,462 c c c c c 0.27 0.15 �0.39 0.41 0.392,705 2,750 0.07 0.04 0.16 0.06 0.03 0.10 0.16 �0.23 0.27 0.192,989 2,846 0.12 0.11 0.21 0.05 0.08 0.16 0.11 �0.21 0.24 0.31
113GENDER DIFFERENCES IN MATH

Table 3Composite and Domain-Specific Indicators of Gender Equity for Each Nation
Nation GEM GEQ SIGE GGI Prim. Sec. Tert. EACT HLMP WR Parl.
Armenia a 0.997 0.149 0.665 1.02 1.06 1.25 0.88 a 0.46 0.03Australia 0.754 0.999 0.296 0.720 1.01 1.03 1.24 0.77 0.35 a 0.27Austria 0.782 0.995 0.312 0.706 1.01 0.99 1.14 0.65 0.39 0.21 0.31Bahrain a 0.988 �1.008 0.593 1.01 1.07 1.59 0.39 a a 0.06Belgium 0.695 0.994 0.202 0.720 1.00 0.97 1.13 0.66 0.35 0.28 0.25Botswana 0.564 0.995 �0.039 0.680 1.04 1.14 0.89 0.77 0.44 a 0.17Brazil 0.490 0.991 0.452 0.664 0.93 1.08 1.29 0.52 0.62 0.46 0.09Bulgaria 0.606 0.999 0.733 0.709 0.98 0.98 1.35 0.86 0.47 0.47 0.26Canada 0.771 0.997 0.451 0.720 1.00 1.01 1.33 0.82 0.44 a 0.24Chile 0.467 0.988 �0.505 0.648 0.99 0.76 0.92 0.49 0.37 0.33 0.10Chinese Taipei a a a a a a a a a 0.19 a
Cyprus 0.542 0.994 �0.473 0.652 1.01 1.02 1.29 0.62 0.31 0.31 0.11Czech Republic 0.579 0.995 0.288 0.672 1.00 1.02 1.05 0.83 0.40 0.28 0.16Denmark 0.825 0.998 0.609 0.752 1.00 1.03 1.35 0.84 0.36 0.28 0.38Egypt 0.253 0.978 �1.633 0.581 0.95 0.96 a 0.45 0.20 a 0.02England a a a a a a a a a a a
Estonia 0.560 0.998 1.043 0.701 0.98 1.03 1.55 0.82 0.53 0.43 0.18Finland 0.801 0.998 0.937 0.804 1.00 1.02 1.21 0.87 0.43 0.30 0.37France a 0.998 0.283 0.682 1.00 1.02 1.23 0.77 0.42 0.30 0.12Germany 0.776 1.003 0.325 0.762 1.02 1.01 0.96 0.70 0.39 0.12 0.31Ghana a 0.995 �0.680 0.673 0.95 0.86 0.40 0.98 a a 0.09Greece 0.519 0.993 �0.323 0.665 1.00 1.03 1.14 0.59 0.36 0.37 0.09Hong Kong a 0.997 �0.326 a 0.94 0.96 0.95 0.65 0.32 a a
Hungary 0.518 0.996 0.381 0.673 0.99 1.01 1.27 0.71 0.48 0.35 0.10Iceland 0.847 0.998 0.661 0.784 1.00 1.05 1.74 0.83 0.43 0.39 0.35Indonesia a 0.993 �0.709 0.655 0.99 0.96 0.77 0.68 a a 0.08Iran, Islamic Republic of a 0.976 �1.464 0.590 0.98 0.94 0.93 0.38 0.25 a 0.04Ireland 0.683 0.992 �0.187 0.746 1.00 1.04 1.27 0.53 0.39 0.31 0.14Israel 0.612 0.994 �0.169 0.697 1.00 1.01 1.39 0.68 0.41 a 0.15Italy 0.561 0.993 �0.252 0.650 1.00 1.01 1.32 0.59 0.32 0.29 0.10Japan 0.515 0.994 �0.284 0.646 1.00 1.01 0.85 0.67 0.27 0.12 0.10Jordan a 0.981 �1.352 0.620 1.01 1.07 1.14 0.35 a 0.18 0.03Korea, Republic of 0.363 0.993 �0.531 0.641 1.01 1.00 0.59 0.70 0.20 0.11 0.06Latvia 0.576 0.999 1.151 0.733 1.00 1.08 1.65 0.80 0.53 0.53 0.21Lebanon a 0.980 �1.020 a 1.00 1.09 1.09 0.39 a a 0.02Liechtenstein a a 0.012 a 1.01 0.87 0.37 a a a 0.24Lithuania 0.499 0.999 0.883 0.723 0.99 1.01 1.51 0.80 0.58 0.48 0.11Luxembourg a 0.989 0.000 0.679 1.01 1.08 1.24 0.58 0.17 0.17Macao a a a a a a a a a 0.11 a
Macedonia a 1.014 �0.089 0.697 1.00 0.98 1.32 0.72 0.41 0.48 0.18Malaysia 0.503 0.992 �0.439 0.644 1.00 1.11 1.08 0.61 0.33 0.34 0.15Mexico 0.516 0.988 �0.436 0.644 1.01 1.08 0.96 0.48 0.33 0.32 0.16Moldova, Republic of 0.468 0.996 0.546 0.717 1.00 1.03 1.29 0.84 0.52 0.30 0.13Morocco a 0.974 �1.511 0.568 0.91 0.83 0.80 0.52 0.24 0.27 0.06Netherlands 0.794 0.996 0.260 0.738 0.99 1.00 1.07 0.67 0.37 0.17 0.33New Zealand 0.750 0.997 0.619 0.765 1.00 1.02 1.52 0.80 0.46 0.39 0.29Norway 0.837 0.997 0.699 0.806 1.00 1.01 1.52 0.85 0.37 0.29 0.36Palestinian National Authority a a �1.685 0.763 1.02 1.08 0.96 0.13 0.22 a a
Philippines 0.539 0.996 0.210 a 1.01 1.18 1.10 0.61 0.60 0.55 0.17Poland 0.594 0.998 0.683 0.676 1.00 1.03 1.44 0.80 0.46 0.39 0.21Portugal 0.647 0.996 0.374 0.696 0.96 1.08 1.37 0.72 0.41 0.44 0.19Romania 0.460 0.997 0.215 0.686 0.99 1.02 1.20 0.76 0.43 0.43 0.10Russian Federation 0.440 0.994 1.035 0.687 1.00 0.99 1.36 0.82 0.51 0.43 0.06Saudi Arabia a 0.966 �1.830 0.565 0.92 0.95 1.29 0.28 0.19 0.17 0.00Scotland a a a a a a a a a a a
Serbia a a 0.598 a 1.00 1.01 1.20 0.76 0.71 0.43 0.20Singapore 0.594 0.995 �0.536 0.661 a a a 0.64 0.34 0.26 0.12Slovak Republic 0.598 0.998 0.622 0.680 1.01 1.01 1.09 0.84 0.46 0.41 0.19Slovenia 0.582 0.998 0.368 0.684 0.99 a 1.35 0.81 0.43 0.34 0.12South Africa a 0.991 0.443 0.719 0.98 1.12 1.23 0.59 a 0.35 0.30Spain 0.709 0.993 0.245 0.744 1.01 1.03 1.15 0.57 0.39 0.36 0.27Sweden 0.831 0.999 1.071 0.815 0.99 1.04 1.52 0.89 0.40 0.35 0.45Switzerland 0.720 0.995 0.000 0.692 0.99 0.95 0.78 0.66 0.34 0.21 0.22
(table continues)
114 ELSE-QUEST, HYDE, AND LINN

Data Analysis
To estimate the magnitude of gender differences in mathematicsachievement across countries, we conducted meta-analysis on eachcomposite and content domain of the TIMSS and PISA data sets,using the formulas provided by Hedges and Becker (1986) andLipsey and Wilson (2001). We also analyzed cognitive domainsfrom the TIMSS data set using these methods.
Effect size computation. We computed effect sizes of genderdifferences for each of the 11 measures of mathematics achievementand the seven measures of mathematics attitudes and affect. The effectsize, d, is defined as the mean for males minus the mean for females,divided by the pooled within-gender standard deviation. Thus, posi-tive values of d represent higher scores for males than females,whereas negative values represent higher scores for females. Cohen(1988) provided guidelines for the interpretation of effect sizes; effectsizes of d � 0.20, 0.50, and 0.80 are considered small, medium, andlarge, respectively. We characterize effect sizes of d � 0.10 asnegligible or close to zero (Hyde, 2005). All effect sizes were cor-rected for bias, using the formula provided by Hedges and Becker(1986). Analyses were conducted using both weighted and un-weighted effect sizes; although results using unweighted effect sizeswere very similar, we report the results using weighted effect sizeshere. Meta-analytic results based on unweighted effect sizes are
available from Nicole M. Else-Quest. Computed, unweighted effectsizes, in addition to male and female sample sizes, for each country ofthe TIMSS and PISA samples appear in Table 2.
Mixed-effects models and moderator analyses. Opinionabout the best statistical methods for estimation of the homogene-ity (Q) of effect sizes and testing moderators is in a state of flux.Meta-analyses have traditionally been based on fixed-effects mod-els, which assume that variability among effect sizes is completelysystematic and accounted for by the moderators in the analysis. Inrecent years, some have chosen instead to compute homogeneitystatistics using the random-effects model, which assumes thatvariability among effect sizes is random (Hedges & Vevea, 1998).Whereas the fixed-effects model requires untenable statistical as-sumptions about the homogeneity of the sample of effect sizes(thereby increasing the Type I error rate), the random-effects modelenlarges the error term so greatly that it is difficult to find significantmoderators (such as indicators of gender equity), even with largesamples of studies (Lipsey & Wilson, 2001). In fact, the random-effects analysis often produces nonsignificant homogeneity, whichimplies that the fixed-effects model could have been appropriate. Forthese reasons, we conducted the current meta-analysis using themixed-effects model (Lipsey & Wilson, 2001), which attributeseffect-size variability to systematic between-study variations, subject-
Table 3 (continued )
Nation GEM GEQ SIGE GGI Prim. Sec. Tert. EACT HLMP WR Parl.
Thailand 0.457 0.997 0.206 0.682 0.97 1.05 0.82 0.85 0.41 0.46 0.10Tunisia a 0.982 �1.141 0.628 0.99 1.05 0.97 0.48 a a 0.12Turkey 0.290 0.989 �1.173 0.577 0.95 0.82 0.70 0.62 0.20 0.36 0.04United Kingdom 0.675 0.998 0.186 0.744 1.00 1.02 1.27 0.74 0.37 a 0.17United States 0.760 0.998 0.446 0.700 1.01 1.02 1.32 0.82 0.50 a 0.14Uruguay 0.516 0.995 0.345 0.661 1.01 1.11 1.83 0.67 0.45 0.47 0.12
Note. On all indicators, higher values reflect higher status of women. GEM � Gender Empowerment Measure; GEQ � Gender Equality Index; SIGE �Standardized Index of Gender Equality; GGI � Gender Gap Index; Prim. � male/female primary enrollment ratio; Sec. � male/female secondaryenrollment ratio; Tert. � male/female tertiary enrollment ratio; EACT � male/female economic activity rate ratio; HLMP � women’s share of higher labormarket positions; WR � women’s share of research positions; Parl. � women’s share of parliamentary seats.a Data not available.
Table 4Intercorrelations Between Composite and Domain-Specific Indicators of Gender Equity
Variable 1 2 3 4 5 6 7 8 9 10 11
1. GEM —2. GEQ .59�� —3. SIGE .54�� .77�� —4. GGI .84�� .69�� .72�� —5. Prim. .34� .47�� .30� .41�� —6. Sec. .17 .22 .29� .32� .45�� —7. Tert. .37� .26� .51�� .39�� .14 .47�� —8. EACT .38�� .77�� .78�� .49�� .18 �.01 .18 —9. HLMP .17 .55�� .78�� .46�� .22 .42�� .52�� .53�� —
10. WR �.26 .38�� .47�� .15 �.06 .27 .48�� .37�� .68�� —11. Parl. .88�� .52�� .65�� .84�� .30� .16 .26� .48�� .23 �.04 —
Note. Pairwise n � 40–64. GEM � Gender Empowerment Measure; GEQ � Gender Equality Index; SIGE � Standardized Index of Gender Equality;GGI � Gender Gap Index; Prim. � male/female primary enrollment ratio; Sec. � male/female secondary enrollment ratio; Tert. � male/female tertiaryenrollment ratio; EACT � male/female economic activity rate ratio; HLMP � women’s share of higher labor market positions; WR � women’s share ofresearch positions; Parl. � women’s share of parliamentary seats.� p � .05. �� p � .01.
115GENDER DIFFERENCES IN MATH

level sampling error, and random effects. In the mixed-effects model,total homogeneity (QT) is computed using random-effects variancecomponents, which are based on the residual homogeneity (QW)computed after taking moderators into account.
Moderator analyses tested the gender stratification hypothesis.We ran hierarchical multiple regressions, using appropriateweighting and mixed-effects model estimates, between the fourcomposite indices (i.e., GEM, GEQ, SIGE, GGI) and sevendomain-specific indicators (i.e., primary enrollment ratio, second-ary enrollment ratio, tertiary enrollment ratio, economic activityrate ratio, women’s share of higher labor market positions, wom-en’s share of research positions, and women’s share of parliamen-tary seats) of gender equity and variables of gender differences inmathematics achievement, attitudes, and affect. The gender strat-ification hypothesis predicted that higher levels of gender equity inall domains would predict smaller gender differences in mathe-matics achievement, attitudes, and affect.
Results
Estimating the Magnitude and Variability of theGender Gap
TIMSS.Achievement. Table 5 displays mean weighted effect sizes (d),
95% confidence intervals, sample sizes (k), and homogeneitystatistics (Q) based on the TIMSS-Math and TIMSS content do-mains of Algebra, Data, Geometry, Measurement, and Number.The weighted mean effect size of the gender difference in perfor-mance on the TIMSS-Math across the k � 46 effect sizes was d �
�0.01, indicating that boys and girls performed similarly overall.This effect size reflects a gender difference of less than 1 point onthe TIMSS-Math, which had an international average score of 467.The range of effect sizes for the TIMSS-Math was from d � �0.42(Bahrain) to d � 0.40 (Tunisia), with 63.0% of the effect sizessmaller than d � 0.10. Small effect sizes also were observed inData, Geometry, and Number. Although the gender difference inMeasurement was significant (d � 0.07, p � .05), it is so smallthat it can be considered negligible. Girls outperformed boysslightly but significantly ( p � .05) in Algebra. According tocontent domain, 39.1% of the effect sizes in Algebra, 56.5% ofthose in Data, 60.9% of those in Geometry, 58.7% of those inMeasurement, and 54.3% of those in Number can be classified asnegligible (d � 0.10; see Table 2). These results indicate a rangeof effect sizes distributed around a very small mean gender dif-ference in math achievement on the TIMSS.
In addition, gender differences in achievement on the threecognitive domains were meta-analyzed. The mean weighted effectsizes for Knowing (d � �0.04, p � .05), Applying (d � 0.02, p �.05), and Reasoning (d � �0.05, p � .05) were all negligible inmagnitude but significantly nonhomogeneous. Thus, in contrast topredictions based on the greater male variability hypothesis, thereis little evidence that gender differences vary according to thedifficulty level of the TIMSS items.
Attitudes and affect. Table 5 displays mean weighted effectsizes (d), 95% confidence intervals, sample sizes (k), and homogene-ity statistics (Q) based on the TIMSS scales of Self-Confidence inMath and Valuing Math. The weighted mean effect size of the genderdifference in self-confidence was d � 0.15, indicating that, averagedacross nations, males reported higher self-confidence in math than did
Table 5Weighted Mean Effect Sizes (d), 95% Confidence Intervals (95% CI), Number of Effect Sizes (k),and Homogeneity Statistics (QT) for Gender Differences in Math Achievement, Attitudes, andAffect
Content domain d k 95% CI QT
TIMSSMath �0.01 46 [�0.05, 0.03] 46.42Algebra �0.11�� 46 [�0.15, �0.07] 45.61Data 0.00 46 [�0.04, 0.04] 47.45Geometry 0.01 46 [�0.03, 0.05] 46.90Measurement 0.07�� 46 [0.04, 0.11] 46.13Number 0.01 46 [�0.03, 0.05] 45.70Self-Confidence in Math 0.15�� 46 [0.12, 0.19] 46.00Valuing Math 0.10�� 46 [0.07, 0.14] 44.22
PISA
Math 0.11�� 40 [0.09, 0.13] 51.31Quantity 0.06�� 40 [0.04, 0.09] 53.19Space/Shape 0.15�� 40 [0.13, 0.18] 52.03Change/Relationships 0.09�� 40 [0.07, 0.11] 45.98Uncertainty 0.12�� 40 [0.09, 0.14] 40.49Extrinsic Motivation 0.24�� 41 [0.18, 0.29] 48.46Intrinsic Motivation 0.20�� 41 [0.17, 0.24] 47.99Anxiety �0.28�� 41 [�0.31, �0.25] 47.66Self-Concept 0.33�� 41 [0.28, 0.36] 48.81Self-Efficacy 0.33�� 41 [0.30, 0.37] 43.81
Note. TIMSS � Trends in International Mathematics and Science Study; PISA � Programme for InternationalStudent Assessment.� p � .05. �� p � .01.
116 ELSE-QUEST, HYDE, AND LINN

girls by a small amount. Effect sizes for the self-confidence in mathscale ranged from d � �0.12 (Bahrain) to d � 0.43 (Hong Kong),with 30.4% of the effect sizes smaller than d � 0.10. Similarly, theweighted mean effect size of the gender difference in valuing mathwas d � 0.10. The range of effect sizes for the valuing math scale wasfrom d � �0.16 (Philippines) to d � 0.46 (Netherlands), with 34.8%of the effect sizes smaller than d � 0.10. The mean effect sizes inself-confidence and valuing math are small but statistically significant(p � .05). Gender differences in math achievement were significantlycorrelated with gender differences in self-confidence in math (r � .54,p � .01) and students’ valuing mathematics (r � .30, p � .05).
PISA.Achievement. See Table 5 for mean weighted effect sizes (d),
95% confidence intervals, sample sizes (k), and homogeneitystatistics (Q) based on the PISA-Math and PISA content domainsof Quantity, Space/Shape, Change/Relationships, and Uncertainty.The weighted mean effect size of the gender difference in perfor-mance on the PISA-Math across the k � 40 effect sizes was d �0.11, indicating that boys performed slightly better than girlsoverall. This effect size indicates a gender difference of 11 pointson the PISA-Math, which had an average OECD score of 500. Asimilar pattern of gender differences was observed for the fourPISA content domains: Boys outperformed girls, but the genderdifferences are negligible to very small in magnitude. The effectsizes for each nation (shown in Table 2) demonstrate that themajority (50%) of the effect sizes favor boys, 2.5% favor girls,and 45% are negligible (d � 0.10). The range of effect sizes forthe PISA-Math was from d � �0.17 (Iceland) to d � 0.29(Liechtenstein). According to content domain, 60.0% of theeffect sizes in Quantity, 17.5% of those in Space/Shape, 47.5%of those in Change/Relationships, and 42.5% of those in Un-certainty can be classified as negligible. These results indicatecross-national variation in the magnitude of the gender gap inmath achievement, with males outperforming females by asmall amount on average.
Attitudes and affect. Table 5 shows mean weighted effectsizes (d), 95% confidence intervals, sample sizes (k), and homo-geneity statistics (Q) for the PISA scales of Extrinsic Motivation,Intrinsic Motivation, Anxiety, Self-Efficacy, and Self-Concept.Although mean effect sizes are small, boys consistently reportedsignificantly more positive attitudes about mathematics (d � 0.21–0.33). Similarly, girls reported greater mathematics anxiety thandid boys (d � �0.27). Ranges of gender differences in mathattitudes and affect were larger than those in math achievement.In extrinsic motivation, gender differences ranged from d ��0.20 (Thailand) to d � 0.89 (Liechtenstein), with 76.9% ofthem favoring males (20.5% were negligible); for intrinsicmotivation, gender differences ranged from d � 0.01 (RussianFederation) to d � 0.60 (Liechtenstein), with 82.1% of themfavoring males (17.9% were negligible). Similarly, gender dif-ferences in self-concept ranged from d � 0.07 (Russian Feder-ation) to d � 0.77 (Liechtenstein), with 97.4% of them favoringmales (2.6% were negligible); for self-efficacy, gender differ-ences ranged from d � 0.08 (Indonesia) to d � 0.65 (Liech-tenstein), with 97.4% of them favoring males (2.6% werenegligible). Gender differences in anxiety ranged from d ��0.61 (Liechtenstein) to d � �0.03 (Poland), with 94.9% ofthem showing higher anxiety among girls (5.1% were negligi-ble). In contrast to the results in mathematics achievement,
which showed gender similarities, mathematics attitudes andaffect showed consistent gender differences, with boys report-ing greater extrinsic and intrinsic motivation, self-concept, andself-efficacy and less math anxiety. Effect sizes in achievement,attitudes, and affect varied a great deal across nations. Nationalgender differences in PISA-Math achievement were signifi-cantly correlated with national gender differences in extrinsicmotivation (r � .40, p � .05), intrinsic motivation (r � .35, p �.05), math anxiety (r � �.35, p � .05), self-concept (r � .33,p � .05), and self-efficacy (r � .33, p � .05).
Comparing results from TIMSS and PISA. Eighteen nationsparticipated in both TIMSS and PISA; we compared gender dif-ferences on the math composites from the two assessments. Gen-der differences on the two assessments were not significantlycorrelated in magnitude (r � .27, p � .05), though lack ofstatistical significance is probably due, in part, to the small sampleof nations participating in both assessments. Paired-samples t testsdemonstrated that the differences between the TIMSS-Math andPISA-Math assessments are not substantial (mean difference �0.05, SD � 0.11, t � 1.92, p � .05). Figure 1 displays the effectsizes for the TIMSS and PISA math composites. As demonstrated,their distributions overlap significantly.
Items from the TIMSS scale of Self-Confidence in Math and thePISA scale of Self-Concept are very similar; both include itemsreflecting students’ perceptions of their ability to do well in mathand to learn math quickly. Thus, as with the math composites, weconducted analyses to compare the effect sizes in nations thatparticipated in both assessments. Gender differences on the twoassessments were highly correlated (r � .77, p � .001). Yet,paired-samples t tests demonstrated that gender differences on thetwo assessments differed significantly within nations (mean dif-ference � �0.08, SD � 0.09, t � �3.81, p � .001). Figure 2displays the distribution of effect sizes on the PISA scale ofSelf-Concept and the TIMSS scale of Self-Confidence in Math.
Moderator Analyses: The Gender StratificationHypothesis
Composite indices of gender equity.Achievement. What factors explain the cross-national vari-
ability in the magnitude and direction of gender differences inmath? Multiple regression analyses tested the gender stratificationhypothesis. Composite indices of gender equity (e.g., GEM, GEQ,SIGE, GGI) were tested as moderators of gender differences inmath achievement, attitudes, and affect. Each of the four compos-ite indices of gender equity was entered into regression analyses asan individual predictor of each of the two gender differences inmath achievement (TIMSS and PISA math composites) and theseven gender differences in attitudes and affect. Cases wereweighted with the inverse variance of the effect sizes, whichincludes the random-effects variance component, as recommendedby Lipsey and Wilson (2001). Results for these models appear inTable 6. Examination of the regression coefficients indicates apattern that provides mixed support for the gender stratificationhypothesis. The composite indices of gender equity did notsignificantly predict gender differences in math achievement onthe TIMSS. In contrast, each of the four gender equity com-posite indices significantly and negatively predicted genderdifferences in PISA achievement, as hypothesized. These ef-
117GENDER DIFFERENCES IN MATH

Figure 2. Distribution of effect sizes on TIMSS Self-Confidence in Math-ematics (black) and PISA Self-Concept in Mathematics (gray). Abbreviationsfor nations are as follows: ARM: Armenia; AUS: Australia; AUT: Austria;BEL: Belgium; BGR: Bulgaria; BHR: Bahrain; BRA: Brazil; BWA: Bo-tswana; CAN: Canada; CHE: Switzerland; CHL: Chile; CYP: Cyprus; CZE:Czech Republic; DEU: Germany; DNK: Denmark; EGY: Egypt; ENG: En-gland; ESP: Spain; EST: Estonia; FIN: Finland; FRA: France; GBR: UnitedKingdom; GHA: Ghana; GRC: Greece; HKG: Hong Kong; HUN: Hungary;IDN: Indonesia; IRL: Ireland; IRN: Islamic Republic of Iran; ISL: Iceland;ISR: Israel; ITA: Italy; JOR: Jordan; JPN: Japan; KOR: Republic ofKorea; LBN: Lebanon; LIE: Liechtenstein; LTU: Lithuania; LUX: Luxembourg;LVA: Latvia; MAC: Macao; MDA: Republic of Moldova; MEX: Mexico; MKD:Macedonia, TFYR; MYS: Malaysia; NLD: Netherlands; NOR: Norway; NZL:New Zealand; PHL: Philippines; POL: Poland; PRT: Portugal; PSE: PalestinianNational Authority; ROU: Romania; RUS: Russian Federation; SAU: Saudi Ara-bia; SCO: Scotland; SGP: Singapore; SRB: Serbia; SVK: Slovak Republic; SVN:Slovenia; SWE: Sweden; TAI: Chinese Taipei; THA: Thailand; TUN: Tunisia;TUR: Turkey; URY: Uruguay; USA: United States; ZAF: South Africa.
Figure 1. Distribution of effect sizes on TIMSS-Math (black) and PISA-Math (gray). Abbreviations for nations are as follows: ARM: Armenia; AUS:Australia; AUT: Austria; BEL: Belgium; BGR: Bulgaria; BHR: Bahrain;BRA: Brazil; BWA: Botswana; CAN: Canada; CHE: Switzerland; CHL:Chile; CYP: Cyprus; CZE: Czech Republic; DEU: Germany; DNK: Denmark;EGY: Egypt; ENG: England; ESP: Spain; EST: Estonia; FIN: Finland; FRA:France; GBR: United Kingdom; GHA: Ghana; GRC: Greece; HKG: HongKong; HUN: Hungary; IDN: Indonesia; IRL: Ireland; IRN: Islamic Republicof Iran; ISL: Iceland; ISR: Israel; ITA: Italy; JOR: Jordan; JPN: Japan; KOR:Republic of Korea; LBN: Lebanon; LIE: Liechtenstein; LTU: Lithuania;LUX: Luxembourg; LVA: Latvia; MAC: Macao; MDA: Republic ofMoldova; MEX: Mexico; MKD: Macedonia, TFYR; MYS: Malaysia; NLD:Netherlands; NOR: Norway; NZL: New Zealand; PHL: Philippines; POL:Poland; PRT: Portugal; PSE: Palestinian National Authority; ROU: Romania;RUS: Russian Federation; SAU: Saudi Arabia; SCO: Scotland; SGP: Singa-pore; SRB: Serbia; SVK: Slovak Republic; SVN: Slovenia; SWE: Sweden;TAI: Chinese Taipei; THA: Thailand; TUN: Tunisia; TUR: Turkey; URY:Uruguay; USA: United States; ZAF: South Africa.
118 ELSE-QUEST, HYDE, AND LINN
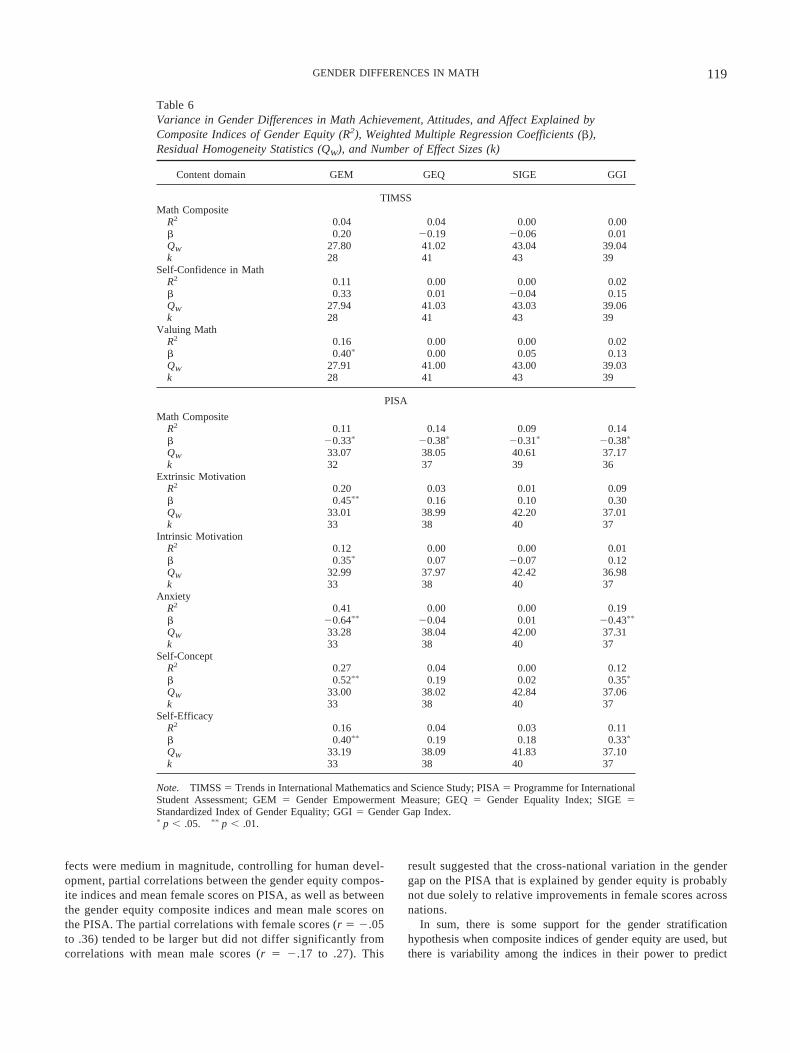
fects were medium in magnitude, controlling for human devel-opment, partial correlations between the gender equity compos-ite indices and mean female scores on PISA, as well as betweenthe gender equity composite indices and mean male scores onthe PISA. The partial correlations with female scores (r � �.05to .36) tended to be larger but did not differ significantly fromcorrelations with mean male scores (r � �.17 to .27). This
result suggested that the cross-national variation in the gendergap on the PISA that is explained by gender equity is probablynot due solely to relative improvements in female scores acrossnations.
In sum, there is some support for the gender stratificationhypothesis when composite indices of gender equity are used, butthere is variability among the indices in their power to predict
Table 6Variance in Gender Differences in Math Achievement, Attitudes, and Affect Explained byComposite Indices of Gender Equity (R2), Weighted Multiple Regression Coefficients (�),Residual Homogeneity Statistics (QW), and Number of Effect Sizes (k)
Content domain GEM GEQ SIGE GGI
TIMSSMath Composite
R2 0.04 0.04 0.00 0.00� 0.20 �0.19 �0.06 0.01QW 27.80 41.02 43.04 39.04k 28 41 43 39
Self-Confidence in MathR2 0.11 0.00 0.00 0.02� 0.33 0.01 �0.04 0.15QW 27.94 41.03 43.03 39.06k 28 41 43 39
Valuing MathR2 0.16 0.00 0.00 0.02� 0.40� 0.00 0.05 0.13QW 27.91 41.00 43.00 39.03k 28 41 43 39
PISA
Math CompositeR2 0.11 0.14 0.09 0.14� �0.33� �0.38� �0.31� �0.38�
QW 33.07 38.05 40.61 37.17k 32 37 39 36
Extrinsic MotivationR2 0.20 0.03 0.01 0.09� 0.45�� 0.16 0.10 0.30QW 33.01 38.99 42.20 37.01k 33 38 40 37
Intrinsic MotivationR2 0.12 0.00 0.00 0.01� 0.35� 0.07 �0.07 0.12QW 32.99 37.97 42.42 36.98k 33 38 40 37
AnxietyR2 0.41 0.00 0.00 0.19� �0.64�� �0.04 0.01 �0.43��
QW 33.28 38.04 42.00 37.31k 33 38 40 37
Self-ConceptR2 0.27 0.04 0.00 0.12� 0.52�� 0.19 0.02 0.35�
QW 33.00 38.02 42.84 37.06k 33 38 40 37
Self-EfficacyR2 0.16 0.04 0.03 0.11� 0.40�� 0.19 0.18 0.33�
QW 33.19 38.09 41.83 37.10k 33 38 40 37
Note. TIMSS � Trends in International Mathematics and Science Study; PISA � Programme for InternationalStudent Assessment; GEM � Gender Empowerment Measure; GEQ � Gender Equality Index; SIGE �Standardized Index of Gender Equality; GGI � Gender Gap Index.� p � .05. �� p � .01.
119GENDER DIFFERENCES IN MATH

cross-national gender differences in math achievement on theTIMSS and PISA. These issues are addressed further in the Dis-cussion.
Attitudes and affect. In terms of attitudes and affect across theTIMSS and PISA data, the GEM was a significant moderator in sixout of seven models. However, the direction of these effects wascontrary to predictions: In nations with greater gender equity,gender differences in valuing math, extrinsic motivation, intrinsicmotivation, self-concept, and self-efficacy were larger (favoringmales) than in nations with less gender equity. Similarly, thegender difference in math anxiety—which was higher in girls thanin boys—was largest in nations with more gender equity. Theseeffects were medium to large in magnitude; notably, the GEM(which assesses women’s political and economic empowerment)explained 41% of the variance in gender differences in mathanxiety. Although the GEQ and SIGE were not significant mod-erators of gender differences in attitudes and affect, we see thesame unpredicted direction of significant effects in three of theseven models predicted by the GGI. These effects were medium inmagnitude.
Domain-specific indicators of gender equity.Achievement. We used multiple regression analysis in order to
assess the specific domains in which gender equity was linked tothe gender gaps in math. Each of the seven domain-specific indi-cators of gender equity was entered as a predictor of the twocomposite indices of gender differences in math achievement andthe seven gender differences in math attitudes and affect. Theresults (including R2, �, QW, and k) of these models appear inTable 7. Inspection of the results reveals two distinct patterns.First, gender differences in math achievement on the TIMSS werenegatively associated with gender ratios in primary, secondary,and tertiary school enrollment, as predicted by the gender stratifi-cation hypothesis. This pattern suggests that, in nations where girlshave more equal access to education, girls and boys tend toperform similarly on the TIMSS. Note that all children tested onthe TIMSS were enrolled in formal schooling at the eighth grade.Yet, when girls are not educated at the same rate as the boys intheir communities, the girls who are enrolled in school tend not toperform at the same level as their male classmates. The secondpattern that is apparent is that gender differences in math achieve-ment on the PISA were significantly and negatively predicted bywomen’s shares of research positions and parliamentary seats, aswell as by the male-to-female ratio in economic activity rates, aspredicted by the gender stratification hypothesis. These findingssuggest that, when women participate at the rate of men in thelabor market (particularly in science jobs) and in national govern-ment, the gender gap in math achievement on the PISA is smaller.
Attitudes and affect. In terms of attitudes and affect, resultsfollowed a pattern similar to that for achievement. As predicted,gender differences on the TIMSS attitudes scale of Self-Confidence in Math were negatively predicted by secondary andtertiary enrollment ratios, women’s share of research positions,and women’s share of higher labor market positions; this indicatedthat gender equity in education and upper level employment (par-ticularly science jobs) is reflected in smaller gender gaps in stu-dents’ math self-confidence. The gender difference on the TIMSSscale of Valuing Math was significantly predicted by the second-ary enrollment ratio and women’s shares of higher labor marketpositions and research jobs, also as predicted.
Similarly, gender differences in the PISA scale of ExtrinsicMotivation were significantly (and positively) predicted by male-to-female ratios in primary enrollment ratios. In contrast, genderdifferences in each of the PISA math attitudes and affect scaleswere significantly linked to women’s share of parliamentary seats.However, as with the models testing composite gender equityindices, each of these significant links was in the opposite of thepredicted direction. When women enjoy greater political represen-tation, gender differences in motivation, interest, self-concept, andself-efficacy (which were higher in boys) are larger and genderdifferences in anxiety (which was higher in girls) are smaller.These effects were medium in magnitude.
In order to determine the combined contributions of domain-specific gender equity indicators on gender differences in math, weentered significant moderators simultaneously into regressionmodels. Primary, secondary, and tertiary enrollment ratios ex-plained 25.5% of the variance in the gender gap in math achieve-ment on TIMSS. When entered into a regression model simulta-neously, secondary and tertiary enrollment ratios, women’s shareof higher labor market positions, and women’s share of researchjobs explained 36.4% of the variance in gender differences in mathself-confidence. The combined effect of secondary enrollmentratio, women’s share of higher labor market positions, and wom-en’s share of research jobs on students’ valuing of mathematicswas also substantial (R2 � .35). On the PISA-Math, economicactivity rate ratios, women’s share of research jobs, and women’sparliamentary representation explained 26.1% of the variance inthe gender gap for achievement. When entered into a regressionmodel simultaneously, primary enrollment ratios, women’s shareof research jobs, and women’s parliamentary representation ex-plained 51.7% of the variance in gender differences in extrinsicmotivation. The combined effect of tertiary enrollment ratios,women’s share of research jobs, and women’s parliamentary rep-resentation on intrinsic motivation was R2 � .41. Women’s shareof research jobs and parliamentary representation explained 34.4%of the variance in gender differences in math anxiety, 49% of thevariance in gender differences in self-concept, and 28% of thevariance in self-efficacy.
In sum, gender equity in various domains appears to explain asubstantial amount of cross-national variation in gender differ-ences in math achievement, attitudes, and affect. Across both theTIMSS and PISA attitudes and affect scales, gender differenceswere significantly predicted by women’s share of research posi-tions, such that nations with greater participation of women inscientific research show smaller gender differences in self-confidence, valuing math, intrinsic and extrinsic motivation, mathanxiety, self-efficacy, and self-concept.
Discussion
Does the magnitude of national gender differences on TIMSSand PISA warrant further publicity of a gender gap in mathperformance? We meta-analyzed these data sets and found evi-dence of gender similarities in mathematics achievement, despiteconsiderable cross-national variability in the direction and magni-tude of effects. Our findings are consistent with previous reportson gender similarities in math achievement in the United States(Hedges & Nowell, 1995; Hyde, Fennema, & Lamon, 1990; Hydeet al., 2008). Previous reports on the 2003 TIMSS and PISA by the
120 ELSE-QUEST, HYDE, AND LINN

IEA and OECD have supported our conclusions with these datasets (Mullis et al., 2004; OECD, 2004). Compared to those forprevious waves of data collection for these data sets, the averageeffect size has changed very little. For the 1982 SIMS, the genderdifference in math achievement (d � 0.03) was small and negli-gible (Baker & Jones, 1993); on the 1995 TIMSS, the genderdifference was d � 0.08 (Mullis, Martin, Fierros, Goldberg, &
Stemler, 2000). These data indicate a pattern of gender similaritiesin mean math achievement over 2 decades. Comparison of d foreach nation across the three IEA studies indicates that, for overhalf of all nations, the gender gap in math has remained near zeroor has even decreased in magnitude to become negligible. Forexample, in the United States, d � �0.01 in 1982, d � 0.05 in1995, and d � 0.06 in 2003.
Table 7Variance in Gender Differences in Mathematics Achievement and Attitudes Explained by Domain-Specific Indicators of GenderEquity (R2), Weighted Multiple Regression Coefficients (�), Residual Homogeneity Statistics (QW), and Number of Effect Sizes (k)
Content domain Prim. Sec. Tert. EACT HLM WR Parl.
TIMSSMath Composite
R2 0.13 0.17 0.14 0.00 0.08 0.07 0.01� �0.36� �0.41�� �0.37� 0.07 �0.29 �0.26 0.08QW 41.98 41.06 40.98 43.05 34.93 31.01 41.04k 42 41 41 43 35 31 41
Self-ConfidenceR2 0.08 0.16 0.12 0.02 0.15 0.29 0.08� �0.28 �0.41�� �0.35� 0.12 �0.38� �0.54�� 0.29QW 42.02 41.11 40.98 43.04 34.99 31.07 40.95k 42 41 41 43 35 31 41
Valuing MathR2 0.01 0.11 0.01 0.00 0.11 0.23 0.07� �0.08 �0.33� 0.12 0.02 �0.33� �0.48�� 0.26QW 42.01 41.15 40.99 43.01 35.07 30.98 40.88k 42 41 41 43 35 31 41
PISA
Math CompositeR2 0.01 0.01 0.08 0.13 0.08 0.10 0.09� 0.08 �0.10 �0.29 �0.37� �0.29 �0.32� �0.30�
QW 40.74 40.45 39.79 38.92 36.15 33.85 39.90k 39 39 39 38 35 33 38
Extrinsic MotivationR2 0.11 0.05 0.04 0.01 0.02 0.37 0.15� 0.33� �0.22 �0.20 �0.07 �0.15 �0.61�� 0.39��
QW 42.06 41.38 41.44 38.98 36.01 33.05 41.40k 40 40 40 39 36 33 39
Intrinsic MotivationR2 0.02 0.07 0.12 0.01 0.04 0.33 0.11� 0.13 �0.27 �0.35� �0.07 �0.19 �0.57�� 0.34�
QW 42.29 41.31 41.07 38.93 35.94 32.56k 40 40 40 39 36 33
AnxietyR2 0.00 0.01 0.01 0.02 0.08 0.23 0.17� �0.05 0.11 0.10 0.14 0.28 0.48�� �0.42��
QW 41.95 41.54 41.59 39.07 36.04 32.88 41.31k 40 40 40 39 36 33 39
Self-ConceptR2 0.01 0.03 0.08 0.00 0.07 0.36 0.21� 0.09 �0.18 �0.27 0.00 �0.26 �0.60�� 0.46��
QW 42.68 41.99 41.63 38.99 35.94 32.54 42.35k 40 40 40 39 36 33 39
Self-EfficacyR2 0.03 0.04 0.00 0.00 0.01 0.15 0.17� 0.18 �0.21 �0.06 0.00 �0.10 �0.39� 0.41��
QW 41.40 40.83 41.30 39.01 36.12 33.03 40.67k 40 40 40 39 36 33 39
Note. Prim. � male/female primary enrollment ratio; Sec. � male/female secondary enrollment ratio; Tert. � male/female tertiary enrollment ratio;EACT � male/female economic activity rate ratio; HLMP � women’s share of higher labor market positions; WR � women’s share of research positions;Parl. � women’s share of parliamentary seats; TIMSS � Trends in International Mathematics and Science Study; PISA � Programme for InternationalStudent Assessment.� p � .05. �� p � .01.
121GENDER DIFFERENCES IN MATH

The largest mean effect size in math achievement was in thecontent domain of Space/Shape on PISA (d � 0.15); this contentdomain assesses understanding of spatial relationships. The find-ing is consistent with historical evidence of gender differences inthe spatial skill of mental rotation (Linn & Petersen, 1985; Voyer,Voyer, & Bryden, 1995) and with the neglect of spatial skillinstruction in schools (National Research Council, 2006). Recentresearch shows that small amounts of instruction can produce largeincreases in spatial skills (Sorby, 2001; Sorby & Baartmans, 2000;Uttal, Hand, & Newcombe, 2009). Today, children have increas-ingly more computer experience, particularly in the form of play-ing videogames, which can improve mental rotation skills (Oka-gaki & Frensch, 1994) and in some cases eliminate genderdifferences in mental rotation (Saccuzzo, Craig, Johnson, & Lar-son, 1996). Furthermore, some research indicates that gender dif-ferences in videogame experiences mediate the gender differencein mental rotation (Terlecki & Newcombe, 2005).
Seven of the 11 mean effect sizes in math achievement weresignificant, though each was very small in magnitude; this pro-vides further support for the gender similarities hypothesis (Hyde,2005). Considerable cross-national variability in effect size mag-nitude and direction qualifies this finding. Although most nationaleffect sizes were very small or negligible, some were small ormedium, with males outperforming females in some cases andfemales outperforming males in others. These findings indicatethat the gender gap in math persists in some nations but not inothers.
Despite overall similarities in achievement, boys felt more con-fident and less anxious in their math abilities and were moreextrinsically and intrinsically motivated to do well in math thanwere girls, as consistent with previous research findings (Casey etal., 1997; Fredricks & Eccles, 2002; Hyde, Fennema, Ryan, et al.,1990; McGraw et al., 2006; Meece et al., 1990; Pajares & Miller,1994; Pomerantz, Altermatt, & Saxon, 2002). Boys also scoredone third of a standard deviation higher than girls on math self-concept and self-efficacy; these were the largest mean effect sizesin the meta-analysis. The intuitively contradictory finding of gen-der similarities in achievement and gender differences in attitudesand affect is consistent with previous research (Hyde, Fennema, &Lamon, 1990; Hyde, Fennema, Ryan, et al., 1990; Pomerantz etal., 2002) and may be influenced by a variety of factors. Pomerantzet al. (2002) explained this pattern of results with U.S. students asbeing rooted in girls’ greater concern for adult approval. That is,girls work hard to achieve in academics in order to please adults,but they also feel internal distress about disappointing those adultswhen they experience or anticipate academic failure. Because boysare less concerned with garnering adult approval, they are lessmotivated to achieve and are not deeply distressed by failing to doso. We must be cautious in generalizing such a pattern to othercultures. Other theoretical approaches are also informative. Con-sistent with Steele’s (1997) theory of stereotype threat, genderstereotypes about gender roles and math may encourage girls tofeel anxious and less confident (Steele, 1997). Alternatively, Rob-erts (1991) argued that girls and boys may approach such achieve-ment situations differently. Whereas boys, feeling self-confidentand capable, may respond positively to the competitive nature ofachievement testing, girls, feeling anxious, may respond nega-tively to the personally evaluative nature of the situation (Roberts,1991).
The link between math achievement and attitudes is complex.Although math achievement and attitudes are positively correlatedon the student level, they are strongly and negatively correlated onthe nation level (Shen & Tam, 2008). That is, nations with highmath achievement tend to have students with less positive mathattitudes. These nation-level data may reflect cultural standards formath achievement; in nations where math achievement is highlyvalued and where there is access to high-level math classes,students perceive math as being difficult and less enjoyable. Forexample, Japanese students outperform German students in mathachievement but hold higher standards for themselves and feelmore negatively about math (Randel, Stevenson, & Witruk, 2000).This pattern likely feeds back to the effort expended, such thatstudents work hard to meet the high cultural standards set for themand feel anxious about their achievement. It is unclear whether asimilar pattern explains gender differences in achievement andattitudes.
The Gender Stratification Hypothesis
The current study supported the gender stratification hypothesisin many analyses. In contrast to those of previously publishedreports (Baker & Jones, 1993; Guiso et al., 2008; Riegle-Crumb,2005), our results point to specific domains of gender equity thatmay be directly or indirectly responsible for gender gaps in math.Results from models using composite indicators of gender equitywere mixed. The gender differences on the PISA math compositeshowed some association with composite indices of gender equity;the GEM and GGI were the best composite predictors of thegender gap in math achievement, attitudes, and affect on PISA. Incontrast, the TIMSS math composite showed no association withthe composite indices of gender equity. Analyses of specific do-mains of gender equity are more revealing and indicate that genderequity in education and research jobs is most relevant.
The gender differences in math achievement and attitudes onTIMSS were consistently associated with gender ratios in schoolenrollment. This is perhaps not surprising, in light of the IEA’sfocus on classroom teaching and student learning. That is, becauseof its emphasis on assessing intended and attained curricula,TIMSS should be more sensitive to variations in the characteristicsof curricula or educational institutions. In contrast, with PISA’semphasis on practical application and literacy, variations in social,economic, or cultural forces should be more relevant to test per-formance. Overall, these findings suggest that, consistent with thegender stratification hypothesis, gender equity in education isimportant not only for girls’ math achievement but also for girls’self-confidence and valuing of mathematics. If girls recognize thatthey have the same rights to formal education that their male peersdo, they may feel it is appropriate to work hard and invest in theireducation. Alternatively, if it is apparent that the education of girlsis not highly valued in their community, it is likely that girls willnot value their own educational achievements and will withdrawfrom achievement opportunities. If girls are outnumbered by boysin the classroom, their identity as girls becomes more salient andthe risk for deleterious stereotype-threat effects is increased. Sucharguments may be used to support gender-segregated education,insofar as a single-sex classroom removes gender from the learn-ing process. Yet, evidence for such claims is mixed. Using TIMSS2003 data, Wiseman (2008) found that nations with high percent-
122 ELSE-QUEST, HYDE, AND LINN

ages of gender-segregated math classrooms displayed considerablevariability in gender differences in math achievement, whereasnations with few or no gender-segregated math classrooms dis-played a pattern of gender similarities in achievement. Althoughcausal inferences are unwarranted with the current data, whenconsidered from the theoretical perspectives discussed herein, ourresults suggest that improving girls’ access to formal educationwill not only increase the number of girls being educated but mayalso be a factor in higher achievement of the girls who are enrolled.Future research should focus on examining the psychologicalmechanisms responsible for the link between gender equity inenrollment and gender differences in math attitudes and achieve-ment, as described by Eccles’s expectancy-value theory,Bandura’s social cognitive theory, and Eagly and Wood’s socialstructural theory.
Gender equity in research jobs was also a consistent and strongpredictor of the gender gap in math achievement, attitudes, andaffect. This gender equity indicator comes closest to assessing thecultural mechanisms suggested by the gender stratification hypoth-esis and our theoretical foundation, which rests on psychologicalmechanisms proposed by social structural theory, expectancy-value theory, and cognitive social learning theory. That is, whengirls develop in a societal context where women have careers inscientific research, they receive a clear message that STEM iswithin the realm of possibilities for them. Conversely, if girls’mothers, aunts, and sisters do not have STEM careers, they willperceive that STEM is a male domain and thus feel anxious aboutmath, lack the confidence to take challenging math courses, andunderachieve on math tests. Consistent with cognitive social learn-ing theory and expectancy-value theory, girls need to observewomen engaging in STEM in order to perceive STEM as a viableoption for themselves. These findings provide substantive supportfor the gender stratification hypothesis and direct our attention tospecific mechanisms responsible for gender gaps in math achieve-ment, attitudes, and affect.
The gender stratification hypothesis maintains that indicators ofsocietal gender equity predict gender differences in achievement,attitudes, and affect because the observed lower social status ofwomen leads girls to achieve less and think and feel negativelyabout math. However, the reverse process is also possible—thatwomen have lower social status as a result of gender differences inmath achievement, attitudes, and affect. For example, the under-representation of women in research jobs might be, in part, a resultof poorer performance in math by girls relative to boys; however,this cannot explain why girls perform more poorly than boys insome nations but not in others. The link between achievement andgender equity may be reciprocal, such that the underrepresentationof women in research jobs and the relatively poorer performanceof girls in math in some nations perpetuate one another. Yet, it ismuch less plausible that indicators of gender equity such as en-rollment ratios operate in this way. Although a dynamic andbidirectional process between societal gender equity and genderdifferences in math cannot be tested with these data, evidence ofsuch a process would underscore the importance of initiativesaimed at improving both the social status of women and girls’math performance.
The finding that more negative attitudes and affect among girls(relative to boys) on the PISA were predicted by a greater wom-en’s share of parliamentary seats ran contrary to our predictions
based on the gender stratification hypothesis. This finding appearscontradictory when juxtaposed to the pattern of results in TIMSSmath achievement and gender equity in enrollment ratios andresearch jobs. Yet, others have reported similar trends with regardto self-construals (Guimond et al., 2007), personality (Costa, Ter-racciano, & McCrae, 2001; McCrae, Terracciano, et al., 2005;Schmitt et al., 2008), emotion (Fischer & Manstead, 2000; Fischer,Rodriguez Mosquera, van Vianen, & Manstead, 2004), and values(Schwartz & Rubel, 2005). Most germane to the current study arethe findings of Fischer and Manstead (2000), who analyzed genderdifferences in seven emotions across 37 cultures. They foundlarger gender differences in emotional intensity, duration, andexperience in nations with higher GEM scores than in nations withlower GEM scores. This pattern was shown with the emotion offear (as well as the six other emotions studied) and is thus relevantto our results on anxiety. How can we explain this apparentlywidespread finding that greater societal gender equity is associatedwith larger gender differences in some psychological constructs?
To explain why cultures that are more gender stratified actuallytend to demonstrate patterns of gender similarities in many, thoughnot all, psychological constructs, Guimond et al. (2007) integratedseveral social psychological theories about self-construal, socialcomparison, and power distance. Drawing from the work of Crossand Madson (1997), Guimond et al. proposed that gender differ-ences in self-construals (a) account for gender differences invalues, motivations, and emotions and (b) exist under conditions inwhich individuals make intergroup social comparisons (i.e., whenthey compare themselves to an out-group, such as the other gen-der) but not when individuals make intragroup social comparisons(i.e., when they compare themselves to their in-group, such asothers within their gender). Consistent with theories of shiftingstandards in social comparisons (Biernat, 2005), individuals tendto self-stereotype or assimilate when they make intergroup socialcomparisons but tend to display contrast effects when they makeintragroup social comparisons. Thus, girls may characterize theirmath anxiety as relatively high if their comparison group is boysbut as relatively low if their comparison group is other girls. Thetendency to engage in intergroup or intragroup social comparisonvaries cross-culturally, according to power distance (Guimond etal., 2007). Power distance is a cultural dimension that refers to theextent to which a society is stratified on the basis of socialcharacteristics such as gender (Hofstede, 1980). High power-distance cultures (PDCs) tend to have rigid social hierarchies andto prohibit informal interactions between people of differing socialstrata, whereas lower PDCs tend to have more egalitarian socialstructures that encourage interactions among people of differingstrata. As such, high PDCs discourage intergroup social compar-isons in favor of intragroup social comparisons, whereas low PDCsdo the reverse. High PDCs are inherently gender unequal, whereaslow PDCs are inherently more gender equitable. Thus, individualsfrom high PDCs (e.g., Saudi Arabia) tend to engage in within-gender comparisons, resulting in a pattern of gender similarities. Incontrast, individuals from low PDCs (e.g., Norway) tend to engagein between-gender comparisons, resulting in a pattern of genderdifferences. That gender equity was negatively associated withgender differences in math attitudes and affect in the current studyis consistent with this theoretical perspective.
An alternative explanation of these unexpected findings drawson Maslow’s theory of the hierarchy of needs (1954), which
123GENDER DIFFERENCES IN MATH

maintains that higher needs, such as feeling confident about one’sabilities, require better economic, political, and educational con-ditions than do more basic needs, such as finding employment orcaring for one’s family. Individuals who are so oppressed andimpoverished that they struggle to meet their survival and securityneeds cannot even think of meeting the esteem needs near the topof the pyramid. Girls who live in a society where they face majorinequities because of their gender may be too consumed withmeeting their most basic needs to think about such things as howanxious they feel about math or whether they feel good about theirmath skills. Consistent with this interpretation, nations with pooreconomic, educational, and political welfare generally tend toreport the lowest mean levels (across both genders) of mathanxiety, self-efficacy, self-confidence, and motivation (OECD,2004). That is, the experience of math attitudes and affect may bea luxury, most often experienced by individuals who are notpreoccupied with meeting more basic needs. This pattern of find-ings points to the importance not only of gender equity but also ofhuman development.
Increases in women’s agency—through improved education,economic opportunities, and property ownership—are central tohuman development (Sen, 1999; UNDP, 1995). Nobel laureateAmartya Sen maintained that
the relative respect and regard for women’s well-being is stronglyinfluenced by such variables as women’s ability to earn an indepen-dent income, to find employment outside the home, to have ownershiprights and to have literacy and be educated participants in decisionswithin and outside the family. (Sen, 1999, p. 191)
That is, women’s agency and empowerment are crucial to wom-en’s welfare. Thus, the assessment of women’s individual andcollective agency and empowerment is an important issue forstudy among social scientists (see special issue 7(2) of the Journalof Human Development for reviews of this topic) and psycholo-gists in particular (Grabe, in press). The varied convergent validity(as can be seen in Table 4) and predictive power of the fourcomposite gender equity indices point to this issue. Although theindices tend to be composed of similar indicators—such as lifeexpectancy, enrollment ratios, and parliamentary representation—the relative weight of each indicator influences the meaning andrelevance of the indices. The GEQ is simple to compute, and datafor most nations are readily available; however, it was not asreliably linked to the predicted gender gaps in math as the GEMand GGI were. Although the multidimensional nature of the GGIis appealing, the index is complicated and difficult to compute,even for the small number of nations with available data. Simi-larly, the GEM cannot be computed for all UNDP nations becauseso many of them lack high-quality estimates of its components.Nonetheless, from the perspective of the gender stratification hy-pothesis, the GEM was a good predictor of gender differences inmath and a valid indicator of societal gender equity.
Future research on the inherently interdisciplinary topic of so-cietal stratification by gender must address the complexities ofmeasuring gender equity with composite indices. Specific domainsof gender equity should be conceptualized as distinct from oneanother; gender equity in educational access and gender equity inpolitical agency are not highly correlated and do not likely reflecta monolithic construct. Future research on societal gender equitymust make precise predictions about the specific domain of gender
equity that is theoretically relevant in order to be truly informative.The current study improves upon previous research in this regard.
Two international math assessments were meta-analyzed in thecurrent study, and this provided an opportunity to compare find-ings between the data sets. When we compare the 18 nationsparticipating in both TIMSS and PISA, it is apparent that the testsdiffer in their assessment of math achievement. The effect sizesfound for gender differences in math achievement on TIMSS andPISA were not significantly correlated. TIMSS showed a strongerpattern of gender similarities, and PISA showed a pattern of a(albeit very small) male advantage in its content domains (notably,Space/Shape). In terms of attitudes, the magnitude of the genderdifference on the PISA and TIMSS scales of Self-Concept andSelf-Confidence in Math were highly correlated, though the PISAscale showed a significantly larger gender difference. Differencesbetween TIMSS and PISA in these assessments have been notedby other researchers (Hutchison & Schagen, 2007) and remain anarea of controversy among experts on cross-national math testing.These varying patterns of results in achievement may be under-stood best in the context of the explicit aims of TIMSS and PISA.Whereas TIMSS claims to assess the attained curriculum (i.e.,what students have learned from the curriculum), PISA focuses onthe concept of literacy, aiming to assess the abilities of students touse their mathematics knowledge and skills in the “real world.”The TIMSS focus on the attained curriculum appears to be re-flected in our finding that gender equity in enrollments signifi-cantly predicted the gender gap in math achievement on TIMSSbut not PISA. Similarly, the pattern of gender differences found onPISA, with its focus on real-world applications, may be moresensitive to societal gender inequity. PISA may tap informal,out-of-school learning more than does TIMSS. Relative to girls,boys acquire more of this relevant knowledge from activities suchas playing football, roaming about their neighborhoods, and play-ing videogames (Matthews, 1986, 1987). This might explain theslightly larger gender differences found on PISA than on TIMSS.
An alternative explanation for the larger gender differences onPISA is rooted in the greater male variability hypothesis, whichwould predict larger gender differences on more challenging mathproblems. Some have argued that PISA tests deeper mathematicalskills that require students to integrate different existing kinds ofknowledge (Hutchison & Schagen, 2007). Our analysis of thelimited items made publicly available and the cognitive complex-ity classification schemes provided by the IEA and OECD sup-ports such an argument. Three quarters of the items on TIMSSassess a DoK limited to recall and routine problem solving, withfew items requiring students to use creative or strategic reasoningand problem-solving skills. In addition, whereas TIMSS testsrecall of abstract knowledge of mathematics primarily withmultiple-choice items, PISA tests application of mathematics pri-marily with constructed response items. Yet, our meta-analyses ofthe gender gap across the three cognitive domains on TIMSSindicate that boys did not perform better than girls on the morechallenging problems that require creative or strategic reasoningand problem-solving skills. Although the results from this studydemonstrate that TIMSS and PISA assess mathematics perfor-mance differently, both assessments showed very small genderdifferences at best. Thus, comparisons between TIMSS and PISAregarding test difficulty should not be overplayed as support forthe greater male variability hypothesis.
124 ELSE-QUEST, HYDE, AND LINN

Strengths and Limitations
None of the nations included in both PISA and TIMSS werecharacterized as low in human development in 2003 when studentswere tested, according to the UNDP. Nations low in human de-velopment have, by definition, poorer access to education; overallachievement on PISA and TIMSS assessments is strongly linked tohuman development. The nations with the lowest 2003 HDI valuesin the current analyses include Ghana, Morocco, Botswana, andEgypt. Of course, human development is much broader than whatthe HDI measures; by measures such as adult illiteracy rates andthe probability at birth of not surviving to age 40, several of thenations in the TIMSS are conspicuously impoverished and under-developed. For example, Botswana ranks as one of the poorestnations in the world according to the UNDP’s Human PovertyIndex, and children in South Africa are less likely than children inmost of the low HDI nations to reach Grade 5 in schooling (UNDP,2003). It is likely that the limited access to formal schooling in lessdeveloped nations is greater for girls; nations with a medium orhigh HDI have significantly more equitable gender ratios in com-bined primary, secondary, and tertiary enrollment than do nationswith a low HDI. Yet, high human development does not guaranteeequal status of women: There are nations with high HDI values butvery low GEM values (e.g., Japan and Korea). It is unclear howgirls and boys in very low development nations compare in mathachievement, attitudes, and affect or how societal gender stratifi-cation is reflected in those comparisons; if the gender stratificationhypothesis is correct and our findings are not anomalous, weshould expect larger effects with a broader sample. TIMSS andPISA—and secondary analyses of those assessments, such as thecurrent study—would be strengthened if low human developmentnations were included in their samples. Of course, given that PISAincludes only OECD nations, this limitation is more likely to beovercome by the IEA; indeed, TIMSS has generally increased itsrepresentation of less developed nations with each testing cycle.
Although studies in the 1990s demonstrated that gender differ-ences in mathematics achievement emerge during adolescence(e.g., Hyde, Fennema, & Lamon, 1990), more recent data suggestthat this gap has closed, at least in the United States (Hyde et al.,2008). The results of the current study are particularly significantin this developmental context because the students tested werebetween 14 and 16 years of age, precisely the ages when genderdifferences emerged in earlier studies. The overall pattern in thecurrent data for many nations was one of gender similarities.
The current meta-analysis included math achievement, attitudes,and affect scores from 493,495 students across 69 nations. As aresult of the statistical power afforded by the large TIMSS andPISA samples, the mean effect sizes reported here are reliableestimates of gender differences in math achievement, attitudes, andaffect in the population. Yet, because reliable data necessary forthe computation of both composite indices and domain-specificindicators of gender equity were not available for some nations,the multiple regression analyses used to test the gender strati-fication hypothesis had sufficient statistical power to detectmedium but not small effect sizes (R2 � .10; Cohen, 1988).This limited statistical power requires that we make conserva-tive conclusions.
Conclusions
This meta-analysis provides further evidence that, on average,males and females differ very little in mathematics achievement,despite more positive math attitudes and affect among males. Yet,these findings of mean similarities in math are qualified by sub-stantial variability across nations. Moderator analyses indicatedthat considerable cross-national variability in the gender gap canbe explained by important national characteristics reflecting thestatus and welfare of women. Also, while differences within edu-cation systems, schools, and classrooms are critical influences onstudent achievement on TIMSS and PISA (OECD, 2004), themagnitude of gender differences in math also depends, in part,upon the quality of the assessment of mathematics achievement. Ifmath assessments measure abilities that are not present in thecurriculum, societal perceptions of their importance are likely toaffect informal learning experiences and, in turn, achievement.Factors that have more direct influences on children’s learning—for example, quality of instruction and curriculum—may serve tomediate the effect of gender inequity on math achievement. Inparticular, the value that schools, teachers, families, and childrenplace on girls learning math should be a focus of future cross-national research on the gender stratification hypothesis. Consis-tent with the predictions of the gender stratification hypothesis andthe psychological theories posited by Eccles (1994); Bandura(1986), and Eagly and Wood (1999), girls will perform at the samelevel as their male classmates when they are encouraged to suc-ceed, are given the necessary educational tools, and have visiblefemale role models excelling in mathematics.
References
Aronson, J., & McGlone, M. S. (2008). Stereotype and social identitythreat. In Nelson, T. (Ed.), The handbook of prejudice, stereotyping, anddiscrimination (pp. 153–178). New York, NY: Psychology Press.
Baker, D. P., & Jones, D. P. (1993). Creating gender equality: Cross-national gender stratification and mathematical performance. Sociologyof Education, 66, 91–103.
Bandura, A. (1986). Social foundations of thought and action: A socialcognitive theory. Englewood Cliffs, NJ: Prentice-Hall.
Bandura, A., Barbaranelli, C., Caprara, G. V., & Pastorelli, C. (2001).Self-efficacy beliefs as shapers of children’s aspirations and careertrajectories. Child Development, 72, 187–206.
Bhana, D. (2005). “I’m the best in maths. Boys rule, girls drool.” Mascu-linities, mathematics, and primary schooling. Perspectives in Education,23, 1–10.
Biernat, M. (2005). Standards and expectancies: Contrast and assimilationin judgments of self and others. New York, NY: Routledge.
Blascovich, J., Spencer, S. J., Quinn, D. M., & Steele, C. M. (2001).Stereotype threat and the cardiovascular reactivity of African-Americans. Psychological Science, 12, 225–229.
Bussey, K., & Bandura, A. (1999). Social cognitive theory of genderdevelopment and differentiation. Psychological Review, 106, 676–713.
Byrnes, J. P. (2005). Gender differences in math: Cognitive processes in anexpanded framework. In A. Gallagher & J. Kaufman (Eds.), Genderdifferences in mathematics: An integrative psychological approach (pp.73–98). New York, NY: Cambridge University Press.
Casey, M. B., Nuttall, R. L., & Pezaris, E. (1997). Mediators of genderdifferences in mathematics college entrance test scores: A comparison ofspatial skills with internalized beliefs and anxieties. DevelopmentalPsychology, 33, 669–680.
Ceci, S. J., & Williams, W. M. (2007). Why aren’t more women in science?
125GENDER DIFFERENCES IN MATH

Top researchers debate the evidence. Washington, DC: American Psy-chological Association.
Cohen, J. (1988). Statistical power analysis for the behavioral sciences.Hillsdale, NJ: Erlbaum.
Costa, P. T., Jr., Terracciano, A., & McCrae, R. R. (2001). Genderdifferences in personality traits across cultures: Robust and surprisingfindings. Journal of Personality and Social Psychology, 81, 322–331.
Cross, S. E., & Madson, L. (1997). Models of the self: Self-construals andgender. Psychological Bulletin, 122, 5–37.
Dijkstra, A. G. (2002). Revisiting UNDP’s GDI and GEM: Towards analternative. Social Indicators Research, 57, 301–338.
Dijkstra, A. G. (2006). Towards a fresh start in measuring gender equality:A contribution to the debate. Journal of Human Development, 7, 275–283.
Dwyer, C. A., & Johnson, L. M. (1997). Grades, accomplishments andcorrelates. In W. A. Willingham & N. S. Cole (Eds.), Gender and fairassessment (pp. 127–156). Mahwah, NJ: Erlbaum.
Eagly, A. H. (1987). Sex differences in social behavior: A social-roleinterpretation. Hillsdale, NH: Erlbaum.
Eagly, A. H., & Wood, W. (1999). The origins of sex differences in humanbehavior. American Psychologist, 54, 408–423.
Eccles, J. S. (1994). Understanding women’s educational and occupationalchoices: Applying the Eccles et al. model of achievement-relatedchoices. Psychology of Women Quarterly, 18, 585–610.
Fennema, E., Peterson, P. L., Carpenter, T. P., & Lubinski, C. A. (1990).Teachers’ attributions and beliefs about girls, boys, and mathematics.Educational Studies in Mathematics, 21, 55–69.
Fennema, E., & Sherman, J. (1977). Sex-related differences in mathematicsachievement, spatial visualization, and affective factors. American Ed-ucational Research Journal, 14, 51–71.
Fischer, A., & Manstead, A. (2000). The relation between gender andemotion in different cultures. In A. Fischer (Ed.), Gender and emotion:Social psychological perspectives (pp. 71–94). London, England: Cam-bridge University Press.
Fischer, A. H., Rodriguez Mosquera, P. M., van Vianen, A. E. M., &Manstead, A. S. R. (2004). Gender and culture differences in emotion.Emotion, 4, 87–94.
Fredricks, J. A., & Eccles, J. S. (2002). Children’s competence and valuebeliefs from childhood through adolescence: Growth trajectories in twomale-sex-typed domains. Developmental Psychology, 38, 519–533.
Frome, P. M., & Eccles, J. S. (1998). Parents’ influence on children’sachievement-related perceptions. Journal of Personality and Social Psy-chology, 74, 435–452.
Grabe, S. (in press). Women’s human rights and empowerment in atransnational, globalized context: What’s psychology got to do with it?In M. Paludi (Ed.), Feminism and women’s rights worldwide. Westport,CT: Praeger Publishers/Greenwood Publishing Group.
Guimond, S., Branscombe, N. R., Brunot, S., Buunk, A. P., Chatard, A.,Desert, M., . . . Yzerbyt, V. (2007). Culture, gender, and the self:Variations and impact of social comparison processes. Journal of Per-sonality and Social Psychology, 92, 118–1134.
Guiso, L., Monte, F., Sapienza, P., & Zingales, L. (2008, May 30). Culture,gender, and math. Science, 320, 1164–1165.
Halpern, D. F., Benbow, C. P., Geary, D. C., Gur, R., Hyde, J. S., &Gernsbacher, M. A. (2007). The science of sex differences in scienceand mathematics. Psychological Science in the Public Interest, 8, 1–51.
Hausmann, R., Tyson, L. D., & Zahidi, S. (2007). The global gender gapreport 2007. Geneva, Switzerland: World Economic Forum.
Hedges, L. V., & Becker, B. J. (1986). Statistical methods in the meta-analysis of research on gender differences. In J. S. Hyde & M. C. Linn(Eds.), The psychology of gender: Advances through meta-analysis (pp.14–50). Baltimore, MD: Johns Hopkins University Press.
Hedges, L. V., & Nowell, A. (1995, July 7). Sex differences in mental test
scores, variability, and numbers of high-scoring individuals. Science,269, 41–45.
Hedges, L. V., & Vevea, J. L. (1998). Fixed- and random-effects models inmeta-analysis. Psychological Methods, 3, 486–504.
Hofstede, G. (1980). Culture’s consequences: International differences inwork-related values. Beverly Hills, CA: Sage.
Hutchison, D., & Schagen, I. (2007). Comparisons between PISA andTIMSS: Are we the man with two watches? In Loveless, T. (Ed.),Lessons learned: What international assessments tell us about mathachievement (pp. 227–261). Washington, DC: Brookings.
Hyde, J. S. (2005). The gender similarities hypothesis. American Psychol-ogist, 60, 581–592.
Hyde, J. S., Fennema, E., & Lamon, S. (1990). Gender differences inmathematics performance: A meta-analysis. Psychological Bulletin,107, 139–155.
Hyde, J. S., Fennema, E., Ryan, M., Frost, L. A., & Hopp, C. (1990).Gender comparisons of mathematics attitudes and affect. Psychology ofWomen Quarterly, 14, 299–324.
Hyde, J. S., Lindberg, S. M., Linn, M. C., Ellis, A., & Williams, C. (2008,July 25). Gender similarities characterize math performance. Science,321, 494–495.
Hyde, J. S., & Mertz, J. E. (2009). Gender, culture, and mathematicsperformance. Proceedings of the National Academy of Sciences, USA,106, 8801–8807.
International Labour Organization. (1990). International standard classi-fication of occupations. Geneva, Switzerland: Author.
International Association for the Evaluation of International Achievement.(2007). TIMSS 2003 mathematics items: Released set eighth grade.Chestnut Hill, MA: International Study Center, Lynch School of Edu-cation, Boston College.
Jacobs, J., Davis-Kean, P., Bleeker, M., Eccles, J., & Malanchuk, O.(2005). “I can, but I don’t want to”: The impact of parents, interests, andactivities on gender differences in math. In A. Gallagher & J. Kaufman(Eds.), Gender differences in mathematics: An integrative psychologicalapproach (pp. 73–98). New York, NY: Cambridge University Press.
Kenney-Benson, G., Pomerantz, E., Ryan, A., & Patrick, H. (2006). Sexdifferences in math performance: The role of children’s approach toschoolwork. Developmental Psychology, 42, 11–26.
Kimball, M. M. (1989). A new perspective on women’s math achievement.Psychological Bulletin, 105, 198–214.
Li, Q. (1999). Teachers’ beliefs and gender differences in mathematics: Areview. Educational Research, 41, 63–76.
Linn, M. C., & Petersen, A. C. (1985). Emergence and characterization ofsex differences in spatial ability: A meta-analysis. Child Development,56, 1479–1498.
Lipsey, M. W., & Wilson, D. B. (2001). Practical meta-analysis. ThousandOaks, CA: Sage.
Machin, S., & Pekkarinen, T. (2008, November 28). Global sex differencesin test score variability. Science, 322, 1331–1332.
Martin, M. O., Mullis, I. V. S., & Chrostowski, S. J. (Eds.). (2004). TIMSS2003 technical report. Chestnut Hill, MA: TIMSS & PIRLS Interna-tional Study Center, Boston College.
Maslow, A. H. (1954). Motivation and personality. New York, NY: Harper& Row.
Matthews, M. H. (1986). The influence of gender on the environmentalcognition of young boys and girls. Journal of Genetic Psychology, 147,295–302.
Matthews, M. H. (1987). Sex differences in spatial competence: The abilityof young children to map “primed” unfamiliar environments. Educa-tional Psychology, 7, 77–90.
McCrae, R. R., Terracciano, A., & 79 members of the Personality Profilesof Cultures Project. (2005). Personality profiles of cultures: Aggregatepersonality traits. Journal of Personality and Social Psychology, 89,407–425.
126 ELSE-QUEST, HYDE, AND LINN

McGraw, R., Lubienski, S. T., & Strutchens, M. E. (2006). A closer lookat gender in NAEP mathematics achievement and affect data: Intersec-tions with achievement, race/ethnicity, and socioeconomic status. Jour-nal of Research in Mathematics Education, 37, 129–150.
Meece, J. L., Eccles-Parsons, J., Kaczala, C. M., Goff, S. B., & Futterman,R. (1982). Sex differences in math achievement: Toward a model ofacademic choice. Psychological Bulletin, 91, 324–348.
Meece, J. L., Wigfield, A., & Eccles, J. S. (1990). Predictors of mathanxiety and its consequences for young adolescents’ course enrollmentintentions and performance in mathematics. Journal of EducationalPsychology, 82, 60–70.
Mullis, I. V., & Martin, M. O. (2007). TIMSS in perspective: Lessonslearned from IEA’s four decades of international mathematics assess-ments. In Loveless, T. (Ed.), Lessons learned: What international as-sessments tell us about math achievement (pp. 9–36). Washington, DC:Brookings.
Mullis, I. V., Martin, M. O., Fierros, E. G., Goldberg, A. L., & Stemler,S. E. (2000). Gender differences in achievement: IEA’s Third Interna-tional Mathematics and Science Study. Chestnut Hill, MA: InternationalStudy Center, Lynch School of Education, Boston College.
Mullis, I. V. S., Martin, M. O., & Foy, P. (2005). IEA’s TIMSS 2003international report on achievement in the mathematics cognitive do-mains. Chestnut Hill, MA: Boston College.
Mullis, I. V., Martin, M. O., Gonzalez, E. J., & Chrostowski, S. J. (2004).TIMSS 2003 international mathematics report. Chestnut Hill, MA: In-ternational Study Center, Lynch School of Education, Boston College.
National Academy of Sciences. (2006). Beyond bias and barriers: Fulfill-ing the potential of women in academic science and engineering. Wash-ington, DC: National Academies Press.
National Research Council. (2006). Learning to think spatially: GIS as asupport system in the K–12 curriculum. Washington, DC: NationalAcademies Press.
OECD. (2003). The PISA 2003 assessment framework. Paris, France:Author.
OECD. (2004). Learning for tomorrow’s world: First results from PISA2003. Paris, France: Author.
Okagaki, L., & Frensch, P. (1994). Effects of videogame playing onmeasures of spatial performance: Gender effects in late adolescence.Journal of Applied Developmental Psychology, 15, 33–58.
Pajares, F., & Miller, M. D. (1994). Role of self-efficacy and self-conceptbeliefs in mathematical problem solving: A path analysis. Journal ofEducational Psychology, 86, 193–203.
Penner, A. M. (2008). Gender differences in extreme mathematicalachievement: An international perspective on biological and social fac-tors. American Journal of Sociology, 114, S138–S170.
Pinel, E. C. (1999). Stigma consciousness: The psychological legacy ofsocial stereotypes. Journal of Personality and Social Psychology, 76,114–128.
Pomerantz, E. M., Altermatt, E. R., & Saxon, J. L. (2002). Making thegrade but feeling distressed: Gender differences in academic perfor-mance and internal distress. Journal of Educational Psychology, 94,396–404.
Porter, A. C., & Gamoran, A. (Eds.) (2002). Methodological advances incross-national surveys of educational achievement. Washington, DC:National Academy Press.
Randel, B., Stevenson, H. W., & Witruk, E. (2000). Attitudes, beliefs, andmathematics achievement of German and Japanese high school students.International Journal of Behavioral Development, 24, 190–198.
Riegle-Crumb, C. (2005). The cross-national context of the gender gap inmath and science. In L. Hedges & B. Schneider (Eds.), The socialorganization of schooling (pp. 227–243). New York, NY: Russell SageFoundation.
Roberts, T.-A. (1991). Gender and the influence of evaluations on self-
assessments in achievement settings. Psychological Bulletin, 109, 297–308.
Saccuzzo, D. P., Craig, A. S., Johnson, N. E., & Larson, G. E. (1996).Gender differences in dynamic spatial abilities. Personality and Individ-ual Differences, 21, 599–607.
Schmitt, D. P., Realo, A., Voracek, M., & Allik, J. (2008). Why can’t aman be more like a woman? Sex differences in Big Five personalitytraits across 55 cultures. Journal of Personality and Social Psychology,94, 168–182.
Schuler, D. (2006). The uses and misuses of the Gender-Related Devel-opment Index and Gender Empowerment Measure: A review of theliterature. Journal of Human Development, 7, 161–181.
Schwartz, S. H., & Rubel, T. (2005). Sex differences in value priorities:Cross-cultural and multimethod studies. Journal of Personality andSocial Psychology, 89, 1010–1028.
Sen, A. (1999). Development as freedom. New York, NY: Knopf.Shen, C., & Tam, H. P. (2008). The paradoxical relationship between
student achievement and self-perception: A cross-national analysisbased on three waves of TIMSS data. Educational Research and Eval-uation, 14, 87–100.
Sorby, S. A. (2001). A course in spatial visualization and its impact on theretention of female engineering students. Journal of Women and Minor-ities in Science and Engineering, 7, 153–172.
Sorby, S. A., & Baartmans, B. J. (2000). The development and assessmentof a course for enhancing the 3-D spatial visualization skills of first-yearengineering students. Journal of Engineering Education, 89, 301–307.
Spelke, E. S. (2005). Sex differences in intrinsic aptitude for mathematicsand science? American Psychologist, 60, 950–958.
Spencer, S. J., Steele, C. M., & Quinn, D. M. (1999). Stereotype threat andwomen’s math performance. Journal of Experimental Social Psychol-ogy, 35, 4–28.
Steele, C. M. (1997). A threat in the air: How stereotypes shape intellectualidentity and performance. American Psychologist, 52, 613–629.
Stetsenko, A., Little, T. D., Gordeeva, T., Grasshof, M., & Oettingen, G.(2000). Gender effects in children’s beliefs about school performance: Across-cultural study. Child Development, 71, 517–527.
Terlecki, M. S., & Newcombe, N. S. (2005). How important is the digitaldivide? The relation of computer and videogame usage to gender dif-ferences in mental rotation ability. Sex Roles, 53, 433–441.
United Nations Development Programme. (1995). Human developmentreport 1995. New York, NY: Oxford University Press.
United Nations Development Programme. (2003). Human developmentreport 2003. New York, NY: Oxford University Press.
UNESCO Institute for Statistics. (November 2006). Women in science:Under-represented and under-measured. UIS Bulletin on Science andTechnology Statistics (3).
Uttal, D. H., Hand, L. L., & Newcombe, N. S. (2009, April). Malleabilityof spatial cognition: Results of a meta-analysis. Paper presented at thebiennial meeting of the Society for Research in Child Development,Denver, CO.
Voyer, D., Voyer, S., & Bryden, M. P. (1995). Magnitude of sex differ-ences in spatial abilities: A meta-analysis and consideration of criticalvariables. Psychological Bulletin, 117, 250–270.
White, H. (1997). Patterns of gender discrimination: An examination of theUNDP’s Gender Development Index. The Hague, the Netherlands: In-stitute of Social Studies.
Wiseman, A. W. (2008). A culture of (in)equality?: A cross-national studyof gender parity and gender segregation in national school systems.Research in Comparative & International Education, 3, 179–201.
Received October 9, 2008Revision received August 16, 2009
Accepted October 6, 2009 �
127GENDER DIFFERENCES IN MATH