Embed Size (px)
Citation preview

First IMF Statistical ForumStatistics for Global Economic and Financial Stability
Cross-Border Capital Flows Statistics
and Its Implication for Monitoring in China
Wang Xiaoyi State Administration of Foreign Exchange
Paper presented at the First IMF Statistical Forum Washington, D.C. | November 12–13, 2013
The views expressed in this paper are those of the author(s) only, and the presence of them, or of links to them, on the IMF website does not imply that the IMF, its Executive Board, or its management endorses or shares the views expressed in the paper.

1
Capital Flow Monitoring
How Statistics Are
Applied In This Key Task
WANG Xiaoyi
Deputy Administrator, State Administration of Foreign Exchange
ⅠThe Importance of Statistics in Monitoring Capital Flows
The role of international capital flows in promoting economic development has been widely
discussed in policy and academic circles. The benefits can include higher investment and
additional capital stock that contribute to economic growth while advanced production
technology and management expertise speed up industrialization and enhance financial
services capabilities1. The rapid economic development of the Four Asian Tigers, some Latin
American countries, and other emerging markets has been closely associated with international
capital inflows.
However, there are also concerns over the costs of international capital mobility, especially from
excessive capital flows which may lead to internal and external economic imbalances. For
example, large-scale capital inflows could affect the independence of monetary policy, increase
money supply and in turn add to inflationary pressures and create asset bubble risks.
Additionally, for surplus countries they can aggravate balance of payments (BOP) distortions and
lead to currency appreciation pressure. Conversely, large-scale capital outflows could have
negative effects on a country's international credit rating, undermine investor confidence and
lead to currency devaluation pressure and BOP deficit risks. In particular, large and dramatic
movements of short-term speculative capital could endanger financial stability and even lead to
financial crisis. The Latin American debt crisis and the Asian financial crisis were both associated
with excessive capital flows.
With the globalization of the world economy and financial markets, fluctuations in cross- border
capital flows are inevitable. We need to take a rational view of this. If kept at reasonable levels,
capital inflows and outflows are acceptable, and can be conducive to economic development
and financial stability. To prevent potential financial risks, countries need to strengthen the
monitoring and management of cross-border capital flows2.
ⅡMonitoring China’s Capital Flows
1 Bosworth, Barry P. & M. Collins, “Capital Flows to Developing Economies: Implications for Savings and
Investment”, NBER Working Paper, 1999.
2 IMF, Liberalizing Capital Flows and Managing Outflows – Background Paper, Mar. 16, 2012, p.5.

2
Complete and accurate statistical data are the foundation of an effective monitoring of cross-
border capital flows. In the past decades, in line with international standards and taking into
account the country’s own circumstances, China has developed three major statistical systems:
the balance of payments (BOP) statistical system, the cross-border receipts and payments
system, and the foreign exchange sales and purchase system (see figure 1). These systems cover
international transactions, cross-border remittances and domestic conversion of currencies.
Meanwhile, China also uses other supplementary statistical and administrative data. Altogether,
these diversified but closely-linked systems form the basis for the monitoring of cross-border
capital flows in China.
The BOP statistical system is used to collect and compile China’s balance of payments statistics.
By definition, the BOP is a statement that summarizes economic transactions between residents
and nonresidents of an economy and thus reveals the economic status of the economy with the
rest of the world and points to future trends. China officially began compiling BOP data in 1982.
Currently, its BOP data are gathered and tallied in accordance with the IMF’s Balance of
Payments Manual, the fifth edition. In 2012, the total volume of China’s BOP transactions
amounted to USD7.5 trillion.
Although the BOP statement has many advantages, it cannot fully meet the needs of monitoring
cross-border capital flows due to the following reasons:
First, the data are not very timely. Currently, China publishes quarterly BOP statistics, with a
one-month time lag for preliminary data and a three-month lag for revised data. However, China
needs more frequent and timely information as cross-border capital flows have become more
volatile since the international financial crisis.
Second, BOP data cannot be used directly in the management of cross-border capital flows. For
the purposes of both macro-prudential management and capital flows management, the
authorities in China need to monitor not only international transactions as they take place, but
also when capital actually moves across the nation’s borders and when it is converted into and
out of domestic currency.
Third, although the BOP covers all types of international transactions, it does not specifically
reflect the supply and demand situation in the domestic foreign exchange market.
As a result, China also has two additional data sets, which are cash-basis flow data on China’s
external economic activities. One is cross-border receipts and payments statistics and the other
is foreign exchange sales and purchase statistics.
Cross-border receipts and payments statistics reveal mainly cross-border cash flows between
domestic nonbank institutions and households (the nonbank sector) and the rest of the world,
in the form of international remittances through banks in China. The data are collected via the
International Transaction Reporting System (ITRS), which was established in 1996. In 2012, the

3
system collected 35 million reports, totaling USD5.1 trillion, on cross- border cash flows through
local banks.
Foreign exchange sales and purchase statistics mainly reflect the exchanges of foreign currency
and RMB by banks on behalf of their customers. As these data indicate how much of the capital
that flows into China is converted into domestic currency, and how much domestic currency is
converted by enterprises into foreign currency, the impact of capital flows on domestic currency
liquidity can be assessed.
The statistics were developed at a time when exchanges of foreign currency and the RMB were
under strict control. In 1996, China announced RMB current account convertibility. Enterprises
and individuals were allowed to buy and sell foreign exchange on an actual needs basis. As
China moves gradually towards capital account convertibility, these statistics still play an
important role, allowing the authorities to evaluate the aggregate supply and demand as well as
the gap between the two in the foreign exchange market. Additionally, the data provide
detailed transaction breakdowns.
Figure 1 Correlation among Three Main Statistical Sets
Moreover, to meet monitoring and management needs, China has established supplementary
statistics, including those on foreign direct investment, external debt, trade credits, external
assets and liabilities of banks, and net foreign exchange open positions of banks. These
supplementary statistics focus on different aspects of cross-border capital flows. For example,
statistics on trade credits of enterprises focus on short-term trade-related credit between
exporters and importers, and statistics on net open positions of banks focus on banks’ foreign
exchange exposure related to foreign exchange trading business.
In our view, current cross-border capital flow statistics in China are different from the BOP
statistics in the following aspects:
First, they provide higher frequency and more timely data. The cross-border receipts and
payments statistics produce monthly data, with the data actually collected daily and on a
transaction-by-transaction basis. Similarly, the foreign exchange sales and purchase statistics
BOP Cross border
Receipts and Payments
Foreign Exchange Sales and
Purchase
Change in Reserves (excluding exchange rate or
price movement effects)

4
also produce monthly data, with the data collected daily on a gross basis, i.e., without
transaction or transactor breakdowns.
Second, they provide broader statistical coverage and greater scope for data analysis.
Cross-border receipts and payments statistics and foreign exchange sales and purchase statistics
not only provide transaction breakdowns, such as for trade in goods, trade in services, and
foreign direct investment as in the BOP statistics, but they also offer a more detailed breakdown
of the source of the transaction, such as foreign-owned enterprises and Chinese enterprises as
well as resident and nonresident individuals. The two data sets also have domestic regional and
bank breakdowns. Moreover, for cross-border receipts and payment statistics, counterparty and
currency breakdowns are also available.
Third, they provide the whole picture of cross-border capital flows and the supply and demand
situation in the domestic foreign exchange market. As indicated earlier, BOP data, cross-border
receipts and payments data and foreign exchange sales and purchase data cover different stages
of cross-border capital flows. So the comparison between different data sets provides the
linkage among related statistics, such as foreign exchange deposits, loans and RMB cross-border
settlements.
In summary, current cross-border capital flow statistics in China meet the basic requirements for
monitoring capital flows. However, as China’s economy becomes more open, challenges to our
statistical gathering system will likely arise.
Ⅲ How We Use Related Data Sets in Monitoring Cross-Border Capital Flows
1. General picture of cross-border capital flows
China has witnessed capital inflows for many years. With regard to the nonbank sector,
cross-border receipts have exceeded payments, and foreign exchange sales have exceeded
purchases since 2001. Before 2007, the balances for both sets of data grew rapidly, but after the
2008 global financial crisis, the balances gradually shrank, though there have been some
fluctuations during the process (see figure 2).
Figure 2 Aggregate Data of the Nonbank Sector

5
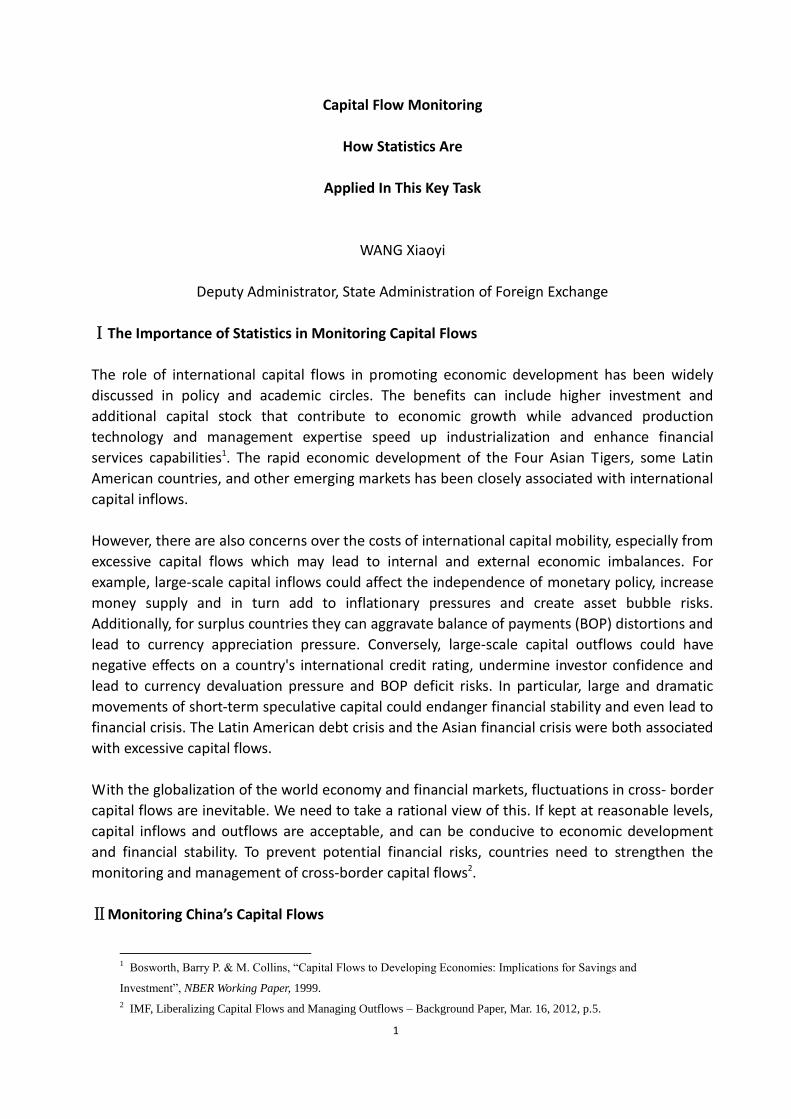
The balances of both cross-border receipts and payments and foreign exchange sales and
purchases for current account transactions have showed a declining trend in recent years. On
one hand, surpluses related to trade in goods decreased, partly because weak external demand
resulted in slower export growth. On the other hand, net receipts for trade in services turned
into net payments, and the net purchase of foreign exchange started to grow, reflecting
increasing demand for foreign exchange related to travel (see figure 3). In 2008, Chinese
residents made 46 million person-trips abroad. In 2012, the number climbed to more than 80
million.
Figure 3 Nonbank Sector Transaction Breakdowns under the Current Account
6
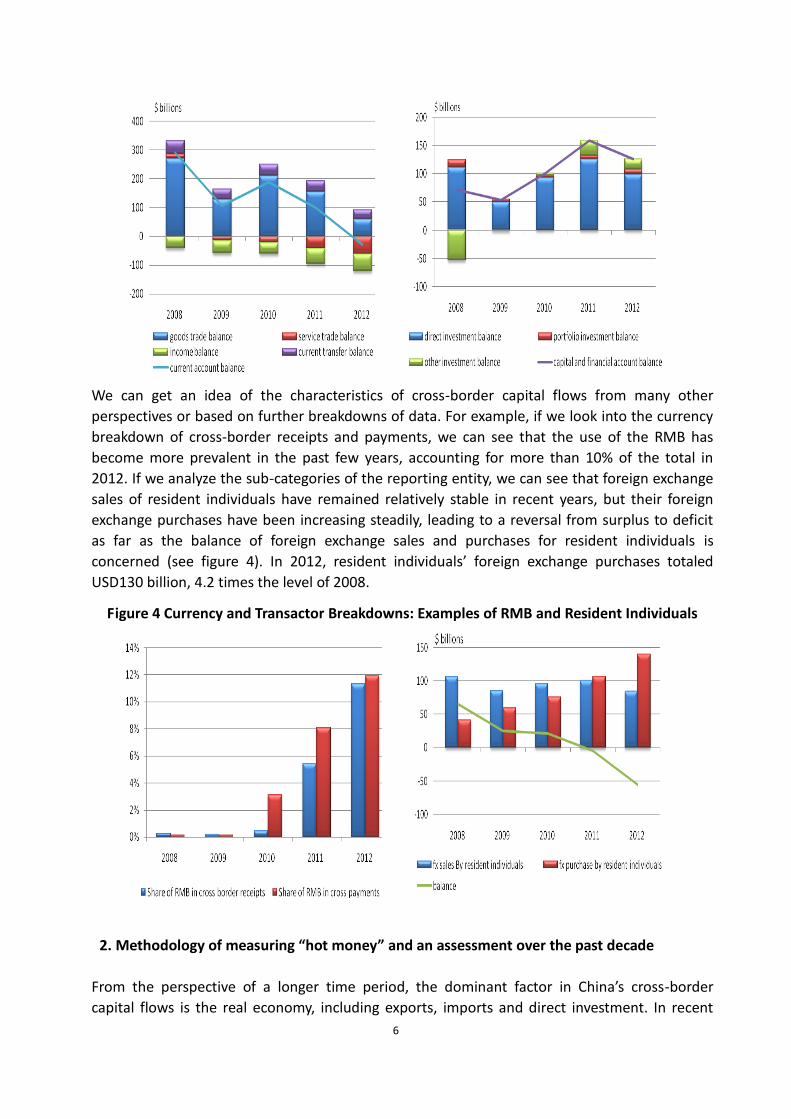
We can get an idea of the characteristics of cross-border capital flows from many other
perspectives or based on further breakdowns of data. For example, if we look into the currency
breakdown of cross-border receipts and payments, we can see that the use of the RMB has
become more prevalent in the past few years, accounting for more than 10% of the total in
2012. If we analyze the sub-categories of the reporting entity, we can see that foreign exchange
sales of resident individuals have remained relatively stable in recent years, but their foreign
exchange purchases have been increasing steadily, leading to a reversal from surplus to deficit
as far as the balance of foreign exchange sales and purchases for resident individuals is
concerned (see figure 4). In 2012, resident individuals’ foreign exchange purchases totaled
USD130 billion, 4.2 times the level of 2008.
Figure 4 Currency and Transactor Breakdowns: Examples of RMB and Resident Individuals
2. Methodology of measuring “hot money” and an assessment over the past decade
From the perspective of a longer time period, the dominant factor in China’s cross-border
capital flows is the real economy, including exports, imports and direct investment. In recent

7
years, there were reports of “hot money” flows into or out of China. Theoretically, in countries
where the capital account is not fully liberalized, speculative capital flows should be under strict
control. But as the interest and exchange rate levels are different onshore and offshore, Chinese
enterprises, banks, and individuals have incentives to change their holdings of foreign currency
or domestic currency assets or liabilities for their own financial benefit. The change in behavior
is most likely reflected in the transactions which are relatively easy to conduct (for example,
current account transactions). Therefore, some arbitrage behavior has been seen in
transactions related to goods or service trade. This is what “hot money” mainly refers to in
China. There is no perfect formula for measuring “hot money” but in general we can say that it
is only a small part of total cross-border capital flows.
We pay close attention to this issue and have made some estimates with reference to the
“residual” method, i.e. using the increment of foreign exchange reserves and subtracting the
trade surplus and net direct investment inflows, as a close substitute for the scale of “hot
money” flows. We determine those trade and investment transactions which are relatively
stable and assume they are all real and legitimate. These transactions include trade surplus, net
direct investment inflows, returns on overseas investments, and inward remittances of funds
raised by Chinese companies that list overseas. We then subtract the above mentioned items
from the reserve increment figure in the BOP statement (i.e. excluding exchange rate or price
movement effects). The residual amount is basically comprised of the more volatile capital flows.
However, it is not purely speculative, illegal, or unexplainable, but also includes many legitimate
international transactions and capital flows.
We have used the above method to calculate “hot money” in the past decade. Since 2001, the
more volatile part of China’s capital flows have been pro-cyclical. From 2001 to 2010, China’s
economic growth was relatively strong, with an annual GDP growth rate of more than 10%. The
RMB faced appreciation expectations. More volatile capital inflows were seen in this period.
From 2011 to 2012, China’s economic growth stabilized at a lower rate and the RMB exchange
rate moved closer to equilibrium. Previous inflows of volatile capital turned into outflows,
especially in the form of the private sector’s increased holdings of foreign assets. Viewed over
the longer period of 2001 to 2012, inflows and outflows of volatile capital basically offset each
other, and the residual amount accounted for only about 1% of the reserve accumulation during
the period. Furthermore, the ratios of volatile flows to GDP each year were also relatively low
(see figure 5).
Figure 5 Volatile capital flows as a share of GDP
8
However, it is worth noting that the volatility of such capital flows has increased to some extent,
especially since the global financial crisis. First, the international financial environment changed
quickly. China’s capital flows were affected by the debt crises in Europe and the US, and the
quantitative easing policies of some advanced economies. Second, domestic economic growth
has been generally stable, but not without some minor fluctuations. Third, to facilitate
enterprises’ trade and investment activities, domestic banks designed new on-balance sheet
and off-balance sheet financial instruments. Fourth, domestic enterprises were more sensitive
to changes of exchange rate and interest rate differentials onshore and offshore, and adjusted
their financing behavior more frequently than in the past.
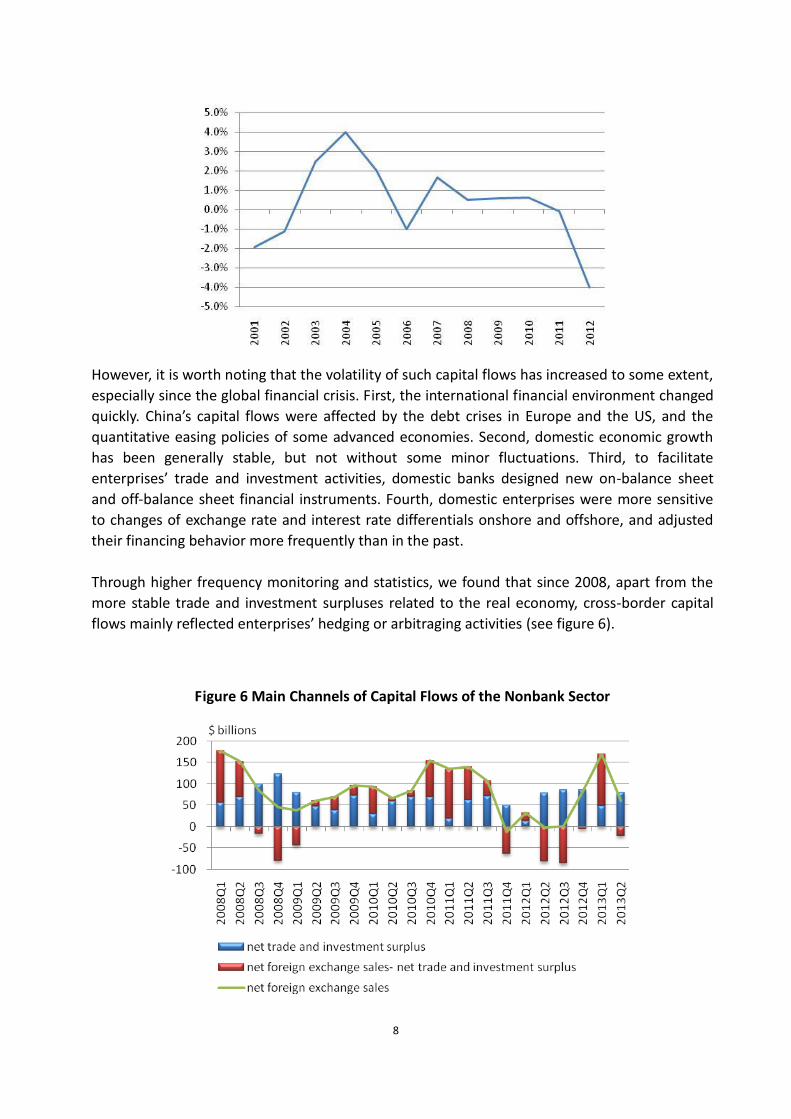
Through higher frequency monitoring and statistics, we found that since 2008, apart from the
more stable trade and investment surpluses related to the real economy, cross-border capital
flows mainly reflected enterprises’ hedging or arbitraging activities (see figure 6).
Figure 6 Main Channels of Capital Flows of the Nonbank Sector

9
Note: Net trade and investment surplus=Net export + Net direct investment inflows
Ⅳ Coping with Volatile Capital Flows
By monitoring and analyzing capital flow data, we can determine the areas of greater risk, and
then move to strengthen macro-prudential regulations. The three main steps are as follows:
1. Assess overall capital flow risks
SAFE has established a system to evaluate the relative risk levels in the capital flow situation,
taking into account specific features of China’s cross-border capital flows. The method relies on
capital inflow and relevant macro-economic indicators. It uses prosperity indicators to show the
status of capital flows, which are placed in three main categories, i.e. “in balance,” “inflow risk,”
and “outflow risk.” For inflow or outflow risks, there are four sub-categories, i.e. “requiring
attention,” “mild,” “medium,”and”high.” SAFE also closely monitors major domestic and
international events that could affect capital flows, and adopts appropriate response measures,
depending on the situation. The specific descriptions of levels of risk are as stated in table 1.
Table 1 Descriptions of Risk in Case of Irregular Inflows and Outflows
Risk Rankings Outflows Inflows
1 Attention
Required
Abnormal changes in indicators
on capital inflows and reserves but
cause is seen as an isolated event
or due to a government policy; or
change is too small to warrant
specific policy action.
Increase of foreign exchange
inflows, RMB appreciation
pressure exists but is not strong,
domestic price levels deemed
appropriate.
2 Mild The balance of foreign exchange
sales and purchase is in deficit,
reserves experience continuous
losses over a period of time or
significant losses in a short time
period, an individual entity suffers
a foreign exchange liquidity
shortage, RMB faces some
depreciation pressures
Relatively large surplus of foreign
exchange sales and purchases,
relatively strong RMB
appreciation expectations,
relatively high inflation.
3 Medium Deficit in foreign exchange sales
and purchase enlarges
considerably, reserves experience
significant and continuous losses
or sharp losses in a short time
period, shortage of foreign
exchange liquidity in the market,
apparent RMB depreciation
pressures, and domestic economic
Surplus of foreign exchange sales
and purchase is at historically high
level, RMB appreciation pressure
is stronger, macro-economic
environment is facing
over-heating risk, and inflation is
relatively high.

10
and financial stability is at
considerable risk.
4 High Panic outflow of capital, widening
of deficits in a short period of
time, severe losses of reserves,
significant foreign exchange
shortage in the market, high RMB
depreciation pressure, and the
economic and financial
development is seen at high risk.
Surplus of foreign exchange sales
and purchase is unprecedented,
RMB appreciation expectation is
very strong, macro-economic
environment is apparently
over-heating, and inflation
situation deteriorates.
After the global financial crisis, in September 2010, February 2011, and April 2013, capital
inflows to China reached mild or medium risk levels respectively (see figure 7).
Figure 7 Net Foreign Exchange Sales of the Nonbank Sector
2. Determine major capital flow channels
Taking the resurgence of capital inflows between November 2012 and April 2013 as an example,
the increased surplus from foreign exchange sales and purchases was mainly due to a decrease
in foreign exchange sales for import payments. Enterprises were unwilling to purchase foreign
currency from banks, but were instead inclined to borrow foreign exchange to pay for their
imports. This behavior resulted in the increasing imbalances in foreign exchange supply and
demand (see figure 8), and also aggravated a currency mismatch in the banking system.
Figure 8 Outstanding Foreign Exchange Deposits and Loans of Banks

11
The relationship between cross border capital flows and trade in goods is as follows:
Δ Balance of foreign exchange sales and purchase for export and import = Δ Trade balance + (Δ
domestic trade financing + Δ overseas trade financing and trade credit) + Δ other factors
According to the above equation, we can conclude that the major channels for capital inflows
were the increase of foreign exchange loans and the increase of overseas trade financing and
trade credit.
Table 2 Capital Flows between November 2012 and April 2013
Items Amounts Contribution
ratios
Balance of foreign exchange sales and purchases 2764 100%
Net cross-border receipts 1815 66%
Net change of forex loans and deposits 820 30%
Among which: change in loans 1075 39%
Change in deposits -255 -9%
Other factors 129 5%
3. Taking measures to smooth the fluctuations of capital flows
After determining the major channels for the increased capital inflows since 2013, we took
measures which linked bank foreign exchange loan-to-deposit ratios to their net foreign
exchange open positions. The banks with more foreign exchange loans and a higher loan-to-
deposit ratio were required to either hold larger net foreign exchange open positions or to
decrease their loans and increase their deposits. After the implementation of the policy, the
increase in the loan-to-deposit ratio stopped (see figure 8), and the currency mismatch of
enterprises and banks was alleviated. As a result, the foreign exchange market became more
balanced.

12
This is China ’s experience in coping with irregular capital flows. Should the situation of large
capital inflows or outflows occur again in the future, China may also take other
macro-prudential regulatory measures that are commonly used elsewhere, such as the Tobin
tax, to curb short term and speculative capital flows. In the meantime, capital account
liberalization has been set as a long term policy goal. We will proceed prudently, with due
regard to the coordination needed between interest and exchange rate liberalization, and the
improvement of financial markets. Capital controls will also remain as a tool to properly manage
cross-border capital flows.
Ⅴ Future Policy Orientations
First, there is a need for further strengthening of statistical gathering and analysis during the
process of lifting foreign exchange controls. After the international financial crisis, authorities of
many countries moved to strengthen their statistical gathering capabilities and closely monitor
financial account transactions. As China’s international transactions are on the rise and the
country is progressively removing capital account controls, China needs to improve its
cross-border capital flow statistics, to strengthen its monitoring ability, and to actively guard
against relevant risks.
Second, there is a need for greater coordination between BOP and other statistical sets. In
China, BOP data are used for international comparison. However, the results are not entirely
satisfactory because we publish only quarterly BOP data with a three-month time lag.
Meanwhile, more timely data on cross-border receipts and payments and foreign exchange
sales and purchases are not suitable for international comparison. In this regard, China needs to
study the methodology for compiling monthly BOP data.
Third, improved statistics on both cross-border receipts and payments and foreign exchange
sales and purchases is required. Currently, data from these two statistical systems play an an
important role in daily capital flow monitoring in China . However, the cross-border receipts and
payments statistics cover domestic banks’ client data, but not data on banks’ own account
status. So, more work needs to be done in this area, including requiring more frequent and
timely external asset and liability data on banks’ own account. Meanwhile, because more and
more economic units settle their international transactions in RMB, the representativeness of
the foreign exchange receipts and payments as well as sales and purchase statistics has
diminished.
Fourth, there is a need for a strengthened linkage between cross-border flow statistics and
domestic currency statistics. Currently, cross-border capital flow statistics in China cover capital
flows in three stages, the international transaction stage, the cross-border cash remittance
stage, and the domestic conversion stage. However, the statistics do not mesh with domestic
currency statistics, not to mention related monitoring. For example, once foreign exchange
flows into the country and is converted into RMB, it is difficult for the authorities to track down
its use in China . Ultimately, it becomes difficult to analyze the final impact of cross-border flows
on China ’s economy.

13
Fifth, more statistical breakdowns of data are required. Some high frequency statistical systems
in China collect mainly gross data. In the future, more statistical breakdowns need to be
introduced into these systems.
Lastly, there is a need for improved statistical methodologies but with greater consideration of
costs and benefits. As the international transaction volume surges, the cost of maintaining a
statistical system such as the ITRS will increase. In this regard, China will adopt more sample
survey and estimation methods to meet statistical requirements and to reduce relevant costs.