Embed Size (px)
Citation preview

8/14/2019 CROSBY COUNTY - Ralls ISD - 2001 Texas School Survey of Drug and Alcohol Use
http://slidepdf.com/reader/full/crosby-county-ralls-isd-2001-texas-school-survey-of-drug-and-alcohol-use 1/144
8/14/2019 CROSBY COUNTY - Ralls ISD - 2001 Texas School Survey of Drug and Alcohol Use
http://slidepdf.com/reader/full/crosby-county-ralls-isd-2001-texas-school-survey-of-drug-and-alcohol-use 2/144
RallsSpring 2001
______________________________________________________________________________________________
Table T-1: How recently, if ever, have you used...
Past School Ever NeverMonth Year Used Used
_____________________________________________________________________________________Any tobacco product All 31.3% 41.0% 64.6% 35.4%
Grades 7-8 18.7% 25.8% 48.4% 51.6%Grades 9-12 38.5% 49.7% 73.9% 26.1%
_____________________________________________________________________________________Cigarettes All 29.7% 38.9% 63.0% 37.0%
Grades 7-8 17.4% 24.5% 48.4% 51.6%Grades 9-12 36.7% 47.2% 71.4% 28.6%
_____________________________________________________________________________________Smokeless tobacco All 4.6% 7.5% 17.4% 82.6%
Grades 7-8 3.6% 4.9% 10.0% 90.0%Grades 9-12 5.1% 9.0% 21.8% 78.2%
______________________________________________________________________________________________
Table T-2: How often do you normally use...
Any tobacco product?
Several Several About About Less ThanNever Every Times Times Once a Once a Once aUsed Day a Week a Month Month Year Year
All 42.6% 15.4% 7.4% 7.1% 8.4% 7.8% 11.3%Grades 7-8 60.4% 3.7% 4.9% 5.1% 6.4% 6.0% 13.5%Grades 9-12 32.3% 22.1% 8.8% 8.2% 9.5% 8.9% 10.1%
Cigarettes?
Several Several About About Less ThanNever Every Times Times Once a Once a Once a
Used Day a Week a Month Month Year Year
All 44.2% 14.6% 6.2% 7.5% 8.8% 7.5% 11.1%Grades 7-8 60.4% 2.4% 4.9% 5.1% 6.4% 6.0% 14.8%Grades 9-12 34.7% 21.8% 7.0% 9.0% 10.3% 8.4% 8.9%
Smokeless tobacco?
Several Several About About Less ThanNever Every Times Times Once a Once a Once aUsed Day a Week a Month Month Year Year
All 84.3% 1.3% 2.1% * % 2.9% 3.8% 5.5%Grades 7-8 92.1% 1.4% * % * % 1.2% 1.4% 3.9%Grades 9-12 80.0% 1.3% 3.2% * % 3.9% 5.2% 6.4%
______________________________________________________________________________________________
Table T-3: In the past 30 days, how many cigarettes have you smoked?
>1 But >10 But >1 Pack<1 Per <10 Per <1 Pack But <2 >2 Packs
None Day Day Per Day Packs/Day Per Day
All 68.7% 12.6% 12.8% 2.4% 2.7% 0.8%Grades 7-8 83.0% 9.7% 6.2% 1.1% * % * %Grades 9-12 60.5% 14.3% 16.6% 3.1% 4.3% 1.2%
8/14/2019 CROSBY COUNTY - Ralls ISD - 2001 Texas School Survey of Drug and Alcohol Use
http://slidepdf.com/reader/full/crosby-county-ralls-isd-2001-texas-school-survey-of-drug-and-alcohol-use 3/144
RallsSpring 2001
______________________________________________________________________________________________
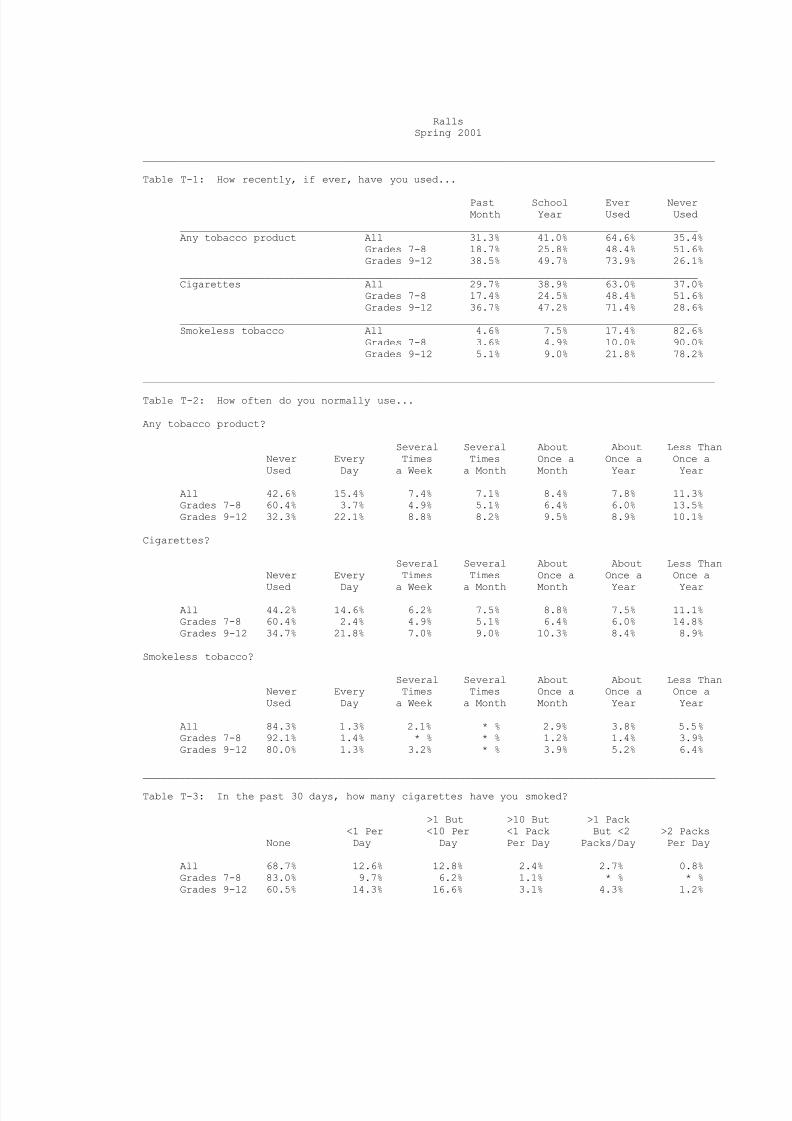
Table T-4: Average age of first use of:
Grades 7-8 Grades 9-12
Tobacco 11.0 11.7
______________________________________________________________________________________________
Table T-5: If you wanted some, how difficult would it be to get...
Cigarettes?
Never Very Somewhat Somewhat VeryHeard Of Impossible Difficult Difficult Easy Easy
All 7.5% 11.7% 4.1% 6.9% 22.3% 47.4%Grades 7-8 9.5% 26.8% 9.1% 10.2% 22.6% 21.8%Grades 9-12 6.4% 3.2% 1.3% 5.1% 22.2% 61.9%
Smokeless Tobacco?
Never Very Somewhat Somewhat VeryHeard Of Impossible Difficult Difficult Easy Easy
All 24.7% 14.2% 7.5% 7.9% 11.1% 34.6%Grades 7-8 33.1% 30.4% 12.4% 3.6% 7.8% 12.7%Grades 9-12 19.7% 4.6% 4.6% 10.5% 13.1% 47.5%
______________________________________________________________________________________________
Table T-6: About how many of your close friends...
Use any tobacco product?
Never heard
None A Few Some Most All
All 18.4% 29.1% 19.7% 23.1% 9.7%Grades 7-8 36.1% 36.8% 18.2% 6.4% 2.5%Grades 9-12 8.7% 24.8% 20.5% 32.3% 13.7%
Smoke cigarettes?
Never heardNone A Few Some Most All
All 21.7% 27.1% 19.0% 22.5% 9.8%Grades 7-8 40.8% 33.2% 17.1% 6.4% 2.5%Grades 9-12 11.2% 23.7% 20.0% 31.3% 13.8%
Use a smokeless tobacco product?
Never heardNone A Few Some Most All
All 61.2% 25.4% 8.1% 3.7% 1.6%Grades 7-8 77.6% 17.1% 4.1% 1.2% * %Grades 9-12 51.9% 30.1% 10.3% 5.1% 2.5%

8/14/2019 CROSBY COUNTY - Ralls ISD - 2001 Texas School Survey of Drug and Alcohol Use
http://slidepdf.com/reader/full/crosby-county-ralls-isd-2001-texas-school-survey-of-drug-and-alcohol-use 4/144
RallsSpring 2001
______________________________________________________________________________________________
Table T-7: How do your parents feel about kids your age smoking cigarettes?
Strongly Mildly Mildly Strongly Don'tDisapprove Disapprove Neither Approve Approve Know
All 61.0% 13.7% 12.5% 2.4% 1.8% 8.7%Grades 7-8 75.9% 10.3% 3.6% * % 2.6% 7.6%Grades 9-12 52.7% 15.6% 17.4% 3.8% 1.2% 9.3%
______________________________________________________________________________________________
Table T-8: How dangerous do you think it is for kids your age to use tobacco?
Very Somewhat Not Very Not at All Do NotDangerous Dangerous Dangerous Dangerous Know
All 47.4% 34.8% 10.4% 2.0% 5.4%Grades 7-8 66.6% 23.7% 2.4% * % 7.2%
Grades 9-12 36.3% 41.2% 15.0% 3.1% 4.4%

8/14/2019 CROSBY COUNTY - Ralls ISD - 2001 Texas School Survey of Drug and Alcohol Use
http://slidepdf.com/reader/full/crosby-county-ralls-isd-2001-texas-school-survey-of-drug-and-alcohol-use 5/144

8/14/2019 CROSBY COUNTY - Ralls ISD - 2001 Texas School Survey of Drug and Alcohol Use
http://slidepdf.com/reader/full/crosby-county-ralls-isd-2001-texas-school-survey-of-drug-and-alcohol-use 6/144
RallsSpring 2001
______________________________________________________________________________________________
Table A-1: How recently, if ever, have you used...
Past School Ever NeverMonth Year Used Used
_____________________________________________________________________________________Any alcohol product All 36.2% 53.1% 74.5% 25.5%
Grades 7-8 28.2% 37.9% 62.3% 37.7%Grades 9-12 40.8% 61.7% 81.5% 18.5%
_____________________________________________________________________________________Beer All 26.7% 42.9% 63.0% 37.0%
Grades 7-8 16.5% 23.9% 47.4% 52.6%Grades 9-12 32.5% 53.8% 71.8% 28.2%
_____________________________________________________________________________________Wine coolers All 24.0% 39.1% 62.5% 37.5%
Grades 7-8 20.0% 32.1% 56.1% 43.9%Grades 9-12 26.2% 43.1% 66.2% 33.8%
_____________________________________________________________________________________Wine All 12.4% 25.6% 49.4% 50.6%
Grades 7-8 13.9% 20.1% 35.4% 64.6%Grades 9-12 11.5% 28.7% 57.3% 42.7%_____________________________________________________________________________________Liquor All 22.9% 37.8% 55.7% 44.3%
Grades 7-8 10.0% 17.3% 31.0% 69.0%Grades 9-12 30.3% 49.4% 69.8% 30.2%
______________________________________________________________________________________________
Table A-2: How often do you normally use...
Any alcohol product?
Several Several About About Less ThanNever Every Times Times Once a Once a Once aUsed Day a Week a Month Month Year Year
All 32.7% 2.7% 10.7% 17.3% 15.0% 10.6% 11.0%Grades 7-8 48.4% * % 9.8% 6.3% 9.8% 8.4% 17.2%Grades 9-12 23.6% 4.3% 11.3% 23.5% 18.0% 11.8% 7.4%
Beer?
Several Several About About Less ThanNever Every Times Times Once a Once a Once aUsed Day a Week a Month Month Year Year
All 40.2% 2.0% 9.4% 15.4% 15.0% 9.3% 8.4%Grades 7-8 58.4% * % 9.2% 5.6% 5.4% 7.8% 13.6%Grades 9-12 30.4% 3.1% 9.6% 20.8% 20.3% 10.1% 5.7%
Wine coolers?
Several Several About About Less Than
Never Every Times Times Once a Once a Once aUsed Day a Week a Month Month Year Year
All 42.2% 0.8% 6.9% 12.3% 13.8% 12.6% 11.5%Grades 7-8 51.7% * % 8.9% 3.8% 9.0% 11.4% 15.2%Grades 9-12 36.7% 1.3% 5.7% 17.1% 16.4% 13.3% 9.5%
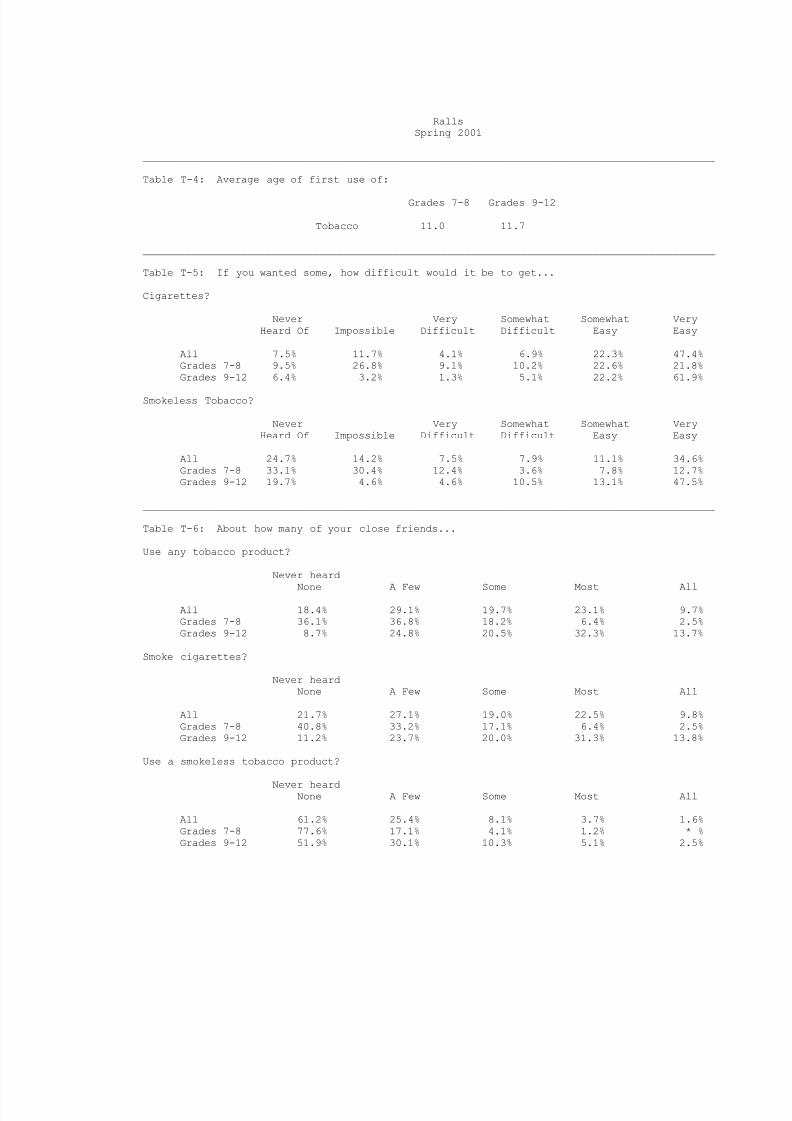
Wine?
Several Several About About Less ThanNever Every Times Times Once a Once a Once aUsed Day a Week a Month Month Year Year
8/14/2019 CROSBY COUNTY - Ralls ISD - 2001 Texas School Survey of Drug and Alcohol Use
http://slidepdf.com/reader/full/crosby-county-ralls-isd-2001-texas-school-survey-of-drug-and-alcohol-use 7/144
All 54.6% 0.4% 4.6% 5.9% 9.4% 15.9% 9.2%Grades 7-8 69.4% * % 3.7% 5.2% 2.5% 12.7% 6.5%Grades 9-12 46.3% 0.6% 5.1% 6.3% 13.2% 17.8% 10.7%
8/14/2019 CROSBY COUNTY - Ralls ISD - 2001 Texas School Survey of Drug and Alcohol Use
http://slidepdf.com/reader/full/crosby-county-ralls-isd-2001-texas-school-survey-of-drug-and-alcohol-use 8/144
RallsSpring 2001
______________________________________________________________________________________________
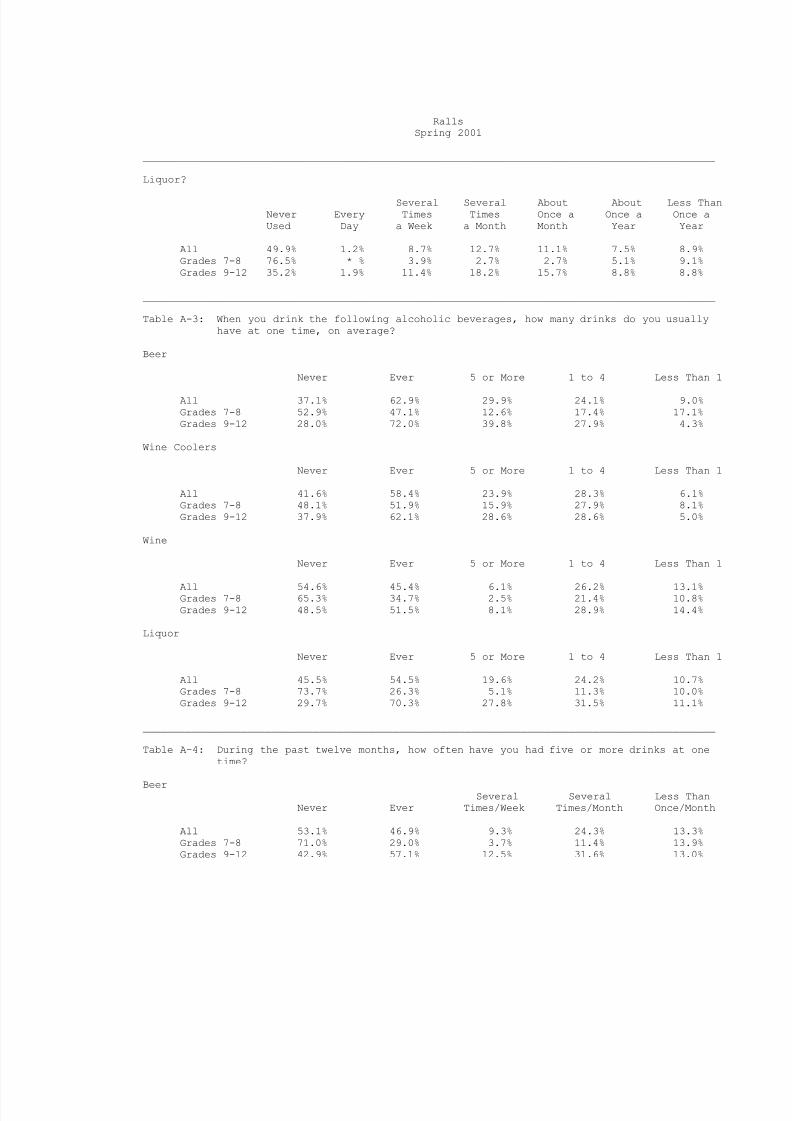
Liquor?
Several Several About About Less ThanNever Every Times Times Once a Once a Once aUsed Day a Week a Month Month Year Year
All 49.9% 1.2% 8.7% 12.7% 11.1% 7.5% 8.9%Grades 7-8 76.5% * % 3.9% 2.7% 2.7% 5.1% 9.1%Grades 9-12 35.2% 1.9% 11.4% 18.2% 15.7% 8.8% 8.8%
______________________________________________________________________________________________
Table A-3: When you drink the following alcoholic beverages, how many drinks do you usuallyhave at one time, on average?
Beer
Never Ever 5 or More 1 to 4 Less Than 1
All 37.1% 62.9% 29.9% 24.1% 9.0%Grades 7-8 52.9% 47.1% 12.6% 17.4% 17.1%Grades 9-12 28.0% 72.0% 39.8% 27.9% 4.3%
Wine Coolers
Never Ever 5 or More 1 to 4 Less Than 1
All 41.6% 58.4% 23.9% 28.3% 6.1%Grades 7-8 48.1% 51.9% 15.9% 27.9% 8.1%Grades 9-12 37.9% 62.1% 28.6% 28.6% 5.0%
Wine
Never Ever 5 or More 1 to 4 Less Than 1
All 54.6% 45.4% 6.1% 26.2% 13.1%Grades 7-8 65.3% 34.7% 2.5% 21.4% 10.8%Grades 9-12 48.5% 51.5% 8.1% 28.9% 14.4%
Liquor
Never Ever 5 or More 1 to 4 Less Than 1
All 45.5% 54.5% 19.6% 24.2% 10.7%Grades 7-8 73.7% 26.3% 5.1% 11.3% 10.0%Grades 9-12 29.7% 70.3% 27.8% 31.5% 11.1%
______________________________________________________________________________________________
Table A-4: During the past twelve months, how often have you had five or more drinks at onetime?
BeerSeveral Several Less Than
Never Ever Times/Week Times/Month Once/Month
All 53.1% 46.9% 9.3% 24.3% 13.3%Grades 7-8 71.0% 29.0% 3.7% 11.4% 13.9%Grades 9-12 42.9% 57.1% 12.5% 31.6% 13.0%
8/14/2019 CROSBY COUNTY - Ralls ISD - 2001 Texas School Survey of Drug and Alcohol Use
http://slidepdf.com/reader/full/crosby-county-ralls-isd-2001-texas-school-survey-of-drug-and-alcohol-use 9/144
RallsSpring 2001
______________________________________________________________________________________________
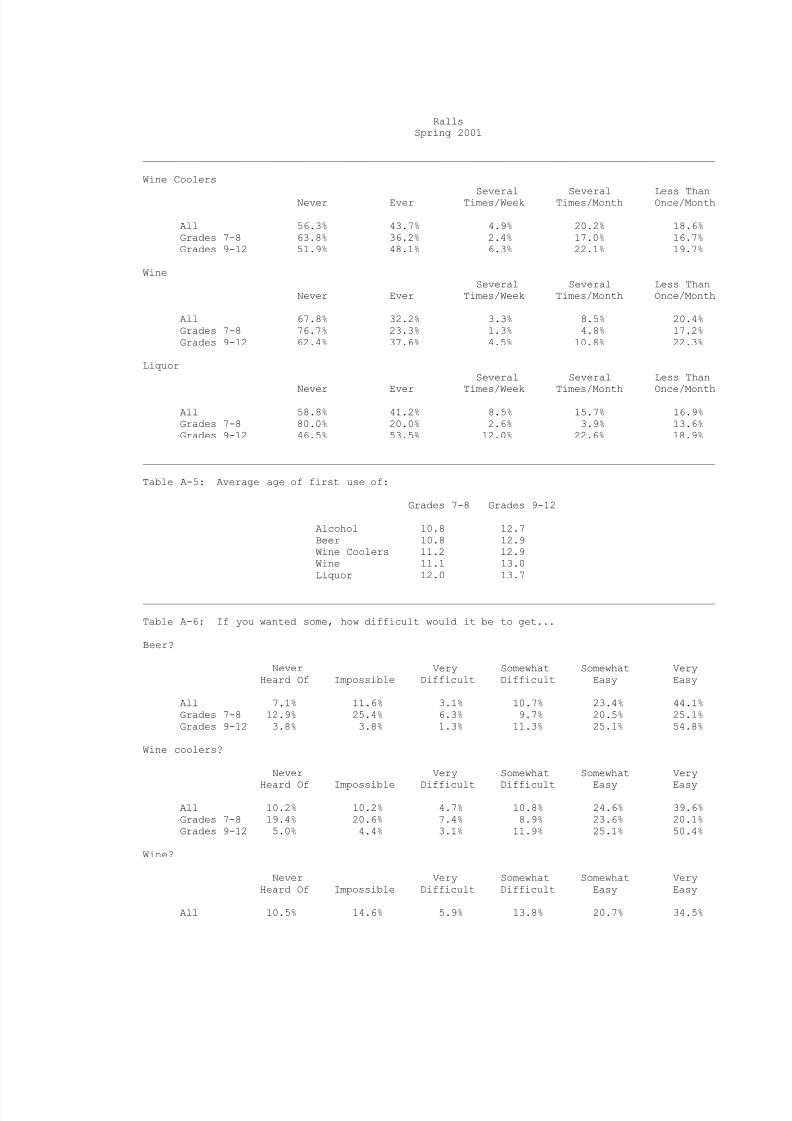
Wine Coolers
Several Several Less ThanNever Ever Times/Week Times/Month Once/Month
All 56.3% 43.7% 4.9% 20.2% 18.6%Grades 7-8 63.8% 36.2% 2.4% 17.0% 16.7%Grades 9-12 51.9% 48.1% 6.3% 22.1% 19.7%
WineSeveral Several Less Than
Never Ever Times/Week Times/Month Once/Month
All 67.8% 32.2% 3.3% 8.5% 20.4%Grades 7-8 76.7% 23.3% 1.3% 4.8% 17.2%Grades 9-12 62.4% 37.6% 4.5% 10.8% 22.3%
LiquorSeveral Several Less Than
Never Ever Times/Week Times/Month Once/Month
All 58.8% 41.2% 8.5% 15.7% 16.9%Grades 7-8 80.0% 20.0% 2.6% 3.9% 13.6%Grades 9-12 46.5% 53.5% 12.0% 22.6% 18.9%
______________________________________________________________________________________________
Table A-5: Average age of first use of:
Grades 7-8 Grades 9-12
Alcohol 10.8 12.7Beer 10.8 12.9Wine Coolers 11.2 12.9Wine 11.1 13.0Liquor 12.0 13.7
______________________________________________________________________________________________
Table A-6: If you wanted some, how difficult would it be to get...
Beer?
Never Very Somewhat Somewhat VeryHeard Of Impossible Difficult Difficult Easy Easy
All 7.1% 11.6% 3.1% 10.7% 23.4% 44.1%Grades 7-8 12.9% 25.4% 6.3% 9.7% 20.5% 25.1%Grades 9-12 3.8% 3.8% 1.3% 11.3% 25.1% 54.8%
Wine coolers?
Never Very Somewhat Somewhat Very
Heard Of Impossible Difficult Difficult Easy Easy
All 10.2% 10.2% 4.7% 10.8% 24.6% 39.6%Grades 7-8 19.4% 20.6% 7.4% 8.9% 23.6% 20.1%Grades 9-12 5.0% 4.4% 3.1% 11.9% 25.1% 50.4%
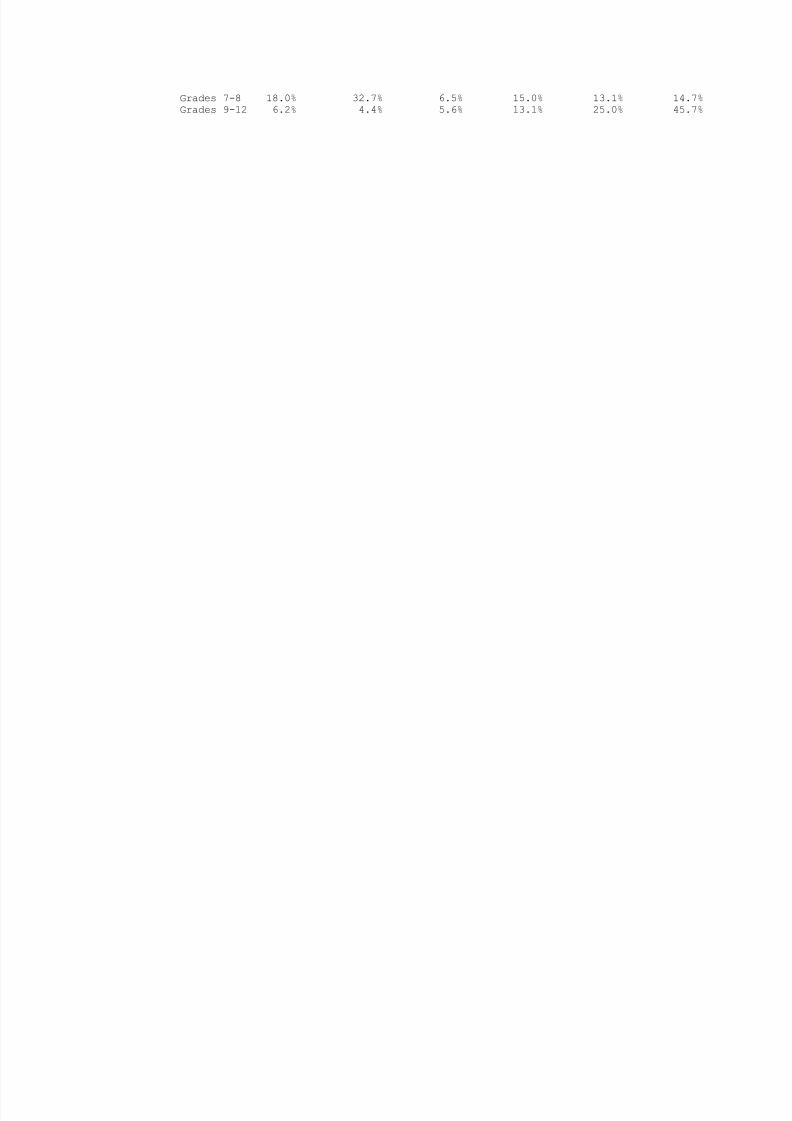
Wine?
Never Very Somewhat Somewhat VeryHeard Of Impossible Difficult Difficult Easy Easy
All 10.5% 14.6% 5.9% 13.8% 20.7% 34.5%
8/14/2019 CROSBY COUNTY - Ralls ISD - 2001 Texas School Survey of Drug and Alcohol Use
http://slidepdf.com/reader/full/crosby-county-ralls-isd-2001-texas-school-survey-of-drug-and-alcohol-use 10/144
Grades 7-8 18.0% 32.7% 6.5% 15.0% 13.1% 14.7%Grades 9-12 6.2% 4.4% 5.6% 13.1% 25.0% 45.7%
8/14/2019 CROSBY COUNTY - Ralls ISD - 2001 Texas School Survey of Drug and Alcohol Use
http://slidepdf.com/reader/full/crosby-county-ralls-isd-2001-texas-school-survey-of-drug-and-alcohol-use 11/144
RallsSpring 2001
______________________________________________________________________________________________
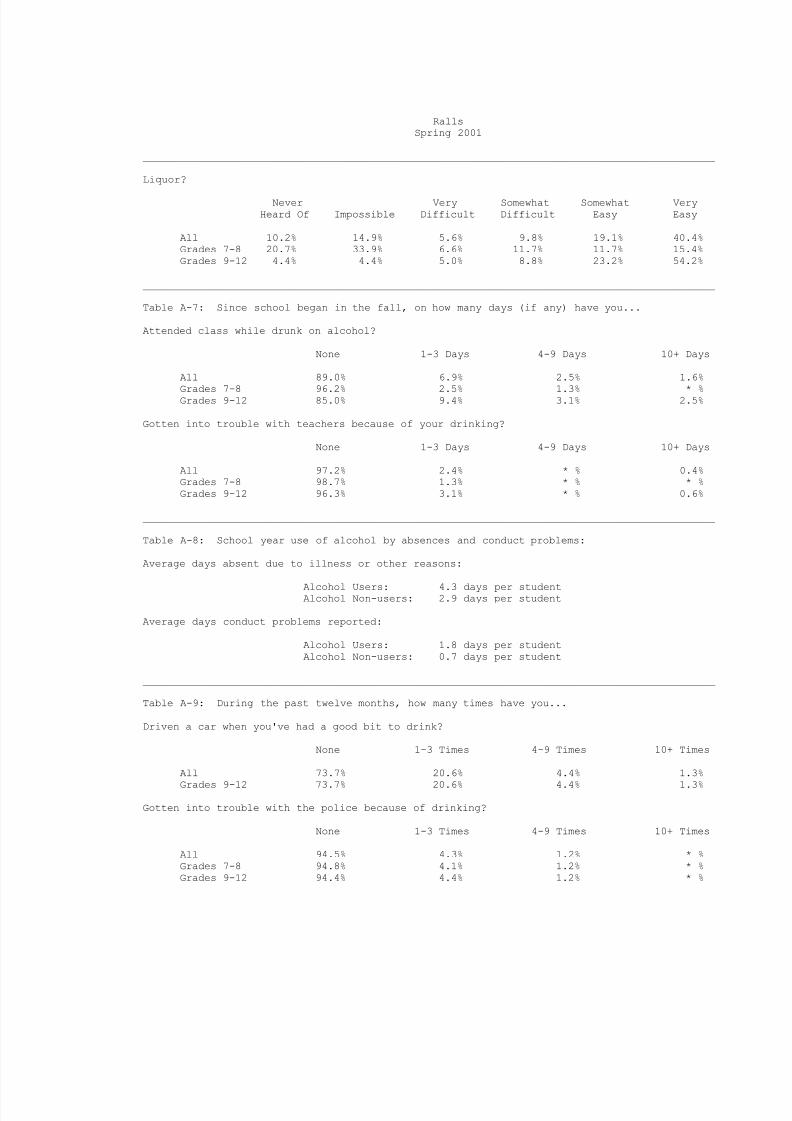
Liquor?
Never Very Somewhat Somewhat VeryHeard Of Impossible Difficult Difficult Easy Easy
All 10.2% 14.9% 5.6% 9.8% 19.1% 40.4%Grades 7-8 20.7% 33.9% 6.6% 11.7% 11.7% 15.4%Grades 9-12 4.4% 4.4% 5.0% 8.8% 23.2% 54.2%
______________________________________________________________________________________________
Table A-7: Since school began in the fall, on how many days (if any) have you...
Attended class while drunk on alcohol?
None 1-3 Days 4-9 Days 10+ Days
All 89.0% 6.9% 2.5% 1.6%
Grades 7-8 96.2% 2.5% 1.3% * %Grades 9-12 85.0% 9.4% 3.1% 2.5%
Gotten into trouble with teachers because of your drinking?
None 1-3 Days 4-9 Days 10+ Days
All 97.2% 2.4% * % 0.4%Grades 7-8 98.7% 1.3% * % * %Grades 9-12 96.3% 3.1% * % 0.6%
______________________________________________________________________________________________
Table A-8: School year use of alcohol by absences and conduct problems:
Average days absent due to illness or other reasons:
Alcohol Users: 4.3 days per studentAlcohol Non-users: 2.9 days per student
Average days conduct problems reported:
Alcohol Users: 1.8 days per studentAlcohol Non-users: 0.7 days per student
______________________________________________________________________________________________
Table A-9: During the past twelve months, how many times have you...
Driven a car when you've had a good bit to drink?
None 1-3 Times 4-9 Times 10+ Times
All 73.7% 20.6% 4.4% 1.3%
Grades 9-12 73.7% 20.6% 4.4% 1.3%
Gotten into trouble with the police because of drinking?
None 1-3 Times 4-9 Times 10+ Times
All 94.5% 4.3% 1.2% * %Grades 7-8 94.8% 4.1% 1.2% * %Grades 9-12 94.4% 4.4% 1.2% * %

8/14/2019 CROSBY COUNTY - Ralls ISD - 2001 Texas School Survey of Drug and Alcohol Use
http://slidepdf.com/reader/full/crosby-county-ralls-isd-2001-texas-school-survey-of-drug-and-alcohol-use 12/144
RallsSpring 2001
______________________________________________________________________________________________
Table A-10: About how many of your close friends use...
Any alcohol product?
Never heardNone A Few Some Most All
All 14.7% 22.2% 17.4% 23.9% 21.8%Grades 7-8 28.7% 30.7% 25.3% 8.9% 6.4%Grades 9-12 6.8% 17.4% 13.1% 32.3% 30.5%
Beer?
Never heardNone A Few Some Most All
All 17.6% 23.4% 14.7% 27.0% 17.3%Grades 7-8 35.9% 27.2% 20.9% 11.8% 4.1%
Grades 9-12 7.5% 21.4% 11.3% 35.3% 24.5%
Wine coolers?
Never heardNone A Few Some Most All
All 31.0% 21.5% 21.1% 16.9% 9.5%Grades 7-8 49.8% 21.5% 18.3% 6.4% 3.9%Grades 9-12 20.6% 21.4% 22.7% 22.6% 12.6%
Wine?
Never heardNone A Few Some Most All
All 48.9% 23.5% 13.1% 8.8% 5.7%
Grades 7-8 63.3% 21.7% 8.9% 5.0% 1.2%Grades 9-12 40.6% 24.5% 15.5% 11.0% 8.4%
Liquor?
Never heardNone A Few Some Most All
All 28.3% 23.7% 17.7% 18.0% 12.3%Grades 7-8 50.6% 27.5% 16.5% 4.0% 1.3%Grades 9-12 15.8% 21.6% 18.3% 25.9% 18.4%
______________________________________________________________________________________________
Table A-11: During the past twelve months, how many times have you...
Had difficulties of any kind with your friends because of your drinking?
None 1-3 Times 4-9 Times 10+ Times
All 90.4% 9.2% 0.4% * %Grades 7-8 94.8% 5.2% * % * %Grades 9-12 87.9% 11.4% 0.6% * %
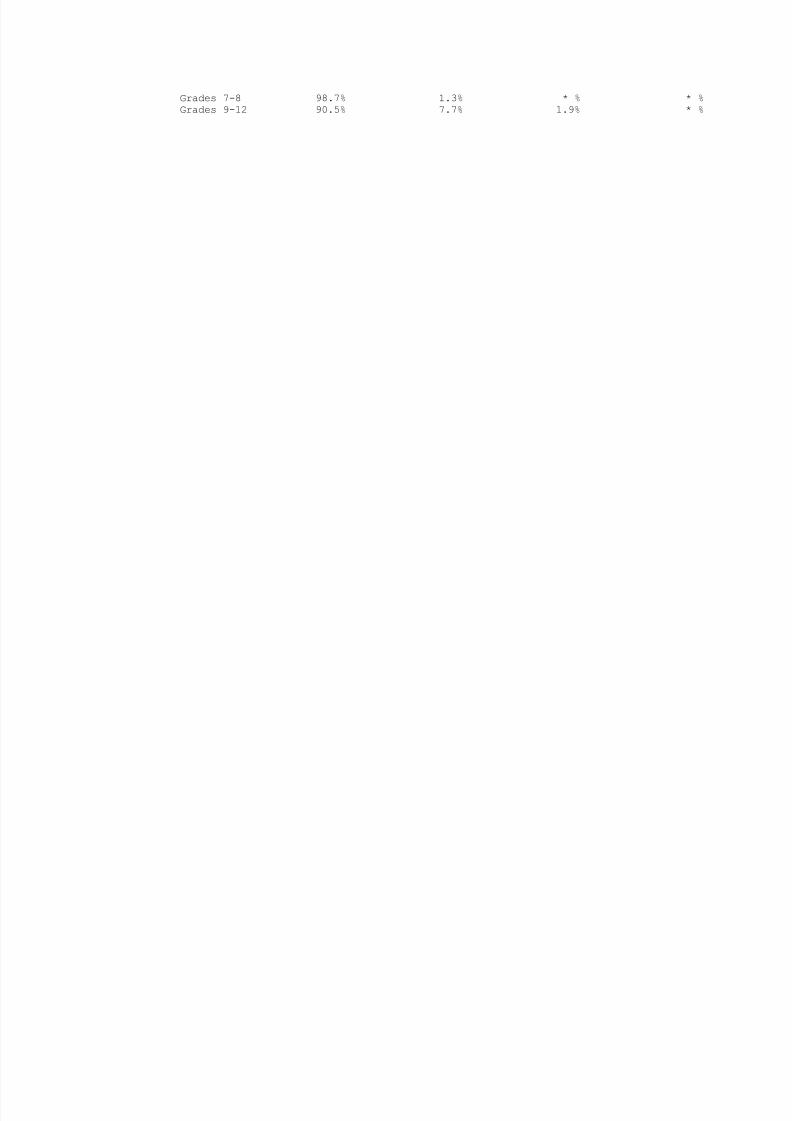
Been criticized by someone you were dating because of drinking?
None 1-3 Times 4-9 Times 10+ Times
All 93.4% 5.4% 1.2% * %
8/14/2019 CROSBY COUNTY - Ralls ISD - 2001 Texas School Survey of Drug and Alcohol Use
http://slidepdf.com/reader/full/crosby-county-ralls-isd-2001-texas-school-survey-of-drug-and-alcohol-use 13/144
Grades 7-8 98.7% 1.3% * % * %Grades 9-12 90.5% 7.7% 1.9% * %

8/14/2019 CROSBY COUNTY - Ralls ISD - 2001 Texas School Survey of Drug and Alcohol Use
http://slidepdf.com/reader/full/crosby-county-ralls-isd-2001-texas-school-survey-of-drug-and-alcohol-use 14/144
RallsSpring 2001
______________________________________________________________________________________________
Table A-12: Thinking of parties you attended this school year, how often was alcohol used?
Half Most Of Don't Didn'tNever Seldom the Time the Time Always Know Attend
All 27.0% 7.5% 8.1% 15.9% 28.3% 0.9% 12.4%Grades 7-8 47.2% 12.1% 6.0% 11.3% 6.3% 2.6% 14.7%Grades 9-12 15.4% 4.9% 9.3% 18.5% 40.8% * % 11.0%
______________________________________________________________________________________________
Table A-13: How often, if ever, do you get alcoholic beverages from...
At home
Do Not Most ofDrink Never Seldom the time Always
All 39.4% 27.8% 20.2% 9.3% 3.3%Grades 7-8 52.8% 22.9% 18.2% 4.8% 1.3%Grades 9-12 31.5% 30.7% 21.4% 11.9% 4.4%
From friends
Do Not Most ofDrink Never Seldom the time Always
All 31.1% 9.8% 18.6% 27.6% 12.8%Grades 7-8 48.2% 17.1% 16.1% 16.1% 2.4%Grades 9-12 21.3% 5.6% 20.0% 34.3% 18.8%
From a store
Do Not Most ofDrink Never Seldom the time Always
All 32.8% 43.6% 12.8% 5.2% 5.6%Grades 7-8 50.1% 42.4% 7.5% * % * %Grades 9-12 22.8% 44.3% 15.8% 8.2% 8.9%
At parties
Do Not Most ofDrink Never Seldom the time Always
All 31.8% 10.7% 10.4% 23.2% 23.9%Grades 7-8 48.8% 18.5% 11.1% 15.4% 6.2%Grades 9-12 22.0% 6.3% 10.0% 27.6% 34.1%
Other source
Do Not Most of
Drink Never Seldom the time Always
All 33.0% 25.7% 15.7% 12.0% 13.7%Grades 7-8 49.2% 28.6% 14.3% 5.2% 2.8%Grades 9-12 24.1% 24.1% 16.4% 15.7% 19.7%
8/14/2019 CROSBY COUNTY - Ralls ISD - 2001 Texas School Survey of Drug and Alcohol Use
http://slidepdf.com/reader/full/crosby-county-ralls-isd-2001-texas-school-survey-of-drug-and-alcohol-use 15/144
RallsSpring 2001
______________________________________________________________________________________________
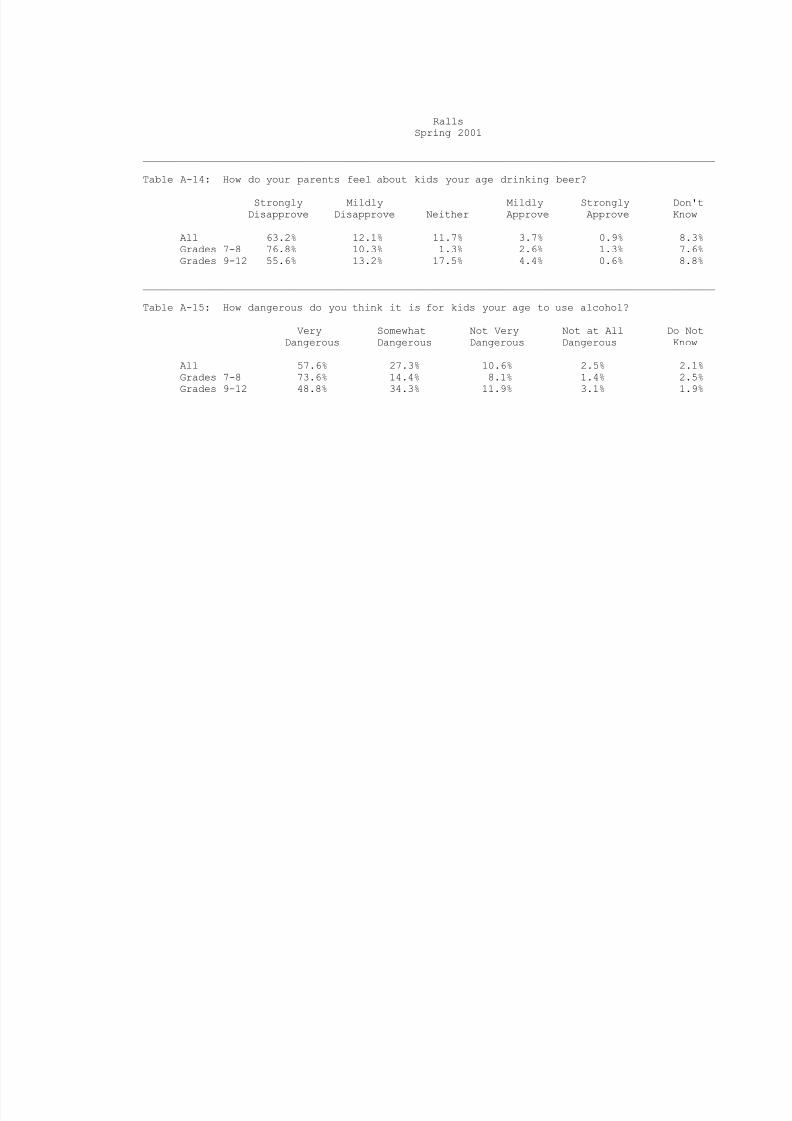
Table A-14: How do your parents feel about kids your age drinking beer?
Strongly Mildly Mildly Strongly Don'tDisapprove Disapprove Neither Approve Approve Know
All 63.2% 12.1% 11.7% 3.7% 0.9% 8.3%Grades 7-8 76.8% 10.3% 1.3% 2.6% 1.3% 7.6%Grades 9-12 55.6% 13.2% 17.5% 4.4% 0.6% 8.8%
______________________________________________________________________________________________
Table A-15: How dangerous do you think it is for kids your age to use alcohol?
Very Somewhat Not Very Not at All Do NotDangerous Dangerous Dangerous Dangerous Know
All 57.6% 27.3% 10.6% 2.5% 2.1%Grades 7-8 73.6% 14.4% 8.1% 1.4% 2.5%
Grades 9-12 48.8% 34.3% 11.9% 3.1% 1.9%

8/14/2019 CROSBY COUNTY - Ralls ISD - 2001 Texas School Survey of Drug and Alcohol Use
http://slidepdf.com/reader/full/crosby-county-ralls-isd-2001-texas-school-survey-of-drug-and-alcohol-use 16/144
8/14/2019 CROSBY COUNTY - Ralls ISD - 2001 Texas School Survey of Drug and Alcohol Use
http://slidepdf.com/reader/full/crosby-county-ralls-isd-2001-texas-school-survey-of-drug-and-alcohol-use 17/144
RallsSpring 2001
______________________________________________________________________________________________
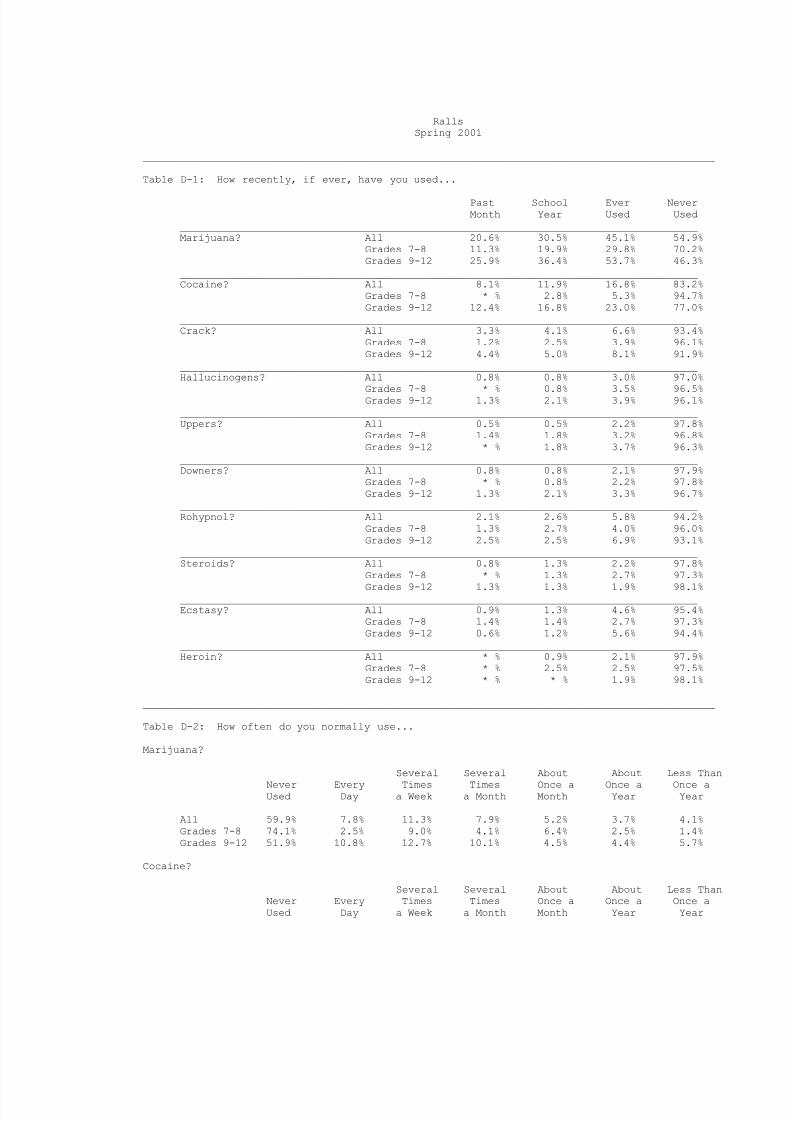
Table D-1: How recently, if ever, have you used...
Past School Ever NeverMonth Year Used Used
_____________________________________________________________________________________Marijuana? All 20.6% 30.5% 45.1% 54.9%
Grades 7-8 11.3% 19.9% 29.8% 70.2%Grades 9-12 25.9% 36.4% 53.7% 46.3%
_____________________________________________________________________________________Cocaine? All 8.1% 11.9% 16.8% 83.2%
Grades 7-8 * % 2.8% 5.3% 94.7%Grades 9-12 12.4% 16.8% 23.0% 77.0%
_____________________________________________________________________________________Crack? All 3.3% 4.1% 6.6% 93.4%
Grades 7-8 1.2% 2.5% 3.9% 96.1%Grades 9-12 4.4% 5.0% 8.1% 91.9%
_____________________________________________________________________________________Hallucinogens? All 0.8% 0.8% 3.0% 97.0%
Grades 7-8 * % 0.8% 3.5% 96.5%Grades 9-12 1.3% 2.1% 3.9% 96.1%_____________________________________________________________________________________Uppers? All 0.5% 0.5% 2.2% 97.8%
Grades 7-8 1.4% 1.8% 3.2% 96.8%Grades 9-12 * % 1.8% 3.7% 96.3%
_____________________________________________________________________________________Downers? All 0.8% 0.8% 2.1% 97.9%
Grades 7-8 * % 0.8% 2.2% 97.8%Grades 9-12 1.3% 2.1% 3.3% 96.7%
_____________________________________________________________________________________Rohypnol? All 2.1% 2.6% 5.8% 94.2%
Grades 7-8 1.3% 2.7% 4.0% 96.0%Grades 9-12 2.5% 2.5% 6.9% 93.1%
_____________________________________________________________________________________Steroids? All 0.8% 1.3% 2.2% 97.8%
Grades 7-8 * % 1.3% 2.7% 97.3%
Grades 9-12 1.3% 1.3% 1.9% 98.1%_____________________________________________________________________________________Ecstasy? All 0.9% 1.3% 4.6% 95.4%
Grades 7-8 1.4% 1.4% 2.7% 97.3%Grades 9-12 0.6% 1.2% 5.6% 94.4%
_____________________________________________________________________________________Heroin? All * % 0.9% 2.1% 97.9%
Grades 7-8 * % 2.5% 2.5% 97.5%Grades 9-12 * % * % 1.9% 98.1%
______________________________________________________________________________________________
Table D-2: How often do you normally use...
Marijuana?
Several Several About About Less Than
Never Every Times Times Once a Once a Once aUsed Day a Week a Month Month Year Year
All 59.9% 7.8% 11.3% 7.9% 5.2% 3.7% 4.1%Grades 7-8 74.1% 2.5% 9.0% 4.1% 6.4% 2.5% 1.4%Grades 9-12 51.9% 10.8% 12.7% 10.1% 4.5% 4.4% 5.7%
Cocaine?
Several Several About About Less ThanNever Every Times Times Once a Once a Once aUsed Day a Week a Month Month Year Year

8/14/2019 CROSBY COUNTY - Ralls ISD - 2001 Texas School Survey of Drug and Alcohol Use
http://slidepdf.com/reader/full/crosby-county-ralls-isd-2001-texas-school-survey-of-drug-and-alcohol-use 18/144
All 85.9% 0.8% 1.2% 2.4% 5.9% 2.9% 0.8%Grades 7-8 94.8% 1.2% * % * % 4.0% * % * %Grades 9-12 81.1% 0.6% 1.9% 3.7% 6.9% 4.4% 1.2%
8/14/2019 CROSBY COUNTY - Ralls ISD - 2001 Texas School Survey of Drug and Alcohol Use
http://slidepdf.com/reader/full/crosby-county-ralls-isd-2001-texas-school-survey-of-drug-and-alcohol-use 19/144
RallsSpring 2001
______________________________________________________________________________________________
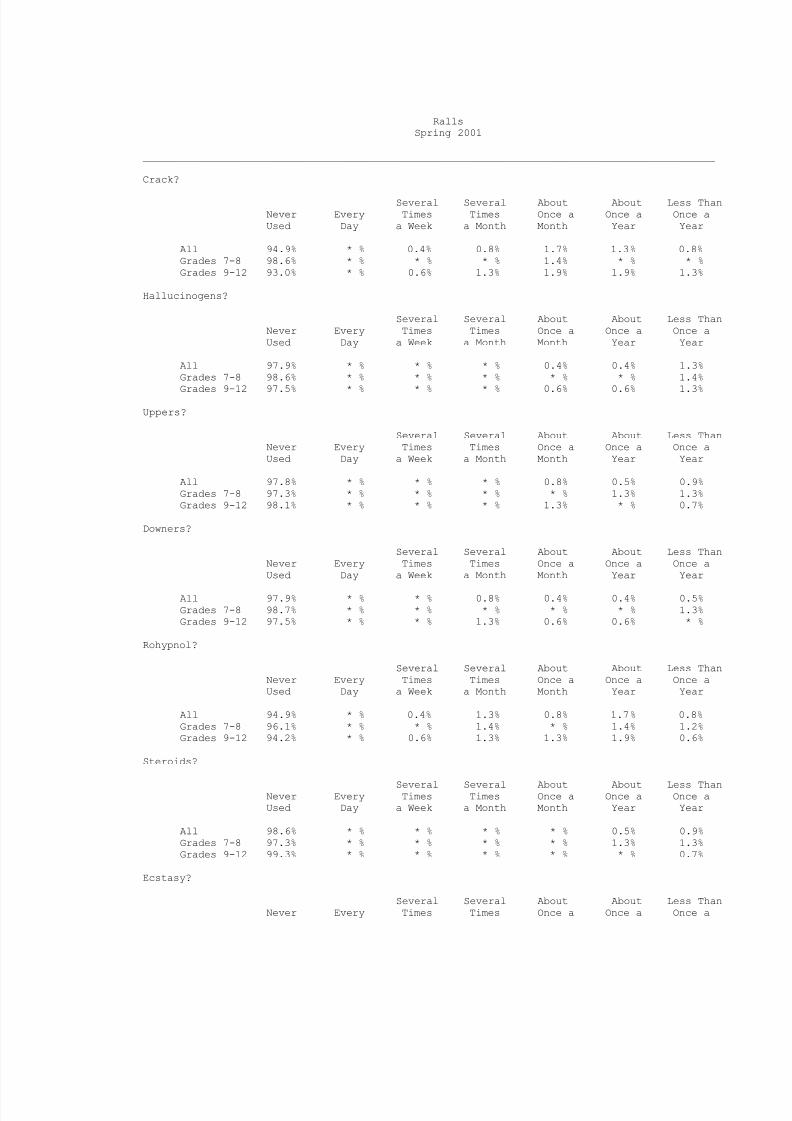
Crack?
Several Several About About Less ThanNever Every Times Times Once a Once a Once aUsed Day a Week a Month Month Year Year
All 94.9% * % 0.4% 0.8% 1.7% 1.3% 0.8%Grades 7-8 98.6% * % * % * % 1.4% * % * %Grades 9-12 93.0% * % 0.6% 1.3% 1.9% 1.9% 1.3%
Hallucinogens?
Several Several About About Less ThanNever Every Times Times Once a Once a Once aUsed Day a Week a Month Month Year Year
All 97.9% * % * % * % 0.4% 0.4% 1.3%Grades 7-8 98.6% * % * % * % * % * % 1.4%
Grades 9-12 97.5% * % * % * % 0.6% 0.6% 1.3%
Uppers?
Several Several About About Less ThanNever Every Times Times Once a Once a Once aUsed Day a Week a Month Month Year Year
All 97.8% * % * % * % 0.8% 0.5% 0.9%Grades 7-8 97.3% * % * % * % * % 1.3% 1.3%Grades 9-12 98.1% * % * % * % 1.3% * % 0.7%
Downers?
Several Several About About Less ThanNever Every Times Times Once a Once a Once aUsed Day a Week a Month Month Year Year
All 97.9% * % * % 0.8% 0.4% 0.4% 0.5%Grades 7-8 98.7% * % * % * % * % * % 1.3%Grades 9-12 97.5% * % * % 1.3% 0.6% 0.6% * %
Rohypnol?
Several Several About About Less ThanNever Every Times Times Once a Once a Once aUsed Day a Week a Month Month Year Year
All 94.9% * % 0.4% 1.3% 0.8% 1.7% 0.8%Grades 7-8 96.1% * % * % 1.4% * % 1.4% 1.2%Grades 9-12 94.2% * % 0.6% 1.3% 1.3% 1.9% 0.6%
Steroids?
Several Several About About Less ThanNever Every Times Times Once a Once a Once aUsed Day a Week a Month Month Year Year
All 98.6% * % * % * % * % 0.5% 0.9%Grades 7-8 97.3% * % * % * % * % 1.3% 1.3%Grades 9-12 99.3% * % * % * % * % * % 0.7%
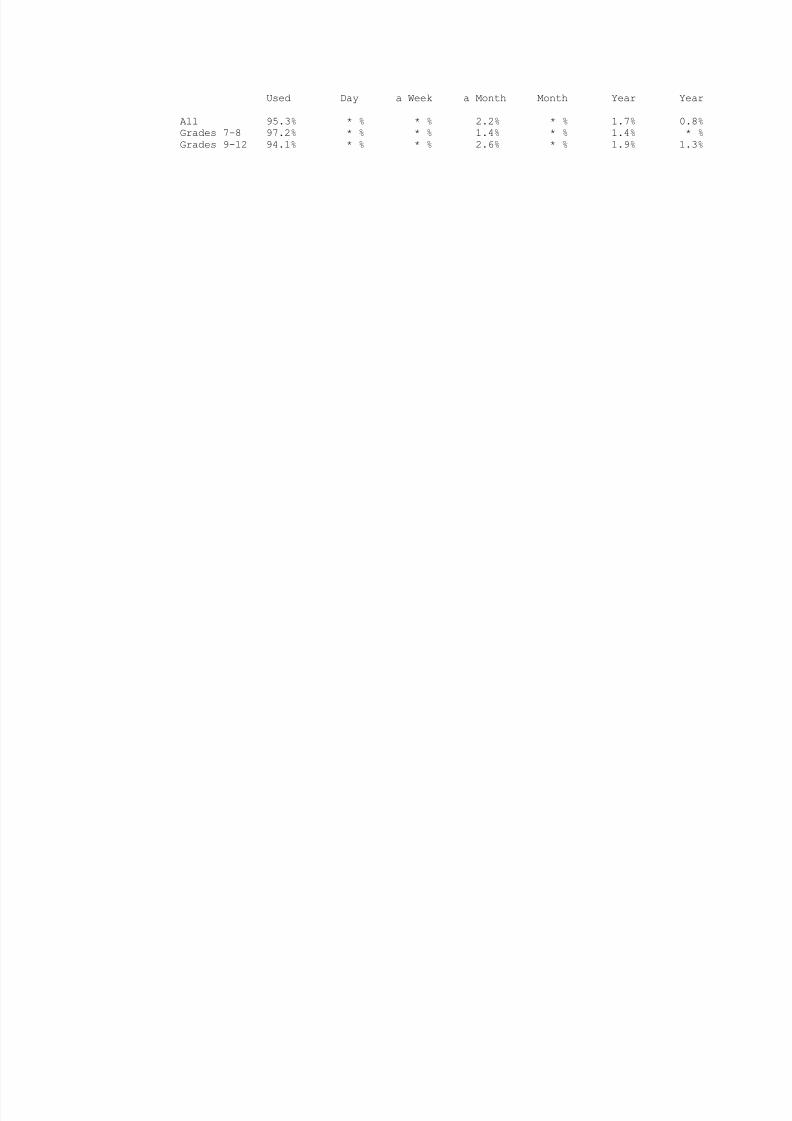
Ecstasy?
Several Several About About Less ThanNever Every Times Times Once a Once a Once a
8/14/2019 CROSBY COUNTY - Ralls ISD - 2001 Texas School Survey of Drug and Alcohol Use
http://slidepdf.com/reader/full/crosby-county-ralls-isd-2001-texas-school-survey-of-drug-and-alcohol-use 20/144
Used Day a Week a Month Month Year Year
All 95.3% * % * % 2.2% * % 1.7% 0.8%Grades 7-8 97.2% * % * % 1.4% * % 1.4% * %Grades 9-12 94.1% * % * % 2.6% * % 1.9% 1.3%
8/14/2019 CROSBY COUNTY - Ralls ISD - 2001 Texas School Survey of Drug and Alcohol Use
http://slidepdf.com/reader/full/crosby-county-ralls-isd-2001-texas-school-survey-of-drug-and-alcohol-use 21/144
RallsSpring 2001
______________________________________________________________________________________________
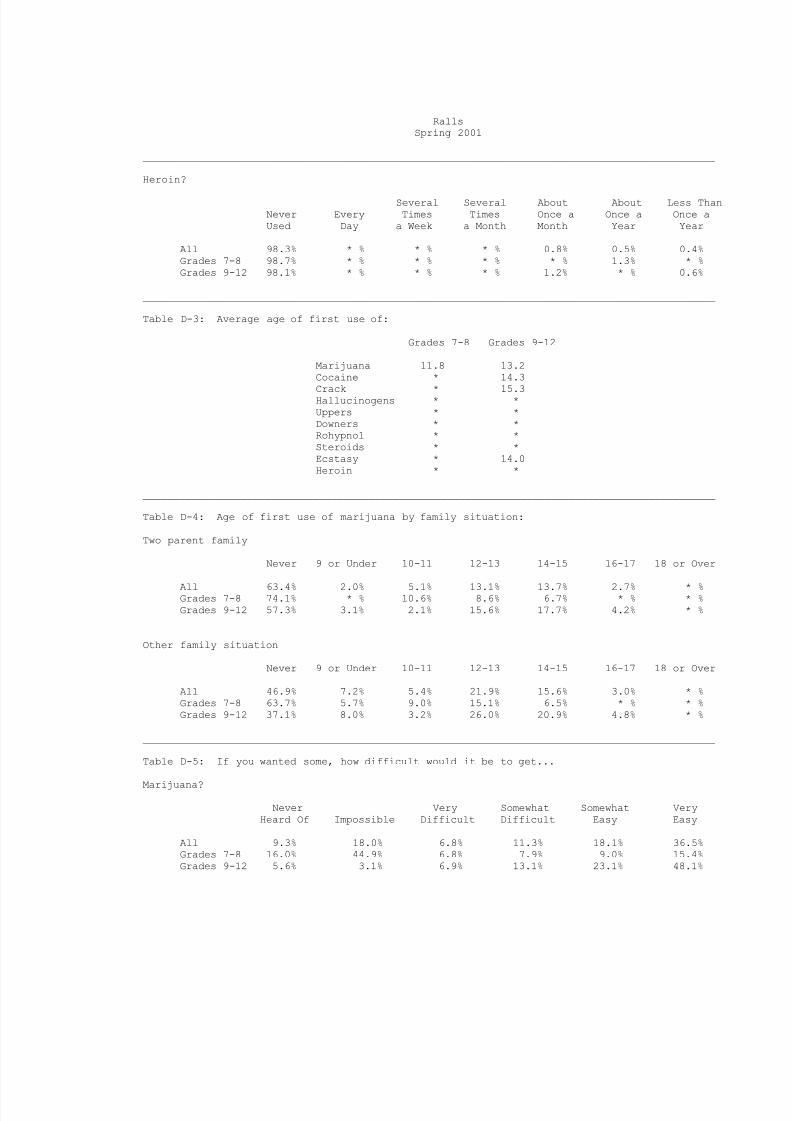
Heroin?
Several Several About About Less ThanNever Every Times Times Once a Once a Once aUsed Day a Week a Month Month Year Year
All 98.3% * % * % * % 0.8% 0.5% 0.4%Grades 7-8 98.7% * % * % * % * % 1.3% * %Grades 9-12 98.1% * % * % * % 1.2% * % 0.6%
______________________________________________________________________________________________
Table D-3: Average age of first use of:
Grades 7-8 Grades 9-12
Marijuana 11.8 13.2Cocaine * 14.3
Crack * 15.3Hallucinogens * *Uppers * *Downers * *Rohypnol * *Steroids * *Ecstasy * 14.0Heroin * *
______________________________________________________________________________________________
Table D-4: Age of first use of marijuana by family situation:
Two parent family
Never 9 or Under 10-11 12-13 14-15 16-17 18 or Over
All 63.4% 2.0% 5.1% 13.1% 13.7% 2.7% * %Grades 7-8 74.1% * % 10.6% 8.6% 6.7% * % * %Grades 9-12 57.3% 3.1% 2.1% 15.6% 17.7% 4.2% * %
Other family situation
Never 9 or Under 10-11 12-13 14-15 16-17 18 or Over
All 46.9% 7.2% 5.4% 21.9% 15.6% 3.0% * %Grades 7-8 63.7% 5.7% 9.0% 15.1% 6.5% * % * %Grades 9-12 37.1% 8.0% 3.2% 26.0% 20.9% 4.8% * %
______________________________________________________________________________________________
Table D-5: If you wanted some, how difficult would it be to get...
Marijuana?
Never Very Somewhat Somewhat VeryHeard Of Impossible Difficult Difficult Easy Easy
All 9.3% 18.0% 6.8% 11.3% 18.1% 36.5%Grades 7-8 16.0% 44.9% 6.8% 7.9% 9.0% 15.4%Grades 9-12 5.6% 3.1% 6.9% 13.1% 23.1% 48.1%
8/14/2019 CROSBY COUNTY - Ralls ISD - 2001 Texas School Survey of Drug and Alcohol Use
http://slidepdf.com/reader/full/crosby-county-ralls-isd-2001-texas-school-survey-of-drug-and-alcohol-use 22/144
RallsSpring 2001
______________________________________________________________________________________________
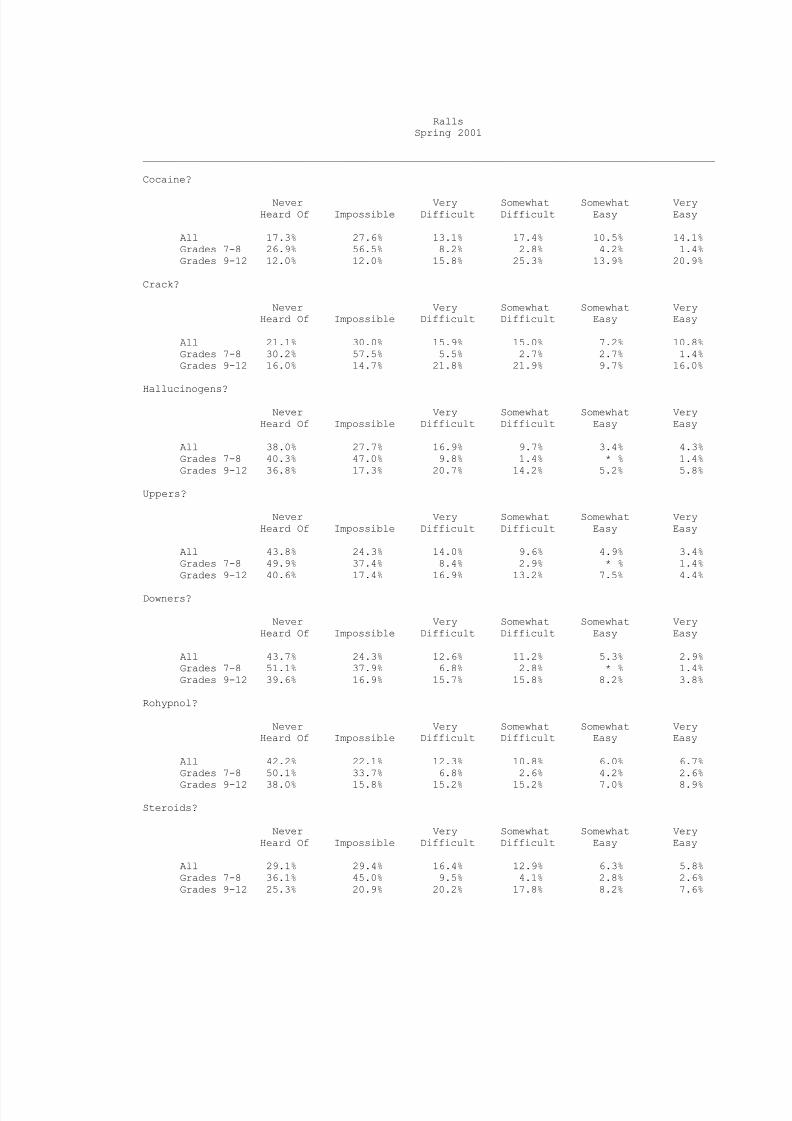
Cocaine?
Never Very Somewhat Somewhat VeryHeard Of Impossible Difficult Difficult Easy Easy
All 17.3% 27.6% 13.1% 17.4% 10.5% 14.1%Grades 7-8 26.9% 56.5% 8.2% 2.8% 4.2% 1.4%Grades 9-12 12.0% 12.0% 15.8% 25.3% 13.9% 20.9%
Crack?
Never Very Somewhat Somewhat VeryHeard Of Impossible Difficult Difficult Easy Easy
All 21.1% 30.0% 15.9% 15.0% 7.2% 10.8%Grades 7-8 30.2% 57.5% 5.5% 2.7% 2.7% 1.4%Grades 9-12 16.0% 14.7% 21.8% 21.9% 9.7% 16.0%
Hallucinogens?
Never Very Somewhat Somewhat VeryHeard Of Impossible Difficult Difficult Easy Easy
All 38.0% 27.7% 16.9% 9.7% 3.4% 4.3%Grades 7-8 40.3% 47.0% 9.8% 1.4% * % 1.4%Grades 9-12 36.8% 17.3% 20.7% 14.2% 5.2% 5.8%
Uppers?
Never Very Somewhat Somewhat VeryHeard Of Impossible Difficult Difficult Easy Easy
All 43.8% 24.3% 14.0% 9.6% 4.9% 3.4%Grades 7-8 49.9% 37.4% 8.4% 2.9% * % 1.4%Grades 9-12 40.6% 17.4% 16.9% 13.2% 7.5% 4.4%
Downers?
Never Very Somewhat Somewhat VeryHeard Of Impossible Difficult Difficult Easy Easy
All 43.7% 24.3% 12.6% 11.2% 5.3% 2.9%Grades 7-8 51.1% 37.9% 6.8% 2.8% * % 1.4%Grades 9-12 39.6% 16.9% 15.7% 15.8% 8.2% 3.8%
Rohypnol?
Never Very Somewhat Somewhat VeryHeard Of Impossible Difficult Difficult Easy Easy
All 42.2% 22.1% 12.3% 10.8% 6.0% 6.7%Grades 7-8 50.1% 33.7% 6.8% 2.6% 4.2% 2.6%
Grades 9-12 38.0% 15.8% 15.2% 15.2% 7.0% 8.9%
Steroids?
Never Very Somewhat Somewhat VeryHeard Of Impossible Difficult Difficult Easy Easy
All 29.1% 29.4% 16.4% 12.9% 6.3% 5.8%Grades 7-8 36.1% 45.0% 9.5% 4.1% 2.8% 2.6%Grades 9-12 25.3% 20.9% 20.2% 17.8% 8.2% 7.6%

8/14/2019 CROSBY COUNTY - Ralls ISD - 2001 Texas School Survey of Drug and Alcohol Use
http://slidepdf.com/reader/full/crosby-county-ralls-isd-2001-texas-school-survey-of-drug-and-alcohol-use 23/144
RallsSpring 2001
______________________________________________________________________________________________
Ecstasy?
Never Very Somewhat Somewhat VeryHeard Of Impossible Difficult Difficult Easy Easy
All 37.6% 29.7% 12.1% 8.1% 4.5% 7.9%Grades 7-8 42.6% 45.5% 6.5% * % 1.3% 4.0%Grades 9-12 34.8% 20.8% 15.2% 12.7% 6.3% 10.2%
Heroin?
Never Very Somewhat Somewhat VeryHeard Of Impossible Difficult Difficult Easy Easy
All 27.5% 36.8% 18.5% 8.0% 2.9% 6.3%Grades 7-8 34.6% 51.4% 8.8% * % 1.3% 3.9%Grades 9-12 23.5% 28.4% 24.1% 12.6% 3.8% 7.6%
______________________________________________________________________________________________
Table D-6: Since school began in the fall, on how many days (if any) have you...
Attended class while high from marijuana use?
None 1-3 Days 4-9 Days 10+ Days
All 76.5% 9.8% 8.1% 5.6%Grades 7-8 87.6% 8.6% 2.6% 1.1%Grades 9-12 70.3% 10.5% 11.2% 8.1%
Attended class while high from use of some other drug?
None 1-3 Days 4-9 Days 10+ Days
All 92.7% 4.6% 1.6% 1.2%
Grades 7-8 96.1% 3.9% * % * %Grades 9-12 90.7% 4.9% 2.5% 1.9%
Gotten into trouble with teachers because of your drug use?
None 1-3 Days 4-9 Days 10+ Days
All 97.9% 1.7% * % 0.4%Grades 7-8 98.7% 1.3% * % * %Grades 9-12 97.5% 1.9% * % 0.6%
______________________________________________________________________________________________
Table D-7: School year use of marijuana by absences and conduct problems:
Average days absent due to illness or other reasons:
Marijuana Users: 4.7 days per studentMarijuana Non-users: 3.2 days per student
Average days conduct problems reported:
Marijuana Users: 2.4 days per studentMarijuana Non-users: 0.8 days per student
8/14/2019 CROSBY COUNTY - Ralls ISD - 2001 Texas School Survey of Drug and Alcohol Use
http://slidepdf.com/reader/full/crosby-county-ralls-isd-2001-texas-school-survey-of-drug-and-alcohol-use 24/144
RallsSpring 2001
______________________________________________________________________________________________
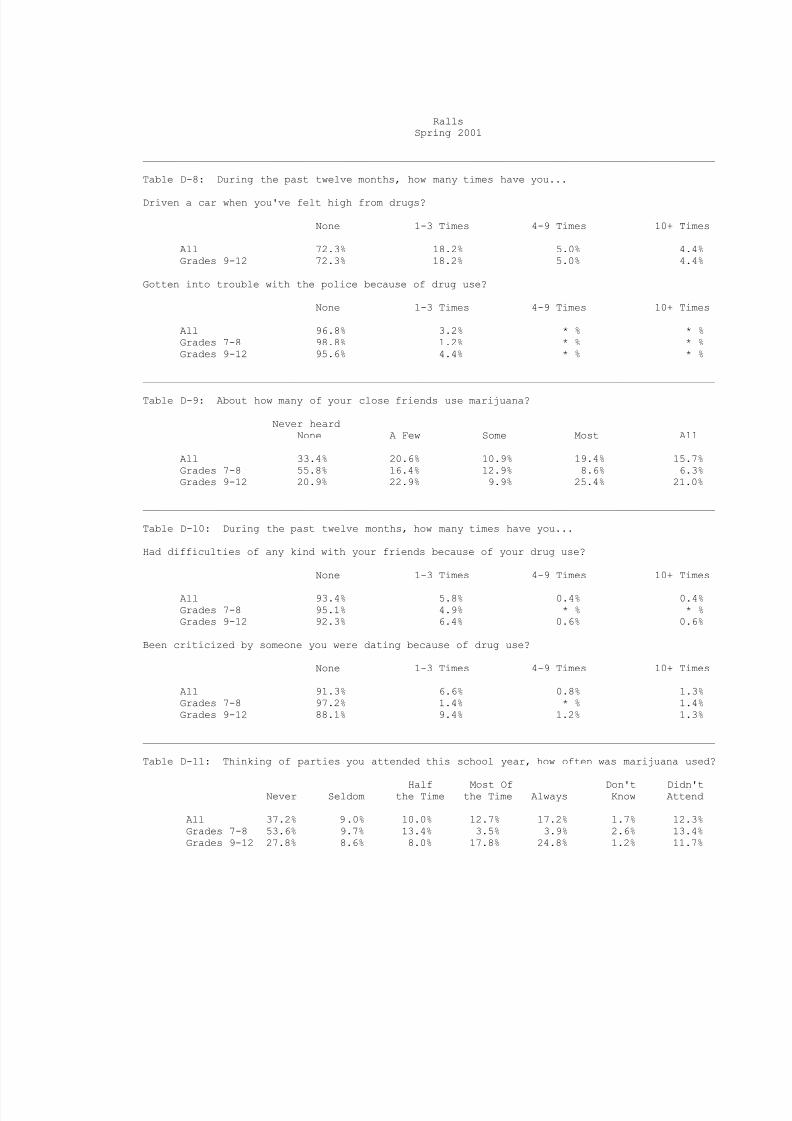
Table D-8: During the past twelve months, how many times have you...
Driven a car when you've felt high from drugs?
None 1-3 Times 4-9 Times 10+ Times
All 72.3% 18.2% 5.0% 4.4%Grades 9-12 72.3% 18.2% 5.0% 4.4%
Gotten into trouble with the police because of drug use?
None 1-3 Times 4-9 Times 10+ Times
All 96.8% 3.2% * % * %Grades 7-8 98.8% 1.2% * % * %Grades 9-12 95.6% 4.4% * % * %
______________________________________________________________________________________________
Table D-9: About how many of your close friends use marijuana?
Never heardNone A Few Some Most All
All 33.4% 20.6% 10.9% 19.4% 15.7%Grades 7-8 55.8% 16.4% 12.9% 8.6% 6.3%Grades 9-12 20.9% 22.9% 9.9% 25.4% 21.0%
______________________________________________________________________________________________
Table D-10: During the past twelve months, how many times have you...
Had difficulties of any kind with your friends because of your drug use?
None 1-3 Times 4-9 Times 10+ Times
All 93.4% 5.8% 0.4% 0.4%Grades 7-8 95.1% 4.9% * % * %Grades 9-12 92.3% 6.4% 0.6% 0.6%
Been criticized by someone you were dating because of drug use?
None 1-3 Times 4-9 Times 10+ Times
All 91.3% 6.6% 0.8% 1.3%Grades 7-8 97.2% 1.4% * % 1.4%Grades 9-12 88.1% 9.4% 1.2% 1.3%
______________________________________________________________________________________________
Table D-11: Thinking of parties you attended this school year, how often was marijuana used?
Half Most Of Don't Didn'tNever Seldom the Time the Time Always Know Attend
All 37.2% 9.0% 10.0% 12.7% 17.2% 1.7% 12.3%Grades 7-8 53.6% 9.7% 13.4% 3.5% 3.9% 2.6% 13.4%Grades 9-12 27.8% 8.6% 8.0% 17.8% 24.8% 1.2% 11.7%

8/14/2019 CROSBY COUNTY - Ralls ISD - 2001 Texas School Survey of Drug and Alcohol Use
http://slidepdf.com/reader/full/crosby-county-ralls-isd-2001-texas-school-survey-of-drug-and-alcohol-use 25/144
RallsSpring 2001
______________________________________________________________________________________________
Table D-12: How often, if ever, do you smoke marijuana in...
Joints?
Half the Most of Don'tNever Seldom Time the Time Always Know
All 63.1% 5.7% 9.3% 13.0% 7.6% 1.4%Grades 7-8 74.8% 4.3% 10.3% 7.6% 2.9% * %Grades 9-12 56.5% 6.5% 8.7% 15.9% 10.2% 2.2%
Blunts?
Half the Most of Don'tNever Seldom Time the Time Always Know
All 66.1% 10.2% 8.6% 8.9% 4.8% 1.4%Grades 7-8 79.6% 8.8% 5.8% 2.9% 2.9% * %
Grades 9-12 58.4% 11.0% 10.2% 12.4% 5.9% 2.2%
Bongs or water pipes?
Half the Most of Don'tNever Seldom Time the Time Always Know
All 70.9% 11.0% 6.7% 5.2% 4.7% 1.5%Grades 7-8 83.2% 6.3% 5.9% 1.6% 1.4% 1.6%Grades 9-12 64.3% 13.6% 7.1% 7.1% 6.4% 1.4%
Pipes?
Half the Most of Don'tNever Seldom Time the Time Always Know
All 66.7% 11.7% 9.9% 5.1% 5.2% 1.4%
Grades 7-8 77.3% 9.1% 12.2% * % 1.4% * %Grades 9-12 60.9% 13.1% 8.7% 8.0% 7.2% 2.2%
Some other way?
Half the Most of Don'tNever Seldom Time the Time Always Know
All 75.6% 10.5% 3.8% 4.3% 2.8% 2.9%Grades 7-8 88.0% 3.2% 3.0% 3.0% 1.4% 1.6%Grades 9-12 68.9% 14.4% 4.3% 5.1% 3.6% 3.6%
______________________________________________________________________________________________
Table D-13: How do your parents feel about kids your age using marijuana?
Strongly Mildly Mildly Strongly Don't
Disapprove Disapprove Neither Approve Approve Know
All 76.4% 6.3% 5.2% 2.4% 1.4% 8.3%Grades 7-8 83.5% 5.1% * % * % 3.8% 7.6%Grades 9-12 72.4% 6.9% 8.1% 3.8% * % 8.7%

8/14/2019 CROSBY COUNTY - Ralls ISD - 2001 Texas School Survey of Drug and Alcohol Use
http://slidepdf.com/reader/full/crosby-county-ralls-isd-2001-texas-school-survey-of-drug-and-alcohol-use 26/144
RallsSpring 2001
______________________________________________________________________________________________
Table D-14: How dangerous do you think it is for kids your age to use...
Marijuana?
Very Somewhat Not Very Not at All Do NotDangerous Dangerous Dangerous Dangerous Know
All 57.0% 21.6% 12.5% 3.8% 5.2%Grades 7-8 76.3% 11.0% 1.3% 3.8% 7.6%Grades 9-12 46.0% 27.6% 18.8% 3.8% 3.8%
Cocaine?
Very Somewhat Not Very Not at All Do NotDangerous Dangerous Dangerous Dangerous Know
All 84.4% 9.6% 1.7% 0.4% 3.9%Grades 7-8 90.9% 3.7% 1.4% * % 4.0%
Grades 9-12 80.9% 12.8% 1.9% 0.6% 3.8%
Crack?
Very Somewhat Not Very Not at All Do NotDangerous Dangerous Dangerous Dangerous Know
All 84.4% 8.3% 0.9% 0.4% 6.0%Grades 7-8 88.7% 3.5% 1.4% * % 6.4%Grades 9-12 81.9% 11.0% 0.6% 0.7% 5.8%
Ecstasy?
Very Somewhat Not Very Not at All Do NotDangerous Dangerous Dangerous Dangerous Know
All 81.8% 7.3% 2.0% 1.2% 7.6%
Grades 7-8 89.0% 2.3% * % * % 8.7%Grades 9-12 77.7% 10.2% 3.2% 1.9% 7.0%
Steroids?
Very Somewhat Not Very Not at All Do NotDangerous Dangerous Dangerous Dangerous Know
All 79.5% 11.9% 0.8% 0.4% 7.3%Grades 7-8 88.2% 5.3% * % * % 6.5%Grades 9-12 74.7% 15.6% 1.3% 0.7% 7.7%
Heroin?
Very Somewhat Not Very Not at All Do NotDangerous Dangerous Dangerous Dangerous Know
All 86.1% 6.4% 0.8% * % 6.7%Grades 7-8 88.9% 2.4% * % * % 8.8%Grades 9-12 84.5% 8.7% 1.2% * % 5.5%
8/14/2019 CROSBY COUNTY - Ralls ISD - 2001 Texas School Survey of Drug and Alcohol Use
http://slidepdf.com/reader/full/crosby-county-ralls-isd-2001-texas-school-survey-of-drug-and-alcohol-use 27/144
RallsSpring 2001
______________________________________________________________________________________________
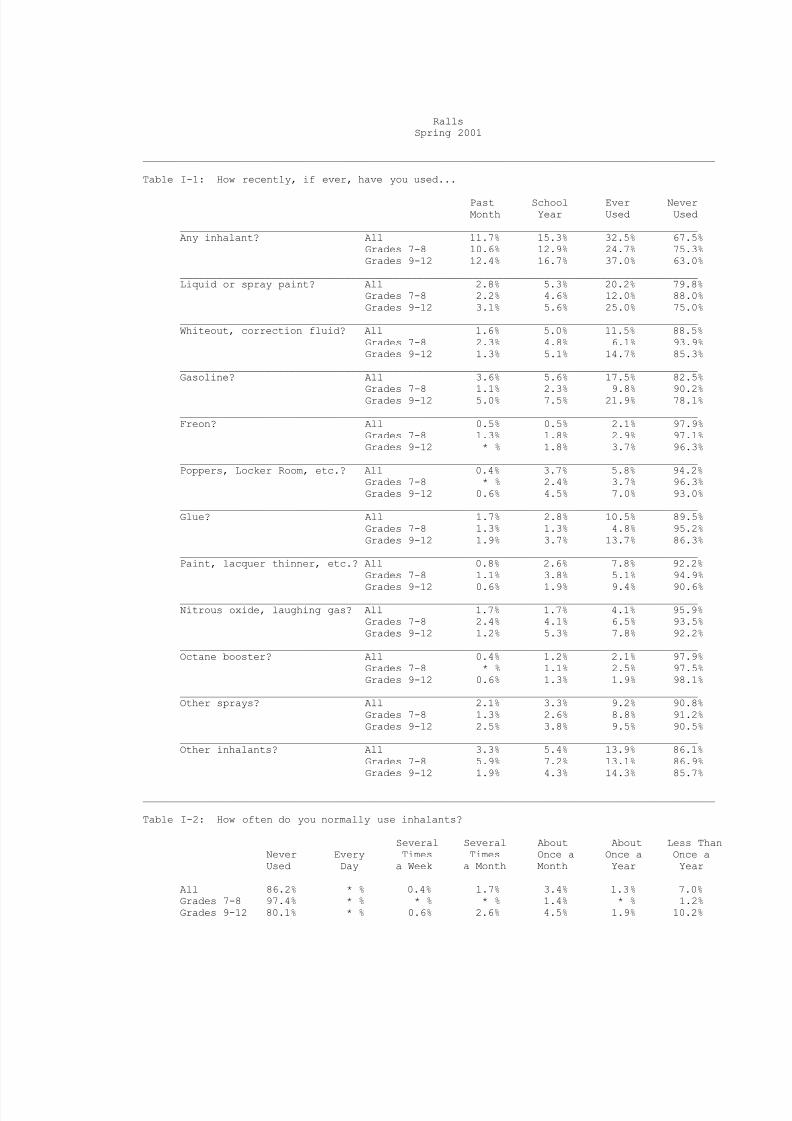
Table I-1: How recently, if ever, have you used...
Past School Ever NeverMonth Year Used Used
_____________________________________________________________________________________Any inhalant? All 11.7% 15.3% 32.5% 67.5%
Grades 7-8 10.6% 12.9% 24.7% 75.3%Grades 9-12 12.4% 16.7% 37.0% 63.0%
_____________________________________________________________________________________Liquid or spray paint? All 2.8% 5.3% 20.2% 79.8%
Grades 7-8 2.2% 4.6% 12.0% 88.0%Grades 9-12 3.1% 5.6% 25.0% 75.0%
_____________________________________________________________________________________Whiteout, correction fluid? All 1.6% 5.0% 11.5% 88.5%
Grades 7-8 2.3% 4.8% 6.1% 93.9%Grades 9-12 1.3% 5.1% 14.7% 85.3%
_____________________________________________________________________________________Gasoline? All 3.6% 5.6% 17.5% 82.5%
Grades 7-8 1.1% 2.3% 9.8% 90.2%Grades 9-12 5.0% 7.5% 21.9% 78.1%_____________________________________________________________________________________Freon? All 0.5% 0.5% 2.1% 97.9%
Grades 7-8 1.3% 1.8% 2.9% 97.1%Grades 9-12 * % 1.8% 3.7% 96.3%
_____________________________________________________________________________________Poppers, Locker Room, etc.? All 0.4% 3.7% 5.8% 94.2%
Grades 7-8 * % 2.4% 3.7% 96.3%Grades 9-12 0.6% 4.5% 7.0% 93.0%
_____________________________________________________________________________________Glue? All 1.7% 2.8% 10.5% 89.5%
Grades 7-8 1.3% 1.3% 4.8% 95.2%Grades 9-12 1.9% 3.7% 13.7% 86.3%
_____________________________________________________________________________________Paint, lacquer thinner, etc.? All 0.8% 2.6% 7.8% 92.2%
Grades 7-8 1.1% 3.8% 5.1% 94.9%
Grades 9-12 0.6% 1.9% 9.4% 90.6%_____________________________________________________________________________________Nitrous oxide, laughing gas? All 1.7% 1.7% 4.1% 95.9%
Grades 7-8 2.4% 4.1% 6.5% 93.5%Grades 9-12 1.2% 5.3% 7.8% 92.2%
_____________________________________________________________________________________Octane booster? All 0.4% 1.2% 2.1% 97.9%
Grades 7-8 * % 1.1% 2.5% 97.5%Grades 9-12 0.6% 1.3% 1.9% 98.1%
_____________________________________________________________________________________Other sprays? All 2.1% 3.3% 9.2% 90.8%
Grades 7-8 1.3% 2.6% 8.8% 91.2%Grades 9-12 2.5% 3.8% 9.5% 90.5%
_____________________________________________________________________________________Other inhalants? All 3.3% 5.4% 13.9% 86.1%
Grades 7-8 5.9% 7.2% 13.1% 86.9%Grades 9-12 1.9% 4.3% 14.3% 85.7%
______________________________________________________________________________________________
Table I-2: How often do you normally use inhalants?
Several Several About About Less ThanNever Every Times Times Once a Once a Once aUsed Day a Week a Month Month Year Year
All 86.2% * % 0.4% 1.7% 3.4% 1.3% 7.0%Grades 7-8 97.4% * % * % * % 1.4% * % 1.2%Grades 9-12 80.1% * % 0.6% 2.6% 4.5% 1.9% 10.2%

8/14/2019 CROSBY COUNTY - Ralls ISD - 2001 Texas School Survey of Drug and Alcohol Use
http://slidepdf.com/reader/full/crosby-county-ralls-isd-2001-texas-school-survey-of-drug-and-alcohol-use 28/144

8/14/2019 CROSBY COUNTY - Ralls ISD - 2001 Texas School Survey of Drug and Alcohol Use
http://slidepdf.com/reader/full/crosby-county-ralls-isd-2001-texas-school-survey-of-drug-and-alcohol-use 29/144
RallsSpring 2001
______________________________________________________________________________________________
Table I-3: Number of different kinds of inhalants used:
0 1 2-3 4+
All 69.6% 10.4% 11.1% 8.9%Grades 7-8 78.7% 9.3% 5.8% 6.1%Grades 9-12 64.2% 11.1% 14.2% 10.5%
______________________________________________________________________________________________
Table I-4: Average age of first use of:
Grades 7-8 Grades 9-12
Inhalants * 12.8
______________________________________________________________________________________________
Table I-5: Since school began in the fall, on how many days (if any) have you attendedclass while high from inhalant use?
None 1-3 Days 4-9 Days 10+ Days
All 97.6% 2.0% * % 0.4%Grades 7-8 100.0% * % * % * %Grades 9-12 96.2% 3.1% * % 0.6%
______________________________________________________________________________________________
Table I-6: School year use of inhalants by absences and conduct problems:
Average days absent due to illness or other reasons:
Inhalants Users: 4.1 days per studentInhalants Non-users: 3.6 days per student
Average days conduct problems reported:
Inhalants Users: 2.5 days per studentInhalants Non-users: 1.0 days per student
______________________________________________________________________________________________
Table I-7: About how many of your close friends use inhalants?
Never heardNone A Few Some Most All
All 73.2% 16.4% 6.5% 2.8% 1.2%Grades 7-8 85.3% 12.3% 2.4% * % * %Grades 9-12 66.1% 18.8% 8.8% 4.4% 1.9%
______________________________________________________________________________________________
Table I-8: How dangerous do you think it is for kids your age to use inhalants?
Very Somewhat Not Very Not at All Do NotDangerous Dangerous Dangerous Dangerous Know
All 78.0% 13.7% 2.4% 1.7% 4.2%Grades 7-8 89.6% 6.4% * % 1.2% 2.8%Grades 9-12 71.7% 17.6% 3.7% 1.9% 5.0%
8/14/2019 CROSBY COUNTY - Ralls ISD - 2001 Texas School Survey of Drug and Alcohol Use
http://slidepdf.com/reader/full/crosby-county-ralls-isd-2001-texas-school-survey-of-drug-and-alcohol-use 30/144
RallsSpring 2001
______________________________________________________________________________________________
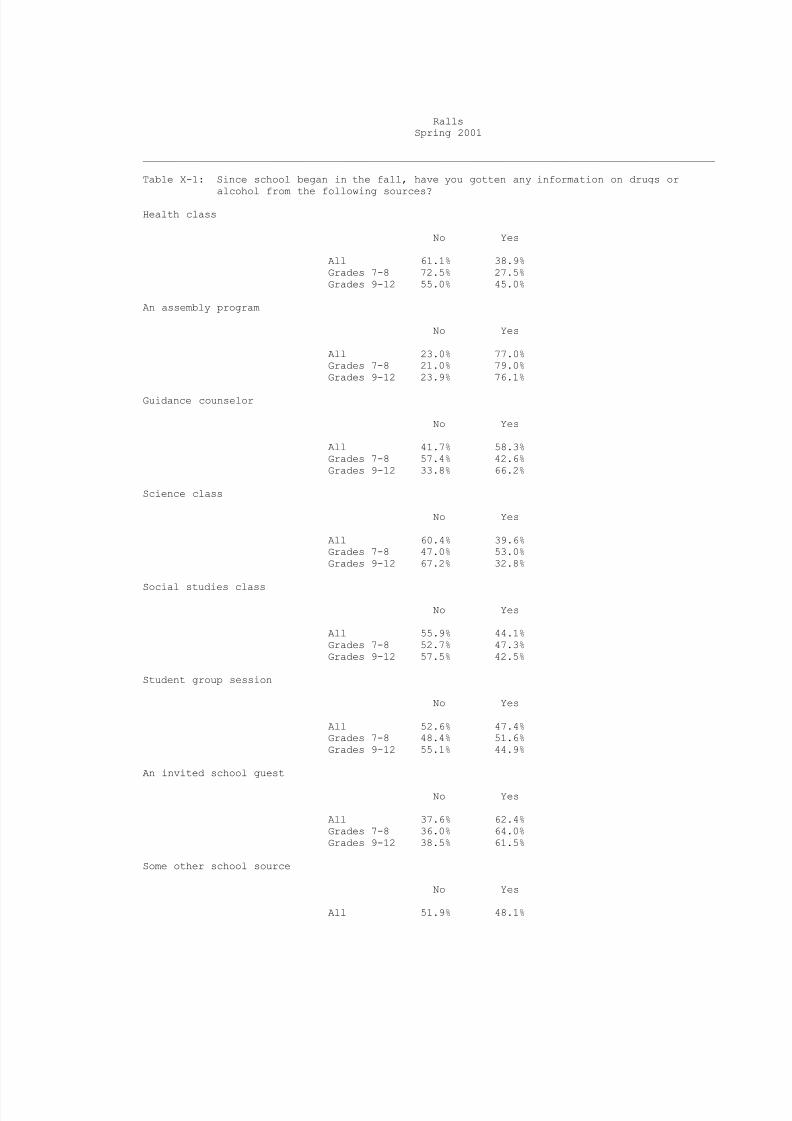
Table X-1: Since school began in the fall, have you gotten any information on drugs or
alcohol from the following sources?
Health class
No Yes
All 61.1% 38.9%Grades 7-8 72.5% 27.5%Grades 9-12 55.0% 45.0%
An assembly program
No Yes
All 23.0% 77.0%Grades 7-8 21.0% 79.0%Grades 9-12 23.9% 76.1%
Guidance counselor
No Yes
All 41.7% 58.3%Grades 7-8 57.4% 42.6%Grades 9-12 33.8% 66.2%
Science class
No Yes
All 60.4% 39.6%Grades 7-8 47.0% 53.0%Grades 9-12 67.2% 32.8%
Social studies class
No Yes
All 55.9% 44.1%Grades 7-8 52.7% 47.3%Grades 9-12 57.5% 42.5%
Student group session
No Yes
All 52.6% 47.4%Grades 7-8 48.4% 51.6%Grades 9-12 55.1% 44.9%
An invited school guest
No Yes
All 37.6% 62.4%Grades 7-8 36.0% 64.0%Grades 9-12 38.5% 61.5%
Some other school source
No Yes
All 51.9% 48.1%
8/14/2019 CROSBY COUNTY - Ralls ISD - 2001 Texas School Survey of Drug and Alcohol Use
http://slidepdf.com/reader/full/crosby-county-ralls-isd-2001-texas-school-survey-of-drug-and-alcohol-use 31/144
Grades 7-8 49.2% 50.8%Grades 9-12 53.3% 46.7%
8/14/2019 CROSBY COUNTY - Ralls ISD - 2001 Texas School Survey of Drug and Alcohol Use
http://slidepdf.com/reader/full/crosby-county-ralls-isd-2001-texas-school-survey-of-drug-and-alcohol-use 32/144
RallsSpring 2001
______________________________________________________________________________________________
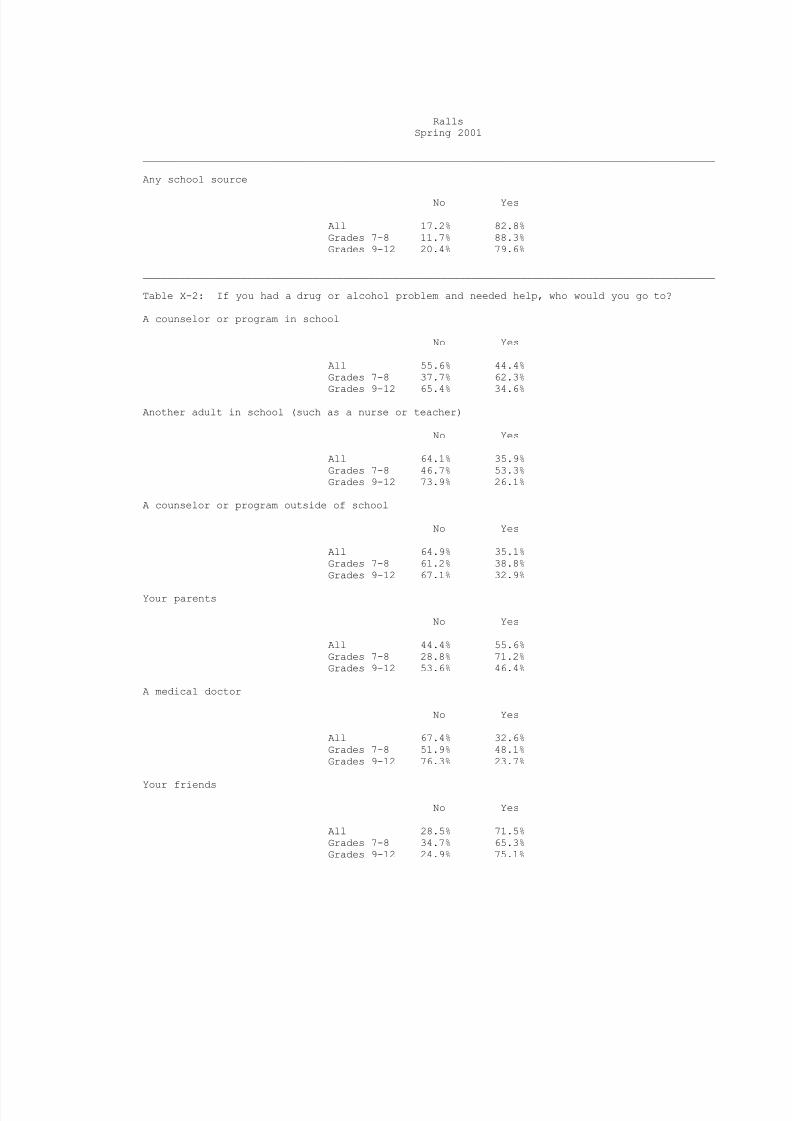
Any school source
No Yes
All 17.2% 82.8%Grades 7-8 11.7% 88.3%Grades 9-12 20.4% 79.6%
______________________________________________________________________________________________
Table X-2: If you had a drug or alcohol problem and needed help, who would you go to?
A counselor or program in school
No Yes
All 55.6% 44.4%Grades 7-8 37.7% 62.3%
Grades 9-12 65.4% 34.6%
Another adult in school (such as a nurse or teacher)
No Yes
All 64.1% 35.9%Grades 7-8 46.7% 53.3%Grades 9-12 73.9% 26.1%
A counselor or program outside of school
No Yes
All 64.9% 35.1%Grades 7-8 61.2% 38.8%Grades 9-12 67.1% 32.9%
Your parents
No Yes
All 44.4% 55.6%Grades 7-8 28.8% 71.2%Grades 9-12 53.6% 46.4%
A medical doctor
No Yes
All 67.4% 32.6%Grades 7-8 51.9% 48.1%Grades 9-12 76.3% 23.7%
Your friends
No Yes
All 28.5% 71.5%Grades 7-8 34.7% 65.3%Grades 9-12 24.9% 75.1%
8/14/2019 CROSBY COUNTY - Ralls ISD - 2001 Texas School Survey of Drug and Alcohol Use
http://slidepdf.com/reader/full/crosby-county-ralls-isd-2001-texas-school-survey-of-drug-and-alcohol-use 33/144
RallsSpring 2001
______________________________________________________________________________________________
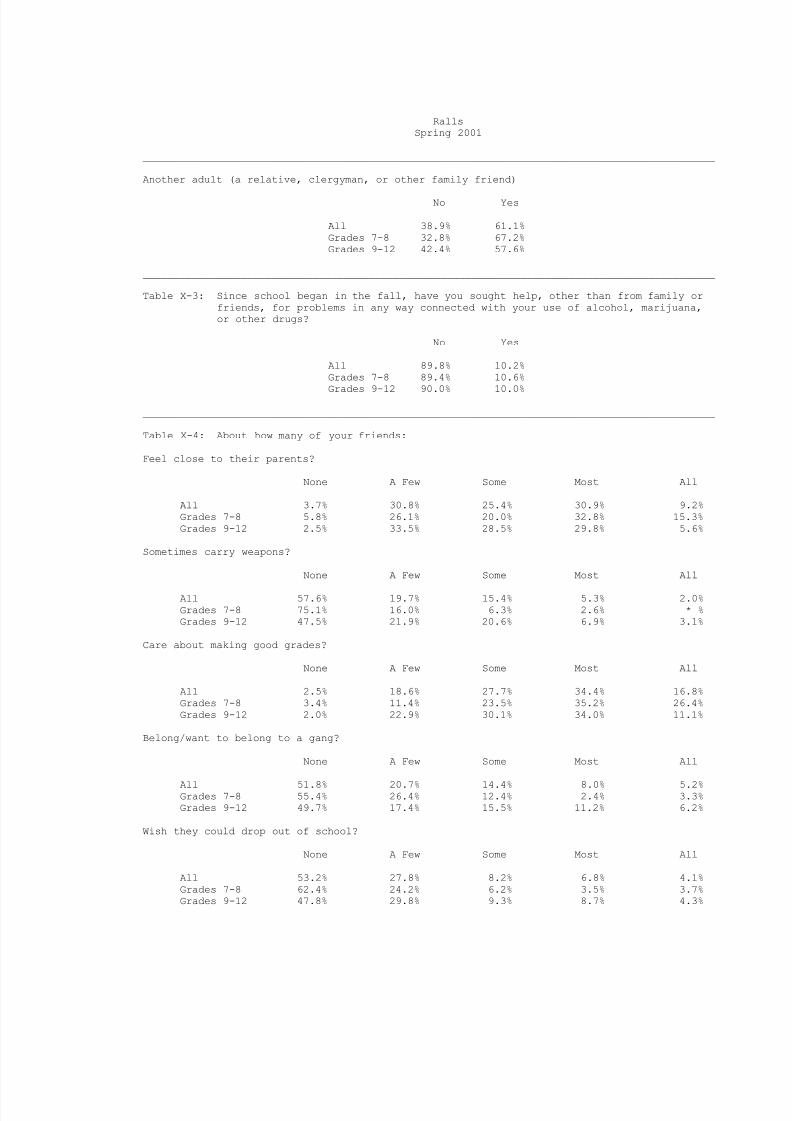
Another adult (a relative, clergyman, or other family friend)
No Yes
All 38.9% 61.1%Grades 7-8 32.8% 67.2%Grades 9-12 42.4% 57.6%
______________________________________________________________________________________________
Table X-3: Since school began in the fall, have you sought help, other than from family orfriends, for problems in any way connected with your use of alcohol, marijuana,or other drugs?
No Yes
All 89.8% 10.2%Grades 7-8 89.4% 10.6%
Grades 9-12 90.0% 10.0%
______________________________________________________________________________________________
Table X-4: About how many of your friends:
Feel close to their parents?
None A Few Some Most All
All 3.7% 30.8% 25.4% 30.9% 9.2%Grades 7-8 5.8% 26.1% 20.0% 32.8% 15.3%Grades 9-12 2.5% 33.5% 28.5% 29.8% 5.6%
Sometimes carry weapons?
None A Few Some Most All
All 57.6% 19.7% 15.4% 5.3% 2.0%Grades 7-8 75.1% 16.0% 6.3% 2.6% * %Grades 9-12 47.5% 21.9% 20.6% 6.9% 3.1%
Care about making good grades?
None A Few Some Most All
All 2.5% 18.6% 27.7% 34.4% 16.8%Grades 7-8 3.4% 11.4% 23.5% 35.2% 26.4%Grades 9-12 2.0% 22.9% 30.1% 34.0% 11.1%
Belong/want to belong to a gang?
None A Few Some Most All
All 51.8% 20.7% 14.4% 8.0% 5.2%Grades 7-8 55.4% 26.4% 12.4% 2.4% 3.3%Grades 9-12 49.7% 17.4% 15.5% 11.2% 6.2%
Wish they could drop out of school?
None A Few Some Most All
All 53.2% 27.8% 8.2% 6.8% 4.1%Grades 7-8 62.4% 24.2% 6.2% 3.5% 3.7%Grades 9-12 47.8% 29.8% 9.3% 8.7% 4.3%

8/14/2019 CROSBY COUNTY - Ralls ISD - 2001 Texas School Survey of Drug and Alcohol Use
http://slidepdf.com/reader/full/crosby-county-ralls-isd-2001-texas-school-survey-of-drug-and-alcohol-use 34/144

8/14/2019 CROSBY COUNTY - Ralls ISD - 2001 Texas School Survey of Drug and Alcohol Use
http://slidepdf.com/reader/full/crosby-county-ralls-isd-2001-texas-school-survey-of-drug-and-alcohol-use 35/144
RallsSpring 2001
Table B1: Prevalence and recency of use of selected substances by grade--> All students
Past School Ever NeverMonth Year Used Used
_____________________________________________________________________________________Tobacco All 31.3% 41.0% 64.6% 35.4%Grades 7-8 18.7% 25.8% 48.4% 51.6%Grades 9-12 38.5% 49.7% 73.9% 26.1%
_____________________________________________________________________________________Alcohol All 36.2% 53.1% 74.5% 25.5%
Grades 7-8 28.2% 37.9% 62.3% 37.7%Grades 9-12 40.8% 61.7% 81.5% 18.5%
_____________________________________________________________________________________Inhalants All 11.7% 15.3% 32.5% 67.5%
Grades 7-8 10.6% 12.9% 24.7% 75.3%Grades 9-12 12.4% 16.7% 37.0% 63.0%
_____________________________________________________________________________________Any Illicit Drug All 22.0% 31.3% 45.9% 54.1%
Grades 7-8 15.0% 21.3% 31.1% 68.9%Grades 9-12 25.9% 37.0% 54.3% 45.7%
_____________________________________________________________________________________
Marijuana All 20.6% 30.5% 45.1% 54.9%Grades 7-8 11.3% 19.9% 29.8% 70.2%Grades 9-12 25.9% 36.4% 53.7% 46.3%
_____________________________________________________________________________________Marijuana Only All 8.4% 13.2% 23.6% 76.4%
Grades 7-8 6.0% 9.4% 17.6% 82.4%Grades 9-12 9.8% 15.4% 27.1% 72.9%
_____________________________________________________________________________________Cocaine or Crack All 8.8% 12.5% 17.5% 82.5%
Grades 7-8 1.2% 3.8% 6.5% 93.5%Grades 9-12 13.1% 17.4% 23.6% 76.4%
_____________________________________________________________________________________Cocaine All 8.1% 11.9% 16.8% 83.2%
Grades 7-8 * % 2.8% 5.3% 94.7%Grades 9-12 12.4% 16.8% 23.0% 77.0%
_____________________________________________________________________________________Crack All 3.3% 4.1% 6.6% 93.4%
Grades 7-8 1.2% 2.5% 3.9% 96.1%Grades 9-12 4.4% 5.0% 8.1% 91.9%
_____________________________________________________________________________________Hallucinogens All 0.8% 0.8% 3.0% 97.0%
Grades 7-8 * % * % 2.7% 97.3%Grades 9-12 1.3% 1.3% 3.1% 96.9%
_____________________________________________________________________________________Uppers All 0.5% 0.5% 2.2% 97.8%
Grades 7-8 1.4% 1.4% 2.7% 97.3%Grades 9-12 * % * % 1.9% 98.1%
_____________________________________________________________________________________Downers All 0.8% 0.8% 2.1% 97.9%
Grades 7-8 * % * % 1.4% 98.6%Grades 9-12 1.3% 1.3% 2.5% 97.5%
_____________________________________________________________________________________Rohypnol All 2.1% 2.6% 5.8% 94.2%
Grades 7-8 1.3% 2.7% 4.0% 96.0%
Grades 9-12 2.5% 2.5% 6.9% 93.1%_____________________________________________________________________________________Steroids All 0.8% 1.3% 2.2% 97.8%
Grades 7-8 * % 1.3% 2.7% 97.3%Grades 9-12 1.3% 1.3% 1.9% 98.1%
_____________________________________________________________________________________Ecstasy All 0.9% 1.3% 4.6% 95.4%
Grades 7-8 1.4% 1.4% 2.7% 97.3%Grades 9-12 0.6% 1.2% 5.6% 94.4%
_____________________________________________________________________________________Heroin All * % 0.9% 2.1% 97.9%
Grades 7-8 * % 2.5% 2.5% 97.5%
8/14/2019 CROSBY COUNTY - Ralls ISD - 2001 Texas School Survey of Drug and Alcohol Use
http://slidepdf.com/reader/full/crosby-county-ralls-isd-2001-texas-school-survey-of-drug-and-alcohol-use 36/144
Grades 9-12 * % * % 1.9% 98.1%
8/14/2019 CROSBY COUNTY - Ralls ISD - 2001 Texas School Survey of Drug and Alcohol Use
http://slidepdf.com/reader/full/crosby-county-ralls-isd-2001-texas-school-survey-of-drug-and-alcohol-use 37/144
RallsSpring 2001
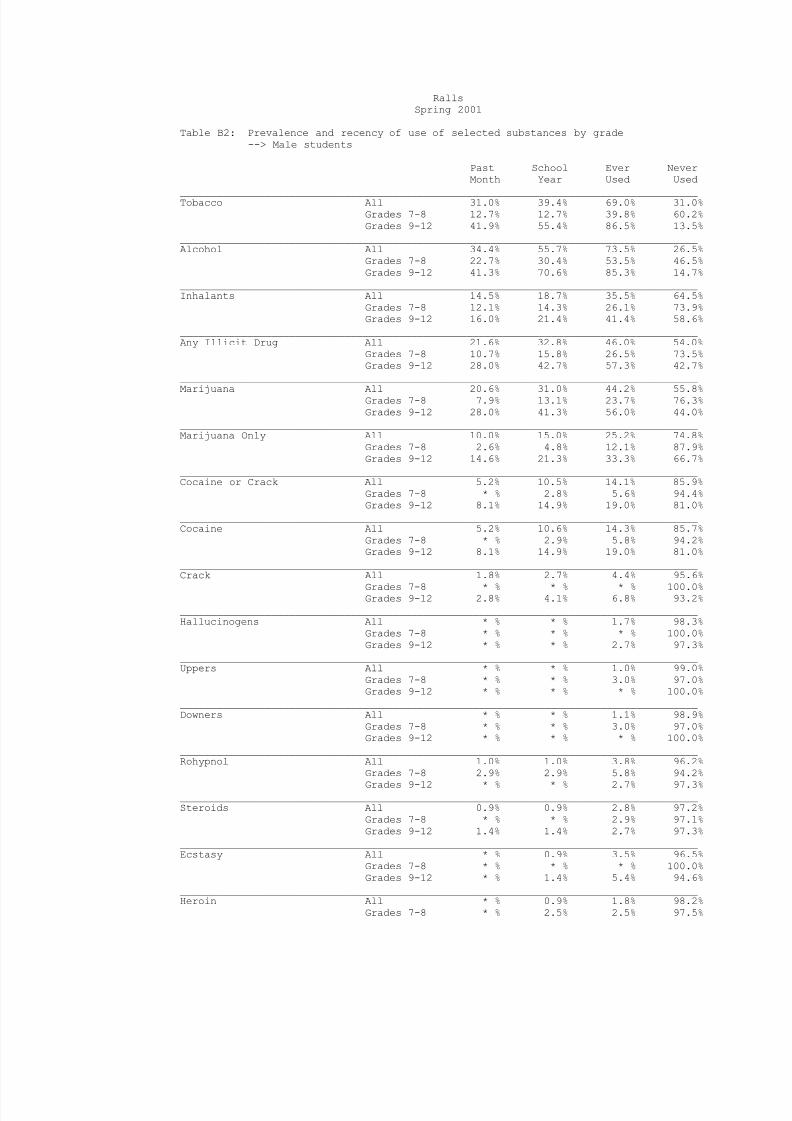
Table B2: Prevalence and recency of use of selected substances by grade--> Male students
Past School Ever NeverMonth Year Used Used
_____________________________________________________________________________________Tobacco All 31.0% 39.4% 69.0% 31.0%Grades 7-8 12.7% 12.7% 39.8% 60.2%Grades 9-12 41.9% 55.4% 86.5% 13.5%
_____________________________________________________________________________________Alcohol All 34.4% 55.7% 73.5% 26.5%
Grades 7-8 22.7% 30.4% 53.5% 46.5%Grades 9-12 41.3% 70.6% 85.3% 14.7%
_____________________________________________________________________________________Inhalants All 14.5% 18.7% 35.5% 64.5%
Grades 7-8 12.1% 14.3% 26.1% 73.9%Grades 9-12 16.0% 21.4% 41.4% 58.6%
_____________________________________________________________________________________Any Illicit Drug All 21.6% 32.8% 46.0% 54.0%
Grades 7-8 10.7% 15.8% 26.5% 73.5%Grades 9-12 28.0% 42.7% 57.3% 42.7%
_____________________________________________________________________________________
Marijuana All 20.6% 31.0% 44.2% 55.8%Grades 7-8 7.9% 13.1% 23.7% 76.3%Grades 9-12 28.0% 41.3% 56.0% 44.0%
_____________________________________________________________________________________Marijuana Only All 10.0% 15.0% 25.2% 74.8%
Grades 7-8 2.6% 4.8% 12.1% 87.9%Grades 9-12 14.6% 21.3% 33.3% 66.7%
_____________________________________________________________________________________Cocaine or Crack All 5.2% 10.5% 14.1% 85.9%
Grades 7-8 * % 2.8% 5.6% 94.4%Grades 9-12 8.1% 14.9% 19.0% 81.0%
_____________________________________________________________________________________Cocaine All 5.2% 10.6% 14.3% 85.7%
Grades 7-8 * % 2.9% 5.8% 94.2%Grades 9-12 8.1% 14.9% 19.0% 81.0%
_____________________________________________________________________________________Crack All 1.8% 2.7% 4.4% 95.6%
Grades 7-8 * % * % * % 100.0%Grades 9-12 2.8% 4.1% 6.8% 93.2%
_____________________________________________________________________________________Hallucinogens All * % * % 1.7% 98.3%
Grades 7-8 * % * % * % 100.0%Grades 9-12 * % * % 2.7% 97.3%
_____________________________________________________________________________________Uppers All * % * % 1.0% 99.0%
Grades 7-8 * % * % 3.0% 97.0%Grades 9-12 * % * % * % 100.0%
_____________________________________________________________________________________Downers All * % * % 1.1% 98.9%
Grades 7-8 * % * % 3.0% 97.0%Grades 9-12 * % * % * % 100.0%
_____________________________________________________________________________________Rohypnol All 1.0% 1.0% 3.8% 96.2%
Grades 7-8 2.9% 2.9% 5.8% 94.2%
Grades 9-12 * % * % 2.7% 97.3%_____________________________________________________________________________________Steroids All 0.9% 0.9% 2.8% 97.2%
Grades 7-8 * % * % 2.9% 97.1%Grades 9-12 1.4% 1.4% 2.7% 97.3%
_____________________________________________________________________________________Ecstasy All * % 0.9% 3.5% 96.5%
Grades 7-8 * % * % * % 100.0%Grades 9-12 * % 1.4% 5.4% 94.6%
_____________________________________________________________________________________Heroin All * % 0.9% 1.8% 98.2%
Grades 7-8 * % 2.5% 2.5% 97.5%

8/14/2019 CROSBY COUNTY - Ralls ISD - 2001 Texas School Survey of Drug and Alcohol Use
http://slidepdf.com/reader/full/crosby-county-ralls-isd-2001-texas-school-survey-of-drug-and-alcohol-use 38/144
Grades 9-12 * % * % 1.4% 98.6%

8/14/2019 CROSBY COUNTY - Ralls ISD - 2001 Texas School Survey of Drug and Alcohol Use
http://slidepdf.com/reader/full/crosby-county-ralls-isd-2001-texas-school-survey-of-drug-and-alcohol-use 39/144
RallsSpring 2001
Table B3: Prevalence and recency of use of selected substances by grade--> Female students
Past School Ever NeverMonth Year Used Used
_____________________________________________________________________________________Tobacco All 31.4% 42.4% 60.1% 39.9%Grades 7-8 24.9% 39.0% 55.3% 44.7%Grades 9-12 34.9% 44.2% 62.7% 37.3%
_____________________________________________________________________________________Alcohol All 36.8% 50.0% 75.0% 25.0%
Grades 7-8 31.6% 43.5% 69.7% 30.3%Grades 9-12 39.6% 53.5% 77.9% 22.1%
_____________________________________________________________________________________Inhalants All 8.5% 11.7% 28.6% 71.4%
Grades 7-8 9.3% 11.8% 21.4% 78.6%Grades 9-12 8.1% 11.6% 32.5% 67.5%
_____________________________________________________________________________________Any Illicit Drug All 21.0% 28.9% 45.0% 55.0%
Grades 7-8 16.9% 24.3% 33.6% 66.4%Grades 9-12 23.2% 31.4% 51.1% 48.9%
_____________________________________________________________________________________
Marijuana All 19.3% 28.9% 45.0% 55.0%Grades 7-8 12.1% 24.3% 33.6% 66.4%Grades 9-12 23.2% 31.4% 51.1% 48.9%
_____________________________________________________________________________________Marijuana Only All 5.5% 10.2% 21.0% 79.0%
Grades 7-8 7.0% 11.8% 21.1% 78.9%Grades 9-12 4.6% 9.3% 20.9% 79.1%
_____________________________________________________________________________________Cocaine or Crack All 12.1% 14.5% 20.7% 79.3%
Grades 7-8 2.2% 4.8% 7.4% 92.6%Grades 9-12 17.5% 19.8% 27.9% 72.1%
_____________________________________________________________________________________Cocaine All 10.8% 13.2% 19.4% 80.6%
Grades 7-8 * % 2.7% 5.1% 94.9%Grades 9-12 16.3% 18.6% 26.7% 73.3%
_____________________________________________________________________________________Crack All 4.6% 5.5% 8.6% 91.4%
Grades 7-8 2.2% 4.8% 7.4% 92.6%Grades 9-12 5.8% 5.8% 9.3% 90.7%
_____________________________________________________________________________________Hallucinogens All 1.5% 1.5% 4.1% 95.9%
Grades 7-8 * % * % 5.3% 94.7%Grades 9-12 2.3% 2.3% 3.5% 96.5%
_____________________________________________________________________________________Uppers All 0.9% 0.9% 3.2% 96.8%
Grades 7-8 2.6% 2.6% 2.6% 97.4%Grades 9-12 * % * % 3.5% 96.5%
_____________________________________________________________________________________Downers All 1.5% 1.5% 3.1% 96.9%
Grades 7-8 * % * % * % 100.0%Grades 9-12 2.4% 2.4% 4.7% 95.3%
_____________________________________________________________________________________Rohypnol All 3.1% 4.0% 7.7% 92.3%
Grades 7-8 * % 2.6% 2.6% 97.4%
Grades 9-12 4.7% 4.7% 10.5% 89.5%_____________________________________________________________________________________Steroids All 0.8% 1.7% 1.7% 98.3%
Grades 7-8 * % 2.6% 2.6% 97.4%Grades 9-12 1.2% 1.2% 1.2% 98.8%
_____________________________________________________________________________________Ecstasy All 1.7% 1.7% 5.6% 94.4%
Grades 7-8 2.6% 2.6% 5.1% 94.9%Grades 9-12 1.2% 1.2% 5.8% 94.2%
_____________________________________________________________________________________Heroin All * % 0.9% 2.4% 97.6%
Grades 7-8 * % 2.6% 2.6% 97.4%

8/14/2019 CROSBY COUNTY - Ralls ISD - 2001 Texas School Survey of Drug and Alcohol Use
http://slidepdf.com/reader/full/crosby-county-ralls-isd-2001-texas-school-survey-of-drug-and-alcohol-use 40/144
Grades 9-12 * % * % 2.3% 97.7%
8/14/2019 CROSBY COUNTY - Ralls ISD - 2001 Texas School Survey of Drug and Alcohol Use
http://slidepdf.com/reader/full/crosby-county-ralls-isd-2001-texas-school-survey-of-drug-and-alcohol-use 41/144
RallsSpring 2001
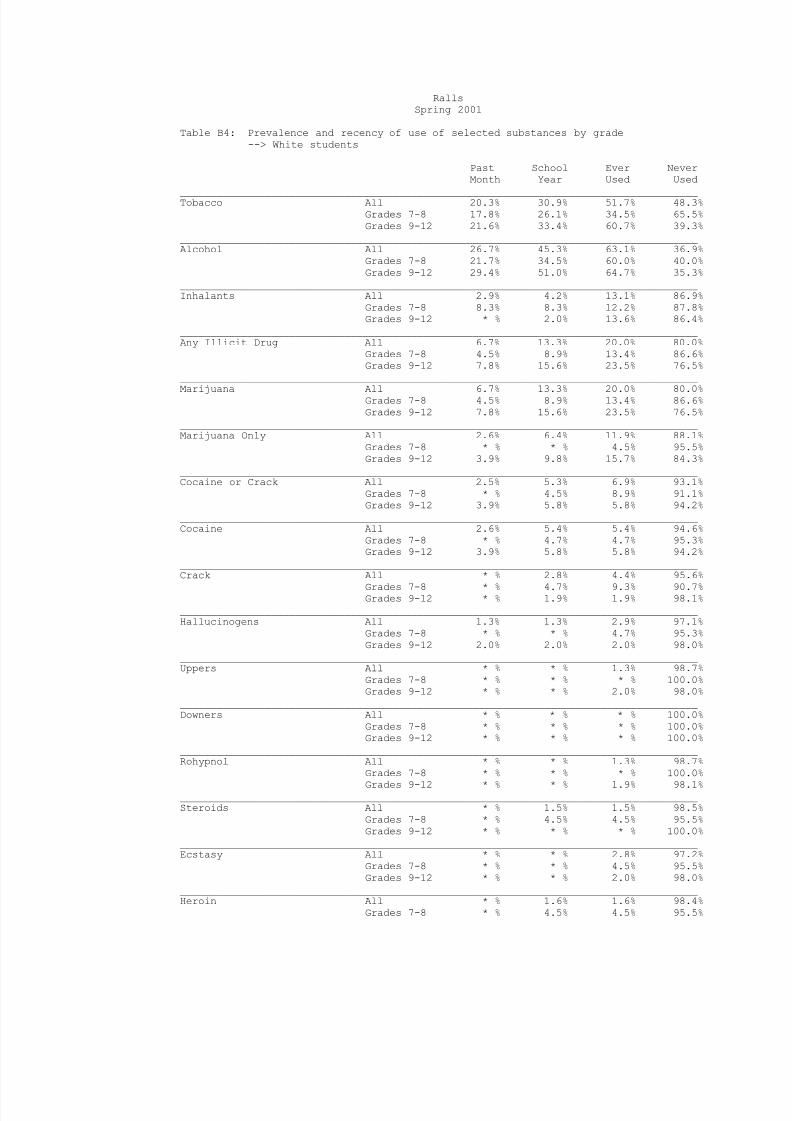
Table B4: Prevalence and recency of use of selected substances by grade--> White students
Past School Ever NeverMonth Year Used Used
_____________________________________________________________________________________Tobacco All 20.3% 30.9% 51.7% 48.3%Grades 7-8 17.8% 26.1% 34.5% 65.5%Grades 9-12 21.6% 33.4% 60.7% 39.3%
_____________________________________________________________________________________Alcohol All 26.7% 45.3% 63.1% 36.9%
Grades 7-8 21.7% 34.5% 60.0% 40.0%Grades 9-12 29.4% 51.0% 64.7% 35.3%
_____________________________________________________________________________________Inhalants All 2.9% 4.2% 13.1% 86.9%
Grades 7-8 8.3% 8.3% 12.2% 87.8%Grades 9-12 * % 2.0% 13.6% 86.4%
_____________________________________________________________________________________Any Illicit Drug All 6.7% 13.3% 20.0% 80.0%
Grades 7-8 4.5% 8.9% 13.4% 86.6%Grades 9-12 7.8% 15.6% 23.5% 76.5%
_____________________________________________________________________________________
Marijuana All 6.7% 13.3% 20.0% 80.0%Grades 7-8 4.5% 8.9% 13.4% 86.6%Grades 9-12 7.8% 15.6% 23.5% 76.5%
_____________________________________________________________________________________Marijuana Only All 2.6% 6.4% 11.9% 88.1%
Grades 7-8 * % * % 4.5% 95.5%Grades 9-12 3.9% 9.8% 15.7% 84.3%
_____________________________________________________________________________________Cocaine or Crack All 2.5% 5.3% 6.9% 93.1%
Grades 7-8 * % 4.5% 8.9% 91.1%Grades 9-12 3.9% 5.8% 5.8% 94.2%
_____________________________________________________________________________________Cocaine All 2.6% 5.4% 5.4% 94.6%
Grades 7-8 * % 4.7% 4.7% 95.3%Grades 9-12 3.9% 5.8% 5.8% 94.2%
_____________________________________________________________________________________Crack All * % 2.8% 4.4% 95.6%
Grades 7-8 * % 4.7% 9.3% 90.7%Grades 9-12 * % 1.9% 1.9% 98.1%
_____________________________________________________________________________________Hallucinogens All 1.3% 1.3% 2.9% 97.1%
Grades 7-8 * % * % 4.7% 95.3%Grades 9-12 2.0% 2.0% 2.0% 98.0%
_____________________________________________________________________________________Uppers All * % * % 1.3% 98.7%
Grades 7-8 * % * % * % 100.0%Grades 9-12 * % * % 2.0% 98.0%
_____________________________________________________________________________________Downers All * % * % * % 100.0%
Grades 7-8 * % * % * % 100.0%Grades 9-12 * % * % * % 100.0%
_____________________________________________________________________________________Rohypnol All * % * % 1.3% 98.7%
Grades 7-8 * % * % * % 100.0%
Grades 9-12 * % * % 1.9% 98.1%_____________________________________________________________________________________Steroids All * % 1.5% 1.5% 98.5%
Grades 7-8 * % 4.5% 4.5% 95.5%Grades 9-12 * % * % * % 100.0%
_____________________________________________________________________________________Ecstasy All * % * % 2.8% 97.2%
Grades 7-8 * % * % 4.5% 95.5%Grades 9-12 * % * % 2.0% 98.0%
_____________________________________________________________________________________Heroin All * % 1.6% 1.6% 98.4%
Grades 7-8 * % 4.5% 4.5% 95.5%

8/14/2019 CROSBY COUNTY - Ralls ISD - 2001 Texas School Survey of Drug and Alcohol Use
http://slidepdf.com/reader/full/crosby-county-ralls-isd-2001-texas-school-survey-of-drug-and-alcohol-use 42/144
Grades 9-12 * % * % * % 100.0%

8/14/2019 CROSBY COUNTY - Ralls ISD - 2001 Texas School Survey of Drug and Alcohol Use
http://slidepdf.com/reader/full/crosby-county-ralls-isd-2001-texas-school-survey-of-drug-and-alcohol-use 43/144
RallsSpring 2001
Table B5: Prevalence and recency of use of selected substances by grade--> Black students
Past School Ever NeverMonth Year Used Used
_____________________________________________________________________________________Tobacco All * % * % * % 100.0%Grades 7-8 * % * % * % 100.0%Grades 9-12 * % * % * % 100.0%
_____________________________________________________________________________________Alcohol All * % * % * % 100.0%
Grades 7-8 * % * % * % 100.0%Grades 9-12 * % * % * % 100.0%
_____________________________________________________________________________________Inhalants All * % * % * % 100.0%
Grades 7-8 * % * % * % 100.0%Grades 9-12 * % * % * % 100.0%
_____________________________________________________________________________________Any Illicit Drug All * % * % * % 100.0%
Grades 7-8 * % * % * % 100.0%Grades 9-12 * % * % * % 100.0%
_____________________________________________________________________________________
Marijuana All * % * % * % 100.0%Grades 7-8 * % * % * % 100.0%Grades 9-12 * % * % * % 100.0%
_____________________________________________________________________________________Marijuana Only All * % * % * % 100.0%
Grades 7-8 * % * % * % 100.0%Grades 9-12 * % * % * % 100.0%
_____________________________________________________________________________________Cocaine or Crack All * % * % * % 100.0%
Grades 7-8 * % * % * % 100.0%Grades 9-12 * % * % * % 100.0%
_____________________________________________________________________________________Cocaine All * % * % * % 100.0%
Grades 7-8 * % * % * % 100.0%Grades 9-12 * % * % * % 100.0%
_____________________________________________________________________________________Crack All * % * % * % 100.0%
Grades 7-8 * % * % * % 100.0%Grades 9-12 * % * % * % 100.0%
_____________________________________________________________________________________Hallucinogens All * % * % * % 100.0%
Grades 7-8 * % * % * % 100.0%Grades 9-12 * % * % * % 100.0%
_____________________________________________________________________________________Uppers All * % * % * % 100.0%
Grades 7-8 * % * % * % 100.0%Grades 9-12 * % * % * % 100.0%
_____________________________________________________________________________________Downers All * % * % * % 100.0%
Grades 7-8 * % * % * % 100.0%Grades 9-12 * % * % * % 100.0%
_____________________________________________________________________________________Rohypnol All * % * % * % 100.0%
Grades 7-8 * % * % * % 100.0%
Grades 9-12 * % * % * % 100.0%_____________________________________________________________________________________Steroids All * % * % * % 100.0%
Grades 7-8 * % * % * % 100.0%Grades 9-12 * % * % * % 100.0%
_____________________________________________________________________________________Ecstasy All * % * % * % 100.0%
Grades 7-8 * % * % * % 100.0%Grades 9-12 * % * % * % 100.0%
_____________________________________________________________________________________Heroin All * % * % * % 100.0%
Grades 7-8 * % * % * % 100.0%

8/14/2019 CROSBY COUNTY - Ralls ISD - 2001 Texas School Survey of Drug and Alcohol Use
http://slidepdf.com/reader/full/crosby-county-ralls-isd-2001-texas-school-survey-of-drug-and-alcohol-use 44/144
Grades 9-12 * % * % * % 100.0%
8/14/2019 CROSBY COUNTY - Ralls ISD - 2001 Texas School Survey of Drug and Alcohol Use
http://slidepdf.com/reader/full/crosby-county-ralls-isd-2001-texas-school-survey-of-drug-and-alcohol-use 45/144
RallsSpring 2001
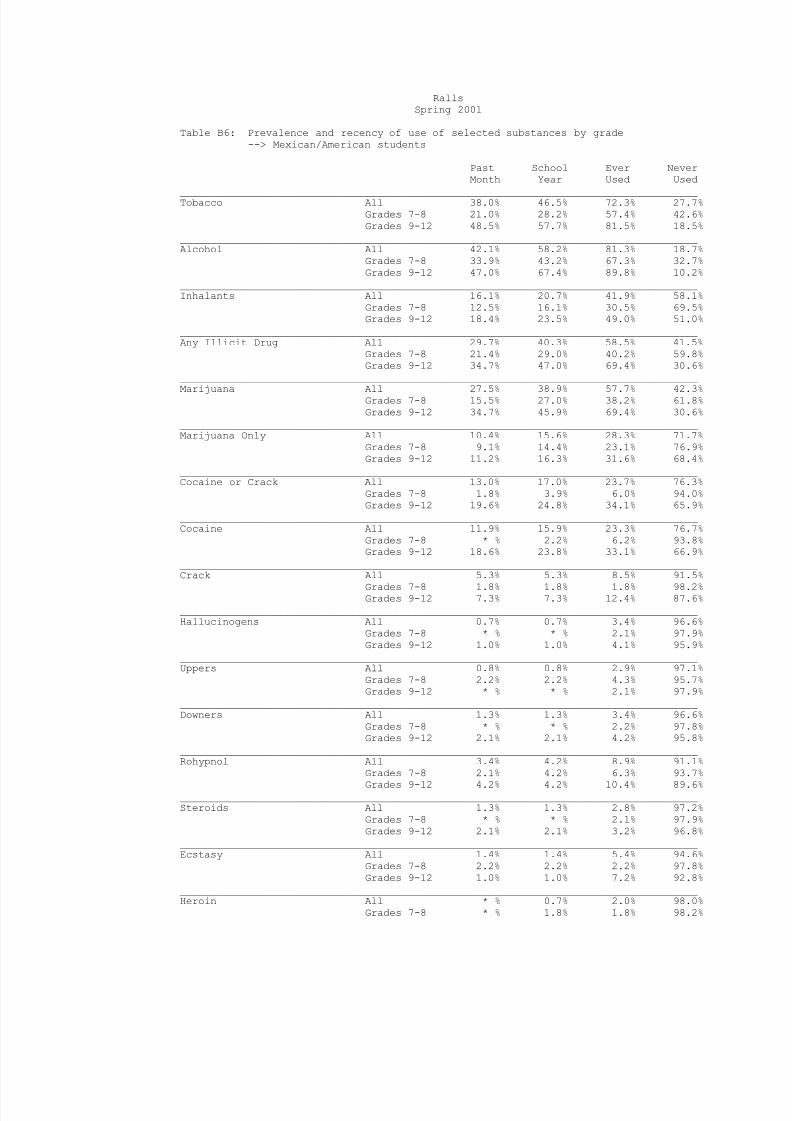
Table B6: Prevalence and recency of use of selected substances by grade--> Mexican/American students
Past School Ever NeverMonth Year Used Used
_____________________________________________________________________________________Tobacco All 38.0% 46.5% 72.3% 27.7%Grades 7-8 21.0% 28.2% 57.4% 42.6%Grades 9-12 48.5% 57.7% 81.5% 18.5%
_____________________________________________________________________________________Alcohol All 42.1% 58.2% 81.3% 18.7%
Grades 7-8 33.9% 43.2% 67.3% 32.7%Grades 9-12 47.0% 67.4% 89.8% 10.2%
_____________________________________________________________________________________Inhalants All 16.1% 20.7% 41.9% 58.1%
Grades 7-8 12.5% 16.1% 30.5% 69.5%Grades 9-12 18.4% 23.5% 49.0% 51.0%
_____________________________________________________________________________________Any Illicit Drug All 29.7% 40.3% 58.5% 41.5%
Grades 7-8 21.4% 29.0% 40.2% 59.8%Grades 9-12 34.7% 47.0% 69.4% 30.6%
_____________________________________________________________________________________
Marijuana All 27.5% 38.9% 57.7% 42.3%Grades 7-8 15.5% 27.0% 38.2% 61.8%Grades 9-12 34.7% 45.9% 69.4% 30.6%
_____________________________________________________________________________________Marijuana Only All 10.4% 15.6% 28.3% 71.7%
Grades 7-8 9.1% 14.4% 23.1% 76.9%Grades 9-12 11.2% 16.3% 31.6% 68.4%
_____________________________________________________________________________________Cocaine or Crack All 13.0% 17.0% 23.7% 76.3%
Grades 7-8 1.8% 3.9% 6.0% 94.0%Grades 9-12 19.6% 24.8% 34.1% 65.9%
_____________________________________________________________________________________Cocaine All 11.9% 15.9% 23.3% 76.7%
Grades 7-8 * % 2.2% 6.2% 93.8%Grades 9-12 18.6% 23.8% 33.1% 66.9%
_____________________________________________________________________________________Crack All 5.3% 5.3% 8.5% 91.5%
Grades 7-8 1.8% 1.8% 1.8% 98.2%Grades 9-12 7.3% 7.3% 12.4% 87.6%
_____________________________________________________________________________________Hallucinogens All 0.7% 0.7% 3.4% 96.6%
Grades 7-8 * % * % 2.1% 97.9%Grades 9-12 1.0% 1.0% 4.1% 95.9%
_____________________________________________________________________________________Uppers All 0.8% 0.8% 2.9% 97.1%
Grades 7-8 2.2% 2.2% 4.3% 95.7%Grades 9-12 * % * % 2.1% 97.9%
_____________________________________________________________________________________Downers All 1.3% 1.3% 3.4% 96.6%
Grades 7-8 * % * % 2.2% 97.8%Grades 9-12 2.1% 2.1% 4.2% 95.8%
_____________________________________________________________________________________Rohypnol All 3.4% 4.2% 8.9% 91.1%
Grades 7-8 2.1% 4.2% 6.3% 93.7%
Grades 9-12 4.2% 4.2% 10.4% 89.6%_____________________________________________________________________________________Steroids All 1.3% 1.3% 2.8% 97.2%
Grades 7-8 * % * % 2.1% 97.9%Grades 9-12 2.1% 2.1% 3.2% 96.8%
_____________________________________________________________________________________Ecstasy All 1.4% 1.4% 5.4% 94.6%
Grades 7-8 2.2% 2.2% 2.2% 97.8%Grades 9-12 1.0% 1.0% 7.2% 92.8%
_____________________________________________________________________________________Heroin All * % 0.7% 2.0% 98.0%
Grades 7-8 * % 1.8% 1.8% 98.2%
8/14/2019 CROSBY COUNTY - Ralls ISD - 2001 Texas School Survey of Drug and Alcohol Use
http://slidepdf.com/reader/full/crosby-county-ralls-isd-2001-texas-school-survey-of-drug-and-alcohol-use 46/144
Grades 9-12 * % * % 2.1% 97.9%
8/14/2019 CROSBY COUNTY - Ralls ISD - 2001 Texas School Survey of Drug and Alcohol Use
http://slidepdf.com/reader/full/crosby-county-ralls-isd-2001-texas-school-survey-of-drug-and-alcohol-use 47/144
RallsSpring 2001
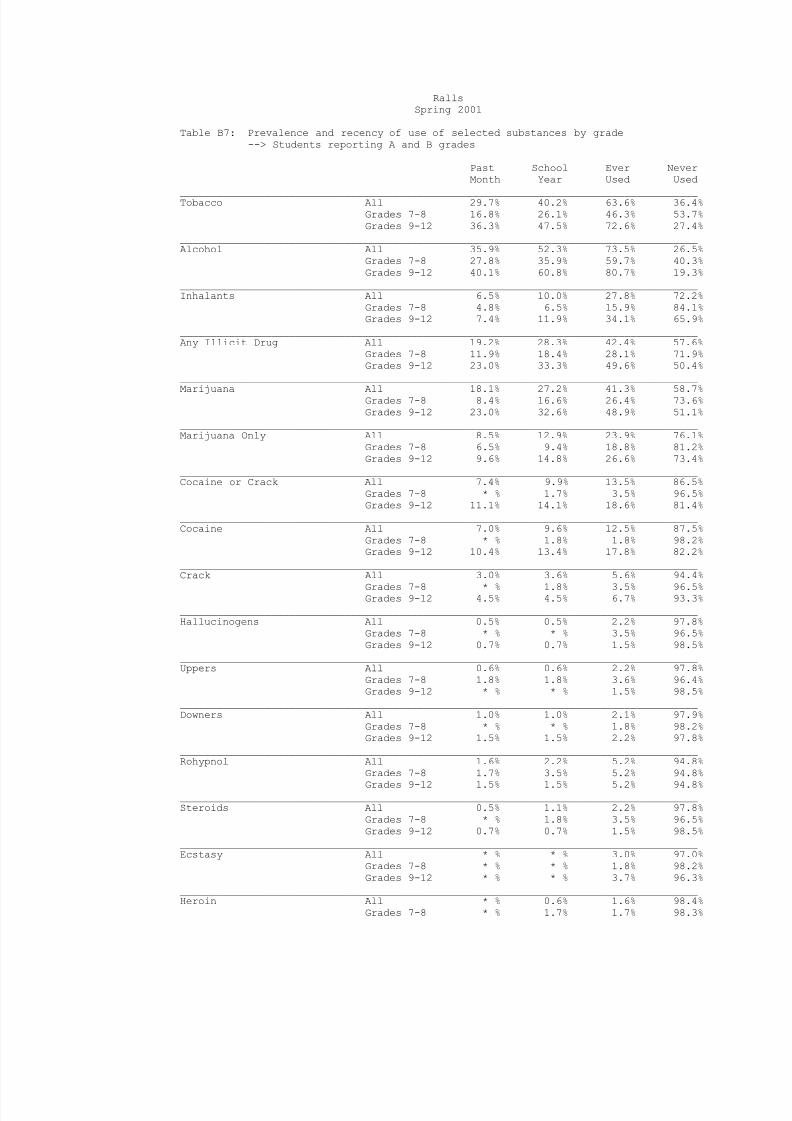
Table B7: Prevalence and recency of use of selected substances by grade--> Students reporting A and B grades
Past School Ever NeverMonth Year Used Used
_____________________________________________________________________________________Tobacco All 29.7% 40.2% 63.6% 36.4%Grades 7-8 16.8% 26.1% 46.3% 53.7%Grades 9-12 36.3% 47.5% 72.6% 27.4%
_____________________________________________________________________________________Alcohol All 35.9% 52.3% 73.5% 26.5%
Grades 7-8 27.8% 35.9% 59.7% 40.3%Grades 9-12 40.1% 60.8% 80.7% 19.3%
_____________________________________________________________________________________Inhalants All 6.5% 10.0% 27.8% 72.2%
Grades 7-8 4.8% 6.5% 15.9% 84.1%Grades 9-12 7.4% 11.9% 34.1% 65.9%
_____________________________________________________________________________________Any Illicit Drug All 19.2% 28.3% 42.4% 57.6%
Grades 7-8 11.9% 18.4% 28.1% 71.9%Grades 9-12 23.0% 33.3% 49.6% 50.4%
_____________________________________________________________________________________
Marijuana All 18.1% 27.2% 41.3% 58.7%Grades 7-8 8.4% 16.6% 26.4% 73.6%Grades 9-12 23.0% 32.6% 48.9% 51.1%
_____________________________________________________________________________________Marijuana Only All 8.5% 12.9% 23.9% 76.1%
Grades 7-8 6.5% 9.4% 18.8% 81.2%Grades 9-12 9.6% 14.8% 26.6% 73.4%
_____________________________________________________________________________________Cocaine or Crack All 7.4% 9.9% 13.5% 86.5%
Grades 7-8 * % 1.7% 3.5% 96.5%Grades 9-12 11.1% 14.1% 18.6% 81.4%
_____________________________________________________________________________________Cocaine All 7.0% 9.6% 12.5% 87.5%
Grades 7-8 * % 1.8% 1.8% 98.2%Grades 9-12 10.4% 13.4% 17.8% 82.2%
_____________________________________________________________________________________Crack All 3.0% 3.6% 5.6% 94.4%
Grades 7-8 * % 1.8% 3.5% 96.5%Grades 9-12 4.5% 4.5% 6.7% 93.3%
_____________________________________________________________________________________Hallucinogens All 0.5% 0.5% 2.2% 97.8%
Grades 7-8 * % * % 3.5% 96.5%Grades 9-12 0.7% 0.7% 1.5% 98.5%
_____________________________________________________________________________________Uppers All 0.6% 0.6% 2.2% 97.8%
Grades 7-8 1.8% 1.8% 3.6% 96.4%Grades 9-12 * % * % 1.5% 98.5%
_____________________________________________________________________________________Downers All 1.0% 1.0% 2.1% 97.9%
Grades 7-8 * % * % 1.8% 98.2%Grades 9-12 1.5% 1.5% 2.2% 97.8%
_____________________________________________________________________________________Rohypnol All 1.6% 2.2% 5.2% 94.8%
Grades 7-8 1.7% 3.5% 5.2% 94.8%
Grades 9-12 1.5% 1.5% 5.2% 94.8%_____________________________________________________________________________________Steroids All 0.5% 1.1% 2.2% 97.8%
Grades 7-8 * % 1.8% 3.5% 96.5%Grades 9-12 0.7% 0.7% 1.5% 98.5%
_____________________________________________________________________________________Ecstasy All * % * % 3.0% 97.0%
Grades 7-8 * % * % 1.8% 98.2%Grades 9-12 * % * % 3.7% 96.3%
_____________________________________________________________________________________Heroin All * % 0.6% 1.6% 98.4%
Grades 7-8 * % 1.7% 1.7% 98.3%

8/14/2019 CROSBY COUNTY - Ralls ISD - 2001 Texas School Survey of Drug and Alcohol Use
http://slidepdf.com/reader/full/crosby-county-ralls-isd-2001-texas-school-survey-of-drug-and-alcohol-use 48/144
Grades 9-12 * % * % 1.5% 98.5%

8/14/2019 CROSBY COUNTY - Ralls ISD - 2001 Texas School Survey of Drug and Alcohol Use
http://slidepdf.com/reader/full/crosby-county-ralls-isd-2001-texas-school-survey-of-drug-and-alcohol-use 49/144
RallsSpring 2001
Table B8: Prevalence and recency of use of selected substances by grade--> Students reporting C, D, and F grades
Past School Ever NeverMonth Year Used Used
_____________________________________________________________________________________Tobacco All 36.2% 42.9% 68.9% 31.1%Grades 7-8 20.6% 20.6% 52.5% 47.5%Grades 9-12 49.9% 62.4% 83.3% 16.7%
_____________________________________________________________________________________Alcohol All 38.9% 54.6% 76.5% 23.5%
Grades 7-8 31.2% 41.1% 68.8% 31.2%Grades 9-12 45.7% 66.5% 83.3% 16.7%
_____________________________________________________________________________________Inhalants All 31.6% 36.0% 49.7% 50.3%
Grades 7-8 29.7% 34.4% 49.3% 50.7%Grades 9-12 33.4% 37.5% 50.1% 49.9%
_____________________________________________________________________________________Any Illicit Drug All 34.4% 43.3% 57.2% 42.8%
Grades 7-8 26.2% 26.2% 36.9% 63.1%Grades 9-12 41.5% 58.2% 74.9% 25.1%
_____________________________________________________________________________________
Marijuana All 32.0% 43.3% 57.2% 42.8%Grades 7-8 21.3% 26.2% 36.9% 63.1%Grades 9-12 41.5% 58.2% 74.9% 25.1%
_____________________________________________________________________________________Marijuana Only All 6.6% 10.9% 15.4% 84.6%
Grades 7-8 4.7% 4.7% 9.4% 90.6%Grades 9-12 8.3% 16.6% 20.8% 79.2%
_____________________________________________________________________________________Cocaine or Crack All 16.0% 25.5% 37.3% 62.7%
Grades 7-8 5.2% 11.2% 17.2% 82.8%Grades 9-12 24.9% 37.4% 54.1% 45.9%
_____________________________________________________________________________________Cocaine All 13.6% 23.1% 37.3% 62.7%
Grades 7-8 * % 6.0% 17.2% 82.8%Grades 9-12 24.9% 37.4% 54.1% 45.9%
_____________________________________________________________________________________Crack All 4.8% 7.1% 11.7% 88.3%
Grades 7-8 5.5% 5.5% 5.5% 94.5%Grades 9-12 4.2% 8.3% 16.6% 83.4%
_____________________________________________________________________________________Hallucinogens All 2.3% 2.3% 7.0% 93.0%
Grades 7-8 * % * % * % 100.0%Grades 9-12 4.2% 4.2% 12.5% 87.5%
_____________________________________________________________________________________Uppers All * % * % 2.3% 97.7%
Grades 7-8 * % * % * % 100.0%Grades 9-12 * % * % 4.1% 95.9%
_____________________________________________________________________________________Downers All * % * % 2.3% 97.7%
Grades 7-8 * % * % * % 100.0%Grades 9-12 * % * % 4.1% 95.9%
_____________________________________________________________________________________Rohypnol All 4.7% 4.7% 9.3% 90.7%
Grades 7-8 * % * % * % 100.0%
Grades 9-12 8.4% 8.4% 16.6% 83.4%_____________________________________________________________________________________Steroids All 2.3% 2.3% 2.3% 97.7%
Grades 7-8 * % * % * % 100.0%Grades 9-12 4.2% 4.2% 4.2% 95.8%
_____________________________________________________________________________________Ecstasy All 5.1% 7.5% 12.1% 87.9%
Grades 7-8 6.3% 6.3% 6.3% 93.7%Grades 9-12 4.2% 8.4% 16.7% 83.3%
_____________________________________________________________________________________Heroin All * % 2.4% 4.6% 95.4%
Grades 7-8 * % 5.2% 5.2% 94.8%

8/14/2019 CROSBY COUNTY - Ralls ISD - 2001 Texas School Survey of Drug and Alcohol Use
http://slidepdf.com/reader/full/crosby-county-ralls-isd-2001-texas-school-survey-of-drug-and-alcohol-use 50/144
Grades 9-12 * % * % 4.1% 95.9%
8/14/2019 CROSBY COUNTY - Ralls ISD - 2001 Texas School Survey of Drug and Alcohol Use
http://slidepdf.com/reader/full/crosby-county-ralls-isd-2001-texas-school-survey-of-drug-and-alcohol-use 51/144
RallsSpring 2001
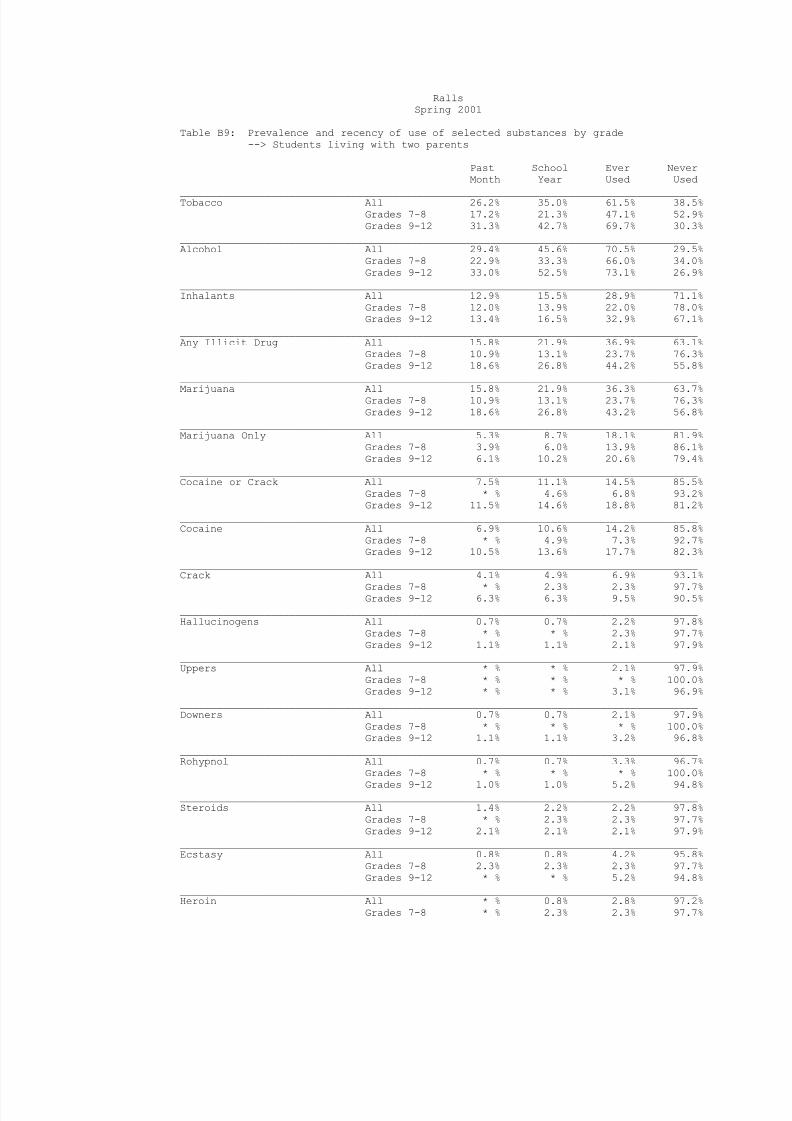
Table B9: Prevalence and recency of use of selected substances by grade--> Students living with two parents
Past School Ever NeverMonth Year Used Used
_____________________________________________________________________________________Tobacco All 26.2% 35.0% 61.5% 38.5%Grades 7-8 17.2% 21.3% 47.1% 52.9%Grades 9-12 31.3% 42.7% 69.7% 30.3%
_____________________________________________________________________________________Alcohol All 29.4% 45.6% 70.5% 29.5%
Grades 7-8 22.9% 33.3% 66.0% 34.0%Grades 9-12 33.0% 52.5% 73.1% 26.9%
_____________________________________________________________________________________Inhalants All 12.9% 15.5% 28.9% 71.1%
Grades 7-8 12.0% 13.9% 22.0% 78.0%Grades 9-12 13.4% 16.5% 32.9% 67.1%
_____________________________________________________________________________________Any Illicit Drug All 15.8% 21.9% 36.9% 63.1%
Grades 7-8 10.9% 13.1% 23.7% 76.3%Grades 9-12 18.6% 26.8% 44.2% 55.8%
_____________________________________________________________________________________
Marijuana All 15.8% 21.9% 36.3% 63.7%Grades 7-8 10.9% 13.1% 23.7% 76.3%Grades 9-12 18.6% 26.8% 43.2% 56.8%
_____________________________________________________________________________________Marijuana Only All 5.3% 8.7% 18.1% 81.9%
Grades 7-8 3.9% 6.0% 13.9% 86.1%Grades 9-12 6.1% 10.2% 20.6% 79.4%
_____________________________________________________________________________________Cocaine or Crack All 7.5% 11.1% 14.5% 85.5%
Grades 7-8 * % 4.6% 6.8% 93.2%Grades 9-12 11.5% 14.6% 18.8% 81.2%
_____________________________________________________________________________________Cocaine All 6.9% 10.6% 14.2% 85.8%
Grades 7-8 * % 4.9% 7.3% 92.7%Grades 9-12 10.5% 13.6% 17.7% 82.3%
_____________________________________________________________________________________Crack All 4.1% 4.9% 6.9% 93.1%
Grades 7-8 * % 2.3% 2.3% 97.7%Grades 9-12 6.3% 6.3% 9.5% 90.5%
_____________________________________________________________________________________Hallucinogens All 0.7% 0.7% 2.2% 97.8%
Grades 7-8 * % * % 2.3% 97.7%Grades 9-12 1.1% 1.1% 2.1% 97.9%
_____________________________________________________________________________________Uppers All * % * % 2.1% 97.9%
Grades 7-8 * % * % * % 100.0%Grades 9-12 * % * % 3.1% 96.9%
_____________________________________________________________________________________Downers All 0.7% 0.7% 2.1% 97.9%
Grades 7-8 * % * % * % 100.0%Grades 9-12 1.1% 1.1% 3.2% 96.8%
_____________________________________________________________________________________Rohypnol All 0.7% 0.7% 3.3% 96.7%
Grades 7-8 * % * % * % 100.0%
Grades 9-12 1.0% 1.0% 5.2% 94.8%_____________________________________________________________________________________Steroids All 1.4% 2.2% 2.2% 97.8%
Grades 7-8 * % 2.3% 2.3% 97.7%Grades 9-12 2.1% 2.1% 2.1% 97.9%
_____________________________________________________________________________________Ecstasy All 0.8% 0.8% 4.2% 95.8%
Grades 7-8 2.3% 2.3% 2.3% 97.7%Grades 9-12 * % * % 5.2% 94.8%
_____________________________________________________________________________________Heroin All * % 0.8% 2.8% 97.2%
Grades 7-8 * % 2.3% 2.3% 97.7%

8/14/2019 CROSBY COUNTY - Ralls ISD - 2001 Texas School Survey of Drug and Alcohol Use
http://slidepdf.com/reader/full/crosby-county-ralls-isd-2001-texas-school-survey-of-drug-and-alcohol-use 52/144
Grades 9-12 * % * % 3.1% 96.9%

8/14/2019 CROSBY COUNTY - Ralls ISD - 2001 Texas School Survey of Drug and Alcohol Use
http://slidepdf.com/reader/full/crosby-county-ralls-isd-2001-texas-school-survey-of-drug-and-alcohol-use 53/144
RallsSpring 2001
Table B10: Prevalence and recency of use of selected substances by grade--> Students not living with two parents
Past School Ever NeverMonth Year Used Used
_____________________________________________________________________________________Tobacco All 37.6% 48.9% 68.5% 31.5%Grades 7-8 21.0% 32.4% 50.2% 49.8%Grades 9-12 47.6% 58.7% 79.4% 20.6%
_____________________________________________________________________________________Alcohol All 46.3% 63.5% 79.9% 20.1%
Grades 7-8 36.0% 44.7% 56.9% 43.1%Grades 9-12 52.5% 74.7% 93.7% 6.3%
_____________________________________________________________________________________Inhalants All 8.1% 13.3% 36.7% 63.3%
Grades 7-8 8.3% 11.5% 28.8% 71.2%Grades 9-12 7.9% 14.3% 41.3% 58.7%
_____________________________________________________________________________________Any Illicit Drug All 30.6% 44.1% 58.3% 41.7%
Grades 7-8 21.0% 32.8% 41.5% 58.5%Grades 9-12 36.4% 50.8% 68.3% 31.7%
_____________________________________________________________________________________
Marijuana All 27.2% 41.9% 57.1% 42.9%Grades 7-8 11.9% 29.7% 38.3% 61.7%Grades 9-12 36.4% 49.2% 68.3% 31.7%
_____________________________________________________________________________________Marijuana Only All 12.3% 18.4% 30.6% 69.4%
Grades 7-8 9.1% 14.6% 23.3% 76.7%Grades 9-12 14.3% 20.6% 34.9% 65.1%
_____________________________________________________________________________________Cocaine or Crack All 10.9% 14.9% 22.1% 77.9%
Grades 7-8 2.8% 2.8% 5.9% 94.1%Grades 9-12 15.8% 22.2% 31.8% 68.2%
_____________________________________________________________________________________Cocaine All 9.9% 13.9% 21.0% 79.0%
Grades 7-8 * % * % 2.8% 97.2%Grades 9-12 15.8% 22.2% 31.8% 68.2%
_____________________________________________________________________________________Crack All 2.1% 3.1% 6.3% 93.7%
Grades 7-8 2.9% 2.9% 6.3% 93.7%Grades 9-12 1.6% 3.1% 6.3% 93.7%
_____________________________________________________________________________________Hallucinogens All 1.0% 1.0% 4.2% 95.8%
Grades 7-8 * % * % 3.3% 96.7%Grades 9-12 1.6% 1.6% 4.8% 95.2%
_____________________________________________________________________________________Uppers All 1.2% 1.2% 2.4% 97.6%
Grades 7-8 3.2% 3.2% 6.3% 93.7%Grades 9-12 * % * % * % 100.0%
_____________________________________________________________________________________Downers All 1.0% 1.0% 2.2% 97.8%
Grades 7-8 * % * % 3.3% 96.7%Grades 9-12 1.6% 1.6% 1.6% 98.4%
_____________________________________________________________________________________Rohypnol All 4.3% 5.5% 9.7% 90.3%
Grades 7-8 3.3% 6.5% 9.8% 90.2%
Grades 9-12 4.9% 4.9% 9.7% 90.3%_____________________________________________________________________________________Steroids All * % * % 2.2% 97.8%
Grades 7-8 * % * % 3.2% 96.8%Grades 9-12 * % * % 1.6% 98.4%
_____________________________________________________________________________________Ecstasy All 1.0% 2.0% 5.2% 94.8%
Grades 7-8 * % * % 3.3% 96.7%Grades 9-12 1.6% 3.2% 6.3% 93.7%
_____________________________________________________________________________________Heroin All * % 1.0% 1.0% 99.0%
Grades 7-8 * % 2.8% 2.8% 97.2%

8/14/2019 CROSBY COUNTY - Ralls ISD - 2001 Texas School Survey of Drug and Alcohol Use
http://slidepdf.com/reader/full/crosby-county-ralls-isd-2001-texas-school-survey-of-drug-and-alcohol-use 54/144
Grades 9-12 * % * % * % 100.0%
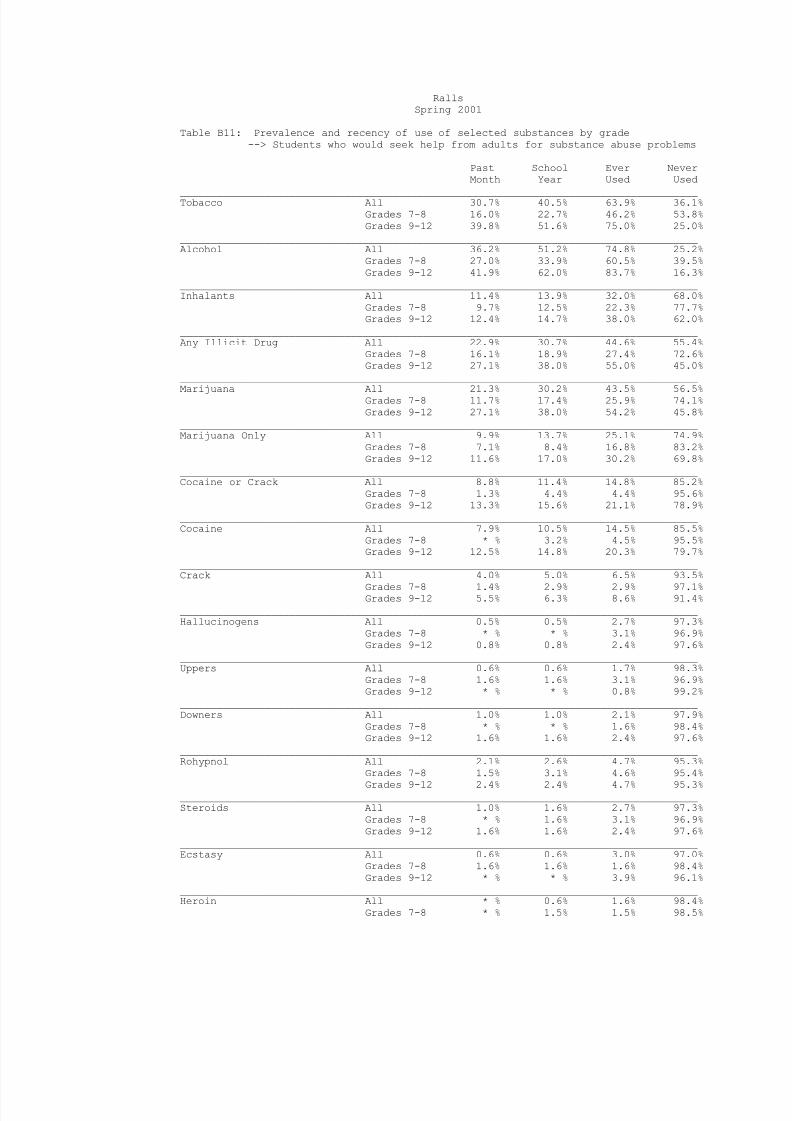
8/14/2019 CROSBY COUNTY - Ralls ISD - 2001 Texas School Survey of Drug and Alcohol Use
http://slidepdf.com/reader/full/crosby-county-ralls-isd-2001-texas-school-survey-of-drug-and-alcohol-use 55/144
RallsSpring 2001
Table B11: Prevalence and recency of use of selected substances by grade--> Students who would seek help from adults for substance abuse problems
Past School Ever NeverMonth Year Used Used
_____________________________________________________________________________________Tobacco All 30.7% 40.5% 63.9% 36.1%Grades 7-8 16.0% 22.7% 46.2% 53.8%Grades 9-12 39.8% 51.6% 75.0% 25.0%
_____________________________________________________________________________________Alcohol All 36.2% 51.2% 74.8% 25.2%
Grades 7-8 27.0% 33.9% 60.5% 39.5%Grades 9-12 41.9% 62.0% 83.7% 16.3%
_____________________________________________________________________________________Inhalants All 11.4% 13.9% 32.0% 68.0%
Grades 7-8 9.7% 12.5% 22.3% 77.7%Grades 9-12 12.4% 14.7% 38.0% 62.0%
_____________________________________________________________________________________Any Illicit Drug All 22.9% 30.7% 44.6% 55.4%
Grades 7-8 16.1% 18.9% 27.4% 72.6%Grades 9-12 27.1% 38.0% 55.0% 45.0%
_____________________________________________________________________________________
Marijuana All 21.3% 30.2% 43.5% 56.5%Grades 7-8 11.7% 17.4% 25.9% 74.1%Grades 9-12 27.1% 38.0% 54.2% 45.8%
_____________________________________________________________________________________Marijuana Only All 9.9% 13.7% 25.1% 74.9%
Grades 7-8 7.1% 8.4% 16.8% 83.2%Grades 9-12 11.6% 17.0% 30.2% 69.8%
_____________________________________________________________________________________Cocaine or Crack All 8.8% 11.4% 14.8% 85.2%
Grades 7-8 1.3% 4.4% 4.4% 95.6%Grades 9-12 13.3% 15.6% 21.1% 78.9%
_____________________________________________________________________________________Cocaine All 7.9% 10.5% 14.5% 85.5%
Grades 7-8 * % 3.2% 4.5% 95.5%Grades 9-12 12.5% 14.8% 20.3% 79.7%
_____________________________________________________________________________________Crack All 4.0% 5.0% 6.5% 93.5%
Grades 7-8 1.4% 2.9% 2.9% 97.1%Grades 9-12 5.5% 6.3% 8.6% 91.4%
_____________________________________________________________________________________Hallucinogens All 0.5% 0.5% 2.7% 97.3%
Grades 7-8 * % * % 3.1% 96.9%Grades 9-12 0.8% 0.8% 2.4% 97.6%
_____________________________________________________________________________________Uppers All 0.6% 0.6% 1.7% 98.3%
Grades 7-8 1.6% 1.6% 3.1% 96.9%Grades 9-12 * % * % 0.8% 99.2%
_____________________________________________________________________________________Downers All 1.0% 1.0% 2.1% 97.9%
Grades 7-8 * % * % 1.6% 98.4%Grades 9-12 1.6% 1.6% 2.4% 97.6%
_____________________________________________________________________________________Rohypnol All 2.1% 2.6% 4.7% 95.3%
Grades 7-8 1.5% 3.1% 4.6% 95.4%
Grades 9-12 2.4% 2.4% 4.7% 95.3%_____________________________________________________________________________________Steroids All 1.0% 1.6% 2.7% 97.3%
Grades 7-8 * % 1.6% 3.1% 96.9%Grades 9-12 1.6% 1.6% 2.4% 97.6%
_____________________________________________________________________________________Ecstasy All 0.6% 0.6% 3.0% 97.0%
Grades 7-8 1.6% 1.6% 1.6% 98.4%Grades 9-12 * % * % 3.9% 96.1%
_____________________________________________________________________________________Heroin All * % 0.6% 1.6% 98.4%
Grades 7-8 * % 1.5% 1.5% 98.5%

8/14/2019 CROSBY COUNTY - Ralls ISD - 2001 Texas School Survey of Drug and Alcohol Use
http://slidepdf.com/reader/full/crosby-county-ralls-isd-2001-texas-school-survey-of-drug-and-alcohol-use 56/144
Grades 9-12 * % * % 1.6% 98.4%
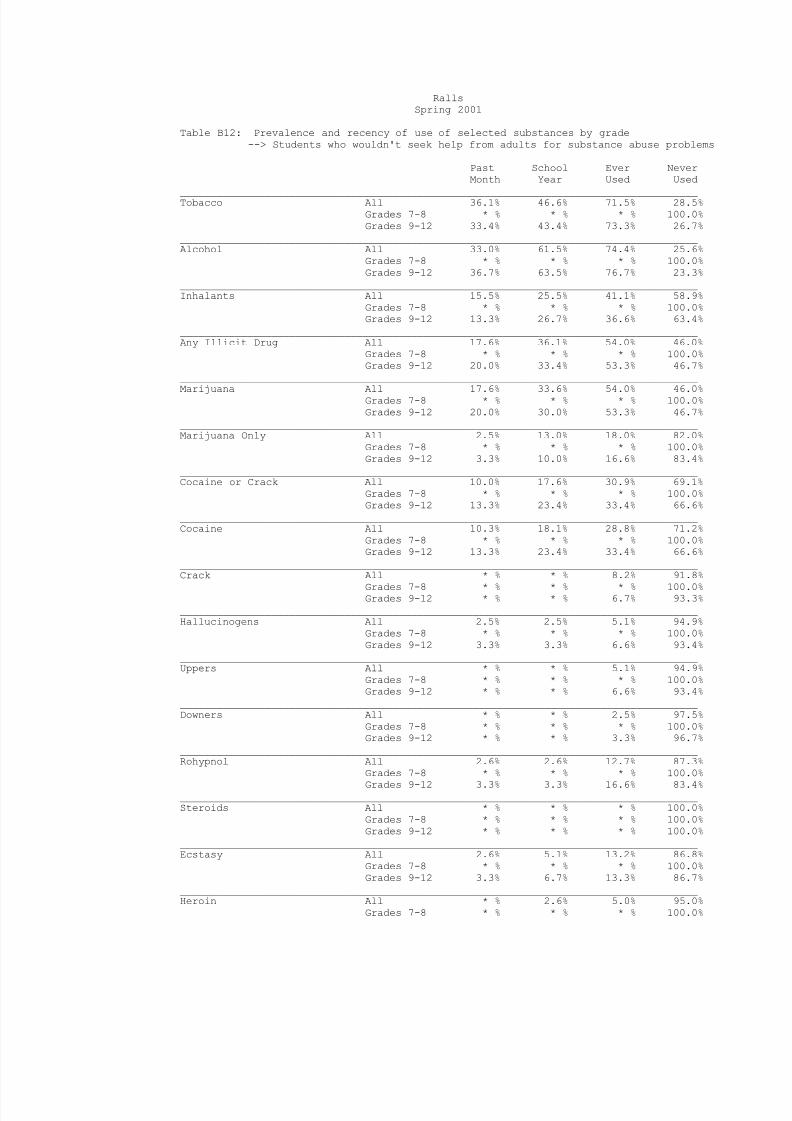
8/14/2019 CROSBY COUNTY - Ralls ISD - 2001 Texas School Survey of Drug and Alcohol Use
http://slidepdf.com/reader/full/crosby-county-ralls-isd-2001-texas-school-survey-of-drug-and-alcohol-use 57/144
RallsSpring 2001
Table B12: Prevalence and recency of use of selected substances by grade--> Students who wouldn't seek help from adults for substance abuse problems
Past School Ever NeverMonth Year Used Used
_____________________________________________________________________________________Tobacco All 36.1% 46.6% 71.5% 28.5%Grades 7-8 * % * % * % 100.0%Grades 9-12 33.4% 43.4% 73.3% 26.7%
_____________________________________________________________________________________Alcohol All 33.0% 61.5% 74.4% 25.6%
Grades 7-8 * % * % * % 100.0%Grades 9-12 36.7% 63.5% 76.7% 23.3%
_____________________________________________________________________________________Inhalants All 15.5% 25.5% 41.1% 58.9%
Grades 7-8 * % * % * % 100.0%Grades 9-12 13.3% 26.7% 36.6% 63.4%
_____________________________________________________________________________________Any Illicit Drug All 17.6% 36.1% 54.0% 46.0%
Grades 7-8 * % * % * % 100.0%Grades 9-12 20.0% 33.4% 53.3% 46.7%
_____________________________________________________________________________________
Marijuana All 17.6% 33.6% 54.0% 46.0%Grades 7-8 * % * % * % 100.0%Grades 9-12 20.0% 30.0% 53.3% 46.7%
_____________________________________________________________________________________Marijuana Only All 2.5% 13.0% 18.0% 82.0%
Grades 7-8 * % * % * % 100.0%Grades 9-12 3.3% 10.0% 16.6% 83.4%
_____________________________________________________________________________________Cocaine or Crack All 10.0% 17.6% 30.9% 69.1%
Grades 7-8 * % * % * % 100.0%Grades 9-12 13.3% 23.4% 33.4% 66.6%
_____________________________________________________________________________________Cocaine All 10.3% 18.1% 28.8% 71.2%
Grades 7-8 * % * % * % 100.0%Grades 9-12 13.3% 23.4% 33.4% 66.6%
_____________________________________________________________________________________Crack All * % * % 8.2% 91.8%
Grades 7-8 * % * % * % 100.0%Grades 9-12 * % * % 6.7% 93.3%
_____________________________________________________________________________________Hallucinogens All 2.5% 2.5% 5.1% 94.9%
Grades 7-8 * % * % * % 100.0%Grades 9-12 3.3% 3.3% 6.6% 93.4%
_____________________________________________________________________________________Uppers All * % * % 5.1% 94.9%
Grades 7-8 * % * % * % 100.0%Grades 9-12 * % * % 6.6% 93.4%
_____________________________________________________________________________________Downers All * % * % 2.5% 97.5%
Grades 7-8 * % * % * % 100.0%Grades 9-12 * % * % 3.3% 96.7%
_____________________________________________________________________________________Rohypnol All 2.6% 2.6% 12.7% 87.3%
Grades 7-8 * % * % * % 100.0%
Grades 9-12 3.3% 3.3% 16.6% 83.4%_____________________________________________________________________________________Steroids All * % * % * % 100.0%
Grades 7-8 * % * % * % 100.0%Grades 9-12 * % * % * % 100.0%
_____________________________________________________________________________________Ecstasy All 2.6% 5.1% 13.2% 86.8%
Grades 7-8 * % * % * % 100.0%Grades 9-12 3.3% 6.7% 13.3% 86.7%
_____________________________________________________________________________________Heroin All * % 2.6% 5.0% 95.0%
Grades 7-8 * % * % * % 100.0%

8/14/2019 CROSBY COUNTY - Ralls ISD - 2001 Texas School Survey of Drug and Alcohol Use
http://slidepdf.com/reader/full/crosby-county-ralls-isd-2001-texas-school-survey-of-drug-and-alcohol-use 58/144
Grades 9-12 * % * % 3.3% 96.7%
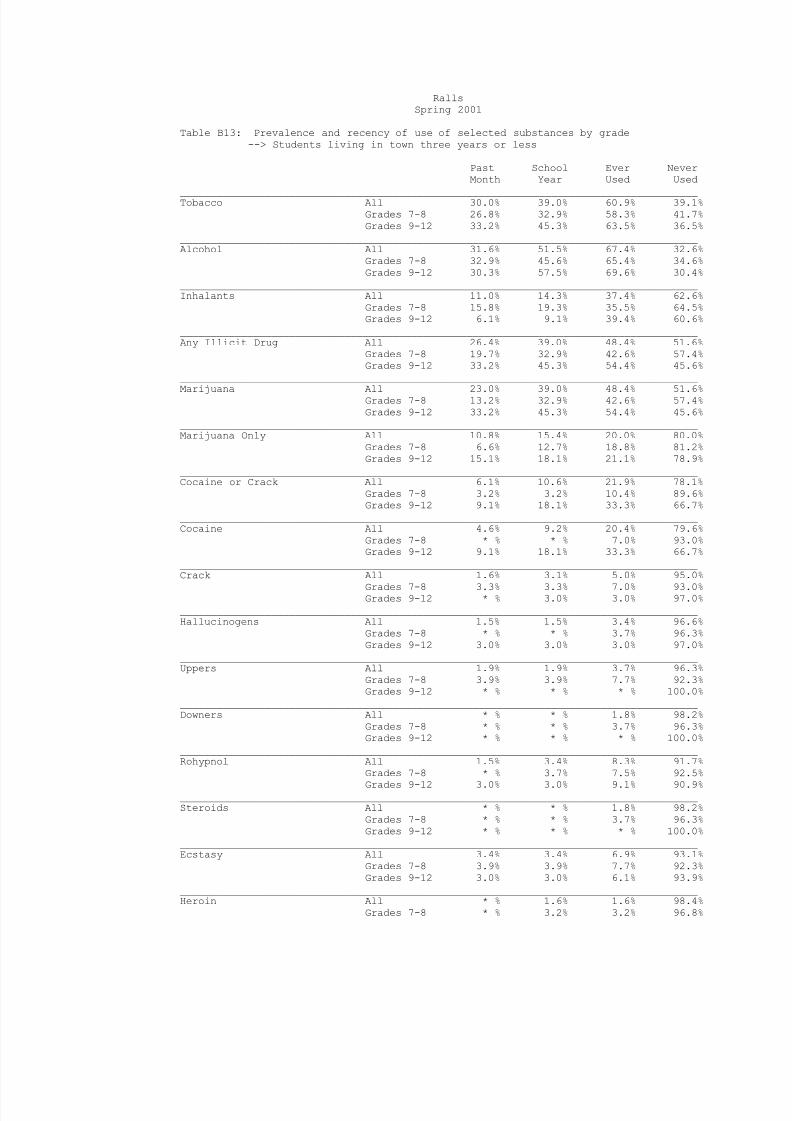
8/14/2019 CROSBY COUNTY - Ralls ISD - 2001 Texas School Survey of Drug and Alcohol Use
http://slidepdf.com/reader/full/crosby-county-ralls-isd-2001-texas-school-survey-of-drug-and-alcohol-use 59/144
RallsSpring 2001
Table B13: Prevalence and recency of use of selected substances by grade--> Students living in town three years or less
Past School Ever NeverMonth Year Used Used
_____________________________________________________________________________________Tobacco All 30.0% 39.0% 60.9% 39.1%Grades 7-8 26.8% 32.9% 58.3% 41.7%Grades 9-12 33.2% 45.3% 63.5% 36.5%
_____________________________________________________________________________________Alcohol All 31.6% 51.5% 67.4% 32.6%
Grades 7-8 32.9% 45.6% 65.4% 34.6%Grades 9-12 30.3% 57.5% 69.6% 30.4%
_____________________________________________________________________________________Inhalants All 11.0% 14.3% 37.4% 62.6%
Grades 7-8 15.8% 19.3% 35.5% 64.5%Grades 9-12 6.1% 9.1% 39.4% 60.6%
_____________________________________________________________________________________Any Illicit Drug All 26.4% 39.0% 48.4% 51.6%
Grades 7-8 19.7% 32.9% 42.6% 57.4%Grades 9-12 33.2% 45.3% 54.4% 45.6%
_____________________________________________________________________________________
Marijuana All 23.0% 39.0% 48.4% 51.6%Grades 7-8 13.2% 32.9% 42.6% 57.4%Grades 9-12 33.2% 45.3% 54.4% 45.6%
_____________________________________________________________________________________Marijuana Only All 10.8% 15.4% 20.0% 80.0%
Grades 7-8 6.6% 12.7% 18.8% 81.2%Grades 9-12 15.1% 18.1% 21.1% 78.9%
_____________________________________________________________________________________Cocaine or Crack All 6.1% 10.6% 21.9% 78.1%
Grades 7-8 3.2% 3.2% 10.4% 89.6%Grades 9-12 9.1% 18.1% 33.3% 66.7%
_____________________________________________________________________________________Cocaine All 4.6% 9.2% 20.4% 79.6%
Grades 7-8 * % * % 7.0% 93.0%Grades 9-12 9.1% 18.1% 33.3% 66.7%
_____________________________________________________________________________________Crack All 1.6% 3.1% 5.0% 95.0%
Grades 7-8 3.3% 3.3% 7.0% 93.0%Grades 9-12 * % 3.0% 3.0% 97.0%
_____________________________________________________________________________________Hallucinogens All 1.5% 1.5% 3.4% 96.6%
Grades 7-8 * % * % 3.7% 96.3%Grades 9-12 3.0% 3.0% 3.0% 97.0%
_____________________________________________________________________________________Uppers All 1.9% 1.9% 3.7% 96.3%
Grades 7-8 3.9% 3.9% 7.7% 92.3%Grades 9-12 * % * % * % 100.0%
_____________________________________________________________________________________Downers All * % * % 1.8% 98.2%
Grades 7-8 * % * % 3.7% 96.3%Grades 9-12 * % * % * % 100.0%
_____________________________________________________________________________________Rohypnol All 1.5% 3.4% 8.3% 91.7%
Grades 7-8 * % 3.7% 7.5% 92.5%
Grades 9-12 3.0% 3.0% 9.1% 90.9%_____________________________________________________________________________________Steroids All * % * % 1.8% 98.2%
Grades 7-8 * % * % 3.7% 96.3%Grades 9-12 * % * % * % 100.0%
_____________________________________________________________________________________Ecstasy All 3.4% 3.4% 6.9% 93.1%
Grades 7-8 3.9% 3.9% 7.7% 92.3%Grades 9-12 3.0% 3.0% 6.1% 93.9%
_____________________________________________________________________________________Heroin All * % 1.6% 1.6% 98.4%
Grades 7-8 * % 3.2% 3.2% 96.8%
8/14/2019 CROSBY COUNTY - Ralls ISD - 2001 Texas School Survey of Drug and Alcohol Use
http://slidepdf.com/reader/full/crosby-county-ralls-isd-2001-texas-school-survey-of-drug-and-alcohol-use 60/144
Grades 9-12 * % * % * % 100.0%
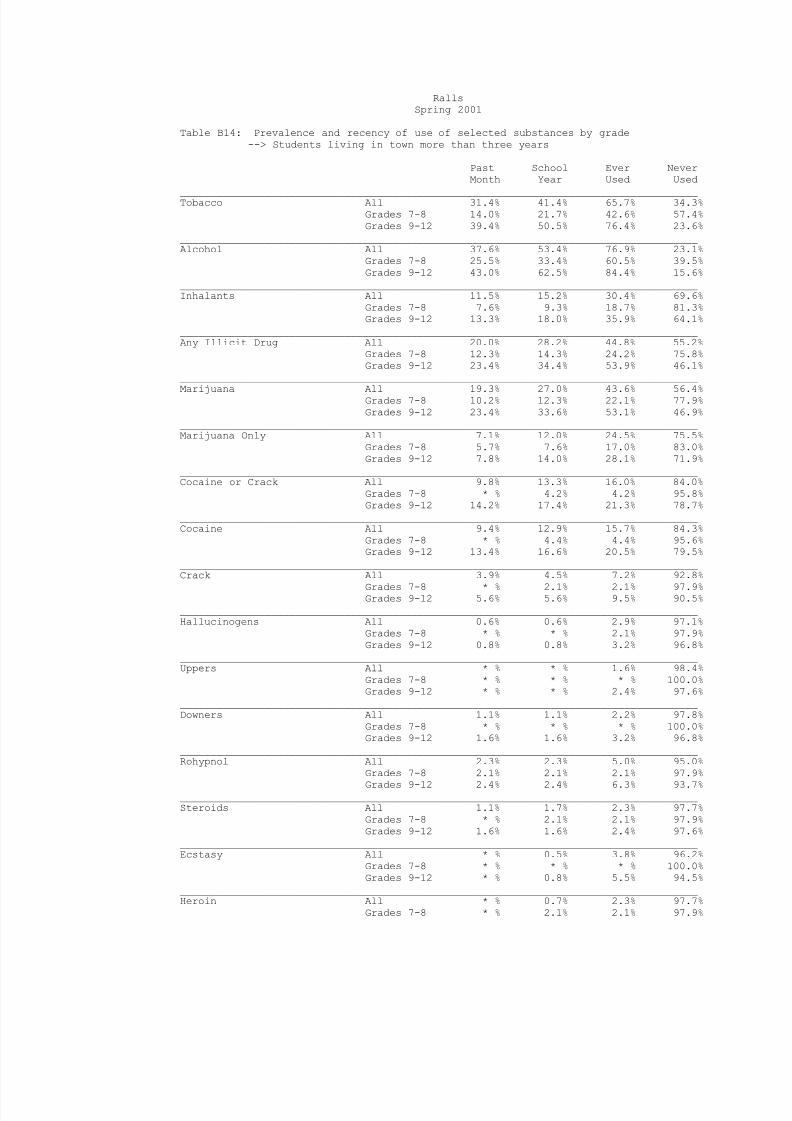
8/14/2019 CROSBY COUNTY - Ralls ISD - 2001 Texas School Survey of Drug and Alcohol Use
http://slidepdf.com/reader/full/crosby-county-ralls-isd-2001-texas-school-survey-of-drug-and-alcohol-use 61/144
RallsSpring 2001
Table B14: Prevalence and recency of use of selected substances by grade--> Students living in town more than three years
Past School Ever NeverMonth Year Used Used
_____________________________________________________________________________________Tobacco All 31.4% 41.4% 65.7% 34.3%Grades 7-8 14.0% 21.7% 42.6% 57.4%Grades 9-12 39.4% 50.5% 76.4% 23.6%
_____________________________________________________________________________________Alcohol All 37.6% 53.4% 76.9% 23.1%
Grades 7-8 25.5% 33.4% 60.5% 39.5%Grades 9-12 43.0% 62.5% 84.4% 15.6%
_____________________________________________________________________________________Inhalants All 11.5% 15.2% 30.4% 69.6%
Grades 7-8 7.6% 9.3% 18.7% 81.3%Grades 9-12 13.3% 18.0% 35.9% 64.1%
_____________________________________________________________________________________Any Illicit Drug All 20.0% 28.2% 44.8% 55.2%
Grades 7-8 12.3% 14.3% 24.2% 75.8%Grades 9-12 23.4% 34.4% 53.9% 46.1%
_____________________________________________________________________________________
Marijuana All 19.3% 27.0% 43.6% 56.4%Grades 7-8 10.2% 12.3% 22.1% 77.9%Grades 9-12 23.4% 33.6% 53.1% 46.9%
_____________________________________________________________________________________Marijuana Only All 7.1% 12.0% 24.5% 75.5%
Grades 7-8 5.7% 7.6% 17.0% 83.0%Grades 9-12 7.8% 14.0% 28.1% 71.9%
_____________________________________________________________________________________Cocaine or Crack All 9.8% 13.3% 16.0% 84.0%
Grades 7-8 * % 4.2% 4.2% 95.8%Grades 9-12 14.2% 17.4% 21.3% 78.7%
_____________________________________________________________________________________Cocaine All 9.4% 12.9% 15.7% 84.3%
Grades 7-8 * % 4.4% 4.4% 95.6%Grades 9-12 13.4% 16.6% 20.5% 79.5%
_____________________________________________________________________________________Crack All 3.9% 4.5% 7.2% 92.8%
Grades 7-8 * % 2.1% 2.1% 97.9%Grades 9-12 5.6% 5.6% 9.5% 90.5%
_____________________________________________________________________________________Hallucinogens All 0.6% 0.6% 2.9% 97.1%
Grades 7-8 * % * % 2.1% 97.9%Grades 9-12 0.8% 0.8% 3.2% 96.8%
_____________________________________________________________________________________Uppers All * % * % 1.6% 98.4%
Grades 7-8 * % * % * % 100.0%Grades 9-12 * % * % 2.4% 97.6%
_____________________________________________________________________________________Downers All 1.1% 1.1% 2.2% 97.8%
Grades 7-8 * % * % * % 100.0%Grades 9-12 1.6% 1.6% 3.2% 96.8%
_____________________________________________________________________________________Rohypnol All 2.3% 2.3% 5.0% 95.0%
Grades 7-8 2.1% 2.1% 2.1% 97.9%
Grades 9-12 2.4% 2.4% 6.3% 93.7%_____________________________________________________________________________________Steroids All 1.1% 1.7% 2.3% 97.7%
Grades 7-8 * % 2.1% 2.1% 97.9%Grades 9-12 1.6% 1.6% 2.4% 97.6%
_____________________________________________________________________________________Ecstasy All * % 0.5% 3.8% 96.2%
Grades 7-8 * % * % * % 100.0%Grades 9-12 * % 0.8% 5.5% 94.5%
_____________________________________________________________________________________Heroin All * % 0.7% 2.3% 97.7%
Grades 7-8 * % 2.1% 2.1% 97.9%

8/14/2019 CROSBY COUNTY - Ralls ISD - 2001 Texas School Survey of Drug and Alcohol Use
http://slidepdf.com/reader/full/crosby-county-ralls-isd-2001-texas-school-survey-of-drug-and-alcohol-use 62/144
Grades 9-12 * % * % 2.4% 97.6%
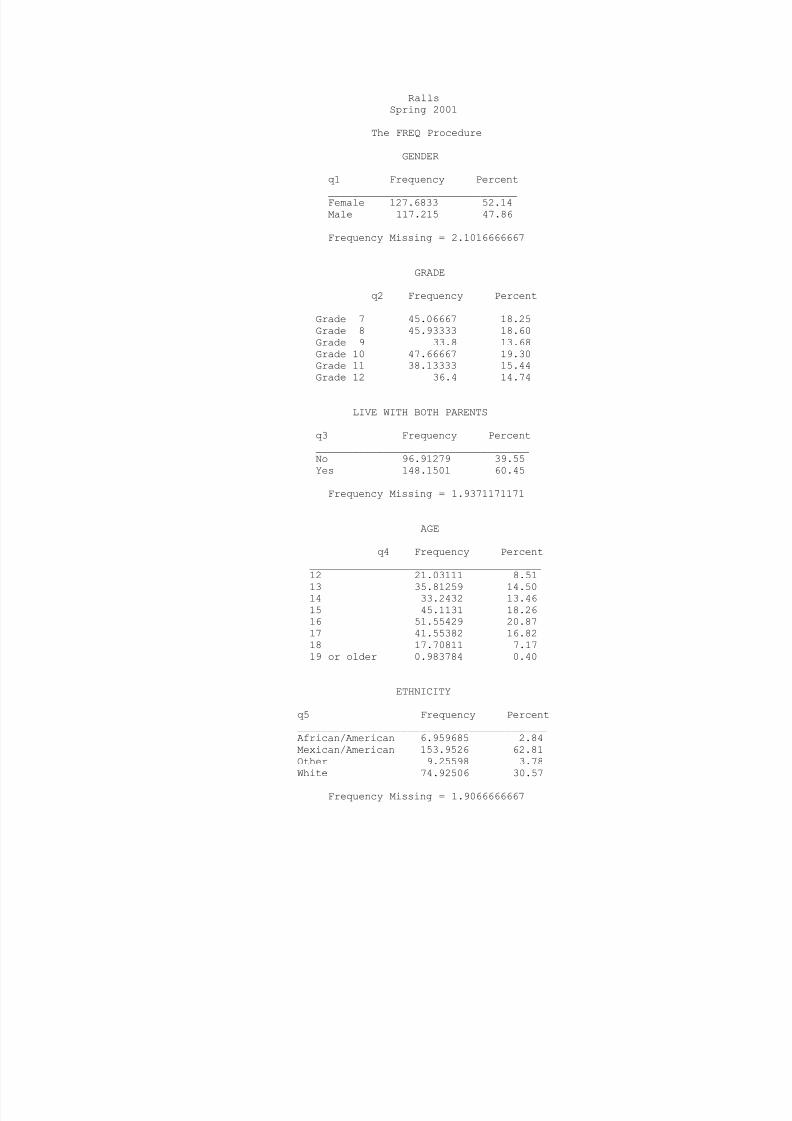
8/14/2019 CROSBY COUNTY - Ralls ISD - 2001 Texas School Survey of Drug and Alcohol Use
http://slidepdf.com/reader/full/crosby-county-ralls-isd-2001-texas-school-survey-of-drug-and-alcohol-use 63/144
RallsSpring 2001
The FREQ Procedure
GENDER
q1 Frequency Percent
_______________________________Female 127.6833 52.14Male 117.215 47.86
Frequency Missing = 2.1016666667
GRADE
q2 Frequency Percent____________________________________Grade 7 45.06667 18.25Grade 8 45.93333 18.60Grade 9 33.8 13.68Grade 10 47.66667 19.30Grade 11 38.13333 15.44Grade 12 36.4 14.74
LIVE WITH BOTH PARENTS
q3 Frequency Percent___________________________________No 96.91279 39.55Yes 148.1501 60.45
Frequency Missing = 1.9371171171
AGE
q4 Frequency Percent______________________________________12 21.03111 8.51
13 35.81259 14.5014 33.2432 13.4615 45.1131 18.2616 51.55429 20.8717 41.55382 16.8218 17.70811 7.1719 or older 0.983784 0.40
ETHNICITY
q5 Frequency Percent_________________________________________African/American 6.959685 2.84Mexican/American 153.9526 62.81Other 9.25598 3.78White 74.92506 30.57
Frequency Missing = 1.9066666667

8/14/2019 CROSBY COUNTY - Ralls ISD - 2001 Texas School Survey of Drug and Alcohol Use
http://slidepdf.com/reader/full/crosby-county-ralls-isd-2001-texas-school-survey-of-drug-and-alcohol-use 64/144
The frequencies have been weighted so that theanalysis reflects the distribution of students by grade
level in the district

8/14/2019 CROSBY COUNTY - Ralls ISD - 2001 Texas School Survey of Drug and Alcohol Use
http://slidepdf.com/reader/full/crosby-county-ralls-isd-2001-texas-school-survey-of-drug-and-alcohol-use 65/144
RallsSpring 2001
The FREQ Procedure
ON AVERAGE WHAT GRADES DO YOU GET
q6 Frequency Percent
___________________________________Mostly A's 71.42522 29.40Mostly B's 127.2973 52.39Mostly C's 43.29106 17.82Mostly D's 0.965714 0.40
Frequency Missing = 4.0207142857
LENGTH OF TIME IN THIS DISTRICT
q7 Frequency Percent__________________________________<1 year 29.00429 11.792-3 years 35.35024 14.37>4 years 181.6921 73.84
Frequency Missing = 0.9533333333
DO YOU HAVE A JOB
q8 Frequency Percent___________________________________No 190.198 77.60Yes 54.89533 22.40
Frequency Missing = 1.9066666667
DO YOU GET AN ALLOWANCE
q9 Frequency Percent___________________________________
No 132.117 54.17Yes 111.7975 45.83
Frequency Missing = 3.0854504505
EITHER PARENT COLLEGE GRADUATE
q10 Frequency Percent___________________________________Don't Know 35.44995 14.47No 144.3143 58.89Yes 65.28093 26.64
Frequency Missing = 1.9548148148
QUALIFY FOR FREE/REDUCED PRICE LUNCH
q11 Frequency Percent___________________________________Don't Know 26.06265 10.64No 67.7604 27.67Yes 151.0753 61.69
Frequency Missing = 2.1016666667

8/14/2019 CROSBY COUNTY - Ralls ISD - 2001 Texas School Survey of Drug and Alcohol Use
http://slidepdf.com/reader/full/crosby-county-ralls-isd-2001-texas-school-survey-of-drug-and-alcohol-use 66/144
The frequencies have been weighted so that theanalysis reflects the distribution of students by grade
level in the district
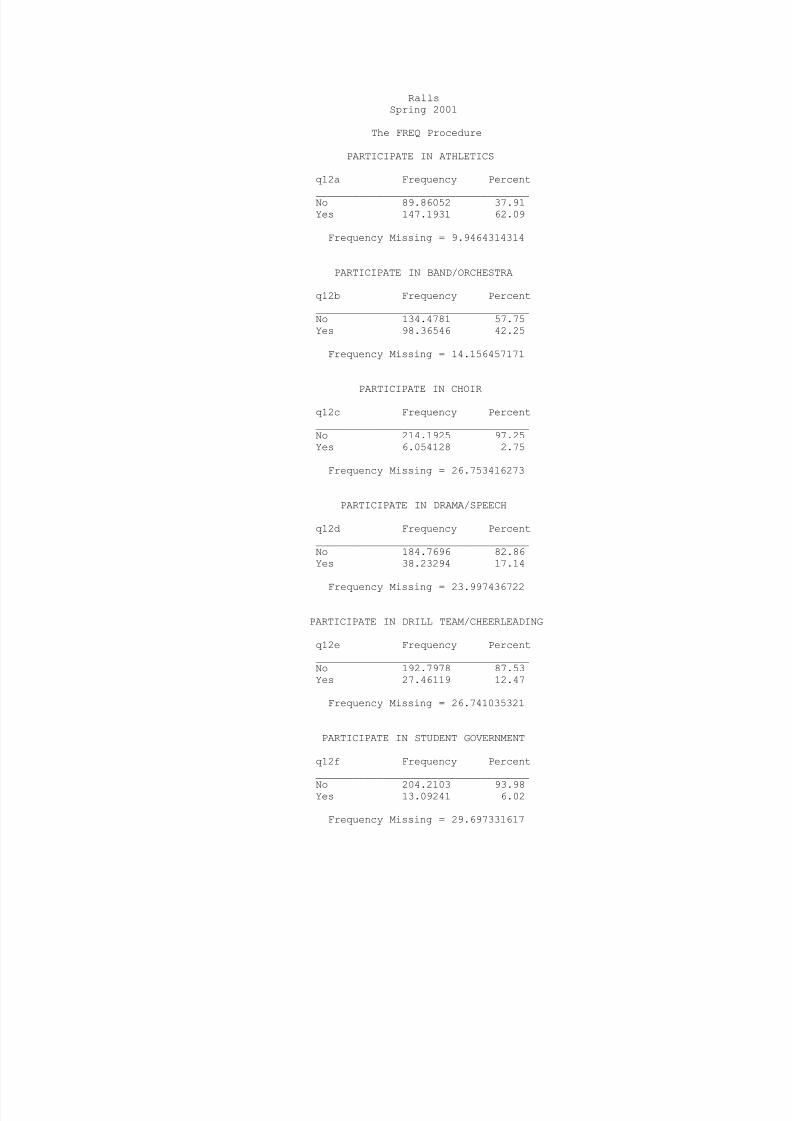
8/14/2019 CROSBY COUNTY - Ralls ISD - 2001 Texas School Survey of Drug and Alcohol Use
http://slidepdf.com/reader/full/crosby-county-ralls-isd-2001-texas-school-survey-of-drug-and-alcohol-use 67/144
RallsSpring 2001
The FREQ Procedure
PARTICIPATE IN ATHLETICS
q12a Frequency Percent
___________________________________No 89.86052 37.91Yes 147.1931 62.09
Frequency Missing = 9.9464314314
PARTICIPATE IN BAND/ORCHESTRA
q12b Frequency Percent___________________________________No 134.4781 57.75Yes 98.36546 42.25
Frequency Missing = 14.156457171
PARTICIPATE IN CHOIR
q12c Frequency Percent___________________________________No 214.1925 97.25Yes 6.054128 2.75
Frequency Missing = 26.753416273
PARTICIPATE IN DRAMA/SPEECH
q12d Frequency Percent___________________________________No 184.7696 82.86Yes 38.23294 17.14
Frequency Missing = 23.997436722
PARTICIPATE IN DRILL TEAM/CHEERLEADING
q12e Frequency Percent___________________________________No 192.7978 87.53Yes 27.46119 12.47
Frequency Missing = 26.741035321
PARTICIPATE IN STUDENT GOVERNMENT
q12f Frequency Percent___________________________________
No 204.2103 93.98Yes 13.09241 6.02
Frequency Missing = 29.697331617

8/14/2019 CROSBY COUNTY - Ralls ISD - 2001 Texas School Survey of Drug and Alcohol Use
http://slidepdf.com/reader/full/crosby-county-ralls-isd-2001-texas-school-survey-of-drug-and-alcohol-use 68/144
The frequencies have been weighted so that theanalysis reflects the distribution of students by grade
level in the district
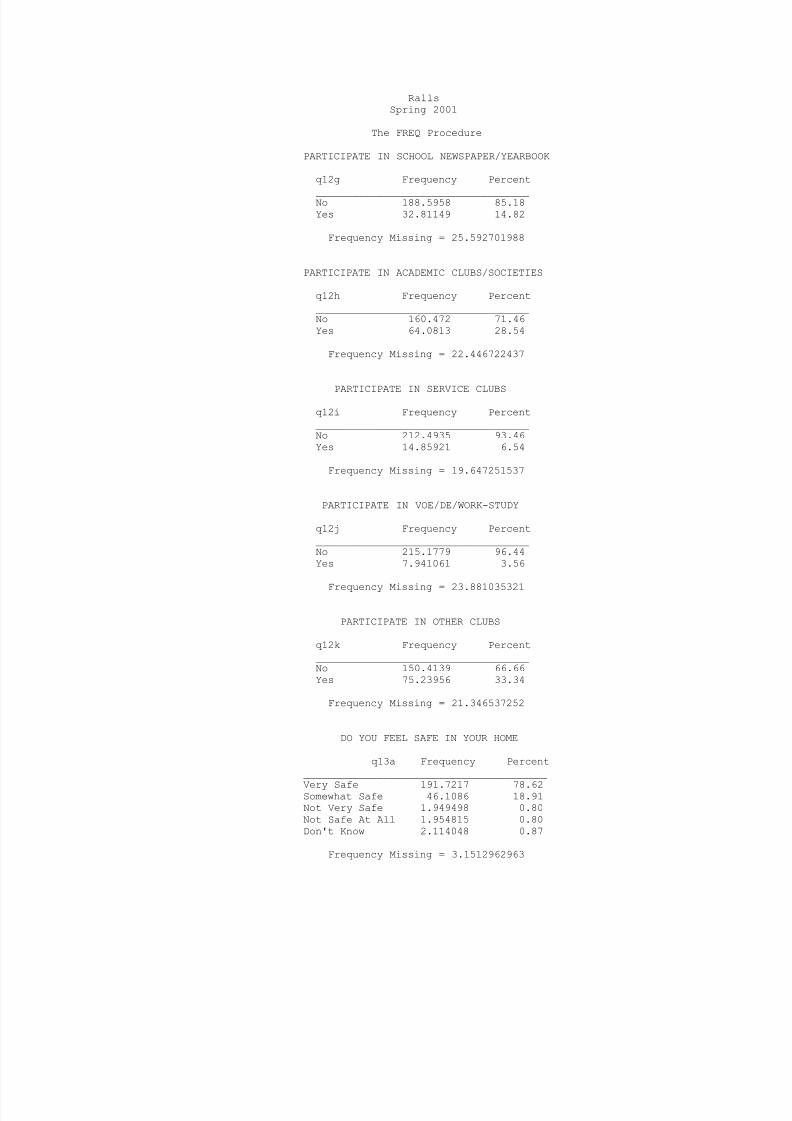
8/14/2019 CROSBY COUNTY - Ralls ISD - 2001 Texas School Survey of Drug and Alcohol Use
http://slidepdf.com/reader/full/crosby-county-ralls-isd-2001-texas-school-survey-of-drug-and-alcohol-use 69/144
RallsSpring 2001
The FREQ Procedure
PARTICIPATE IN SCHOOL NEWSPAPER/YEARBOOK
q12g Frequency Percent
___________________________________No 188.5958 85.18Yes 32.81149 14.82
Frequency Missing = 25.592701988
PARTICIPATE IN ACADEMIC CLUBS/SOCIETIES
q12h Frequency Percent___________________________________No 160.472 71.46Yes 64.0813 28.54
Frequency Missing = 22.446722437
PARTICIPATE IN SERVICE CLUBS
q12i Frequency Percent___________________________________No 212.4935 93.46Yes 14.85921 6.54
Frequency Missing = 19.647251537
PARTICIPATE IN VOE/DE/WORK-STUDY
q12j Frequency Percent___________________________________No 215.1779 96.44Yes 7.941061 3.56
Frequency Missing = 23.881035321
PARTICIPATE IN OTHER CLUBS
q12k Frequency Percent___________________________________No 150.4139 66.66Yes 75.23956 33.34
Frequency Missing = 21.346537252
DO YOU FEEL SAFE IN YOUR HOME
q13a Frequency Percent________________________________________
Very Safe 191.7217 78.62Somewhat Safe 46.1086 18.91Not Very Safe 1.949498 0.80Not Safe At All 1.954815 0.80Don't Know 2.114048 0.87
Frequency Missing = 3.1512962963

8/14/2019 CROSBY COUNTY - Ralls ISD - 2001 Texas School Survey of Drug and Alcohol Use
http://slidepdf.com/reader/full/crosby-county-ralls-isd-2001-texas-school-survey-of-drug-and-alcohol-use 70/144
The frequencies have been weighted so that theanalysis reflects the distribution of students by grade
level in the district
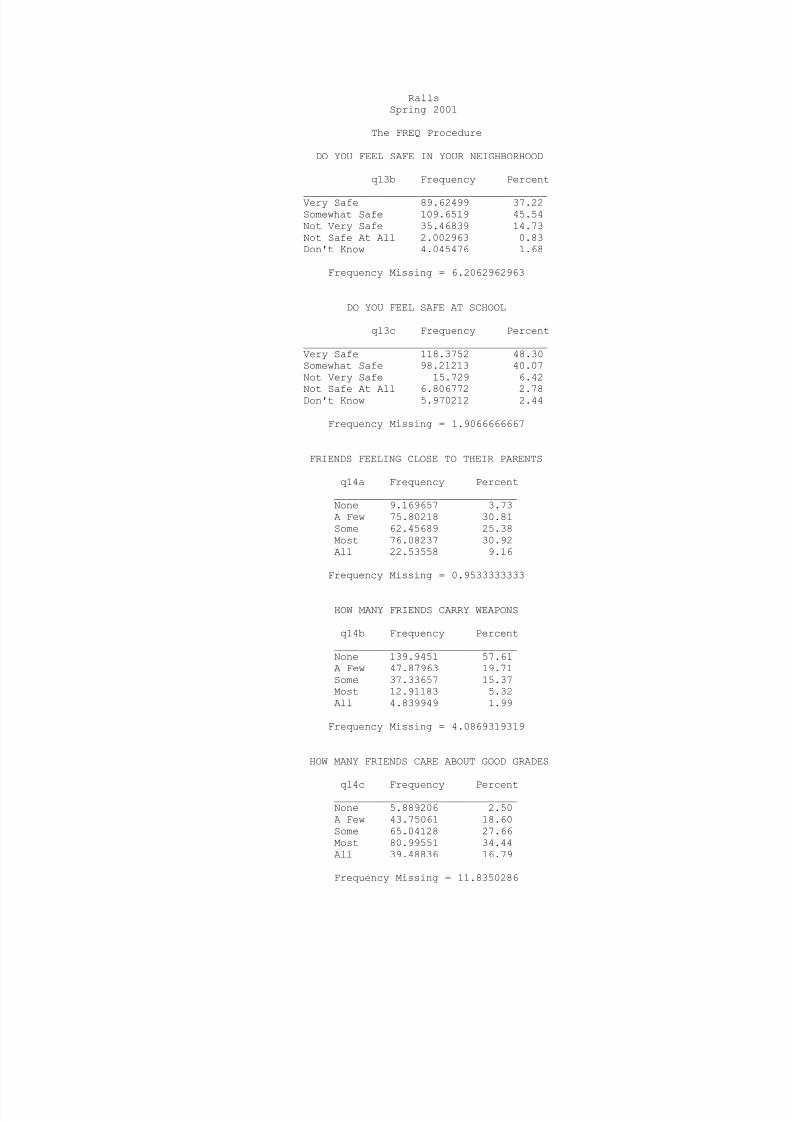
8/14/2019 CROSBY COUNTY - Ralls ISD - 2001 Texas School Survey of Drug and Alcohol Use
http://slidepdf.com/reader/full/crosby-county-ralls-isd-2001-texas-school-survey-of-drug-and-alcohol-use 71/144
RallsSpring 2001
The FREQ Procedure
DO YOU FEEL SAFE IN YOUR NEIGHBORHOOD
q13b Frequency Percent
________________________________________Very Safe 89.62499 37.22Somewhat Safe 109.6519 45.54Not Very Safe 35.46839 14.73Not Safe At All 2.002963 0.83Don't Know 4.045476 1.68
Frequency Missing = 6.2062962963
DO YOU FEEL SAFE AT SCHOOL
q13c Frequency Percent________________________________________Very Safe 118.3752 48.30Somewhat Safe 98.21213 40.07Not Very Safe 15.729 6.42
Not Safe At All 6.806772 2.78Don't Know 5.970212 2.44
Frequency Missing = 1.9066666667
FRIENDS FEELING CLOSE TO THEIR PARENTS
q14a Frequency Percent______________________________None 9.169657 3.73A Few 75.80218 30.81Some 62.45689 25.38Most 76.08237 30.92All 22.53558 9.16
Frequency Missing = 0.9533333333
HOW MANY FRIENDS CARRY WEAPONS
q14b Frequency Percent______________________________None 139.9451 57.61A Few 47.87963 19.71Some 37.33657 15.37Most 12.91183 5.32All 4.839949 1.99
Frequency Missing = 4.0869319319
HOW MANY FRIENDS CARE ABOUT GOOD GRADES
q14c Frequency Percent______________________________None 5.889206 2.50A Few 43.75061 18.60Some 65.04128 27.66Most 80.99551 34.44All 39.48836 16.79
Frequency Missing = 11.8350286

8/14/2019 CROSBY COUNTY - Ralls ISD - 2001 Texas School Survey of Drug and Alcohol Use
http://slidepdf.com/reader/full/crosby-county-ralls-isd-2001-texas-school-survey-of-drug-and-alcohol-use 72/144
The frequencies have been weighted so that theanalysis reflects the distribution of students by grade
level in the district
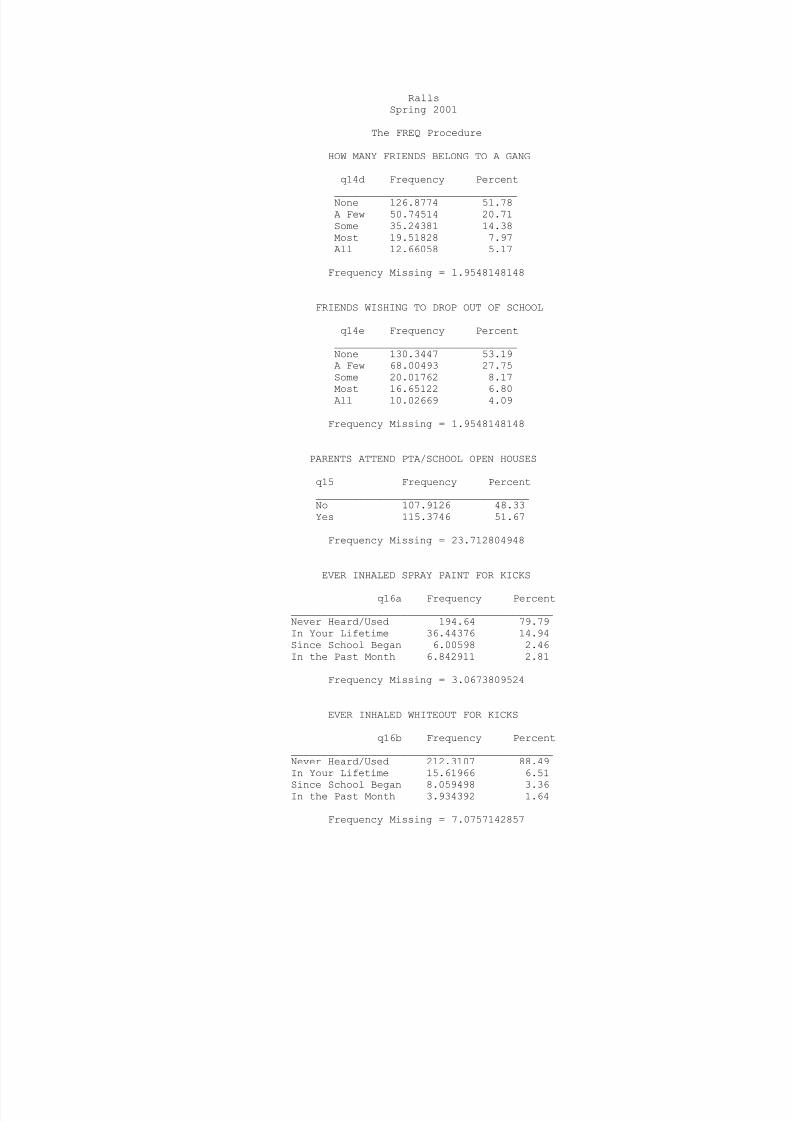
8/14/2019 CROSBY COUNTY - Ralls ISD - 2001 Texas School Survey of Drug and Alcohol Use
http://slidepdf.com/reader/full/crosby-county-ralls-isd-2001-texas-school-survey-of-drug-and-alcohol-use 73/144
RallsSpring 2001
The FREQ Procedure
HOW MANY FRIENDS BELONG TO A GANG
q14d Frequency Percent
______________________________None 126.8774 51.78A Few 50.74514 20.71Some 35.24381 14.38Most 19.51828 7.97All 12.66058 5.17
Frequency Missing = 1.9548148148
FRIENDS WISHING TO DROP OUT OF SCHOOL
q14e Frequency Percent______________________________None 130.3447 53.19A Few 68.00493 27.75Some 20.01762 8.17
Most 16.65122 6.80All 10.02669 4.09
Frequency Missing = 1.9548148148
PARENTS ATTEND PTA/SCHOOL OPEN HOUSES
q15 Frequency Percent___________________________________No 107.9126 48.33Yes 115.3746 51.67
Frequency Missing = 23.712804948
EVER INHALED SPRAY PAINT FOR KICKS
q16a Frequency Percent___________________________________________Never Heard/Used 194.64 79.79In Your Lifetime 36.44376 14.94Since School Began 6.00598 2.46In the Past Month 6.842911 2.81
Frequency Missing = 3.0673809524
EVER INHALED WHITEOUT FOR KICKS
q16b Frequency Percent___________________________________________Never Heard/Used 212.3107 88.49In Your Lifetime 15.61966 6.51
Since School Began 8.059498 3.36In the Past Month 3.934392 1.64
Frequency Missing = 7.0757142857

8/14/2019 CROSBY COUNTY - Ralls ISD - 2001 Texas School Survey of Drug and Alcohol Use
http://slidepdf.com/reader/full/crosby-county-ralls-isd-2001-texas-school-survey-of-drug-and-alcohol-use 74/144
The frequencies have been weighted so that theanalysis reflects the distribution of students by grade
level in the district

8/14/2019 CROSBY COUNTY - Ralls ISD - 2001 Texas School Survey of Drug and Alcohol Use
http://slidepdf.com/reader/full/crosby-county-ralls-isd-2001-texas-school-survey-of-drug-and-alcohol-use 75/144
RallsSpring 2001
The FREQ Procedure
EVER INHALED GASOLINE FOR KICKS
q16c Frequency Percent
___________________________________________Never Heard/Used 199.3083 82.48In Your Lifetime 28.71905 11.88Since School Began 4.864339 2.01In the Past Month 8.756642 3.62
Frequency Missing = 5.3516666667
EVER INHALED FREON FOR KICKS
q16d Frequency Percent___________________________________________Never Heard/Used 235.63 97.90In Your Lifetime 3.904313 1.62In the Past Month 1.148333 0.48
Frequency Missing = 6.3173809524
EVER INHALED POPPERS, ETC. FOR KICKS
q16e Frequency Percent___________________________________________Never Heard/Used 225.9377 94.19In Your Lifetime 5.022568 2.09Since School Began 7.955478 3.32In the Past Month 0.965714 0.40
Frequency Missing = 7.1185456885
EVER INHALED GLUE FOR KICKS
q16f Frequency Percent___________________________________________Never Heard/Used 217.2972 89.51In Your Lifetime 18.56357 7.65Since School Began 2.884762 1.19In the Past Month 4.020714 1.66
Frequency Missing = 4.2337837838
EVER INHALED PAINT THINNERS FOR KICKS
q16g Frequency Percent___________________________________________Never Heard/Used 222.8831 92.18In Your Lifetime 12.72921 5.26Since School Began 4.228095 1.75
In the Past Month 1.954815 0.81
Frequency Missing = 5.2048148148

8/14/2019 CROSBY COUNTY - Ralls ISD - 2001 Texas School Survey of Drug and Alcohol Use
http://slidepdf.com/reader/full/crosby-county-ralls-isd-2001-texas-school-survey-of-drug-and-alcohol-use 76/144
The frequencies have been weighted so that theanalysis reflects the distribution of students by grade
level in the district
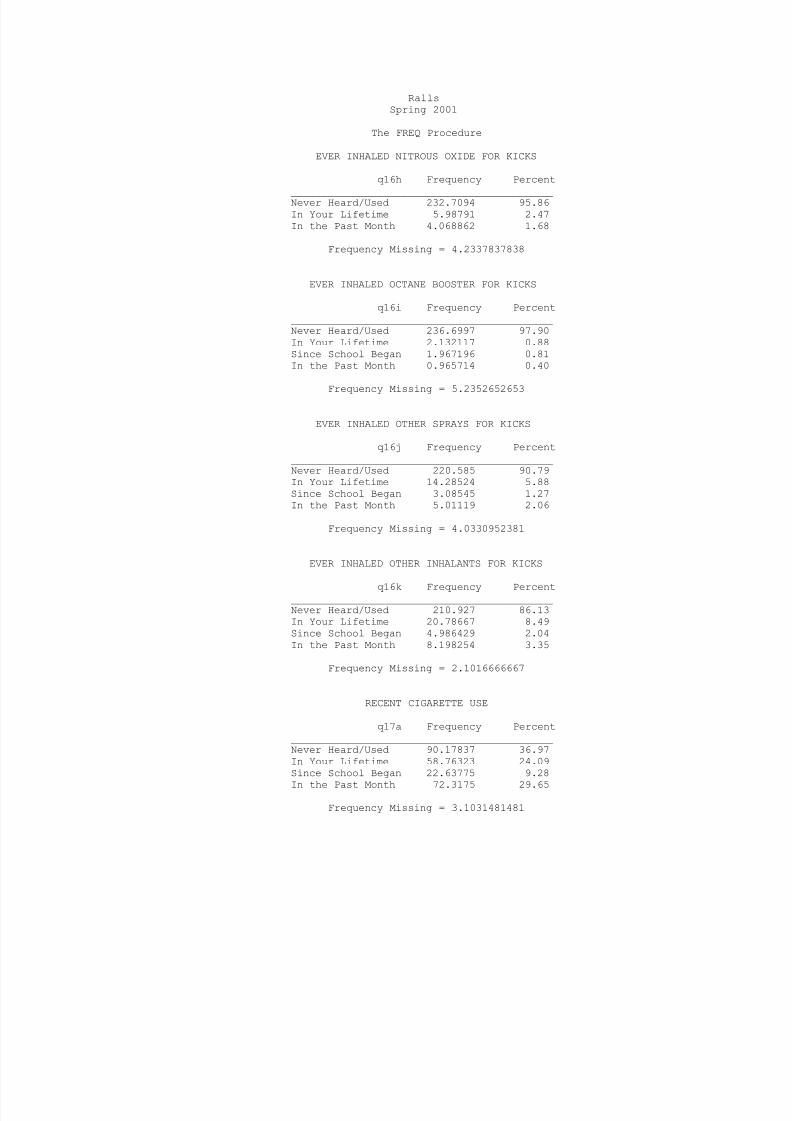
8/14/2019 CROSBY COUNTY - Ralls ISD - 2001 Texas School Survey of Drug and Alcohol Use
http://slidepdf.com/reader/full/crosby-county-ralls-isd-2001-texas-school-survey-of-drug-and-alcohol-use 77/144
RallsSpring 2001
The FREQ Procedure
EVER INHALED NITROUS OXIDE FOR KICKS
q16h Frequency Percent
___________________________________________Never Heard/Used 232.7094 95.86In Your Lifetime 5.98791 2.47In the Past Month 4.068862 1.68
Frequency Missing = 4.2337837838
EVER INHALED OCTANE BOOSTER FOR KICKS
q16i Frequency Percent___________________________________________Never Heard/Used 236.6997 97.90In Your Lifetime 2.132117 0.88Since School Began 1.967196 0.81In the Past Month 0.965714 0.40
Frequency Missing = 5.2352652653
EVER INHALED OTHER SPRAYS FOR KICKS
q16j Frequency Percent___________________________________________Never Heard/Used 220.585 90.79In Your Lifetime 14.28524 5.88Since School Began 3.08545 1.27In the Past Month 5.01119 2.06
Frequency Missing = 4.0330952381
EVER INHALED OTHER INHALANTS FOR KICKS
q16k Frequency Percent___________________________________________Never Heard/Used 210.927 86.13In Your Lifetime 20.78667 8.49Since School Began 4.986429 2.04In the Past Month 8.198254 3.35
Frequency Missing = 2.1016666667
RECENT CIGARETTE USE
q17a Frequency Percent___________________________________________Never Heard/Used 90.17837 36.97In Your Lifetime 58.76323 24.09Since School Began 22.63775 9.28
In the Past Month 72.3175 29.65
Frequency Missing = 3.1031481481

8/14/2019 CROSBY COUNTY - Ralls ISD - 2001 Texas School Survey of Drug and Alcohol Use
http://slidepdf.com/reader/full/crosby-county-ralls-isd-2001-texas-school-survey-of-drug-and-alcohol-use 78/144
The frequencies have been weighted so that theanalysis reflects the distribution of students by grade
level in the district
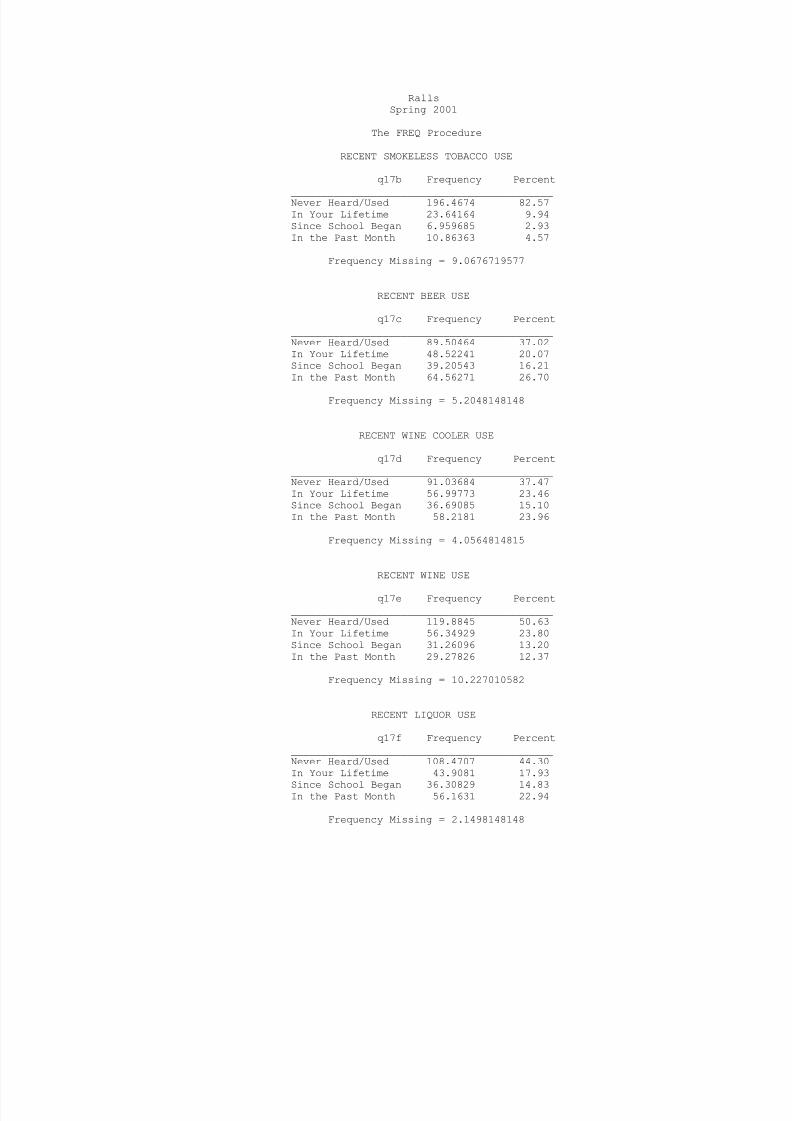
8/14/2019 CROSBY COUNTY - Ralls ISD - 2001 Texas School Survey of Drug and Alcohol Use
http://slidepdf.com/reader/full/crosby-county-ralls-isd-2001-texas-school-survey-of-drug-and-alcohol-use 79/144
RallsSpring 2001
The FREQ Procedure
RECENT SMOKELESS TOBACCO USE
q17b Frequency Percent
___________________________________________Never Heard/Used 196.4674 82.57In Your Lifetime 23.64164 9.94Since School Began 6.959685 2.93In the Past Month 10.86363 4.57
Frequency Missing = 9.0676719577
RECENT BEER USE
q17c Frequency Percent___________________________________________Never Heard/Used 89.50464 37.02In Your Lifetime 48.52241 20.07Since School Began 39.20543 16.21In the Past Month 64.56271 26.70
Frequency Missing = 5.2048148148
RECENT WINE COOLER USE
q17d Frequency Percent___________________________________________Never Heard/Used 91.03684 37.47In Your Lifetime 56.99773 23.46Since School Began 36.69085 15.10In the Past Month 58.2181 23.96
Frequency Missing = 4.0564814815
RECENT WINE USE
q17e Frequency Percent___________________________________________Never Heard/Used 119.8845 50.63In Your Lifetime 56.34929 23.80Since School Began 31.26096 13.20In the Past Month 29.27826 12.37
Frequency Missing = 10.227010582
RECENT LIQUOR USE
q17f Frequency Percent___________________________________________Never Heard/Used 108.4707 44.30In Your Lifetime 43.9081 17.93
Since School Began 36.30829 14.83In the Past Month 56.1631 22.94
Frequency Missing = 2.1498148148

8/14/2019 CROSBY COUNTY - Ralls ISD - 2001 Texas School Survey of Drug and Alcohol Use
http://slidepdf.com/reader/full/crosby-county-ralls-isd-2001-texas-school-survey-of-drug-and-alcohol-use 80/144
The frequencies have been weighted so that theanalysis reflects the distribution of students by grade
level in the district

8/14/2019 CROSBY COUNTY - Ralls ISD - 2001 Texas School Survey of Drug and Alcohol Use
http://slidepdf.com/reader/full/crosby-county-ralls-isd-2001-texas-school-survey-of-drug-and-alcohol-use 81/144
RallsSpring 2001
The FREQ Procedure
RECENT MARIJUANA USE
q18a Frequency Percent
___________________________________________Never Heard/Used 133.8566 54.93In Your Lifetime 35.58572 14.60Since School Began 23.98246 9.84In the Past Month 50.2771 20.63
Frequency Missing = 3.2981481481
RECENT COCAINE USE
q18b Frequency Percent___________________________________________Never Heard/Used 198.3131 83.17In Your Lifetime 11.79926 4.95Since School Began 9.055663 3.80In the Past Month 19.28082 8.09
Frequency Missing = 8.5511111111
RECENT CRACK USE
q18c Frequency Percent___________________________________________Never Heard/Used 223.7468 93.38In Your Lifetime 5.94545 2.48Since School Began 2.101667 0.88In the Past Month 7.803309 3.26
Frequency Missing = 7.4027777778
RECENT HALLUCINOGEN USE
q18e Frequency Percent___________________________________________Never Heard/Used 230.5901 97.02In Your Lifetime 5.156667 2.17In the Past Month 1.919048 0.81
Frequency Missing = 9.3342063492
RECENT UPPER USE
q18f Frequency Percent___________________________________________Never Heard/Used 233.5912 97.82In Your Lifetime 4.051165 1.70In the Past Month 1.148333 0.48
Frequency Missing = 8.2092592593
RECENT DOWNER USE
q18g Frequency Percent___________________________________________Never Heard/Used 230.5901 97.89In Your Lifetime 3.055 1.30In the Past Month 1.919048 0.81
8/14/2019 CROSBY COUNTY - Ralls ISD - 2001 Texas School Survey of Drug and Alcohol Use
http://slidepdf.com/reader/full/crosby-county-ralls-isd-2001-texas-school-survey-of-drug-and-alcohol-use 82/144
Frequency Missing = 11.435873016
The frequencies have been weighted so that theanalysis reflects the distribution of students by grade
level in the district

8/14/2019 CROSBY COUNTY - Ralls ISD - 2001 Texas School Survey of Drug and Alcohol Use
http://slidepdf.com/reader/full/crosby-county-ralls-isd-2001-texas-school-survey-of-drug-and-alcohol-use 83/144
RallsSpring 2001
The FREQ Procedure
RECENT ROHYPNOL USE
q18h Frequency Percent
___________________________________________Never Heard/Used 225.7625 94.15In Your Lifetime 7.852117 3.27Since School Began 1.148333 0.48In the Past Month 5.016879 2.09
Frequency Missing = 7.2201587302
RECENT STEROID USE
q18i Frequency Percent___________________________________________Never Heard/Used 234.568 97.83In Your Lifetime 2.132117 0.89Since School Began 1.148333 0.48In the Past Month 1.931429 0.81
Frequency Missing = 7.2201587302
RECENT ECSTASY USE
q18j Frequency Percent___________________________________________Never Heard/Used 228.8055 95.44In Your Lifetime 7.85881 3.28Since School Began 0.965714 0.40In the Past Month 2.114048 0.88
Frequency Missing = 7.2559259259
RECENT HEROIN USE
q18k Frequency Percent___________________________________________Never Heard/Used 234.8182 97.91In Your Lifetime 2.86 1.19Since School Began 2.149815 0.90
Frequency Missing = 7.172010582
TOBACCO USE IN PAST MONTH
q19a Frequency Percent_________________________________________Never Heard/Used 160.0731 68.221-2 times 20.70138 8.823-10 times 15.77714 6.72
11+ times 38.10159 16.24
Frequency Missing = 12.346746747

8/14/2019 CROSBY COUNTY - Ralls ISD - 2001 Texas School Survey of Drug and Alcohol Use
http://slidepdf.com/reader/full/crosby-county-ralls-isd-2001-texas-school-survey-of-drug-and-alcohol-use 84/144
The frequencies have been weighted so that theanalysis reflects the distribution of students by grade
level in the district

8/14/2019 CROSBY COUNTY - Ralls ISD - 2001 Texas School Survey of Drug and Alcohol Use
http://slidepdf.com/reader/full/crosby-county-ralls-isd-2001-texas-school-survey-of-drug-and-alcohol-use 85/144
RallsSpring 2001
The FREQ Procedure
ALCOHOL USE IN PAST MONTH
q19b Frequency Percent
_________________________________________Never Heard/Used 138.4583 58.251-2 times 45.09898 18.973-10 times 36.51027 15.3611+ times 17.64069 7.42
Frequency Missing = 9.2917467467
INHALANT USE IN PAST MONTH
q19c Frequency Percent_________________________________________Never Heard/Used 215.3738 92.511-2 times 12.59437 5.413-10 times 2.902831 1.2511+ times 1.931429 0.83
Frequency Missing = 14.197541113
MARIJUANA USE IN PAST MONTH
q19d Frequency Percent_________________________________________Never Heard/Used 160.2135 69.211-2 times 24.07775 10.403-10 times 23.50717 10.1511+ times 23.69117 10.23
Frequency Missing = 15.510423995
COCAINE USE IN PAST MONTH
q19e Frequency Percent_________________________________________Never Heard/Used 211.225 90.091-2 times 16.53519 7.053-10 times 3.825714 1.6311+ times 2.872381 1.23
Frequency Missing = 12.541746747
CRACK USE IN PAST MONTH
q19f Frequency Percent_________________________________________Never Heard/Used 221.9618 95.401-2 times 9.740426 4.19
11+ times 0.953333 0.41
Frequency Missing = 14.344392964

8/14/2019 CROSBY COUNTY - Ralls ISD - 2001 Texas School Survey of Drug and Alcohol Use
http://slidepdf.com/reader/full/crosby-county-ralls-isd-2001-texas-school-survey-of-drug-and-alcohol-use 86/144
The frequencies have been weighted so that theanalysis reflects the distribution of students by grade
level in the district

8/14/2019 CROSBY COUNTY - Ralls ISD - 2001 Texas School Survey of Drug and Alcohol Use
http://slidepdf.com/reader/full/crosby-county-ralls-isd-2001-texas-school-survey-of-drug-and-alcohol-use 87/144
RallsSpring 2001
The FREQ Procedure
CLOSE FRIENDS USE CIGARETTES
q20a Frequency Percent
_________________________________________Never heard/None 51.78114 21.69A few 64.63331 27.07Some 45.31233 18.98Most 53.67713 22.48All 23.37445 9.79
Frequency Missing = 8.2216402116
CLOSE FRIENDS USE SMOKELESS TOBACCO
q20b Frequency Percent_________________________________________Never heard/None 143.6741 61.16A few 59.74083 25.43Some 18.94863 8.07
Most 8.708122 3.71All 3.825714 1.63
Frequency Missing = 12.102566853
CLOSE FRIENDS USE BEER
q20c Frequency Percent_________________________________________Never heard/None 41.56614 17.55A few 55.51887 23.44Some 34.84162 14.71Most 63.88644 26.98All 41.01048 17.32
Frequency Missing = 10.176455026
CLOSE FRIENDS USE WINE COOLERS
q20d Frequency Percent_________________________________________Never heard/None 73.72275 31.02A few 51.04165 21.48Some 50.18805 21.12Most 40.1163 16.88All 22.59135 9.51
Frequency Missing = 9.3398948949
CLOSE FRIENDS USE WINE
q20e Frequency Percent_________________________________________Never heard/None 114.8927 48.87A few 55.24032 23.50Some 30.77091 13.09Most 20.68331 8.80All 13.51762 5.75
Frequency Missing = 11.8951859

8/14/2019 CROSBY COUNTY - Ralls ISD - 2001 Texas School Survey of Drug and Alcohol Use
http://slidepdf.com/reader/full/crosby-county-ralls-isd-2001-texas-school-survey-of-drug-and-alcohol-use 88/144
The frequencies have been weighted so that theanalysis reflects the distribution of students by grade
level in the district
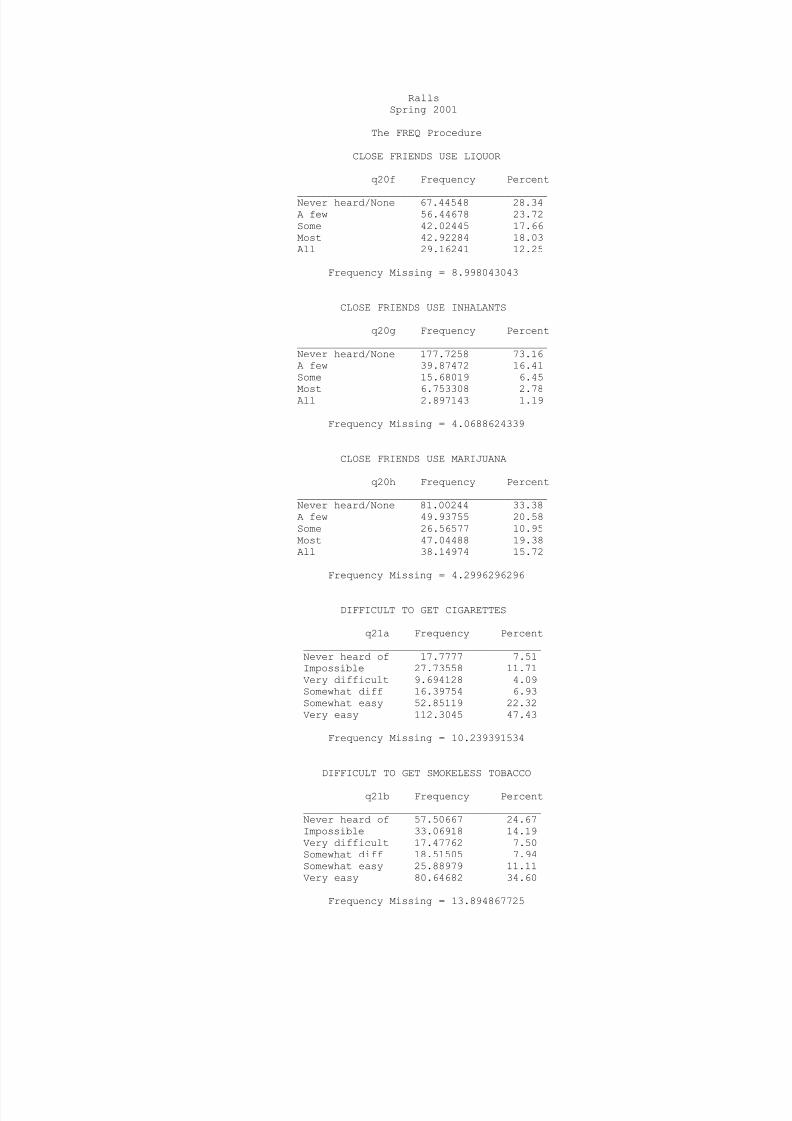
8/14/2019 CROSBY COUNTY - Ralls ISD - 2001 Texas School Survey of Drug and Alcohol Use
http://slidepdf.com/reader/full/crosby-county-ralls-isd-2001-texas-school-survey-of-drug-and-alcohol-use 89/144
RallsSpring 2001
The FREQ Procedure
CLOSE FRIENDS USE LIQUOR
q20f Frequency Percent
_________________________________________Never heard/None 67.44548 28.34A few 56.44678 23.72Some 42.02445 17.66Most 42.92284 18.03All 29.16241 12.25
Frequency Missing = 8.998043043
CLOSE FRIENDS USE INHALANTS
q20g Frequency Percent_________________________________________Never heard/None 177.7258 73.16A few 39.87472 16.41Some 15.68019 6.45
Most 6.753308 2.78All 2.897143 1.19
Frequency Missing = 4.0688624339
CLOSE FRIENDS USE MARIJUANA
q20h Frequency Percent_________________________________________Never heard/None 81.00244 33.38A few 49.93755 20.58Some 26.56577 10.95Most 47.04488 19.38All 38.14974 15.72
Frequency Missing = 4.2996296296
DIFFICULT TO GET CIGARETTES
q21a Frequency Percent_______________________________________Never heard of 17.7777 7.51Impossible 27.73558 11.71Very difficult 9.694128 4.09Somewhat diff 16.39754 6.93Somewhat easy 52.85119 22.32Very easy 112.3045 47.43
Frequency Missing = 10.239391534
DIFFICULT TO GET SMOKELESS TOBACCO
q21b Frequency Percent_______________________________________Never heard of 57.50667 24.67Impossible 33.06918 14.19Very difficult 17.47762 7.50Somewhat diff 18.51505 7.94Somewhat easy 25.88979 11.11Very easy 80.64682 34.60
Frequency Missing = 13.894867725

8/14/2019 CROSBY COUNTY - Ralls ISD - 2001 Texas School Survey of Drug and Alcohol Use
http://slidepdf.com/reader/full/crosby-county-ralls-isd-2001-texas-school-survey-of-drug-and-alcohol-use 90/144
The frequencies have been weighted so that theanalysis reflects the distribution of students by grade
level in the district
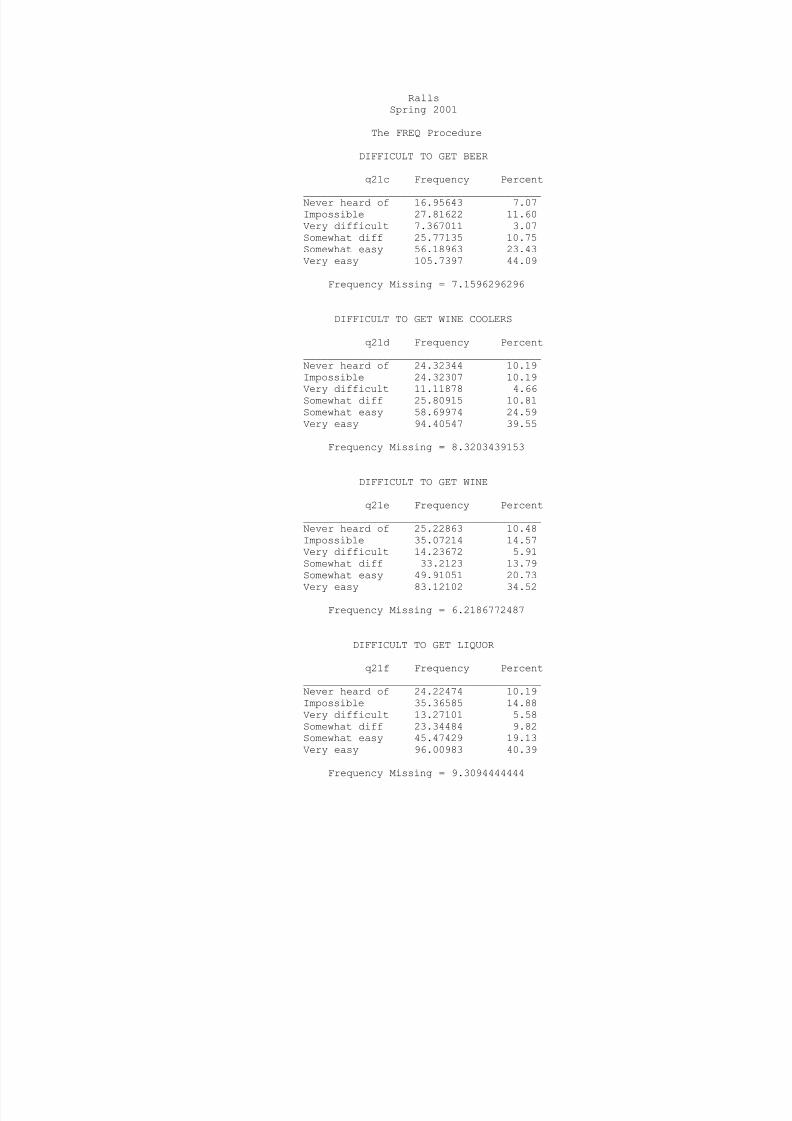
8/14/2019 CROSBY COUNTY - Ralls ISD - 2001 Texas School Survey of Drug and Alcohol Use
http://slidepdf.com/reader/full/crosby-county-ralls-isd-2001-texas-school-survey-of-drug-and-alcohol-use 91/144
RallsSpring 2001
The FREQ Procedure
DIFFICULT TO GET BEER
q21c Frequency Percent
_______________________________________Never heard of 16.95643 7.07Impossible 27.81622 11.60Very difficult 7.367011 3.07Somewhat diff 25.77135 10.75Somewhat easy 56.18963 23.43Very easy 105.7397 44.09
Frequency Missing = 7.1596296296
DIFFICULT TO GET WINE COOLERS
q21d Frequency Percent_______________________________________Never heard of 24.32344 10.19Impossible 24.32307 10.19
Very difficult 11.11878 4.66Somewhat diff 25.80915 10.81Somewhat easy 58.69974 24.59Very easy 94.40547 39.55
Frequency Missing = 8.3203439153
DIFFICULT TO GET WINE
q21e Frequency Percent_______________________________________Never heard of 25.22863 10.48Impossible 35.07214 14.57Very difficult 14.23672 5.91Somewhat diff 33.2123 13.79Somewhat easy 49.91051 20.73
Very easy 83.12102 34.52
Frequency Missing = 6.2186772487
DIFFICULT TO GET LIQUOR
q21f Frequency Percent_______________________________________Never heard of 24.22474 10.19Impossible 35.36585 14.88Very difficult 13.27101 5.58Somewhat diff 23.34484 9.82Somewhat easy 45.47429 19.13Very easy 96.00983 40.39
Frequency Missing = 9.3094444444

8/14/2019 CROSBY COUNTY - Ralls ISD - 2001 Texas School Survey of Drug and Alcohol Use
http://slidepdf.com/reader/full/crosby-county-ralls-isd-2001-texas-school-survey-of-drug-and-alcohol-use 92/144
The frequencies have been weighted so that theanalysis reflects the distribution of students by grade
level in the district
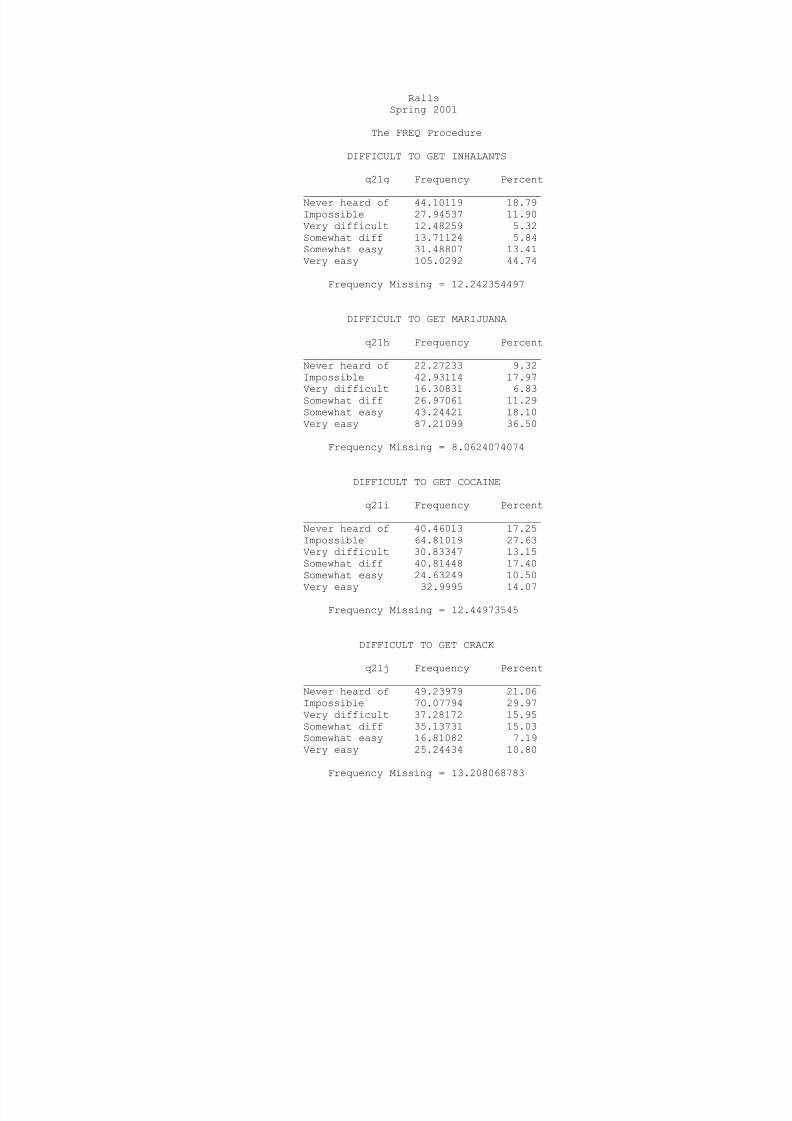
8/14/2019 CROSBY COUNTY - Ralls ISD - 2001 Texas School Survey of Drug and Alcohol Use
http://slidepdf.com/reader/full/crosby-county-ralls-isd-2001-texas-school-survey-of-drug-and-alcohol-use 93/144
RallsSpring 2001
The FREQ Procedure
DIFFICULT TO GET INHALANTS
q21g Frequency Percent
_______________________________________Never heard of 44.10119 18.79Impossible 27.94537 11.90Very difficult 12.48259 5.32Somewhat diff 13.71124 5.84Somewhat easy 31.48807 13.41Very easy 105.0292 44.74
Frequency Missing = 12.242354497
DIFFICULT TO GET MARIJUANA
q21h Frequency Percent_______________________________________Never heard of 22.27233 9.32Impossible 42.93114 17.97
Very difficult 16.30831 6.83Somewhat diff 26.97061 11.29Somewhat easy 43.24421 18.10Very easy 87.21099 36.50
Frequency Missing = 8.0624074074
DIFFICULT TO GET COCAINE
q21i Frequency Percent_______________________________________Never heard of 40.46013 17.25Impossible 64.81019 27.63Very difficult 30.83347 13.15Somewhat diff 40.81448 17.40Somewhat easy 24.63249 10.50
Very easy 32.9995 14.07
Frequency Missing = 12.44973545
DIFFICULT TO GET CRACK
q21j Frequency Percent_______________________________________Never heard of 49.23979 21.06Impossible 70.07794 29.97Very difficult 37.28172 15.95Somewhat diff 35.13731 15.03Somewhat easy 16.81082 7.19Very easy 25.24434 10.80
Frequency Missing = 13.208068783

8/14/2019 CROSBY COUNTY - Ralls ISD - 2001 Texas School Survey of Drug and Alcohol Use
http://slidepdf.com/reader/full/crosby-county-ralls-isd-2001-texas-school-survey-of-drug-and-alcohol-use 94/144
The frequencies have been weighted so that theanalysis reflects the distribution of students by grade
level in the district
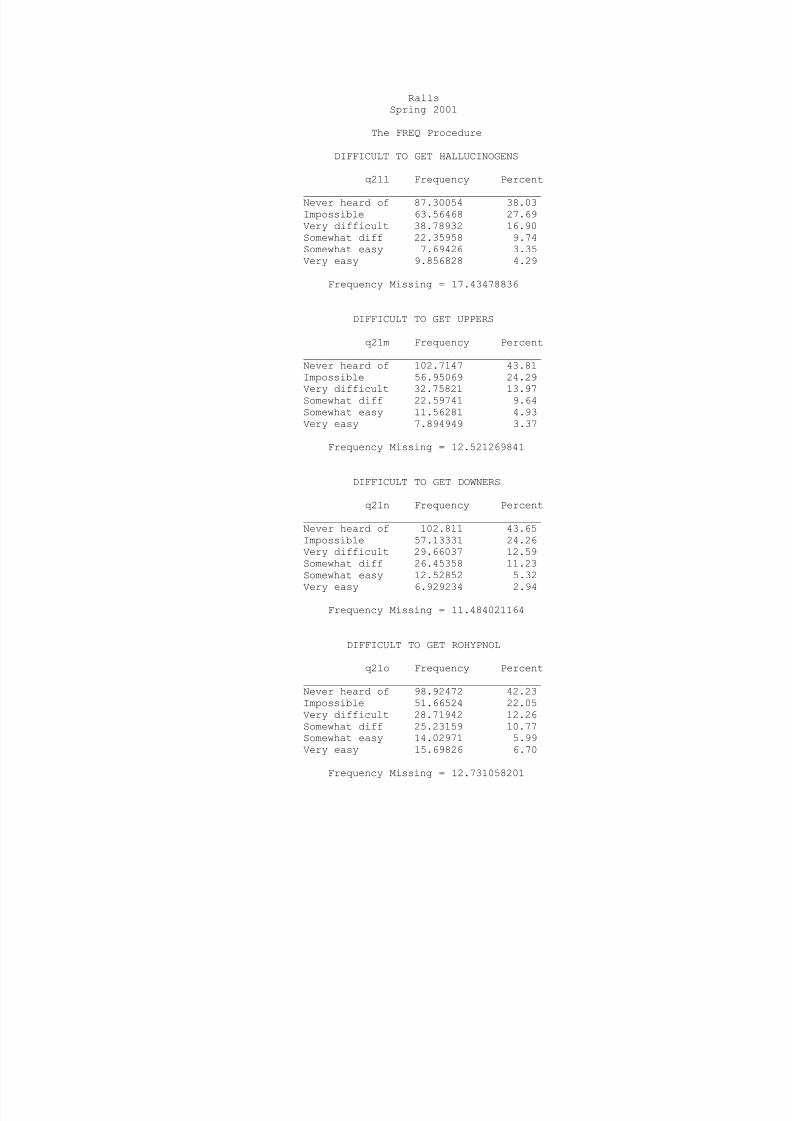
8/14/2019 CROSBY COUNTY - Ralls ISD - 2001 Texas School Survey of Drug and Alcohol Use
http://slidepdf.com/reader/full/crosby-county-ralls-isd-2001-texas-school-survey-of-drug-and-alcohol-use 95/144
RallsSpring 2001
The FREQ Procedure
DIFFICULT TO GET HALLUCINOGENS
q21l Frequency Percent
_______________________________________Never heard of 87.30054 38.03Impossible 63.56468 27.69Very difficult 38.78932 16.90Somewhat diff 22.35958 9.74Somewhat easy 7.69426 3.35Very easy 9.856828 4.29
Frequency Missing = 17.43478836
DIFFICULT TO GET UPPERS
q21m Frequency Percent_______________________________________Never heard of 102.7147 43.81Impossible 56.95069 24.29
Very difficult 32.75821 13.97Somewhat diff 22.59741 9.64Somewhat easy 11.56281 4.93Very easy 7.894949 3.37
Frequency Missing = 12.521269841
DIFFICULT TO GET DOWNERS
q21n Frequency Percent_______________________________________Never heard of 102.811 43.65Impossible 57.13331 24.26Very difficult 29.66037 12.59Somewhat diff 26.45358 11.23Somewhat easy 12.52852 5.32
Very easy 6.929234 2.94
Frequency Missing = 11.484021164
DIFFICULT TO GET ROHYPNOL
q21o Frequency Percent_______________________________________Never heard of 98.92472 42.23Impossible 51.66524 22.05Very difficult 28.71942 12.26Somewhat diff 25.23159 10.77Somewhat easy 14.02971 5.99Very easy 15.69826 6.70
Frequency Missing = 12.731058201

8/14/2019 CROSBY COUNTY - Ralls ISD - 2001 Texas School Survey of Drug and Alcohol Use
http://slidepdf.com/reader/full/crosby-county-ralls-isd-2001-texas-school-survey-of-drug-and-alcohol-use 96/144
The frequencies have been weighted so that theanalysis reflects the distribution of students by grade
level in the district
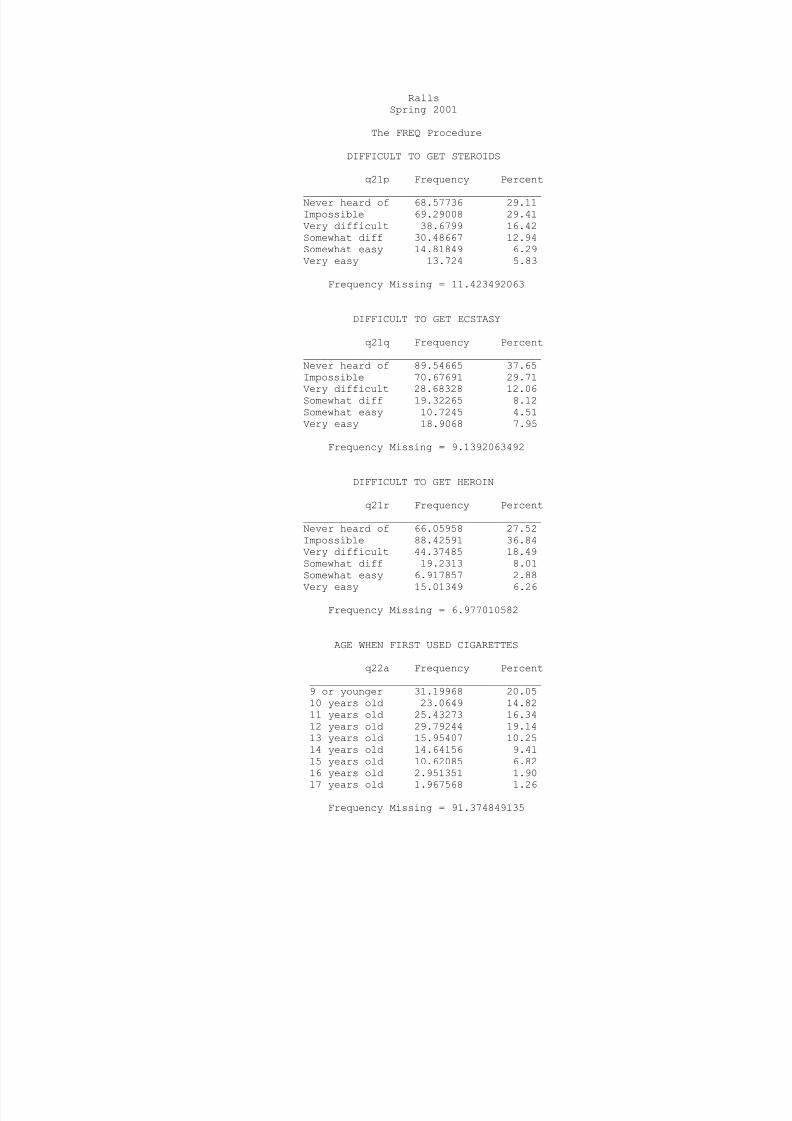
8/14/2019 CROSBY COUNTY - Ralls ISD - 2001 Texas School Survey of Drug and Alcohol Use
http://slidepdf.com/reader/full/crosby-county-ralls-isd-2001-texas-school-survey-of-drug-and-alcohol-use 97/144
RallsSpring 2001
The FREQ Procedure
DIFFICULT TO GET STEROIDS
q21p Frequency Percent
_______________________________________Never heard of 68.57736 29.11Impossible 69.29008 29.41Very difficult 38.6799 16.42Somewhat diff 30.48667 12.94Somewhat easy 14.81849 6.29Very easy 13.724 5.83
Frequency Missing = 11.423492063
DIFFICULT TO GET ECSTASY
q21q Frequency Percent_______________________________________Never heard of 89.54665 37.65Impossible 70.67691 29.71
Very difficult 28.68328 12.06Somewhat diff 19.32265 8.12Somewhat easy 10.7245 4.51Very easy 18.9068 7.95
Frequency Missing = 9.1392063492
DIFFICULT TO GET HEROIN
q21r Frequency Percent_______________________________________Never heard of 66.05958 27.52Impossible 88.42591 36.84Very difficult 44.37485 18.49Somewhat diff 19.2313 8.01Somewhat easy 6.917857 2.88
Very easy 15.01349 6.26
Frequency Missing = 6.977010582
AGE WHEN FIRST USED CIGARETTES
q22a Frequency Percent______________________________________9 or younger 31.19968 20.0510 years old 23.0649 14.8211 years old 25.43273 16.3412 years old 29.79244 19.1413 years old 15.95407 10.2514 years old 14.64156 9.4115 years old 10.62085 6.8216 years old 2.951351 1.90
17 years old 1.967568 1.26
Frequency Missing = 91.374849135

8/14/2019 CROSBY COUNTY - Ralls ISD - 2001 Texas School Survey of Drug and Alcohol Use
http://slidepdf.com/reader/full/crosby-county-ralls-isd-2001-texas-school-survey-of-drug-and-alcohol-use 98/144
The frequencies have been weighted so that theanalysis reflects the distribution of students by grade
level in the district
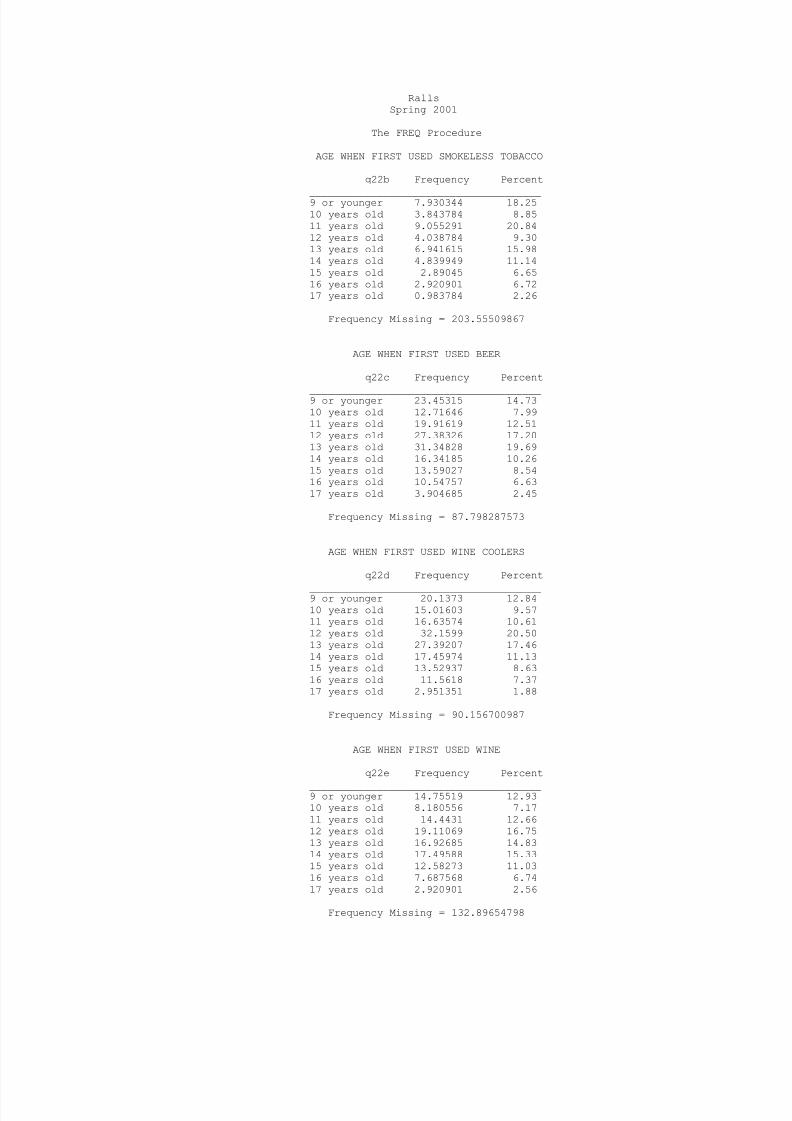
8/14/2019 CROSBY COUNTY - Ralls ISD - 2001 Texas School Survey of Drug and Alcohol Use
http://slidepdf.com/reader/full/crosby-county-ralls-isd-2001-texas-school-survey-of-drug-and-alcohol-use 99/144
RallsSpring 2001
The FREQ Procedure
AGE WHEN FIRST USED SMOKELESS TOBACCO
q22b Frequency Percent
______________________________________9 or younger 7.930344 18.2510 years old 3.843784 8.8511 years old 9.055291 20.8412 years old 4.038784 9.3013 years old 6.941615 15.9814 years old 4.839949 11.1415 years old 2.89045 6.6516 years old 2.920901 6.7217 years old 0.983784 2.26
Frequency Missing = 203.55509867
AGE WHEN FIRST USED BEER
q22c Frequency Percent
______________________________________9 or younger 23.45315 14.7310 years old 12.71646 7.9911 years old 19.91619 12.5112 years old 27.38326 17.2013 years old 31.34828 19.6914 years old 16.34185 10.2615 years old 13.59027 8.5416 years old 10.54757 6.6317 years old 3.904685 2.45
Frequency Missing = 87.798287573
AGE WHEN FIRST USED WINE COOLERS
q22d Frequency Percent
______________________________________9 or younger 20.1373 12.8410 years old 15.01603 9.5711 years old 16.63574 10.6112 years old 32.1599 20.5013 years old 27.39207 17.4614 years old 17.45974 11.1315 years old 13.52937 8.6316 years old 11.5618 7.3717 years old 2.951351 1.88
Frequency Missing = 90.156700987
AGE WHEN FIRST USED WINE
q22e Frequency Percent
______________________________________9 or younger 14.75519 12.9310 years old 8.180556 7.1711 years old 14.4431 12.6612 years old 19.11069 16.7513 years old 16.92685 14.8314 years old 17.49588 15.3315 years old 12.58273 11.0316 years old 7.687568 6.7417 years old 2.920901 2.56
Frequency Missing = 132.89654798

8/14/2019 CROSBY COUNTY - Ralls ISD - 2001 Texas School Survey of Drug and Alcohol Use
http://slidepdf.com/reader/full/crosby-county-ralls-isd-2001-texas-school-survey-of-drug-and-alcohol-use 100/144
The frequencies have been weighted so that theanalysis reflects the distribution of students by grade
level in the district

8/14/2019 CROSBY COUNTY - Ralls ISD - 2001 Texas School Survey of Drug and Alcohol Use
http://slidepdf.com/reader/full/crosby-county-ralls-isd-2001-texas-school-survey-of-drug-and-alcohol-use 101/144
RallsSpring 2001
The FREQ Procedure
AGE WHEN FIRST USED LIQUOR
q22f Frequency Percent
______________________________________9 or younger 9.849392 7.6210 years old 2.114048 1.6411 years old 7.19008 5.5612 years old 20.79934 16.0913 years old 22.9509 17.7614 years old 25.544 19.7615 years old 17.58053 13.6016 years old 18.29604 14.1617 years old 4.918919 3.81
Frequency Missing = 117.75675318
AGE WHEN FIRST USED INHALANTS
q22g Frequency Percent
______________________________________9 or younger 2.968677 6.8910 years old 5.022196 11.6611 years old 5.957831 13.8312 years old 10.77971 25.0213 years old 5.775212 13.4014 years old 3.898996 9.0515 years old 6.746615 15.6616 years old 0.983784 2.2817 years old 0.953333 2.21
Frequency Missing = 203.91364436
AGE WHEN FIRST USED MARIJUANA
q22h Frequency Percent
______________________________________9 or younger 9.654392 9.1910 years old 6.236747 5.9411 years old 6.218677 5.9212 years old 23.99384 22.8513 years old 15.66781 14.9214 years old 20.16447 19.2015 years old 16.3104 15.5316 years old 4.827568 4.6017 years old 1.937117 1.84
Frequency Missing = 141.98898184
AGE WHEN FIRST USED COCAINE
q22i Frequency Percent
______________________________________9 or younger 2.920529 8.3110 years old 1.001481 2.8511 years old 0.965714 2.7513 years old 5.169048 14.7014 years old 9.618996 27.3615 years old 6.716165 19.1016 years old 7.778919 22.1317 years old 0.983784 2.80
Frequency Missing = 211.84536394

8/14/2019 CROSBY COUNTY - Ralls ISD - 2001 Texas School Survey of Drug and Alcohol Use
http://slidepdf.com/reader/full/crosby-county-ralls-isd-2001-texas-school-survey-of-drug-and-alcohol-use 102/144
The frequencies have been weighted so that theanalysis reflects the distribution of students by grade
level in the district

8/14/2019 CROSBY COUNTY - Ralls ISD - 2001 Texas School Survey of Drug and Alcohol Use
http://slidepdf.com/reader/full/crosby-county-ralls-isd-2001-texas-school-survey-of-drug-and-alcohol-use 103/144
RallsSpring 2001
The FREQ Procedure
AGE WHEN FIRST USED CRACK
q22j Frequency Percent
______________________________________10 years old 1.001481 7.2812 years old 1.148333 8.3513 years old 1.906667 13.8714 years old 0.953333 6.9315 years old 2.884762 20.9816 years old 3.886615 28.2717 years old 1.967568 14.31
Frequency Missing = 233.25124053
AGE WHEN FIRST USED HALLUCINOGENS
q22l Frequency Percent______________________________________12 years old 0.953333 16.12
13 years old 2.101667 35.5314 years old 1.906667 32.2315 years old 0.953333 16.12
Frequency Missing = 241.085
AGE WHEN FIRST USED UPPERS
q22m Frequency Percent______________________________________11 years old 1.148333 18.6612 years old 0.953333 15.4914 years old 1.919048 31.1915 years old 1.148333 18.6616 years old 0.983784 15.99
Frequency Missing = 240.8471686
AGE WHEN FIRST USED DOWNERS
q22n Frequency Percent______________________________________11 years old 1.148333 23.0913 years old 2.86 57.5015 years old 0.965714 19.42
Frequency Missing = 242.02595238
AGE WHEN FIRST USED ROHYPNOL
q22o Frequency Percent
______________________________________11 years old 1.001481 8.3813 years old 0.953333 7.9814 years old 7.093784 59.3615 years old 0.965714 8.0816 years old 0.953333 7.9817 years old 0.983784 8.23
Frequency Missing = 235.04857
8/14/2019 CROSBY COUNTY - Ralls ISD - 2001 Texas School Survey of Drug and Alcohol Use
http://slidepdf.com/reader/full/crosby-county-ralls-isd-2001-texas-school-survey-of-drug-and-alcohol-use 104/144
The frequencies have been weighted so that theanalysis reflects the distribution of students by grade
level in the district

8/14/2019 CROSBY COUNTY - Ralls ISD - 2001 Texas School Survey of Drug and Alcohol Use
http://slidepdf.com/reader/full/crosby-county-ralls-isd-2001-texas-school-survey-of-drug-and-alcohol-use 105/144
RallsSpring 2001
The FREQ Procedure
AGE WHEN FIRST USED STEROIDS
q22p Frequency Percent
______________________________________13 years old 2.296667 44.0715 years old 2.915212 55.93
Frequency Missing = 241.78812098
AGE WHEN FIRST USED ECSTASY
q22q Frequency Percent______________________________________9 or younger 0.965714 8.1212 years old 0.965714 8.1213 years old 3.25 27.3314 years old 0.965714 8.1215 years old 4.791429 40.2917 years old 0.953333 8.02
Frequency Missing = 235.10809524
AGE WHEN FIRST USED HEROIN
q22r Frequency Percent______________________________________13 years old 1.906667 47.5714 years old 1.148333 28.6515 years old 0.953333 23.78
Frequency Missing = 242.99166667
HOW OFTEN NORMALLY USE CIGARETTES
q23a Frequency Percent_________________________________________Every day 34.88204 14.64Several times/wk 14.82913 6.22Several times/mo 17.93971 7.53About once/month 21.01947 8.82About once/year 17.88384 7.51< once/year 26.44762 11.10Never used 105.2309 44.17
Frequency Missing = 8.7672758473
HOW OFTEN NORMALLY USE SMOKELESS TOBACCO
q23b Frequency Percent_________________________________________
Every day 3.055 1.31Several times/wk 4.821879 2.07About once/month 6.825214 2.93About once/year 8.896802 3.82< once/year 12.88669 5.53Never used 196.353 84.33
Frequency Missing = 14.161402116

8/14/2019 CROSBY COUNTY - Ralls ISD - 2001 Texas School Survey of Drug and Alcohol Use
http://slidepdf.com/reader/full/crosby-county-ralls-isd-2001-texas-school-survey-of-drug-and-alcohol-use 106/144
The frequencies have been weighted so that theanalysis reflects the distribution of students by grade
level in the district
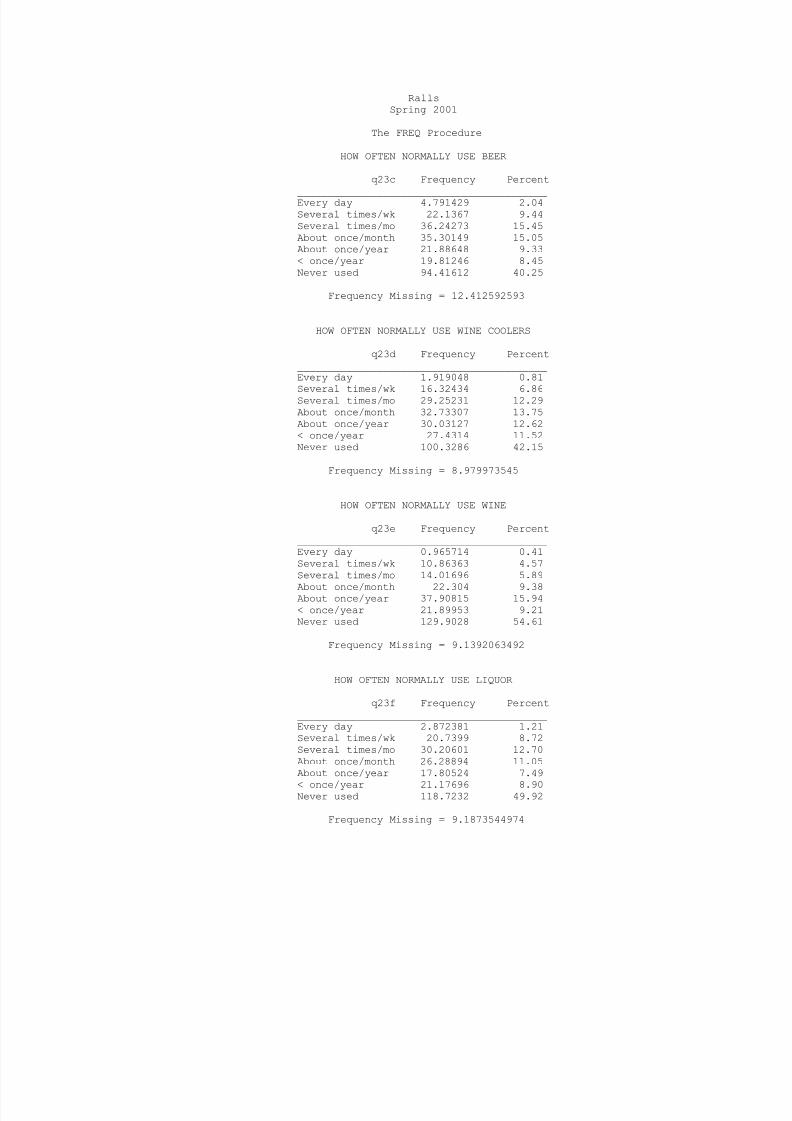
8/14/2019 CROSBY COUNTY - Ralls ISD - 2001 Texas School Survey of Drug and Alcohol Use
http://slidepdf.com/reader/full/crosby-county-ralls-isd-2001-texas-school-survey-of-drug-and-alcohol-use 107/144
RallsSpring 2001
The FREQ Procedure
HOW OFTEN NORMALLY USE BEER
q23c Frequency Percent
_________________________________________Every day 4.791429 2.04Several times/wk 22.1367 9.44Several times/mo 36.24273 15.45About once/month 35.30149 15.05About once/year 21.88648 9.33< once/year 19.81246 8.45Never used 94.41612 40.25
Frequency Missing = 12.412592593
HOW OFTEN NORMALLY USE WINE COOLERS
q23d Frequency Percent_________________________________________Every day 1.919048 0.81
Several times/wk 16.32434 6.86Several times/mo 29.25231 12.29About once/month 32.73307 13.75About once/year 30.03127 12.62< once/year 27.4314 11.52Never used 100.3286 42.15
Frequency Missing = 8.979973545
HOW OFTEN NORMALLY USE WINE
q23e Frequency Percent_________________________________________Every day 0.965714 0.41Several times/wk 10.86363 4.57Several times/mo 14.01696 5.89
About once/month 22.304 9.38About once/year 37.90815 15.94< once/year 21.89953 9.21Never used 129.9028 54.61
Frequency Missing = 9.1392063492
HOW OFTEN NORMALLY USE LIQUOR
q23f Frequency Percent_________________________________________Every day 2.872381 1.21Several times/wk 20.7399 8.72Several times/mo 30.20601 12.70About once/month 26.28894 11.05About once/year 17.80524 7.49
< once/year 21.17696 8.90Never used 118.7232 49.92
Frequency Missing = 9.1873544974

8/14/2019 CROSBY COUNTY - Ralls ISD - 2001 Texas School Survey of Drug and Alcohol Use
http://slidepdf.com/reader/full/crosby-county-ralls-isd-2001-texas-school-survey-of-drug-and-alcohol-use 108/144
The frequencies have been weighted so that theanalysis reflects the distribution of students by grade
level in the district
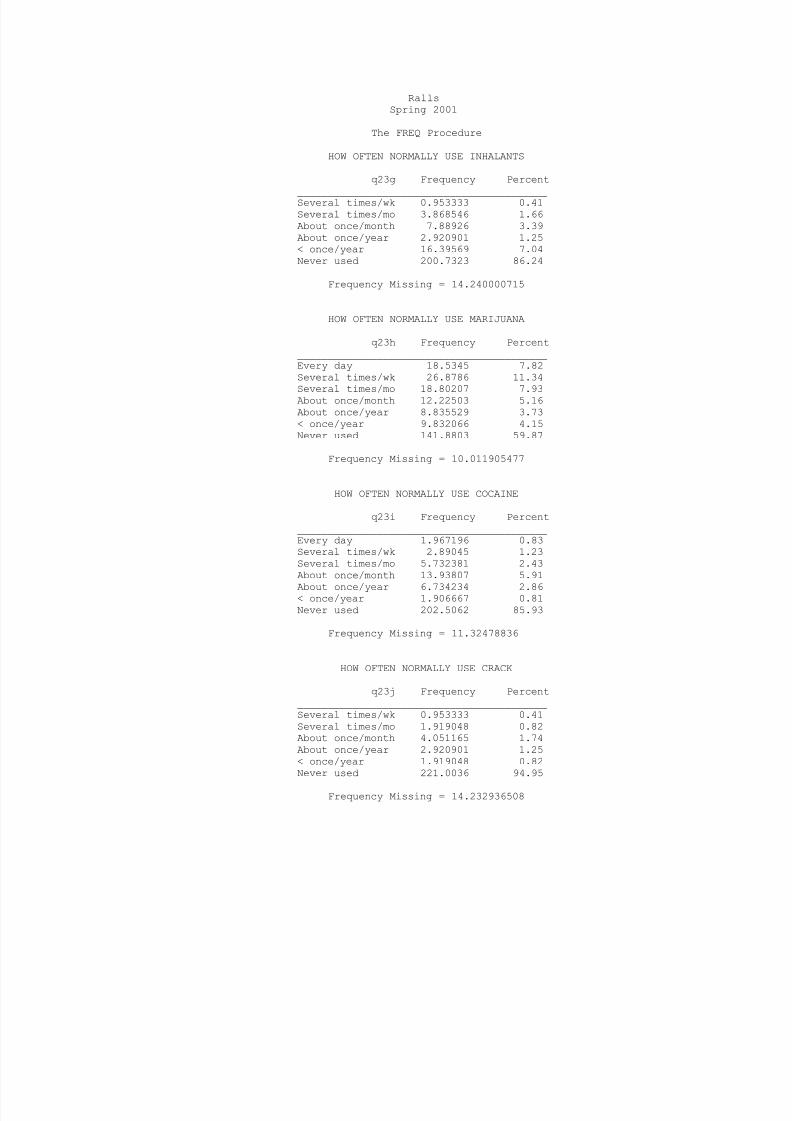
8/14/2019 CROSBY COUNTY - Ralls ISD - 2001 Texas School Survey of Drug and Alcohol Use
http://slidepdf.com/reader/full/crosby-county-ralls-isd-2001-texas-school-survey-of-drug-and-alcohol-use 109/144
RallsSpring 2001
The FREQ Procedure
HOW OFTEN NORMALLY USE INHALANTS
q23g Frequency Percent
_________________________________________Several times/wk 0.953333 0.41Several times/mo 3.868546 1.66About once/month 7.88926 3.39About once/year 2.920901 1.25< once/year 16.39569 7.04Never used 200.7323 86.24
Frequency Missing = 14.240000715
HOW OFTEN NORMALLY USE MARIJUANA
q23h Frequency Percent_________________________________________Every day 18.5345 7.82Several times/wk 26.8786 11.34
Several times/mo 18.80207 7.93About once/month 12.22503 5.16About once/year 8.835529 3.73< once/year 9.832066 4.15Never used 141.8803 59.87
Frequency Missing = 10.011905477
HOW OFTEN NORMALLY USE COCAINE
q23i Frequency Percent_________________________________________Every day 1.967196 0.83Several times/wk 2.89045 1.23Several times/mo 5.732381 2.43About once/month 13.93807 5.91
About once/year 6.734234 2.86< once/year 1.906667 0.81Never used 202.5062 85.93
Frequency Missing = 11.32478836
HOW OFTEN NORMALLY USE CRACK
q23j Frequency Percent_________________________________________Several times/wk 0.953333 0.41Several times/mo 1.919048 0.82About once/month 4.051165 1.74About once/year 2.920901 1.25< once/year 1.919048 0.82Never used 221.0036 94.95
Frequency Missing = 14.232936508

8/14/2019 CROSBY COUNTY - Ralls ISD - 2001 Texas School Survey of Drug and Alcohol Use
http://slidepdf.com/reader/full/crosby-county-ralls-isd-2001-texas-school-survey-of-drug-and-alcohol-use 110/144
The frequencies have been weighted so that theanalysis reflects the distribution of students by grade
level in the district

8/14/2019 CROSBY COUNTY - Ralls ISD - 2001 Texas School Survey of Drug and Alcohol Use
http://slidepdf.com/reader/full/crosby-county-ralls-isd-2001-texas-school-survey-of-drug-and-alcohol-use 111/144
RallsSpring 2001
The FREQ Procedure
HOW OFTEN NORMALLY USE HALLUCINOGENS
q23l Frequency Percent
_________________________________________About once/month 0.953333 0.40About once/year 0.953333 0.40< once/year 3.055 1.29Never used 231.7756 97.90
Frequency Missing = 10.262777778
HOW OFTEN NORMALLY USE UPPERS
q23m Frequency Percent_________________________________________About once/month 1.906667 0.81About once/year 1.148333 0.49< once/year 2.114048 0.90Never used 228.8299 97.79
Frequency Missing = 13.001059631
HOW OFTEN NORMALLY USE DOWNERS
q23n Frequency Percent_________________________________________Several times/mo 1.906667 0.81About once/month 0.953333 0.40About once/year 0.965714 0.41< once/year 1.148333 0.49Never used 230.962 97.89
Frequency Missing = 11.063942514
HOW OFTEN NORMALLY USE ROHYPNOL
q23o Frequency Percent_________________________________________Several times/wk 0.953333 0.41Several times/mo 3.055 1.30About once/month 1.919048 0.82About once/year 4.038784 1.73< once/year 1.954815 0.83Never used 222.1947 94.91
Frequency Missing = 12.884286429
HOW OFTEN NORMALLY USE STEROIDS
q23p Frequency Percent
_________________________________________About once/year 1.148333 0.49< once/year 2.132117 0.92Never used 228.9767 98.59
Frequency Missing = 14.742804948

8/14/2019 CROSBY COUNTY - Ralls ISD - 2001 Texas School Survey of Drug and Alcohol Use
http://slidepdf.com/reader/full/crosby-county-ralls-isd-2001-texas-school-survey-of-drug-and-alcohol-use 112/144
The frequencies have been weighted so that theanalysis reflects the distribution of students by grade
level in the district
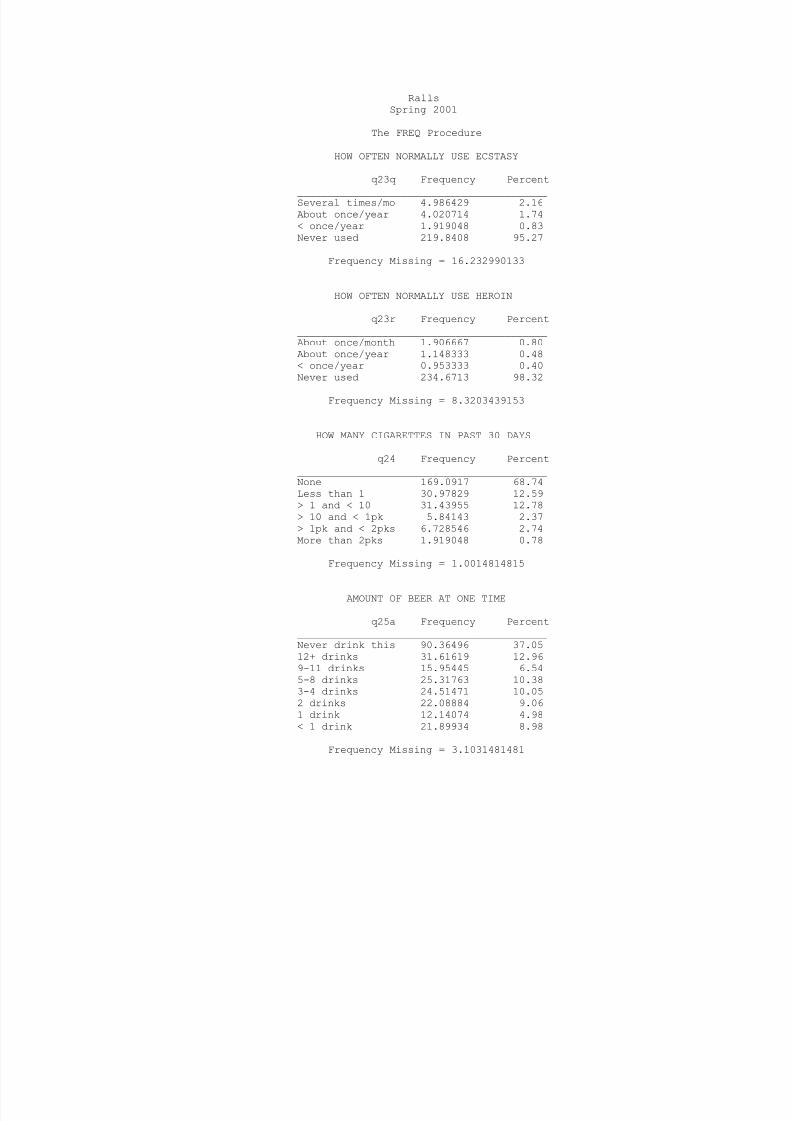
8/14/2019 CROSBY COUNTY - Ralls ISD - 2001 Texas School Survey of Drug and Alcohol Use
http://slidepdf.com/reader/full/crosby-county-ralls-isd-2001-texas-school-survey-of-drug-and-alcohol-use 113/144
RallsSpring 2001
The FREQ Procedure
HOW OFTEN NORMALLY USE ECSTASY
q23q Frequency Percent
_________________________________________Several times/mo 4.986429 2.16About once/year 4.020714 1.74< once/year 1.919048 0.83Never used 219.8408 95.27
Frequency Missing = 16.232990133
HOW OFTEN NORMALLY USE HEROIN
q23r Frequency Percent_________________________________________About once/month 1.906667 0.80About once/year 1.148333 0.48< once/year 0.953333 0.40Never used 234.6713 98.32
Frequency Missing = 8.3203439153
HOW MANY CIGARETTES IN PAST 30 DAYS
q24 Frequency Percent_________________________________________None 169.0917 68.74Less than 1 30.97829 12.59> 1 and < 10 31.43955 12.78> 10 and < 1pk 5.84143 2.37> 1pk and < 2pks 6.728546 2.74More than 2pks 1.919048 0.78
Frequency Missing = 1.0014814815
AMOUNT OF BEER AT ONE TIME
q25a Frequency Percent_________________________________________Never drink this 90.36496 37.0512+ drinks 31.61619 12.969-11 drinks 15.95445 6.545-8 drinks 25.31763 10.383-4 drinks 24.51471 10.052 drinks 22.08884 9.061 drink 12.14074 4.98< 1 drink 21.89934 8.98
Frequency Missing = 3.1031481481

8/14/2019 CROSBY COUNTY - Ralls ISD - 2001 Texas School Survey of Drug and Alcohol Use
http://slidepdf.com/reader/full/crosby-county-ralls-isd-2001-texas-school-survey-of-drug-and-alcohol-use 114/144
The frequencies have been weighted so that theanalysis reflects the distribution of students by grade
level in the district

8/14/2019 CROSBY COUNTY - Ralls ISD - 2001 Texas School Survey of Drug and Alcohol Use
http://slidepdf.com/reader/full/crosby-county-ralls-isd-2001-texas-school-survey-of-drug-and-alcohol-use 115/144
RallsSpring 2001
The FREQ Procedure
AMOUNT OF WINE COOLERS AT ONE TIME
q25b Frequency Percent
_________________________________________Never drink this 102.0098 41.6312+ drinks 22.73783 9.289-11 drinks 15.03119 6.135-8 drinks 20.84217 8.513-4 drinks 31.98749 13.052 drinks 19.36659 7.901 drink 18.03564 7.36< 1 drink 15.03447 6.14
Frequency Missing = 1.9548148148
AMOUNT OF WINE AT ONE TIME
q25c Frequency Percent_________________________________________
Never drink this 131.5302 54.6212+ drinks 5.805291 2.419-11 drinks 3.08545 1.285-8 drinks 5.732381 2.383-4 drinks 13.95643 5.802 drinks 20.22334 8.401 drink 28.89598 12.00< 1 drink 31.56995 13.11
Frequency Missing = 6.200979551
AMOUNT OF LIQUOR AT ONE TIME
q25d Frequency Percent_________________________________________Never drink this 110.8764 45.50
12+ drinks 28.56157 11.729-11 drinks 4.791429 1.975-8 drinks 14.41611 5.923-4 drinks 29.05768 11.922 drinks 11.81733 4.851 drink 18.16479 7.45< 1 drink 26.01654 10.68
Frequency Missing = 3.2981481481
BEERS, FIVE OR MORE AT ONE TIME
q26a Frequency Percent_________________________________________Never drink this 99.7621 41.05Never 5+ at time 29.19865 12.01
Every day 5.744762 2.36Several times/wk 16.87135 6.94Several times/mo 34.21929 14.08About once/month 24.87601 10.24< once/month 14.85426 6.11< once/year 17.51579 7.21
Frequency Missing = 3.9577777778

8/14/2019 CROSBY COUNTY - Ralls ISD - 2001 Texas School Survey of Drug and Alcohol Use
http://slidepdf.com/reader/full/crosby-county-ralls-isd-2001-texas-school-survey-of-drug-and-alcohol-use 116/144
The frequencies have been weighted so that theanalysis reflects the distribution of students by grade
level in the district

8/14/2019 CROSBY COUNTY - Ralls ISD - 2001 Texas School Survey of Drug and Alcohol Use
http://slidepdf.com/reader/full/crosby-county-ralls-isd-2001-texas-school-survey-of-drug-and-alcohol-use 117/144
RallsSpring 2001
The FREQ Procedure
WINE COOLERS, FIVE OR MORE AT ONE TIME
q26b Frequency Percent
_________________________________________Never drink this 109.2423 45.11Never 5+ at time 27.14717 11.21Several times/wk 11.79926 4.87Several times/mo 30.59564 12.63About once/month 18.40757 7.60< once/month 23.75069 9.81< once/year 21.21775 8.76
Frequency Missing = 4.8395767196
WINE, FIVE OR MORE AT ONE TIME
q26c Frequency Percent_________________________________________Never drink this 140.5459 58.27
Never 5+ at time 22.89569 9.49Every day 0.965714 0.40Several times/wk 6.929234 2.87Several times/mo 8.84791 3.67About once/month 11.73836 4.87< once/month 22.79736 9.45< once/year 26.4745 10.98
Frequency Missing = 5.8052910053
LIQUOR, FIVE OR MORE AT ONE TIME
q26d Frequency Percent_________________________________________Never drink this 115.5691 47.76Never 5+ at time 26.67857 11.03
Every day 2.86 1.18Several times/wk 17.79461 7.35Several times/mo 23.25871 9.61About once/month 14.84225 6.13< once/month 22.62749 9.35< once/year 18.33466 7.58
Frequency Missing = 5.0345767196
GET ALCOHOLIC BEVERAGES FROM HOME
q27a Frequency Percent_________________________________________Do not Drink 95.84752 39.43Never 67.68143 27.84Seldom 49.11225 20.20
Most of the Time 22.55953 9.28Always 7.907329 3.25
Frequency Missing = 3.8919319319

8/14/2019 CROSBY COUNTY - Ralls ISD - 2001 Texas School Survey of Drug and Alcohol Use
http://slidepdf.com/reader/full/crosby-county-ralls-isd-2001-texas-school-survey-of-drug-and-alcohol-use 118/144
The frequencies have been weighted so that theanalysis reflects the distribution of students by grade
level in the district

8/14/2019 CROSBY COUNTY - Ralls ISD - 2001 Texas School Survey of Drug and Alcohol Use
http://slidepdf.com/reader/full/crosby-county-ralls-isd-2001-texas-school-survey-of-drug-and-alcohol-use 119/144
RallsSpring 2001
The FREQ Procedure
GET ALCOHOLIC BEVERAGES FROM FRIENDS
q27b Frequency Percent
_________________________________________Do not Drink 75.59702 31.12Never 23.85553 9.82Seldom 45.16548 18.59Most of the Time 67.13598 27.63Always 31.18951 12.84
Frequency Missing = 4.0564814815
GET ALCOHOLIC BEVERAGES FROM A STORE
q27c Frequency Percent_________________________________________Do not Drink 78.65202 32.77Never 104.6884 43.62Seldom 30.60664 12.75
Most of the Time 12.49138 5.20Always 13.55413 5.65
Frequency Missing = 7.0074610325
GET ALCOHOLIC BEVERAGES AT PARTIES
q27d Frequency Percent_________________________________________Do not Drink 76.53797 31.78Never 25.79796 10.71Seldom 25.11135 10.43Most of the Time 55.76993 23.16Always 57.61226 23.92
Frequency Missing = 6.1705291005
GET ALCOHOLIC BEVERAGES FROM OTHER
q27e Frequency Percent_________________________________________Do not Drink 77.59707 32.96Never 60.47355 25.69Seldom 36.84302 15.65Most of the Time 28.25577 12.00Always 32.23548 13.69
Frequency Missing = 11.59510582
DANGEROUS FOR KIDS TO USE TOBACCO
q28a Frequency Percent___________________________________Very 115.2191 47.40Somewhat 84.62178 34.81Not very 25.26204 10.39Not at all 4.809498 1.98Don't know 13.17799 5.42
Frequency Missing = 3.9096296296

8/14/2019 CROSBY COUNTY - Ralls ISD - 2001 Texas School Survey of Drug and Alcohol Use
http://slidepdf.com/reader/full/crosby-county-ralls-isd-2001-texas-school-survey-of-drug-and-alcohol-use 120/144
The frequencies have been weighted so that theanalysis reflects the distribution of students by grade
level in the district
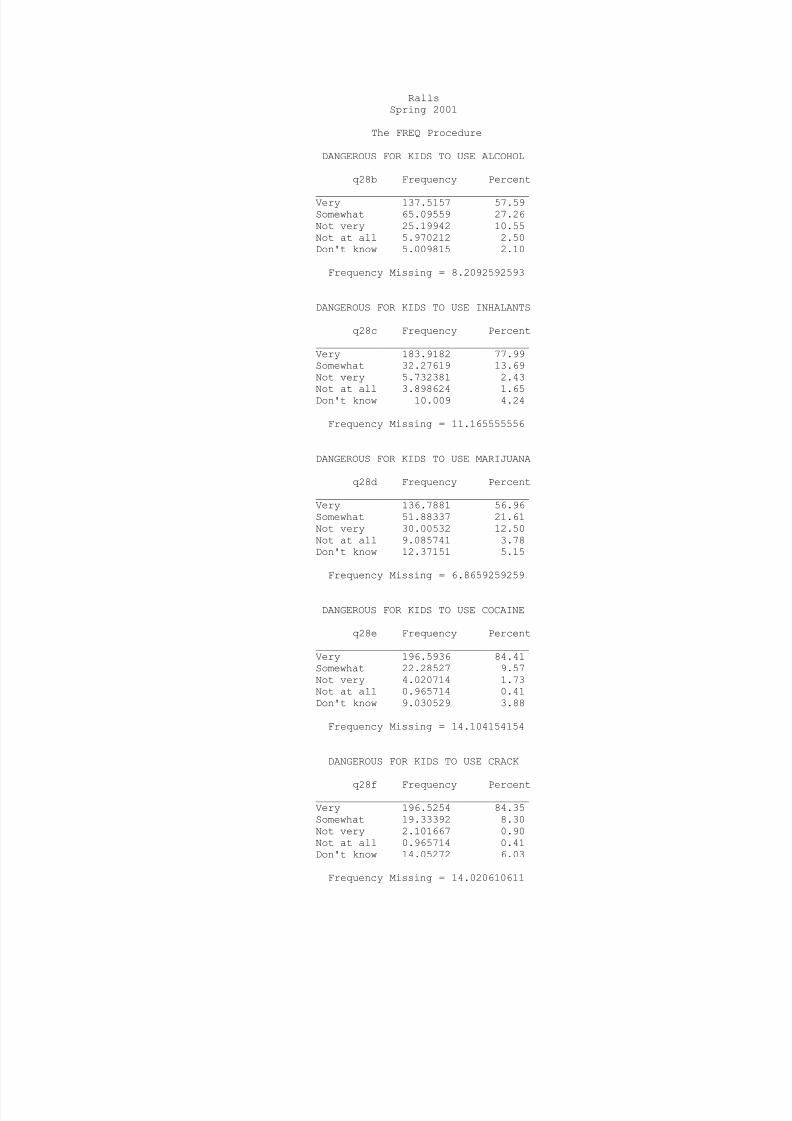
8/14/2019 CROSBY COUNTY - Ralls ISD - 2001 Texas School Survey of Drug and Alcohol Use
http://slidepdf.com/reader/full/crosby-county-ralls-isd-2001-texas-school-survey-of-drug-and-alcohol-use 121/144
RallsSpring 2001
The FREQ Procedure
DANGEROUS FOR KIDS TO USE ALCOHOL
q28b Frequency Percent
___________________________________Very 137.5157 57.59Somewhat 65.09559 27.26Not very 25.19942 10.55Not at all 5.970212 2.50Don't know 5.009815 2.10
Frequency Missing = 8.2092592593
DANGEROUS FOR KIDS TO USE INHALANTS
q28c Frequency Percent___________________________________Very 183.9182 77.99Somewhat 32.27619 13.69Not very 5.732381 2.43
Not at all 3.898624 1.65Don't know 10.009 4.24
Frequency Missing = 11.165555556
DANGEROUS FOR KIDS TO USE MARIJUANA
q28d Frequency Percent___________________________________Very 136.7881 56.96Somewhat 51.88337 21.61Not very 30.00532 12.50Not at all 9.085741 3.78Don't know 12.37151 5.15
Frequency Missing = 6.8659259259
DANGEROUS FOR KIDS TO USE COCAINE
q28e Frequency Percent___________________________________Very 196.5936 84.41Somewhat 22.28527 9.57Not very 4.020714 1.73Not at all 0.965714 0.41Don't know 9.030529 3.88
Frequency Missing = 14.104154154
DANGEROUS FOR KIDS TO USE CRACK
q28f Frequency Percent___________________________________Very 196.5254 84.35Somewhat 19.33392 8.30Not very 2.101667 0.90Not at all 0.965714 0.41Don't know 14.05272 6.03
Frequency Missing = 14.020610611

8/14/2019 CROSBY COUNTY - Ralls ISD - 2001 Texas School Survey of Drug and Alcohol Use
http://slidepdf.com/reader/full/crosby-county-ralls-isd-2001-texas-school-survey-of-drug-and-alcohol-use 122/144
The frequencies have been weighted so that theanalysis reflects the distribution of students by grade
level in the district

8/14/2019 CROSBY COUNTY - Ralls ISD - 2001 Texas School Survey of Drug and Alcohol Use
http://slidepdf.com/reader/full/crosby-county-ralls-isd-2001-texas-school-survey-of-drug-and-alcohol-use 123/144
RallsSpring 2001
The FREQ Procedure
DANGEROUS FOR KIDS TO USE ECSTASY
q28g Frequency Percent
___________________________________Very 193.9396 81.81Somewhat 17.41524 7.35Not very 4.80381 2.03Not at all 2.915212 1.23Don't know 17.9928 7.59
Frequency Missing = 9.9333068783
DANGEROUS FOR KIDS TO USE STEROIDS
q28h Frequency Percent___________________________________Very 182.7408 79.51Somewhat 27.449 11.94Not very 1.906667 0.83
Not at all 0.965714 0.42Don't know 16.78394 7.30
Frequency Missing = 17.153837409
DANGEROUS FOR KIDS TO USE HEROIN
q28i Frequency Percent___________________________________Very 206.5849 86.06Somewhat 15.46005 6.44Not very 1.937117 0.81Don't know 16.05569 6.69
Frequency Missing = 6.9622222222
USE MARIJUANA AS JOINTS
q29a Frequency Percent_________________________________________Never 130.1507 63.05Seldom 11.81696 5.72Half the time 19.14151 9.27Most of the time 26.76424 12.97Always 15.64305 7.58Don't know 2.902831 1.41
Frequency Missing = 40.580690691
USE MARIJUANA AS BLUNTS
q29b Frequency Percent_________________________________________Never 136.5163 66.07Seldom 21.09138 10.21Half the time 17.74434 8.59Most of the time 18.46691 8.94Always 9.892595 4.79Don't know 2.902831 1.40
Frequency Missing = 40.385690691

8/14/2019 CROSBY COUNTY - Ralls ISD - 2001 Texas School Survey of Drug and Alcohol Use
http://slidepdf.com/reader/full/crosby-county-ralls-isd-2001-texas-school-survey-of-drug-and-alcohol-use 124/144
The frequencies have been weighted so that theanalysis reflects the distribution of students by grade
level in the district

8/14/2019 CROSBY COUNTY - Ralls ISD - 2001 Texas School Survey of Drug and Alcohol Use
http://slidepdf.com/reader/full/crosby-county-ralls-isd-2001-texas-school-survey-of-drug-and-alcohol-use 125/144
RallsSpring 2001
The FREQ Procedure
USE MARIJUANA IN BONGS OR WATER PIPES
q29c Frequency Percent
_________________________________________Never 147.0508 70.92Seldom 22.88368 11.04Half the time 13.88818 6.70Most of the time 10.74926 5.18Always 9.667144 4.66Don't know 3.097831 1.49
Frequency Missing = 39.663124553
USE MARIJUANA IN PIPES
q29d Frequency Percent_________________________________________Never 137.0743 66.68Seldom 23.98183 11.67
Half the time 20.40056 9.92Most of the time 10.58471 5.15Always 10.63286 5.17Don't know 2.902831 1.41
Frequency Missing = 41.422939368
USE MARIJUANA OTHER WAYS
q29e Frequency Percent_________________________________________Never 155.4521 75.62Seldom 21.49752 10.46Half the time 7.912646 3.85Most of the time 8.933573 4.35Always 5.79291 2.82
Don't know 5.988282 2.91
Frequency Missing = 41.422939368
DAYS SKIPPED SINCE SEPTEMBER
q30a Frequency Percent_________________________________None 211.8227 87.871-3 days 23.30685 9.674-9 days 4.961667 2.0610+ days 0.965714 0.40
Frequency Missing = 5.943043043
DAYS ILL SINCE SEPTEMBER
q30b Frequency Percent_________________________________None 80.61358 33.301-3 days 124.2727 51.344-9 days 32.34492 13.3610+ days 4.827196 1.99
Frequency Missing = 4.9415615616

8/14/2019 CROSBY COUNTY - Ralls ISD - 2001 Texas School Survey of Drug and Alcohol Use
http://slidepdf.com/reader/full/crosby-county-ralls-isd-2001-texas-school-survey-of-drug-and-alcohol-use 126/144
The frequencies have been weighted so that theanalysis reflects the distribution of students by grade
level in the district

8/14/2019 CROSBY COUNTY - Ralls ISD - 2001 Texas School Survey of Drug and Alcohol Use
http://slidepdf.com/reader/full/crosby-county-ralls-isd-2001-texas-school-survey-of-drug-and-alcohol-use 127/144
RallsSpring 2001
The FREQ Procedure
OTHER DAYS MISSED SINCE SEPTEMBER
q30c Frequency Percent
_________________________________None 98.14826 41.211-3 days 118.2705 49.654-9 days 17.72701 7.4410+ days 4.038784 1.70
Frequency Missing = 8.8154239954
SENT TO PRINCIPAL/DEAN SINCE SEPTEMBER
q30d Frequency Percent_________________________________None 198.3567 81.611-3 days 38.94074 16.024-9 days 5.744762 2.36
Frequency Missing = 3.9577777778
SOMEONE CALLED HOME SINCE SEPTEMBER
q30e Frequency Percent_________________________________None 213.3755 88.901-3 days 24.68027 10.2810+ days 1.954815 0.81
Frequency Missing = 6.9893915344
IN TROUBLE FOR DRINKING SINCE SEPTEMBER
q30f Frequency Percent
_________________________________None 235.2316 97.161-3 days 5.927381 2.4510+ days 0.953333 0.39
Frequency Missing = 4.8877248677
IN TROUBLE FOR DRUG USE SINCE SEPTEMBER
q30g Frequency Percent_________________________________None 233.9812 97.921-3 days 4.020714 1.6810+ days 0.953333 0.40
Frequency Missing = 8.0447097097
DAYS SKIPPED IN PAST MONTH
q31a Frequency Percent_________________________________None 216.4429 89.851-3 days 23.49617 9.754-9 days 0.953333 0.40
Frequency Missing = 6.1075925926

8/14/2019 CROSBY COUNTY - Ralls ISD - 2001 Texas School Survey of Drug and Alcohol Use
http://slidepdf.com/reader/full/crosby-county-ralls-isd-2001-texas-school-survey-of-drug-and-alcohol-use 128/144
The frequencies have been weighted so that theanalysis reflects the distribution of students by grade
level in the district

8/14/2019 CROSBY COUNTY - Ralls ISD - 2001 Texas School Survey of Drug and Alcohol Use
http://slidepdf.com/reader/full/crosby-county-ralls-isd-2001-texas-school-survey-of-drug-and-alcohol-use 129/144
RallsSpring 2001
The FREQ Procedure
DAYS ILL IN PAST MONTH
q31b Frequency Percent
_________________________________None 144.7008 60.011-3 days 88.31472 36.634-9 days 6.170529 2.5610+ days 1.937117 0.80
Frequency Missing = 5.8768253968
OTHER DAYS MISSED IN PAST MONTH
q31c Frequency Percent_________________________________None 161.3767 67.471-3 days 68.10607 28.484-9 days 7.748468 3.2410+ days 1.937117 0.81
Frequency Missing = 7.8316402116
SENT TO PRINCIPAL/DEAN IN PAST MONTH
q31d Frequency Percent_________________________________None 218.2586 90.171-3 days 18.01225 7.444-9 days 3.856165 1.5910+ days 1.931429 0.80
Frequency Missing = 4.9415615616
SOMEONE CALLED HOME IN PAST MONTH
q31e Frequency Percent_________________________________None 232.1542 95.921-3 days 8.92082 3.6910+ days 0.965714 0.40
Frequency Missing = 4.9592592593
TROUBLE WITH FRIENDS BECAUSE OF DRINKING
q32a Frequency Percent__________________________________None 212.9189 90.391-3 times 21.67379 9.204-9 times 0.965714 0.41
Frequency Missing = 11.441561562

8/14/2019 CROSBY COUNTY - Ralls ISD - 2001 Texas School Survey of Drug and Alcohol Use
http://slidepdf.com/reader/full/crosby-county-ralls-isd-2001-texas-school-survey-of-drug-and-alcohol-use 130/144
The frequencies have been weighted so that theanalysis reflects the distribution of students by grade
level in the district
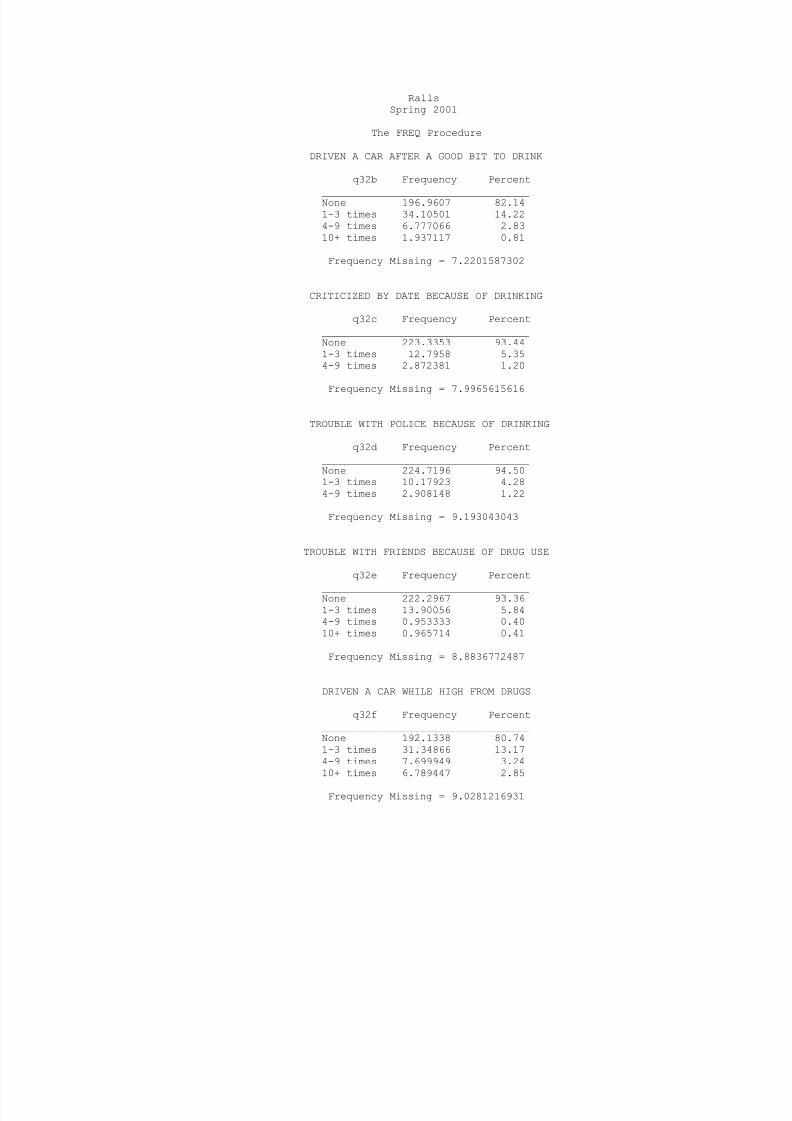
8/14/2019 CROSBY COUNTY - Ralls ISD - 2001 Texas School Survey of Drug and Alcohol Use
http://slidepdf.com/reader/full/crosby-county-ralls-isd-2001-texas-school-survey-of-drug-and-alcohol-use 131/144
RallsSpring 2001
The FREQ Procedure
DRIVEN A CAR AFTER A GOOD BIT TO DRINK
q32b Frequency Percent
__________________________________None 196.9607 82.141-3 times 34.10501 14.224-9 times 6.777066 2.8310+ times 1.937117 0.81
Frequency Missing = 7.2201587302
CRITICIZED BY DATE BECAUSE OF DRINKING
q32c Frequency Percent__________________________________None 223.3353 93.441-3 times 12.7958 5.354-9 times 2.872381 1.20
Frequency Missing = 7.9965615616
TROUBLE WITH POLICE BECAUSE OF DRINKING
q32d Frequency Percent__________________________________None 224.7196 94.501-3 times 10.17923 4.284-9 times 2.908148 1.22
Frequency Missing = 9.193043043
TROUBLE WITH FRIENDS BECAUSE OF DRUG USE
q32e Frequency Percent
__________________________________None 222.2967 93.361-3 times 13.90056 5.844-9 times 0.953333 0.4010+ times 0.965714 0.41
Frequency Missing = 8.8836772487
DRIVEN A CAR WHILE HIGH FROM DRUGS
q32f Frequency Percent__________________________________None 192.1338 80.741-3 times 31.34866 13.174-9 times 7.699949 3.2410+ times 6.789447 2.85
Frequency Missing = 9.0281216931

8/14/2019 CROSBY COUNTY - Ralls ISD - 2001 Texas School Survey of Drug and Alcohol Use
http://slidepdf.com/reader/full/crosby-county-ralls-isd-2001-texas-school-survey-of-drug-and-alcohol-use 132/144
The frequencies have been weighted so that theanalysis reflects the distribution of students by grade
level in the district
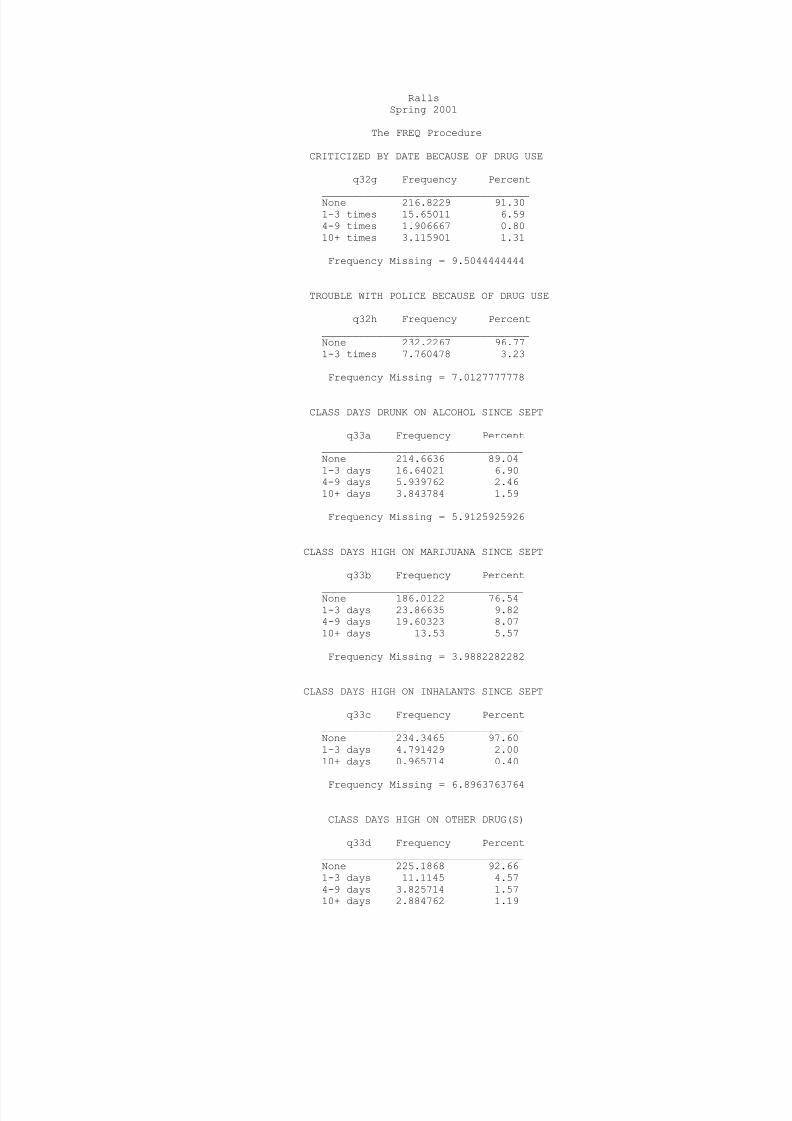
8/14/2019 CROSBY COUNTY - Ralls ISD - 2001 Texas School Survey of Drug and Alcohol Use
http://slidepdf.com/reader/full/crosby-county-ralls-isd-2001-texas-school-survey-of-drug-and-alcohol-use 133/144
RallsSpring 2001
The FREQ Procedure
CRITICIZED BY DATE BECAUSE OF DRUG USE
q32g Frequency Percent
__________________________________None 216.8229 91.301-3 times 15.65011 6.594-9 times 1.906667 0.8010+ times 3.115901 1.31
Frequency Missing = 9.5044444444
TROUBLE WITH POLICE BECAUSE OF DRUG USE
q32h Frequency Percent__________________________________None 232.2267 96.771-3 times 7.760478 3.23
Frequency Missing = 7.0127777778
CLASS DAYS DRUNK ON ALCOHOL SINCE SEPT
q33a Frequency Percent_________________________________None 214.6636 89.041-3 days 16.64021 6.904-9 days 5.939762 2.4610+ days 3.843784 1.59
Frequency Missing = 5.9125925926
CLASS DAYS HIGH ON MARIJUANA SINCE SEPT
q33b Frequency Percent
_________________________________None 186.0122 76.541-3 days 23.86635 9.824-9 days 19.60323 8.0710+ days 13.53 5.57
Frequency Missing = 3.9882282282
CLASS DAYS HIGH ON INHALANTS SINCE SEPT
q33c Frequency Percent_________________________________None 234.3465 97.601-3 days 4.791429 2.0010+ days 0.965714 0.40
Frequency Missing = 6.8963763764
CLASS DAYS HIGH ON OTHER DRUG(S)
q33d Frequency Percent_________________________________None 225.1868 92.661-3 days 11.1145 4.574-9 days 3.825714 1.5710+ days 2.884762 1.19

8/14/2019 CROSBY COUNTY - Ralls ISD - 2001 Texas School Survey of Drug and Alcohol Use
http://slidepdf.com/reader/full/crosby-county-ralls-isd-2001-texas-school-survey-of-drug-and-alcohol-use 134/144
Frequency Missing = 3.9882282282
The frequencies have been weighted so that theanalysis reflects the distribution of students by grade
level in the district
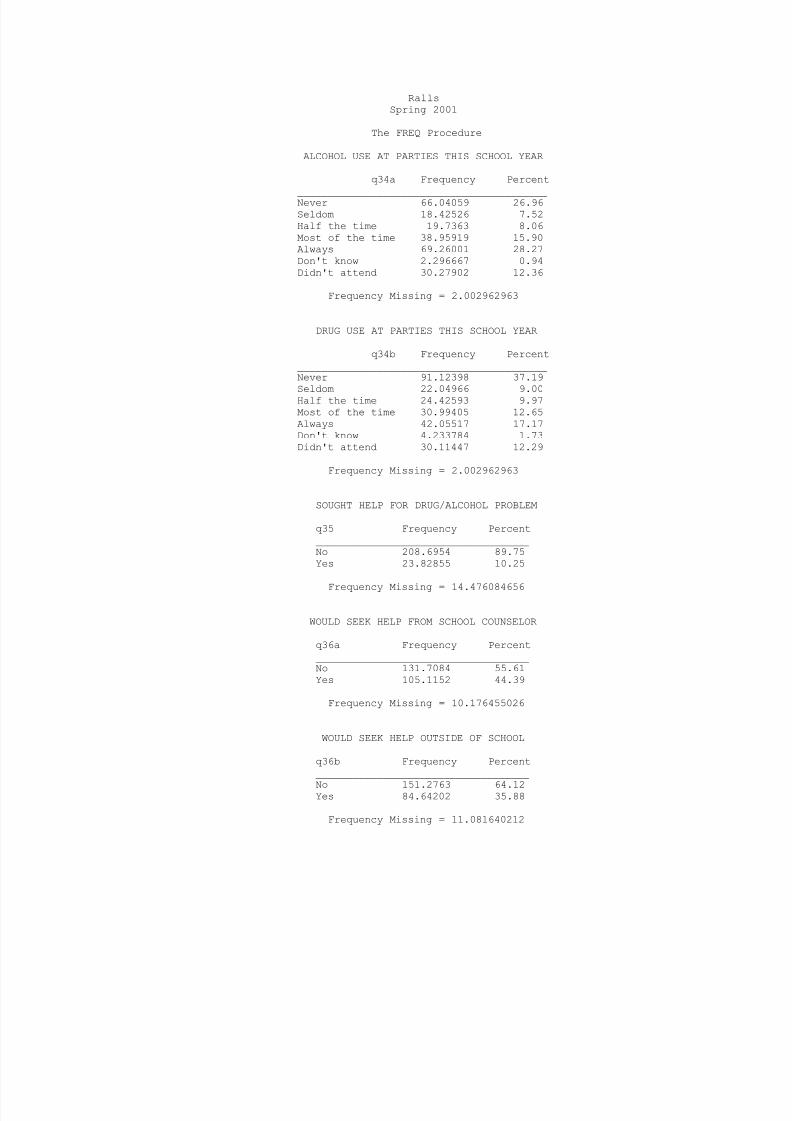
8/14/2019 CROSBY COUNTY - Ralls ISD - 2001 Texas School Survey of Drug and Alcohol Use
http://slidepdf.com/reader/full/crosby-county-ralls-isd-2001-texas-school-survey-of-drug-and-alcohol-use 135/144
RallsSpring 2001
The FREQ Procedure
ALCOHOL USE AT PARTIES THIS SCHOOL YEAR
q34a Frequency Percent
_________________________________________Never 66.04059 26.96Seldom 18.42526 7.52Half the time 19.7363 8.06Most of the time 38.95919 15.90Always 69.26001 28.27Don't know 2.296667 0.94Didn't attend 30.27902 12.36
Frequency Missing = 2.002962963
DRUG USE AT PARTIES THIS SCHOOL YEAR
q34b Frequency Percent_________________________________________Never 91.12398 37.19
Seldom 22.04966 9.00Half the time 24.42593 9.97Most of the time 30.99405 12.65Always 42.05517 17.17Don't know 4.233784 1.73Didn't attend 30.11447 12.29
Frequency Missing = 2.002962963
SOUGHT HELP FOR DRUG/ALCOHOL PROBLEM
q35 Frequency Percent___________________________________No 208.6954 89.75Yes 23.82855 10.25
Frequency Missing = 14.476084656
WOULD SEEK HELP FROM SCHOOL COUNSELOR
q36a Frequency Percent___________________________________No 131.7084 55.61Yes 105.1152 44.39
Frequency Missing = 10.176455026
WOULD SEEK HELP OUTSIDE OF SCHOOL
q36b Frequency Percent___________________________________
No 151.2763 64.12Yes 84.64202 35.88
Frequency Missing = 11.081640212

8/14/2019 CROSBY COUNTY - Ralls ISD - 2001 Texas School Survey of Drug and Alcohol Use
http://slidepdf.com/reader/full/crosby-county-ralls-isd-2001-texas-school-survey-of-drug-and-alcohol-use 136/144
The frequencies have been weighted so that theanalysis reflects the distribution of students by grade
level in the district

8/14/2019 CROSBY COUNTY - Ralls ISD - 2001 Texas School Survey of Drug and Alcohol Use
http://slidepdf.com/reader/full/crosby-county-ralls-isd-2001-texas-school-survey-of-drug-and-alcohol-use 137/144
RallsSpring 2001
The FREQ Procedure
WOULD SEEK HELP FROM OTHER COUNSELOR
q36c Frequency Percent
___________________________________No 152.6305 64.95Yes 82.38268 35.05
Frequency Missing = 11.986825397
WOULD SEEK HELP FROM PARENTS
q36d Frequency Percent___________________________________No 104.9074 44.45Yes 131.1073 55.55
Frequency Missing = 10.985343915
WOULD SEEK HELP FROM A MEDICAL DOCTOR
q36e Frequency Percent___________________________________No 159.0957 67.42Yes 76.87085 32.58
Frequency Missing = 11.033492063
WOULD SEEK HELP FROM FRIENDS
q36f Frequency Percent___________________________________No 67.704 28.46Yes 170.2173 71.54
Frequency Missing = 9.0786772487
WOULD SEEK HELP FROM ANOTHER ADULT
q36g Frequency Percent___________________________________No 92.6407 38.95Yes 145.2325 61.05
Frequency Missing = 9.1268253968
WOULD NOT SEEK HELP
q36h Frequency Percent___________________________________
No 187.6334 80.88Yes 44.36823 19.12
Frequency Missing = 14.998334048

8/14/2019 CROSBY COUNTY - Ralls ISD - 2001 Texas School Survey of Drug and Alcohol Use
http://slidepdf.com/reader/full/crosby-county-ralls-isd-2001-texas-school-survey-of-drug-and-alcohol-use 138/144
The frequencies have been weighted so that theanalysis reflects the distribution of students by grade
level in the district
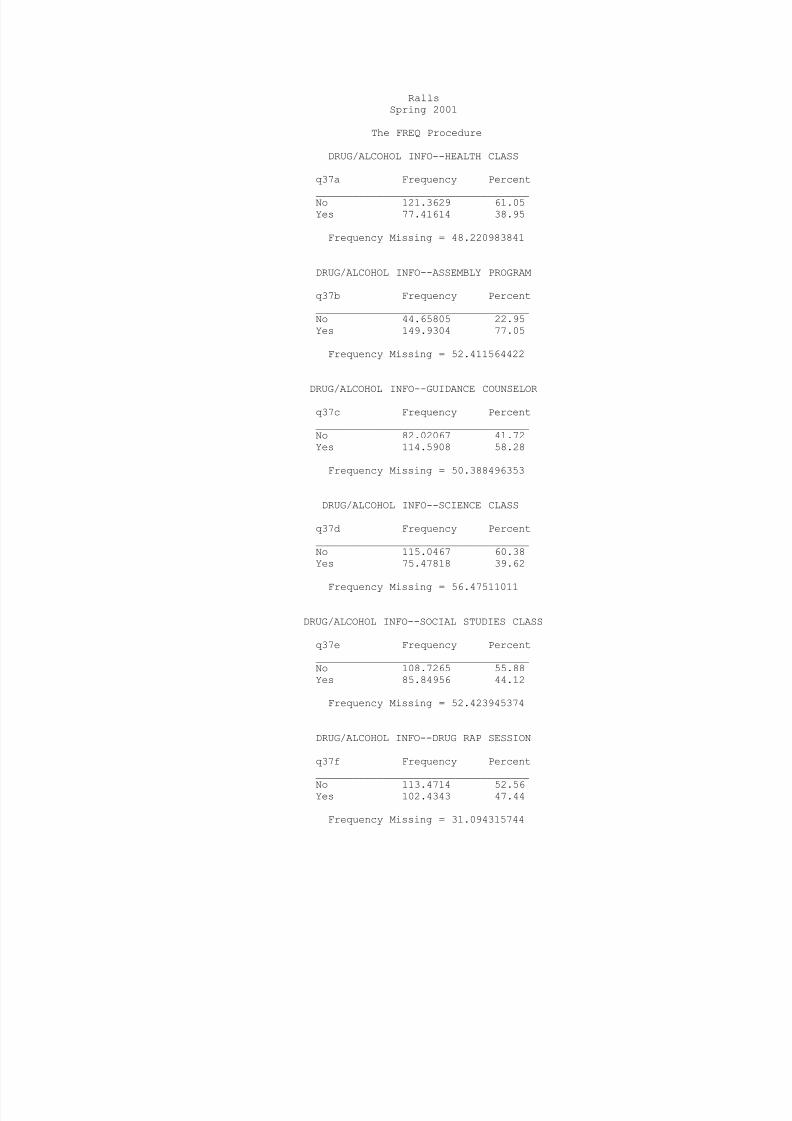
8/14/2019 CROSBY COUNTY - Ralls ISD - 2001 Texas School Survey of Drug and Alcohol Use
http://slidepdf.com/reader/full/crosby-county-ralls-isd-2001-texas-school-survey-of-drug-and-alcohol-use 139/144
RallsSpring 2001
The FREQ Procedure
DRUG/ALCOHOL INFO--HEALTH CLASS
q37a Frequency Percent
___________________________________No 121.3629 61.05Yes 77.41614 38.95
Frequency Missing = 48.220983841
DRUG/ALCOHOL INFO--ASSEMBLY PROGRAM
q37b Frequency Percent___________________________________No 44.65805 22.95Yes 149.9304 77.05
Frequency Missing = 52.411564422
DRUG/ALCOHOL INFO--GUIDANCE COUNSELOR
q37c Frequency Percent___________________________________No 82.02067 41.72Yes 114.5908 58.28
Frequency Missing = 50.388496353
DRUG/ALCOHOL INFO--SCIENCE CLASS
q37d Frequency Percent___________________________________No 115.0467 60.38Yes 75.47818 39.62
Frequency Missing = 56.47511011
DRUG/ALCOHOL INFO--SOCIAL STUDIES CLASS
q37e Frequency Percent___________________________________No 108.7265 55.88Yes 85.84956 44.12
Frequency Missing = 52.423945374
DRUG/ALCOHOL INFO--DRUG RAP SESSION
q37f Frequency Percent___________________________________
No 113.4714 52.56Yes 102.4343 47.44
Frequency Missing = 31.094315744

8/14/2019 CROSBY COUNTY - Ralls ISD - 2001 Texas School Survey of Drug and Alcohol Use
http://slidepdf.com/reader/full/crosby-county-ralls-isd-2001-texas-school-survey-of-drug-and-alcohol-use 140/144
The frequencies have been weighted so that theanalysis reflects the distribution of students by grade
level in the district

8/14/2019 CROSBY COUNTY - Ralls ISD - 2001 Texas School Survey of Drug and Alcohol Use
http://slidepdf.com/reader/full/crosby-county-ralls-isd-2001-texas-school-survey-of-drug-and-alcohol-use 141/144
RallsSpring 2001
The FREQ Procedure
DRUG/ALCOHOL INFO--INVITED SCHOOL GUEST
q37g Frequency Percent
___________________________________No 74.62173 37.63Yes 123.6636 62.37
Frequency Missing = 48.71463249
DRUG/ALCOHOL INFO--OTHER SCHOOL SOURCE
q37h Frequency Percent___________________________________No 103.1049 51.91Yes 95.50998 48.09
Frequency Missing = 48.38516159
PARENTS FEEL ABOUT KIDS SMOKING CIGARET
q38a Frequency Percent__________________________________________Strong disapprove 147.4637 61.00Mild disapprove 33.02612 13.66Neither 30.15583 12.47Mildly approve 5.818044 2.41Strongly approve 4.233784 1.75Don't know 21.03717 8.70
Frequency Missing = 5.2653439153
PARENTS FEEL ABOUT KIDS DRINKING BEER
q38b Frequency Percent
__________________________________________Strong disapprove 152.2106 63.22Mild disapprove 29.2004 12.13Neither 28.11672 11.68Mildly approve 9.025212 3.75Strongly approve 2.132117 0.89Don't know 20.09622 8.35
Frequency Missing = 6.2186772487
PARENTS FEEL ABOUT KIDS USING MARIJUANA
q38c Frequency Percent__________________________________________Strong disapprove 183.9741 76.41Mild disapprove 15.11016 6.28
Neither 12.479 5.18Mildly approve 5.848494 2.43Strongly approve 3.298148 1.37Don't know 20.07146 8.34
Frequency Missing = 6.2186772487

8/14/2019 CROSBY COUNTY - Ralls ISD - 2001 Texas School Survey of Drug and Alcohol Use
http://slidepdf.com/reader/full/crosby-county-ralls-isd-2001-texas-school-survey-of-drug-and-alcohol-use 142/144
The frequencies have been weighted so that theanalysis reflects the distribution of students by grade
level in the district
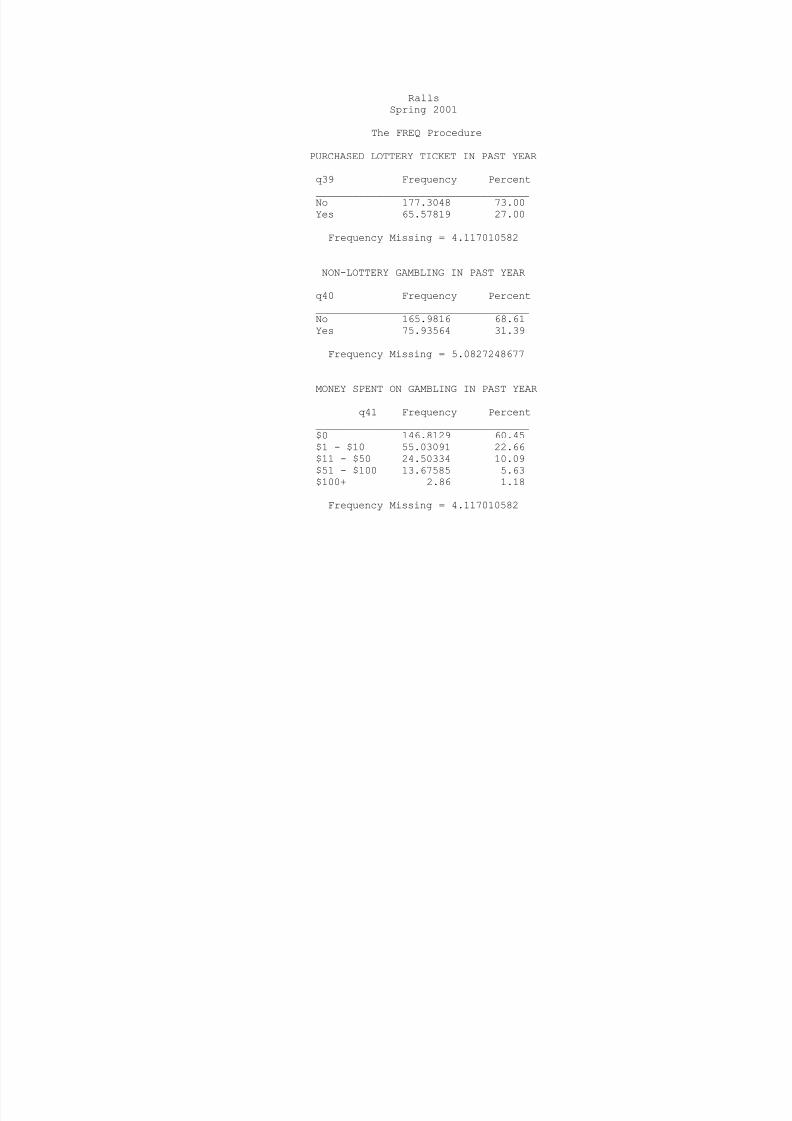
8/14/2019 CROSBY COUNTY - Ralls ISD - 2001 Texas School Survey of Drug and Alcohol Use
http://slidepdf.com/reader/full/crosby-county-ralls-isd-2001-texas-school-survey-of-drug-and-alcohol-use 143/144
RallsSpring 2001
The FREQ Procedure
PURCHASED LOTTERY TICKET IN PAST YEAR
q39 Frequency Percent
___________________________________No 177.3048 73.00Yes 65.57819 27.00
Frequency Missing = 4.117010582
NON-LOTTERY GAMBLING IN PAST YEAR
q40 Frequency Percent___________________________________No 165.9816 68.61Yes 75.93564 31.39
Frequency Missing = 5.0827248677
MONEY SPENT ON GAMBLING IN PAST YEAR
q41 Frequency Percent___________________________________$0 146.8129 60.45$1 - $10 55.03091 22.66$11 - $50 24.50334 10.09$51 - $100 13.67585 5.63$100+ 2.86 1.18
Frequency Missing = 4.117010582

8/14/2019 CROSBY COUNTY - Ralls ISD - 2001 Texas School Survey of Drug and Alcohol Use
http://slidepdf.com/reader/full/crosby-county-ralls-isd-2001-texas-school-survey-of-drug-and-alcohol-use 144/144
The frequencies have been weighted so that theanalysis reflects the distribution of students by grade
level in the district