Embed Size (px)
Citation preview
Bogota, 9 Nov. 2017 1
Crop Acreage Measurement by using remote sensing in Chinese Agricultural Census ’ 2016
ZHOU [email protected]
Department of Rural SurveysNational Bureau of Statistics of China
The Third Chinese agricultural census has been conducted at the end of 2016, which is the year ended with 6 in every ten years. The reference time is December 31 24pm, and the reference period is year 2016.
Chinese agricultural census ’2016 is included a module of crop acreage measurement by using remote sensing for major crops, covering 31 provinces (municipalities, autonomous regions) throughout the mainland China. It mainly includes 4 aspects of this work as follows.
2
Crop Acreage Measurement by Using Remote Sensing in Chinese Agricultural Census ’2016

(1) Cropland interpretation. At provincial level, Land use was visually interpreted by using Chinese high resolution satellite images (GF‐1/2 & ZY‐3) to distinguish cropland and then delimitate them into each field with recognizable demarcation lines, in order to build (update) area frame and recognize the plots of cropland.
(2) Area frame construction and sample selection. Area frame was constructed by cropland extracted from either year 2015‐2016 satellite images or updated results of Chinese Second Land Survey conducted by the Ministry of Land and Resources in year 2007‐2009. A two stage sampling was adopted to select sample villages firstly and then sample grids.
3
Crop Acreage Measurement by Using Remote Sensing in Chinese Agricultural Census ’2016 (cont’d)

(3) Collecting and interpreting sample information. For sample grids, a field survey for crop acreage was conducted. For sample villages, crop types were visually interpreted by each plot by using Chinese high resolution satellite images (GF‐1&GF‐2 etc.). Typically each province had around 300 sample villages, and each village had 3 sample grids.
(4) Crop classification. At provincial level, crop classification was manipulated by using moderate resolution satellite (GF‐1 16m CCD images, and sometimes Landsat 8 OLI) to obtain crop planted pattern.
4
Crop Acreage Measurement by Using Remote Sensing in Chinese Agricultural Census ’2016 (cont’d)

5
Acquisition of Remote Sensing Satellite Images
• For high resolution satellite images, mostly from Chinese domestic satellites available for government users, such as optical sensor satellites of GF‐1, GF‐2, ZY‐3, CBERS‐04 and complemented by commercial satellite BJ‐2 etc.
• For moderate resolution satellite images, GF‐1 is the main source, complemented by USA Landsat 8 (OLI) and EU Sentinel 2A.
6
Source of Satellite imagery

7
Chinese Remote Sensing Satellites for Earth Observation
GF1/2…

8
Satellite GF‐1 (Gaofen‐1) Parameters
Main sensor 2╳High Resolution Cameras 4╳Wide Field of View Cameras
Spatial resolution Pan 2 m; MS 8 m (nadir) MS 16 m (nadir)
Swath width 70km with two cameras 800km with 4 cameras
Data Quantization 10 bit 10 bit
Revisit capability 4 days (roll near 35º) 4 days
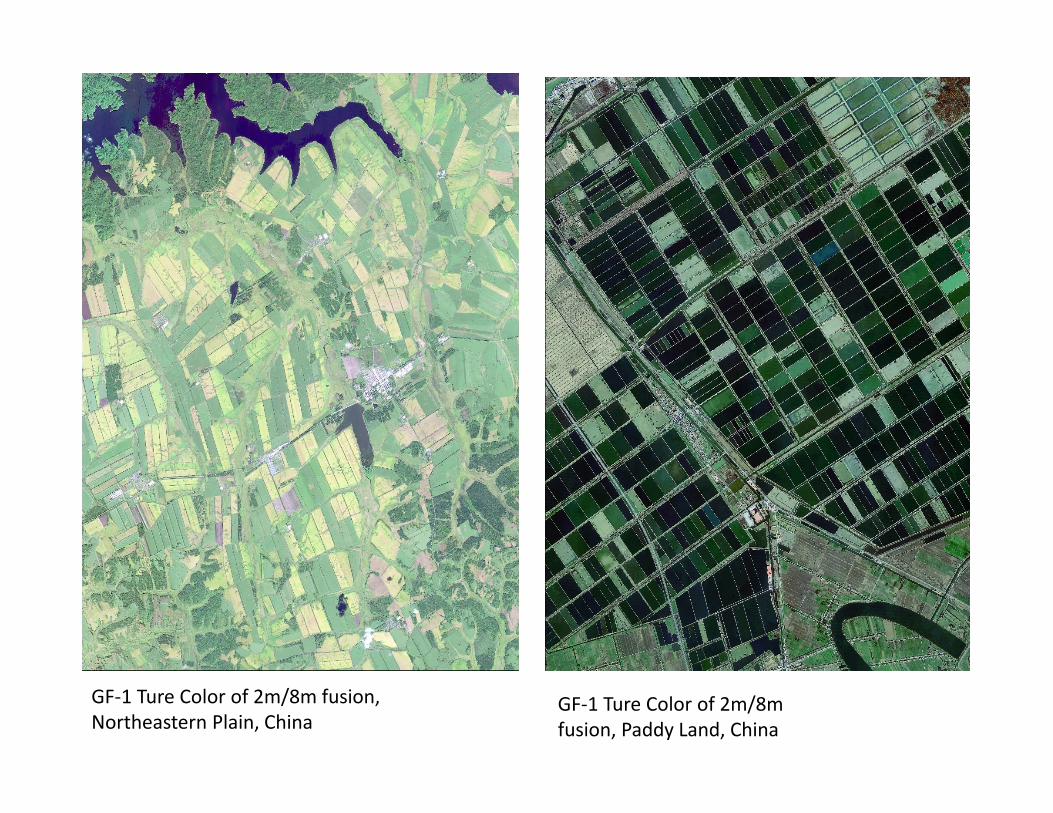
GF‐1 Ture Color of 2m/8m fusion, Northeastern Plain, China
GF‐1 Ture Color of 2m/8m fusion, Paddy Land, China

10
Satellite GF‐2 (Gaofen‐2) Parameters
Main sensor 2╳High Resolution Cameras
Spatial resolution Pan 0.8 m; MS 3.2 m
Swath width 45 km with two cameras
Data Quantization 10 bit
Revisit capability 5 days (roll near 35º)

GF‐2 Ture Color of 1m/4m fusion, River Impact landform in Henan, China
GF‐2 Ture Color of 1m/4m fusion, Pond landform in Henan, China

12
Satellite ZY‐3 (Resource‐3) Parameters
Main sensor 3 Panchromatic Cameras(Forward, Nadir, Backward)
1 Multi‐spectrum Cameras
Spatial resolution Pan 2.5/2.1/2.5 m MS 5.8 m
Swath width 51 km 51 km
Data Quantization 10 bit 10 bit
Revisit capability 3‐5 days (roll near 32º) 3 days (roll near 32º)
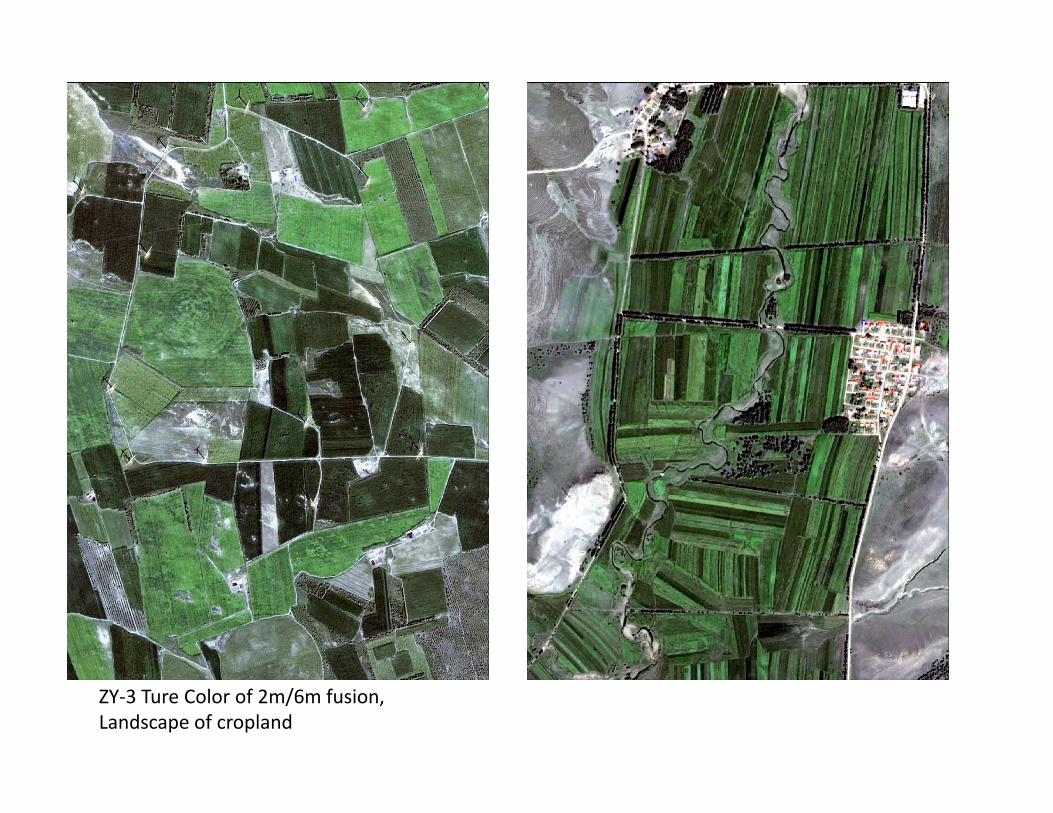
ZY‐3 Ture Color of 2m/6m fusion, Landscape of cropland

14
Satellite BJ‐2 (Beijing‐2) Parameters
Main sensor 1╳High Resolution Cameras
Spatial resolution Pan 0.8 m; MS 3.2 m
Swath width 24 km with two cameras
Data Quantization 10 bit
Revisit capability 1‐2 days (roll near 45º)
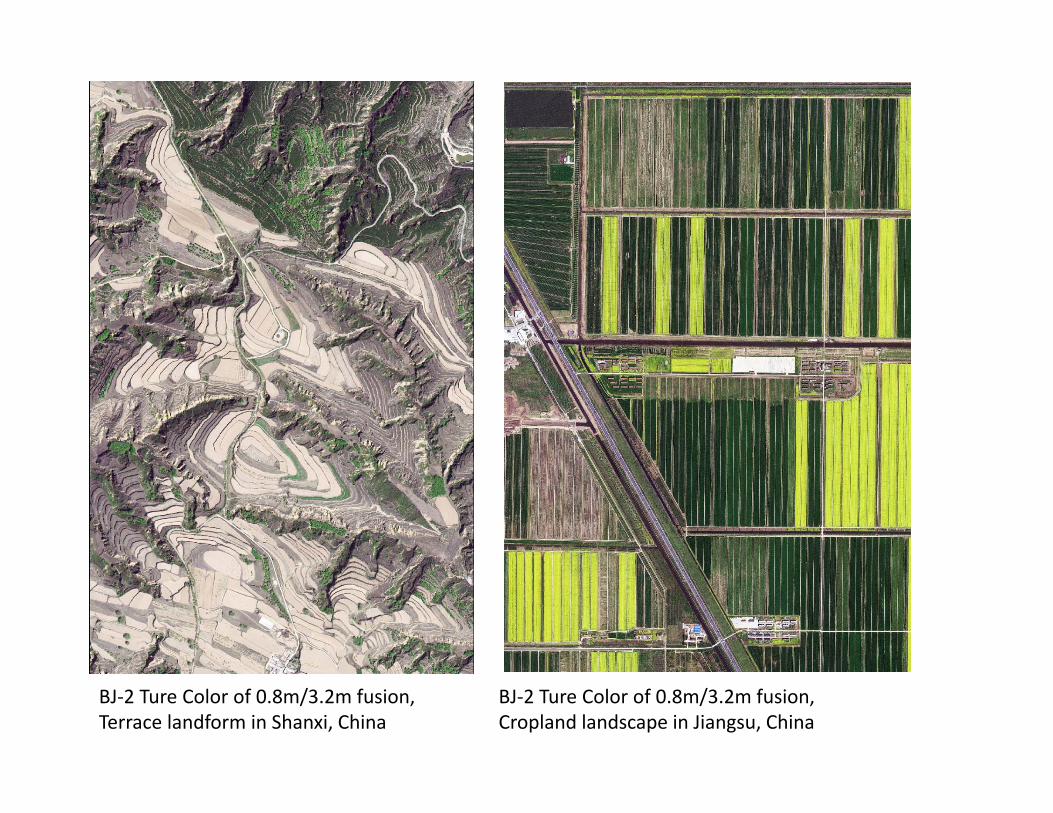
BJ‐2 Ture Color of 0.8m/3.2m fusion, Terrace landform in Shanxi, China
BJ‐2 Ture Color of 0.8m/3.2m fusion, Cropland landscape in Jiangsu, China
16
Cropland Extraction and Area Frame Construction
17
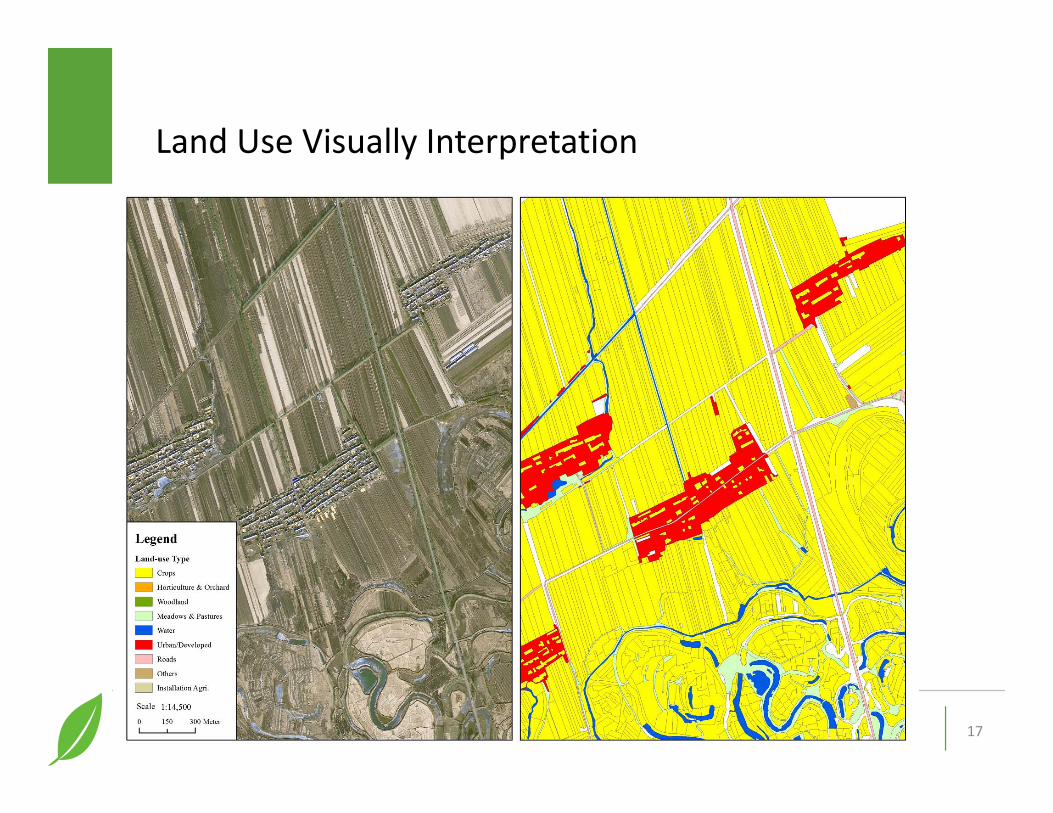
Land Use Visually Interpretation

• Cropland extracted from the visual interpretation of high resolution satellite images, was used to construct or update area frame.
• A two stage sampling is adopted, sample villages were selected by PPS method, and sample grids were selected by SRS method.
18
Area Frame Construction and Sampling

19
Field Survey for Sample Grids
NavigationTask Assignment
Base Map Feature Capture
PDA used to navigate and collect info.
Identity Crop Types
20
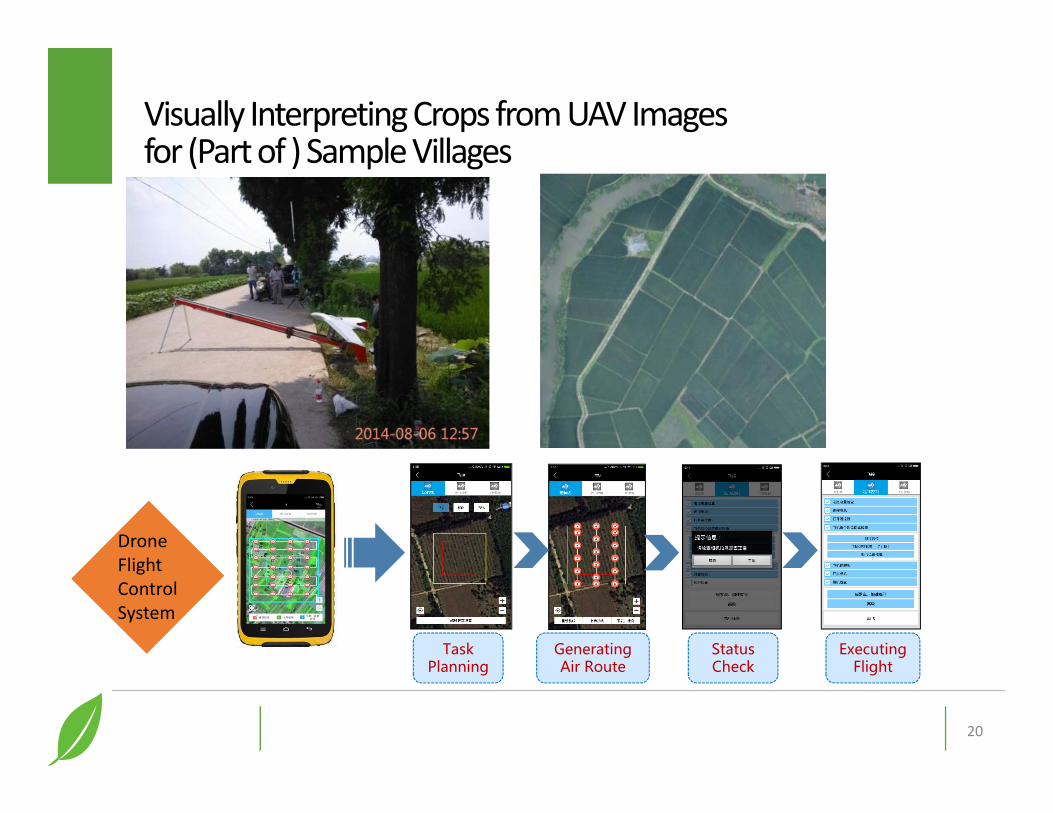
Visually Interpreting Crops from UAV Images for (Part of ) Sample Villages
Task Planning
Generating Air Route
Status Check
Executing Flight
DroneFlight Control System
21
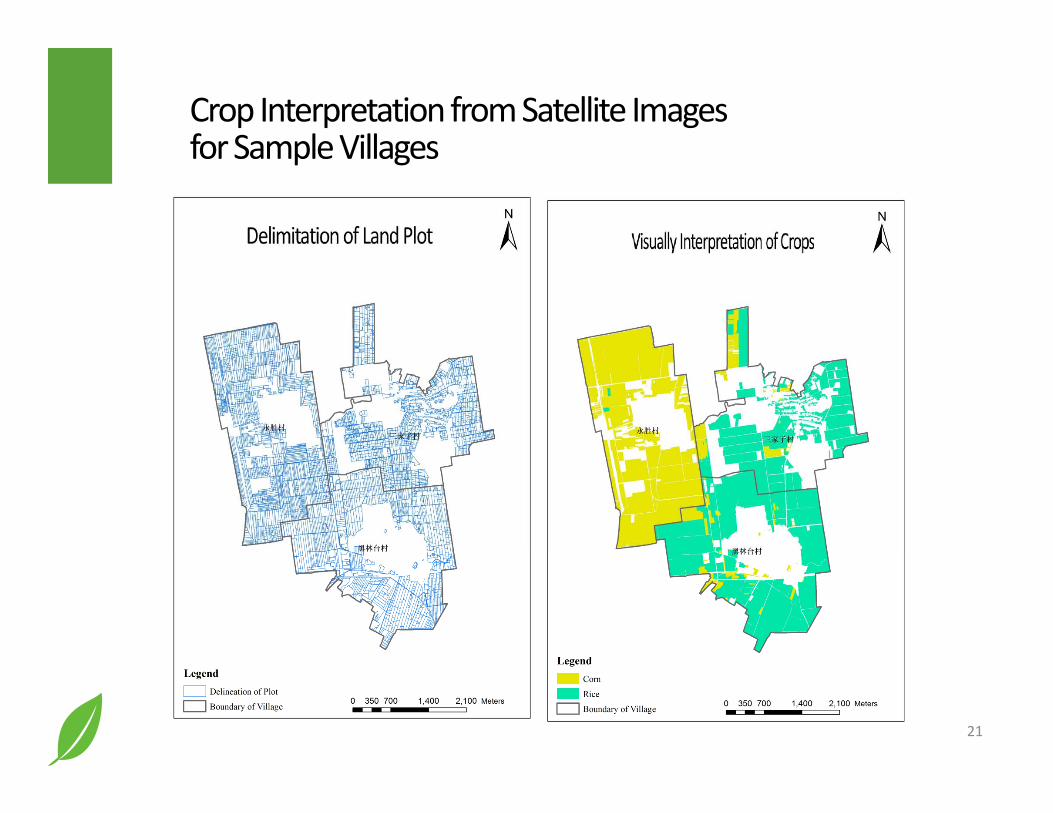
Crop Interpretation from Satellite Imagesfor Sample Villages
22
Crop Classification from Moderate Resolution Images
• GF‐1 16m CCD images, and sometimes Landsat 8 OLI and Sentinel 2A.
• For crop classification in Agricultural Census’2016, multi‐temporal especially in key phenological calendar of crop growth’s Digital Orthophoto Map (DOM) images which covered the entire province was expected.
23
Source of Moderate Resolution Images

Landsat 8 OLI
25
Improvement of Crop Acreage Estimation by Using Small Area Estimation Model
According to Stephen V. Stehman (2009), for crop acreage estimation we have (1) director estimator from sample expansion,(2) mapping‐based confusion matrix area estimator,(3) model assisted estimator, (4) others, like survey sampling calibration estimators, small‐area estimator (SAE).
In agricultural census, we had survey data from field observation and full‐coverage classified crops as auxiliary information for entire population (e.g province), small area estimation (SAE) provides an improved approach of crop acreage estimation both at population and sub‐population (e.g county) levels by combining the crop classification data with the data of sample survey.
26
Methods of Crop Acreage Estimation
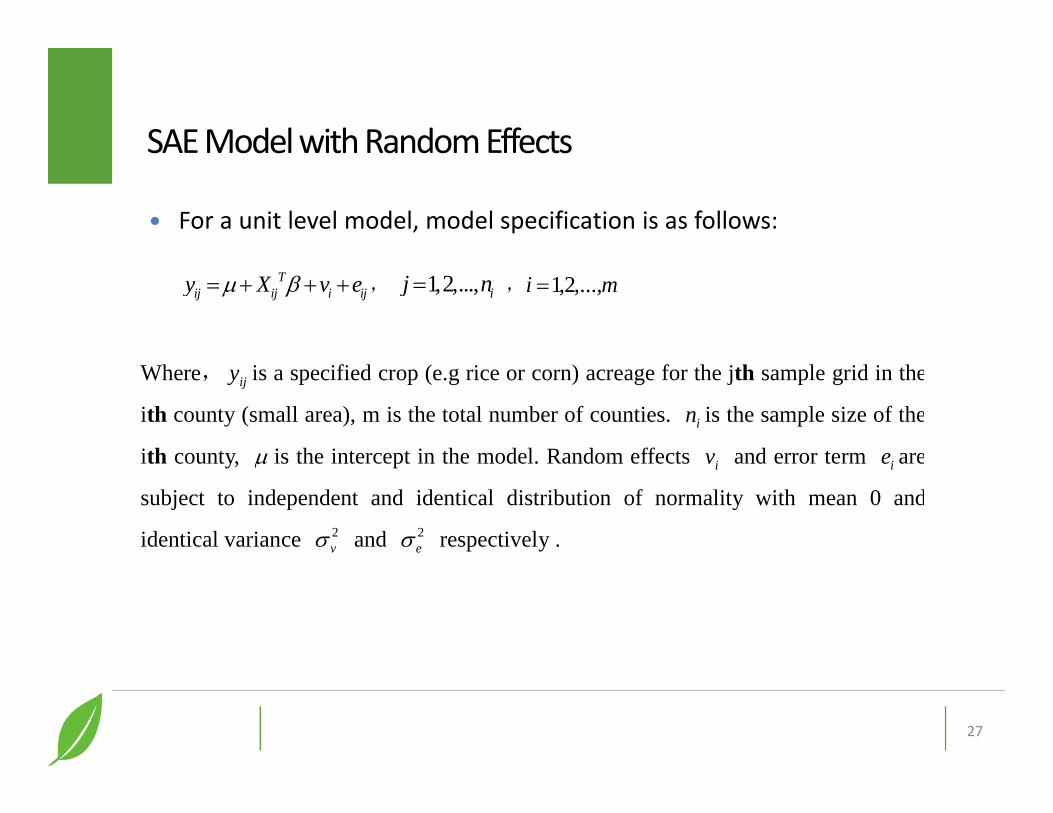
For a unit level model, model specification is as follows:
27
SAE Model with Random Effects
Tij ij i ijy X v e , 1,2,..., ij n , mi ,...,2,1
Where, ijy is a specified crop (e.g rice or corn) acreage for the jth sample grid in the
ith county (small area), m is the total number of counties. in is the sample size of the
ith county, is the intercept in the model. Random effects iv and error term ie are
subject to independent and identical distribution of normality with mean 0 and
identical variance 2v and 2
e respectively .
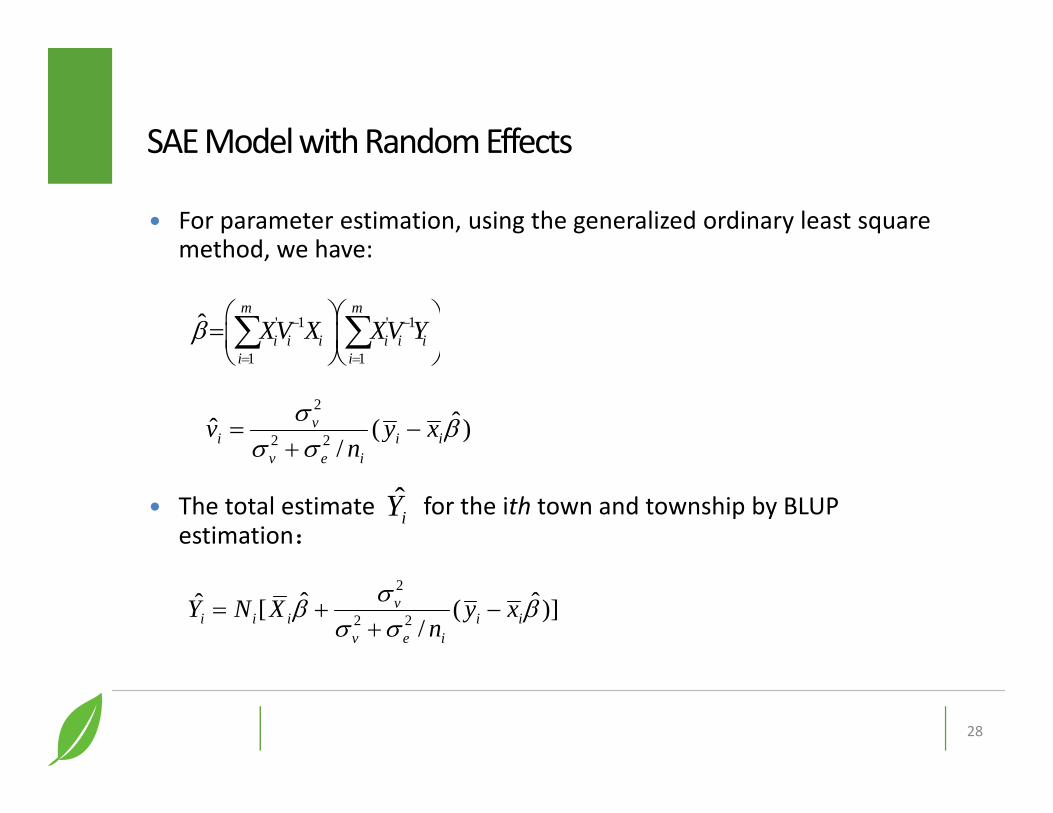
For parameter estimation, using the generalized ordinary least square method, we have:
The total estimate for the ith town and township by BLUP estimation:
28
SAE Model with Random Effects
' 1 ' 1
1 1
ˆm m
i i i i i ii i
XV X XV Y
2
2 2ˆ ˆˆ [ ( )]
/v
i i i i iv e i
Y N X y xn
iY
2
2 2ˆˆ ( )
/v
i i iv e i
v y xn

MSE of at town level
Population total at county level
29
SAE Model with Random Effects
2 2 2 2 2 21 2 3
ˆ ˆ ˆ ˆ ˆ ˆ ˆ( ) ( , ) ( , ) 2 ( , )i i v e i v e i v eMSEY g g g
1 2ˆ ˆ ˆ ˆ( ) ( ) ( ) ... ( )mEY EY EY EY
iY

Estimating Crop Acreage by SAE in Shenyang City
30
Shenyang, Liaoning Province

Estimating Crop Acreage by SAE in Shenyang City (cont’d)
31
Grids within the scope of cropland
Shenyang, Liaoning Province

Estimating Crop Acreage by SAE in Shenyang City (cont’d)
• Data description used for SAE model in Shenyang city
32
County
Name
County
Code
Total No. of
Grids
No. of
Sample
Grids
Corn Area
Surveyed
m2/Grid
Rice Area
Surveyed
m2/Grid
Corn Area
Classified
m2/Grid
Rice Area
Classified
m2/Grid
浑南区 210112 14385 66 27135.77 902.63 26160.65 780.04
沈北新区 210113 17918 67 20467.88 12170.74 20186.72 9063.32
于洪区 210114 9499 14172.83 5765.67
辽中县 210122 37447 100 16772.38 11849.48 15857.21 7903.62
康平县 210123 47455 75 28986.18 251.72 29066.78 224.80
法库县 210124 54405 99 26493.65 2016.88 25152.68 1191.79
新民县 210181 74857 101 22880.79 8216.61 21452.30 6085.45
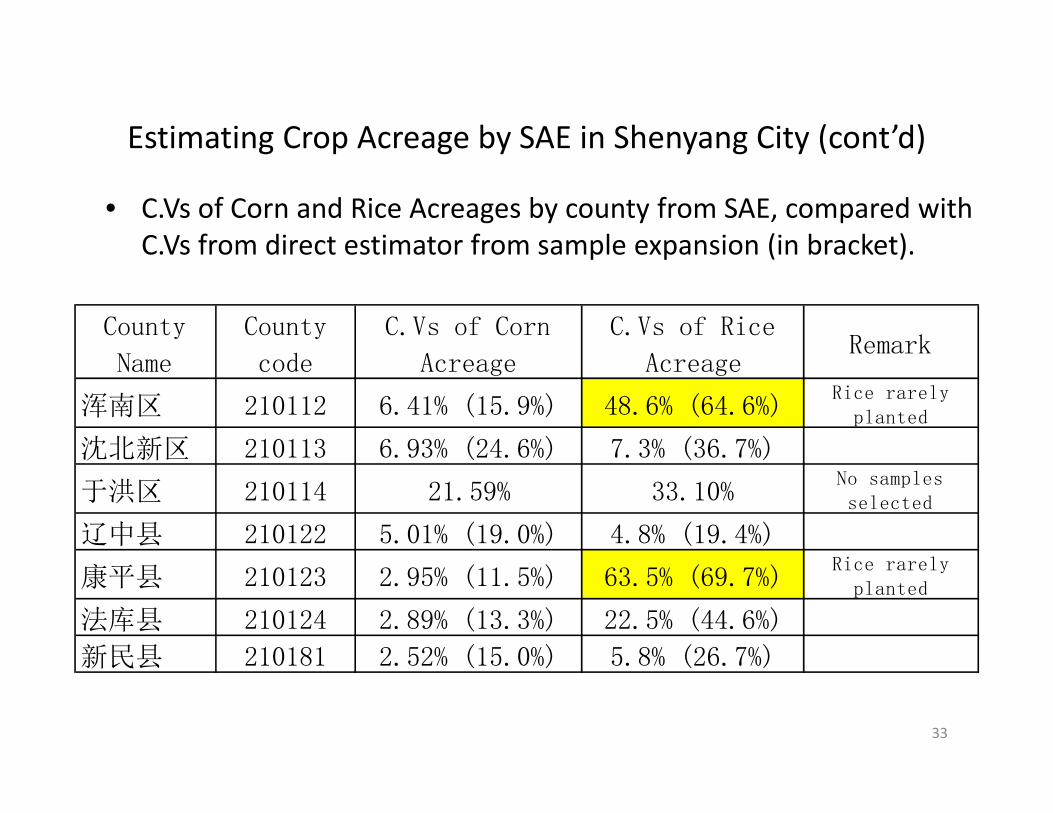
Estimating Crop Acreage by SAE in Shenyang City (cont’d)
• C.Vs of Corn and Rice Acreages by county from SAE, compared with C.Vs from direct estimator from sample expansion (in bracket).
33
County
Name
County
code
C.Vs of Corn
Acreage
C.Vs of Rice
AcreageRemark
浑南区 210112 6.41% (15.9%) 48.6% (64.6%)Rice rarely
planted
沈北新区 210113 6.93% (24.6%) 7.3% (36.7%)
于洪区 210114 21.59% 33.10%No samplesselected
辽中县 210122 5.01% (19.0%) 4.8% (19.4%)
康平县 210123 2.95% (11.5%) 63.5% (69.7%)Rice rarely
planted
法库县 210124 2.89% (13.3%) 22.5% (44.6%)
新民县 210181 2.52% (15.0%) 5.8% (26.7%)
A unit level small area model in the form of one‐response multiple regression with random effects could produce the estimates at province and county levels simultaneously.
Taking the advantages of combining crop classification from satellite images with field survey data, SAE model could improve the estimate precision of crop acreage.
Therefore, remote sensing application in agricultural statistics could (1) facilitating construction and update of area frame, (2) improving the sample design for crop surveys, (3) improving the crop acreage estimation and etc.
For National Bureau of Statistics (NBS) of China, although NBS facing some challenges in applying remote sensing techniques, we are moving forward to further apply remote sensing in agricultural statistics and attempt to extend to relevant areas of the System of Environmental‐Economic Accounting.
34
Summary

Thanks for your attention!
35


![Qi SENSING MIcROwAVE USING OPTICAL CROP … · CROP EvAPOTRAN5PIRATION ESTIMATION USING OPTICAL AN]) MIcROwAVE REMOTE SENSING Main Vidal, Denis Troufleau, M. Susan Moran, Jiaguo Qi](https://img.dokumen.tips/doc/110x75/5b1e8f6a7f8b9a8a3a8bb1c3/qi-sensing-microwave-using-optical-crop-crop-evapotran5piration-estimation-using.jpg)