Embed Size (px)
Citation preview
Proceedings World Geothermal Congress 2020
Reykjavik, Iceland, April 26 – May 2, 2020
1
Croatia Country Update 2020 - Finally the start of power production
Slobodan Kolbah 1, Sanja Živković 2, Mladen Škrlec 1, Dražen Tumara 2
[email protected], [email protected], [email protected], [email protected]
Keywords: Geothermal resources, power production, direct energy utilization, geothermal exploration and production, Croatia
ABSTRACT
After some turbulent attempts, the local developers and international companies succeeded to break the ice and the first geothermal
power plant has started production and contribution to the national power grid (for now 10 MWe can be passed into the power grid
due to grid limitation, but up to potentially 20MWe). That is a small but crucial step and should raise attention to the understanding
and utilization of the geothermal energy potential, which is significant for the country’s needs. This long-expected event, combined
with the recent taking over of control of several thousand abandoned hydrocarbon exploration and production wells by the
government, together with massive geophysical-geological studies available to investors, will cut costs and risk of the utilization of
Croatia's geothermal potential. Finally, these efforts will be supported by a new legislative framework for renewable energy sources.
These crucial events should raise the interest for new exploration / production licenses, both for power generation and direct heat
utilization.
In the Croatian part of Neogene-age Pannonian basin, the main geothermal advantage is the favorable terrestrial heat flow. Heat
conduction is easier there because of regional crust thinning (less than twenty kilometers) and the presence of the geothermal fluids
(predominantly water convergence through massive structures of Mesozoic fractured carbonate aquifers, insulated with the younger
basin fill). In the lower scale, they are followed by the basin material origin; carbonate fractured massif and high-profile reservoirs,
together with layered sandy bodies, with intergranular porosity, insulated with the fine-grained shales, marls and clays.
Here, some extraordinary geothermal water bodies at economically reasonable depths from less than 1,000 m to hardly over 3,000 m
can be found. They can produce a significant outflow from several tens to more than a hundred liters per second, with temperatures
from one hundred to higher than two hundred degrees Celsius. Since most of the already tested fields outflow is artesian, enhanced
and dry rock geothermal approaches are not discussed here. Together with geothermal water production, it is often possible to produce
significant quantities of the unconventional hydrocarbon dissolved aquifer gas. Geothermal water production can be used to enhance
production in aged hydrocarbon fields.
Other geothermal energy targets are numerous poorly developed natural geothermal springs, and shallow (500 -> 1000 m) “geo-
temperate waters” structures which are also attractive for low cost / low energy gain, mostly utilizable for recreation and balneology.
Some of them can rise to worthy energy production, not mentioning standard procedures to pump the energy from the neutral Earth
layer by heat pump technology and hybrid energy systems.
Beside proven geothermal potential of the north Croatian part of the Pannonian sedimentary basin, the geothermal potential is
expected also at the tectonically active belt of the Dinaridic carbonate platform range stretching to the southwest. It is indicated by
some natural geothermal springs and shows, but its potential will be revealed by better understanding of hydrocarbon games and
fields, together with expected deep geothermal water.
Now after “geothermal electricity” is running through the Croatian power grid, conservative expectation from the already proven part
of geothermal potential is about 10% of the expected potential. From discovered fields it is realistic to expect 100 MWe (2% of the
existing capacity in the country) several hundred MWt in co-generation there, followed by additional 500 MWt direct geothermal
heat consumption from new sites and/or using several hundred abandoned oil and gas deep wells, what amounts to 25% of today’s
natural gas consumption.
Already, such conservative predictions of geothermal energy production can change the lethargic visions of the energy mix of the
country into the self-sustaining domestic clean and stable energy supply and make the country meaningful in the EU and world
economy. The geothermal energy resources are a trigger to the complex development of Croatia for all who come and stay in the
country.
1. INTRODUCTION
This report is the last in the series since WGC Florence 1995 (Čubrić et al., 1995; Jelić et al., 2000; Jelić et al., 2005; Jelić et al.,
2010; Kolbah et al., 2015). Croatia is now an EU member parliamentary democracy State, where the Prime Minister is the head of
government. A growing number of industry factors are pressuring the state policies to recognize geothermal energy resources as
important.
The Ministry of Environment and Energy is responsible for energy sector activities and policies, whereas exploration and production
of geothermal waters are serviced by the Croatian Hydrocarbon Agency (CHA). The high-level effort is undertaken there, to ensure
geological and international legal framework to enhance existing initiatives and provide further support. They are especially looking
for possibilities to ease and ensure funding. Geothermal energy sources are recently developed by private domestic and international
investors, gradually more supported by the local communities.
Kolbah et al.
2
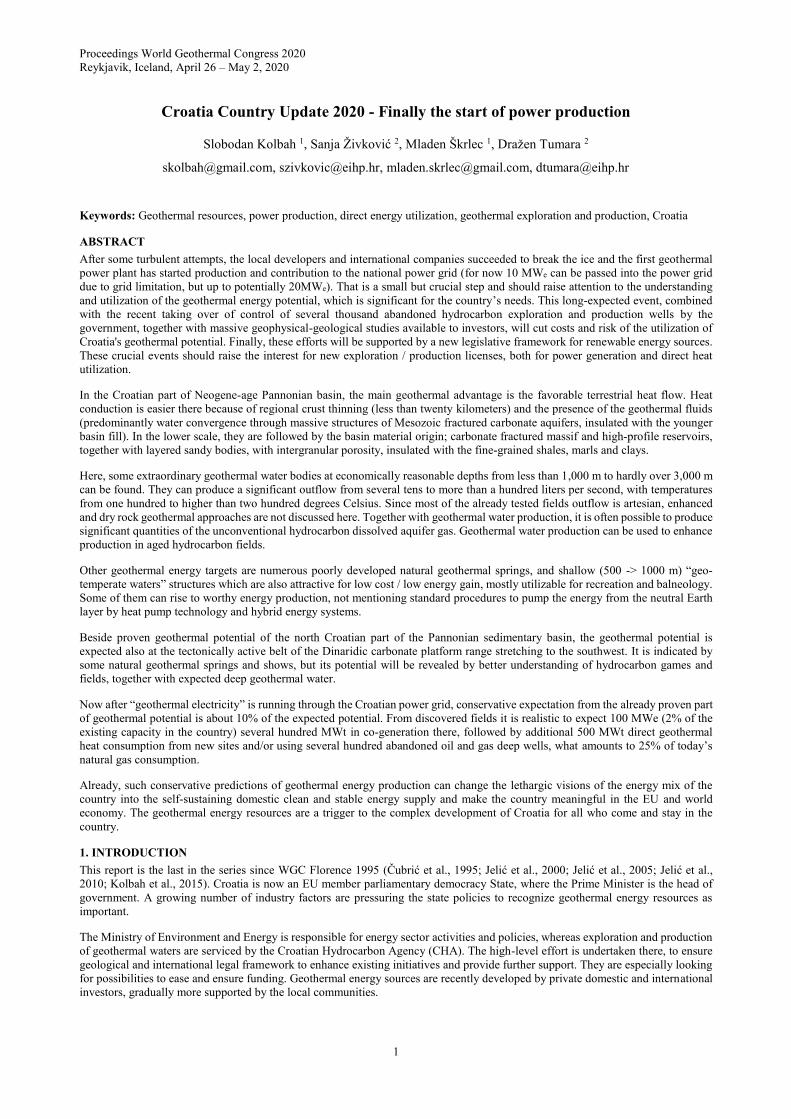
2. GEOLOGY BACKGROUND WITH GEOTHERMAL RESOURCES AND POTENTIAL
Croatia is settled within two main regional geological provinces – Pannonian basin to the north, and Dinarides to the south. Both
units are results of indentation of Ancient Ocean and their archipelagos backed by the African plate to the Euro-Asian plate bay,
controlled by Check and Moesia massifs that started in Cretaceous. Today’s geological setting in Croatia, was developed in several
phases resulting in the rise of the main part of Dinaridic carbonate platform, with southwest verging foreland, mostly developed in
the Adriatic offshore, backed by mountain belt extending in a northwest-southeast direction along with important strike-slip
compensation. At the inner Pannonian side, north branch of Dinaridic carbonate platform’s archipelagos are twisted around central
Bosnian massifs and its fragments, by indentation entered deeply into the future basin area, even to the north and to the east of the
Croatian Pannonian territory, forming the basin basement and marking the proto basin troughs initially filed with sin-orogenetic
material. That rise of the main part of Dinarides was caused by subduction of the Adriatic plate and deepening of the Moho
discontinuity to 35-40 km in the narrow northwest-southeast direction and consequently formation of a back-arc type basin in the
Pannonian area. Future basin area was firstly characterized by uprising and thinning of the crust and differential erosion of
sedimentary cover and opening of proto basins with local sedimentation, followed by isotactic subsidence in the mid-Miocene, finally
setting Moho discontinuity in the Pannonian area at about 25-30 km (Figure 1).
Figure 1. Map of Moho discontinuity depths in SE Europe (Grad et al., 2009)
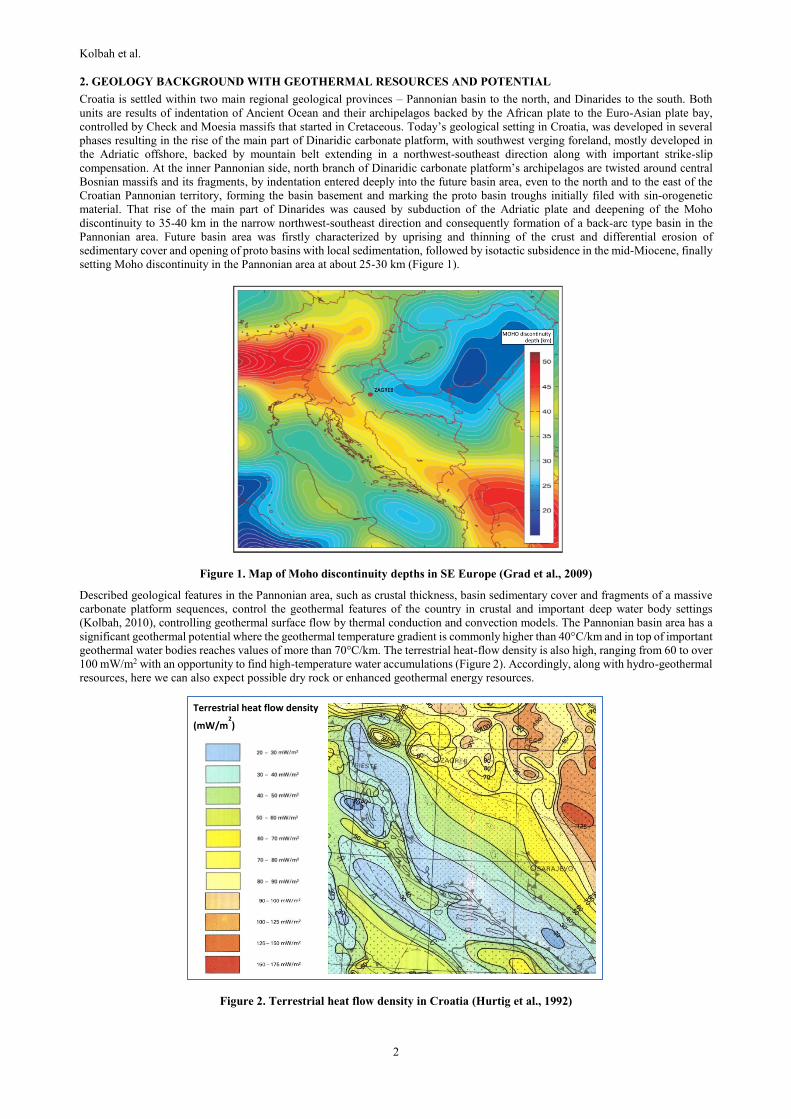
Described geological features in the Pannonian area, such as crustal thickness, basin sedimentary cover and fragments of a massive
carbonate platform sequences, control the geothermal features of the country in crustal and important deep water body settings
(Kolbah, 2010), controlling geothermal surface flow by thermal conduction and convection models. The Pannonian basin area has a
significant geothermal potential where the geothermal temperature gradient is commonly higher than 40°C/km and in top of important
geothermal water bodies reaches values of more than 70°C/km. The terrestrial heat-flow density is also high, ranging from 60 to over
100 mW/m2 with an opportunity to find high-temperature water accumulations (Figure 2). Accordingly, along with hydro-geothermal
resources, here we can also expect possible dry rock or enhanced geothermal energy resources.
Figure 2. Terrestrial heat flow density in Croatia (Hurtig et al., 1992)
Terrestrial heat flow density
(mW/m2)

Kolbah et al.
3
On the other hand, there is missing consolidated sedimentary cover in the Adriatic and exposed thick carbonate sequences at the
surface in Dinaridic area, with bit ticker crust in the relatively narrow zone, but it is still a tectonically very active area, given a
completely different surface geothermal heat flow picture under the deep penetration of huge masses of surface and seawater. The
Dinarides area, with poor geothermal features at the moment, geothermal temperature gradient ranges between 10 and 30°C/km and
the terrestrial heat-flow density between 20 and 60 mW/m2 (Figure 2). Deep geothermal water bodies, as well as hydrocarbon
accumulations, are indicated in the area by the surface geothermal and hydrocarbons exploration, but we leave it to the expected
future discoveries.
The geothermal potential of the Pannonian basin area is marked with 30 major natural springs of thermal water, many of which have
been known since Roman times. They exhibit temperatures up to 65°C and have often been developed with wells in order to reach
waters with higher temperatures or increase flow rates.
Moreover, waters with higher water temperatures were found in the course of oil and gas research taken in the Pannonian basin area
in the second part of the 20th century. In that time, massive geological and geophysical exploration finalized with more than 4,000
deep wells drilled. Nearly fifty oil and gas fields and five geothermal fields (Elezović et al., 2018) were put in production.
There are two main types of geothermal aquifers: the one with intergranular porosity in clastic sediments of Mesozoic and Tertiary
age and the other with secondary porosity - fractures and caverns of Mesozoic and Miocene carbonates. Mesozoic massive carbonate
deposits with highly developed secondary porosity provide reservoirs with richer flows and higher formation temperatures such as
Velika Ciglena (175°C) now in production, Kutnjak-Lunjkovec (140°C), and Slatina (190°C) with high production level favorable
for electricity generation by modern technology and economy.
Quantification of geothermal resources for power production and other sources expect to cover 20% of domestic demand (Kolbah et
al; 2018). Except for that exceptional places, most of the basin area of north Croatia show potential for acceptable production rates
and temperatures for direct heat geothermal consumption. For that preferentially we can use clastic deposits reservoirs up to 1,000 m
depth, but other reservoirs can be useful and even more prolific if the production rate was higher (Brkić et al; 2009). Examples of
such locations are in Bošnjaci in Vukovar-Srijem county or Sveta Nedelja in Zagreb county where greenhouses are heated by
geothermal energy.
3. GEOTHERMAL UTILIZATION
Geothermal energy is traditionally used for balneology and space heating, nowadays in 15 active Spas. Beside Spas, there are three
locations of greenhouses where geothermal energy is used for heating, two locations of individual space heating, and a small district
heating system. Due to low utilization capacity of direct heat, only 360 TJ of thermal energy was produced in 2019.
Figure 3. Exploitation and exploration licences of geothermal waters for energy use in Croatia (Croatian Hydrocarbon
Agency, 2019)
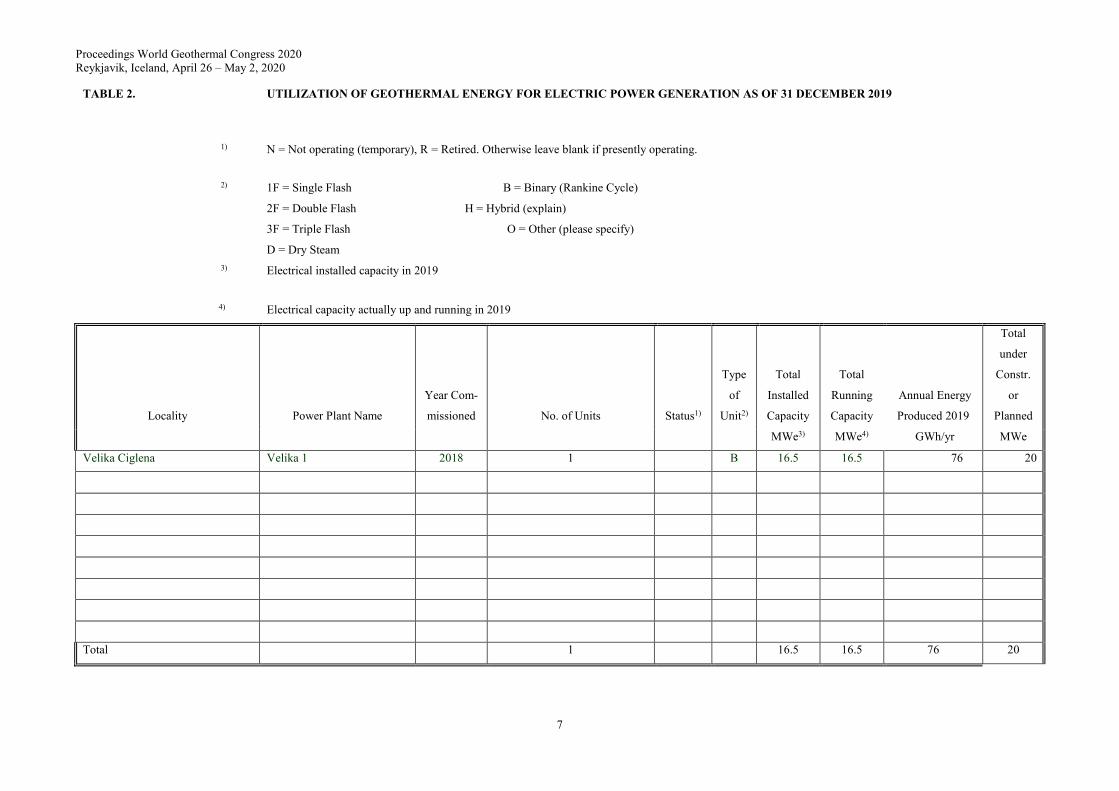
At the end of 2018 first geothermal power plant Velika 1 was put in operation at Velika Ciglena Site. This was a huge achievement
for Croatian geothermal sector, as the site has been known since the 1980s. At the location are two production-injection doublets, a
16.5 MW turbine has been installed, and 10 MW are delivered to the power grid. Altogether, the capacity of all active geothermal
installations amounts to 75.5 MWt, and 16.5 MWe.
Along with the Velika Ciglena site, production licenses are also issued for a greenhouse (Bošnjaci), two Spas (Bizovac and Ivanić),
and a hybrid geothermal power plant development in the NW part of Croatia (AAT Geothermae) (Figure 3).
Shallow geothermal energy shows significant potential for utilization in Croatia. The continental region and region of the Adriatic
coastline have a great perspective for utilization of ground source heat pumps. In the continental region, this is due to favorable
geothermal gradients and the geological setting. Even though along the Adriatic coastline the geothermal gradient shows low to
Kolbah et al.
4
moderate values, a favorable shallow geothermal potential is present because of the geological setting, which shows that rocks are
mostly carbonates, with favorable thermal conductivity. Ground source heat pump installations are growing in popularity throughout
Croatia, becoming more attractive for space heating and cooling in both private houses and the service sector. Collected data on heat
production shows 32,6 TJ/y, of which 30 TJ/y is used for heating and 2,6 TJ/y was produced as cooling energy (Macenić et al., 2018).
4. DISCUSSION
In the last three years, a detailed survey of utilization of existing geothermal capacities was conducted in Croatia, with review of data
of average flow rates, inlet and outlet temperatures. Additionally, four Spas were closed, in Ivanić Grad Spa thermal water is no
longer used, and two new ones opened. Therefore, although similar capacity is still in place, only 56% of thermal energy is produced
compared to 2015.
Most of the Spas in Croatia are outdated, seeking funds for renovation and increased energy efficiency. There is a lot of interest for
geothermal projects, both for direct utilization and for power production, so it remains to be seen how fast the geothermal utilization
will advance in the coming years.
Geothermal energy, as well as the other renewable energy sources, falls under an incentive scheme for eligible producers of energy.
The incentive price for electricity produced from geothermal power plants amounts to 1.5669 HRK/kWh (0.21 EUR/kWh) and is
paid by the Croatian Energy Market Operator (HROTE) for the electricity delivered to the power system.
Cost of heat produced form geothermal energy depends on its use and overall project, but the average savings compared to other
fuels, particularly gas, amount to about 30%.
Mid-2018 adoption of a law on exploration and exploitation of hydrocarbons introduced a chapter solely devoted to geothermal
energy. The procedure of obtaining a license for exploration and production is united into a joint procedure enabling faster and simpler
processing.
5. FUTURE DEVELOPMENT AND INSTALLATIONS
There are a number of perspective locations suitable for geothermal utilization of which 8 exploration licenses have been issued in
the last couple of years: 6 for electricity production, 2 for space heating (Figure 3).
Hybrid geothermal power plant AAT Geothermae is an ongoing project that, along with geothermal water energy in an ORC power
plant, plans to use methane dissolved in geothermal water in four cogeneration units with the internalization of exhaust gases,
separation of CO2 and its injection along with geothermal water outflow back to the reservoir. This project was declared as a project
of national interest for Croatia.
Geothermal field Zagreb, with its 14 wells, and current production in 3 of them is under additional exploration aiming to connect to
a part of the city district heating system, now using natural gas.
Intensive preparation for exploratory works is ongoing in Slatina, one of the perspective locations that was recently issued an
exploration license.
The overview of research conducted in shallow geothermal energy potential shows a good scientific basis for implementation in
future heating and/or cooling of commercial and residential buildings/objects.
6. CONCLUSION
Besides the icebreaking development in the power production at the Velika Ciglena, direct heat testing is expected at the geothermal
field, Zagreb. Challenged by the private, international initiatives, a lot of work was done in understanding the nature and potential of
this important national energy resource, from additional hydrocarbon production, CO2 management, water recovery, balneology, and
development of continental tourism. With abundant natural resources it is obvious that geothermal resources can provide meaningful
energy production, both electricity and heat. Projects requiring high scientific and technological levels such as the ongoing hybrid
geothermal power plant with internalization of CO2, and more are expected in the coming years. The production potential of these
projects could cover up to 20% of Croatia’s domestic energy needs (electricity and heat).
ACKNOWLEDGEMENTS
Authors thank Croatian Hydrocarbon Agency and Energy Institute Hrvoje Požar for recent data and information on exploration and
exploitation licences of geothermal waters for energy use.
REFERENCES
Brkić, V., Radionov, S., Škrlec, M., and Kulenović, I., and Kolbah, S.: Geothermal Energy Production in the Republic of Croatia,
Proceedings, 5th International Oil and Gas Conference, Šibenik, Croatia (2009).
Čubrić, S., and Jelić, K.: Geothermal Resources potential of the Republic of Croatia, Proceedings, WGC 1995, Firenza, p. 87-91
(1995).
Elezović I., Škrlec M. & Kolbah S.: Construction of Wells for Geothermal Production in Croatia, HUNIG Zagreb, Nafta i Plin
bulletin, Vol. 38., No. 155 (2018).
Grad M., Tiira T., ESC Working Group, 2009. The Moho depth map of the European Plate. Geophys. J. Int., 176, 279–292, doi:
10.1111/j.1365-246X.2008.03919.x

Kolbah et al.
5
Hurtig, E., Čermak. V., Haenel, R. and Zui, V.: Geothermal atlas of Europe, Working group „Geothermal atlas of Europe“ of the
International Heat Flow Commission (Yugoslavia: D. Ravnik, S. Kolbah, K. Jelić, M. Milovanović, N. Miošić, S. Tomić, D.
Rajver; 102-105), Kartographisher Dienst Potsdam, Hermann Haack Verlagesgesellschaft mbH Gotha, Germany, (1992).
Jelić, K., Pavičić, H., and Bošnjak, R.: Geothermal Energy Potential and Utilization in the Republic of Croatia, Proceedings, WGC
2000, Kyushu – Tohoku, Japan, p. 237-246 (2000).
Jelić, K., Kovačić, M., and Koščak-Kolin, S.: State of the Art of the Geothermal Resources in Croatia in Year 2004, Proceedings,
WGC 2005, Antalya, Turkey, p. 1-9 (2005).
Jelić, K., Golub, M., Kolbah, S., Kulenović, I., and Škrlec, M.: Croatia Geothermal Resources Updates in the Year 2009, Proceedings,
WGC 2010, Bali, Indonesia, p. 25-29 (2010).
Kolbah S., Živković, S., Golub M., Škrlec M.: Croatia Country Update 2015 and On, Proceedings, WGC 2015, Melbourne, Australia,
File name 01026, (2015).
Kolbah, S.: Deep Transboundary Water-Bodies: Exploration and Management in the Pannonian Basin of the Republic of Croatia,
Proceedings, UNESCO-IAH-UNEP Conference, Paris, France, p. 6-8 (2010).
Kolbah S., Škrlec M., Golub M.: Quantification of Indicated Geothermal Resources in Croatia for Electricity Production, University
of Zagreb, Geotechnical faculty Varaždin, Inženjerstvo okoliša bulletin, Vol. 5, No. 1-2 (2018)
http://www.gfv.unizg.hr/hr/journalio.html
Mecenić, M., Kurevija, T and Strpić, K.: Systematic review of research and utilization of shallow geothermal energy in Croatia, The
Mining-Geology-Petroleum Engineering Bulletin, 33/5, 37-46 (2018) doi: 10.17794/rgn.2018.5.4

Proceedings World Geothermal Congress 2020
Reykjavik, Iceland, April 26 – May 2, 2020
6
TABLE 1. PRESENT AND PLANNED PRODUCTION OF ELECTRICITY
Geothermal Fossil Fuels Hydro Nuclear Other Renewables (specify) Total
Capacity
MWe
Gross
Prod.
GWh/yr
Capacity
MWe
Gross
Prod.
GWh/yr
Capacity
MWe
Gross
Prod.
GWh/yr
Capacity
MWe
Gross
Prod.
GWh/yr Capacity MWe
Gross
Prod.
GWh/yr Capacity MWe
Gross
Prod.
GWh/yr
In operation in
December 2019
16 76 2048 4667 2212 5608
60 (biomass) 42
(biogas) 576
(wind) 85
(solar)
450
310
1300
79 5039 12490
Under construction
in December 2019
4 25
52 (biomass) 12
(biogas) 162
(wind)
380
85
300 176 790
Funds committed,
but not yet under
construction in
December 2019
Estimated total
projected use by
2020 20 120 1941 3100 2356 6482
153 (biomass)
50 (biogas) 734
(wind) 96
(solar)
734
350
1720
134 5354 12640
Proceedings World Geothermal Congress 2020
Reykjavik, Iceland, April 26 – May 2, 2020
7
TABLE 2. UTILIZATION OF GEOTHERMAL ENERGY FOR ELECTRIC POWER GENERATION AS OF 31 DECEMBER 2019
1) N = Not operating (temporary), R = Retired. Otherwise leave blank if presently operating.
2) 1F = Single Flash
B = Binary (Rankine Cycle)
2F = Double Flash H = Hybrid (explain)
3F = Triple Flash
O = Other (please specify)
D = Dry Steam
3) Electrical installed capacity in 2019
4) Electrical capacity actually up and running in 2019
Locality Power Plant Name
Year Com-
missioned No. of Units Status1)
Type
of
Unit2)
Total
Installed
Capacity
Total
Running
Capacity
Annual Energy
Produced 2019
Total
under
Constr.
or
Planned
MWe3) MWe4) GWh/yr MWe
Velika Ciglena Velika 1 2018 1 B 16.5 16.5 76 20
Total 1 16.5 16.5 76 20
Proceedings World Geothermal Congress 2020
Reykjavik, Iceland, April 26 – May 2, 2020
8
TABLE 3. UTILIZATION OF GEOTHERMAL ENERGY FOR DIRECT HEAT AS OF 31 DECEMBER 2019 (other than heat pumps)
1) I = Industrial process heat
H = Individual space heating (other than heat pumps)
C = Air conditioning (cooling) D = District heating (other than heat pumps)
A = Agricultural drying (grain, fruit, vegetables) B = Bathing and swimming (including balneology)
F = Fish farming G = Greenhouse and soil heating
K = Animal farming O = Other (please specify by footnote)
S = Snow melting
2) Enthalpy information is given only if there is steam or two-phase flow
3) Capacity (MWt) = Max. flow rate (kg/s)[inlet temp. (oC) - outlet temp. (oC)] x 0.004184
(MW = 106 W)
or = Max. flow rate (kg/s)[inlet enthalpy (kJ/kg) - outlet enthalpy (kJ/kg)] x 0.001
4) Energy use (TJ/yr) = Ave. flow rate (kg/s) x [inlet temp. (oC) - outlet temp. (oC)] x 0.1319
(TJ = 1012 J)
or = Ave. flow rate (kg/s) x [inlet enthalpy (kJ/kg) - outlet enthalpy (kJ/kg)] x 0.03154
5) Capacity factor = [Annual Energy Use (TJ/yr)/Capacity (MWt)] x 0.03171
Note: the capacity factor must be less than or equal to 1.00 and is usually less,
since projects do not operate at 100% of capacity all year.
Note: please report all numbers to three significant figures.
Maximum Utilization Capacity3) Annual Utilization
Locality Type1) Flow Rate Temperature (oC) Enthalpy2) (kJ/kg) Ave. Flow Energy4) Capacity
(kg/s) Inlet Outlet Inlet Outlet (MWt) (kg/s) (TJ/yr) Factor5)
Bizovac
HB 6,4 80,0 40,0 1,07 5,00 26,38 0,78
Bošnjaci (Bos-1) G 20,0 65,0 55,0 0,84 12,00 15,83 0,60
Daruvar Spa(Daruvar) B 21,0 48,0 21,0 2,37 4,70 16,74 0,22
Kolbah et al.
9
Aquae Belissae (Daruvar) B 21,0 46,0 28,0 1,58 3,20 7,60 0,15
Jezerčica Spa (Stubicke T) B 34,2 37,0 25,0 1,72 0,60 0,95 0,02
Krapinske Toplice (KrT-1)
(Krapina Spa) HB 110,0 40,7 26,0 6,77 6,80 13,18 0,06
Krapinske Toplice
(Greenhouse) G 10,0 45,0 35,0 0,42 7,00 9,23 0,70
Lešće Spa (Lesce) B 6,2 32,0 15,7 0,42 2,00 4,30 0,32
Lipik Spa (Lipik) HB 6,8 60,0 28,0 0,91 1,40 5,91 0,21
Livade Spa (N Istria) B 2,0 28,0 13,0 0,13 0,50 0,99 0,25
Stubičke Toplice - Spa
(Stubicke T) HB 17,0 58,0 28,0 2,13 2,00 7,91 0,12
Sveta Nedjelja (N-1) G 25,0 63,0 53,0 1,05 20,00 26,38 0,80
Topusko Spa (TEB-3) HB 136,0 64,0 22,0 23,90 19,30 106,92 0,14
Tuhelj Spa (Tuh.T) B 85,0 32,9 17,0 5,65 3,30 6,92 0,04
Varaždinske Toplice - Spa
(VTB-1) HB 95,0 57,6 29,0 11,37 16,30 61,49 0,17
Zagreb (Mla-3) HB 50,0 82,0 32,0 10,46 0,64 4,22 0,01
Zagreb-Univ.Hosp.(Zagreb) H 14,0 78,0 25,0 3,10 6,10 42,64 0,44
Zagreb Lucko (Luc-1) H 13,9 55,0 30,0 1,45 0,64 2,11 0,05
Terme Sv. Martin B 10,0 37,0 32,0 0,21 0,50 0,33 0,05
TOTAL 683,5 75,55 111,98 360,04 0,15
Proceedings World Geothermal Congress 2020
Reykjavik, Iceland, April 26 – May 2, 2020
10
TABLE 4. GEOTHERMAL (GROUND-SOURCE) HEAT PUMPS AS OF 31 DECEMBER 2019
This table should report thermal energy used (i.e. energy removed from the ground or water) and report separately heat rejected to the ground or water in the cooling mode. Cooling energy numbers
will be used to calculate carbon offsets.
rejected to the ground in the cooling mode as this reduces the effect of global warming.
1) Report the average ground temperature for ground-coupled units or average well water or lake water temperature for water-source heat pumps
2) Report type of installation as follows: V = vertical ground coupled (TJ = 1012 J)
H = horizontal ground coupled
W = water source (well or lake water)
O = others (please describe)
3) Report the COP = (output thermal energy/input energy of compressor) for your climate - typically 3 to 4
4) Report the equivalent full load operating hours per year, or = capacity factor x 8760
5) Thermal energy (TJ/yr) = flow rate in loop (kg/s) x [(inlet temp. (oC) - outlet temp. (oC)] x 0.1319
or = rated output energy (kJ/hr) x [(COP - 1)/COP] x equivalent full load hours/yr
6) Cooling energy = rated output energy (kJ/hr) x [(EER - 1)/EER] x equivalent full load hours/yr
Note: please report all numbers to three significant figures
Due to room limitation, locality can be by regions within the country.
Locality Ground or Water Temp.
Typical
Heat
Pump
Rating or
Capacity Number of Units Type2) COP3)
Heating
Equivalent
Full Load
Thermal
Energy
Used5)
Cooling
Energy6)
(oC)1) (kW)
Hr/Year4) ( TJ/yr) (TJ/yr)
TOTAL
1200 30 2,6
Proceedings World Geothermal Congress 2020
Reykjavik, Iceland, April 26 – May 2, 2020
11
TABLE 5. SUMMARY TABLE OF GEOTHERMAL DIRECT HEAT USES AS OF 31 DECEMBER 2019
1) Installed Capacity (thermal power) (MWt) = Max. flow rate (kg/s) x [inlet temp. (oC) - outlet temp. (oC)] x 0.004184
or = Max. flow rate (kg/s) x [inlet enthalpy (kJ/kg) - outlet enthalpy (kJ/kg)] x 0.001
2) Annual Energy Use (TJ/yr) = Ave. flow rate (kg/s) x [inlet temp. (oC) - outlet temp. (oC)] x 0.1319 (TJ = 1012 J)
or = Ave. flow rate (kg/s) x [inlet enthalpy (kJ/kg) - outlet enthalpy (kJ/kg) x 0.03154
3) Capacity Factor = [Annual Energy Use (TJ/yr)/Capacity (MWt)] x 0.03171
(MW = 106 W)
Note: the capacity factor must be less than or equal to 1.00 and is usually less, since projects do not operate at
100% capacity all year
4) Other than heat pumps
5) Includes drying or dehydration of grains, fruits and vegetables
6) Excludes agricultural drying and dehydration
7) Includes balneology
Use
Installed Capacity1) Annual Energy Use2) Capacity Factor3)
(MWt) (TJ/yr = 1012 J/yr)
Individual Space Heating4) 18,6 51,2 0,09
District Heating 4) 10,5 126,4 0,38
Air Conditioning (Cooling)
Greenhouse Heating 2,3 87,4 1,20
Fish Farming
Animal Farming
Agricultural Drying5)
Industrial Process Heat6)
Snow Melting
Bathing and Swimming7) 44,1 95,1 0,07
Other Uses (specify)
Subtotal 75,5 360,1 0,15
Geothermal Heat Pumps
TOTAL 75,6 360,1 0,15

Proceedings World Geothermal Congress 2020
Reykjavik, Iceland, April 26 – May 2, 2020
12
TABLE 6. WELLS DRILLED FOR ELECTRICAL, DIRECT AND COMBINED USE OF GEOTHERMAL RESOURCES FROM JANUARY 1, 2015 TO
DECEMBER 31, 2019 (excluding heat pump wells)
1) Include thermal gradient wells, but not ones less than 100 m deep
Purpose Wellhead Temperature Number of Wells Drilled Total Depth (km)
Electric Power Direct Use Combined Other (specify)
Exploration1) (all) 2.3
Production >150o C
150-100o C
<100o C 1
Injection (all)
Total 1 2.3
Proceedings World Geothermal Congress 2020
Reykjavik, Iceland, April 26 – May 2, 2020
13
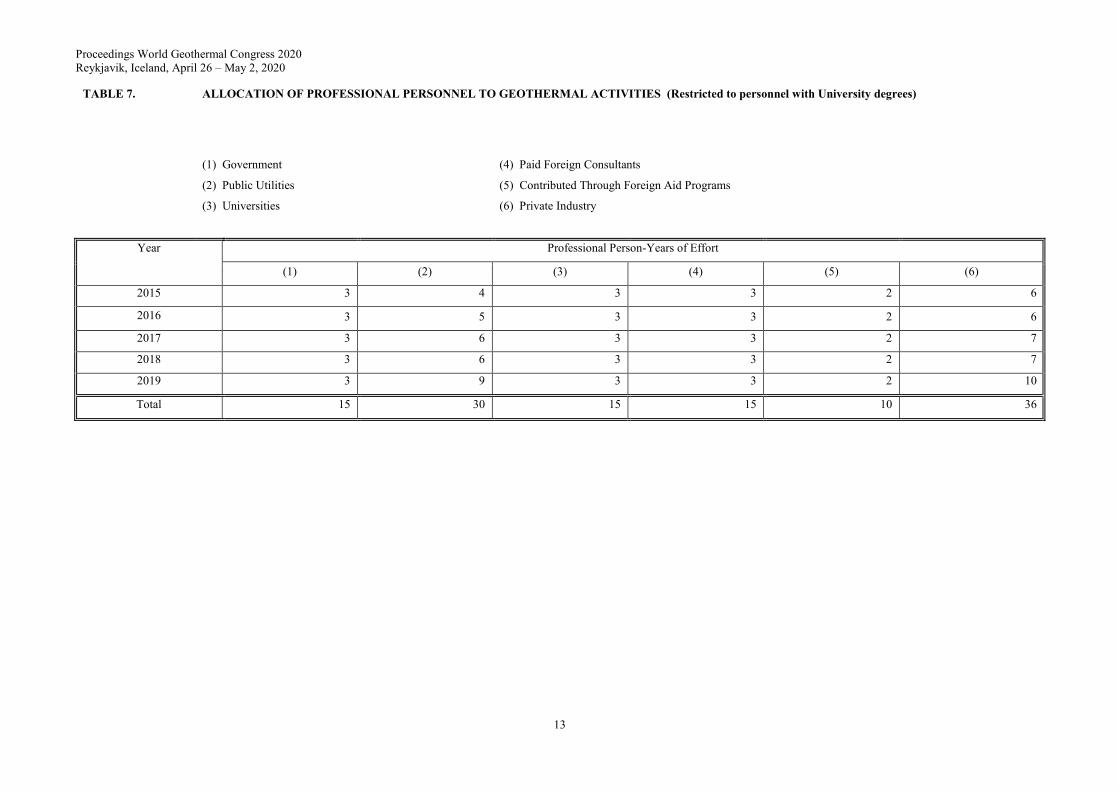
TABLE 7. ALLOCATION OF PROFESSIONAL PERSONNEL TO GEOTHERMAL ACTIVITIES (Restricted to personnel with University degrees)
(1) Government (4) Paid Foreign Consultants
(2) Public Utilities (5) Contributed Through Foreign Aid Programs
(3) Universities (6) Private Industry
Year Professional Person-Years of Effort
(1) (2) (3) (4) (5) (6)
2015 3 4 3 3 2 6
2016 3 5 3 3 2 6
2017 3 6 3 3 2 7
2018 3 6 3 3 2 7
2019 3 9 3 3 2 10
Total 15 30 15 15 10 36

Proceedings World Geothermal Congress 2020
Reykjavik, Iceland, April 26 – May 2, 2020
14
TABLE 8. TOTAL INVESTMENTS IN GEOTHERMAL IN (2019) US$
Period
Research &
Development Incl.
Surface Explor. &
Exploration
Drilling
Field Development
Including
Production Drilling
& Surface
Equipment
Utilization Funding Type
Direct Electrical Private Public
Million US$ Million US$ Million US$ Million US$ % %
1995-1999 0 0 0 0 0 0
2000-2004 0 1 1 0 0 100
2005-2009 0 0,5 0,5 0 0 100
2010-2014 0,5 3 3 0,5 100 0
2015-2019 4 3 1 40 100 0


