Embed Size (px)
Citation preview
Criticality Safety Principles for Health Physicists
Prepared for the Baltimore-Washington Chapterof the Health Physics Society Certification Course
Douglas M. Minnema, PhD, CHPRadiological Control Advisor to Defense Programs
National Nuclear Security AdministrationDepartment of Energy
Outline
4. Introduction
5. Basic principles of critical systems
A. Definition of a criticality event
B. Determination of critical state
C. Physical properties influencing the critical state
D. Kinetics of super-critical systems
E. Tools for analyzing critical systems
6. Radiation hazards from critical systems
A. Neutron flux characteristics
B. Gamma flux characteristics
C. Environmental concerns
D. Tools for determining radiation hazards
7. Operational experiences with critical systems
8. Radiation doses from criticality accidents
A. Estimation of doses for postulated accidents
B. Determination of doses from actual accidents
9. Emergency Preparedness
10. Conclusions
11. References
12. Problems in criticality safety
2
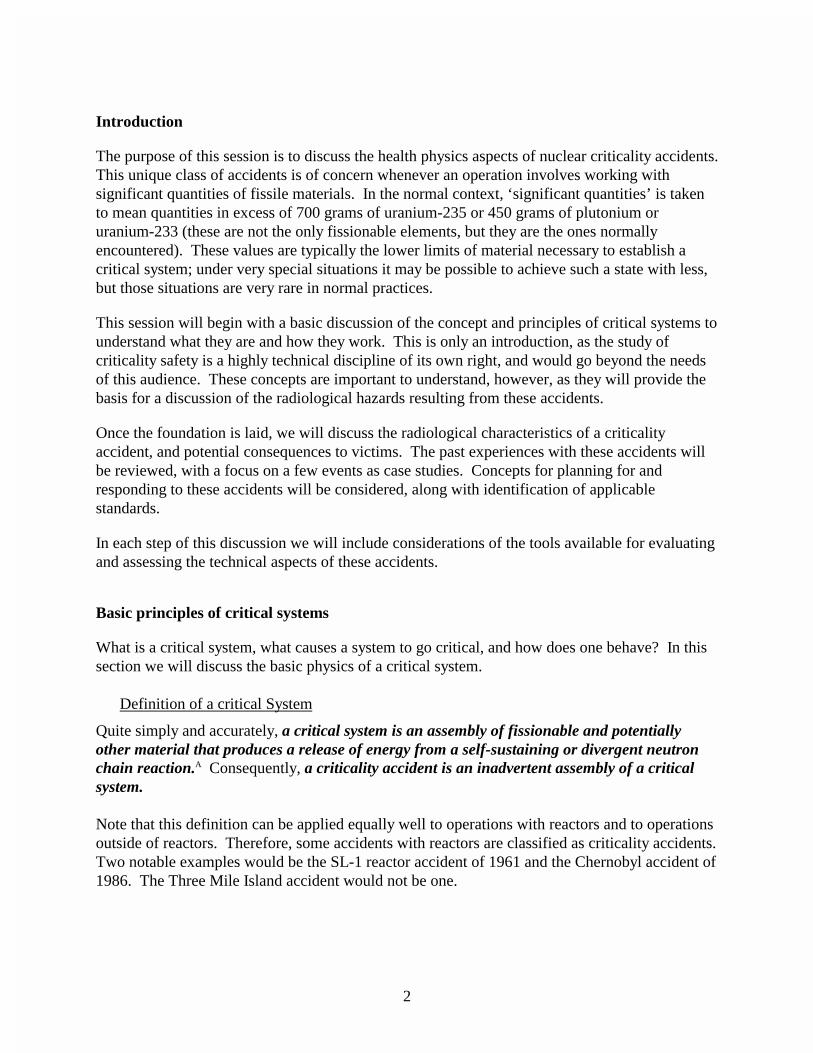
Introduction
The purpose of this session is to discuss the health physics aspects of nuclear criticality accidents.This unique class of accidents is of concern whenever an operation involves working withsignificant quantities of fissile materials. In the normal context, ‘significant quantities’ is takento mean quantities in excess of 700 grams of uranium-235 or 450 grams of plutonium oruranium-233 (these are not the only fissionable elements, but they are the ones normallyencountered). These values are typically the lower limits of material necessary to establish acritical system; under very special situations it may be possible to achieve such a state with less,but those situations are very rare in normal practices.
This session will begin with a basic discussion of the concept and principles of critical systems tounderstand what they are and how they work. This is only an introduction, as the study ofcriticality safety is a highly technical discipline of its own right, and would go beyond the needsof this audience. These concepts are important to understand, however, as they will provide thebasis for a discussion of the radiological hazards resulting from these accidents.
Once the foundation is laid, we will discuss the radiological characteristics of a criticalityaccident, and potential consequences to victims. The past experiences with these accidents willbe reviewed, with a focus on a few events as case studies. Concepts for planning for andresponding to these accidents will be considered, along with identification of applicablestandards.
In each step of this discussion we will include considerations of the tools available for evaluatingand assessing the technical aspects of these accidents.
Basic principles of critical systems
What is a critical system, what causes a system to go critical, and how does one behave? In thissection we will discuss the basic physics of a critical system.
Definition of a critical System
Quite simply and accurately, a critical system is an assembly of fissionable and potentiallyother material that produces a release of energy from a self-sustaining or divergent neutronchain reaction.A Consequently, a criticality accident is an inadvertent assembly of a criticalsystem.
Note that this definition can be applied equally well to operations with reactors and to operationsoutside of reactors. Therefore, some accidents with reactors are classified as criticality accidents.Two notable examples would be the SL-1 reactor accident of 1961 and the Chernobyl accident of1986. The Three Mile Island accident would not be one.

3
Determination of critical state
How is a critical state determined? In practice, this can be a quite complicated analysis toundertake, and beyond the scope of this course. However, in nuclear engineering the status of a
potentially critical system is monitored by a single value known as �-effective, or simply �. In
technical terms, � is the eigenvalue of an equation balancing the rates of neutron production(from fissions and sources) and losses (from leakage and non-fission absorption) in a fissionableassembly.B
Before discussing the critical state of a fissionable system, we must digress for a moment todiscuss the time-dependency of the fission process itself. For a large percentage of fissionevents, the neutrons are emitted essentially instantaneously with the fission of the nucleus, or atleast within 10-9 seconds or less after the absorption (referred to as prompt neutrons). However,a small fraction of the neutrons, generally on the order of about 0.65% for U-235 and only about0.2% for Pu-239, are from unstable neutron-rich fission products that undergo neutron decayover longer periods of time, generally fractions of seconds to almost a minute after the fissiontakes place. These fission products are called delayed neutron precursors, and are the wholebasis on which a fission chain reaction can be controlled in a reactor. (Control systems could notrespond to changes in neutron populations occurring in nanosecond timescales.) Typically theseprecursors are collected into six groups by decay rate, and each group is represented by twovalues, βi, the fractional yield of the group, and λ i, the decay rate in inverse seconds (i is thegroup number). The sum of the fractional yields is β. (Sometimes you will hear reference to β-effective, but we don’t need to go into that here.)
For our purposes, all that is necessary to know is that � can be used to determine the critical stateof the system in the following way:
� < 1.0 For a value of � less than 1.0, the neutron loss rate exceed theproduction rate, and the system cannot self-sustain the chain reaction.This state is referred to as being subcritical.
� = 1.0 For a value of � equal to 1.0, the neutron production and loss rates areequal, and the system is self-sustaining. This state is referred to asbeing critical.
1.0 < � < 1.0 +β For a value of � greater than 1.0, but less than 1.0 + β, the neutronproduction rate exceeds the neutron loss rate, and the system willincrease in power. This state is referred to as being supercritical.However, in this region these increases are gradual, and provide thedegree of controllability necessary to operate reactors.
� > 1.0 + β When � is equal to 1.0 + β, the system is prompt critical, that is, it is
critical on the prompt neutrons alone. When � exceeds this threshold,then the system is considered to be super-prompt critical, and the
4
power level will increase exponentially. At this point, active controlsystems are normally not responsive enough to allow control of thesystem.
Later we will discuss how systems in the latter two states behave when we talk about kinetics.
For now, it is sufficient to note that we want to avoid situations where � is equal to or greaterthan 1.0.
As discussed, � is derived from equations that describe the neutron inventory in the system. Itcan normally be considered as the ratio of the number neutrons produced to the number lost from
the system. While the calculation of ��is normally quite complicated, the basic principle can bedemonstrated by a simple product of six values, historically known as the six-factor formula(rather catchy title, isn’t it?). The six-factor formula is:
( )( )tlfl PPfp −−ηε= 11� . (1)
This can also be written in another form (although we lose the ‘six factors’) as:
( )2DBaf +ΣΣυ=� . (2)
The terms in these equations are defined as:
ε = fast fission factor;p = resonance escape probability;η = number of neutrons produced per neutron absorbed in fuel;
f = thermal utilization = ( )nfa
fa
fa Σ+ΣΣ / ;
Pfl = fast neutron leakage probability;Ptl = thermal neutron leakage probability;υ = number of neutrons per fission event;Σ = macroscopic cross-section (absorption, fission);D = Diffusion coefficient; andB2 = geometric buckling.
So far, all we have is a couple equations with a bunch of Greek symbols with nonsensicaldescriptions. While these equations may look simple, it is the determination of the various termsthat makes the process quite complicated. These terms are interrelated, and they are dependenton the neutron energy spectrum and the fission distribution within the system. The calculation ofthese terms usually requires an iterative numeric solution. However, for the purposes of thiseffort, we don’t need to go into a detailed explanation and calculation of these terms. It is thephysical characteristics of a critical system that are represented by these terms that we want todiscuss here.

5
Physical properties influencing the critical state
The terms identified in the last section are mathematical representations of the various physicalcharacteristics that influence the critical state of a fissionable system. Table 1 considers thoseproperties, and which of the terms they influence:
Table 1: Physical Influences on a System’s Critical StatePhysical Property Influenced Factor
material mass (fissionable and other) Σ’s, ε, f, ηfissionable material enrichment p, f, η
density or concentration Σ’s, f, pcontainer volume B2
composition of non-fissionable materials(absorbers and moderators)
Σa, D, p, f
container design or surrounding conditions(presence of neutron reflectors)
Pfl, Ptl
system geometry B2
environmental conditions(temperature, primarily. Others ??)
Σ’s, p, D
As can be seen from this table, there are at least 8 physical properties or characteristics thatcombine to determine the critical state of a fissionable system. A reactor is designed to optimizethese properties to achieve a controlled state of criticality, but here we try to do just the opposite.
One other point to be made about the critical state of the system is that the equations presentedabove are not dependent on the amplitude of the neutron or fission flux in the system. This isimportant, because it implies that a critical condition can be achieved at any power level, as longas the various parameters are balanced against each other properly. For example, a reactor can bebrought to critical at a very low power level under one set of conditions. Then the positions ofcontrol rods (absorbers) and the coolant temperature (moderator density and fuel temperature) arebalanced against each other to raise and lower the power level as necessary. Note that this alsoimplies that a system can achieve a critical or supercritical mass with no neutrons present, andthen suffer a sudden increase in power when a stray neutron starts the chain reaction. This isan important concept for criticality safety, as it means that a system can undergo changes in itscritical state, and achieve a super-prompt critical condition, completely undetected bypersonnel or normal radiation monitoring equipment.
We have not yet discussed the various forms that a critical system can take. When one normallyconsiders a fissionable system, one envisions a single unit, such as a single tank or a mass ofsolid material. However, arrays are another form of fissionable system that must also beconsidered. One can take a single unit, and design it to be subcritical. However, it is possible forconditions to be such that a collection of these single units, when put into a particular array, to gocritical as a single unit. Therefore, activities such as the stacking of drums and arrays of solutioncontainers must be analyzed in as much or more detail than the individual units.
6
Another form that must be considered is a reflected system. Reflectors are components exteriorto the fissionable system that can scatter neutrons back into the system. For this to be aneffective contribution, these components would generally be very close to the system. Anyscattering medium can be a reflector, such as walls, shields, floors, or even human bodies. Eventhe thickness of a tank wall should be considered. For external reflectors, the absorptionproperties should be ignored, for they cannot induce the system to leak any more neutrons thannormal. [From this, note that one cannot use externally positioned poisons to reduce thepotential for a criticality event.] Reflectors are important because they reduce the quantity andgeometrical size of a system necessary to go critical compared to an unreflected system. Forthe critical state of the system, it is vitally important that the criticality safety engineer considerpossible reflectors in their determinations. For the health physicist, reflectors will also affect thecharacteristics of the radiation emitted by the system, which will be discussed further below.
The art and science of Criticality Safety is the discipline that evaluates the potential contributionsof each of these properties, and determines how to control them to limit the potential for aninadvertent achievement of a critical state. Normally, criticality safety programs are based on adouble contingency principle that recommends that designs should incorporate sufficient factorsof safety to require at least two unlikely, independent, and concurrent changes in processconditions before a criticality accident is possible. They also attempt to the extent possible tocontrol two different physical properties, and to minimize reliance on administrative practices asa control mechanism. As we will see later when we discuss past accidents, the focus of theinvestigation is primarily to determine which of these characteristics changed to cause the event,and why.
Kinetics of supercritical systems
Nuclear kinetics is the study of the time-dependent behavior of a fissionable system. The actualsets of equations used to describe fissionable systems are both time- and space-dependent, andbecome very complex when describing a real system. Therefore, the process of determining the
critical state of such as system normally uses the eigenvalue � to replace the time-dependency asa simplifying assumption. Consequently, one can only determine the critical state as to the threegeneral conditions, subcritical, critical, and supercritical. Therefore, the opposite simplification isusually done for evaluating the time-dependency, by using the geometric buckling term B2 asrepresentative of the space-dependency, and then homogenizing the cross-sections to create a‘point-reactor’ model. This is the origin of the point-reactor kinetics model.C
To describe the point-reactor model, the following parameters are defined:
a
1
Σ≡∞ ν
� = infinite medium neutron lifetime;
a
DL
Σ≡ = diffusion length;
af ΣΣ≡∞ /ν� = infinite medium reproduction factor;
7
22BL1 +≡ ∞�� = effective reproduction factor;
22BL1 +≡ ∞��
RR= neutron lifetime;
���� = = neutron generation time; and
�
� 1−=ρ = reactivity.
Note that B2 is the geometric buckling term from the eigenvalue solution of the diffusionequation.
Given these definitions, neutron flux as a function of time is:
∑=
λ+β−ρ=g
1iii (t)Ctn
dt
dn(t))(
�, (3)
where β is the delayed neutron fraction, g is the number of delay groups, and (t)Ci is the
concentration of delayed neutron precursors for the ith, such that:
(t)Cn(t)dt
(t)dCii
ii λβ −=�
. (4)
One advantage of these equations is that they are insensitive to units. Therefore, the neutrondensity term, n(t), can be replaced with a power term with no loss of meaning, as long as Ci(t) isin the same units. Therefore, we can use these same equations for describing the system’s powerlevel as a function of time, which is very convenient.
The system reactivity, ρ, is the key to understanding this process. From its definition, one can
see that it is a function of �, from the neutron balance equations above. A positive reactivitychange would imply an increase in power level, and a decrease would be a reduction. Areactivity of zero would be a steady-state condition. However, this is not a constant value, andindeed is a function of time, even though it is not normally shown that way. The reason for thisis that several of the parameters in the neutron balance equations, most notably the cross-
sections, are functions of temperature, so consequently � will vary with temperature. As thesystem generates heat from the fission process, these parameters change. This temperature-induced change is referred to as feedback, and is accounted for by defining a temperaturefeedback coefficient, α, such that
( ) ( )oTT(t)t −α+ρ=ρ � (5)
8
where T(t) is the temperature at time t, and To is the initial temperature of the system.
The temperature can be calculated from Newton’s Law of Cooling,
( )cTT(t)Kn(t)dt
dT −γ−= , (6)
where K is the reciprocal of the heat capacity and γ is a heat transfer coefficient. For thepurposes of the rapid initial heating of the system, adiabatic conditions are assumed, and the heattransfer coefficient can be set to zero. However, we will later see that it does come back intoplay if the system does not self-disassemble after the initial event.
The temperature feedback coefficient is actually a sum of various components, and can be eitherpositive or negative, depending on the system’s design, and which parameters dominate thechange. Obviously, a positive feedback term would cause power to continue to increase, and anegative term would cause power to decrease as temperature increased. However, for mostsimple systems like those normally encountered for criticality safety concerns, the feedback istypically negative. In these cases, this feedback is normally due to material densities decreasingfrom thermal expansion, causing macroscopic cross-sections to go down.
The formulas above allow us to completely predict the power history, energy production, fissionyield, and final temperature of the system. The main problem with all of this is that many of theparameters, especially the temperature feedback coefficient, are difficult to predict for aninadvertent system, since there are many variable conditions that could be postulated as leadingto the event. As a result, the kinetics equations are typically used to qualitatively understand thelikely behavior, and to back-calculate a system’s behavior following an event.
Now that we have a basic understanding of the equations, we can discuss the qualitative aspectsof what they tell us.
The supercritical regime can be broken up into two parts, by drawing a line at the point where ρ= β. This point is referred to as prompt critical, since the system is critical on prompt neutronsalone. Systems with reactivities above this point are referred to as super-prompt critical.
This line also represents a significant point with respect to the kinetics of the system, as can beseen from equation 3. Below the line, the delayed neutron groups dominate the power changes,and time response is rather slow, with positive periods1 ranging from many seconds down to tensof milliseconds. There are no “power pulses” in this range.
It is possible to have a criticality accident occur in this range, but it is rare to see one in practice.The reason is that in the absence of a neutron source, the system will not actually start up until astray neutron comes along to start the chain reaction. In this time period, whatever is happening
1 The system’s period is the amount of time it takes for the power to change by a factor of e1. Negative periodsindicate decreasing power, positive are increasing power.
9
to cause the reactivity increase will continue. Also, even if the system started operating in thisrange, the temperature increase will be very slow, so there will be essentially no feedback tonegate the reactivity addition. Therefore, the addition will continue until the system exceedssuper-prompt critical. It should be noted that plutonium systems will have a higher neutronbackground than uranium systems due to spontaneous fissions and (α, n) reactions.Consequently, the kinetics of plutonium systems can be somewhat different than uraniumsystems, at least for the initial transient.
It is when the system’s reactivity exceeds prompt critical that things really get interesting. At thispoint the period of the system becomes fast enough to ‘outrun’ the delayed neutrons, and they nolonger contribute significantly to the pulse dynamics. From equation 3 it can be seen that if oneignores the delayed neutron groups, the summation term drops out and the equation reduces to asimple exponential function. Therefore, the power increases exponentially with a time constantdetermined by the neutron generation time in the system. This time constant is highly dependenton the composition of the system, but generally ranges from 10-5 to 10-8 seconds. Obviously, thepower will increase very rapidly.
As the system power increases, it deposits a significant amount of energy into the system fasterthan any cooling capability can respond to. Therefore, the system rapidly expands, and thetemperature feedback ultimately causes the power to peak and begin to fall. This is the powerpulse that criticality accidents are famous for. The integral of the power is the total energydeposited, and this can be significant, since peak powers could in some cases exceed 100,000MW before turning over as feedback comes in. Note that after the pulse is over, there is still aproblem: now the delayed neutrons that we previously ignored are coming into play, and thesystem is still supercritical, although less than prompt critical. Therefore, there is still significantpower generated in the ‘tail’ region, unless in some manner the pulse physically disrupts thesystem. As an example of what the initial pulse and power tail from a criticality accident maylook like, figure 1 displays the power levels and energy release for the SPR III fast burst reactoras a function of time. This reactor is an unmoderated, highly enriched metal system designed forsuper-prompt critical pulse operations. The fuel temperature increase for a pulse such as thiswould be about 300oC.

10
1.E+04
1.E+05
1.E+06
1.E+07
1.E+08
1.E+09
1.E+10
1.E+11
0.0000 0.0002 0.0004 0.0006 0.0008 0.0010 0.0012 0.0014 0.0016 0.0018 0.0020
Time (s)
Po
wer
(W
)
1.E+00
1.E+01
1.E+02
1.E+03
1.E+04
1.E+05
1.E+06
1.E+07
En
erg
y (J
)
Figure 1: A typical super-prompt critical pulse on the SPR III fast burst reactor, inserted reactivity is 1.10 x Beta. The resulting fuel temperature increase would be about 300 C.
11
The potential for continued operation is a significant point to remember. In some cases withsolutions the energy deposited in the pulse may be sufficient to cause a steam bubble to begenerated, splashing out the solution. If the container is open, enough material may be ejectedfrom the top to bring the system subcritical, shutting it down. In other cases, the geometry maychange having the same effect. (For example, some previous accidents were caused by transientgeometrical conditions, such as starting stirrers that formed a vortex. When the vortex collapsed,so did the geometry that supported the criticality condition.) Normally with solutions, radiolyticgas bubbles will form, causing volumetric changes that tend to shut the system down. As thebubbles migrate from the system, it may return to its initial supercritical geometry, thus initiatinganother pulse.
It is feasible in a metal system for fuel to melt and slump as a shutdown mechanism, but usuallyheat transfer to surrounding media will preclude this from happening. However, in lieu of theseeffects, the system will continue to generate fissions. As heat is slowly transferred out of thesystem, it could go super-prompt critical again, and generate another pulse.
For either type of system, these oscillatory cycles may well continue, resulting in a gradualincrease in power until it stabilizes at some power level commensurate with heat transfer fromthe system. Therefore, such a system could continue indefinitely, or until enough solution hasboiled away to take it subcritical. This effect was clearly observed in both the recent Japaneseaccident and in the second Russian criticality accident of 1997. In both cases, direct action wasnecessary to physically disrupt the system before the chain reaction could be terminated.
Obviously, the fission yield of a criticality accident is highly dependent on the configuration ofthe system and the circumstances of the situation. However, it is important to note that one canestablish a range for the fission yield based on both past experiences and first principles. While Iwill not go into details, the normal range for the yield from a criticality accident is between1015 and 1020 fissions, with 1017 fissions as a nominal mean value.
Tools for analyzing the critical state of fissionable systems
There are some simple techniques for estimating the critical state of a system, but this would notbe recommended for anything beyond an exercise. Remember that the difference between beingjust subcritical and super-prompt critical is a positive change of only 0.7% for a uranium system,and even less when plutonium is involved. Therefore, accuracy is vitally important.
There are several computer codes that can do criticality calculations. The most popular are theMonte Carlo-based codes like MCNP from Los Alamos or KENO from ORNL. However, all ofthese codes are quite complicated to use with steep learning curves, so I would suggest getting acriticality safety engineer involved if you have a real situation to evaluate. [In this discussion Iwill use results from MCNP to demonstrate various aspects of criticality events. Remember thateach situation is quite unique, and the results shown here are for informational purposes only,and should not be accepted as general conditions.]
12
As an alternative to computer codes, there are a variety of references that can be used todetermine criticality limits for a wide range of materials and conditions. The most widely knownare the ANSI/ANS 8.xx series. This series discusses various aspects of criticality safety,including design of criticality safe containers, criticality alarm systems, critical masses forvarious geometries and forms, and operation and management of criticality safety programs.
To some extent the same comments apply to the neutron kinetics analysis, although the equationsare much more straightforward and easy to use. The problem here is that some of the parameterssuch as the temperature feedback coefficient are difficult to predict, and the models are verysensitive to that term. However, there is not as great of a need to perform kinetics calculations inpractice. Generally, most criticality analyses are conducted by normalizing to a value of totalfissions for the excursion. This is often broken into the total for the initial pulse, and the total forcontinued operations. Therefore, it is only necessary to consider the detailed kinetics whenconducting a post-mortem of an actual event.
Radiation hazards from critical systems
Now that we have some understanding as to the physics and dynamics of a criticality event, wecan discuss the personnel hazards involved.
One point to make at the beginning, and one that we will keep returning to, comes from thediscussions of the last section on kinetics. Criticality accidents are characterized by a veryshort, very intense pulse of radiation, which may be following by additional pulses leading to acontinuous steady-state power level. This is a key concept to remember. For personnel in thevicinity of such an occurrence, there is no way to avoid the initial exposure from the pulse.The initial pulse is generally over in much less than a second, and cannot be anticipated. All theycan do is to evacuate (or be evacuated from) the area as quickly as possible to avoid furtherexposure from the system. Entry into the area after the event should be done very cautiously, ifat all, until the status of the system can be determined.
Under normal conditions, the primary radiation hazards from a criticality accident are the directemissions of neutrons and photons from the system. These emissions can be extremely intenseduring the excursion, and can extend to large distances from the system, depending on theamount of intervening shielding. Following the excursion there will continue to be gammaradiation from the decaying fission products and activated materials in the surrounding area, buttypically at much lower intensities. Depending on the situation, there is a potential for significantlocalized contamination, and some possibility of environmental releases of radioactive materials.
This section will discuss the characteristics of each of these hazards, and consider the situationspecific influences on them.
Before going further, it should be noted that to demonstrate the various types of critical systemsand their characteristics, we would consider six hypothetical systems. These systems may notrepresent real situations, but they do illustrate the principles discussed in this report. All systemsare designed to be super-prompt critical. These systems are:

13
1. A sphere of U3O8, enriched to 97% 235U, and packed to about 50% theoretical density(8.3 gm/cm3). This sphere is sitting in the corner of a room with walls of 10 cm thickconcrete. (This will be referred to as “3-sided reflection”.)
2. A sphere of uranium metal, enriched to 97% 235U, at a density of 17 gm/cm3. Thissphere is sitting in the corner of a room with walls of 10 cm thick concrete.
3. A sphere of U3O8, enriched to 97% 235U, and packed to about 50% theoretical density(8.3 gm/cm3). This sphere is sitting in the corner of a room with walls of 10 cm thicksteel.
4. An unreflected sphere of uranium metal, enriched to 97% 235U, at a density of 17gm/cm3. (Imagine a ball floating in mid-air.)
5. A spherical aluminum tank with a diameter of 48”, filled with Pu(NO3)4 solution to aheight of 40”. The plutonium is the “reactor-grade” isotopic mix.
6. Eight plutonium metal cylinders, 3 kg each, in a 2 x 2 x 2 array in a water-floodedstorage container.
These systems will be used throughout this discussion for comparison purposes. Obviously, oneshould not consider these as generic systems, nor use them to represent real configurations. Infact, the point of much of this is to demonstrate the uniqueness of each situation. As I continueto stress, each system should be analyzed individually.
Neutron flux characteristics
In this section we will discuss the characteristics of the neutrons being emitted from a criticalityevent. There are three primary factors that should be considered in understanding thecharacteristics of the neutron field. These are the neutron leakage probabilities for the system(the same probabilities as discussed in the six-factor formula above), the presence of neutronreflectors near the system, and the energy spectra of the emitted neutrons. Besides these primaryfactors, one should also consider the potential impact that any intervening material, such as wallsor shields, may have on either the total flux or the energy spectrum.
Neutron Leakage ProbabilitiesThe neutron leakage probability is the probability that a neutron will escape the boundary of thefissionable system and not return. In the six-factor formula, this was broken into two parts forthe fast and thermal components. Since the energy spectrum of the escaped neutron flux can varyfrom the spectrum in the system, we will not concern ourselves with these separate components,but only consider the overall leakage. The energy spectrum at the receptor location will bediscussed below.
14
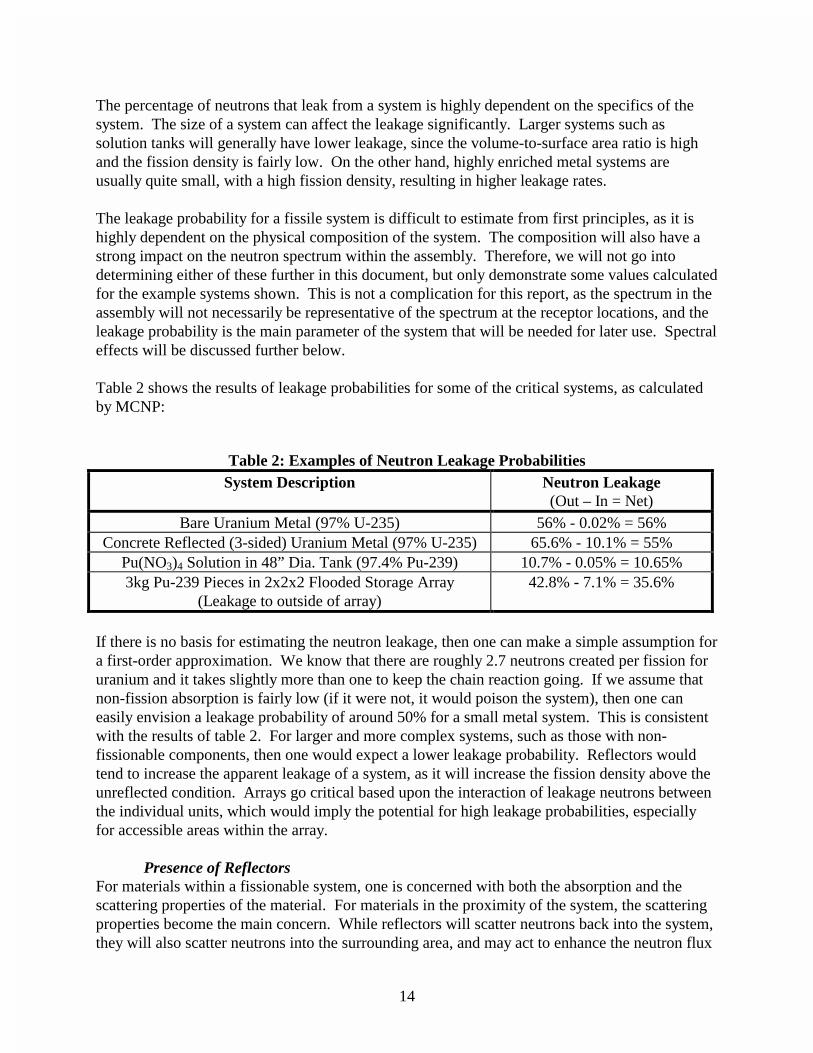
The percentage of neutrons that leak from a system is highly dependent on the specifics of thesystem. The size of a system can affect the leakage significantly. Larger systems such assolution tanks will generally have lower leakage, since the volume-to-surface area ratio is highand the fission density is fairly low. On the other hand, highly enriched metal systems areusually quite small, with a high fission density, resulting in higher leakage rates.
The leakage probability for a fissile system is difficult to estimate from first principles, as it ishighly dependent on the physical composition of the system. The composition will also have astrong impact on the neutron spectrum within the assembly. Therefore, we will not go intodetermining either of these further in this document, but only demonstrate some values calculatedfor the example systems shown. This is not a complication for this report, as the spectrum in theassembly will not necessarily be representative of the spectrum at the receptor locations, and theleakage probability is the main parameter of the system that will be needed for later use. Spectraleffects will be discussed further below.
Table 2 shows the results of leakage probabilities for some of the critical systems, as calculatedby MCNP:
Table 2: Examples of Neutron Leakage ProbabilitiesSystem Description Neutron Leakage
(Out – In = Net)Bare Uranium Metal (97% U-235) 56% - 0.02% = 56%
Concrete Reflected (3-sided) Uranium Metal (97% U-235) 65.6% - 10.1% = 55%Pu(NO3)4 Solution in 48” Dia. Tank (97.4% Pu-239) 10.7% - 0.05% = 10.65%3kg Pu-239 Pieces in 2x2x2 Flooded Storage Array
(Leakage to outside of array)42.8% - 7.1% = 35.6%
If there is no basis for estimating the neutron leakage, then one can make a simple assumption fora first-order approximation. We know that there are roughly 2.7 neutrons created per fission foruranium and it takes slightly more than one to keep the chain reaction going. If we assume thatnon-fission absorption is fairly low (if it were not, it would poison the system), then one caneasily envision a leakage probability of around 50% for a small metal system. This is consistentwith the results of table 2. For larger and more complex systems, such as those with non-fissionable components, then one would expect a lower leakage probability. Reflectors wouldtend to increase the apparent leakage of a system, as it will increase the fission density above theunreflected condition. Arrays go critical based upon the interaction of leakage neutrons betweenthe individual units, which would imply the potential for high leakage probabilities, especiallyfor accessible areas within the array.
Presence of ReflectorsFor materials within a fissionable system, one is concerned with both the absorption and thescattering properties of the material. For materials in the proximity of the system, the scatteringproperties become the main concern. While reflectors will scatter neutrons back into the system,they will also scatter neutrons into the surrounding area, and may act to enhance the neutron flux

15
in occupied areas. Also, the scattering by reflectors can reduce the energy of the neutronspectrum of the radiation field. For example, the concrete reflected uranium system in table 2 isbased on a subcritical quantity of material being put in a corner of a room. In this case the floorand the two intersecting walls reflect neutrons back into the uranium (note the 10% in-leakage intable 2), and also reflect neutrons back towards a person standing in the room. In theparticular case from table 2, the neutron flux at the receptor location, one meter from thecenterline of the system was 3 times higher than the flux at the same point for the unreflectedsystem, for the same number of fission neutrons.
Also, the effect of external reflectors is to reduce the amount of fissionable material necessary togo critical. Therefore, reflected systems are generally smaller, with higher leakage probabilities,than their unreflected counterparts.
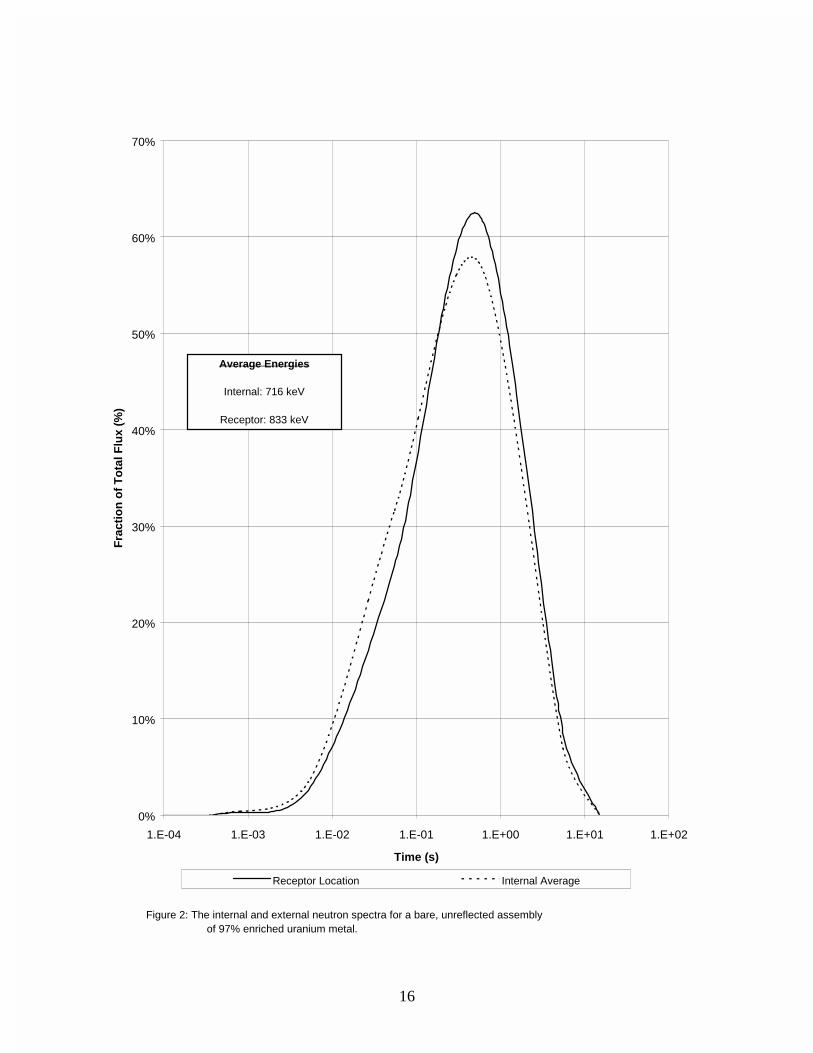
Neutron Spectral EffectsAs discussed, there are various factors that can affect the spectrum of the neutrons at a receptorlocation external to the fissionable system. Self-absorption within the system can result in ahigher average energy, as demonstrated in figure 2. This example is a hypothetical unreflectedmetal system, composed of a 19.8 cm diameter sphere of 97% enrichment uranium metal. Sinceit is unreflected, it would be expected to have essentially a fission spectrum, as confirmed by theMCNP calculations. Note that the spectrum at the receptor location, one meter from thecenterline of the sphere, clearly displays a shift towards the higher energy neutrons, as can alsobe seen by the average energy values. Since there are no other features present in thiscalculation, self-absorption induced hardening can be the only explanation.
16
0%
10%
20%
30%
40%
50%
60%
70%
1.E-04 1.E-03 1.E-02 1.E-01 1.E+00 1.E+01 1.E+02
Time (s)
Fra
ctio
n o
f T
ota
l Flu
x (%
)
Receptor Location Internal Average
Average Energies
Internal: 716 keV
Receptor: 833 keV
Figure 2: The internal and external neutron spectra for a bare, unreflected assembly of 97% enriched uranium metal.
17
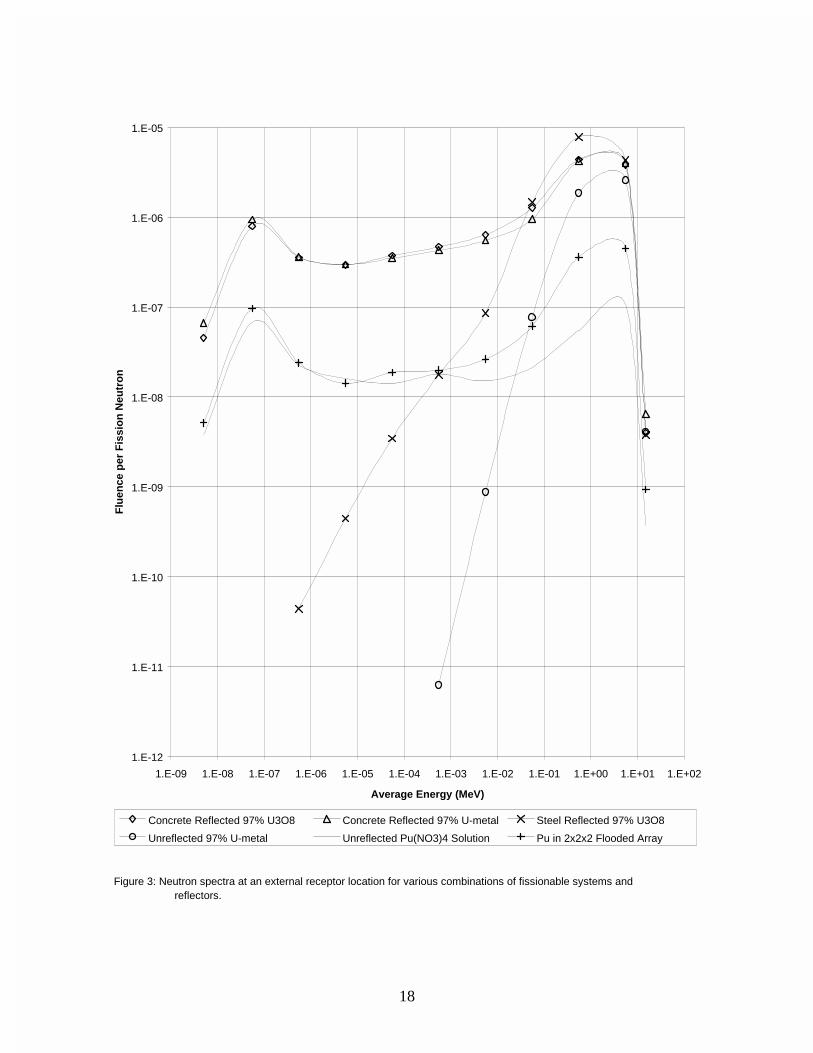
Figure 3 is a plot of the spectra at the receptor location for several of the hypothetical systemslisted in table 2. One can clearly see that for various types of systems, the spectra can vary bylarge amounts. It can also be seen that even for systems of identical internal composition, therecan be significant differences in the spectra based on the presence and composition of reflectors.
As can be seen from figure 3, the neutron spectrum can change dramatically with only subtlechanges in the configuration. Note for example, the differences between the unreflected andconcrete-reflected uranium metal spheres, and between the concrete-reflected and steel-reflectedU3O8 systems. The average neutron energies are listed in table 3 below.
Table 3: Average Neutron Energy at Receptor LocationSystem Description Average Energy (keV)
Concrete Reflected 97% U3O8 Sphere 0.55 x 10⁻³
Concrete Reflected 97% Uranium Metal Sphere 0.43 x 10⁻³
Steel Reflected 97% U3O8 Sphere 44.0Unreflected 97% Uranium Metal Sphere 833.Pu(NO3)4 Solution in 48” Diameter Tank 0.18 x 10⁻³
Pu Metal in 2x2x2 Array, Flooded 0.41 x 10⁻³
Note that Table 3 demonstrates a range of energies that spans six orders of magnitude. As willbe seen later, this will translate into a range of two orders of magnitude in the dose conversionfactors for determining the neutron dose to a victim. Consequently, this demonstrates theimportance of being able to determine the neutron spectrum for the exact situation understudy. It is difficult to estimate the neutron spectrum without detailed information regardingthe exact condition of the system and its surroundings.
18
1.E-12
1.E-11
1.E-10
1.E-09
1.E-08
1.E-07
1.E-06
1.E-05
1.E-09 1.E-08 1.E-07 1.E-06 1.E-05 1.E-04 1.E-03 1.E-02 1.E-01 1.E+00 1.E+01 1.E+02
Average Energy (MeV)
Flu
ence
per
Fis
sio
n N
eutr
on
Concrete Reflected 97% U3O8 Concrete Reflected 97% U-metal Steel Reflected 97% U3O8
Unreflected 97% U-metal Unreflected Pu(NO3)4 Solution Pu in 2x2x2 Flooded Array
Figure 3: Neutron spectra at an external receptor location for various combinations of fissionable systems and reflectors.
19
Gamma flux characteristics
There can be several sources of gamma radiation during and after a criticality event, againdepending on the exact configuration of the system and its surroundings. Contributors to thegamma flux at the receptor location are fission gamma rays, fission-product-decay gamma rays,capture gamma rays, inelastic-scatter gamma rays, reaction-product gamma rays, activation-product gamma rays, annihilation radiation, and bremsstrahlungD. While this list pretty muchcovers the entire range of possible sources, we can reduce the discussion somewhat by dividingthem into groups based on the timeframes in which they are significant. For the purpose of thisdiscussion, let’s define the following groups:
• Prompt gamma rays are those which are produced during the fission process. Thiswould include both fission gamma rays, and those produced during neutron interactionswith matter, such as capture, reaction-product, and neutron scatter gamma rays. Once thefission process is terminated, these would not be present.
• Early decay gamma rays are those emitted during the decay of short-lived fission andactivation products that contribute to the gamma radiation field immediately after theevent. This group will contribute to the acute doses to the victims before they can beevacuated from the area. While it is difficult to define a universally applicabletimeframe, one convenient value would be the first 45 seconds, as this has been evaluatedin the literature (ref. D).
• Late decay gamma rays are those emitted from the decay of longer-lived fission andactivation products. This group will contribute to the residual radiation field after anevent, resulting in doses to rescue and recovery personnel.
Due to the processes involved, the gamma radiation field associated with any criticality eventwill be highly dependent on the exact physical arrangement involved. This is apparent from thevarious mechanisms for creating the photons described above. Therefore we cannot create adetailed estimate of the dose that one would receive, but we can discuss and estimate majorcontributors to the doses from the event itself.
Prompt Gamma Rays Gamma rays emitted simultaneously with the fission process have been extensively studied for235U, and much less so for other fissionable materials (at least at the time ref. D was published).Therefore, we will assume 239Pu to yield similar results. These emissions have been found toproduce a fairly continuous spectrum of energies from 10 keV up to about 10 MeV. For thosegamma rays emitted during the first 50 nanoseconds after fission, there is an average of 8.1photons per fission, carrying off 7.25 MeV per fission event. In addition, another 0.98 MeV ofenergy is emitted during the rest of the first second after fission. Short-lived fission productscontribute another 0.3 MeV/fission of gamma radiation in the first second (ref. D). The numberof photons emitted per fission in the last two cases is not given in the reference, but for ourpurposes we can assume that each is represented by one photon carrying the total energy perfission.
20
Capture and neutron scattering gamma rays can also be significant contributors in this initialphase, but are harder to estimate. Materials in the immediate area of the event emit them, andtherefore one must know the specifics of the physical layout of the event. Photons from captureevents can be very energetic, ranging from 2.2 MeV up to about 11 MeV, with neutron scatteringphotons being typically lower in energy. Both types of emissions depend on the initial neutronenergy, but in opposite directions. Capture gamma rays will be higher for lower energy neutrons,where capture cross-sections are higher, but neutron scattering photons will increase with higherneutron energies. Reaction-product gamma rays are produced in events similar to inelastic neutron scatters, but aparticle other than a neutron is emitted from the absorbing nucleus. For example, the 10B(n,α)7Lireaction emits a gamma ray of 0.5 MeV. However, since only relatively few isotopes react in thisway, we will ignore them for now.
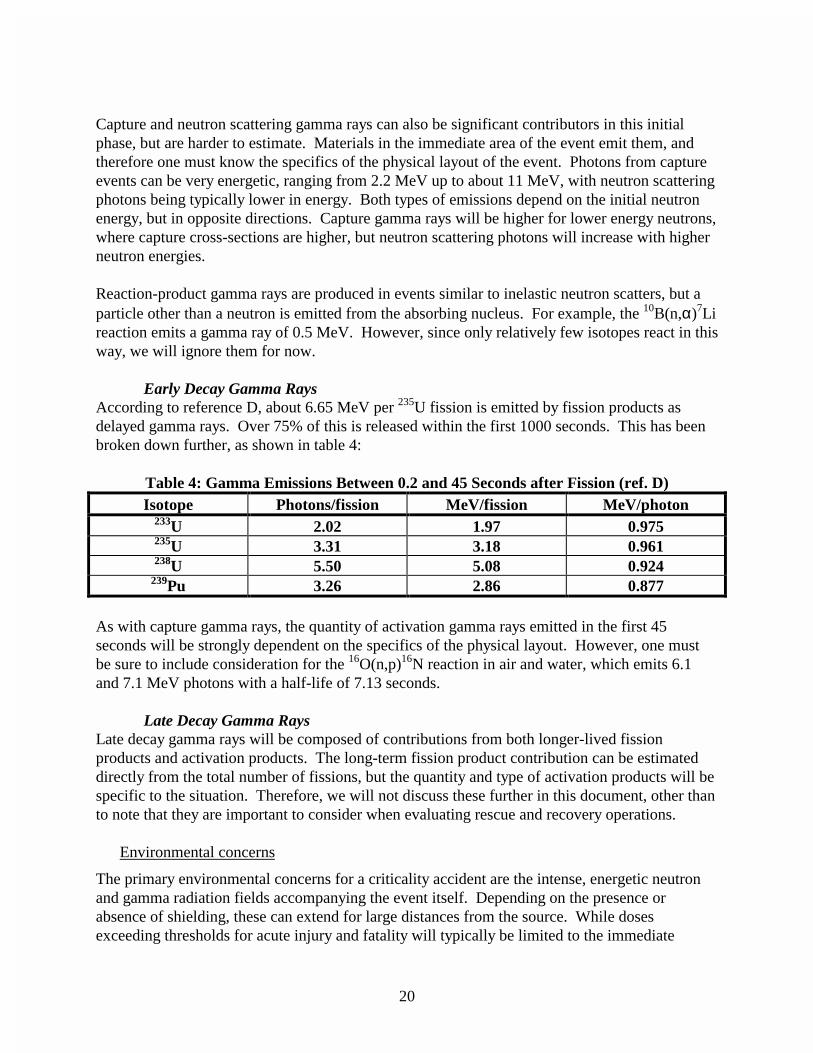
Early Decay Gamma Rays According to reference D, about 6.65 MeV per 235U fission is emitted by fission products asdelayed gamma rays. Over 75% of this is released within the first 1000 seconds. This has beenbroken down further, as shown in table 4:
Table 4: Gamma Emissions Between 0.2 and 45 Seconds after Fission (ref. D) Isotope Photons/fission MeV/fission MeV/photon
233U 2.02 1.97 0.975 235U 3.31 3.18 0.961 238U 5.50 5.08 0.924 239Pu 3.26 2.86 0.877
As with capture gamma rays, the quantity of activation gamma rays emitted in the first 45seconds will be strongly dependent on the specifics of the physical layout. However, one mustbe sure to include consideration for the 16O(n,p)16N reaction in air and water, which emits 6.1and 7.1 MeV photons with a half-life of 7.13 seconds.
Late Decay Gamma Rays Late decay gamma rays will be composed of contributions from both longer-lived fissionproducts and activation products. The long-term fission product contribution can be estimateddirectly from the total number of fissions, but the quantity and type of activation products will bespecific to the situation. Therefore, we will not discuss these further in this document, other thanto note that they are important to consider when evaluating rescue and recovery operations.
Environmental concerns
The primary environmental concerns for a criticality accident are the intense, energetic neutronand gamma radiation fields accompanying the event itself. Depending on the presence orabsence of shielding, these can extend for large distances from the source. While dosesexceeding thresholds for acute injury and fatality will typically be limited to the immediate
21
vicinity of the event, significant doses can be received by collocated personnel, potentiallyexceeding annual regulatory limits. In addition, depending on the situation, members of thepublic could also be exposed. Environmental releases of radioactive material can also occur, and should be considered forcompleteness. Depending on the exact situation, these may or may not have significant impacton the situation. Both DOE and the NRC have discussions of techniques for evaluating thesereleases in their accident analysis handbooks. DOE’s version is Airborne ReleaseFractions/Rates and Respirable Fractions for Nonreactor Nuclear Facilities, DOE-HDBK-3010-94, volume I. It is available online at http://tis.eh.doe.gov/techstds/standard/appframe.html (beforewarned, this is the full document, and is over 3.9 megabytes in size). In either case, the approach is the same. First, the airborne source term is determined from
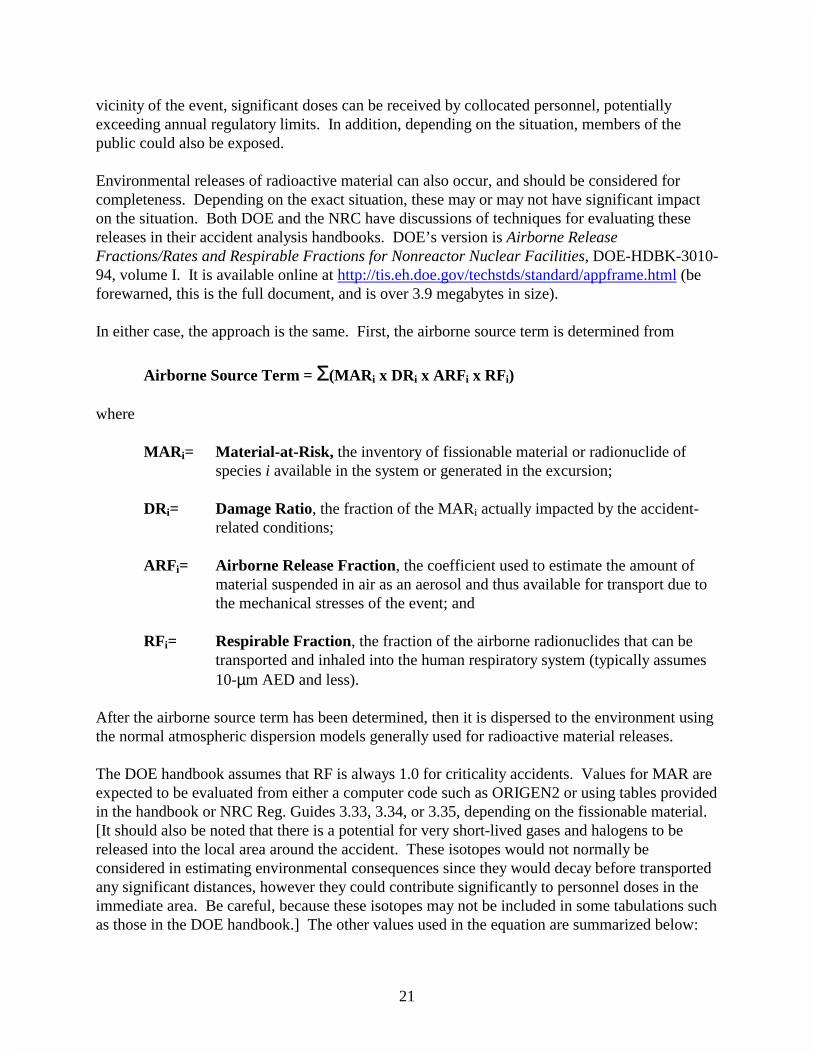
Airborne Source Term = Σ(MARi x DRi x ARFi x RFi) where
MARi= Material-at-Risk, the inventory of fissionable material or radionuclide ofspecies i available in the system or generated in the excursion;
DRi= Damage Ratio, the fraction of the MARi actually impacted by the accident-
related conditions; ARFi= Airborne Release Fraction, the coefficient used to estimate the amount of
material suspended in air as an aerosol and thus available for transport due tothe mechanical stresses of the event; and
RFi= Respirable Fraction, the fraction of the airborne radionuclides that can be
transported and inhaled into the human respiratory system (typically assumes10-µm AED and less).
After the airborne source term has been determined, then it is dispersed to the environment usingthe normal atmospheric dispersion models generally used for radioactive material releases. The DOE handbook assumes that RF is always 1.0 for criticality accidents. Values for MAR areexpected to be evaluated from either a computer code such as ORIGEN2 or using tables providedin the handbook or NRC Reg. Guides 3.33, 3.34, or 3.35, depending on the fissionable material.[It should also be noted that there is a potential for very short-lived gases and halogens to bereleased into the local area around the accident. These isotopes would not normally beconsidered in estimating environmental consequences since they would decay before transportedany significant distances, however they could contribute significantly to personnel doses in theimmediate area. Be careful, because these isotopes may not be included in some tabulations suchas those in the DOE handbook.] The other values used in the equation are summarized below:

22
Table 5: Summary of DRs and ARFs for Airborne Source Terms Scenario MAR Type DR ARF
Solution Systems Noble Gases generated by event 1.0 1.0 Radioiodines generated by event 1.0 0.25 Non-volatiles in quantity evaporated 1.0 0.0005 Radioruthenium in reprocessing solutions 1.0 0.001
FullyModerated/Reflected
Noble gases generated by event 0.1 0.5
Solids (metal pieces) Radioiodines generated by event 0.1 0.05 Fully
Moderated/Reflected Noble gases generated by event 1.0 0.5
Solids (fines, powders) Radioiodines generated by event 1.0 0.05 Bare, Dry Solids Noble gases generated by event 0.1 0.5
(metal pieces) Radioiodines generated by event 0.1 0.05 Large Storage Arrays Noble gases generated by event 1.0 0.5 (Upper Bound Only) Radioiodines generated by event 1.0 0.05
Past experiences have also shown that criticality accidents are often accompanied by significantlocalized contamination. This is most likely resulting from a combination of the materialreleases discussed above in this section and activation of dust and loose material in the vicinity ofthe event. While this is a hazard for the personnel involved in rescue and recovery operations, itcan also be a source of environmental releases. While not a criticality accident, it was observedat the plutonium glovebox fires of the 1950’s and 1960’s at Rocky Flats that a primaryenvironmental release was due to the spread of contamination during firefighting and recoveryoperations. This can be evaluated using typical resuspension models. For example, DOE-HDBK-3010-94 recommends a bounding value of 4 x 10⁻⁵ /hour as an airborne release rate, witha respirable fraction of 1.0, for a freshly deposited, homogeneous bed of powder exposed toambient conditions. When dealing with the environmental releases from a criticality accident, it must be recognizedthat a large fraction of the noble gases and halogens produced have short halflives. Within therealm of a normally operating system, these radioisotopes would rarely be present since theywould decay before release. However, in the case of many criticality accident scenarios, onecannot assume that a ventilation system is designed and optimized for dealing with such releases.Therefore, there are two basic approaches to evaluating doses from these shortlived isotopes. The first approach would be to assume that the criticality accident directly releases the materialinto the ambient airstream, resulting in immediate dispersion to the environment. Radioactivedecay could be accounted for during the transit time to the target of interest if desired. Thisassumption would tend to overestimate the resulting doses, and would therefore be conservative. However, it would be desirable and sometimes necessary to consider the more realistic casewhere the system disperses the material into a room at one characteristic rate, and the material isremoved from the room at a different rate characterized by the flow of the ventilation system.

23
This results in a time delay between production and release to the environment. While thisapproach is in general a much more complex system than the first, there is a method forapproximating the fraction of material that would decay during the time delay versus the fractionthat would be released outside the room. From Appendix B of ICRP 37, the concentration ofradioactive material in a room as a function of time (the “ventilation equation”) is
( )( ) ( )tQ
otQ eCe
Q
AC(t) µλµ+−µλµ+− +−
λµ+= ������1
where C(t) is the concentration in the volume at time t (activity/volume); A is the activity entering the volume per unit time (activity/second); Q is the ventilation flow rate (volume/second); λ is the radioactive decay constant (sec-1); and µ is the room volume. If the contaminant is stable, that is, does not decay radioactively, then the equation reduces to
( )( ) ( )tQ
otQ eCe
Q
AC(t) µ−µ− +−= ��1 .
Also, if one assumes that the ventilation flow rate is expressed in the room exchange rate (roomchanges per unit time) rather than based on unit volumes, then µ becomes 1, and C(t) becomesthe total quantity of activity in the room at time t. (This is convenient in that it reduces theamount of information necessary in order to evaluate a postulated scenario.) Now, assume that the concentration in the room reaches equilibrium between production andremoval (in effect, letting t approach infinity) in both equations, and take the ratio of the two.The resulting expression,
Q1
1
Q
Q Ratio λ+
=λ+
=
is the fraction of material that is removed by the ventilation system after decay. This result yieldsa simple relationship that allows the estimation of the fraction of a shortlived radioisotope thatwould escape from the room into the environment. While this ratio does not account for thetime-dependency of the release, it should provide a reasonable approximation for the purpose ofthis document.

24
Room Release Fraction
0%
10%
20%
30%
40%
50%
60%
70%
80%
90%
100%
1.E+00 1.E+01 1.E+02 1.E+03 1.E+04 1.E+05 1.E+06
Halflife (s)
Rel
ease
Fra
ctio
n
Q = 2 / hour
Q= 4 / hour
Q = 6 / hour
Q = 8 /hour
Q = 10 /hour
Figure 4: Room release fraction as function of radioisotope halflife. The result of this estimation is shown in figure 4 for several possible room exchange rates. Notethat for halflives of less than 1 second, essentially all decay occurs in the room, and for those ofgreater than about 1 day (86,400 s), essentially all escape without decay. This relationship can beused directly to modify the airborne release fractions discussed above to provide a more realisticestimate of the radiation doses to individuals outside of the building where the criticality accidentoccurs.
Tools for determining radiation hazards
Besides the computer codes already discussed for determining neutron radiation fields, there areseveral tools available for evaluating the hazards present from a criticality accident. In the handsof a knowledgeable person, MCNP may also be able to provide adequate information regardingthe gamma radiation fields (sorry, no tips from me - I am not that much of an expert withMCNP). Also of use for neutrons is IAEA Technical Report 180, Compendium of Neutron Spectra inCriticality Accident Dosimetry, 1978, which contains measured and calculated neutron spectrafor a wide variety of fissionable systems. This document also included spectra from reflectedsources and through various shields.

25
For environmental impacts, the methodology of the accident analysis handbooks will onlyprovide an estimate of the airborne source terms. Additional tools are necessary for estimatingthe dispersion of this material into the environment. While simple dispersion calculations can beperformed with the basic Pasquill-Gifford dispersion modelsE, computer codes such asHOTSPOT from LLNL, or MACCS2 can perform more detailed evaluations of environmentaland population impacts from such an accident.
Operational experiences with critical systems
There have been about 60 criticality accidents since 1945. In the Free World there have been 9nonreactor process accidents, including the recent one in Japan, and 33 accidents involving eitherreactors or critical experiments. There have also been at least 14 criticality accidents in theFormer Soviet Union, although details on those are somewhat sketchy. By my count (not official by any means) this has resulted in about 48 fatalities and more than 69significant non-fatal exposures. This breaks down as follows:
Non-Soviet:• 3 fatalities in process accidents (LASL 1958, Wood River Junction 1964, JCO 1999)• 3 fatalities in critical experiments (LASL 1945, LASL 1946, Russia 1997)• 4 fatalities in reactor accidents (SL-1 1961 (3), Brazil, 1980)• 69 non-fatal significant exposures ranging from 3 to ~500 rem
Former Soviet Union (pre-1997):
• 6 fatalities in 12 accidents (3 in one solution-based critical experiment accident)• 1 individual blinded• 1 amputation of both legs• 17 cases of “radiation sickness”• ~30 – 33 acute fatalities at Chernobyl• ??? non-fatal significant exposures at Chernobyl
These accidents have been discussed extensively in the literatureF, and this document will not tryto repeat the descriptions here. However, in Knief’s book (see ref. E, first bullet) there is ananalysis of the frequent elements and factors for criticality accidents in U.S. processing plantsthat does bear repeating here:
26
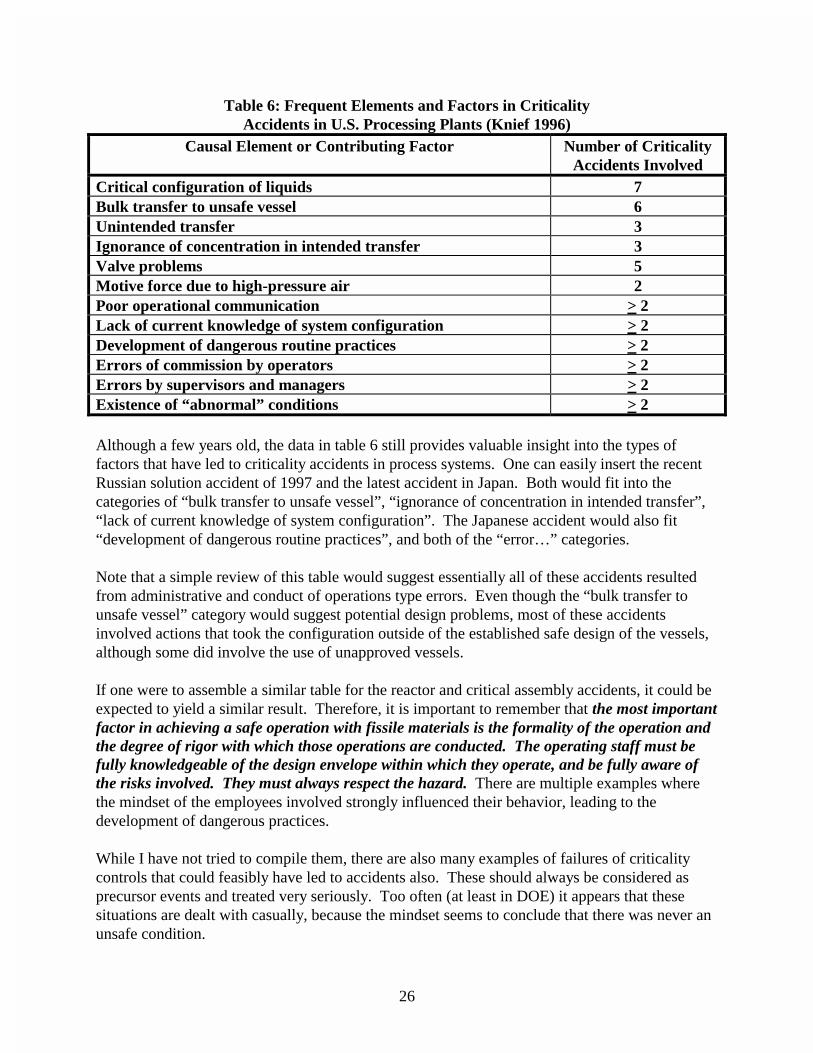
Table 6: Frequent Elements and Factors in CriticalityAccidents in U.S. Processing Plants (Knief 1996)
Causal Element or Contributing Factor Number of CriticalityAccidents Involved
Critical configuration of liquids 7Bulk transfer to unsafe vessel 6Unintended transfer 3Ignorance of concentration in intended transfer 3Valve problems 5Motive force due to high-pressure air 2Poor operational communication > 2Lack of current knowledge of system configuration > 2Development of dangerous routine practices > 2Errors of commission by operators > 2Errors by supervisors and managers > 2Existence of “abnormal” conditions > 2
Although a few years old, the data in table 6 still provides valuable insight into the types offactors that have led to criticality accidents in process systems. One can easily insert the recentRussian solution accident of 1997 and the latest accident in Japan. Both would fit into thecategories of “bulk transfer to unsafe vessel”, “ignorance of concentration in intended transfer”,“lack of current knowledge of system configuration”. The Japanese accident would also fit“development of dangerous routine practices”, and both of the “error…” categories.
Note that a simple review of this table would suggest essentially all of these accidents resultedfrom administrative and conduct of operations type errors. Even though the “bulk transfer tounsafe vessel” category would suggest potential design problems, most of these accidentsinvolved actions that took the configuration outside of the established safe design of the vessels,although some did involve the use of unapproved vessels.
If one were to assemble a similar table for the reactor and critical assembly accidents, it could beexpected to yield a similar result. Therefore, it is important to remember that the most importantfactor in achieving a safe operation with fissile materials is the formality of the operation andthe degree of rigor with which those operations are conducted. The operating staff must befully knowledgeable of the design envelope within which they operate, and be fully aware ofthe risks involved. They must always respect the hazard. There are multiple examples wherethe mindset of the employees involved strongly influenced their behavior, leading to thedevelopment of dangerous practices.
While I have not tried to compile them, there are also many examples of failures of criticalitycontrols that could feasibly have led to accidents also. These should always be considered asprecursor events and treated very seriously. Too often (at least in DOE) it appears that thesesituations are dealt with casually, because the mindset seems to conclude that there was never anunsafe condition.
27
It is often observed that criticality safety controls are dominated by administrative rather thanphysical controls. While it is recommended that systems be designed to physically control atleast two independent parameters (see table 1), it is often difficult to do in practice. Therefore,systems often depend on multiple controls of single parameters, and frequently administrativecontrols are used in combination with physical controls. This should always be done withcaution, as the experience base indicates that administrative controls are often the weakest link inthe operation.
One other point to be made regarding the past experience base. The most common characteristicof these accidents is that each is quite unique and unanticipated, and obviously not predictable.On the opposite hand, it is occasionally observed that safety analyses of fissile material processesassume that the criticality safety controls result in dropping the accident frequency down to the“incredible” or “extremely unlikely” probability bins (i.e., a frequency of less than 10-6 per year).From this discussion, one can see that this should always be done with great caution, since it willaffect the mindset of the operating staff.
Radiation doses from criticality accidents
Up to this point, this discussion has attempted to provide a fundamental understanding of thephysics, behavior, and characteristics of critical systems. Given that basis, we can now discussthe human consequences from such an event. We have seen that critical systems have basiccommonalities in the behavior of the system and the types of radiation fields. However, it is alsoobvious that the specifics of each situation will have a strong impact on the relative significanceof each of these factors in determining the consequences from an event. Therefore it is obviousthat each situation must be evaluated separately, but the tools used are generally common to allsituations.
In this section we will discuss the basic techniques for evaluating the consequences from acriticality accident. It should be noted that, once the characteristics of the radiation fields areestablished, the techniques for estimating radiation doses are the same as would be applied forany other health physics application.
Estimation of doses for postulated accidents
The first thing to remember is that for the directly involved victims of a criticality accident,radiation doses will likely exceed thresholds for the onset of acute injury or death. [While wehave not discussed the biological effects of high doses of radiation, they are well documented inthe literature, and should be familiar to practicing health physicists.G] These deterministic effectsare based on the absorbed dose to the individual, and not the dose equivalent, which is intendedto estimate stochastic effects like cancer induction. Therefore, it is customary and appropriatethat doses be evaluated in terms of absorbed dose in rad or gray. For collocated workers andother incidental exposures, it will still be appropriate to determine the dose equivalent, but wewill not concern ourselves with that here, as it will typically only involve the inclusion of thequality factor (QF) into the dose calculations.

28
As with any radiation field, the important characteristics to know for dose assessment are thetype, intensity, and energy spectrum. Once these are determined, then the appropriate doseconversion factors can be applied. In the case of criticality accidents, this is not alwaysstraightforward without detailed information, as has been stressed previously. However, one canmake some assumptions that simplify matters for first order estimates. While this may not berecommended in general practice, these assumptions help to gain an appreciation for the relativecontributions from the different components of an exposure to a criticality event. The basicassumptions that we will apply in this section are:
1. The radiation fields (both neutron and photons) will be assumed to follow the inverse-square law with distance from the critical system. The effects of room scattering andspectral changes will be ignored for photons.
2. Scattering of neutrons outside of the system will only be considered if the scenariosuggests that there is a partial reflector near the system, such as a wall, that willscatter neutrons towards the receptor. In this case, the reflected neutrons will betreated as a simple multiple of the source neutrons.
3. There are no secondary sources of neutrons, such as photoneutron production, thatwill increase the number of neutrons from the system. Consequently, the totalnumber of neutrons generated is a direct function of the number of fissions.
4. The energy spectrum of the neutrons at the receptor will be the same as the spectrumof the neutrons leaking from the system. No corrections for in-transit spectralchanges will be made.
Neutron DoseThe accurate calculation of the neutron dose depends on the degree of knowledge availableregarding the neutron spectrum. This is due to the fact that the dose conversion factors forneutrons are dependent on energy and the neutron spectrum can range over eight orders ofmagnitude, depending on the situation. Therefore, the conversion factors must be ‘folded’together with the spectrum to arrive at an accurate dose estimate. While one can in principleassume an average energy for the neutrons and use a single-point estimate, it will be seen thatthese are of somewhat limited value.
For neutron conversion factors, I elected to create them from the table of quality factors forneutrons in DOE’s 10CFR835 (I have not compared these to 10CFR20, but would expect them tobe the same, since they are both based on ICRP 38). Table 7 contains the relevant informationfor creating these factors.

29
Table 7: Neutron Absorbed Dose Conversion FactorsEnergy (MeV)
(Note 1)
QualityFactor
(Note 1)
n/cm2-s100 mrem/40 hrs
(Note 1)
remn/cm2
(Note 2)
radn/cm2
(Note 3)1 x 10⁻⁸ 2 680 1.02 x 10⁻⁹ 5.1 x 10⁻¹⁰
1 x 10⁻⁷ 2 680 1.02 x 10⁻⁹ 5.1 x 10⁻¹⁰
1 x 10⁻⁶ 2 560 1.24 x 10⁻⁹ 6.2 x 10⁻¹⁰
1 x 10⁻⁵ 2 560 1.24 x 10⁻⁹ 6.2 x 10⁻¹⁰
1 x 10⁻⁴ 2 580 1.2 x 10⁻⁹ 6.0 x 10⁻¹⁰
1 x 10⁻³ 2 680 1.02 x 10⁻⁹ 5.1 x 10⁻¹⁰
1 x 10⁻² 2.5 700 9.92 x 10⁻¹⁰ 3.97 x 10⁻¹⁰
1 x 10⁻¹ 7.5 115 6.04 x 10⁻⁹ 8.05 x 10⁻¹⁰
1.0 11 19 3.65 x 10⁻⁸ 3.32 x 10⁻⁹
10.0 6.5 17 4.09 x 10⁻⁸ 6.28 x 10⁻⁹
20.0 8 18 6.31 x 10⁻⁸ 7.89 x 10⁻⁹
(1) Value taken directly from 10 CFR 835.2.(2) Value rem/(n/cm2) obtained by dividing column 3 into 6.944 x 10⁻⁷ rem/s.(3) Value rad/(n/cm2) obtained by dividing column 4 by the quality factor.
[It should be noted that the energies selected in table 7 were chosen to correspond with energyranges that I used in calculating neutron energy spectra with MCNP. One could certainly use adifferent approach, depending on the form of the conversion factor necessary for the application.]
Using these conversion factors and the neutron spectrum from a modeled scenario, one candirectly estimate the neutron dose at some receptor location. Following the examples that havebeen previously discussed and graphed in figure 3, one obtains the results shown in table 8.
Table 8: Neutron Absorbed Dose per Fission Neutron at Receptor LocationSystem Description Average Energy
(keV)Absorbed Dose
rad/(fission neutron)Concrete Reflected 97% U3O8 Sphere 0.55 x 10⁻³ 4.1 x 10⁻¹⁴
Concrete Reflected 97% Uranium Metal Sphere 0.43 x 10⁻³ 4.2 x 10⁻¹⁴
Steel Reflected 97% U3O8 Sphere 44.0 5.43 x 10⁻¹⁴
Unreflected 97% Uranium Metal Sphere 833. 2.24 x 10⁻¹⁴
Pu(NO3)4 Solution in 48” Diameter Tank 0.18 x 10⁻³ 9.54 x 10⁻¹⁶
Pu Metal in 2x2x2 Array, Flooded 0.41 x 10⁻³ 4.18 x 10⁻¹⁵
From table 8 one notices the broad spread between the different values of absorbed dose, varyingby as much as a factor of 56 between the highest and lowest values. This demonstrates theaccumulation of the effects we have discussed previously. Doses will tend to go down as neutronenergy goes down, but partial reflectors such as walls would increase the flux at the receptor. Ifwe use row 4 as a reference point (no reflectors and essentially a fission spectrum), then one canmake the following observations:

30
• Rows 1 and 2 were higher due to the effects of the ‘wall’ reflector, but this wasreduced somewhat by the significant moderation of the neutrons.
• Row 3 was higher due to the ‘wall’ also, but with the steel reflectors there was lessmoderation, so the average energy was higher than rows 1 and 2, resulting in a higherdose.
• Row 5 is lower due to the lower leakage probability of the larger volume system, andthe low average energy due to moderation.
• Row 6 is not as low as row 5 due to somewhat higher leakage from the compact, fullyreflected array configuration.
One would be tempted to use the average neutron energy to calculate a dose rather thanspectrum-weighting the conversion factors as done above. This could be based on a simpleformula
)4 2 ave
lneutrons xDCF(E
r
FD
πρυ= , (7)
where
υ = number of neutrons per fission; F = number of fissions; pl = total leakage probability; DCF(Eave) = Dose Conversion Factor for average neutron energy; and r = Distance to receptor in centimeters. For first order estimates, one could use the leakage probabilities and average energies determinedin this document, as long as they were appropriate for the system under study. Note though that this should be resisted unless there is no other information available, since asseen from figure 3, many of these spectra tend to be bimodal. The average energy is notnecessarily representative of the full spectrum. In order to demonstrate this effect, table 9contains the resulting values.
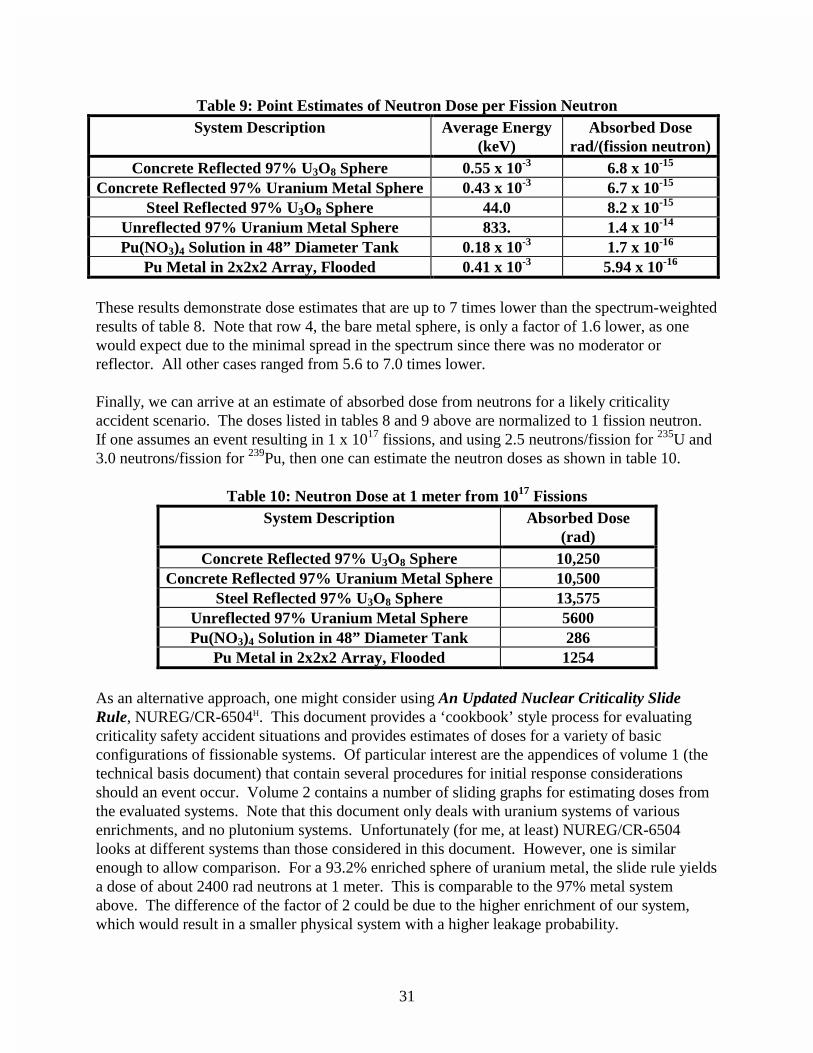
31
Table 9: Point Estimates of Neutron Dose per Fission Neutron System Description Average Energy
(keV) Absorbed Dose
rad/(fission neutron) Concrete Reflected 97% U3O8 Sphere 0.55 x 10⁻³ 6.8 x 10⁻¹⁵
Concrete Reflected 97% Uranium Metal Sphere 0.43 x 10⁻³ 6.7 x 10⁻¹⁵
Steel Reflected 97% U3O8 Sphere 44.0 8.2 x 10⁻¹⁵
Unreflected 97% Uranium Metal Sphere 833. 1.4 x 10⁻¹⁴
Pu(NO3)4 Solution in 48” Diameter Tank 0.18 x 10⁻³ 1.7 x 10⁻¹⁶
Pu Metal in 2x2x2 Array, Flooded 0.41 x 10⁻³ 5.94 x 10⁻¹⁶
These results demonstrate dose estimates that are up to 7 times lower than the spectrum-weightedresults of table 8. Note that row 4, the bare metal sphere, is only a factor of 1.6 lower, as onewould expect due to the minimal spread in the spectrum since there was no moderator orreflector. All other cases ranged from 5.6 to 7.0 times lower. Finally, we can arrive at an estimate of absorbed dose from neutrons for a likely criticalityaccident scenario. The doses listed in tables 8 and 9 above are normalized to 1 fission neutron.If one assumes an event resulting in 1 x 10¹⁷ fissions, and using 2.5 neutrons/fission for 235U and3.0 neutrons/fission for 239Pu, then one can estimate the neutron doses as shown in table 10.
Table 10: Neutron Dose at 1 meter from 1017 Fissions System Description Absorbed Dose
(rad) Concrete Reflected 97% U3O8 Sphere 10,250
Concrete Reflected 97% Uranium Metal Sphere 10,500 Steel Reflected 97% U3O8 Sphere 13,575
Unreflected 97% Uranium Metal Sphere 5600 Pu(NO3)4 Solution in 48” Diameter Tank 286
Pu Metal in 2x2x2 Array, Flooded 1254 As an alternative approach, one might consider using An Updated Nuclear Criticality SlideRule, NUREG/CR-6504H. This document provides a ‘cookbook’ style process for evaluatingcriticality safety accident situations and provides estimates of doses for a variety of basicconfigurations of fissionable systems. Of particular interest are the appendices of volume 1 (thetechnical basis document) that contain several procedures for initial response considerationsshould an event occur. Volume 2 contains a number of sliding graphs for estimating doses fromthe evaluated systems. Note that this document only deals with uranium systems of variousenrichments, and no plutonium systems. Unfortunately (for me, at least) NUREG/CR-6504looks at different systems than those considered in this document. However, one is similarenough to allow comparison. For a 93.2% enriched sphere of uranium metal, the slide rule yieldsa dose of about 2400 rad neutrons at 1 meter. This is comparable to the 97% metal systemabove. The difference of the factor of 2 could be due to the higher enrichment of our system,which would result in a smaller physical system with a higher leakage probability.

32
Gamma Dose The estimation of the gamma dose rate from an accident is complicated due to basically the samereason the neutron dose is difficult to determine – one should have detailed information about thephysical configuration of the system, and the layout and characteristics of the location. In thisdiscussion, we have ignored photons generated by capture, neutron scattering, and reaction-product interactions both within the fissionable system and the surrounding area. This is not dueto the fact that they are negligible, but rather due to the fact that they cannot be determined for ageneric situation. They should certainly be considered to the extent possible for an actualevaluation. Given this limitation, we can still estimate the gamma doses from the prompt gamma raysgenerated during the fission process and the early decay gamma rays from the fission products.We will ignore the late gamma rays from fission product decay (those after the first 45 seconds),but not because they are indeterminable as the others discussed above. But rather, in most pastaccidents the personnel involved have generally evacuated or been removed from the room veryquickly after the first pulse. Therefore, we will assume that they are only exposed to the systemfor the first 45 seconds, and that the later radiation levels would only be of concern forrescue/recovery operations. Recall from our previous discussion on the photon radiation fields the following results:
• Prompt gamma rays: 7.25 Mev per 8.1 photons (average energy 0.895 MeV) withinthe first 50 nanoseconds; 0.98 MeV per 1 photon additional up to first second; and 0.3MeV per 1 photon from very short-lived fission products in first second.
• Early decay gamma rays: For 235U, 3.18 MeV per 3.31 photons (average energy 0.961MeV) in first 45 seconds. For 239Pu, 2.86 MeV per 3.26 photons (average energy0.877 MeV) in first 45 seconds.
For photon flux-to-dose conversion factors, I generally use a table from ANS-6.1I, although thereare probably newer tables that should be considered. Pulling only the values necessary for theappropriate energies and converting to proper units:
Table 11: Appropriate Photon Flux-to-Dose Conversion Factors Photon Energy (MeV) rad per photon/cm2
0.3 2.11 x 10⁻¹⁰
0.877 4.99 x 10⁻¹⁰
0.895 5.06 x 10⁻¹⁰
0.96 5.33 x 10⁻¹⁰
0.98 5.41 x 10⁻¹⁰
For photons we can use an equation similar to equation 7. As with neutrons, there will be somescattering and spectral softening that occurs with photons. However, since we do not havesufficient information (even less than what is available for the neutron case), we will ignore theseissues and apply a simple inverse-square law approximation.

33
)4
(2 avep
ave
E allphotons (ExDCF
r
)FED
save' πδ= ∑ , (8)
where F = number of fissions; δ(Eave) = number of photons of average energy Eave per fission; DCFp(Eave) = Dose Conversion Factor for photons of average energy Eave; and r = Distance to receptor in centimeters. Applying this method to the previous scenarios yields the following estimates of gamma doses.
Table 12: Gamma Dose at 1 meter from 1017 Fissions System Description Absorbed Dose
(rad) Concrete Reflected 97% U3O8 Sphere 5263
Concrete Reflected 97% Uranium Metal Sphere 5263 Steel Reflected 97% U3O8 Sphere 5263
Unreflected 97% Uranium Metal Sphere 5263 Pu(NO3)4 Solution in 48” Diameter Tank 5153
Pu Metal in 2x2x2 Array, Flooded 5153 These numbers are clearly higher than one might expect, by comparison with both NUREG/CR-6504 and with doses determined from actual events when personnel were within this range of thesystem. Comparison with the Slide Rule suggest that the bare metal sphere gamma dose abovecould be 17 – 20 time high, and the solution system dose could be a factor of 5 high. Therefore,let’s consider what may have led to this situation:
• From table 12, note that gamma doses are the same for all systems of the same fissionablematerial. This is a limitation of the simplifications that we took in arriving at theestimates. In reality, the doses would vary based on system configuration, mainly due toself-absorption within the system. The effectiveness of self-absorption would be basedon the density and volume of the fissionable system. This would certainly be highest forthe four uranium case studies (rows 1 – 4). The uranium metal density is about 17gm/cm3, and the U3O8 density is about half of that. The solution systems are much lower.
• This estimate assumed a point-energy value for the gamma rays. However, in realitythese photons will cover a broad range of energies, and a spectrum-weighted conversionfactor should be used, similar to that applied to the neutrons. For example, the majorcontributors to table 12 are the prompt fission gamma rays.
34
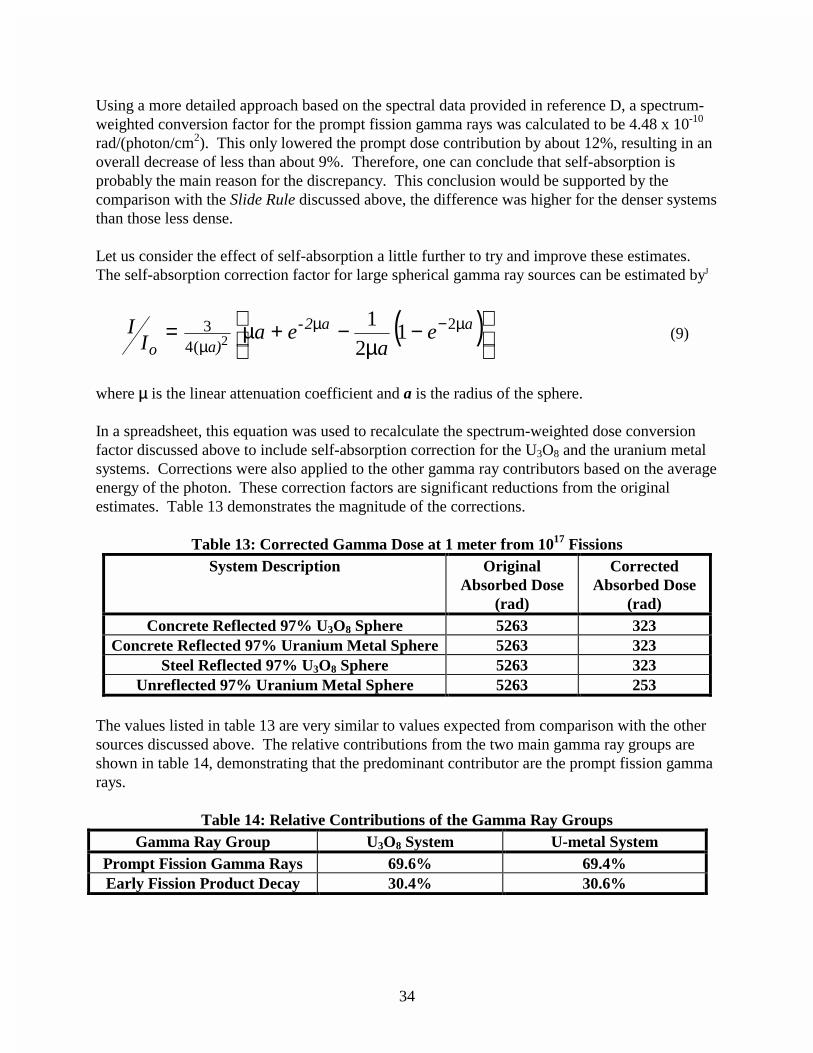
Using a more detailed approach based on the spectral data provided in reference D, a spectrum-weighted conversion factor for the prompt fission gamma rays was calculated to be 4.48 x 10⁻¹⁰
rad/(photon/cm2). This only lowered the prompt dose contribution by about 12%, resulting in anoverall decrease of less than about 9%. Therefore, one can conclude that self-absorption isprobably the main reason for the discrepancy. This conclusion would be supported by thecomparison with the Slide Rule discussed above, the difference was higher for the denser systemsthan those less dense. Let us consider the effect of self-absorption a little further to try and improve these estimates.The self-absorption correction factor for large spherical gamma ray sources can be estimated byJ
( )
−
µ−+µ= µ−µ
µaa2-
a)oe
aeaI
I 2
(43 1
21
2 (9)
where µ is the linear attenuation coefficient and a is the radius of the sphere. In a spreadsheet, this equation was used to recalculate the spectrum-weighted dose conversionfactor discussed above to include self-absorption correction for the U3O8 and the uranium metalsystems. Corrections were also applied to the other gamma ray contributors based on the averageenergy of the photon. These correction factors are significant reductions from the originalestimates. Table 13 demonstrates the magnitude of the corrections.
Table 13: Corrected Gamma Dose at 1 meter from 1017 Fissions System Description Original
Absorbed Dose (rad)
CorrectedAbsorbed Dose
(rad) Concrete Reflected 97% U3O8 Sphere 5263 323
Concrete Reflected 97% Uranium Metal Sphere 5263 323 Steel Reflected 97% U3O8 Sphere 5263 323
Unreflected 97% Uranium Metal Sphere 5263 253 The values listed in table 13 are very similar to values expected from comparison with the othersources discussed above. The relative contributions from the two main gamma ray groups areshown in table 14, demonstrating that the predominant contributor are the prompt fission gammarays.
Table 14: Relative Contributions of the Gamma Ray Groups Gamma Ray Group U3O8 System U-metal System
Prompt Fission Gamma Rays 69.6% 69.4% Early Fission Product Decay 30.4% 30.6%

35
The slight differences between the two systems are most likely due to the effects of the spectralweighting of the lower energy prompt fission gamma rays in the denser system (U-metal) versusthe higher energy early fission product decay gamma rays.
Determination of doses from actual accidents
In the event of an actual criticality event, it is very important to attempt to estimate the dose ofthe victims as quickly as possible to aid in their medical treatment. However, this is extremelydifficult to do accurately, because of the need for detailed information regarding the radiationfields involved. For the neutron doses, the energy spectrum must be determined, and this willtake some time, as the techniques are rather complex. However, some traditional techniques areavailable to help with the initial estimates, as discussed in reference G, and some new techniquesare becoming available.
Initial Screening of Potential Victims When an event occurs, it is important to screen all personnel that could have been in the generalarea, as some, especially those with lower doses, may not display any symptoms immediately.This is traditionally done by using a simple direct survey with a Geiger-type survey instrument tomonitor for neutron activation within the body of the personnel. The detector should becalibrated to indicate a response of 3200 cpm in a 1 mR/hr gamma radiation field. Hold thedetector against the abdominal area and record the response. If there is a response, segregate theindividual for further monitoring. The neutron dose can be estimated by the equation D = 1.1K/M (10) where K is the count rate in cpm, M is the body weight of the individual in kilograms, and D isthe first collision neutron dose in rad. Immediately after an accident there is a 50% margin oferror due to 38Cl, but after 4 hours the error margin reduces to 1%. Typical sensitivity isestimated to be about 1 rad in a standard man. Be cautioned that external contamination on thebody or clothing may confound the results, and should be checked for. In general, contamination is a secondary concern when acute injuries are involved. Therefore,always make sure that the victim’s medical concerns are dealt with first. Contamination controlcan be re-established after rescue operations are concluded, if necessary. Once the potential victims have been identified, then further work can be conducted to improvethe neutron dose estimates. This could include measuring the quantities of 24Na in the blood, 32Pin the hair, and activation of metals in jewelry, belt buckles, and other personal effects on theindividual’s body at the time of the exposure. The formula for converting 24Na activity in theblood is
t5Ce1.6x10D 0462.0= (11)
where D is the neutron dose in rad, C is the concentration of 24Na in the blood in µCi/cc at time t,and t is the time in hours between the accident and the analysis.
36
If the victim was wearing a dosimeter, then obviously that should be processed as soon aspossible for the gamma dose. If not, then evaluation of the gamma dose may be morecomplicated. Some recent workK has developed techniques for rapidly determining doses fromthe kinetics of lymphocyte depletion in the victim’s blood within the first 8 hours of theexposure. However, this work was based on accidents involving whole body gamma irradiationonly, and it is not clear whether the same technique will work for neutrons or whether it willallow a method for separating the two components.
Evaluating the Neutron Spectrum Once initial screening, triage, and recovery have been completed, then efforts can be started toattempt to determine the neutron spectrum. Hopefully, the facility will have Nuclear AccidentDosimetry (NAD) in place. These are dosimetry packages containing a variety of activation foilsand filters for unfolding the neutron spectrum from the measured activation. This will providegood information regarding the general fields. However, it is important to try to determine theexact field the victims were in, since it can vary widely with location. Ideally, the individualwould be wearing a personal nuclear accident dosimeter (PNAD), but this may not be the case.Therefore, one should consider trying to analyze objects collected from the individuals foractivation products that may help unfold the neutron spectrum. Unfolding a neutron spectrum requires a significant understanding of the cross-sections for thevarious materials and reactions involved. By selecting the reactions properly, one can build upthe spectrum by comparing the various responses to each other. This will require some expertise,and so a specialist in activation analysis should be tasked to conduct the effort. I will not try toprovide any guidance on this, as it is beyond the scope of this work.
Caring for the Victims Once the victims have been turned over to medical personnel, the health physicist should provideany support necessary, as would be done with any other radiation-related injury. It is beyond thescope of this document to discuss the medical treatment further, although reference G provides agood basis for further study if desired.
Emergency Preparedness
This section will discuss in a general way the preparations that a facility should consider beforeconducting activities with significant quantities of fissionable material. First and foremost wouldobviously be to have qualified criticality safety personnel conduct an extensive evaluation of theoperation for potential criticality safety concerns. This document will not address this, andplease do not attempt to use this document as a substitute for such an analysis. It is only intendedto provide a basic review of the considerations involved in criticality safety, and to provide thehealth physicist with an understanding of the radiological hazards involved when dealing with acriticality accident. Nevertheless, there are some basic considerations that should be addressed.

37
It would be expected that any facility dealing with significant quantities of fissionable materialwould have an emergency response program in place. However, there are aspects of criticalitysafety that should be included in these programs.
• Criticality alarm systems are usually installed in these facilities to detect such an event.Bear in mind that the alarm will not protect individuals from the initial pulse ofradiation, but will only warn that one has occurred. Do not allow the personnel tocome to rely on these systems as a protective measure! These alarms act as an aid inrapidly activating the emergency response, and should initiate an evacuation of thefacility. Criticality alarms are usually specially designed systems in order to detect therapid transients associated with an inadvertent criticality event which might be lost in thetime constants of normal radiation monitors. To minimize false alarms and increasereliability, these systems will normally involve multiple detectors with logic systems thatrequire signals from multiple detectors before signaling an alarm. Refer to ANS/ANS-8.3, Criticality Alarm Systems for the criteria for these systems.
• Alarms from criticality alarm systems are usually intended to be unique from otherfacility alarms, and should automatically trigger an evacuation of personnel in affectedareas. Evacuation routes should be clearly marked, and should be designed to minimizethe possibility of directing personnel through any high radiation areas that might begenerated by the event. In other words, lead the personnel in a direction away from thelocation of the event as quickly as possible. This may well require limiting fissionablematerial operations to particular areas so that evacuation routes can be effectively plannedahead of time. The personnel should be trained to be aware of the potential forcontinuing operation or recurring pulses from such an event, so that they realize theimportance of evacuating the facility. Since the time between pulses is generally on theorder of minutes, evacuations should be conducted in an orderly manner. Panic and“break-neck” speed is not helpful, and may lead to more serious injuries. Generally,acute doses are only incurred within the first few meters of the system.
• The emergency plan should include procedures for the rapid screening of personnel toidentify potential victims, and equipment should be calibrated and pre-staged to facilitatethis process. Since these events are very rare, the plan should include regular verificationof the operability and availability of this equipment.
• Nuclear Accident Dosimetry (NAD) should be positioned in and around the facility inlocations that will provide a representative sampling of the neutron radiation fields. Theyshould also allow easy access and removal by emergency response personnel withoutoverly exposing them to any residual radiation hazards. Procedures should also beprepared and equipment and personnel available to quickly evaluate the results of thisdosimetry. This same consideration should also be applied to personnel NADs. ANSIN13.1 provides criteria for a nuclear accident dosimetry program. Also, IAEA TechnicalReport 211, Dosimetry for Criticality Accidents: A Manual, 1982, provides a great dealof information regarding methods for the dosimetry of such accidents using physical andbiological media.

38
• As has been emphasized previously, a super-prompt critical system can oscillate inpower, producing multiple pulses and may achieve a steady-state power level. Therefore,response and recovery personnel should always take great caution before approachingsuch a system until its status is determined. After recovery of any victims, the state ofthe system is the most important question that must be answered by the emergencypersonnel.
All aspects of the emergency program are expected to be drilled against annually. Refer toANSI/ANS-8.19, Administrative Practices for Nuclear Criticality Safety for overall criteria forthe management of a criticality safety program.
Conclusions
Criticality accidents are very rare, but have the potential to cause significant injury and possibledeath to involved personnel. They are complicated systems to fully evaluate in general, andrequire detailed information of the system and the facility in order to adequately predict results.Unfortunately, many of the necessary details will not be available until after the event occurs,which requires the criticality safety expert and the health physicist to depend on assumptions andestimations in order to prepare for such an event.
This document has demonstrated techniques that should allow the health physics practitioner tobetter understand the potential hazards involved, and to make basic estimates of the order-of-magnitude of the potential consequences. The influences of various factors have been discussedwith reference to how they may affect the radiation fields generated, and techniques aredemonstrated for how to evaluate those influences. While there are much more advanced toolsand techniques that should be relied upon when dealing with a real operation, the simpletechniques discussed here are designed to help the practitioners better understand thefundamental aspects of such systems, and the concepts that would be applied to their study.
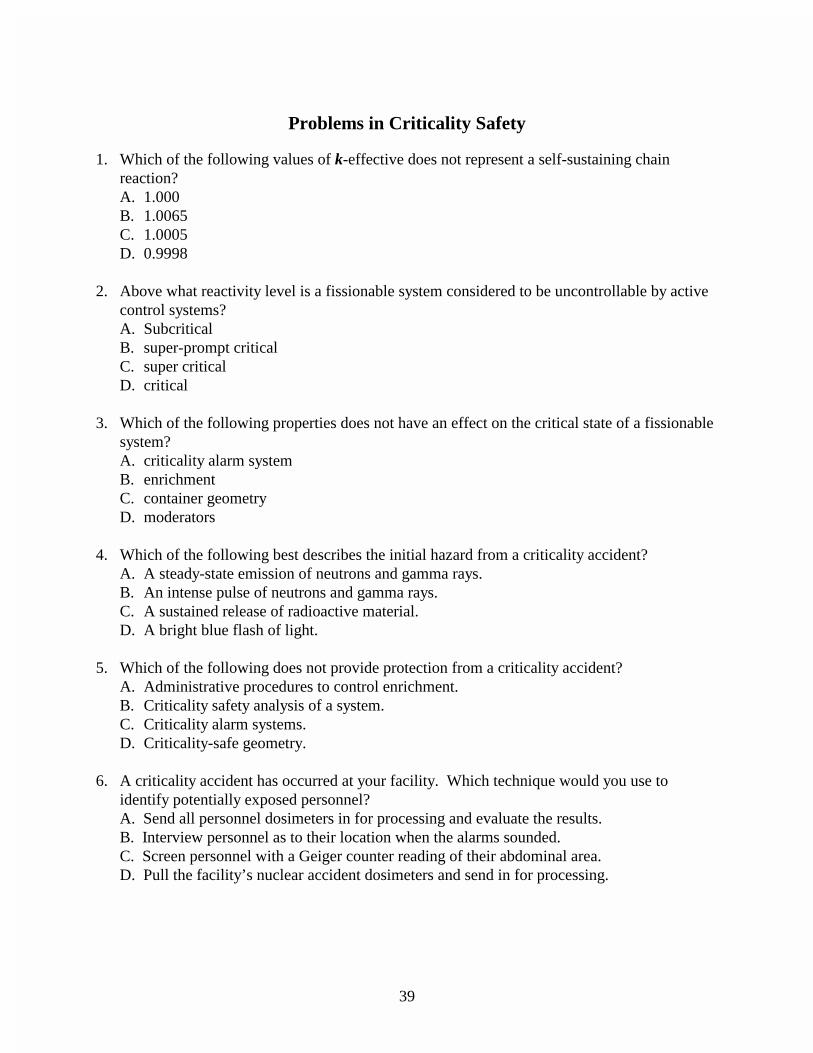
39
Problems in Criticality Safety
1. Which of the following values of k-effective does not represent a self-sustaining chainreaction?A. 1.000B. 1.0065C. 1.0005D. 0.9998
2. Above what reactivity level is a fissionable system considered to be uncontrollable by activecontrol systems?A. SubcriticalB. super-prompt criticalC. super criticalD. critical
3. Which of the following properties does not have an effect on the critical state of a fissionablesystem?A. criticality alarm systemB. enrichmentC. container geometryD. moderators
4. Which of the following best describes the initial hazard from a criticality accident?A. A steady-state emission of neutrons and gamma rays.B. An intense pulse of neutrons and gamma rays.C. A sustained release of radioactive material.D. A bright blue flash of light.
5. Which of the following does not provide protection from a criticality accident?A. Administrative procedures to control enrichment.B. Criticality safety analysis of a system.C. Criticality alarm systems.D. Criticality-safe geometry.
6. A criticality accident has occurred at your facility. Which technique would you use toidentify potentially exposed personnel?A. Send all personnel dosimeters in for processing and evaluate the results.B. Interview personnel as to their location when the alarms sounded.C. Screen personnel with a Geiger counter reading of their abdominal area.D. Pull the facility’s nuclear accident dosimeters and send in for processing.
40
7. What is the primary concern in responding to a criticality accident after recovery of potentialvictims?A. Assessing contamination levels in the area.B. Securing ventilation to reduce environmental releases.C. Establish a mechanism for cooling the system.D. Determining the potential for re-achieving a critical state.
8. What is normally the primary contributor of gamma rays for a criticality accident?A. Prompt fission gamma rays.B. Early fission product decay gamma rays.C. Activation-product decay gamma rays from neutron capture in surrounding materials.D. Skyshine.
9. What is the main purpose of a criticality alarm system?A. To warn personnel of an inadvertent accumulation of fissile material.B. To warn personnel of an impending super-prompt critical pulse.C. To alert personnel that a criticality event has occurred.D. To monitor general radiation levels in a room.
10. Recently a criticality accident occurred at a fuel processing facility in Tokai-mura, Japan.The accident involved a solution of uranyl nitrate, enriched to 18.8% 235U, in a precipitationtank. The tank was cylindrical with a diameter of 45 cm, and had a 5 cm thick cooling-waterjacket on the outside of the tank. The estimated yield of the excursion was 2.5 x 10¹⁸
fissions, with roughly half of the yield from the initial pulse, and the rest from continuingsteady-state operation of the system for about 18 hours.
Assume the following:• The neutron leakage probability from the system was 20%;• assume an average neutron energy of 0.2 eV;• self-absorption of photons in the system can be ignored;• ignore all attenuation of photons and neutrons in the surrounding air;• meteorological conditions resulted in a Χ/Q of 9 x 10⁻⁴ at 100 meters from the release;• the room ventilation rate is 8 changes/hour;• ignore all intervening shielding;• use other data and equations as necessary from this module; and• if other assumptions are necessary, please identify and justify.
For an individual standing at a distance of 100 meters from the system, but in direct line-of-sightand directly downwind:
a) Estimate the neutron and gamma deep dose equivalents due to the direct radiation fromthe initial pulse;

41
b) Estimate the neutron and gamma deep dose equivalent rates due to the direct radiationfrom the steady-state operation of the system;
c) Estimate the total neutron and gamma dose equivalents due to the direct radiation, for theduration of the event;
d) Estimate the total deep dose equivalent to the same individual from the passage of aplume of radioactive gases and halogens from the system, using the table below, for theduration of the event;
e) Discuss any impact on the results obtained from the assumptions listed above; and
f) Discuss what implications these results would have on the design of a building withinwhich a similar process will take place (note – building design, not process design).
Fission Product Noble Gas and Halogen Data (see notes)Isotope Fission Yield
(Ci/fission)Half-life Immersion Dose
Conversion Factor(mrem/yr)/(µCi/m3)
Kr-85m 1.5 e-17 4.4 hr 817Kr- 87 9.9 e-17 76 m 4470Kr-88 6.5 e-17 2.8 hr 11300Kr-89 4.2 e-15 3.18 m 10200I-131 8.7 e-19 8.05 d 1910I-132 1.1 e-16 2.26 hr 11900I-134 4.5 e-16 52 m 13800I-135 4.7 e-17 6.68 hr 8340
Xe-135 3.6 e-17 9.14 hr 1250Xe-135m 2.2 e-16 15.6 m 2150Xe-137 4.9 e-15 3.9 m 955Xe-138 1.3 e-15 17.5 m 6270
Notes:1. Fission yield data from DOE Release Fractions Handbook, DOE-HDBK-3010-94.2. Dose Conversion Factors from External Dose-Rate Conversion Factors for Calculation of
Dose to the Public, DOE/EH-0070, 1988.3. Note that this listing is not intended to be comprehensive, but was selected to include the
most significant contributors in order to demonstrate the magnitude of the concern withoutovercomplicating the problem.
42
References and Notes
A ANSI/ANS-8.1-1983, American National Standard for Nuclear Criticality Safety in Operationswith Fissionable Materials Outside of Reactors; Reaffirmed, Nov. 30, 1988.
B Most any good nuclear engineering textbook will discuss the various forms of equations usedfor determining the neutron balance, the two most typical are the Boltzmann transport equationand the neutron diffusion equation.
C Most of the kinetics material is from Hetrick, D. L., Dynamics of Nuclear Reactors; TheUniversity of Chicago Press, 1971. Other nuclear engineering texts also contain derivations andvariations on the same theme.
D The treatment of gamma radiation characteristics is based on Schaeffer, N.M. (editor), ReactorShielding for Nuclear Engineers, U.S. Atomic Energy Commission Office of InformationServices; TID-25951, 1973. Similar information can be found in other nuclear engineering texts.
E Cember, H.; Introduction to Health Physics; McGraw-Hill, Inc.; 1992.
F Discussions of previous criticality accidents can be found in:
• Knief, R.; Nuclear Criticality Safety: Theory and Practice; American Nuclear Society,1996.
• Vargo, G.J.; A Brief History of Nuclear Criticality Accidents in Russia – 1953-1997;April 1999; PNNL-12199.
• Stratton, W. R.; A Review of Criticality Accidents; Los Alamos National Laboratory,LA-3611; 1967. (There may be an updated version available)
• Horan, J. R. and Gammill, W. P.; The Health Physics Aspects of the SL-1 Accident;Health Physics Journal; Vol. 9, pp. 177-186; 1963.
• Union Carbide Nuclear Company; Accidental Radiation Excursion at the Y-12Plant; Report # Y-1234; Aug. 4, 1958.
And various other documents.
G Mettler, F. A., C. A. Kelsey, and R. C. Ricks; Medical Management of Radiation Accidents;CRC Press; 1990.

43
H Broadhead, B.L., C. M. Hopper, R. L. Childs, and J. S. Tang; An Updated Nuclear CriticalitySlide Rule, (Vol.1 is the technical basis, Vol. 2 is the functional slide rule), NUREG/CR-6504(aka ORNL/TM-13322); prepared by ORNL for the NRC, 1997.
I Report of ANS-6.1 Committee on Shielding Standards, June 1974.
J Courtney, J. C.; A Handbook of Radiation Shielding Data; ANS/SD-76/14; sponsored by theNuclear Science Center, Louisiana State University, and the Shielding and Dosimetry Division,American Nuclear Society; July 1976.
K Goans, R. E., E. C. Holloway, M. E. Berger, and R. C. Ricks; Early Dose AssessmentFollowing Sever Radiation Accidents; Health Physics Journal; Vol. 72, Number 4; April 1997.


![[ON TIME-CRITICALITY] TIME-CRITICALITY … · ["ON TIME-CRITICALITY"] TIME-CRITICALITY Time-critical signal processing in humans and machines ... - ancient Greek prosody based on](https://img.dokumen.tips/doc/110x75/5b914fb509d3f215288b5a2b/on-time-criticality-time-criticality-on-time-criticality-time-criticality.jpg)